Safety climate in the operating room: Translation ... · Scale psychometrics were analyzed using...
10
r e v p o r t s a ú d e p ú b l i c a . 2 0 1 6; 3 4(2) :107–116 www.elsevier.pt/rpsp Original Article Safety climate in the operating room: Translation, validation and application of the Safety Attitudes Questionnaire João Pedro Alexandre Pinheiro a,b,∗ , António de Sousa Uva c,d a Departamento de Radiologia, Escola Superior de Saúde, Universidade do Algarve, Avenida Dr. Adelino da Palma Carlos, 8000-510 Faro, Portugal b CES – Centro de Estudos em Saúde da Universidade do Algarve, Portugal c Escola Nacional de Saúde Pública, Universidade Nova de Lisboa, Avenida Padre Cruz, 1600-560 Lisboa, Portugal d CISP – Centro de Investigac ¸ão em Saúde Pública, ENSP/UNL, Lisboa, Portugal a r t i c l e i n f o Article history: Received 19 April 2015 Accepted 28 July 2015 Available online 22 November 2015 Keywords: Safety climate Operating room Ergonomics Patient safety Healthcare quality a b s t r a c t Background: Safety climate assessment is increasingly recognized as an important factor in healthcare quality improvement, especially in operating rooms (OR). One of the most com- monly used and rigorously validated tools to measure safety culture is the Safety Attitudes Questionnaire (SAQ). This study presents the validation of the Operating Room Version of the SAQ (SAQ-OR) for use in Portuguese Hospitals. The psychometric properties of the translated questionnaire are also presented. Methods: The original English version of the SAQ-OR was translated and adapted to the Portuguese setting by forward–backward translation method and applied in a central public hospital. Scale psychometrics were analyzed using Cronbach’s alpha and inter-correlations among the scales. Results: The internal consistency test yielded values around 0.9 for all 73 items. The CFA and its goodness-of-fit indices (SRMR 0.05, RMSEA 0.002, CFI 0.90) showed an acceptable model fit. Inter-correlations between the factors safety climate, teamwork climate, job satisfac- tion, perceptions of management, and working conditions showed moderate correlation with each other. 82 valid questionnaires were analyzed revealing significant differences in communication ratings between different jobs, mainly between surgeons (4.2) and between nurses and surgeons (2.9). Working conditions and job satisfaction have the highest score with 3.8 and 3.5, respectively, and perceptions of management have the lowest score (2.8). Conclusion: The Portuguese translation of the SAQ-OR reveals good psychometric proper- ties for studying the organizational safety climate, however larger and further studies are required to compensate the lack of subjects in some items. Like other studies, this scale seems to be an acceptable to adequate tool to evaluate the safety climate. Results allowed ∗ Corresponding author. E-mail addresses: [email protected], [email protected] (J.P.A. Pinheiro). http://dx.doi.org/10.1016/j.rpsp.2015.07.006 0870-9025/© 2015 The Authors. Published by Elsevier Espa ˜ na, S.L.U. on behalf of Escola Nacional de Sa ´ ude P´ ublica. This is an open access article under the CC BY-NC-ND license (http://creativecommons.org/licenses/by-nc-nd/4.0/).
Transcript of Safety climate in the operating room: Translation ... · Scale psychometrics were analyzed using...

O
SvQ
Ja
Pb
c
d
a
A
R
A
A
K
S
O
E
P
H
h0a
r e v p o r t s a ú d e p ú b l i c a . 2 0 1 6;3 4(2):107–116
www.elsev ier .p t / rpsp
riginal Article
afety climate in the operating room: Translation,alidation and application of the Safety Attitudesuestionnaire
oão Pedro Alexandre Pinheiroa,b,∗, António de Sousa Uvac,d
Departamento de Radiologia, Escola Superior de Saúde, Universidade do Algarve, Avenida Dr. Adelino da Palma Carlos, 8000-510 Faro,ortugalCES – Centro de Estudos em Saúde da Universidade do Algarve, PortugalEscola Nacional de Saúde Pública, Universidade Nova de Lisboa, Avenida Padre Cruz, 1600-560 Lisboa, PortugalCISP – Centro de Investigacão em Saúde Pública, ENSP/UNL, Lisboa, Portugal
r t i c l e i n f o
rticle history:
eceived 19 April 2015
ccepted 28 July 2015
vailable online 22 November 2015
eywords:
afety climate
perating room
rgonomics
atient safety
ealthcare quality
a b s t r a c t
Background: Safety climate assessment is increasingly recognized as an important factor in
healthcare quality improvement, especially in operating rooms (OR). One of the most com-
monly used and rigorously validated tools to measure safety culture is the Safety Attitudes
Questionnaire (SAQ). This study presents the validation of the Operating Room Version of the
SAQ (SAQ-OR) for use in Portuguese Hospitals. The psychometric properties of the translated
questionnaire are also presented.
Methods: The original English version of the SAQ-OR was translated and adapted to the
Portuguese setting by forward–backward translation method and applied in a central public
hospital. Scale psychometrics were analyzed using Cronbach’s alpha and inter-correlations
among the scales.
Results: The internal consistency test yielded values around 0.9 for all 73 items. The CFA and
its goodness-of-fit indices (SRMR 0.05, RMSEA 0.002, CFI 0.90) showed an acceptable model
fit. Inter-correlations between the factors safety climate, teamwork climate, job satisfac-
tion, perceptions of management, and working conditions showed moderate correlation
with each other. 82 valid questionnaires were analyzed revealing significant differences in
communication ratings between different jobs, mainly between surgeons (4.2) and between
nurses and surgeons (2.9). Working conditions and job satisfaction have the highest score
with 3.8 and 3.5, respectively, and perceptions of management have the lowest score (2.8).
Conclusion: The Portuguese translation of the SAQ-OR reveals good psychometric proper-
ties for studying the organizational safety climate, however larger and further studies are
required to compensate the lack of subjects in some items. Like other studies, this scale
seems to be an acceptable to adequate tool to evaluate the safety climate. Results allowed
∗ Corresponding author.E-mail addresses: [email protected], [email protected] (J.P.A. Pinheiro).
ttp://dx.doi.org/10.1016/j.rpsp.2015.07.006870-9025/© 2015 The Authors. Published by Elsevier Espana, S.L.U. on behalf of Escola Nacional de Saude Publica. This is an open accessrticle under the CC BY-NC-ND license (http://creativecommons.org/licenses/by-nc-nd/4.0/).

108 r e v p o r t s a ú d e p ú b l i c a . 2 0 1 6;3 4(2):107–116
are satisfactory. However, there is latitude for improvement, especially in the involvement
of the management bodies as this factor has the lowest score for the majority of healthcare
professionals.
© 2015 The Authors. Published by Elsevier Espana, S.L.U. on behalf of Escola Nacional de
Saude Publica. This is an open access article under the CC BY-NC-ND license (http://
creativecommons.org/licenses/by-nc-nd/4.0/).
Clima de seguranca no bloco operatório: traducão, validacão e aplicacãodo Questionário de Atitudes de Seguranca
Palavras-chave:
Clima de seguranca
Bloco operatório
Ergonomia
Seguranca do doente
Qualidade em saúde
r e s u m o
Introducão: A avaliacão do clima de seguranca é cada vez mais reconhecida como um fator
na melhoria da prestacão de cuidados de saúde, especialmente no bloco operatório (BO).
Um dos instrumentos mais comumente validados e utilizados para medir a Cultura de
Seguranca é o Safety Attitudes Questionnaire (SAQ) ou Questionário de Atitude de Seguranca
(QAS). Este estudo apresenta a validacão da versão para Bloco Operatório (QAS-BO), para
aplicacão nas instituicões de saúde portuguesas. As características psicométricas do ques-
tionário traduzido são também apresentadas.
Metodologia: A versão original em inglês do QAS-BO, foi traduzida e adaptada para o contexto
português, através do processo de traducão-retraducão e aplicado num hospital público
central. A análise psicométrica foi feita através do alfa de Cronbach e das correlacões entre
escalas.
Resultados: Os testes de consistência interna obtiveram valores médios de 0.9 para os
73 itens. A análise fatorial e o grau de ajuste (SRMR 0.05, RMSEA 0.002, CFI 0.90) obtiveram
valores satisfatórios. As relacões entre o clima de seguranca, trabalho em equipa, satisfacão
profissional, percecão sobre os órgãos de gestão e condicões de trabalho são moderadas.
Um total de 82 questionários foram analisados e revelaram diferencas significativas na
comunicacão entre diferentes classes profissionais, nomeadamente entre cirurgiões (4.2)
e entre cirurgiões e enfermeiros (2.9). As condicões de trabalho e a satisfacão profissional
obtiveram os valores mais elevados, com 3.8 e 3.5 respetivamente, e a percecão sobre os
órgãos de gestão o valor mais baixo (2.8).
Conclusão: A versão portuguesa do QAS-BO, apresenta boas características psicométricas
para estudar o clima de seguranca das instituicões de saúde, não obstante, são necessários
estudos mais abrangentes de forma a colmatar o reduzido número de elementos em alguns
itens. Tal como outros estudos revelaram, este instrumento é aceitável para analisar o clima
de seguranca. Os resultados permitem concluir que as condicões de trabalho e a satisfacão
profissional são satisfatórias. No entanto, existe oportunidade de intervencão e melhoria,
principalmente no envolvimento dos órgãos de gestão.
© 2015 Os Autores. Publicado por Elsevier Espana, S.L.U. em nome de Escola Nacional
de Saude Publica. Este e um artigo Open Access sob uma licenca CC BY-NC-ND (http://
Introduction
Population based research suggests that in the United Statesbetween 44,000 and 98,000 patients die each year frompreventable errors, making medical error the eighth mostcommon cause of death.1 Operating rooms (OR) can have ahigh prevalence of errors, being an interdisciplinary, complexactivity with a strong dependence on technical skill, whereergonomics and organizational factors play an essential role.Due to these factors it is imperative that the safety climatein the OR is analyzed in order to improve patient safety.2
Efforts to assess and improve safety culture and to betterdefine its role in patient safety are facilitated by its measure-ment. By identifying attributes of an organization that are
creativecommons.org/licenses/by-nc-nd/4.0/).
both malleable and potentially related to safety, managerscan intervene to improve the quality of care. Existing patientsafety climate measurement tools are numerous, whereas lit-tle information in the literature provides guidance to usersor researchers in the selection of tools for research or safetyimprovement measurement initiatives.3
Patient safety is fundamental to healthcare quality. Atten-tion has recently focused on the patient safety climate of anorganization and its impact on patient outcomes. A strongsafety climate appears to be an essential condition for safepatient care in hospitals. A number of instruments are usedto measure this patient safety climate or culture. The Safety
Attitudes Questionnaire (SAQ) is a validated, widely usedinstrument to investigate multiple factors of safety climateat the clinical level in a variety of inpatient and outpatient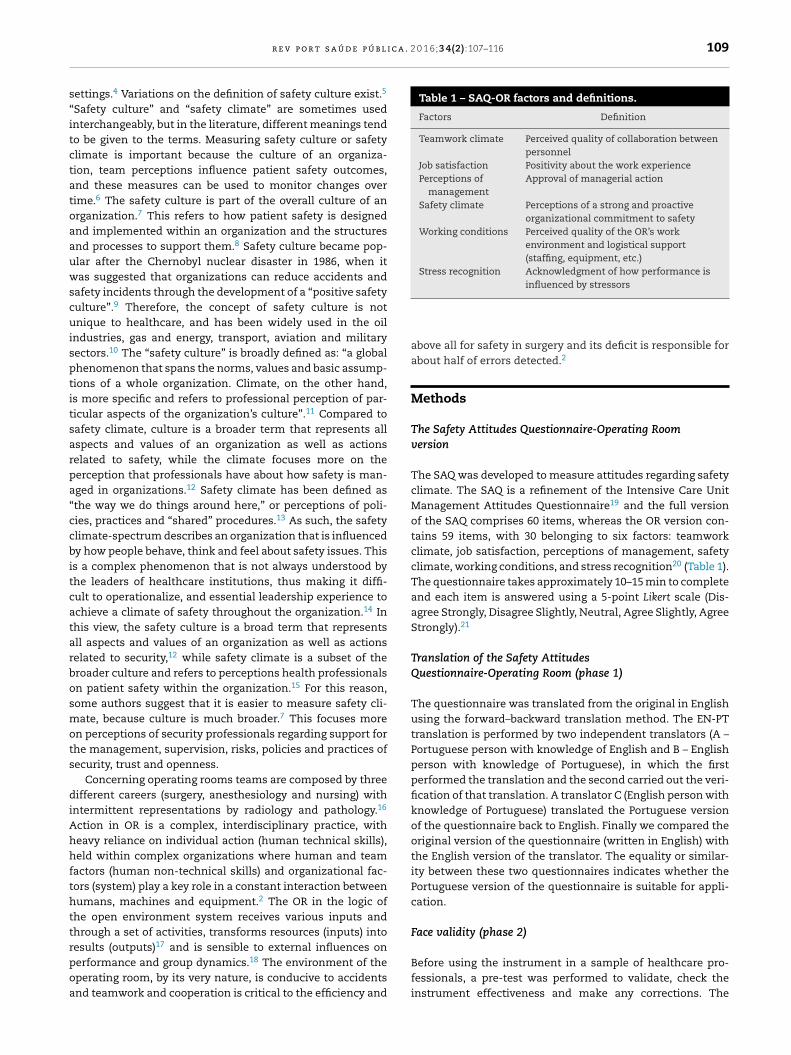
i c a . 2 0 1 6;3 4(2):107–116 109
s“itctatoaauwscuisptitsarpa“ccbitcatarbosmots
diAhhfthttrpoa
Table 1 – SAQ-OR factors and definitions.
Factors Definition
Teamwork climate Perceived quality of collaboration betweenpersonnel
Job satisfaction Positivity about the work experiencePerceptions of
managementApproval of managerial action
Safety climate Perceptions of a strong and proactiveorganizational commitment to safety
Working conditions Perceived quality of the OR’s workenvironment and logistical support(staffing, equipment, etc.)
Stress recognition Acknowledgment of how performance isinfluenced by stressors
r e v p o r t s a ú d e p ú b l
ettings.4 Variations on the definition of safety culture exist.5
Safety culture” and “safety climate” are sometimes usednterchangeably, but in the literature, different meanings tendo be given to the terms. Measuring safety culture or safetylimate is important because the culture of an organiza-ion, team perceptions influence patient safety outcomes,nd these measures can be used to monitor changes overime.6 The safety culture is part of the overall culture of anrganization.7 This refers to how patient safety is designednd implemented within an organization and the structuresnd processes to support them.8 Safety culture became pop-lar after the Chernobyl nuclear disaster in 1986, when itas suggested that organizations can reduce accidents and
afety incidents through the development of a “positive safetyulture”.9 Therefore, the concept of safety culture is notnique to healthcare, and has been widely used in the oil
ndustries, gas and energy, transport, aviation and militaryectors.10 The “safety culture” is broadly defined as: “a globalhenomenon that spans the norms, values and basic assump-ions of a whole organization. Climate, on the other hand,s more specific and refers to professional perception of par-icular aspects of the organization’s culture”.11 Compared toafety climate, culture is a broader term that represents allspects and values of an organization as well as actionselated to safety, while the climate focuses more on theerception that professionals have about how safety is man-ged in organizations.12 Safety climate has been defined asthe way we do things around here,” or perceptions of poli-ies, practices and “shared” procedures.13 As such, the safetylimate-spectrum describes an organization that is influencedy how people behave, think and feel about safety issues. Thiss a complex phenomenon that is not always understood byhe leaders of healthcare institutions, thus making it diffi-ult to operationalize, and essential leadership experience tochieve a climate of safety throughout the organization.14 Inhis view, the safety culture is a broad term that representsll aspects and values of an organization as well as actionselated to security,12 while safety climate is a subset of theroader culture and refers to perceptions health professionalsn patient safety within the organization.15 For this reason,ome authors suggest that it is easier to measure safety cli-ate, because culture is much broader.7 This focuses more
n perceptions of security professionals regarding support forhe management, supervision, risks, policies and practices ofecurity, trust and openness.
Concerning operating rooms teams are composed by threeifferent careers (surgery, anesthesiology and nursing) with
ntermittent representations by radiology and pathology.16
ction in OR is a complex, interdisciplinary practice, witheavy reliance on individual action (human technical skills),eld within complex organizations where human and team
actors (human non-technical skills) and organizational fac-ors (system) play a key role in a constant interaction betweenumans, machines and equipment.2 The OR in the logic ofhe open environment system receives various inputs andhrough a set of activities, transforms resources (inputs) intoesults (outputs)17 and is sensible to external influences on
erformance and group dynamics.18 The environment of theperating room, by its very nature, is conducive to accidentsnd teamwork and cooperation is critical to the efficiency andabove all for safety in surgery and its deficit is responsible forabout half of errors detected.2
Methods
The Safety Attitudes Questionnaire-Operating Roomversion
The SAQ was developed to measure attitudes regarding safetyclimate. The SAQ is a refinement of the Intensive Care UnitManagement Attitudes Questionnaire19 and the full versionof the SAQ comprises 60 items, whereas the OR version con-tains 59 items, with 30 belonging to six factors: teamworkclimate, job satisfaction, perceptions of management, safetyclimate, working conditions, and stress recognition20 (Table 1).The questionnaire takes approximately 10–15 min to completeand each item is answered using a 5-point Likert scale (Dis-agree Strongly, Disagree Slightly, Neutral, Agree Slightly, AgreeStrongly).21
Translation of the Safety AttitudesQuestionnaire-Operating Room (phase 1)
The questionnaire was translated from the original in Englishusing the forward–backward translation method. The EN-PTtranslation is performed by two independent translators (A –Portuguese person with knowledge of English and B – Englishperson with knowledge of Portuguese), in which the firstperformed the translation and the second carried out the veri-fication of that translation. A translator C (English person withknowledge of Portuguese) translated the Portuguese versionof the questionnaire back to English. Finally we compared theoriginal version of the questionnaire (written in English) withthe English version of the translator. The equality or similar-ity between these two questionnaires indicates whether thePortuguese version of the questionnaire is suitable for appli-cation.
Face validity (phase 2)
Before using the instrument in a sample of healthcare pro-fessionals, a pre-test was performed to validate, check theinstrument effectiveness and make any corrections. The
b l i c a
110 r e v p o r t s a ú d e p úface validity was tested by 4 nurses and 4 physicians, ran-domly selected from the OR team with different ages andspecialties. They studied the Portuguese version and wereguided to indicate concerns about the items and feel free topropose a better formulation. Comments were then discussedby the researchers and a consensus was reached and a finaltranslated SAQ-OR Portuguese version was established.
Psychometric testing of the Safety Attitudes Questionnairebased on survey data
A cross-sectional design was used to test the internal con-sistency of the SAQ-OR. Surgeons, Nurses, Anesthesiologists,Radiographers and Auxiliaries with at least 1 year of work-ing experience at a central hospital from two surgical wardswere asked to fill out the Portuguese translation of the SAQ-OR.Respondent demographic characteristics such as gender, age,professional category, professional experience, employmentstatus were also included.
Data collection and ethical considerations
The questionnaires were distributed to the Surgeons, Nurses,Anesthesiologists, Radiographers and Auxiliaries by the headnurse and head Anesthesiologist or the researcher and hadto be completed within 2 months. All questionnaires werecollected in a (secured) box on the ward. Every week, areminder was sent to ward staff. Respondents were informedthat participation was voluntary. Questionnaires were treatedanonymously, and that the decision to return a completedquestionnaire was deemed their informed consent. The studywas approved by the Medical Ethics Committee of Algarve’sHospital Center (Centro Hospitalar do Algarve – CHA).
Statistical analysis
Descriptive statistics were used to describe the populationcharacteristics and the SAQ-OR item and scale-level results onthe units. Internal consistency of the total SAQ-OR and its sixfactors “teamwork climate,” “safety climate,” “stress recogni-tion,” “working conditions,” “job satisfaction” and “perceptionof management” was measured by calculating Cronbach’salpha.
The goodness-of-fit statistic was used to measure whetherthe overall model fit was good. Three different fit indiceswere used: standardized root mean square residual (SRMR),root mean square error of approximation (RMSEA) and com-parative fit index (CFI). The goodness-of-fit statistics andcorrelation matrix were analyzed with IBM SPSS AMOS (Anal-ysis of Moment Structures) V.22.22
A good model fit between the target model and theobserved data are distinguished by SRMR values between 0.0and 1.0, where 0.0 indicates perfect fit, and RMSEA values ≤ .05and CFI values ≥ .95.21 Confirmatory factor analysis (CFA) wasused for conclusions about the conceptual and semanticequivalence of a translated questionnaire20 and deals with
the relationships between observed measures or indicators.In this context, CFA is used to verify the number of underly-ing factors of the instrument and the pattern of item–factorrelationships (factor loadings).22. 2 0 1 6;3 4(2):107–116
Normality test was performed using the Kolmogorv–Smirnov test. Data analysis was performed by frequency tablesand descriptive statistics. In order to compare more than twogroups, the Kruskal–Wallis test (H) was performed. Finally, fora review of the relationship between variables, the Spearmancorrelation (rs) test was applied. All data were analyzed usingSPSS (version 20.0 for Windows).
Results
Translation, validity and internal consistency of SafetyAttitudes Questionnaire-Operating Room
Translation of the Safety Attitudes Questionnaire-OperatingRoom (phase 1)No significant differences were detected between the transla-tions. Ethnic group was present in the demographics sectionof the English version of the questionnaire, but was decided tobe removed as it was considered to be irrelevant and still pos-sibly offensive. Some questions were considered somewhatdelicate, because of the sensitivities regarding errors, staffing,management, and workload.
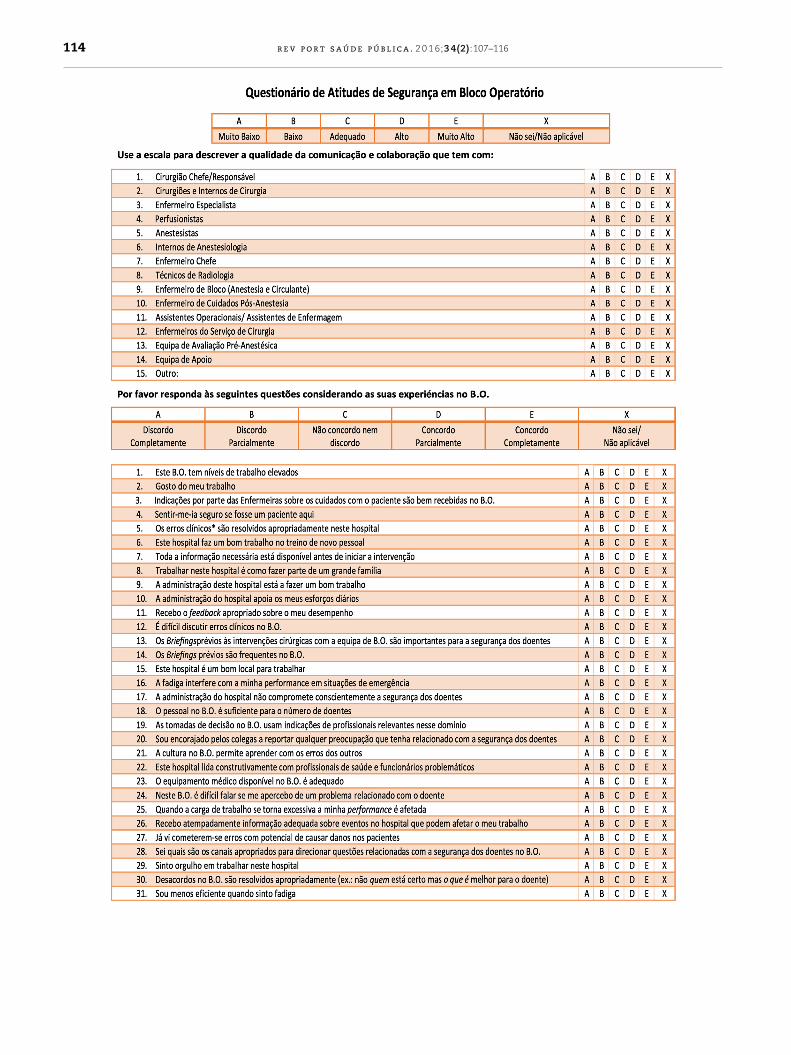
Face validity (phase 2)No major remarks were given by the four nurses and fourphysicians who evaluated the face validity of the SAQ-OR.Minor suggestions were given to improve the clarity of thewording, e.g. the word “medical error” was changed to “clin-ical error” (“erro médico” to “erro clínico”) as the term “medicalerror” in Portuguese implies that these are errors performedby physicians alone and not by all healthcare professionals.Moreover a brief definition of what was considered a “clinicalerror” was included on the bottom of the questionnaire simi-lar to the original English version (“Clinical error is defined hasany mistake in the delivery of care, by any healthcare profes-sional, regardless of the outcome”). In addition, one spellingmistake was detected and corrected (“fatigue” was translatedto “fatiga” instead of “fadiga”) (Annex 1).
Psychometric testing of the Safety Attitudes Questionnairebased on survey dataThe sample consists of 82 healthcare professionals who holdpositions in the operating room, divided into 5 distinct pro-fessional classes. 18 surgeons (22%), 43 nurses (52%), 11anesthesiologists (13%), 6 (7%) Radiographers and 4 auxiliaries(5%). 21 subjects have ages between 20 and 29 years (25.6%), 26between 30 and 39 years (31.7%), 18 between 40 and 49 years(22%), 14 between 50 and 59 years (17%) and 3 between 60 and69 years (3.7%).
We obtained a mean age of 38.7 years, a minimum of23 years and a maximum of 61 years. The average numberof years that health professionals working in that institutionis 12.6 years with 10.1 years of professional experience witha minimum of 1 year and a maximum of 36 years, respec-
tively. Regarding the sex distribution of the sample, 44 werefemale (53.7%) and 38 male (46.3%). Of all surgeons, 15 weremales. With a total of 43 nurses, the majority (n = 27) werefemales.
r e v p o r t s a ú d e p ú b l i c a . 2 0 1 6;3 4(2):107–116 111
Table 2 – Cronbach’s alpha for each of the factors of theSafety Attitudes Questionnaire-OR version.
Factors Cronbach’salpha
Number ofitems (n = 59)
Teamwork climate 0.47 17Safety climate 0.67 19Stress recognition 0.72 10Job satisfaction 0.55 4Working conditions 0.50 4Perceptions of management 0.34 5
≥ 0.9, excellent; 0.7–0.9, good; 0.6–0.7, acceptable; 0.5–0.6, poor;<0.5, unacceptable.
Table 3 – Goodness-of-fit indices for CFA of the SAQ-ORfactors.
Sample size 82
Standardized root mean square residual (SRMR) 0.05Root mean square error of approximation (RMSEA) 0.00Comparative fit index (CFI) 0.90
SRMR reference: 0.0–1.0, with 0.0 indicating perfect fit. RMSEAreference: ≤0.05, good; ≥0.10, poor fit. CFI reference: 0.90–0.95,acceptable; >0.95, good.
wy3ehm
IIunaw
ITs
Table 5 – Communication analysis by differentprofessions (n = 82).
Communication Average Standarddeviation (SD)
Surgeons 3.1 0.9Nurses 3.7 0.7Anesthesiologists 3.3 0.9Radiographers 3.4 0.8Auxiliaries 3.4 0.8Communication (overall) 3.5 0.6
1, very low; 2, low; 3, adequate; 4, high; 5, very high.
A table with their respective response averages attributed
The majority of respondents are between 0 and 5 yearsorking in the institution with 24%, and between 6 and 10
ears with 28%. The same applies to years of experience with4.1% and 31.7% respectively. The majority of the sample ismployed full time (91.5%) and only 7 elements claim to beired part-time or contractual. Regarding shifts performed,ost of the staff said they hold variable shifts (73.2%).
nternal consistencyn order to study the internal consistency of the instrumentsed, Cronbach’s alpha for each of the factors of the question-aire was calculated (Table 2). The overall Cronbach’s alphassumes a value of 0.89 for all items of the questionnairehich is borderline excellent.
nternal construct validityhe goodness-of-fit values used to evaluate the internal con-truct validity are displayed in Table 3. The SRMR value was
Table 4 – Correlation matrix for the SAQ-OR factors.
Teamworkclimate
Safetyclimate
Josatisf
Teamwork climate 1Safety climate 0.43 1Job satisfaction 0.36 0.38 1Stress recognition −0.18 −0.05 −0Perceptions of management 0.58 0.70 0Working conditions 0.45 0.24 0
0.05, the RMSEA was 0.00, and the CFI value was 0.90, whichindicates an acceptable model fit approximation of the trans-lated version of the SAQ-OR. The inter-correlations betweenthe factors are presented in Table 4 and ranged from 0.2to 0.7.
Communication
Based on a Likert scale of 6 points the sample classifiedthe quality of communication. Descriptively represented inTable 5 are the averages of the responses for the differentprofessions and in Table 6 about communication between pro-fessional groups.
In order to ascertain whether the respondent’s occupiedfunction produces some influence on their perception of com-munication, the nonparametric Kruskal–Wallis (H) (Table 7)was applied.
Safety Attitudes Questionnaire-operating room factors
In Table 8 are shown the factors of the instrument that com-prise safety climate. Working conditions is the factor that has ahigher average (3.8) and perceptions of management have thelowest average (2.8). The climate team also has a high value inrelation to other factors, however is considerably within theaverage (3.4). Still related to this factor the safety climate hasthe second lowest rating with 3.1 in average.
by caregivers to each factor groups was also made (Table 9).The factors with higher scores are the working conditions andjob satisfaction.
baction
Stressrecognition
Perceptions ofmanagement
Workingconditions
.33 1
.36 −0.02 1
.23 −0.09 0.26 1

112 r e v p o r t s a ú d e p ú b l i c a . 2 0 1 6;3 4(2):107–116
Table 6 – Response distribution on communication between professionals (n = 82).
Function Communication
Surgeons Nurses Anesthesiologists Radiographers Auxiliaries
Surgeons 4.2 3.8 3.6 3.6 3.3Nurses 2.9 3.8 3.1 3.1 3.5Anesthesiologists 2.7 3.2 3.8 3.7 3.4Radiographers 2.9 3.4 2.7 4.8 2.6Auxiliaries 2.8 3.4 3.1 2.2 3.5
1, very low; 2, low; 3, adequate; 4, high; 5, very high.The gray shades highlight the relation between the same profession.
Table 7 – Communication influence on different professions (n = 82).
Function Communication
Surgeons Nurses Anesthesiologists Radiographers Auxiliaries p
Surgeons 65.6 34.4 32.5 34.0 36.2 0.00Nurses 39.2 39.2 24.4 28.7 28.8 0.24Anesthesiologists 38.5 28.0 44.9 19.4 27.6 0.03Radiographers 48.5 32.2 50.0 72.9 15.6 0.00Auxiliaries 39.7 440 43.
Table 8 – Analysis of safety climate factors.
SAQ factors Average Standarddeviation (SD)
Team climate 3.4 0.4Safety climate 3.1 0.4Working conditions 3.8 0.5Perceptions of management 2.8 0.6Stress recognition 3.3 0.6Job satisfaction 3.5 0.7
1, very low; 2, low; 3, adequate; 4, high; 5, very high.
value is not a characteristic of the instrument, but rather an
DiscussionThe purpose of this study was to translate the SAQ-OR Ver-sion and assess the validity and reliability of the Portuguese
Table 9 – Distribution of means allocated by different profession
Function
Teamworkclimate
Safetyclimate
Jobsatisfact
Surgeons 3.5 3.2 3.8
Nurses 3.4 3.1 3.4
Anesthesiologists 3.0 3.0 3.2
Radiographers 4.0 2.7 3.9
Auxiliaries 4.0 DK/NA 4.3
DK/NA – don’t know, not applicable; CD – completely disagree; PD – partiaCA – completely agree.
0 24.6 43.5 0.37
version. The values obtained in the study of validity of theinstrument both in each factor and as a whole are of thesame magnitude of the figures presented by the authors ofthe questionnaire.19 Translations and adaptations of “SafetyAttitudes Questionnaire” for other languages also revealeda high content validity.23,24 The SAQ has also been exten-sively used to relate climate safety with the results for thepatient,24 however this study did not address this issue. Thepresent value of Cronbach’s alpha value is closely linked tothe number of items evaluated. The greater the number ofitems, the higher the alpha value obtained.25 Thus, it is pos-sible to determine that low values are caused by the smallnumber of items per factor.26 Despite the usefulness of Cron-bach’s alpha in the study of reliability, it is still an estimate,subject to many influences to be taken into account. The alpha
estimate of the reliability of the data obtained,27 however, thevalues recorded on the validity of the instrument, using Cron-bach’s alpha ranged between 0.68 and 0.90.21,23,25 This study
al groups to the factors (n = 82).
Factors
ionStress
recognitionPerceptions ofmanagement
Workingconditions
3.5 3.0 3.73.2 2.9 3.43.0 2.5 4.13.2 2.7 3.72.7 3.5 4.1
lly disagree; NAND – neither agree nor disagree; PA – partially agree;
i c a . 2
wssabamvfr
gsctsatntmab(iehtithsstupaagaoicnots
maaas
r e v p o r t s a ú d e p ú b l
as conducted in a public hospital, more specifically in theurgery department. Many studies which use the SAQ haveamples within the hundreds or even thousands of subjectss they are large-scale studies.5,20,28 Internal construct validityased on the CFA and goodness-of-fit indices (SRMR, RMSEA,nd CFI) showed an acceptable model fit. According to goododel fit indices, the Portuguese version of the SAQ-OR is a
alid instrument. Factors were moderately correlated exceptor stress recognition, similar to the results of the psychomet-ic testing of other versions of the SAQ-OR.20,21
The main elements of the operating room team are sur-eons, nurses and anesthesiologists. Radiographers just addome timely interventions, particularly in orthopedics orardiology,16 being called by the radiology department, andherefore not part of the surgical team itself. So this profes-ional class has also been included for the sake of consistencys indirectly involved with patient safety in the operatingheater. There are significant differences related to commu-ication between the operating room team. Nurses also have
he highest average (3.8) which suggests higher quality of com-unication between them and the other professions which
grees with studies using the same instrument29 followedy Auxiliaries (3.4), Radiographers (3.4) and Anesthesiologists3.3). Surgeons have the lowest average (3.1). Communicationn the operating room follows complex patterns and is influ-nced by recurrent themes causing tension.16 These resultsowever, should not be extrapolated or generalized because
hey are very dependent on the number of individuals presentn each professional group. Nevertheless, similar studies pointo similar results in different patterns and professional classesave different communication strategies.26,27,30 Observationaltudies report more tense patterns of communication betweenurgeons and nurses.31 Communication patterns betweenense surgeons and anesthesiologists were also observed, butncommon.16,27 This can be explained by the fact that therocedures for dialog are more common among surgeonsnd nurses. In a study in which they used questionnairesnd direct observation of surgical procedures, nurses describeood partnership as having their opinions respected andccepted in the OR and the surgeons describe good collab-ration when nurses anticipate their needs and follow their
nstructions.32 In another study conducted in an intensiveare unit with similar methodology, doctors often resorted tourses to provide additional information and further detailsn the evaluation of the patient during rounds.33 However,hey describe many difficulties and less involvement in deci-ion making process during the rounds.
The factors “safety climate” and “perception of manage-ent” obtained the lower averages (3.1 and 2.8 respectively)
nd job satisfaction and working conditions the higher (3.5nd 3.8 respectively). Regarding the distribution of the aver-ge response of different professional groups evidenced thaturgeons and radiographers have the highest job satisfaction
0 1 6;3 4(2):107–116 113
(3.8 and 3.9). Nurses give greater score to team climate (3.4)and working conditions (3.4). Anesthesiologists give higherscore to fatigue and stress than other professional groups,followed by surgeons (3.5) and nurses (3.2). Compared to thestudies analyzed, nurses have higher levels of stress, followedby anesthesiologists and surgeons.5,28,34 The instrument usedis derived from a questionnaire for aviation safety. Thereis overlap between the two items of about 25%. In a com-parative study, the size of teams between OR and aviationdemonstrated that the pilots had less tendency to negatethe effects of fatigue and stress on your performance againstsurgeons (26% versus 70%).34 Being collaboration and commu-nication as important to the success of the procedures, theSAQ allows to measure teamwork, identify problems withinand between professional groups and evaluate interventionsaimed at improving patient safety.16 Other authors have con-cluded that, as in aviation, errors are more related withnon-technical skills such as communication, than with thetechnical capacity and performance.2,18
Conclusions
The SAQ-OR demonstrates good psychometric capabilitiesto study safety climate, however larger studies are neededto address the lack of data on some items. The develop-ment of a valid and reliable instrument is a longitudinalprocess that requires numerous positive findings across dif-ferent settings. The results indicate that working conditionsand job satisfaction are acceptable, but it is crucial to improvethe safety climate and the involvement of the managementbodies. Improving safety climate is crucial for increasingquality of service on surgical wards, and thus, it becomesrelevant to improve the above aspects. Our results demon-strate the perception of professionals employed in the OR,but the use of interviews and direct observation of surgi-cal procedures, would be also interesting for a more suitableapproach.
Conflicts of interest
The authors have no conflicts of interest to declare.
Acknowledgments
The authors would like to thank Chief-Nurse Maria Manuelaand the OR board of the Centro Hospitalar do Algarve (CHA-Faro) for their cooperation.
Annex 1. Safety AttitudesQuestionnaire-Operating Room–PortugueseVersion
b l i c a . 2 0 1 6;3 4(2):107–116
114 r e v p o r t s a ú d e p ú
i c a . 2 0 1 6;3 4(2):107–116 115
r e v p o r t s a ú d e p ú b l
b l i c a
r
1
1
1
1
1
1
1
1
1
1
2
2
2
2
2
2
2
2
2
2
3
3
3
3care ward rounds. J Clin Nurs. 2001;10:442–50.
34. Sexton J, Thomas E, Helmreich R. Error, stress, and teamwork
116 r e v p o r t s a ú d e p ú
e f e r e n c e s
1. USA. Institute of Medicine. To err is human: Building a saferhealth system. Washington, DC: National Academy Press;1999.
2. Fragata J. Erros e acidentes no bloco operatório: revisão doestado da arte. Rev Port Saúde Pública. 2011;VolTemat(10):17–26.
3. Singla A, Kitch B. Assessing patient safety culture: A reviewand synthesis of the measurement tools [Internet]. J PatientSaf. 2006;2:105–16.
4. Devriendt E, Heede K, Van Den Coussement J, Dejaeger E,Sexton B, Wellens NIH, et al. Content validity and internalconsistency of the Dutch translation of the Safety AttitudesQuestionnaire: An observational study. Int J Nurs Stud.2012;49:327–37.
5. Nordén-Hägg A, Sexton JB, Kälvemark-Sporrong S, Ring L,Kettis-Lindblad A. Assessing safety culture in pharmacies:The psychometric validation of the Safety AttitudesQuestionnaire (SAQ) in a national sample of communitypharmacies in Sweden [Internet]. BMC Clin Pharmacol.2010;10:8.
6. UK. National Healthcare System. An introduction to safetyclimate. London: National Healthcare System; 2010.
7. Ross J. Patient safety outcomes: The importance ofunderstanding the organizational culture and safety climate.J Perianesth Nurs. 2011;26:347–8.
8. Turnberg W, Daniell W. Evaluation of a healthcare safetyclimate measurement tool. J Safety Res. 2008;39:563–8.
9. Findley M, Smith S, Gorski J, O’Neil M. Safety climatedifferences among job positions in a nucleardecommissioning and demolition industry: Employees’self-reported safety attitudes and perceptions [Internet]. SafSci. 2007;45:875–89.
0. Flin R. Measuring safety culture in healthcare: A case foraccurate diagnosis [Internet]. Saf Sci. 2007;45:653–67.
1. Blegen M, Pepper G, Rosse J. Safety climate on hospital units:A new measure. In: Henriksen K, Battles JB, Marks ES, editors.Advances in patient safety. Volume 4: Programs, tools, andproducts. Rockville, MD: Agency for Healthcare Research andQuality; 2012.
2. The Health Foundation Inspiring Improvement. Evidencescan: Measuring safety culture [Internet]. London: The HealthFoundation; 2011. Available from: http://www.health.org.uk/sites/default/files/MeasuringSafetyCulture.pdf [accessed08.12.12].
3. UK. Health and Safety Executive (HSE). Offshore SafetyDivision. Safety climate measurement: User guide and toolkit[Internet]. London: Health and Safety Executive; 2004.Available from: http://www.lboro.ac.uk/media/wwwlboroacuk/content/sbe/downloads/Offshore%20Safety%20Climate%20Assessment.pdf [accessed 15.01.13].
4. Sammer C, Lykens K, Singh KP, Mains DA, Lackan NA. What ispatient safety culture?: A review of the literature. J NursScholarsh. 2010;42:156–65.
5. Flin R, Burns C, Mearns K, Yule S, Robertson EM. Measuringsafety climate in health care. Qual Saf Health Care.
2006;15:109–15.6. Lingard L, Reznick R, Espin S. Team communications in theoperating room: Talk patterns, sites of tension, andimplications for novices [Internet]. Acad Med. 2002;77:232–7.
. 2 0 1 6;3 4(2):107–116
7. Pereira MCA. Dinâmicas e percepcões sobre trabalho deequipa: um estudo em ambiente cirúrgico. Covilhã: Faculdadede Ciências da Saúde. Universidade da Beira Interior; 2010.Mestrado Integrado em Medicina.
8. Helmreich R, Schaefer H. Team performance in the operatingroom. New Jersey: Hillsdale; 1994.
9. Sexton J, Thomas E. The Safety Attitudes Questionnaire[Internet]. Austin: University of Texas; 2011. Available from:http://www.hret.org/quality/projects/walkrounds-saq.shtml[accessed 25.07.13].
0. Göras C, Wallentin FY, Nilsson U, Ehrenberg A. Swedishtranslation and psychometric testing of the safety attitudesquestionnaire: Operating room version [Internet]. BMC HealthServ Res. 2013;13:104.
1. Sexton J, Helmreich R, Neilands T, Rowan K, Vella K, Boyden J,et al. The Safety Attitudes Questionnaire: Psychometricproperties, benchmarking data, and emerging research[Internet]. BMC Health Serv Res. 2006;6:44.
2. Brown TA. Confirmatory factor analysis for applied research.New York, NY: The Guilford Press; 2006 (Methodology in thesocial sciences).
3. Deilkås ET, Hofoss D. Psychometric properties of theNorwegian version of the Safety Attitudes Questionnaire(SAQ): generic version: Short Form 2006 [Internet]. BMCHealth Serv Res. 2008;8:191.
4. Devriendt E, Van den Heede K, Coussement J, Dejaeger E,Surmont K, Heylen D, et al. Content validity and internalconsistency of the Dutch translation of the Safety AttitudesQuestionnaire: An observational study. Int J Nurs Stud.2012;49:327–37.
5. Shteynberg G, Sexton BJ, Thomas EJ. Johns Hopkins Qualityand Safety Research Group. Test retest reliability of the safetyclimate scale. Austin: The University of Texas Center ofExcellence for Patient Safety Research and Practice; 2005.Technical Report; 01-05.
6. Field A. Discovering statistics using SPSS. 3rd ed. Los Angeles:Sage; 2009.
7. Maroco J, Marques G. Qual a fiabilidade do alfa de Cronbach?Questões antigas e solucões modernas? Lab Psicol.2006;4:65–90.
8. Makary M, Sexton J, Freischlag JA, Holzmueller CG, MillmanEA, Rowen L, et al. Operating room teamwork amongphysicians and nurses: Teamwork in the eye of the beholder. JAm Coll Surg. 2006;202:746–52.
9. Wisniewski AM, Erdley WS, Singh R, Servoss TJ, Naughton BJ,Singh G. Assessment of safety attitudes in a skilled nursingfacility. Geriatr Nurs. 2007;28:126–36.
0. Hill A, Hill M. Investigacão por questionário. Lisboa: Sílabo;2002.
1. Gardezi F, Lingard L, Espin S, Whyte S, Orser B, Baker GR.Silence, power and communication in the operating room[Internet]. J Adv Nurs. 2009;65:1390–9.
2. Lingard L, Whyte S, Espin S. Communication failures in theoperating room: An observational classification of recurrenttypes and effects. Qual Saf Health Care. 2004;13:24.
3. Manias E. Street A. Nurse–doctor interactions during critical
in medicine and aviation: Cross sectional surveys. Br Med J.2000;9:745–9.