Safety Case for the Disposal of Spent Nuclear Fuel at ...Olkiluoto FI-27160 EURAJOKI, FINLAND Phone...
237
POSIVA 2012-39 February 2014 POSIVA OY Olkiluoto FI-27160 EURAJOKI, FINLAND Phone (02) 8372 31 (nat.), (+358-2-) 8372 31 (int.) Fax (02) 8372 3809 (nat.), (+358-2-) 8372 3809 (int.) Paul Wersin Mirjam Kiczka Dominic Rosch Gruner AG, Switzerland Safety Case for the Disposal of Spent Nuclear Fuel at Olkiluoto Radionuclide Solubility Limits and Migration Parameters for the Canister and Buffer
Transcript of Safety Case for the Disposal of Spent Nuclear Fuel at ...Olkiluoto FI-27160 EURAJOKI, FINLAND Phone...

POSIVA 2012-39
February 2014
POSIVA OY
Olki luoto
FI-27160 EURAJOKI, F INLAND
Phone (02) 8372 31 (nat. ) , (+358-2-) 8372 31 ( int. )
Fax (02) 8372 3809 (nat. ) , (+358-2-) 8372 3809 ( int. )
Paul Wersin
Mirjam Kiczka
Dominic Rosch
Gruner AG, Switzer land
Safety Case for the Disposal of Spent Nuclear Fuel at Olkiluoto
Radionuclide Solubility Limits and MigrationParameters for the Canister and Buffer

ISBN 978-951-652-219-0ISSN 1239-3096

Tekijä(t) – Author(s)
Paul Wersin, Mirjam Kiczka, Dominic Rosch Gruner AG, Switzerland
Toimeksiantaja(t) – Commissioned by
Posiva Oy
Nimeke – Title
SAFETY CASE FOR THE DISPOSAL OF SPENT NUCLEAR FUEL AT OLKILUOTO: RADIONUCLIDE SOLUBILITY LIMITS AND MIGRATION PARAMETERS FOR THE CANISTER AND THE BUFFER
Tiivistelmä – Abstract
This report presents canister, buffer and groundwater solubility limits, as well as buffer diffusion and sorption data for radionuclides to be used in safety assessment of a spent fuel repository at Olkiluoto.
In the analysis, saline water and brackish water are considered as reference groundwaters for different time windows. Dilute, carbonate rich water, brine water, high alkaline water and glacial melt water (Grimsel water) are considered as bounding groundwaters. The corresponding bentonite porewaters and canister waters, applying a thermodynamic model are defined. As in previous safety assessments, MX-80 bentonite was used as reference bentonite. All geochemical calculations were performed using the PHREEQC code and the thermodynamic database Thermochimie v.7b developed by Andra. This database builds on well established thermodynamic data, as recommended for example by the NEA TDB database.
Radionuclide (RN) solubilities were calculated for the expected reference and bounding conditions in (i) a (defective) canister, (ii) at the bentonite – host rock interface and (iii) in the bentonite buffer. For some RN, solubilities calculated with the Thermochimie database were compared with those calculated with the Nagra/PSI database and with calculations using the alternative SIT (Specific Ion Interaction Theory) method for the high saline bounding water (brine water). Reference solubility values are provided based on the calculated solubilities for the saline water and brackish water. For each RN, an upper solubility limit is recommended considering the uncertainity in the thermodynamic data as well as in the groundwater composition.
Effective diffusivities of all species are based on a compilation of available experimental data and their extrapolation to in-situ conditions. As a reference, MX-80 bentonite with a dry density of 1570 kg·m-3 was assumed with a lower and upper limit of 1410 and 1650 kg·m-3, respectively, which account for data and material uncertainty. Diffusion-available porosities of non-charged species and cations were assumed to equal the total porosity. Anion diffusivities and diffusion-available porosities were determined individually for each reference and bounding porewater to account for the variability in ionic strength.
In-situ sorption values were derived using the empirical approach of Bradbury & Baeyens (2003) with minor modifications suggested by Ochs & Talerico (2004). If available, high quality experimental batch sorption data were transferred to in-situ conditions using conversion factors, which account for differences in mineralogy and porewater chemistry (pH and RN speciation). In case of lacking suitable and reliable experimental data, analogue considerations or expert judgment had to be applied. Uncertainties associated with each conversion step and the derivation of an overall uncertainty factor were handled as proposed by Bradbury & Baeyens (2003). A best estimate and upper and lower limit sorption value for each reference and bounding porewater are given.
The uncertainties related to the potential effect of poorly known groundwater-born humic substances are highlighted. The new site-specific RN migration parameters are compared to those previously used in Posiva's safety assessments and major differences are highlighted and discussed.
Avainsanat - Keywords
Geochemical database, Radionuclide (RN) solubilities, RN diffusion data, RN sorption data, canister, buffer, near field. ISBN
ISBN 978-951-652-219-0 ISSN
ISSN 1239-3096 Sivumäärä – Number of pages
226 Kieli – Language
English
Posiva-raportti – Posiva Report Posiva Oy Olkiluoto FI-27160 EURAJOKI, FINLAND Puh. 02-8372 (31) – Int. Tel. +358 2 8372 (31)
Raportin tunnus – Report code
POSIVA 2012-39
Julkaisuaika – Date
February 2014


Tekijä(t) – Author(s)
Paul Wersin, Mirjam Kiczka, Dominic Rosch Gruner AG, Switzerland
Toimeksiantaja(t) – Commissioned by
Posiva Oy
Nimeke – Title
TURVALLISUUSPERUSTELU KÄYTETYN POLTTOAINEEN LOPPUSIJOITUKSESTA OLKILUOTOON: RADIONUKLIDIEN LIUKOISUUS JA KULKEUTUMISPARAMETRIT KAPSELILLE JA PUSKURILLE
Tiivistelmä – Abstract
Tässä raportissa esitetään radionuklidien liukoisuusrajat sekä diffuusio- ja sorptiokertoimet kapselissa ja puskurissa. Näitä tietoja käytetään Olkiluotoon rakennettavan käytetyn polttoaineen loppusijoitustilan turvallisuusanalyysissä.
Mallinnuksessa on oletettu suolaisen veden ja murtoveden kuvaavan eri ajanjaksoina vallitsevia pohjavesiolosuhteita. Sen lisäksi on häiriintyneinä olosuhteina huomioitu laimea karbonaattipitoinen vesi, erittäin suolainen vesi, korkean pH:n vesi ja jäätikön sulamisvesi (Grimsel). Näitä vesiä vastaavat bentoniitin huokosveden ja kapselissa olevan veden koostumukset on laskettu termodynaamisella mallilla. Kuten edellisessäkin turvallisuusanalyysissä MX-80 oli referenssibentoniitti. Kaikissa geokemiallisissa laskuissa käytettiin PHREEQC koodia ja Andran kehittämää Thermochimie v.7b termodynaamista tietokantaa. Tämä tietokanta perustuu vakiintuneeseen termodynaamiseen dataan, kuten esimerkiksi NEA TDB -tietokannassa suositellaan.
Radionuklidien (RN) liukoisuudet laskettiin oletetuissa vallitsevissa ja häiriintyneissä pohjavesiolosuhteissa (i) vaurioituneen kapselin sisällä, (ii) bentoniitin ja kallion rajapinnassa ja (iii) bentoniittipuskurissa. Joidenkin nuklidien Thermochimie tietokannan perusteella laskettuja liukoisuuksia verrattiin Nagra/PSIn tietokannan perusteella laskettuihin tuloksiin ja häiriintyneitä olosuhteita kuvaavan erittäin suolaisen veden tapauksessa vaihtoehtoisella SIT (Specific Ion Interaction Theory) -menetelmällä laskettuihin tuloksiin. Referenssiliukoisuusarvot perustuvat suolaiselle vedelle ja murtovedelle laskettuihin liukoisuuksiin. Jokaiselle nuklidille annettiin suositus liukoisuuden ylärajasta ottaen huomioon termodynaamiseen tietokantaan ja pohjavesien koostumukseen liittyvät epävarmuudet.
Kaikkien nuklidien efektiiviset diffuusiokertoimet perustuvat käytettävissä olevaan kokeelliseen tietoon, jonka perusteella in-situ olosuhteita vastaavat arvot on määritetty. Referenssinä käytettin MX-80 bentoniittia, jonka kuivatiheys on 1570 kg·m-3 (vaihteluväli 1410 - 1650 kg·m-3). Diffuusiohuokoisuus oletettiin neutraaleille molekyyleille ja kationeille samaksi kuin kokonaishuokoisuus. Anionien diffuusiokertoimet ja diffuusiohuokoisuudet määritettiin erikseen jokaiselle pohjaveden koostumukselle, jotta ionivahvuuden vaihtelu voitiin huomioida.
In-situ sorptioarvot määritettiin käyttäen Bradburyn & Baeyensin (2003) empiiristä ratkaisutapaa ja huomioiden Ochsin & Talericon (2004) ehdottamat muutokset. Jos korkealaatuista kokeellista tietoa oli saatavilla, se muunnettiin in-situ olosuhteita vastaavaksi konversiokertoimien avulla ottaen huomioon eroavuudet minerologiassa ja huokosveden kemiassa (pH ja RN spesiaatio). Jos soveltuvaa ja luotettavaa kokeellista tietoa ei ollut saatavilla, käytettiin hyväksi analogioita ja asiantuntija-arviointia. Kuhunkin muunnokseen liittyvät epävarmuudet ja kokonaisepävarmuustekijä määritettiin Bradbury & Baeyensin (2003) mukaisesti. Kullekin vesityypille annetaan suositeltu sorptiokerroin sekä sen ylä- ja alaraja.
Epävarmuudet, jotka liittyvät huonosti tunnettuun pohjaveden humusaineksen vaikutukseen on esitetty. Uusia paikkakohtaisia radionuklidien migraatioparametrejä on verrattu Posivan aiemmassa turvallisuusanalyysissä käytettyihinn ja suurimmat erot on huomioitu ja perusteltu. Avainsanat - Keywords
Geokemiallinen tietokanta, radionuklidien (RN) liukoisuus, RN diffuusio, RN sorptio, puskuri, kapseli, lähialue. ISBN
ISBN 978-951-652-219-0 ISSN
ISSN 1239-3096 Sivumäärä – Number of pages
226 Kieli – Language
Englanti
Posiva-raportti – Posiva Report Posiva Oy Olkiluoto FI-27160 EURAJOKI, FINLAND Puh. 02-8372 (31) – Int. Tel. +358 2 8372 (31)
Raportin tunnus – Report code
POSIVA 2012-39
Julkaisuaika – Date
Helmikuu 2014


1
TABLE OF CONTENTS ABSTRACT TIIVISTELMÄ ABBREVIATIONS ........................................................................................................... 5
1 INTRODUCTION .................................................................................................... 9
1.1 Geochemical boundary conditions .............................................................. 10
1.2 Radionuclides of interest ............................................................................. 14
1.3 Thermodynamic database ........................................................................... 14
PART I - RADIONUCLIDE SOLUBILITIES ................................................................... 17
2 BACKGROUND AND DATABASE ....................................................................... 19
3 DERIVATION OF SOLUBILITY DATA .................................................................. 23
3.1 Method ........................................................................................................ 23
3.2 Treatment of uncertainties .......................................................................... 24
3.3 Recommendation of "reference values" and "upper limit" ........................... 25
4 SOLUBILITY DATA............................................................................................... 27
4.1 Solubility of actinides ................................................................................... 27
4.1.1 Thorium (Th) ................................................................................... 27
4.1.2 Protactinium (Pa) ............................................................................ 28
4.1.3 Uranium (U) .................................................................................... 30
4.1.4 Neptunium (Np) ............................................................................... 33
4.1.5 Plutonium (Pu) ................................................................................ 35
4.1.6 Americium (Am) and Curium (Cm) .................................................. 37
4.2 Solubilities of the groups IA to VIIA ............................................................. 39
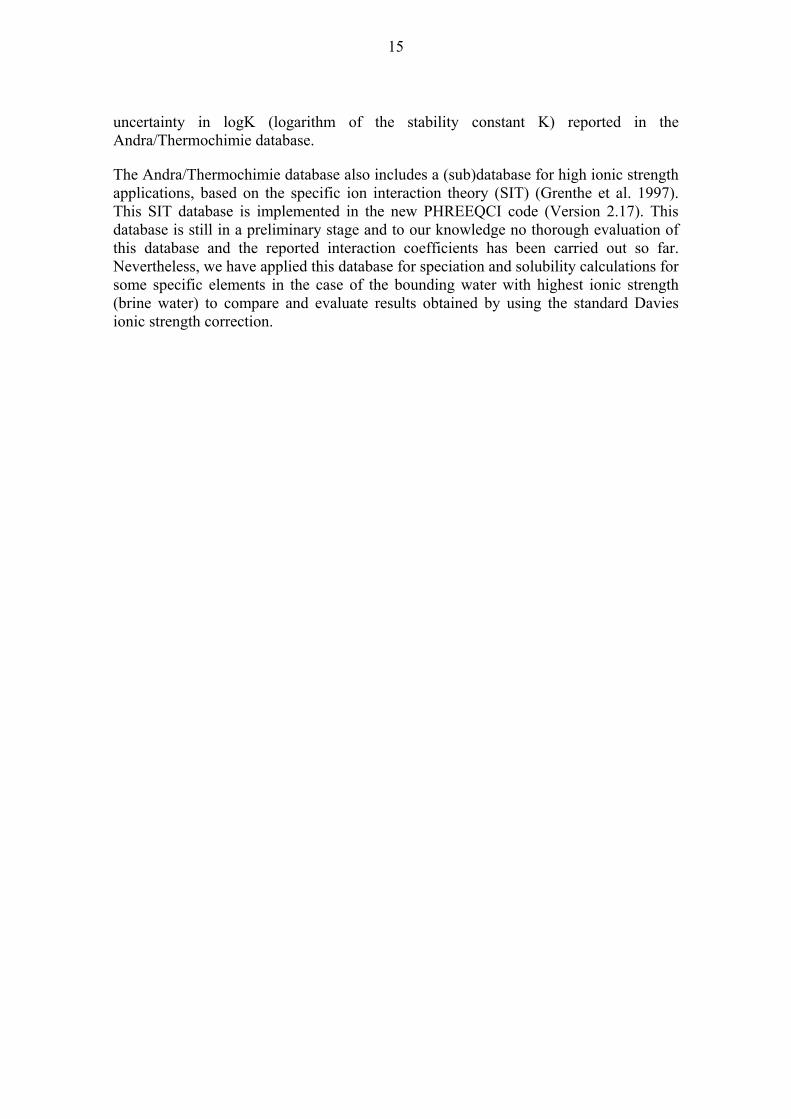
4.2.1 Carbon (C) ...................................................................................... 39
4.2.2 Radium (Ra) .................................................................................... 40
4.2.3 Caesium (Cs) .................................................................................. 44
4.2.4 Strontium (Sr) .................................................................................. 44
4.2.5 Selenium (Se) ................................................................................. 45
4.2.6 Tin (Sn) ........................................................................................... 47
4.2.7 Beryllium (Be) ................................................................................. 48
4.2.8 Iodine (I) .......................................................................................... 50
4.2.9 Chlorine (Cl) .................................................................................... 50
4.3 Solubilities of the transition metals .............................................................. 50
4.3.1 Zirconium (Zr) ................................................................................. 50
4.3.2 Nickel (Ni) ....................................................................................... 51
4.3.3 Niobium (Nb) ................................................................................... 52

2
4.3.4 Molybdenum (Mo) ........................................................................... 54
4.3.5 Technetium (Tc) .............................................................................. 55
4.3.6 Palladium (Pd) ................................................................................ 57
4.3.7 Silver (Ag) ....................................................................................... 58
4.4 Solubilities of the lanthanides ...................................................................... 59
4.4.1 Samarium (Sm) ............................................................................... 59
4.4.2 Europium (Eu) ................................................................................. 60
4.5 Solubilities in the bentonite porewater ........................................................ 61
4.5.1 Actinides ......................................................................................... 62
4.5.2 Groups IA to VIIA ............................................................................ 63
4.5.3 Transition metals ............................................................................. 65
4.5.4 Lanthanides .................................................................................... 67
5 DISCUSSION OF SOLUBILITY DATA ................................................................. 69
5.1 Comparison with previous assessment ....................................................... 69
5.2 General uncertainties and concluding remarks ........................................... 70
PART II - RADIONUCLIDE SORPTION AND DIFFUSION .......................................... 75
6 INTRODUCTION TO RADIONUCLIDE MIGRATION ........................................... 77
6.1 Radionuclide migration ................................................................................ 77
6.2 Bentonite porewaters .................................................................................. 78
7 RADIONUCLIDE DIFFUSION: MODEL CONCEPTS ........................................... 81
7.1 Multi-porosity diffusion models .................................................................... 81
7.2 Single porosity model .................................................................................. 82
7.3 Model uncertainties ..................................................................................... 82
8 RADIONUCLIDE DIFFUSION DATA .................................................................... 85
8.1 Diffusion of non-charged species (HTO) ..................................................... 85
8.2 Diffusion of anions (Cl-) ............................................................................... 88
8.3 Diffusion of cations ...................................................................................... 93
8.3.1 Cations sorbing via cation exchange .............................................. 93
8.3.2 Other cations ................................................................................... 97
8.4 Recommended diffusion data ..................................................................... 97
9 RADIONUCLIDE SORPTION IN COMPACTED BENTONITES ........................ 101
9.1 Sorption processes ................................................................................... 101
9.2 Derivation of sorption data ........................................................................ 101
9.2.1 Data selection ............................................................................... 102
9.2.2 Conversion factors ........................................................................ 103
9.2.3 Treatment of uncertainties ............................................................ 105
10 RADIONUCLIDE SORPTION DATA .................................................................. 107

3
10.1 Sorption values of actinides ...................................................................... 107
10.1.1 Thorium (Th) ................................................................................. 107
10.1.2 Protactinium (Pa) .......................................................................... 107
10.1.3 Uranium (U) .................................................................................. 108
10.1.4 Neptunium (Np) ............................................................................. 109
10.1.5 Plutonium (Pu) .............................................................................. 110
10.1.6 Americium (Am) and Curium (Cm) ................................................ 111
10.2 Sorption values of the groups IA to VIIA ................................................... 113
10.2.1 Carbon (C) .................................................................................... 113
10.2.2 Caesium (Cs) ................................................................................ 114
10.2.3 Strontium (Sr) ................................................................................ 115
10.2.4 Radium (Ra) .................................................................................. 116
10.2.5 Selenium (Se) ............................................................................... 116
10.2.6 Tin (Sn) ......................................................................................... 117
10.2.7 Beryllium (Be) ............................................................................... 117
10.2.8 Iodine (I) ........................................................................................ 118
10.2.9 Chlorine (Cl) .................................................................................. 119
10.3 Sorption values of the transition elements IB to VIIIB ............................... 119
10.3.1 Zirconium (Zr) ............................................................................... 119
10.3.2 Nickel (Ni) ..................................................................................... 119
10.3.3 Niobium (Nb) ................................................................................. 120
10.3.4 Molybdenum (Mo) ......................................................................... 121
10.3.5 Technetium (Tc) ............................................................................ 122
10.3.6 Palladium (Pd) .............................................................................. 122
10.3.7 Silver (Ag) ..................................................................................... 123
10.4 Sorption values of the lanthanides ............................................................ 123
10.4.1 Europium (Eu) ............................................................................... 123
10.4.2 Samarium (Sm) ............................................................................. 125
11 DISCUSSION OF SORPTION DATA ................................................................. 127
11.1 Sorption competition ................................................................................. 127
11.2 General uncertainties ................................................................................ 128
11.3 Comparison with previous assessments ................................................... 129
REFERENCES ........................................................................................................... 135
APPENDIX A - SOLUBILITY LIMITS .......................................................................... 149
A1 Overview solubilities ...................................................................................... 149
A2 Solubility data sheets .................................................................................... 150
APPENDIX B - SORPTION DATA .............................................................................. 169
B1 Overview sorption .......................................................................................... 169

4
B2 Sorption data sheets ..................................................................................... 170
APPENDIX C- REFERENCE BENTONITE PORE WATERS .................................... 199
APPENDIX D- REFERENCE AND BOUNDING GROUNDWATER COMPOSITION .................................................................................................. 225

5
ABBREVIATIONS
Amm total surface of montmorillonite
Andra French agency for the disposal of radioactive waste (Agence Nationale pour la Gestion des Déchets Radioactifs)
APW artificial porewater
BET surface area
surface area determined by gas (N2) adsorption (developed by Brunauer-Emmett-Teller)
C concentration CEC cation exchange capacity CF conversion factor d distance
D0 free solution diffusion coefficient (m2 s-1)
Da apparent diffusion coefficient (m2 s-1)
Dc pore diffusion coefficient (m2 s-1) in single porosity models
DDL diffuse double layer
De effective diffusion coefficient (m2 s-1)
Di diffusion coefficient in the interlayer (m2 s-1)
DIC dissolved inorganic carbon DOC dissolved organic carbon
Dp pore diffusion coefficient (m2 s-1)
EBS engineered barrier system Eh redox potential (mV) F Faraday constant (96485 j/V/eq) F fraction HS humic substances HSPW saline porewater used in SKB studies (Ochs and Talerico 2004) HTO tritiated water I ionic strength IL interlayer J flux (mol s-1 m-2) JAEA Japan Atomic Energy Agency KBS-3 concept
multi barrier disposal concept developed by SKB
Kd mass distribution ration between dissolved and sorbed species (sorption coefficient)
KWK (Volclay)
sodium bentonite from america
LEFR Linear Free Enery Relationship MINTEQ v.4 thermodynamic database available in Phreeqc
mmm mass of montmorillonite

6
MX-80 Commercial name for sodium-rich high-grade bentonite from Wyoming (USA)
NAGRA Swiss agency for the disposal of radioactive waste (Nationale Genossenschaft für die Lagerung radioaktiver Abfälle)
NBS National Bureau of Standards NEA Nuclear Energy Agency p stacking number of the TOT layer of montmorillonite particles PA performance assessment
pCO2 CO2 partial pressure
PHREEQC geochemical modelling program PSI Paul Scherrer Institute PW Porewater R gas constant (8.314 J/K/mol)
Rd experimentally determined distribution coefficient (m3/kg)
RN Radionuclide
RPW dilute brackish porewater used in SKB studies (Ochs and Talerico 2004)
S/L ratio solid-liquid ratio SA Safety Assessment
SAz-1 montmorillonite from the Clay Minerals Society's Source Clay Repository
SF repository spent fuel repository SHE Standard Hydrogen Electrode SIT Specific Interaction Theory
SKB Swedish Nuclear Fuel and Waste Management Co (Svensk Kärnbränslehantering)
SR-Can Safety assessment of SKB
SWy1 montmorillonite from the Clay Minerals Society's Source Clay Repository
T Temperature TDB thermodynamic database TDS total dissolved solids (g/L) TOC total organic carbon TOT tetraeder-octaeder-tetraeder layer of a clay mineral UF uncertainty factor x diffusion distance (m) z charge number
δ/τ2 tortuosity factor (ratio between constrictivity and totuosity)
ε diffusion available porosity
εc total porosity in single porosity models
εIL interlayer porosity

7
ζ filter factor κ debye length (m) Ξ ion equilibrium (osmotic type) coefficient
ρd or ρdry dry density (kg m3)
ρgrain grain density ((kg m3))
ρsat saturated density (kg m3)
ρw density of water (kg m3)
ΨD potential in Donnan volume (V)

8

9
1 INTRODUCTION
Safety assessment (SA) calculations depend fundamentally on the quality of the input data. Among these, radionuclide (RN) solubility, diffusion and sorption values for the near-field are key parameters and are often referred to as geochemical database for the near-field (e.g. Wersin & Schwyn 2004). In Figure 1-1, the concept for SA calculations with the compartments and location of input parameters for the near-field is schematically illustrated. Upon canister failure, RN solubility limits provide a boundary condition in the canister and at the buffer/host rock for the migration through the buffer. Within the bentonite buffer, RN migration is determined by diffusion and sorption processes and limited by solubility limits. Grivé et al. (2008) provided a first set of RN concentration limits for the conditions of the Olkiluoto site using four groundwater types equilibrated with bentonite and canister corrosion products. They applied a slightly modified version of the thermodynamic database presented in Duro et al. (2006) based on the Nagra/PSI database. Diffusion and sorption data used in the recent RN release and transport assessment (Nykyri et al. 2008) were adopted from the study of Ochs & Talerico (2004) for the Swedish SA SR-Can. Some of the parameters, for example the diffusion of neutral species, are not expected to differ significantly between the Swedish and Finnish concepts, because the same bentonite and density parameters are considered. In contrast, diffusion of anions and RN sorption values strongly depend on the local porewater chemistry. This underlines the need for a new assessment of RN diffusion and sorption data specifically for the Olkiluoto site. Recently, Hellä et al. 2014presented new geochemical data on the water compositions expected for the far and near-field at the Olkiluoto site, which are briefly summarised in section 1.1 and in Appendix D. These allow for more detailed and site specific calculations of RN solubilities, diffusion and sorption values. In the first part of the report, updated RN solubilities are presented. In the second part, Olkiluoto site specific diffusion and sorption values for future SA are derived. In each part, necessary theoretical background information and model assumptions are presented and a comparison with previous data is provided. Remaining open questions and need for further research are briefly discussed at the end of each part.

10
Figure 1-1. Concept of compartments, pathways and processes relevant for RN migration in the near-field as applied in SA calculations. Processes within the crystalline host-rock, which are investigated in Hakanen et al. (2014) are not included in this sketch.
1.1 Geochemical boundary conditions
Solubility and sorption of RN are a direct function of the geochemical conditions, such as pH, Eh and solution composition. The geochemistry of the waters in the compartments of the near-field depend on (i) the mineral composition and surface properties of the bentonite buffer, (ii) the materials inside the canister and (iii) the geochemical conditions/composition of the surrounding groundwater. The exchange between the different compartments and the host rock is characterised by solute diffusion and chemical reactions in the bentonite, such as dissolution/precipitation, cation exchange and surface complexation reactions. Although this will initially induce transient conditions, over longer time scales (decades to several 1000 years) diffusive equilibrium between the bentonite porewater and the groundwater of the host rock will be established. The composition of the groundwater will evolve over time, mainly driven by changing climate conditions. These changes in the groundwater composition occur over long time scales compared with the transient state in the bentonite. Therefore, calculations concerning the geochemical conditions in the bentonite buffer or inside the canister can approximated by the assumption of complete mixing and equilibrium with the surrounding groundwater (e.g. Appendix C). This assumption of chemical equilibrium allows the application of thermodynamic data for the modelling of porewater compositions, solubility limits and RN speciation. Hellä et al. 2014 (Appendix D) defined reference and bounding groundwaters, which reflect the geochemical evolution of the groundwaters over time and climate conditions. Reference waters are considered as the most plausible water composition for a specific time/climate window at Olkiluoto. Bounding waters, on the other hand, represent
RN matrix
waste bentonite buffer crystalline host rock
solubility sorption diffusion
solubility
canister

11
extreme water compositions with respect to near-field conditions, in particular also for RN solubility and sorption behaviour. Over the entire time frame and potential climate conditions, two reference and four bounding waters, as listed below, are considered as relevant for assessing solubilities and migration parameters in the near-field. Reference groundwaters:
saline water based on KR20/465/1 brackish water based on KR6/135/8
Bounding groundwaters: dilute carbonate rich water, based on KR4/81/1 brine water, based on KR4/861/1 high alkaline water, based on the saline reference water titrated with Ca(OH)2 glacial melt water (Grimsel water)
Based on these six groundwaters defined by Hellä et al. 2014 (Appendix D), a thermodynamic model for bentonite (Appendix C) was applied to derive three different sets of reference and bounding waters, as listed below. The focus was to provide realistic water compositions, especially with regard to pH, Eh, carbonate concentrations and ionic strength for radionuclide solubilities and migration parameters in the near-field. The applied model is based on the model for compacted bentonite developed by Wersin et al. (2004) and on later information on porosities (Appelo 2013; Tournassat 2008). A detailed description of the porewater modelling is provided in Appendix C. Briefly, this geochemical bentonite model considers three different types of water filled porosities: the interlayer water between the clay tetraeder-octahedra-tetraheder (TOT) layers (1), the diffuse double layer water (DDL), which is bound through electrostatic surface interactions to the external surfaces (2) and the non-interacting external water (Fig. 1-2). The conceptual uncertainties associated with this model were evaluated by comparing the results for the reference waters with those derived using the original model by Wersin et al. (2004) and the model of Bradbury & Baeyens (2002a). The main difference of these three models is the fraction of interlayer water, in which no geochemical reactions except for cation exchange take place, assumed in the modelling. In the model of Wersin et al. (2004), the volume fraction of interlayer water was set to 0 %, in the present model to about 50 % and in Bradbury & Baeyens (2002a) to 80 %. This exercise yielded intermediate compositions for the applied model (Appendix C Table 8). It further demonstrated that differences associated with the model selection are minor compared with differences arising from uncertainties in the groundwater composition, which is accounted for by the definition of reference and bounding waters. The three sets of reference and bounding waters include:
water at the bentonite/host rock interface. These correspond to the groundwaters equilibrated with calcite and quartz at a temperature of 25 °C. The geochemical parameters and composition are described in section 2 and summarised in Table 2-2.
bentonite porewater. Porewaters were calculated by assuming thermodynamic equilibration of the groundwaters with bentonite. Key aspects of the bentonite model and discussion of the porewater characteristics with respect to sorption/diffusion behaviour as well as summary Table 6-1 are presented in section 6.2 of this report. More information is available in Appendix C.

12
canister water. Canister waters were calculated by assuming equilibration of the porewater with canister corrosion products, namely magnetite. This results in low redox potentials controlled by the magnetite/Fe2+ equilibrium. The geochemical parameters and composition of the canister waters are summarised in Table 2-1.
external water
+
+
+
+
+
clayparticle
DDL
DDL
-
- -
-
-
-
-+
+
+
++
+
+
+
+
+++ +++ +++
+++
+++ +++ +++
+++
+
+
+
+
++
+
+
+
+
+
+
+
+
+
-
-
- + + -
1 23
12
3
interlayer water with exchanged cations
diffuse double layer with excess positive charge
charge balanced external porewater
1 nm
Figure 1-2. Different water types in bentonite according to model concept (Wersin et al. 2004). The bentonite buffer material used for the modelling of the reference and bounding porewaters, the derivation of sorption data and as reference for the diffusion data are a sodium rich bentonite from Wyoming with the commercial name MX-80. This bentonite has also been used as reference bentonite in previous safety assessments for Posiva and for other repository sites than Olkiluoto. Thus, a large number of experimental studies with MX-80 are available, which improves the applicability and thus quality of e.g. calculated sorption values. The properties and mineralogy of the MX-80 bentonite as taken in this report are summarised in Table 1-1. However, it should be mentioned that the selection of the buffer bentonite for Posiva is still in progress and other bentonites such as e.g. a Ca-bentonite from Milos, Greece are currently under investigation (Kumpulainen & Kiviranta 2010). Experimental data for RN diffusion and sorption in Ca-bentonites are comparatively rare, which does not allow an independent geochemical database for Ca-bentonites. Nevertheless, we include a short discussion on the Ca-bentonite cases, where data are available. All data reported here correspond to a temperature of 25 °C. The expected temperature at the canister/buffer interface will decrease from the early peak temperature of about 90 °C to about 50 °C at 1 000 years and to about 30 °C at 10 000 years after repository closure, as indicated from thermal calculations (Pastina & Hellä 2006). The choice to base solubilities and migration parameters on 25 °C has been motivated by: (i) the considerable time (>1 000 years) required to fill an initially defective canister with porewater from the buffer, even for "wet" host rock conditions, (ii) the minimisation of data uncertainties by applying all thermodynamic calculations for standard state conditions, and (iii) the comparably small errors introduced in neglecting temperature dependence for solubility and sorption data under the temperatures of interest.

13
Table 1-1 Parameters and mineralogical composition of the MX-80 bentonite used as reference bentonite system in this report. References: 1) Müller-Vonmoos & Kahr (1983); 2) Bradbury & Baeyens (2002a) 3) Bradbury & Baeyens (1997b) 4) Wieland et al. (1994).
Organic carbon in the groundwater has not been considered in these reference and bounding waters. TOC (Total organic carbon) values in deep groundwaters are often biased by leaching from the tubings which explains the large scatter in TOC contents observed in deep boreholes (Pitkänen et al. 2007). Considering this effect, the content of TOC in deep Olkiluoto groundwaters is generally low, a few mg L-1 (Pitkänen et al. 2007; Posiva 2009). The nature thereof is not well known and studies have been focussed on more shallow groundwaters. From a recent preliminary study (Vilhunen & Manninen 2010) it could be inferred that the TOC and content of humic substances (HS) decrease with depth. At the lowest depth sampled (228 m below surface), a TOC content of about 1.5 mg L-1 was found. The amount of dissolved organic carbon (DOC) made up by HS was determined to be 0.75 mg L-1. Due to methodological limitations the molecular size distribution could not be well determined. It was speculated that most of the HS consists of small-sized fulvic acids. It can be expected from this study and previous ones (Peuravuori & Pihlaja 1997; Mäkelä & Manninen 2008) that the amount as well as the molecular sizes of HS further decrease with depth, as a result of microbially-induced iron and sulphate reduction (Posiva 2009). An early study of Laaksoharju et al. (1994) on deep groundwaters of the KR1 borehole reported a HS concentration of "about 10 ppb" at a depth of 614 m, which is qualitatively in line with

14
the expected decrease in HS with depth. In summary, the concentrations of TOC and thus potentially RN complexing organic agents in the near-field are low, although there is considerable uncertainty with regard to the actual levels and nature of organic compounds. Due to the small poresize and the suppressed (or at least strongly limited) microbial activity, the levels of potentially reactive DOC in the buffer will likely be further reduced. The effect of HS on solubilities and sorption data are briefly discussed in the corresponding sections.
1.2 Radionuclides of interest
The number of RN in the canister is large and comprises fission products of uranium and plutonium and activation products from neutron absorption (Pastina & Hellä 2010). The set of RN investigated in this report is based on the RN inventory summarised in Pastina & Hellä (2010). It includes 33 RN of 22 elements, which were also used in previous safety assessments for example of Grivé et al. (2008). In addition to the RN set investigated by Grivé et al. (2008) we also provide data for beryllium, silver as well as iodine and chlorine, which are key elements affecting dose (e.g., Nykyri et al. 2008). Previously, Eu has not been included in SA considerations. However, it serves as an analogue for Sm sorption data and is therefore included in the new solubility and sorption thermodynamic database. The main groups of elements are:
actinides (Th, Pa, U, Np, Pu, Am, Cm) elements of the groups IA-VIIA (C, Ra, Cs, Sr, Se, Sn, I, Cl) transition metals (Zr, Ni, Nb, Mo, Tc, Pd, Ag) lanthanides (Sm, Eu).
1.3 Thermodynamic database
The derivation of RN solubilities and sorption values hinges on a reliable and consistent thermodynamic database. For this work, we apply the database Thermochimie v.7b developed by Andra (Andra 2009a). This database is designed to deal with various aspects of radioactive waste disposal including the determination of radioelement aqueous speciation and solubility, the study of the geochemical evolution, the assessment of the process of cement degradation and the assessment of the process of canister corrosion. 25 radioelements are included in this database. The database builds on well established thermodynamic data, such as for example those recommended by the NEA and the Nagra/PSI database (Hummel et al. 2002), on which solubility calculations of Grivé et al. (2008) were based.
As indicated in the last interim report (Andra 2009b), the Andra/Thermochimie database contains a rather comprehensive set of temperature dependent thermodynamic data, but important gaps are still manifested in enthalpy and/or entropy values (Andra 2009b). Further important uncertainties include metal carbonate complexation data (as also reflected in the NEA data) and data at pH > 10. For the purpose of this study, only the uncertainty related to carbonate complexation is important, in particular for actinides. For these elements, the uncertainty can be estimated to a large extent from the
15
uncertainty in logK (logarithm of the stability constant K) reported in the Andra/Thermochimie database.
The Andra/Thermochimie database also includes a (sub)database for high ionic strength applications, based on the specific ion interaction theory (SIT) (Grenthe et al. 1997). This SIT database is implemented in the new PHREEQCI code (Version 2.17). This database is still in a preliminary stage and to our knowledge no thorough evaluation of this database and the reported interaction coefficients has been carried out so far. Nevertheless, we have applied this database for speciation and solubility calculations for some specific elements in the case of the bounding water with highest ionic strength (brine water) to compare and evaluate results obtained by using the standard Davies ionic strength correction.

16

17
PART I - RADIONUCLIDE SOLUBILITIES

18

19
2 BACKGROUND AND DATABASE
Radionuclide (RN) solubilities or - in more general terms - RN concentration limits represent an important chemical constraint for safety assessment (SA) calculations. They are defined here for the expected conditions in a defective canister (Fig. 1-1), i.e. for an imaginary volume filled with water which is in equilibrium with the bentonite buffer and iron corrosion products. Furthermore, solubilities are calculated for the bentonite/host rock interface (Fig.1-1). In these latter calculations, solubilities are derived from the groundwater composition. Finally, solubility calculations are conducted for the porewater in the bentonite buffer. The chemical conditions in the "canister waters" are derived from geochemical modelling of bentonite porewaters in equilibrium with the canister corrosion product magnetite (Appendix C). The magnetite/Fe2+ equilibrium is controlling the redox potential of the canister waters. As outlined in section 1.1, two reference waters and four bounding waters have been defined, whose composition is shown in Table 2-1. The derivation procedure is presented in detail in Appendix C. The analogous procedure has been adopted for solubilities at the buffer/rock interface: The chemical composition of the two reference and four bounding groundwaters, as defined in Hellä et al. 2014 (Appendix D), was set to equilibrium with calcite and quartz at a temperature of 25 °C. The corresponding compositions of these groundwaters are listed in Table 2-2. For the solubilities in the clay buffer, the compositions in the "free" porewater listed in Table 6-1 were applied. The concept of solubilities for SA is well established and is based on chemical thermodynamics. Thus, in principle, the aqueous RN concentration is controlled by the most insoluble RN-containing solid for given chemical conditions. However, kinetic considerations with regard to the precipitation of the solid must be accounted for as well. This particularly holds for insoluble actinides and lanthanides where, for conservative reasons, the X-ray amorphous hydroxide forms rather than the more crystalline ones are assumed to control the aqueous concentrations. Moreover, for redox sensitive elements (e.g. U, Np, Se), redox kinetics which is highly system-specific needs to be accounted for.

20
Table 2-1 Reference waters and bounding waters for RN solubilities for water inside canister. Units in mmol L-1 unless otherwise indicated. Temperature is 25 °C.

21
Table 2-2 Reference and bounding groundwaters for RN solubilities for buffer / host rock interface. Units in mmol L-1 unless otherwise indicated. Temperature is 25°C.
Saline water KR20/465/1
Brackish water
KR6/135/8
Dilute, carbonate rich water, KR4/81/1
Brine water, KR4/861/1,
with PSI database
High alkaline water
Glacial melt water,
(Grimsel water)
log p(CO2) -2.74 -2.28 -2.11 -3.91 -8.30 -5.72
pH 7.21 7.12 7.49 7.18 10.0 9.69
Eh (mV) -222 -198 -224 -296 -408 -204
Alkalinity (meq
L-1)0.60 1.53 4.26 0.041 1.93 0.43
Ionic Strength
(meq L-1)215 144 18.94 1299 218 1.21
Na 116 77.12 13.15 424 117 0.69
K 0.28 0.47 0.25 0.560 0.28 0.0050
Mg 2.63 7.45 0.74 4.52 2.66 0.00062
Ca 32.75 16.19 1.19 392 33.77 0.13
Cl 182 114 9.91 1214 184 0.16
SO42- 0.21 4.82 0.96 - 0.21 0.061
S-2 0.0057 0.00060 0.00030 - 0.0058 -
CO3 tot 0.77 1.74 4.52 0.103 0.0095 0.19
Sr 0.16 0.093 0.0057 1.841 0.16 0.0020
Si 0.17 0.18 0.18 0.121 1.91 0.32
Mn 0.01 0.02 0.00 0.040 0.01 -
Fe 0.0023 0.0057 0.0081 0.036 0.0023 3.00E-06
F 0.051 0.016 0.032 0.084 0.052 0.36
Br 0.56 0.17 0.018 4.363 0.57 -
B 0.12 0.057 0.027 0.083 0.12 -
Calcite 0.0 0.0 0.0 0.0 0.0 0.0
Quartz 0.0 0.0 0.0 0.0 0.0 0.0
Siderite -1.88 -1.18 -0.23 -2.45 -2.25 -3.89
FeS(am) -1.59 -2.26 -2.01 - 1.00 -30.34
Magnetite -4.92 -3.58 -1.34 -5.67 9.92 4.22
Bounding groundwaters
Sat
ura
tio
n in
dex
S
.I.
Reference groundwaters
Gro
un
dw
ater
in e
qu
ilib
riu
m w
ith
cal
cite
an
d q
uar
tz

22

23
3 DERIVATION OF SOLUBILITY DATA
3.1 Method
The procedure for deriving RN concentration limits is rather well established and the process used in this report can be separated in different steps:
1) Derive "canister waters" to calculate solubilities inside the canister: equilibrate porewater from reference and "bounding" waters with corrosion products. This derivation procedure is described in detail in Appendix C.
2) For solubilities in the buffer, take equilibrated porewater from reference and "bounding" waters. This derivation procedure is described in detail in Appendix C.
3) For solubilities at buffer/rock interface, take reference and bounding groundwater compositions proposed by Hellä (Appendix D), equilibrated with calcite and quartz at 25 °C.
4) Calculate solubilities for RN based on thermodynamic database. Calculate "thermodynamic" uncertainties and derive "reference values" and "upper limit" (section 3.3). For certain critical RN, perform calculations with alternative database (e.g. Nagra/PSI database). In case of high salinity waters (brine water), perform calculations with alternative SIT method for some selected elements (Th, U, Pu, Am/Cm).
5) Derive solubilities for "special" RN: Ra, C-14(inorg), Se. 6) For RN where no reliable data are available, estimate solubility based on
chemical analogues or by "qualified guess" based on expert judgement. 7) Compare derived solubilities with data from the previous assessment of Grivé et
al. (2008) (which was based on the Nagra/PSI database), highlight main differences.
The thermodynamic calculations were performed with the PHREEQC code assuming a temperature of 25 °C in all calculations. The justification for calculations at 25 °C only is given in section 1.1. The calculations were run for the waters inside the canister (Table 2-1) based on the two reference and the four bounding waters and including the thermodynamic clay model and magnetite equilibrium. By including these model features, pH and redox buffering reactions of the clay and iron system are explicitly accounted for, thus stabilising the water composition. For the solubilities in the buffer, the approach was similar, but the redox conditions were assumed to be constrained by those of the corresponding groundwaters (Table 6-1). For the solubilities of the waters at the buffer/rock interface (Table 2-2) the procedure was also similar, but the calculations were carried out without the clay components. For some elements with a high solubility, PHREEQC intrinsic factors made it necessary to stabilise the Eh by adjusting the hydrogen partial pressure. In the PHREEQC code no direct fixation of the Eh is possible and the Eh is used to adjust for charge balance. An implicit assumption in the calculations was that no sulphate reduction would occur, which was ensured by decoupling sulphate from redox reactions. This is justified by the fact that microbially induced sulphate reduction is known to be suppressed, or at least severly restricted (or limited) in compacted bentonite (e.g. Masurat et al. 2010). For a

24
number of transition metals forming insoluble sulphides (e.g. Ni, Co), the absence of the sulphate-sulphide reaction results in higher (and thus more pessimistic) solubilities. For some elements (e.g Sr, Ra) forming insoluble sulphate phases, the opposite effect, namely increasing solubility upon sulphate reduction would arise. However, from the large range of sulphate concentrations in the considered reference and bounding waters, the omission of sulphate reduction is not expected to lead to an underestimation of solubilities for these elements. No information on phosphate concentrations in the groundwaters is available, but they are expected to be very low. Formation and precipitation of RN-phosphates are therefore conservatively ignored in the solubility calculations. The procedure included the following: First, the potential solubility controlling phases in the database were checked and the appropriate one(s) selected. Second, the equilibrium calculations with the selected solid(s) were carried out. For some important elements, calculations were conducted also with the alternative Nagra/PSI database. Third, the data were evaluated and upper (pessimistic) solubility limits proposed.
3.2 Treatment of uncertainties
A central aspect in deriving solubilities is the estimate of uncertainties. In particular, in addition to the "best estimate" (termed "reference values" here) it is important to present a "pessimistic" estimate or "upper limit" which accounts for both data and conceptual uncertainty (e.g. Andersson 1999). This is not a trivial task and requires, besides a transparent and traceable treatment, a certain deal of (subjective) expert judgment (e.g. Berner 2002; Wersin & Schwyn 2004). For most elements, the uncertainty treatment is approximated by estimating two types of uncertainties, namely the "thermodynamic" and "geochemical" uncertainty.
"Thermodynamic" uncertainty The formal thermodynamic uncertainty (formal uncertainty in the following) is estimated from the uncertainty in the solubility constant and that of the main species in solution. If the required uncertainty data are available and the different uncertainties of the logK constants are independent, the Gaussian error propagation method can be used (Grenthe et al. 1992). A simplified form of the general formula for error propagation is given in equation 3-1.
2
1
2
N
iYi
ix Y
X (3-1)
The formula to calculate the standard deviation can be simplified if the resulting variable X is a function of the sum of the variables Yi.
22
21
22211 21
: YYx ccYcYcX (3-2)
The total concentration of a radionuclide is the result of summing up the distribution of the total solubility over different complexes. Therefore, the error propagation is

25
calculated by summing up the uncertainties of the solubility product of the solubility controlling phase, and the formation constant of the main aqueous complex. It should be emphasised that in many cases these uncertainties are highly correlated (e.g. Hummel & Berner 2002) and thus the error propagation often leads to an overestimation of the uncertainty in total dissolved concentration. Identification of such correlations requires inspection beyond the thermodynamic database and careful evaluation of the original experimental data. This is beyond the scope of this exercise. The "thermodynamic" uncertainty also depends on the quality of the selected data in the database itself. For example, it includes various types of uncertainties, such as the extrapolation procedure of the original experimental data to zero ionic strength, the omission of relevant complexes or other types of errors in data processing for the database. In this exercise, we qualitatively consider this type of uncertainty by also applying the Nagra/PSI database for selected RN where the underlying thermodynamic data differ. There is yet another type of uncertainty, the logK uncertainty induced by the extrapolation method from zero to the ionic strength of the water to be considered. In the Andra/Thermochimie database, the logK data for charged species is extrapolated by the Davies equation and for uncharged species by the Setchenow equation (Andra 2009b; Parkhurst & Appelo 1999). The error induced by the ionic strength extrapolation is largely accounted for in the reported logK uncertainty up to an ionic strength of about 0.3 M, thus for all waters except for the brine water. For this water, the error induced by using the Davies method has been qualitatively evaluated by using the SIT data in the Andra/Thermochimie database, available in the new version 2.17 of PHREEQC (http://wwwbrr.cr.usgs.gov/projects/GWC_coupled/phreeqc/) (see also section 1.3).
"Geochemical" uncertainty The uncertainty in the geochemical conditions (in particular pH, Eh, CO2 concentration) is separately evaluated by defining reference and bounding waters. The geochemical uncertainty depends on the timing of the scenario considered and the uncertainty in estimated chemical evolution of the geosphere. This is accounted for to a large extent by defining the reference and bounding groundwaters as a function of the climatic evolution. For many elements, the "geochemical" uncertainty − the uncertainty resulting from variations in chemical composition − is larger than the "thermodynamic" uncertainty. Uncertainties related to the omitting of potential complexation of organic substances are discussed in a qualitative manner in section 5.2.
3.3 Recommendation of "reference values" and "upper limit"
Provided that good thermodynamic data for a given RN are available, the derivation of the solubilities for the two reference waters (saline KR20/465/1 and brackish KR6/135/8, see Table 2-1 for water inside canister and Table 2-2 for buffer/rock interface) is straightforward. The calculated solubilities for these reference waters are termed here as "reference values" for the water inside the canister and for the water at

26
the buffer/rock interface. In case of insufficient reliable data, reference values are estimated from data of a chemically analogous element, or if this is not possible, they are estimated by expert judgement. For safety assessment, it is important to carry out calculations under pessimistic assumptions. For this purpose, an upper (solubility) limit is proposed which considers both "thermodynamic" and "geochemical" uncertainty. The estimate of the overall uncertainty is a difficult task and depends strongly on the information available and the specific characteristics of the radioelement. Moreover, the water composition is not constant with time, but is influenced by the climatic evolution. Because of the large uncertainty in that evolution, we propose one (pessimistic) upper limit for all times. For most elements, this upper limit corresponds to the highest solubility of the six waters considered and accounting for the formal uncertainty. In cases where this resulted in unrealistically high solubilities, an element-specific procedure based on geochemical reasoning was adopted. Thus, for some elements (e.g. Am, Sn) only the "geochemical" uncertainty, but not the formal uncertainty was considered. For elements where the derived solubilities are higher than 210-3 M, they are considered as "unlimited". For sake of transparency, calculated solubilities are given for each element in the respective Tables, also for values higher than 210-3 M.

27
4 SOLUBILITY DATA
4.1 Solubility of actinides
4.1.1 Thorium (Th)
The solubility of Th is controlled by ThO2 (mcr) according to the Andra/Thermochimie database. We conservatively selected the amorphous hydrous oxide ThO2·2H2O(am) as solubility controlling phase. The redox state is Th(IV) for all conditions considered. Dissolved thorium in most of the waters is mainly present as Th(OH)4(aq) and Th(OH)3CO3
- complexes. In a carbonate rich water, Th(OH)3CO3- and Th(OH)2(CO3)2
2- are clearly the dominating complexes (solubility data sheet in Appendix A2). Formation of solubility increasing ternary Ca-Th(IV)-OH complexes is limited to pH > 14 (Altmaier et al. 2008) and can therefore be neglected for all in-situ conditions. The formal uncertainty calculation includes two uncertainties: 1) dissolution of the solubility controlling phase, 2) formation of the main aqueous complexes (see section 3.2).
Solubilities inside canister Uncertainties and recommended values:
The calculated solubilities for the reference waters using the Andra/Thermochimie database are lower compared with the values obtained with the Nagra/PSI database (Hummel et al. 2002) (Table 4-1). The higher solubility obtained with the Nagra/PSI database for the saline and the brackish water arises from the somewhat larger carbonate complexation constant. This is also reflected for the bounding water yielding the highest solubility (dilute, carbonate rich water). As pointed out in previous assessments (Hummel & Berner 2002; Duro et al. 2006; Grivé et al. 2008), the uncertainty in the Th carbonate complexation constants is rather large and the dominant contributor to the overall "thermodynamic" uncertainty. This does not only refer to the stability constants but also for the species considered. Whereas the Nagra/PSI database only includes the Th(OH)3(CO)3
- and Th(CO3)56- complexes, the Andra/Thermochimie database includes
complexation constants for a variety of Th-hydroxo-carbonate complexation constants, as determined by Altmaier et al. (2006). The thermodynamic data of Altmaier et al. (2006) has also been recommended by NEA (Rand et al. 2009), although the Th(OH)3(CO3)
- complex was not included by NEA. Its inclusion in the Andra/Thermochimie database however represents a conservative approach. For the brine water, the solubility was also calculated with the SIT database of Thermochimie in order to evaluate the error resulting from extrapolation with the Davies method. The calculated solubility with SIT is somewhat lower (710-10 M) compared with that obtained from the standard procedure (1.210-9 M). Reference values: 2.710-9 M for saline water, 4.210-9 M for brackish water. Upper limit: Using the calculated highest solubility (dilute, carbonate rich water) and adding the formal uncertainty (+ 0.7 log-units) yields 6.510-8 M. This is clearly lower than the solubility obtained from the Nagra/PSI database. Because of the large

28
uncertainty related to carbonate complex formation, we propose to use the highest solubility obtained from the Nagra/PSI database as upper limit, thus 8.810-7 M.
Solubilities at the bentonite/host rock interface Uncertainties and recommended values: The solubilities and speciation calculated for the bentonite/host rock interface (Table 4-1, solubility data sheet in Appendix A2) are rather similar to those calculated inside the canister. Using the analogous treatment the following solubilities are proposed: Reference values: 3.310-9 M for saline groundwater and 6.310-9 M for brackish groundwater. Upper limit: The highest solubility is obtained for the dilute, carbonate rich bounding water (2.010-8 M). Adding the corresponding formal uncertainty yields 1.010-7 M. Using the same argumentation as for the canister water yields an upper limit of 1.210-6 M, taken from the Nagra/PSI database.
Table 4-1. Solubilities of thorium (Th) for canister- and groundwaters with the associated formal uncertainties. Speciation data and uncertainties of single phases and species are provided in the Th solubility data sheet in Appendix A2.
*Solubility controlling phase ThO2(s)
4.1.2 Protactinium (Pa)
In general, the thermodynamic data for Pa is scarce and uncertain. The element may occur in the Pa(V) and Pa(IV) state, but it is generally assumed that the Pa(V) is stabilised under repository-type environments (e.g. Berner 2002). For Pa(V) the solubility limiting solid is Pa2O5(s) based on the Andra/Thermochimie thermodynamic

29
database. By applying the Andra/Thermochimie database and solubility control by Pa2O5(s), solubilities of about 10-9 M are obtained for most waters with PaO2(OH) as dominant species (Table 4-2, Pa solubility data sheet in Appendix A2). At higher pH the negatively charged PaO2(OH)2
- becomes dominant, resulting in a somewhat higher solubility. Due to the incomplete logK uncertainty data, the formal thermodynamic uncertainty cannot be calculated.
Solubilities inside canister: Uncertainties and recommended values: The overall uncertainty is dominated by the uncertainty in thermodynamic data. In view of this unsatisfactory situation, Berner (2002) proposed a conservative "best estimate" of 10-8 M for Nagra's HLW disposal concept, based entirely on experimental data of JAEA reported in Yui et al. (1999) and a comparison with the solubilities of other actinides. Calculations with the Andra/Thermochimie database result in lower solubilities (Table 4-2). Because of the uncertainty of the solubility controlling solid Pa2O5 whose data are derived from an old reference (Baes & Mesmer 1976), we conservatively adapt the “best estimate” proposed by Berner (2002). Reference values: Following the proposition of Berner (2002) we propose a "conservative" reference value of 10-8 M for both the saline and brackish waters. Upper limit: In view of the scarcity of the data, no estimate of the "thermodynamic" uncertainty is possible. We arbitrarily assume a large uncertainty of 2 log-units for the upper limit, thus yielding 10-6 M.
Solubilities at the bentonite/host rock interface: Uncertainties and recommended values:
The calculated values for solubilities and speciation (Table 4-2) are rather similar to those obtained for the canister waters. Applying the same arguments as for the canister waters the following values are proposed: Reference values: 10-8 M for both saline and brackish groundwaters. Upper limit: 10-6 M.

30
Table 4-2. Solubilities of protactinium (Pa) for canister- and groundwaters as calculated with the Andra/Thermochimie database. Note, that for conservatism, higher solubilities are recommended as reference and upper limit, data shown has informative character only. No overall uncertainties are provided, because no uncertainty is available for the solubility controlling solid phase (Pa2O5 (s)). Speciation data and uncertainties of single species are provided in the Pa solubility data sheet in Appendix A2.
4.1.3 Uranium (U)
The oxidation state of U is highly dependent on the redox conditions. Under the redox conditions of interest, U(IV), U(V)1 and U(VI) species may form stable complexes. Besides redox equilibria, redox kinetics needs to be considered, in particular with regard to the precipitating uranium phase. There are a number of experimental data indicating the reduction of uranyl in contact with zero-valent iron and corrosion products, such as magnetite and green rust (Fiedor et al. 1998; Farell et al. 1999; Gu et al. 1998; Morrison et al. 2001; Cantrell et al.1995; Cui & Spahiu 2002; Rovira et al. 2007; O'Loughlin et al. 2003). In all these studies, U(VI) was effectively immobilised by a combined reduction /precipitation process. Uranyl reduction was also shown to occur on an iron oxide surface doped with Fe(II) (Liger et al. 1999; Scott et al. 2005). Generally speaking, the results indicate that reduction kinetics of uranyl is affected by the surface reactivity of the iron sorbent. In the case of magnetite, reduction kinetics is influenced by the presence of zero-valent iron. Thus, studies with commercial magnetite suspensions indicated very slow and incomplete reduction of U(VI) (Grambow et al. 1996; El Aamrami et al. 1999; Missana et al. 2003), whereas uranyl showed effective reduction to U(IV) in contact with synthesised magnetite on steel coupons and H2 gas (Rovira et al. 2007). These ample experimental results provide a strong argument that uranyl having possibly been generated by radiolysis in the fuel will be reduced to an insoluble UO2 form when entering the canister environment.
1 The stability of pentavalent U is still controversial. According to the new NEA database (Guillaumot et al. 2003), U(V) complexes are stable and recommended to be included for thermodynamic calculations, in spite of the uncertainty of their stability.

31
From the above argumentation, UO2 in the amorphous form (UO2:H2O (am)) from the Andra/Thermochimie database is selected as solubility controlling phase. According to the thermodynamic calculations, U(OH)4 is the predominant species for all waters except for the brackish and dilute, carbonate-rich and glacial water type, where uranyl carbonate complexes dominate. This is because of the thermodynamically predicted stabilisation of U(VI) at high pH under mildly reducing conditions. Recent experimental solubility data from Ollila (2008) carried out within Posiva's research programme provides a good basis for comparing calculated solubility data presented below. In this work, the solubility of UO2 was measured in different NaCl solutions under reducing conditions. Conditions were varied from slightly alkaline to strongly alkaline conditions (pH 9 - 13). As solid phase crushed polycrystalline UO2 pellets were used. The experiments were carried out under nitrogen atmosphere. Furthermore, reducing conditions were maintained by inserting metallic iron in the solution. As depicted from Table 4-3, the obtained U concentrations are slightly pH dependent, thus slightly increasing with increasing pH. No clear effect of ionic strength is noted. The concentrations were also simulated by solubility calculations, also shown in Table 4-3. Note that for the high pH conditions, the Eh in the calculations was lowered with regard to reported Eh of - 400 mV (SHE), because of the predicted stabilisation of soluble uranyl complexes at this Eh. The comparison shows higher predicted than measured values, which probably is related to the higher crystallinity of the solid in the experiment relative to the amorphous phase taken from the Andra/Thermochimie database.
Table 4-3. Experimental data of the UO2 solubilities by different pH, ionic strength and experimental duration. Eh = -400 mV. Predicted uranium solubilities from UO2(am) also shown (Ollila 2008).
pH NaCl concentration (M) Duration (days) Measured solubility
mol/L Calculated solubility (mol/L)
9 0.01 432 2.5 ּ◌10-10 3.16 ּ◌10-9
10 0.01 432 5.5 ּ◌10-10 3.16 ּ◌10-9
11 0.01 432 3.9 ּ◌10-10 3.14 ּ◌10-9
12 0.01 432 5.5 ּ◌10-10 3.71·10-9 (Eh = -526 mV)
13 0.01 432 2.5 ּ◌10-9 8.42·10-9 (Eh = -614 mV)
9 0.1 325 1.0 ּ◌10-10 3.09 ּ◌10-9
9 0.1 180 1.8 ּ◌10-10 -
Solubilities inside the canister: Uncertainties and recommended values:
The formal uncertainty is calculated with the solubility product of UO2:H2O (am), the formation constant of the most abundant aqueous complex e.g. U(OH)4(aq), the redox reaction and from the carbonate formation (1.092+1.42+0.042+0.142)1/2 = 1.78). Using the alternative Nagra/PSI database and including the potentially important mixed uranium carbonate hydroxide complex (UCO3(OH)3
-), as suggested by Hummel &

32
Berner (2002), leads to a similar speciation with U(OH)4 as predominant species. This also holds for the brackish water, where less uranyl carbonate species are predicted using the Nagra/PSI database because of the smaller complexation constants relative to the Andra/Thermochimie database. The predicted solubilities using the Nagra/PSI database are generally lower because of the lower solubility constant of UO2 and the lower uranyl carbonate complexation constants (Table 4-4). Applying the SIT database of Thermochimie for the brine water, results in a similar solubility as that calculated with the standard database and applying the Davies approximation. The main uncertainties arise from the uncertainty in the stability of uranyl carbonate complexes and in the redox conditions affecting oxidation states. However, as pointed out above, there are strong experimental indications that the tetravalent form is stabilised in the reduced iron rich canister environment. For the reference values, we propose to use the calculated values from the Andra/Thermochimie database in which the update NEA data are included. It should be noted, that the Eh values used in the calculations probably lead to an overestimate in solubilities, in particular for the brackish waters where uranyl carbonate complexes are predicted to constitute 65% of total U. As indicated from experiments, the presence of reduced iron compounds in the canister is likely to stabilise the tetravalent form. Nevertheless, we conservatively propose the calculated solubilities as reference values: Reference values: 4.110-9 M for saline water, 2.410-8 M for brackish water. Upper limit: The highest solubility is calculated for the brackish-type water, which contains the highest carbonate content of all the waters. Adding the formal uncertainty of 1.1 log-units results in 3.010-7 M. As discussed above, the calculated solubility for the carbonate rich water is probably too high, but in view of the uncertainty related to carbonate complexes we propose this value as upper limit. Recently, stability constants for ternary earth alkaline (Ca, Mg) uranyl carbonate complexes have been reported (Dong & Brooks 2006; 2008), which are not implemented in the NEA data and not included in the Andra/Thermochimie database. The updated NEA TDB of uranium (Guillamont et al. 2003) noted these complexes but did not accept them in the TDB. Including these data leads to strongly increased solubilities, in particular for the brackish water (310-6 M; see Table 4-4). Such high solubilities are not in line with natural uranium concentrations inferred from natural analogue studies which are usually below 10-7 M (see e.g. Wersin & Schwyn 2004). Because of this mismatch, we do not include these complexes for the recommended solubility data. We acknowledge however that there remains uncertainty with regard to the relevance of ternary calcium uranyl carbonate complexes for Olkiluoto-type waters.

33
Solubilities on the bentonite/host rock interface: Uncertainties and recommended values:
The solubilities calculated for the groundwaters are rather similar to those of the canister waters, though the dominant species differ for some of the waters (U solubility data sheet). Reference values: 3.310-9 M for saline water, 6.310-9 M for brackish water. Upper limit: For estimating the upper limit we add the formal uncertainty (1.1 log-unit) for the brackish water which yields 6.010-8 M.
Table 4-4. Solubilities of uranium (U) for canister- and groundwaters with the associated formal uncertainties. Speciation data and uncertainties of single phases and species are provided in the U solubility data sheet in Appendix A2.
*Solubility controlling phase UO2(s)
4.1.4 Neptunium (Np)
Under the redox conditions of interest, neptunium may occur as tetravalent and pentavalent species. From a thermodynamic viewpoint, Np(IV) is the dominant oxidation state, as revealed from equilibria calculations carried out for recent safety

34
assessments (e.g. Berner 2002; Duro et al. 2006; Grivé et al. 2008). Kinetic data supporting the reduction of oxidised Np(V) in the presence of reduced Fe are more scarce than for U(VI). Recent Japanese studies (Nakata et al. 2002; 2004) support the reduction of Np(V) to Np(IV) in the presence of Fe(II), even in the case of homogenous solutions. This gives support for the assumption that neptunium in the EBS (engineered barrier system) will behave according to thermodynamic predictions. From the Np(IV) solids, the neptunium oxide NpO2(s) is the solubility controlling phase according to the Andra/Thermochimie database. For conservative reasons, the amorphous neptunium hydroxide (NpO2:2H2O (am)) was selected as solubility limiting phase. According to the thermodynamic calculations, Np(OH)4 with tetravalent neptunium is the dominant aqueous species for all waters. In waters with high carbonate concentrations, Np(CO3)(OH)3
- significantly contributes to the total dissolved Np (Np solubility data sheet in Appendix A2).
Solubilities inside the canister: Uncertainties and recommended values:
Using the alternative Nagra/PSI database leads to similar solubilities and speciation (not shown) as with the Andra/Thermochimie database, which is not surprising since the thermodynamic data are based on the same NEA data. Some uncertainty arises from the stability of the mixed Np(IV) carbonate hydroxide complex, but, as indicated from Hummel & Berner (2002), the contribution of this complex under the conditions of interest is not large. The formal uncertainty originates from the solubility product of the solid and the formation constant of Np(OH)4 (Table 4-5). Reference values: 1.010-9 M for saline water and brackish water. Upper limit: The range in solubility for all water is small. The calculated formal uncertainty is 1.12 log-units. Adding this uncertainty to the reference value yields a value of 1.310-8 M, which we recommend as upper limit.
Solubilities on the bentonite/host rock interface: Uncertainties and recommended values:
Solubilities and speciation are very similar (Table 4-5) to those calculated for canister waters. Reference values: 9.610-10 M and 1.010-9 M for saline groundwater and for brackish groundwater, respectively. Upper limit: We recommend considering the formal uncertainty (1.1 log-units) for the reference value, as also proposed for the canister water. This yields 1.310-8 M as upper limit.

35
Table 4-5. Solubilities of neptunium (Np) for canister- and groundwaters with the associated formal uncertainties. Speciation data and uncertainties of single phases and species are provided in the Np solubility data sheet in Appendix A2.
4.1.5 Plutonium (Pu)
Plutonium occurs in the tri- and tetravalent oxidation state in reducing environments. Its solubility is controlled by the tetravalent Pu oxide PuO2 (s) over a wide range of redox conditions, according to the Andra/Thermochimie database. For conservative reasons, the hydrous plutonium oxide PuO2:2H2O(am) is selected as solubility limiting phase. The calculations indicate the trivalent species Pu(SO4)
+ and Pu(CO3)+ as dominant
aqueous species for most waters. In the alkaline waters, the tetravalent Pu(OH)4 species predominates (Pu solubility data sheet in Appendix A2). Formation of solubility increasing ternary Ca-Pu(IV)-(OH) complexes only occur at pH above 11 and Ca concentration > 2 M (Altmaier et al. 2008) and therefore do not play a role under in-situ conditions. The solubility is generally low, reaching the highest values for the dilute, carbonate rich water (Table 4-6).
Solubilities inside the canister: Uncertainties and recommended values:
Using the alternative Nagra/PSI database and including the mixed Pu(IV) carbonate hydroxide complex proposed by Hummel & Berner (2002) leads to slightly different speciation and total concentrations. Both databases predict predominance of carbonate complexes for brackish and dilute, carbonate rich waters. The main difference is noted for the brine water where in the Nagra/PSI database Pu(III) chloride complexes are predicted to dominate, which are missing in the Andra/Thermochimie database. This difference probably reflects the uncertainty in ionic strength extrapolation. This is also indicated when the SIT database is applied for the brine water (Table 4-6), which results in a higher solubility (8.110-9 M) than that obtained from the standard Andra/Thermochimie database (1.210-9 M).

36
The uncertainty in complex formation, in particular with regard to the carbonate ligand is also reflected in the relatively large logK uncertainties recommended in both databases. The formal thermodynamic uncertainty is calculated from the reported individual uncertainties of the solubility constant, the redox equilibrium Pu4+/Pu3+ (0.67 log-units) and the main aqueous complex (Table 4-6). Reference values: 1.210-10 M for saline groundwater and 4.310-10 M for brackish groundwater. Upper limit: The highest solubility with the Andra database is obtained for the dilute, carbonate rich bounding water (1.810-9 M). In view of the general large uncertainty in speciation in carbonate rich waters, we propose to add the calculated formal uncertainty of 1.24 log-units, which leads to 3.010-8 M.
Solubilities at the bentonite/host rock interface: Uncertainties and recommended values:
Speciation and solubility show differences in the groundwaters with regard to the canister waters (Table 4-6, Pu solubility data sheet). This is mainly because of the differences in Eh conditions. The solubility of PuO2 increases with decreasing Eh under reducing conditions due to the stabilisation of Pu(III). For the groundwaters (e.g. saline, brackish waters) where Eh is assumed to be controlled by the S(VI)/S(II) redox couple, the Eh is lower than that of the corresponding canister waters in which magnetite/Fe(II) equilibrium is assumed. Thus, Pu solubility is higher in the groundwaters. The brine water shows the highest solubility because of the low Eh conditions controlled by CO3/CH4 (and not because of the high ionic strength). As reference values, the calculated solubilities for the reference waters are proposed: Reference values: 7.410-9 M for saline groundwater and 1.110-8 M for brackish groundwater. Upper limit: The highest solubility is reflected by the brine water (3.410-8 M). The formal uncertainty is composed of the individual uncertainties of the solubility constant, the redox equilibrium Pu4+/Pu3+ (0.67 log-units) and the main aqueous complex PuIII
(0.62+0.672+0.672)1/2 = 1.12). This results in an upper limit of 4.510-7 M.

37
Table 4-6. Solubilities of plutonium (Pu) for canister- and groundwaters with the associated formal uncertainties. Speciation data and uncertainties of single phases and species are provided in the Pu solubility data sheet in Appendix A2.
*Solubility controlling phase PuO2(hyd,ag)
4.1.6 Americium (Am) and Curium (Cm)
Americium and curium are chemically very similar. Because of that, the calculated data of americium are also used for curium. Under considered redox potentials, the only oxidation state is Am(III). Various solid Am phases may form under the considered conditions. Thermodynamic calculations with the Andra/Thermochimie database indicate the stability of Am(III) carbonate hydroxide phases Am(CO3)3(OH)(am) and Am(CO3)2Na5H2O. The crystalline hydroxide and carbonate hydroxide forms are conservatively excluded from the solubility considerations. The main aqueous complexes are AmOSi(OH)3
2+ and Am(CO3)+. Only in the high
alkaline water, Am(OH)2+ predominates. Based on the Andra/Thermochimie database
and the predominant aqueous speciation the chosen solubility controlling phase for the brine water KR4/861/1, the high alkaline water and the glacial melt water is Am(OH)3(am), for the dilute, carbonate rich water is Am(CO3)(OH) (am) and for all other waters it is Am(CO3)2Na:5H2O(s) (Am / Cm solubility data sheet in Appendix A2). The amorphous Am(OH)3 and Am(CO3)(OH) were chosen over the thermodynamically solubility limiting crystalline phases for conservative reasons. Am(OH)3 (aq) species do not play a significant role under in-situ conditions. Hence, solubility increasing formation of ternary Ca-Am/Cm-OH complexes as observed for Cm at pH 11 (Rabung et al. 2008) can be neglected.

38
Solubilities inside the canister: Uncertainties and recommended values:
The "geochemical" uncertainty is more relevant than the thermodynamic one, as indicated from the variation in solubility in the different waters (Table 4-7). The increase in solubility is related to the carbonate complexation for the more carbonate rich waters, and to the first hydrolysis complex in case of the alkaline water. In the formal "thermodynamic" uncertainty calculation, the uncertainty of the solubility controlling phase and the most abundant aqueous complex formation is included. Applying the SIT database of Thermochimie for the brine water results in a considerably higher solubility (1.310-4 M) as that calculated with the standard Andra/Thermochimie database (2.710-5 M) with the standard Davies Ionic strength correction. This highlights the large uncertainty induced by the ionic strength extrapolation method for this element. The application of the Nagra/PSI database yields similar solubilities for most waters. In the case of the alkaline waters however, lower solubilities are predicted by application of the Nagra/PSI database. This is because of the different Am(III) silicate complexation data, resulting in a weaker complex formation. Reference values: 1.710-6 M for saline water and 6.010-6 M for brackish water. Upper limit: The highest solubility is of about 2.710-5 M obtained for the brine water. A similar value is obtained if the calculated formal uncertainty is considered for the brackish reference water. We propose this value to be used as upper limit.
Solubilities on the bentonite/host rock interface: Uncertainties and recommended values:
In the brackish and in the dilute, carbonate rich groundwater, the solubility is slightly lower for the buffer/rock interface brackish water than in the canister water because of the lower pH conditions. The speciation however remains very similar. On the other hand, the solubility for the saline groundwater is higher than the corresponding one for the canister water. This is explained by the lower pH in the groundwater and the corresponding difference in speciation. Reference values: 1.110-5 M for saline groundwater and 5.210-6 M for brackish groundwater. Upper limit: As for the canister water, we propose the highest solubility value (6.810-5 M) obtained for bounding brine groundwater to be uses as upper limit.

39
Table 4-7. Solubilities of americium (Am) and curium (Cm) for canister- and groundwaters with the associated formal uncertainties. Speciation data and uncertainties of single phases and species are provided in the Am/Cm solubility data sheet in Appendix A2.
* Solubility controlling phase AmCO3OH(cr), ** solubility controlling phase Am(OH)3(cr)
4.2 Solubilities of the groups IA to VIIA
4.2.1 Carbon (C)
Most carbon-14 released from the spent fuel and the zircaloy cladding is expected to occur in organic form (Yim & Caron 2006). Organic carbon: The solubility of organic carbon species is conservatively assumed to be unlimited in view of the large uncertainty with regard to the organic C-14 species released from the waste and the activated metals of the canister (Johnson & Schwyn 2008). Inorganic carbon: The solubility of inorganic carbon is fixed through the dissolution of calcite. All canister waters and groundwaters are saturated with calcite.
Solubilities inside the canister: Uncertainties and recommended values:
The formal uncertainties in the well known inorganic carbon system are small and therefore negligible compared to the geochemical uncertainty (Table 4-8). The most relevant parameters affecting calcite solubility in the bentonite porewaters are pH and alkalinity.
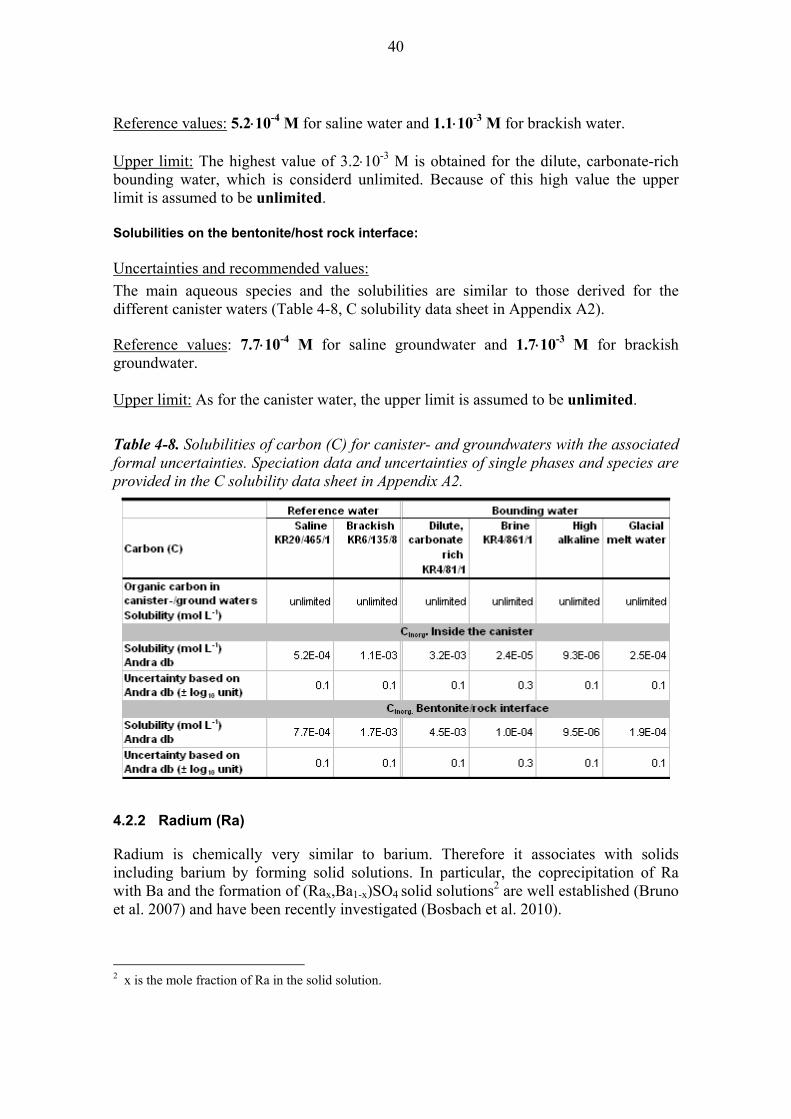
40
Reference values: 5.210-4 M for saline water and 1.110-3 M for brackish water. Upper limit: The highest value of 3.210-3 M is obtained for the dilute, carbonate-rich bounding water, which is considerd unlimited. Because of this high value the upper limit is assumed to be unlimited.
Solubilities on the bentonite/host rock interface: Uncertainties and recommended values:
The main aqueous species and the solubilities are similar to those derived for the different canister waters (Table 4-8, C solubility data sheet in Appendix A2).
Reference values: 7.710-4 M for saline groundwater and 1.710-3 M for brackish groundwater. Upper limit: As for the canister water, the upper limit is assumed to be unlimited.
Table 4-8. Solubilities of carbon (C) for canister- and groundwaters with the associated formal uncertainties. Speciation data and uncertainties of single phases and species are provided in the C solubility data sheet in Appendix A2.
4.2.2 Radium (Ra)
Radium is chemically very similar to barium. Therefore it associates with solids including barium by forming solid solutions. In particular, the coprecipitation of Ra with Ba and the formation of (Rax,Ba1-x)SO4 solid solutions2 are well established (Bruno et al. 2007) and have been recently investigated (Bosbach et al. 2010).
2 x is the mole fraction of Ra in the solid solution.

41
The inventory of (stable) barium in the waste is largely in excess compared to that of active Ra-226 which is formed by decay of thorium and uranium isotopes. Compared to the pure end member solid, the aqueous concentration of radium is three to four orders of magnitude lower forming solid solutions. This can be illustrated by the following relationships (e.g. Appelo & Postma 2007). For a solid solution the solid phase activity is related to the mole fraction:
444RaSO RaSORaSO x (4-1)
In an ideal solid solution, the activity coefficient λ is equal to one, which is a valid assumption for trace concentrations of Ra coprecipitating with Ba (Bruno et al. 2007).
)1( and ; RaSO
4444 RaSOBaSORaSOBaRa
Ra xxxmolmol
mol
(4-2)
and
4
4
4
4
2
2
RaSO
BaSO
BaSO
RaSO
K
K
Ra
Ba
x
xK
(4-3) where KBaSO4 and KRaSO4 are the solubility constants of the pure end members. Equation (4-3) highlights that the solubility of Ra is strongly related to its mole fraction in the solid solution. At trace concentrations of Ra relative to Ba, the Ba2+ concentration is controlled by the solubility of the BaSO4 end member. By combining eqs. 4-2 and 4-3 one obtains:
])[1(
24
2
4
44
SOx
KxRa
RaSO
RaSORaSO
(4-4) The solubility of Ra thus depends primarily on the inventories of Ra and Ba and the sulphate concentration of the porewater. In the assessment of Grandia et al. (2008), the Ra solubility in a Ra-Ba solid solution was calculated from the waste inventories of SKB's SF repository, conservatively assuming the maximum Ra inventory which is reached from ingrowth after about 300 000 years. The calculated dissolved Ra was in the range of 10-11 mol L-1. This is in the upper range of observed concentrations in natural and anthropogenically influenced environments (Dickson 1990; Langmuir & Melchior 1985). Here we apply an analogous approach by taking the inventory of stable barium and the maximum radium inventory which is generated from the uranium and thorium decay series. The Ba and Ra inventories for different fuel types and burn-up, characteristic for Finnish nuclear power plants (Anttila 2005) are shown in Table 4-9. The amount of stable Ba increases along with its ingrowth as a decay product. Thus, its early inventory at the cooling time of 30 years is applied as a conservative choice leading to higher calculated Ra solubilities. The Ra/Ba ratio at maximum Ra inventory (100 000 years) varies for the different fuel types from 2.2E-04 to 3.2E-04. The Ra solubility

42
calculations were carried out with PHREEQC (keyword SOLID SOLUTION), conservatively assuming the highest Ra/Ba ratio of 3.2E-04.
Table 4-9. Barium and radium inventories of different reactor types and burn-ups per tU, all based on 3.8 % fuel enrichment (Anttila 2005). Stable barium concentrations are calculated for a cooling time of 30 years as based on given element-wise mass (g/tU) in Appendix 3 of Anttila 2005, calculated to mol/tU by considering the molecular weight of Ba 137 g/mol.
Reactor type/burn-up Ra-226 Ra-226 Ra-226 Ra-226 Ba (stable) minimum
Ra/Ba maximum
cooling time (years) 1E +03 1E+04 1E+05 1E+06 3E+01 1E+05*
mol /tU mol /tU mol /tU mol /tU mol /tU mol/mol
BWR/ 40 MWd 1.46E-05 6.26E-04 4.95E-03 2.09E-03 19.1 2.59E-04
BWR / 60 MWd 1.83E-05 8.34E-04 6.58E-03 2.34E-03 29.6 2.22E-04
VVER 440 / 40 MWd 1.72E-05 7.50E-04 5.92E-03 2.24E-03 18.9 3.13E-04
VVER 440 / 60 MWd 2.56E-05 1.19E-03 9.36E-03 2.79E-03 29.4 3.18E-04
EPR/ 40 MWd 1.65E-05 7.29E-04 5.76E-03 2.22E-03 19.1 3.02E-04
EPR/ 60 MWd 2.49E-05 1.16E-03 9.15E-03 2.76E-03 29.6 3.09E-04
*Ra-226
The results show that, depending on the solution composition, Ra2+ or RaSO4 are the most abundant species (Ra solubility data sheet in Appendix A2). For the brine water, Ra chloride complexes are predicted to be significant. The differences in solubilities are largely explained by the differences in sulphate concentrations, high sulphate concentrations leading to lower solubilities (cf. eq. 4-4), in spite of the opposing effect of sulphate complexation. In the brine groundwater, sulphate and sulphide concentrations were below the detection limit, thus no sulphate concentrations are given in the corresponding canister water and the groundwater at the bentonite/rock interface. However, the brine water is considered only to occur in the early phase of the repository. In this phase the dissolution of gypsum in the bentonite will presumably provide enough sulphate for the precipitation of Ra as Ra(x)Ba(1-x)SO4. We therefore deem it justified to calculate Ra solubility in the brine water as the maximum solubility of Ra(x)Ba(1-x)SO4. In this approach no initial sulphate concentration is considered which would lower the Ra solubility. Ra solubilities in the brine water are therefore the highest solubilities of all reference and bounding waters. The solubilities of Ra assuming a pure RaSO4 phase are also calculated (Table 4-10). These show 3-4 order higher concentrations relative to the Ra-Ba sulphate solid solution. Note that in the previous solubility assessment of Grivé et al. (2008), Ra solubility for the pure RaSO4 was assumed, which also resulted in much higher solubility values compared to those derived here (Table 5-1).
Solubilities inside the canister Uncertainties and recommended values:
The reported logK uncertainties are incomplete and therefore the formal uncertainties cannot be calculated. The uncertainty in geochemical conditions are however more relevant, in particular the variation in sulphate concentrations. The coprecipitation and

43
solid solution formation of (Rax,Ba1-x)SO4 is well established, also supported by recent experimental data (Bosbach et al. 2010), and the Ba inventory in the waste is large. Therefore, we consider it justified deriving solubilities for the reference waters based on solid solution formation. Because of some remaining uncertainty with regard to the nature of the solubility controlling phase(s) and the fate of Ba and Ra in the canister and in bentonite we propose to use the highest solubility obtained from the pure RaSO4 phase as upper limit. Reference values: 1.610-11 M for saline water and 6.710-11 M for brackish water. Upper limit: 8.710-5 M highest concentration value (brine) from the solid solution end member RaSO4(s).
Solubilities at the bentonite/host rock interface: Uncertainties and recommended values:
Because of lower concentrations of sulphate relative to the bentonite porewater for the reference saline groundwater, the Ra solubility is higher in the reference saline groundwater. Other than that, solubilities are very similar (Table 4-10). Reference values: 1.710-9 M for saline groundwater and 6.710-11 M for brackish groundwater. Upper limit: 8.610-5 M highest concentration value (brine groundwater) from the solid solution end member RaSO4(s).
Table 4-10. Solubilities of radium (Ra) for canister- and groundwaters. No formal uncertainties are provided, because no log K uncertainty of the solubility controlling phase is available. Speciation data and uncertainties of single species are provided in the Ra solubility data sheet in Appendix A2.

44
4.2.3 Caesium (Cs)
For caesium, there is no sparingly soluble salt which would form under Olkiluoto-type conditions. Under such conditions, Cs+ is the main species. Depending on the chloride concentrations, the CsCl complex contributes to some extent to the overall speciation. Reference value: For all waters the caesium concentration is unlimited.
4.2.4 Strontium (Sr)
For strontium, the solubility controlling solid phases based on the Andra/Thermochimie database are celestite (SrSO4) or strontianite (SrCO3), depending on the concentrations of sulphate and carbonate. The most dominant dissolved species is Sr2+. Depending on the water composition, SrCl+ and SrSO4 can make up a substantial fraction of the speciation. As in all other calculations, the reduction of sulphate to sulphide is suppressed. If microbially-mediated sulphate reduction were to occur, celestite would be more soluble and therefore strontianite would exert the solubility control for the sulphate dominated waters.
Solubilities inside the canister: Uncertainties and recommended values:
The formal uncertainties related to the solubility controlling phases celestite and strontianite are small compared to the geochemical uncertainties reflected by the reference and bounding waters (Tables 4-11). Reference values: 1.310-4 M for saline water and 7.410-4 M for brackish water. Upper limit: Considering the high solubility value from the brine and high alkaline waters we propose an unlimited upper solubility value.
Solubilities at the bentonite/host rock interface: Uncertainties and recommended values:
For the saline groundwater, the solubility controlling phase has changed because of the considerably lower sulphate concentration of the groundwater relative to the bentonite porewater (which is in equilibrium with gypsum). For the other waters, only small changes in the solubilities arise (Table 4-11), caused mainly by differences in bicarbonate concentration and pH. Reference values: unlimited for saline groundwater and 8.710-4 M for brackish groundwater. Upper limit: Considering the high solubility value from the saline, brine and high alkaline waters we propose an unlimited upper solubility value.

45
Table 4-11. Solubilities of strontium (Sr) for canister- and groundwaters with the associated formal uncertainties. Speciation data and uncertainties of single phases and species are provided in the Sr solubility data sheet in Appendix A2.
4.2.5 Selenium (Se)
Selenium may occur in many oxidation states: VI, IV, 0, -I, -II. Under reducing conditions, Se(O), and Se(-II) prevail due to their thermodynamic stability under these conditions (Séby et al. 2001). The solubility of Se under reducing conditions is affected by the presence of iron with the formation of insoluble FeSex phases. Moreover, Se may be incorporated in iron sulphides as solid solution (Vaughan & Craig 1987; Cutter 1989). The reduction of oxidised Se is slow and kinetically controlled. In particular, Se(VI) may be stabilised under reducing conditions for long times. Because of the possibility that fuel releases oxidised Se species via radiolysis, the reduction of Se(IV) and Se(VI) in the presence of iron metal surfaces has been experimentally investigated. The results obtained are, to our knowledge, not yet entirely conclusive, but there are strong indications of reduction of oxidised Se to insoluble species FeSex and Se(0). Thus, it could be shown by spectroscopic analysis that both reduction of Se(IV) and Se(VI) sorbed to iron surfaces under simulated repository like conditions occurred (Cui et al. 2009; Puranen et al. 2009; Kvashnina et al. 2010). In general, the reduction of Se(VI) is slower than that of Se(IV) and more sensitive to experimental conditions (e.g. Puranen et al. 2009). This has been explained by the low sorption affinity of selenate to iron oxide surfaces relative to that of selenite (Cutter 1989; Puranen et al. 2009). The presence of uranyl was shown to enhance the reduction of Se(VI) (Puranen et al. 2010). In conclusion, experimental data indicate, that in spite of uncertainties in the reduction process, the reduction of oxidised Se species to insoluble reduced species in the canister environment for the periods of interest is very likely to occur. Thus, we consider it justified to estimate Se solubilities from thermodynamic considerations. Under the Eh conditions defined, Se(-II) is the stable form, albeit the

46
anionic HSe- species (Se solubility data sheet in Appendix A2). Solubility control is exerted by the very insoluble FeSe2 according to the Andra/Thermochimie database. This is also supported by experimental findings of Cui et al. (2009). However, the possibility of formation of more soluble, less crystalline FeSex or Se(0) species cannot be ruled out, as suggested from the experimental study of Iida et al. (2007). The solubility is strongly dependent on Eh conditions, as for example highlighted by Berner (2002). From the span in Eh provided by the defined bounding waters, thus a large range in solubilities is obtained (Table 4-12).
Solubilities inside the canister:
Uncertainties and recommended values:
The formal uncertainty is calculated from the uncertainty of the equilibrium constant and the formation constant of the aqueous species HSe-. The resulting uncertainty is relatively high with 2.77 log-units which arise mainly from the uncertainty in formation constant of FeSe2. Assuming Se(0) as solubility controlling phase leads to solubilities in the same range as those for FeSe2 when the formal uncertainty is added. Reference values: 5.810-10 M for saline water and 5.910-11 M for brackish water. Upper limit: The highest solubility of (2.010-7) is obtained for the highly alkaline water because of the rather high Eh of this water. A similar solubility for the saline reference water is obtained if the formal uncertainty (2.77 log-units) is added, a value of 3.410-7 M is obtained. We propose this value as upper limit.
Solubilities at the bentonite/host rock interface: Uncertainties and recommended values:
The calculated solubilities for the groundwaters are rather similar (Table 4-12). Because of the slight difference in pH and Eh relative to the canister waters, somewhat different solubilities result. Reference values: 1.710-9 M for saline groundwater and 4.910-10 M for brackish groundwater. Upper limit: Applying the same procedure as for the canister waters leads to an upper limit of 1.010-6 M.

47
Table 4-12. Solubilities of selenium (Se) for canister- and groundwaters with the associated formal uncertainties. Speciation data and uncertainties of single phases and species are provided in the Se solubility data sheet in Appendix A2.
4.2.6 Tin (Sn)
Tin occurs in the tetravalent oxidation state under the redox conditions of interest. Sn(OH)4 and Sn(OH)5
- are the most abundant aqueous complexes. In the high alkaline waters, Sn(OH)6
2- becomes more important than Sn(OH)4. The amorphous oxide SnO2(am) is selected as the solubility controlling solid based on the Andra/ Thermochimie database.
Solubilities inside the canister: Uncertainties and recommended values:
The formal uncertainty is calculated from the uncertainty of the equilibrium constant and the formation constant of the most abundant aqueous species. This uncertainty is relatively small compared to the range of geochemical uncertainties found for the bounding waters, and is therefore neglected for the derivation of the upper limit. The highest solubility is found for the high alkaline waters in which the negatively charged Sn(OH)5
- is the dominant species (Table 4-13). Reference values: 1.110-7 M for saline water and 6.310-8 M for brackish water.
Upper limit: The highest solubility of 1.310-5 M is obtained for the high alkaline water which is selected as upper limit.
Solubilities at the bentonite/host rock interface: Uncertainties and recommended values:
The calculated solubilities for most groundwaters are slightly lower (Table 4-13) than those of the canister waters because of lower pH in corresponding groundwaters. For the alkaline waters, the calculated solubilities are almost the same.

48
Reference values: 5.910-8 M for saline groundwater and 5.710-8 M for brackish groundwater. Upper limit: 1.310-5 M obtained from the high alkaline water.
Table 4-13. Solubilities of tin (Sn) for canister- and groundwaters with the associated formal uncertainties. Speciation data and uncertainties of single phases and species are provided in the Sn solubility data sheet in Appendix A2.
4.2.7 Beryllium (Be)
No thermodynamic data for Be are given in the Andra Thermochimie v7b (Andra 2009) database nor in the Nagra/PSI database. Beryllium thermodynamic data were therefore taken from the Minteq v.4 database and implemented in the Andra Thermochimie v.7b database. The implementation of the Be data in the Thermochimie v7b database rather than the direct application of the Minteq v4 database assured the consistency of the modelled waters with all other performed calculations. According to the Minteq v4 thermodynamic data, the Be-hydroxide Be(OH)2 (beta) is the least soluble mineral under all canister-, pore- and groundwater conditions. However, kinetic considerations with regard to the precipitation of the solid must be accounted for as well. Therefore, we conservatively selected the more soluble X-ray amorphous hydroxide Be(OH)2(am) as solubility limiting phase instead of the crystalline alpha and beta form. Speciation and solubility of Be under in-situ conditions are controlled by pH via the hydrolysis of Be. Complexation of Be by F-, Cl-, CO3
2- or SO42- only plays a
subordinate role, with the exception of the brine waters, were BeF+ complexes contribute up to 15 % (bentonite/rock interface water) to the total Be in solution.

49
Solubilities inside the canister: Uncertainties and recommended values:
For Be, no logK uncertainties for the solid phases and aqueous species are available. Thus no formal thermodynamic uncertainty could be calculated. However, speciation and solubility of Be under in-situ conditions are controlled by pH. The large range in pH described by the reference and bounding waters results in a geochemical uncertainty, which presumably exceeds the formal thermodynamic uncertainty. In combination with the conservatively selected solubility limiting phase we therefore deem it justified to base the upper solubility limit on the geochemical uncertainty alone. The highest solubility obtained for the six reference and bounding waters is consequently recommended as upper limit. Reference values: 1.410-6 M for saline water and 4.410-6 M for brackish water. Upper limit: The highest solubility of 4.4 106 M is obtained for the brackish water which is selected as upper limit.
Solubilities at the bentonite/host rock interface: Uncertainties and recommended values:
Following the same discussion as for the canister water, the highest solubility obtained for all six waters is recommended as upper solubility limit. Reference values: 6.310-6 M for saline groundwater and 7.110-6 M for brackish groundwater. Upper limit: 7.410-6 M obtained from the brine water.
Table 4-14. Solubilities of beryllium (Be) for canister- and groundwaters.

50
4.2.8 Iodine (I)
Within the radionuclide waste, iodine is present as the anion I-. Salts of I- with e.g. Ca, Mg or K are highly soluble and the solubility of I has therefore to be regarded as unlimited for all reference and boundary canister- and groundwaters. No I- solubility data sheet is provided.
4.2.9 Chlorine (Cl)
Natural occurring chloride (Cl-) is the dominant anion in all reference and bounding waters. The release of radiogenic Cl will therefore be negligible in comparison with the natural Cl concentrations. The solubility of Cl in all reference and bounding waters has to be regarded as unlimited. No Cl solubility data sheet is provided.
4.3 Solubilities of the transition metals
4.3.1 Zirconium (Zr)
Under the studied system, zirconium remains in the tetravalent state. According to the Andra/Thermochimie database, the solubility can potentially be controlled by the x-ray amorphous phases Zr(OH)4(am, aged) or Zr(OH)4(am, fresh), or by the crystalline phase ZrO2. As assumed in a general fashion, the solubility control by the amorphous phase is conservatively favoured. Here we select Zr(OH)4(am, aged) as solubility controlling phase because calculations with Zr(OH)4(am, fresh) yield unrealistically high zirconium concentrations of about 10-4 M. Based on the speciation calculations with the Andra/ Thermochimie database, Zr(OH)4(aq) is the only relevant aqueous complex for Zr under the considered conditions. The formation of Zr-carbonate complexes only influences solubility at HCO3-concentrations above 5 mM, as shown in the experiments at pH 9 of Pouchon et al. (2001). Recent findings on the effect of Ca on the solubility of Zr demonstrated that Ca interacts with the Zr(OH)6
2- octahedron, and therefore only influences Zr solubility at pH > 10 (Altmaier et al. 2008). No extra Zr solubility data sheet is provided in the Appendix.
Solubilities inside the canister: Uncertainties and recommended values:
The logK uncertainty of the formation of Zr(OH)4(aq) is rather large (1.7). Together with the uncertainty of the solubility constant of the solid phase an uncertainty of 1.71 logK units ((1.72+0.22)1/2 = 1.71) is calculated. All waters show very similar solubilities (Table 4-15). Reference values: 1.710-8 M for saline water and 1.810-8 M for brackish water. Upper limit: Adding to the highest solubility value (1.810-8 M) the formal uncertainty of 1.7 log-units results in an upper limit of 9.210-7 M.
51
Solubilities at the bentonite/host rock interface: Uncertainties and recommended values:
The solubilities are very similar between the corresponding porewaters and groundwaters (Table 4-15). The differences in pH and Eh do not influence the zirconium solubility. Reference values: 1.710-8 M for saline water and 1.810-8 M for brackish water. Upper limit: Adding to the highest solubility value (1.810-8 M) the formal uncertainty of 1.7 log-units results an upper limit of 9.210-7 M.
Table 4-15. Solubilities of zirconium (Zr) for canister- and groundwaters with the associated formal uncertainties. No extra Zr solubility data sheet is provided.
4.3.2 Nickel (Ni)
Nickel occurs in the divalent oxidation state under the conditions of interest. As a mineral formed at high temperatures, the mineral gaspeite (NiCO3(s)) is not considered as solubility controlling phase. Under the considered conditions, the solubility controlling phase is Ni(OH)2(s) based on the Andra/Thermochimie database. For pH values in the range of 7-8 the free Ni2+ is the dominant aqueous species. At higher pH values the nickel hydroxide Ni(OH)2 becomes the most abundant aqueous complex.
Solubilities inside the canister: Uncertainties and recommended values:
The formal thermodynamic uncertainty is low compared to the geochemical uncertainty reflected in the different water compositions (Table 4-16) and is therefore neglected in the determination of the upper limit.

52
Reference values: 9.310-5 M for saline water and 8.310-4 M for brackish water. Upper limit: The brackish water displays the highest solubility value of 8.310-4 M and is proposed as upper limit.
Solubilities at the bentonite/host rock interface: Uncertainties and recommended values:
The solubilities for the high alkaline and the glacial melt water are very similar to those of the canister waters (Table 4-16). For all other groundwaters, the lower pH compared to the canister water reduces the stability of the solubility controlling phase Ni(OH)2(s). Therefore, the calculated solubilities are higher in the groundwaters. Reference values: 1.510-3 M for saline groundwater and unlimited (2.110-3 M) for brackish groundwater. Upper limit: The highest value is obtained for the brackish reference water (2.110-3 M). We recommend the upper solubility value to be unlimited.
Table 4-16. Solubilities of nickel (Ni) for canister- and groundwaters with the associated formal uncertainties. Speciation data and uncertainties of single phases and species are provided in the Ni solubility data sheet in Appendix A2.
4.3.3 Niobium (Nb)
Niobium in natural waters is only present in the pentavalent oxidation state. The solubility of niobium is controlled by Nb2O5(s) according to the Andra/Thermochimie database. The solubility of the solid phase depends on pH, thus showing larger solubilities at higher pH. The thermodynamic data in the Andra/Thermochimie database is derived from solubility and hydrolysis data of Peiffert et al. (1997, unpublished Andra report). This work has recently been published (Peiffert et al. 2010). According to these

53
data, the main aqueous species is Nb(OH)6- at near-neutral pH conditions. For the high
alkaline waters, Nb(OH)72-(aq) dominates over Nb(OH)6
-(aq) (Nb solubility data sheet in Appendix A2). The speciation with the Nagra/PSI database is also presented in the Nb solubility data sheet. This highlights significant differences in solubilities obtained with the two databases. The reason lies in the different solubility constant for Nb2O5(s): logK -28.38 (Andra db) and logK -24.34 (Nagra/PSI db) and the complexation constant for Nb(OH)5: log K: 5.08 (Andra); 7.344 (Nagra/PSI). In the latter database, "standard" NBS thermodynamic data for Nb are included (Wagman et al. 1982). At high pH, Ca-niobate may limit solubilities, as shown by Talerico et al. (2004). These authors applied experimental data for the derivation of an empirical relationship between Nb solubilities Ca concentrations and pH.
Solubilities inside the canister: The solubilities for the different waters based on the Andra/Thermochimie database are presented in Table 4-17 which highlights the strongly increased solubilities for the two high pH bounding waters. Uncertainties and recommended values: The logK uncertainty of the aqueous species Nb(OH)6
-(aq) is not available. Due to this lack of information, the strong pH dependence of the solubility and the uncertainty with regard to the crystallinity of Nb2O5(s) we propose to consider the high solubility obtained for the alkaline bounding water as upper limit (Table 4-17). On the other hand, the precipitation of Ca-niobate may limit Nb concentration at high pH, as indicated by the study of Talerico et al. (2004). Due to the rather preliminary nature of the underlying data, we conservatively do not account for the potential precipitation of Ca-niobate. Reference values: 9.510-7 M for saline water and 1.910-7 M for brackish water. Upper limit: Based on the high solubilities in the alkaline bounding waters, we propose to assume the solubility to be unlimited.
Solubilities at the bentonite/host rock interface: Uncertainties and recommended values:
The species distribution for the different groundwaters is equal compared to the bentonite porewaters. Excluding the high alkaline and the glacial melt water, the solubilities in the groundwaters are lower than in the bentonite porewaters because of their lower pH values. Reference values: 1.510-7 M for saline water and 1.210-7 M for brackish water. Upper limit: Based on the same argument as for canister waters we propose the solubility to be unlimited.

54
Table 4-17. Solubilities of niobium (Nb) for canister- and groundwater. Calculation of the formal uncertainty was limited to the high alkaline and glacial melt water, because for the other waters, no uncertainty of the dominant solution species was available. Speciation data and uncertainties of single phases and species are provided in the Nb solubility data sheet in Appendix A2.
4.3.4 Molybdenum (Mo)
The solubility of molybdenum is dependent on the pH and the redox potential of the water. Under Eh conditions of interest the hexavalent state predominates in solution, but at lower redox conditions the contribution of the pentavalent species increases. Despite the hexavalent state in solution, the solubility of molybdenum at near-neutral pH is controlled by MoO2(s), according to the Andra/Thermochimie database. Above a pH of 8.6, however, the hexavalent CaMoO4(s) is the solubility controlling solid. A comparison with the Nagra/PSI database shows similar solubility values except for the high pH waters (glacial melt water and high alkaline water) (Table 4-18). The reason for this discrepancy lies in the lacking CaMoO4(s) solid phase in the Nagra/PSI database. Hence, MoO2(s) is the solubility controlling phase for all waters in that database.
Solubilities inside the canister: Uncertainties and recommended values:
From the thermodynamic data the formal uncertainty cannot be calculated because no logK uncertainty for the formation of the aqueous complex is reported. But, as stated above, the strong dependency of pH and Eh on the solubility makes quantitative estimates of uncertainty difficult. Moreover, at higher pH conditions, the solubility is

55
very sensitive to the calcium concentrations. The solubility calculations presented in Table 4-18 were made under the assumption of calcite equilibrium. Reference values: 3.110-6 M for saline water and 2.410-6 M for brackish water. Upper limit: Unlimited due to the strong pH and Eh dependency.
Solubilities at the bentonite/host rock interface: Uncertainties and recommended values:
For all groundwaters, the solubility is somewhat lower (Table 4-18) compared to the solubilities in the bentonite porewaters, which is principally due to the lower pH values in the groundwaters. Reference values: 8.810-9 M for saline water and 2.310-8 M for brackish water. Upper limit: Unlimited due to the strong pH and Eh dependency.
Table 4-18. Solubilities of molybdenum (Mo) for canister- and groundwaters. No formal uncertainty is calculated due to missing thermodynamic uncertainty data of the dominant solution species Mo(VI)O4
2-. Speciation data, solution limiting phases and their thermodynamic data are provided in the Mo solubility data sheet in Appendix A2.
4.3.5 Technetium (Tc)
Technetium is a redox sensitive element with prevailing oxidation states of +VII and +IV in natural waters. Under reducing conditions, the tetravalent state is thermodynamically stable and its solubility is controlled by insoluble Tc(IV) hydroxides. On the other hand, Tc(VII) forms soluble anionic complexes and is highly mobile. The reduction of Tc(VII) in the presence of reduced iron (e.g. magnetite) is

56
rapid, as has been experimentally shown (Cui & Eriksen 1996; Lee & Bondietti 1983). Thus, the assumption of rapid reduction of Tc(VII) possibly released by the fuel via radiolysis to Tc(IV) is deemed justified. Calculations with Andra/Thermochimie database indicate the hydrous technetium dioxide TcO2:1.63H2O(s) as solubility controlling phase. The aqueous speciation is dominated by TcO(OH)2(aq). For the glacial meltwater, which displays the least reducing conditions of all waters, the oxidised species TcO4
- makes up a minor fraction of the aqueous speciation (Tc solubility data sheet in Appendix A2).
Solubilities inside the canister: Uncertainties and recommended values:
The uncertainty for the most important equilibrium TcO2:1.63H2O(s) ↔ TcO(OH)2(aq) + 0.63 H2O is reported with 0.5 logK units. Based on the minor contribution of other species, their uncertainties can be neglected. Reference values: 3.710-9 M for saline water and 3.910-9 M for brackish water. Upper limit: Adding the formal uncertainty (0.5 logK units) to the highest solubility value (high alkaline water) results in an upper limit of 1.510-8 M.
Solubilities at the bentonite/host rock interface: Uncertainties and recommended values:
The solubilities from the canister waters and the bentonite/host rock interface (Table 4-19) water are very similar. Reference values: 3.810-9 M for saline water and 3.910-9 M for brackish water. Upper limit: Adding the formal uncertainty (0.5 logK units) to the highest solubility value (high alkaline water and glacial melt water) yields an upper limit of 1.510-8 M.

57
Table 4-19. Solubilities of technetium (Tc) for canister- and groundwaters. The formal uncertainty is given as 0.5 logK (see text). Speciation data and individual thermodynamic uncertainties are provided in the Tc solubility data sheet in Appendix A2.
4.3.6 Palladium (Pd)
According to thermodynamic predictions metallic palladium is the most insoluble form (Berner 2002). The formation of this phase however may be kinetically restricted. In this case, Pd(II) oxide or hydroxide will form. Here we conservatively assume the formation of the more soluble hydrated phase Pd(OH)2(s) over the oxide PdO2(s). The divalent redox state is the only stable form under the conditions of interest. The main species is Pd(OH)2(aq) except for high ionic strengths, where according to the standard Andra/Thermochimie database, the PdCl4
2-(aq) complex becomes important (Pd solubility data sheet in Appendix A2).
Solubilities inside the canister: Uncertainties and recommended values:
The formal uncertainties from logK data cannot be calculated because of incomplete data. The estimated uncertainty for the solubility of Pd(OH)2 has been reported to be in the order of 0.5 log-units (Hummel et al. 2002, Berner 2002) (Pd solubility data sheet). Reference values: 3.710-6 M for saline water and 3.910-6 M for brackish water. Upper limit: From the estimated uncertainty of 0.5 log-units for the solubility constant of Pd(OH)2, we propose 1.210-5 M as upper limit. Solubilities at the bentonite/host rock interface: Uncertainties and recommended values:
For all waters except the brine, the solubilities are very similar (Table 4-20) compared to the canister waters. Reference values: 3.910-6 M for saline water and 3.910-6 M for brackish water.

58
Upper limit: We propose the solubility value of the brine water, 8.510-5 M as upper limit. No formal uncertainty is added due to the high solubility under these extreme geochemical conditions.
Table 4-20. Solubilities of palladium (Pd) for canister- and groundwaters. No formal uncertainty is calculated due to missing thermodynamic uncertainty data of the dominant solution species. Speciation data and available thermodynamic uncertainties are provided in the Pd solubility data sheet in Appendix A2.
4.3.7 Silver (Ag)
The solubility of silver is likely controlled by the precipitation of AgCl(cr) according to the Andra/Thermochimie database if the precipitation of AgS is not accounted for. The latter phase would result in a much lower solubility. Because of the uncertainties in the actual sulphide contents and the well-established solubility of AgCl, we conservatively ignore the possibility of AgS formation. The formation of metallic silver is difficult to defend due to slow kinetics. For the considered system, silver is only present in the monovalent oxidation state. The aqueous speciation is dominated by chloride complexes, except in the glacial melt water, where the Ag+ is the dominant species (Ag solubility data sheet in Appendix A2).
Solubilities inside the canister: Uncertainties and recommended values:
The thermodynamic uncertainty about the AgCl(s) solubility product is very small and the solubility of AgCl is well known from the Ag/AgCl electrode. The variations in ionic strength in the different waters are more relevant in terms of uncertainty. The highest solubility occurs in the brine water because of the formation of chloride complexes. The obtained value however is probably too high and results from the ionic strength extrapolation method. Nevertheless, it is proposed as upper limit. Reference values: 9.910-6 M for saline water and 5.110-6 M for brackish water. Upper limit: 2.510-4 M taken from solubility value for the brine canister water.

59
Solubilities at the bentonite/host rock interface: Uncertainties and recommended values:
Solubilities in the groundwaters are very similar (Table 4-21) as those obtained for the canister waters. Reference values: 1.010-5 M for saline water and 5.210-6 M for brackish water. Upper limit: 2.510-4 M solubility value from the bentonite/host rock interface brine water.
Table 4-21. Solubilities of silver (Ag) for canister- and groundwaters. No formal uncertainty is calculated due to missing thermodynamic uncertainty data of the dominant Ag-chloro solution species. Speciation data and available thermodynamic uncertainties are provided in the Ag solubility data sheet in Appendix A2.
4.4 Solubilities of the lanthanides
4.4.1 Samarium (Sm)
Samarium is not redox sensitive and occurs in the trivalent oxidation state. The solubility mainly depends on the pH value, carbonate, silicate and chloride concentrations. In carbonate rich waters Sm(CO3)
+(aq) is the dominant aqueous complex (Sm solubility data sheet in Appendix A2). For high alkaline waters, samarium hydroxides become more important. Light lanthanides (La to Eu) form mixed hydroxocarbonate solids (Spahiu & Bruno 1995). Based on the Andra/Thermochimie database, solubility of samarium is controlled by SmOHCO3(cr). For conservative reasons the more amorphous form SmOHCO3:0.5H2O is chosen as solubility controlling solid phase.
Solubilities inside the canister: Uncertainties and recommended values:
The formal thermodynamic uncertainty is calculated from the reported individual uncertainties of the solubility constant and the main aqueous complex.

60
Reference values: 6.110-8 M for saline water and 3.610-7 M for brackish water. Upper limit: The highest solubility is obtained for the brine water. Adding the formal uncertainty (0.7 log-units) results in 1.210-5 M which is recommended as upper limit.
Solubilities at the bentonite/host rock interface: Uncertainties and recommended values:
The saline, brackish, dilute, carbonate rich, and brine groundwaters have a higher solubility than the canister waters as a result of their higher bicarbonate concentration.
Reference values: 6.410-7 M for saline water and 5.310-7 M for brackish water.
Upper limit: The highest solubility is obtained for the brine water (4.210-6 M). Adding the formal uncertainty (0.7 log-units) results in 2.110-5 M which is recommended as upper limit.
Table 4-22. Solubilities of samarium (Sm) for canister- and groundwaters with the corresponding formal uncertainties. Speciation data and uncertainties of single phases and species are provided in the Sm solubility data sheet in Appendix A2.
4.4.2 Europium (Eu)
Europium occurs mainly in the trivalent oxidation state and to a minor extent in the divalent state. The dependence from the different system parameters and the solubility limiting phase is equal to that of samarium.
Solubilities inside the canister: Uncertainties and recommended values:
The formal thermodynamic uncertainty is calculated from the reported individual uncertainties of the solubility constant and the main aqueous complex (Eu solubility data sheet in Appendix A2, Table 4-23).

61
Reference values: 5.410-8 M for saline water and 1.310-7 M for brackish water. Upper limit: The highest solubility is obtained for the brine water (8.110-7 M). Adding the formal uncertainty (1.2 log-units) results in 1.310-5 M which is recommended as upper limit.
Solubilities at the bentonite/host rock interface: Uncertainties and recommended values:
Compared with the canister waters, the solubility is similar for the groundwaters (Table 4-23). Reference values: 2.310-7 M for saline water and 2.010-7 M for brackish water. Upper limit: The highest solubility is obtained for the brine water (1.510-6 M). Adding the formal uncertainty (1.2 log-units) results in 2.310-5 M which is recommended as upper limit.
Table 4-23. Solubilities of europium (Eu) for canister- and groundwaters with the corresponding formal uncertainties. Speciation data and uncertainties of single phases and species are provided in the Eu solubility data sheet in Appendix A2.
4.5 Solubilities in the bentonite porewater The solubility limits assessed in the last section refer to the waters inside a defective canister and in the groundwaters adjacent to the bentonite buffer. These waters are considered to be "free", thus not in direct contact with the clay. In the bentonite buffer, where the porewater is intimately associated with the clay particles, the definition of the porewater composition is not straightforward and depends on the model concept. As outlined in detail in Appendix C, the bentonite porewater applied here is based on a multiporosity concept including interlayer, diffuse double layer and "free" porewater.

62
The composition (presented in Table 6-1) is similar to the canister water, but according to model assumptions presented in Appendix C it has a higher ionic strength and is not in equilibrium with corrosion products. The redox conditions therein are assumed to be controlled by those in the surrounding groundwater. In the following the derived solubilities in the "free" bentonite porewater for the different groups of radionuclides are shown. The same procedure as for the canister waters and groundwaters has been adopted. Therefore, no further explanations unless necessary are given.
4.5.1 Actinides
Thorium: Reference values: 3.610-9 M for saline water and for brackish water. Upper limit: Adding the formal uncertainty to the dilute, carbonate rich water yields 7.510-8 M. Protactinium: As discussed in previous section, a conservative selection is made in view of uncertain data: Reference values: 110-8 M for saline water and for brackish water. Upper limit: 110-6 M. Uranium: Reference values: 3.510-9 M for saline water and 3.7 10-9 M for brackish water. Upper limit: Adding the formal uncertainty to the water with the highest solubility, the carbonate rich water yields a value of 1.510-7 M. Neptunium: Reference values: 9.110-10 M for saline water and 1.0 10-9 M for brackish water. Upper limit: Adding the formal uncertainty to the solubility of the carbonate rich bounding water yields a value of 2.1 10-8 M. Plutonium: Reference values: 8.4 10-10 M for saline water and 5.7 10-9 M for brackish water. Upper limit: Taking the highest solubility obtained for the brackish water and accounting for its formal uncertainty yields 9.910-8 M. Americium/Curium: Reference values: 4.910-7 M for saline water and 6.3 10-6 M for brackish water. Upper limit: This is taken from the highest solubility derived for the brine water and yields 9.2 10-6 M.

63
Table 4-24. Solubilities of actinides for "free" bentonite porewaters with the corresponding formal uncertainties. Speciation data of single phases and species are provided in the sorption data sheets in Appendix B2.
* These data for Pa only have informative character. As reference and upper limit a conservative selection was applied (see text)
4.5.2 Groups IA to VIIA
Carbon: The solubility of organic carbon is taken to be unlimited. For inorganic carbon solubility is fixed by the porewater composition which is in equilibrium with calcite. Reference values: 9.310-4 M for saline water and 9.010-4 M for brackish water. Upper limit: A high dissolved carbonate concentration occurs in the carbonate rich water, thus the upper limit is assumed to be unlimited. Radium: As with the other waters, equilibrium with a Ba-Ra sulphate solid solution is assumed for defining solubilities for reference values: Reference values: 1.410-11 M for saline water and 5.710-11 M for brackish water. Upper limit: Due to conceptual uncertainties related to the solid solution with barium, the unlimited solubility of pure RaSO4 for the worst case (brine water) is taken as upper limit.

64
Caesium: Due to the high solubility of Cs, this element is assumed to be unlimited for all cases. Strontium: Reference values: 1.010-3 M for saline water and 6.710-4 M for brackish water. Upper limit: Considering the high solubility of the brine water, we propose the upper limit to be unlimited. Selenium: Reference values: 1.410-9 M for saline water and 4.310-10 M for brackish water. Upper limit: The highest solubility obtained (1.510-8 M) is considerably lower than the corresponding one for the canister water. This is due to the lower redox conditions defined in the bentonite porewater (constrained by methane/carbonate equilibrium). Because of uncertainties in the redox potential we add the (large) formal uncertainty to the reference value which yields a value of 8.110-7 M, which we propose as upper limit. Tin: Reference values: 8.410-8 M for saline water and 5.910-8 M for brackish water. Upper limit: We propose 1.210-5 M obtained for the high alkaline water as upper limit. Beryllium: Reference values: 1.910-6 M for saline water and 6.010-6 M for brackish water. Upper limit: We propose 6.010-6 M obtained for the brackish water as upper limit. Iodine: The solubility is assumed to be unlimited for all cases. Chlorine: The solubility is assumed to be unlimited for all cases.

65
Table 4-25. Solubilities of elements from groups IA to VIIa for "free" bentonite porewaters with the corresponding formal uncertainties. Speciation data of single phases and species are provided in the sorption data sheets in Appendix B2.
4.5.3 Transition metals
Zirconium: Reference values: 1.510-8 M for saline water and 1.710-8 M for brackish water. Upper limit: Adding to the highest solubility value (1.810-8 M), the formal uncertainty of 1.7 log-units results an upper limit of 9.210-7 M.

66
Nickel: Reference values: 1.910-4 M for saline water and 1.510-3 M for brackish water Upper limit: The highest value of 1.510-3 M obtained from the brackish water is taken as upper limit. Niobium: Reference values: 6.110-7 M for saline water and 1.510-7 M for brackish water. Upper limit: Because of high solubilities in alkaline waters we propose this value to be unlimited. Molybdenum: Reference values: 3.310-7 M for saline water and 3.710-8 M for brackish water. Upper limit: Unlimited due to strong Eh and pH dependency. Technetium: Reference values: 3.410-9 M for saline water and 3.810-9 M for brackish water. Upper limit: Adding the formal uncertainty to the highest value (alkaline water) yields a value of 1.410-8 M. Palladium: Reference values: 3.410-6 M for saline water and 3.910-6 M for brackish water. Upper limit: The high ionic strength for the brine (free) porewater generates a solubility of 1.510-4 M which is probably too high and induced by the crude ionic strength correction procedure and the high fraction of chloride. Nevertheless, this value is taken as upper limit. Silver: Reference values: 3.010-5 M for saline water and 1.4 10-5 M for brackish water. Upper limit: As for Pd, the high ionic strength for the brine (free) porewater generates a solubility of 3.310-4 M which is probably too high. Nevertheless, this value is taken as upper limit.

67
Table 4-26. Solubilities of transition elements for "free" bentonite porewaters with the corresponding formal uncertainties. Speciation data of single phases and species are provided in the sorption data sheets in Appendix B2.
4.5.4 Lanthanides
Samarium: Reference values: 1.710-7 M for saline water and 6.310-7 M for brackish water. Upper limit: The highest value is obtained for the high alkaline water. Adding the formal uncertainty results in 2.110-5 M as upper limit. Europium: Reference values: 6.210-8 M for saline water and 2.310-7 M for brackish water. Upper limit: The highest value is obtained for the high alkaline water. Adding the formal uncertainty results in 2.910-5 M as upper limit.
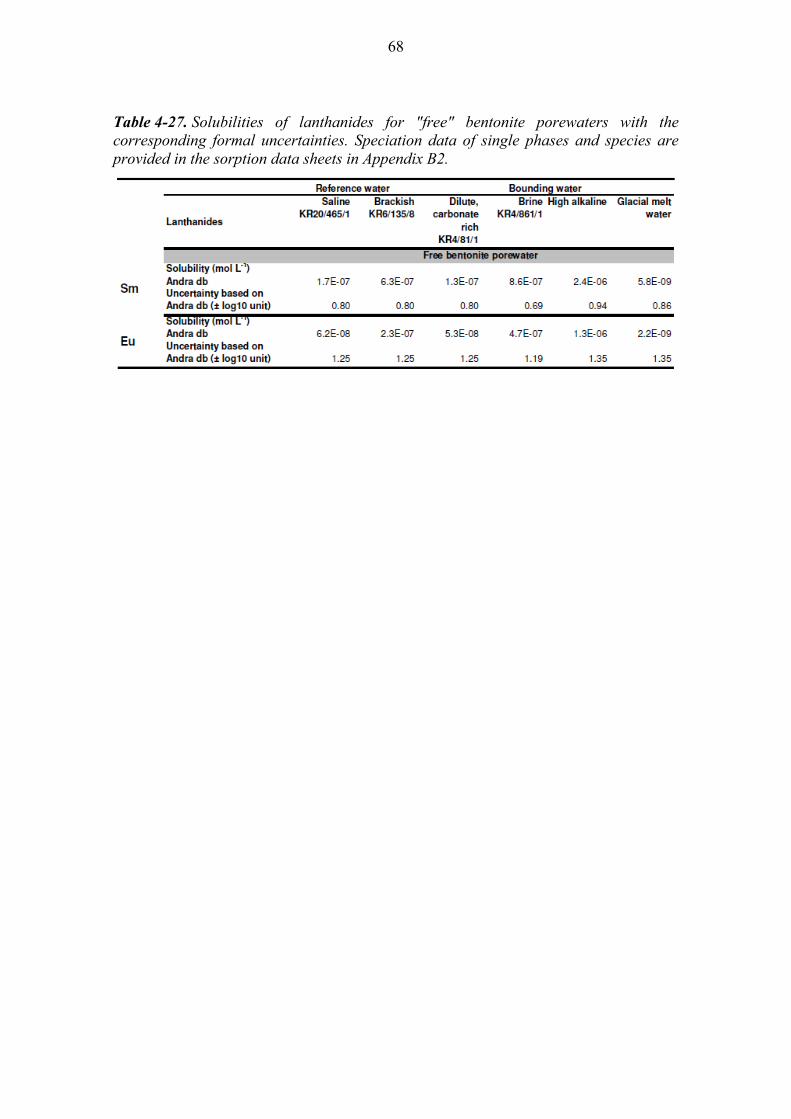
68
Table 4-27. Solubilities of lanthanides for "free" bentonite porewaters with the corresponding formal uncertainties. Speciation data of single phases and species are provided in the sorption data sheets in Appendix B2.

69
5 DISCUSSION OF SOLUBILITY DATA
5.1 Comparison with previous assessment In Table 5-1 solubility data derived here are compared with those presented in the previous assessment by Grivé et al. (2008). For the comparison, the solubilities for three similar groundwaters were selected:
1) saline groundwater - both assessments from KR20/465/1 2) dilute brackish (carbonate rich) groundwater - this study from KR4/81/1, Grivé
et al. (2008) from KR6/58/1 3) brine groundwater - this study from KR4/861/1, Grivé et al. (2008) from
KR12/741/1
In general, the agreement between the two solubility data sets is good. This is explained by the very similar thermodynamic data used. In fact, the Andra/Thermochimie database is built to a large extent on the same thermodynamic data as the Nagra/PSI database including for example those from the NEA-TDB project. It is being co-developed by the same team at Amphos 21 in Barcelona. The agreement also contributes to the confidence in the thermodynamic calculation procedure. The main differences evident from Table 5-1 (deviations of more than one order of magnitude) are highlighted in yellow or in orange, depending on which assessment yields higher values, and can be summarised as follows: Different solubility-limiting solid: For trivalent actinides and lanthanides (Am, Cm, Pu, Sm), Grivé et al. (2008) assumed insoluble phosphates as solubility limiting, whereas here the hydroxide or hydrous carbonate phases were selected. Because of the uncertainty in phosphate measurements and the uncertainty of the behaviour of this ligand under site-specific conditions, precipitation with phosphate is conservatively ignored here. Different Eh conditions: For redox sensitive actinides (U, Pu), higher solubilities for the dilute brackish groundwater were derived by Grivé et al. (2008) which are explained by the higher Eh (-55 mV) and larger U(VI) contribution of this water relative to that used here (-224 mV). The differences in the solubilities of the highly redox sensitive Mo and Se are also explained by the differences in Eh. Radium: The large differences in solubilities arise from the different treatments (solid solution vs. pure phase). The trends between waters are however similar and largely explained by differences in sulphate content. Other differences: For Pa, a different treatment leads to different solubilities. Because of the not very reliable thermodynamic data, we estimate solubilities from scarce experimental data, as proposed by Berner (2002). For Ni, much higher solubilities are derived here for the brine water compared to Grivé et al. (2008), which is explained by the lower pH of this groundwater (7.18 vs. 8.2).

70
Table 5-1. Radionuclide solubilities (mol L-1) proposed in this work and in Grivé et al. (2008) for selected groundwaters. Differences larger than one order of magnitude marked in yellow (this work yields lower values) and in orange (this work yields higher values). unlim. in this work refers to values > 2·10-3 mol L-1.
Element this work Grivé Table B-1
this work Grivé Table B-1
this work Grivé Table B-1
Comments
saline gw KR20/465/1
saline gw KR20/465/1
dilute gwKR4/81/1
dilute gw KR6/58/1
brine gw KR4/861/1
brine gw KR12/741/1
Cm, Am 1.1e-05 1.7E-07 2.3e-06 3.2E-09 6.8e-05 1.2E-08 Grivé: AmPO4 solid
Pu 7.4e-09 8.0E-09 5.8e-09 1.5E-10 3.4e-08 2.3E-10 difference in Eh for
dilute water; PuPO4 for brine
Np 1.0e-09 8.0e-10 1.3e-09 1.2e-09 7.0e-10 5.7E-10
U 3.3e-09 7.0e-10 2.0e-08 2.7e-07 1.2e-09 5.2e-10 difference in Eh
Pa 1.0e-08 3.0e-07 1.0e-08 3.1e-07 1.0e-08 2.4e-07 different data assessment
Th 3.3e-09 1.0e-09 2.0e-08 6.9e-09 1.2e-09 7.5e-11
Ra 1.7e-09 3.2e-06 7.7e-11 1.1e-07 2.4e-08 3.0e-05 solid solution vs.
pure phase treatment
Eu 2.3E-07 7.5E-08 1.5E-06
Sm 6.4E-07 9.3e-09 1.8E-07 9.2e-10 4.2E-06 1.2e-10 Grivé: SmPO4 solid
lower salinity for brine gw
Cs unlim. unlim. unlim. unlim. unlim.
I unlim. unlim. unlim.
Be 6.3E-06 3.0E-06 7.4E-6
Sn 5.9e-08 9.6E-08 6.9e-08 1.1E-07 3.9e-08 1.5E-07
Ag 1.0e-05 6.9e-07 2.5e-04
Pd 3.9e-06 2.6e-06 4.0e-06 2.7e-06 8.5e-05 2.4e-06
Tc 3.8e-09 4.0e-09 4.0e-09 5.0e-09 2.7e-09 4.1e-09
Mo 8.8e-09 7.9e-09 5.2e-08 1.9e-05 1.1e-11 1.3e-08 difference in Eh
Nb 1.5e-07 3.9e-05 2.4e-07 4.6e-05 9.7e-08 2.0e-04 difference in speciation
Zr 1.7e-08 1.7e-08 1.8e-08 1.8e-08 1.2e-08 1.4e-08
Sr unlim. 5.9e-3 1.8e-04 3.1e-4 unlim. 1.6e-02
Se 1.7e-09 6.0e-10 4.7e-10 6.6e-14 1.2e-08 6.3e-09 difference in Eh
Ni 1.5e-03 2.0e-03 2.3e-04 4.4e-04 1.4e-03 4.4e-05 Grivé: higher pH
Cl unlim. unlim. unlim.
Cinorg 7.7e-04 unlim. 1.1e-04
5.2 General uncertainties and concluding remarks The derivation of RN solubilities for Olkiluoto waters was based on well established principles of chemical equilibrium thermodynamics and the Andra/Thermochimie database which is developed within Andra's programme. This database relies on well accepted data from the NEA-TDB project and other sources. A similar database was also applied in Posiva's last assessment exercise in 2007 (Grivé et al. 2008). The reliability of the database is supported by comparing the results with those obtained

71
from the Nagra/PSI database. The previous assessment of solubilities by Grivé et al. (2008) is largely based on the latter database. A major uncertainty related to the thermodynamic approach refers to the nature of the solubility limiting solid. This poorly constrained uncertainty was taken into account for many RN by conservatively considering kinetically favoured less crystalline hydroxide solids. More experimental data are required for the solubility controlling solid of Pa to reduce the large uncertainty associated with the Pa solubility data. Also, the possibility of solid solution formation was neglected in view of large inherent uncertainties in applying this approach to the EBS system. An exception is Ra, where sufficient experimental and natural analogue evidence is available to support its coprecipitation and solid solution formation with Ba sulphate. Future experimental work on solid solution formation would be desirable and might offer the possibility to reduce the best estimates for RN solubilities. A further important thermodynamic uncertainty regards the carbonate complexes for actinides and lanthanides. This is reflected - at least partly - in the rather large uncertainties associated with the formation constants of these complexes, and this has been accounted for in the uncertainty treatment. An uncertainty not accounted for in the database is the recently published stability of ternary Ca and (to a lesser extent) Mg uranyl carbonate complexes, whose inclusion would lead to much higher and, in case of carbonate rich waters, to unrealistic uranium solubilities. For many RN, the geochemical uncertainty - the uncertainty in geochemical conditions - clearly outweighs the uncertainty of the thermodynamic data. This uncertainty has been considered by defining a set of bounding waters, both for those representing the canister and the buffer/host rock interface environments. An aspect that cannot be fully treated in this manner is related to the redox conditions. A number of key nuclides (e.g. U, Pu, Se) are highly sensitive to Eh conditions, in terms of redox potential and reducing capacity of the system. In addition, the reactivity of redox active surfaces may strongly affect the kinetics of precipitation. Thus, both thermodynamic and kinetic factors need to be considered for such radioelements. In this study, recent work on the reduction of soluble oxidised U, Np, Tc and Se and precipitation to insoluble solids in canister-like environments has been summarised to support thermodynamic calculations. A further uncertainty is related to the ionic strength extrapolation with the Davies approximation, in particular for the brine water displaying an ionic strength of about 1.4 eq L-1. In order to test the validity of this approach, the SIT method has been applied for selected actinides (Th, U, Pu, Am) with aid of the preliminary SIT database developed within the Andra/Thermochimie database project. The obtained solubility values agree fairly well (less than one order of magnitude), thus providing support for the simplistic extrapolation procedure. It also is noteworthy that the likelihood of such highly saline waters to reach repository levels is considered to be small. An uncertainty regards the application of the data calculated at 25 °C to higher temperatures in the early phases of the repository. Between 1 000 years (minimum time required to fill an initially defective canister) and 10 000 years after closure, temperatures between 30 and 50 °C are expected (Pastina & Hellä 2006). Generally, the error introduced in neglecting temperature dependence in solubility and sorption data in this temperature range is assumed to be small and largely compensated by the better

72
quality database of thermodynamic data at standard state conditions. For many RN, there are still significant gaps in enthalpy data for important solids and complexation or hydrolysis reactions. Thermodynamic calculations at non-standard temperatures with such incomplete enthalpy data will result in erroneous speciation and solubilities. On the other hand, it should not be ignored that some recent experimental data indicate a relevant temperature effect on complexation and hydrolysis reactions of actinides and lanthanides. For example increasing complexation with increasing temperature was observed for Pu(IV)-F complexes (Moore 2011), the Cm(CO3)3
3- complex (Vercouter et al. 2005), Pa(V)-sulphate complexes (Di Giandomenico & Le Naour 2009) and various actinide/lanthanide complexes with organic ligands (summarised in Skerencak et al. 2009), whereas Rao & Tian (2011) found only a small temperature effect on the formation of CmNO3
2+ complexes. It should be noted that none of these complexes plays an important role under in-situ conditions. Recent publications describe an enhancement of hydrolysis with increasing temperature for Pu(VI) (Rao et al. 2011) and Pa(V) (Le Naour et al. 2003; Trubert et al. 2002; 2003) resulting in a larger proportion of the less soluble neutral hydrolysed species at higher temperature. Thus, the effect of temperature on solubilities will be RN specific and needs more consideration in the future. There is uncertainty in the effect of dissolved humic substances (HS) from the groundwater on speciation and solubility because of lack of site specific data (see section 1.1). As a first estimate, the findings of Hummel et al. (2000), applying a "conservative roof" approach (= maximum humic concentration that does not have a diminishing effect on nuclide speciation/inorganic sorption), can serve as guidance. In this approach, a conservative and simple equilibrium model is proposed from a number of metal-humate complexation data. Effects of humate sorption or competition with other cations are conservatively ignored in the model. Analysing the situation for Swiss groundwaters, Hummel et al. (2000) concluded that significant effects on speciation are limited to trivalent lanthanides and actinides for HS concentrations in the ppb range. For HS concentrations of 10 ppb, complexation of HS with Eu could - for low carbonate waters - lead to an increase in solubility or decrease in sorption of about one order of magnitude or less. The results from a recent experimental study on Eu binding by natural dissolved organic matter in Opalinus Clay (Courdouan et al. 2008) indicated an increase in solubility of 510-8 M, representing about 30% of total dissolvable Eu. Concluding from these considerations for the Olkiluoto case, the effect of groundwater-born humic substances on solubilities is expected to be minor except for trivalent lanthanides and actinides, in spite of lack of knowledge on the nature of dissolved organic matter. Because of the conservative uncertainty treatment and the corresponding large range of solubilities for these trivalent elements, we consider it justified to ignore the potential complexation effects by HS. However, this aspect should be evaluated in more detail and better knowledge on humic (and fulvic) substances at the site should be obtained. The impact of organics contained in construction materials such as concrete admixtures used in cavern and backfill construction is assumed to be minor, because these materials are not in contact with the bentonite and organic content is generally low. However, it cannot be excluded for certain that minor amounts of such organics migrate in the bentonite and interact with RNs. Some detailed investigations on this aspect would be desirable for future SA.

73
The proposed solubility data - reference values and upper limits - are listed for canister waters and groundwaters in Appendix A1, Table A-1. The derivation of the upper limit was done for most elements by considering the highest solubility of all waters and accounting for the formal thermodynamic uncertainty. This treatment is conservative and probably tends to lead to overpessimistic values. For some elements (e.g. Am), this procedure clearly resulted in unrealistic values. For these cases, the upper limit was derived directly from the "geochemical" uncertainty, thus from the water yielding the highest solubility.

74

75
PART II - RADIONUCLIDE SORPTION AND DIFFUSION

76

77
6 INTRODUCTION TO RADIONUCLIDE MIGRATION
6.1 Radionuclide migration
The migration of radionuclides (RN) through the bentonite buffer is constrained by (slow) diffusion. In addition, many RN are retarded by sorption to the clay and by co-precipitation processes. Radionuclide transport models applied in safety assessment are generally based on the simple formalism of Fick's laws:
a) For linear one-dimensional steady-state RN flux:
dx
dCDJ e (6-1)
with )(
20DDD pe (6-2)
where J: flux (mols-1m-2), De, Dp, D0: 'effective', 'pore', 'free solution' coefficients (m2s-1) respectively, C: concentration (molm-3), x: diffusion distance (m), /2: "tortuosity factor" (ratio between constrictivity and tortuosity, sometimes termed "geometric factor"), representing effects of pore space geometry on diffusion (dimensionless), : diffusion-available porosity (dimensionless).
b) For linear one-dimensional time-dependent RN mass transfer:
2
2
dx
CdD
t
Ca
(6-3)
with dd
ea K
DD
(6-4)
where Da: 'apparent' diffusion coefficient (m2s-1), d: bentonite dry density (kgm-3); Kd: mass distribution ratio representing partitioning of RN mass between dissolved species and sorbed species at position x (m). The term +dKd is often referred to as rock capacity factor. In practice, transport through the buffer is modelled with the aid of eq. 6-4 and assigning De, and Kd values for each RN. The diffusion parameters De and are commonly obtained from small-scale through-diffusion experiments from non-sorbing or weakly sorbing tracers, such as tritiated water (HTO), Cl- or Na+. Kd values on the other hand can either be obtained from diffusion data or from batch sorption tests as outlined in section 9.2. It should be born in mind that there are some implicit assumptions in this approach: The first assumption is that sorption is linear (with concentration) which is generally valid at low concentrations at which RN occur. The second is that sorption is reversible, which is less certain in many cases because it neglects the possibility of irreversible uptake processes, such as co-precipitation and/or diffusion into the solid. Such processes lead to stronger immobilization and thus

78
sorption reversibility can generally be regarded as conservative assumption. The third assumption regards the transport process itself: the RN migrate solely by diffusion, independently of other species, thus multicomponent diffusion effects and other transport processes, such as electromigration processes are neglected. This assumption is also valid for RN diffusing through the buffer at trace concentrations under more or less constant conditions of salinity, but inherent in this assumption is that each species may diffuse at its own rate. Thus, in principle the diffusivity and diffusion-accessible porosity for each RN should be known. Also, this simple model does not allow for describing simultaneous diffusion of cationic and anionic species as outlined in section 7. The scope of this part is to compile RN migration data (including uncertainties) for the bentonite buffer under expected conditions of the Olkiluoto site. Thus, values for De, and Kd are proposed, based on literature data and their extrapolation to site-specific conditions. This part of the report is organised as follows: In the next section, geochemical conditions and the porewater chemistry of the bentonite, based on the concept of reference waters, are briefly presented. In section 7, diffusion properties in compacted bentonite, based on recent model concepts, are summarised and diffusion data are compiled (section 8). Section 9 gives a short overview on sorption processes in compacted bentonite and describes the approach for deriving sorption values from literature data. Finally, sorption values are compiled for safety-relevant RN (section 10).
6.2 Bentonite porewaters
Based on the reference and bounding groundwaters defined by Hellä (Appendix D), corresponding reference and bounding porewaters for the buffer were defined (Appendix C). The derivation of bentonite porewaters was based on a thermodynamic model including, on the one hand cation exchange/surface complexation reactions at the montmorillonite surface and dissolution/precipitation of accessory minerals (Wieland et al. 1994; Wersin et al. 2004). On the other hand, the clay medium was separated into three porosity compartments including interlayer, diffuse double layer and free water (Fig. 6-1) according to available structural and diffusion data. The details are presented in Appendix C. The derivation of all data was based on a temperature of 25 °C, as outlined and justified in section 1.1. The results of the thermodynamic model in terms of reference and bounding porewaters are listed in Table 6-1. Thus, the composition of the "free" porewater, the cation exchange composition and edge site composition is given. Considering sorption and diffusion data, the following is noteworthy:
The ionic strength for reference waters varies between 0.27 and 0.51 eq L-1. The whole range of ionic strength is 0.002 - 3.0 eq L-1.
The variation in pH for reference waters is rather limited (7.2 - 7.8), the pH range given by the bounding water is 7.4 - 10.

79
Redox conditions in the bentonite porewaters are assumed to be constrained by those in the surrounding groundwater. Thus, redox conditions for most waters are very low, constrained by sulphate/sulphide equilibrium or carbonate/methane equilibrium (brine porewater). For the glacial melt water less reducing conditions controlled by Fe(OH)3/Fe2+ are assumed.
The sorption capacity (3.6 % of CEC) and species distribution of edge sites is based on the diffuse layer model documented in Wieland et al. (1994). It should be kept in mind that surface complexation parameters are highly model dependent and subject to quite some uncertainty. Thus, in the non-electrostatic model of Bradbury & Baeyens (2002a), the sorption capacity of edge sites is significantly larger (10 % of CEC) and three different surface sites are included.
external water
+
+
+
+
+
clayparticle
DDL
DDL
-
- -
-
-
-
-+
+
+
++
+
+
+
+
+++ +++ +++
+++
+++ +++ +++
+++
+
+
+
+
++
+
+
+
+
+
+
+
+
+
-
-
- + + -
1 23
12
3
interlayer water with exchanged cations
diffuse double layer with excess positive charge
charge balanced external porewater
1 nm
Figure 6-1. Different water types in bentonite according to model concept (Wersin et al. 2004) The data on dissolved organic matter and humic substances in the Olkiluoto groundwaters is sparse as outlined in section 1.1. Potential effects of humic substances on speciation and sorption are briefly discussed in sections 5.2 and 11.1, respectively.

80
Table 6-1. Composition of free porewater, cation exchange sites and edge sites for the two reference and four bounding porewater conditions. Concentrations in mmol L-1 unless otherwise noted. Temperature is 25 °C.

81
7 RADIONUCLIDE DIFFUSION: MODEL CONCEPTS
A remarkable property of compacted clay is the different diffusion behaviour of cations and anions in such materials. From tracer through-diffusion experiments it can be inferred that anions show lower diffusive fluxes than water tracers, whereas cations, such as Na+, Sr2+ and Cs+, tend to show higher diffusive fluxes.3 The lower effective diffusivity and lower diffusion-accessible porosity of anions can be explained by ion exclusion from the negatively charged clay surfaces and interlayers. The reason for the higher diffusivities of cations is less well established. The larger diffusivity relative to water has been proposed to be induced by diffusion in the diffuse double layer (often referred to as "surface diffusion") and/or by diffusion in the interlayers (Appelo & Wersin 2007; Jougnot et al. 2009; Glaus et al. 2007). Recently, Gimmi & Kosakowski (2011) inferred from an evaluation of a large set of diffusion data in the literature that cations sorbed to clay surfaces exhibit a cation specific surface mobility, which is inversely proportional to the sorption affinity. According to the authors, this surface mobility would contribute to diffusive fluxes exceeding the diffusive flux expected from the sorption coefficients determined in batch experiments. In commonly applied diffusion models, the different diffusion properties of anions and cations cannot be accounted for simultaneously, as highlighted above. There are however recent model concepts which consider the apparent different diffusivities of cations and anions in a self-consistent fashion. These can be separated into two model types:
7.1 Multi-porosity diffusion models
Models belonging to this family display quite a variety with regard to the underlying concepts. But all are based on the concept of exclusion of anions from part of the total porosity, thus leading to lower diffusion porosities and diffusion coefficients relative to neutral and cationic species. In the most simple form, models as applied for performance assessments (PA) calculations, assume lower diffusion parameters De and for anions than for neutral species and cations. The higher diffusive flux diffusion of Cs+ is described by a larger De value relative to tritiated water (HTO) (e.g. Yu & Neretnieks 1997; Ochs & Talerico 2004). The drawback of these simple models, besides conceptual deficiencies (Appelo & Wersin 2007) is that the description of simultaneous diffusion of anions and cations is not possible. More advanced models have been formulated recently which account for the specific properties of compacted clays. They generally consider diffusion in the different porosity compartments "free" water, DDL water and interlayer water, each with their own physico-chemical properties (e.g. Appelo & Wersin 2007; Bourg et al. 2006; Leroy et al. 2006; Jougnot et al. 2009). The enhanced diffusion of cations on the other hand is taken into account by the increased diffusional gradient of cations between the DDL and the free water (e.g. Appelo & Wersin 2007), by an additional diffusion pathway in the 3 It should be pointed out however that there is considerable uncertainty with regard to the diffusive fluxes of cations, and that only for Cs+ higher diffusive flux relative to HTO is evident (see also section 8.2).

82
interlayer (e.g. Bourg et al. 2007) or increased mobility close to the surface, often termed surface diffusion (e.g. Gimmi et al. 2010). An example of a successful simulation of a suite of cationic (Na+, Sr2+, Cs+), anionic (Cl-, I-) and neutral tracers (HTO) in Opalinus clay in two diffusion experiments with a multicomponent diffusion model was presented by Appelo & Wersin (2007) and Appelo et al. (2013). Diffusion coefficients for all species were derived from those in free water and tortuosity factors determined from experimental data. The concentration in the DDL were approximated by assuming a Donnan volume in which the concentrations are related with Boltzmann’s equation to the concentrations in free porewater (Cfree,i in mol/L):
)RT
FΨz-exp(CC Di
ifree,iDDL, ]L [mol -1 (7-1)
where zi is the charge number, F the Faraday constant (96485 J/V/eq), and D the potential (V) in the Donnan volume, R the gas constant (8.314 J/K/mol) and T the temperature (K). All solutes could be well described by considering free and DDL porewater, except for Cs+ where an additional diffusion path in the interlayer or surface layer had to be invoked for explaining the diffusional flux. To our knowledge a similar validation exercise for simultaneous diffusion migration of cations and anions in compacted bentonite is lacking so far.
7.2 Single porosity model
This model, termed "homogeneous model" has been promoted by Clay Technology (Birgersson & Karnland 2009). It assumes Donnan equilibrium between an outer solution (i.e. groundwater) and the clay, separated by an osmotic-type discontinuity at the clay/outer solution interface. Diffusion of all species including cations and anions occurs solely in the interlayer and is driven by diffusional gradients within the interlayer. Donnan equilibrium between the outer solution and the interlayer solution regulates the concentration at the inlet. The effective diffusion coefficient for both cations and anions is expressed as:
ζ)2
ζΞ(DεD cce ]s [m -12 (7-2)
where εc is the total porosity (-), Dc the pore diffusion coefficient (m2 s-1), is ion equilibrium (an osmotic-type) coefficient (-) and is a filter factor (-), needed for interpreting tracer diffusion experiments carried out with filters. The model has been successfully applied to simulate Na+, Cl- tracer tests of Van Loon et al. (2007).
7.3 Model uncertainties
The variety in diffusion models for compacted bentonite (and claystones) reflects the large conceptual uncertainty regarding the microstructure and nanostructure of these materials.

83
The simplest model is the single porosity model of Birgersson & Karnland (2009) in which all solutes diffuse within the same interlayer space. This model has so far only been tested for simple NaCl systems in a limited range of compaction degree. At lower compaction degree and/or higher content of accessory minerals and resulting increasing fraction of external water (free and DDL) this simple osmotic model has not been tested. A further drawback is that this model cannot be applied in current geochemical codes. The multi-porosity models are more robust in that they can be applied for a large range of compaction degrees and fraction of accessory minerals. Moreover, they can be and have been implemented in geochemical codes, such as for example in PHREEQC. On the other hand, the diffusional and electrochemical properties in the DDL and interlayer are not well known and are treated in an oversimplified manner. This regards for example the assumption of same electric permittivity in free and DDL water, which probably does not hold (Leroy et al. 2006; Appelo et al. 2013).

84

85
8 RADIONUCLIDE DIFFUSION DATA
A large number of experimental diffusion data for compacted bentonite exists, particular for non-charged and anionic species. In spite of the inherent uncertainty associated with such data (such as, for example, the effect of filters, model assumptions), a rather good and consistent dataset can be compiled. This is also evident from compilations performed for KBS-3 bentonite conditions (Yu & Neretnieks 1997; Ochs & Talerico 2004). Effective diffusivities (De) and diffusion-available porosities are given for a target dry density of 1570 kg m-3, which corresponds to the saturation density of 2005 kg m-3 and a total porosity ε of 0.43. Bounding dry densities, which account for data and material uncertainty, are 1650 kg m-3 (upper limit, corresponds to total porosity of 0.40) and 1410 kg m-3 (lower limit, corresponds to total porosity of 0.49).
8.1 Diffusion of non-charged species (HTO)
Figure 8-1 summarises effective diffusivities (De) of HTO in compacted montmorillonite and bentonite as a function of dry density at room temperature. Bentonites with a high smectite content (all except Kunigel-V1: 45-50 % smectite) exhibit consistent diffusion behaviour at room temperature, whereas at lower smectite content (Kunigel-V1) higher De values were observed. In the overall trend and in particular for the MX-80 bentonite (Melkior et al. 2009), no significant difference in the effective diffusivity coefficients of Na or Ca bentonites, as well as bentonites conditioned with artificial porewaters (APW) can be observed. Other studies with Milos Montmorillonite (Gonzalez Sanchez et al. 2008) and Avonlea bentonite (Choi & Oscarson 1996) report significant higher diffusion coefficients for the Ca-form. This was explained by the larger particles sizes and therefore less tortuous diffusion pathways in Ca-montmorillonite. However, these do not exceed the diffusivities observed for Na-bentonites/montmorillonites. Hence, the regression and equation 8-1 is valid for Na-, Ca- and artificial porewater conditioned bentonites.
d 0.0022-9e e10 3D ]s [m -12 (8-1)
At high smectite contents, compaction of the bentonite can result in orientation of the smectite particles. This leads to anisotropy of tortuosity and consequently to different De values for different diffusion pathways. De values parallel to the direction of orientated clay particles are generally higher than De values perpendicular to the orientation direction (Sato & Suzuki 2003; Suzuki et al. 2004). The ionic strength of the porewater does not exhibit a significant influence on the effective diffusion of non-charged species (e.g. Gonzalez Sanchez et al. 2008; Melkior et al. 2009; Glaus et al. 2010). In contrast, effective diffusivity shows an exponential increase with increasing temperature according to
0.03)T0.026(ee eC)(0DC)(TD ]s [m -12 (8-2)

86
(Fig. 8-2). This corresponds to a factor of 1.5 for a temperature increase from 25 °C (standard temperature, see section 1.1.) to 40 °C. In the range of dry densities expected for the bentonite buffer (bounding dry densities 1410-1650 kg m-3), De values measured at room temperature span a range of almost one order of magnitude. Part of the data spread is based on the different smectite content of the bentonite materials with De values between 1.3·10 -10 and 3.3·10 -11 m2 s-1 at high smectite contents and De values between 2.6·10 -10 and 1.9·10 -10 m2 s-1 for the Kunigel-V1 bentonite (smectite 45-50%). For a dry density of 1570 kg m-3, a best estimate De value of 9.5·10 -11 m2 s-1 is suggested based on regression analysis of all diffusion data measured at room temperature (Table 8-2). The upper and lower limits, 1.3·10 -10 and 3.3·10 -11 m2 s-1, respectively are based on the scatter of the experimental data in the range of the bounding dry density conditions. A calculation using the intercept of the regression with the upper and lower limit dry densities would underestimate the data uncertainty. Non-charged species can diffuse in the total porosity, comprising all three porosities in the multiporosity model, the interlayer porosity, the diffuse double layer porosity and the free porosity (Fig. 6-1). For the in-situ conditions, the diffusion-available porosity of non-charged species at the target dry density of 1570 kg m-3 therefore corresponds to the total porosity of 0.43. At the bounding dry densities of 1650 and 1410 kg m3 diffusion-available porosities of 0.40 and 0.49, respectively, are expected.

87
y = 3E-09e-0.0022x
R2 = 0.70
1.E-12
1.E-11
1.E-10
1.E-09
0 500 1000 1500 2000 2500
dry density (kg m-3)
De
(m2 s
-1)
Montmorillonite Milos (Na) (Gonzales Sanchez et al., 2008) Montmorillonite Milos (Na) (Glaus et al., 2007,2010)
Montmorillonite Milos (Ca) (Gonzales Sanchez et al., 2008) MX-80 (Na) (Melkior et al., 2009)
MX-80 (Na) (Neretnieks, 1982) MX-80 (Na) (Eriksen, 1982)
MX-80 (Na) (Pocachard et al. 2000) MX-80 (Ca) (Melkior et al., 2009)
MX-80 (APW) (Goutelard & Charles, 2004) MX-80 (APW) (Melkior et al., 2004, 2009)
MX-80 (APW) (Brouard et al., 2004) MX-80 (Cs) (Melkior et al., 2009)
Kunipia-F (Na) (Kozaki et al. 1998) Kunipia-F (Na) (Sato & Suzuki, 2003)
Kunipia-F (Na) (Suzuki et al., 2004) Avonlea (Na) (Choi & Oscarson, 1996)
Avonlea (Ca) (Choi & Oscarson, 1996) FEBEX-bentonite (Ca,Mg) (Garcia-Guttierez et al., 2001,2004)
Kunigel-V1 (Na) (Sato & Suzuki, 2003) Kunigel-V1 (Na) (Kato et al., 1995)
Kunigel-V1 (APW) (Sato, 1998a)
Figure 8-1. Effective diffusivities (De) of HTO in compacted montmorillonite and bentonite as a function of dry density. Vertical lines indicate the target (solid) and bounding (dashed) dry densities of the buffer bentonite. Only data obtained at 20-25 °C are presented and used for the regression.

88
Figure 8-2. Temperature dependence of effective diffusivities for HTO.
8.2 Diffusion of anions (Cl-)
Experimentally determined effective diffusivities for Cl-, which is used as proxy for anion diffusion, are presented in Figure 8-3 as a function of dry density. De values for anions are significantly lower than the De values obtained for HTO, which is in line with the model predictions as discussed in section 7. The large spread in the De values of Cl- results from the high dependence of anion effective diffusivity on the ionic strength of the porewater. In Figure 8-4, De values are plotted against the ionic strength of the experimental solutions. With increasing ionic strength, De values increase and the function of De from ionic strength (I) can be expressed as
0.08)( .640
e I aD ]s [m -12
(8-3) where a is a constant depending on the dry density of the bentonite according to
da 0.0066-7 e10 3 (8-4)
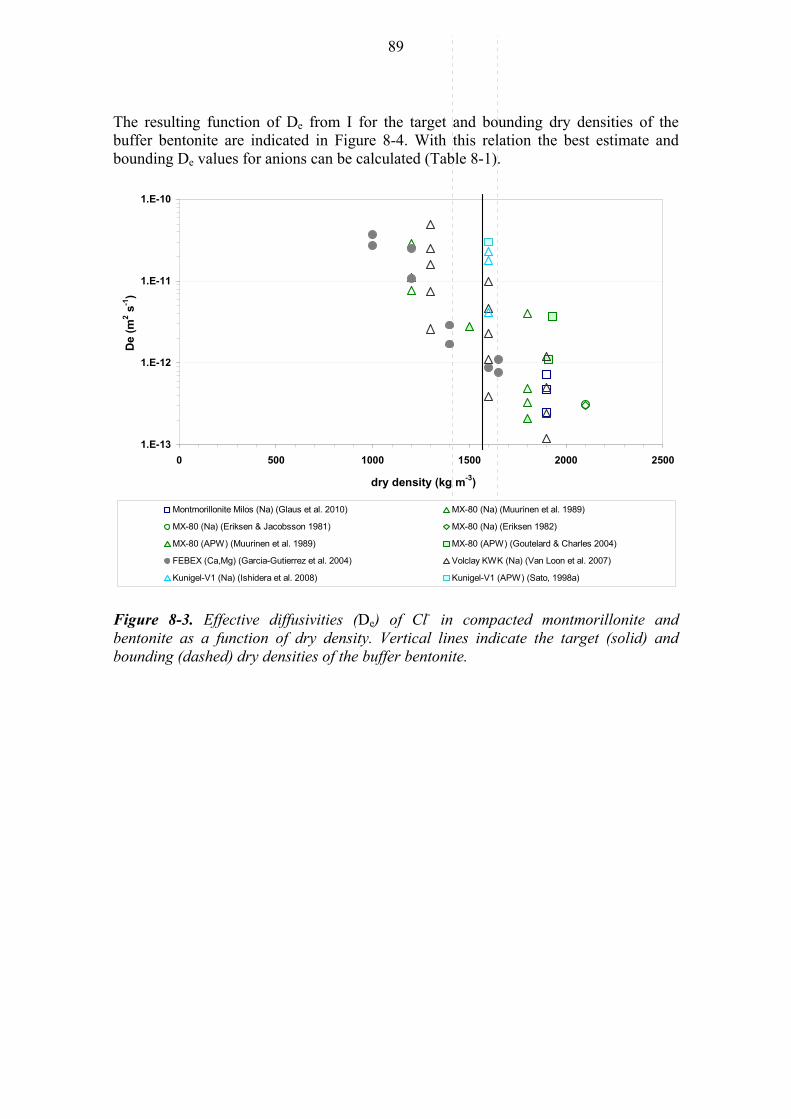
89
The resulting function of De from I for the target and bounding dry densities of the buffer bentonite are indicated in Figure 8-4. With this relation the best estimate and bounding De values for anions can be calculated (Table 8-1).
1.E-13
1.E-12
1.E-11
1.E-10
0 500 1000 1500 2000 2500
dry density (kg m-3)
De
(m2 s
-1)
Montmorillonite Milos (Na) (Glaus et al. 2010) MX-80 (Na) (Muurinen et al. 1989)
MX-80 (Na) (Eriksen & Jacobsson 1981) MX-80 (Na) (Eriksen 1982)
MX-80 (APW) (Muurinen et al. 1989) MX-80 (APW) (Goutelard & Charles 2004)
FEBEX (Ca,Mg) (Garcia-Gutierrez et al. 2004) Volclay KWK (Na) (Van Loon et al. 2007)
Kunigel-V1 (Na) (Ishidera et al. 2008) Kunigel-V1 (APW) (Sato, 1998a)
Figure 8-3. Effective diffusivities (De) of Cl- in compacted montmorillonite and bentonite as a function of dry density. Vertical lines indicate the target (solid) and bounding (dashed) dry densities of the buffer bentonite.

90
1.E-13
1.E-12
1.E-11
1.E-10
0.001 0.01 0.1 1 10
Ionic strength of solution (eq kg-3)
De
(m2 s
-1)
Montmorillonite Milos (Na) 1900 kg m-3 (Glaus et al. 2010) MX-80 (Na) 1200 kg m-3 (Muurinen et al. 1989)
MX-80 (Na) 1800 kg m-3 (Muurinen et al. 1989) MX-80 (APW) 1910/1930(Goutelard & Charles 2004)
Volclay KWK (Na) 1300 kg m-3 (Van Loon et al. 2007) Volclay KWK (Na) 1600 kg m-3 (Van Loon et al. 2007)
Volclay KWK (Na) 1900 kg m-3 (Van Loon et al. 2007) Kunigel-V1 (Na) 1600 kg m-3 (Ishidera et al. 2008)
Figure 8-4. Effective diffusivities (De) of Cl- as a function of the ionic strength. Vertical lines indicate the ionic strength of the two reference porewaters (saline water: black, brackish water: grey), whereas the range given by the two bounding porewaters glacial melt water (I= 0.001) and brine water (I=1.3), would cover the entire experimental range. The calculated regressions for the target (solid) and bounding (dashed) dry densities of the buffer bentonite are indicated in red.
Diffusion-available porosities for anions were determined using the method for anion exclusion quantification at montmorillonite surfaces presented by Tournassat (2008). Based on the modified Gouy-Chapman theory, the anion exclusion distance at the external surface can be expressed as
-1
exclusionanion κ ad (8-5)
where κ is the Debye length
I
101 10037.3
(8-6)

91
and a is a factor depending on the ionic strength I of the solution. Following Tournassat (2008) we use a=1.9 for I<0.05 mol L-1 and a=1.2 for I >0.1 mol L-1, with a linear extrapolation for 0.05<I<0.1. The anion free DDL porosity (ε DDL anion free) is then calculated as
p
mAdε mmmm
exclusionanion freeanion DDL
(8-7)
Amm (total surface of the montmorillonite), mmm (mass of montmorillonite) and p (stacking number of the TOT layer of montmorillonite particles) for in-situ bentonite conditions are taken from Appendix C. With the interlayer porosity (εIL) determined by the procedure outlined in Appendix C, the anion accessible porosity is calculated as
freeanion DDLILtotaccessibleanion εεεε (8-8)
The resulting anion accessible porosities for the reference and bounding waters are presented in Table 8-1. For the two very dilute bounding waters (dilute, carbonate rich KR4/81/1 and glacial melt water) this approach results in negative anion accessible porosities, demonstrating the limitations of the model concept. We therefore also estimated the anion accessible porosity for the reference and bounding water conditions based on the experimental data of Van Loon et al. (2007) and their graphical presentation in Tournassat (2008) (Table 8-1). These experimentally derived porosities are smaller (for I>0.1) than those based on the model calculations, which is presumably due to the different grain size of the Volclay KWK used by Van Loon et al. (2007) and the higher dry density (ρ = 1620 kg m3) in the experiments. We therefore suggest the model derived anion accessible porosities as best estimate for all reference and bounding porewaters except for the dilute, carbonate rich and glacial melt water, where experimental data are proposed. The resulting Da values for anions under the relevant in-situ conditions are given in Table 8-1.

92
Table 8-1. De values, anion accessible porosities and resulting Da values for the reference and bounding groundwaters. De values are based on the experimental data for Cl- (Figures 8-3 and 8-4). Anion accessible porosities were determined (i) using the model of Tournassat (2008) (source data b) with bentonite specific parameters (Appendix C; source data a) and (ii) based on the experimental data of Van Loon et al. (2007). Da values were calculated using the model derived anion accessible porosities for all waters with I > 0.1 and the experimental data for I<0.1 (dilute, carbonate rich and glacial melt water).

93
8.3 Diffusion of cations
8.3.1 Cations sorbing via cation exchange
Through-diffusion experiments indicate that the diffusive flux of "simple" cations, such as Na+, Sr2+ or Cs+, tends to be higher than that of neutral or anionic tracers although this is still controversially discussed in the literature (section 8.1). It should be noted that this enhancing effect in compacted bentonite, often termed "surface diffusion", has been described for cations sorbing via cation exchange to interlayer sites (Gimmi & Kosakowski 2011 and references therein) and thus applies to the safety relevant nuclides 137Cs+, 87Sr2+ and 226Ra2+. Systematic cation diffusion studies are rather sparse and a large scatter in reported De data for Na+, Sr2+, and Cs+ exist. This is partly because of the different experimental setups and data analysis procedures used. However, a clearer picture is obtained if the effective diffusive fluxes are compared, i.e. diffusion coefficients multiplied with the concentration gradient in the clay sample rather than the concentration gradient between the external solutions at the in- and outlet respectively (e.g. Van Schaik et al. 1966; Gimmi & Kosakowski 2011). Thus, the diffusive flux can be defined with respect to the sorbed concentration (Glaus et al. 2007) or an internal concentration being lower than the external one (Donnan approach; Birgersson & Karnland 2009). The relationship between sorbed concentration and effective diffusion coefficients has been shown for Na+ and Sr2+ for highly compacted montmorillonite samples by Glaus et al. (2007). This relationship has been confirmed by the compilation of Gimmi & Kosakowski (2011) for these cations and for Cs+ based on a number of diffusion studies with different clay materials with different densities. Here we apply part of the data compiled by these authors which is deemed relevant for near-field in situ conditions. Thus, the data selected comprise tracer (Sr2+ and Cs+) through-diffusion studies in bentonite or pure montmorillonite for a range of dry densities with reported data of De and rock capacity factors or Kd values. In view of scarce data for Cs+ we also considered further data from Sato et al. (1998a), who reported Da values instead of rock capacity factors. The following relationships were applied.
ii CDJ (8-9)
where Di is the diffusion coefficient in the interlayer and Ci the concentration gradient between sorbed (interlayer) cation concentration Ci and external concentration (Caq). Hereby it is inherently assumed that the interlayer cation is in dissolved form. Ci is linked to the distribution coefficient Kd by:
'Daqi KCC (8-10)
where D
DD KK ' (8-11)
If all parameters except for Caq are constant then:

94
aqDiaq CKDCconstJ ' (8-12)
The constant in eq. 8-12 can also be expressed as classical De:
'Die KDD (8-13)
Strontium: The through-diffusion data of Oscarson (1994), Choi & Oscarson (1996), Jensen & Radke (1988), Molera & Eriksen (2002), Eriksen et al. (1999), Gonzalez Sanchez et al. (2008) and Glaus et al. (2007), as compiled in Gimmi & Kosakowski (2011) were applied to test above relationships and test the influence of dry density on the diffusive flux. The De data plotted as a function of dry density show a huge scatter of about three orders of magnitude. However, when these data are plotted as Di the scatter diminishes considerably. The "scaled" De values also show a trend to decrease with dry density, which can be approximated with the following regression curve underlining the strong coupling of De and Kd via Kd':
deKD de0022.010 '10 (8-14)
This relationship is used to derive De values for the buffer. The Kd values for the reference and bounding porewaters have been derived separately by applying the thermodynamic bentonite porewater model and treating Sr2+ sorption as cation exchange, as detailed in section 10.2. The resulting Kd and Kd' values are shown in Table 8-2 together with the De values calculated from eqs. 8-13 and 8-14. Note that by using the proposed relationship Da values calculated from eq. 8-14 for the different porewaters are rather similar ranging from 2.6·10-12 to 7.710-12 m2 s-1 despite the strongly differing sorption values. Thus, the diffusion of Sr2+ and the other cations sorbing by ion exchange is considered to take place at a similar rate, with only minor influence of ionic strength and thus of Kd values which is a more consistent and conservative approach than by assuming a constant De value for all conditions and selecting Kd values independently for each porewater composition.

95
Figure 8-5. Reported De values (diamonds) and "scaled" De/Kd' values (squares) of Sr2+ vs dry density. Vertical line indicates the target dry density of the buffer bentonite. The regression is based on the experimental data of Oscarson (1994), Choi & Oscarson (1996), Jensen & Radke (1988), Molera & Eriksen (2002), Eriksen et al. (1999), Gonzalez Sanchez et al. (2008) and Glaus et al. (2007). For these datasets the compiled data of Gimmi & Kosakoswski (2011) were used.
Table 8-2. Calculated Di, De and Da values for Sr2+, target dry density 1570 kg m-3; data source a: Through diffusion data compiled by Gimmi & Kosakowski (2011), data source b: best estimate Kd data determined by cation exchange model (see text).

96
Caesium The analogous exercise is carried out for Cs+ data which is based on Molera & Eriksen (2002) and Eriksen et al. (1999), as compiled by Gimmi & Kosakowski (2011), and in addition on data of Sato (1998a). The reported De values and calculated Di values based on these data are depicted in Figure 8-6, which indicates a similar trend of Di versus dry density to that of Sr2+ data. Thus, a regression curve for scaled De values as a function of dry density can be drawn:
deKD de
0024.011 '106 (8-15)
The derivation of the Kd values in the in-situ porewaters, as detailed in section 10.2.2, is based on the distribution ratio of exchangeable and dissolved Na+, as proposed by Bradbury & Baeyens (2003), leading to higher Kd values in low salinity waters (Table 8-3). In this Table the derived De and corresponding Da values are also given. The Di and Da values are a factor of 2.7 lower than those for Sr2+.
Figure 8-6. Reported De values (diamonds) and "scaled" De/Kd' values (squares) of Cs+ vs dry density. Vertical line indicates the target dry density of the buffer bentonite. The regression is based on the experimental data of Molera & Eriksen (2002), Eriksen et al. (1999) and Sato (1998a). For the first two datasets the compiled data of Gimmi & Kosakoswski (2011) were used.

97
Table 8-3. Calculated Di, De and Da values for Cs+, target dry density 1570 kg m-3; data source a: Through diffusion data shown in Fig. 8.5, data source b: best estimate Kd data determined by cation exchange model (see text).
Radium: The only diffusion data found are from the work of Tachi et al. (2001). They performed in-diffusion experiments with Kunigel-V1 bentonite at dry densities of 1400 and 1800 kg m-3. “Scaled” De/Kd
’ values calculated from these data follow the regression obtained for Sr. In view of this, Sr2+ is used as analogue for diffusion data. As indicated in section 8.2., Sr2+ is also used as analogue for sorption. Thus, the same De and Kd data as for Sr2+ are proposed.
8.3.2 Other cations
For other safety relevant cations, including in particular metal complexes, diffusion data are sparse and very few reliable measurements of De values exist. This is in part due to experimental shortcomings and the low diffusion rates of such tracers. In general, more strongly sorbing cations, such as actinides, lanthanides and also transition elements (i.e. Ni) sorb predominately via surface complexation at pH conditions of interest and are thus less sensitive to ionic strength effects (see also section 8.2). Gimmi & Kosakowski (2011) derived scaled De values postulated a rather low surface mobility of the transition element Co compared to those of Sr2+ and Cs+. From these considerations, we propose the same De values for these other cations as for water tracers and non-charged species and to derive Kd values independently, as has been done for previous assessments (e.g. Ochs & Talerico 2004).
8.4 Recommended diffusion data
We recommend the upper limit effective diffusivities for use in safety assessment, because they account for uncertainties in the experimental data and in the expected buffer parameters. An exception to this concerns the class of cations sorbing via cation exchange where a close link between De and Kd values is manifested, as outlined in section 8.3. Thus, De values of Sr, Ra and Cs have to be used in combination with the respective Kd values and we propose to use best estimate De values coupled with the lower limit Kd values to account for the inherent data uncertainty. With this approach,

98
De values of Sr and Ra in the brine, saline and brackish water and for Cs in the brine water would be lower than the diffusivity of water. This conflicts with the general concept of cation diffusion and indicates limitations in the transferability of the calculation approach to cases of low Kd values. We therefore recommend the effective diffusivity of water as the minimum diffusivity of cations, i.e. using a De of 1.3·10-10 m2 s for Sr, Ra and Cs in case the best estimate De calculated in Table 8-2 and 8-3 was below this value. All data are based on a target dry density of 1'570 kg/m3 as was the case in previous assessments (e.g. Pastina & Hellä 2010). Due to the conservative approach applied to derive the recommended data, uncertainties in the actual buffer densities are not explicitly taken into account. Table 8-4 summarises the recommended effective diffusivities and diffusion-available porosities and compares them with the diffusion data applied in a previous safety assessment (Nykyri et al. 2008, original data source Ochs & Talerico 2004). Generally, no significantly different diffusion values are recommended compared with the previous assessments, despite new available experimental data. An exception to this is the data for cations Cs+, Sr2+ and Ra2+ where a different approach for the compilation has been adopted. For anions, De values and diffusion-available porosities are distinguished for the reference and bounding porewaters in this work. If only the highest De and largest porosity is considered as conservative estimate, these values equal the values previously suggested. The diffusion values for anions refer to "true" anions and oxyanions, thus including I, Cl, Se and Cinorg. Labile metal anionic complexes, such as negatively charged metal-carbonate complexes (e.g. for actinides), chloride complexes and anionic hydrolysed species are conservatively assumed to "see" the full porosity.

99
Table 8-4. Recommended De values, accessible porosities and, in case of Cs+, Sr2+ and Ra2+, lower limit Kd values for safety assessment. Note that De and Kd values are coupled for cations sorbing via cation exchange and that De values calculated with the best estimate Kd are conservatively recommended in combination with the lower limit Kd. De based on HTO De as minimum De are printed in italics. Comparison with data used in the previous safety assessment (summarised in Pastina & Hellä 2010, applied in Nykyri et al. 2008, original data Ochs & Talerico 2004) also shown.

100

101
9 RADIONUCLIDE SORPTION IN COMPACTED BENTONITES
9.1 Sorption processes
Sorption of RN and other solutes in bentonite and montmorillonite has been extensively studied in batch systems in the last 20 years and a fairly good process understanding thereof exists. In this regard it is worth noting the systematic experimental work of Bradbury & Baeyens (e.g. Bradbury & Baeyens 1997a; 2003; 2011). Their results have revealed the importance of the two fundamental sorption processes: cation exchange at interlayer sites and surface complexation at edge sites of the montmorillonite surface. An illustrative example of these two processes is given by the sorption of divalent heavy metals, such as Ni2+, which sorbs via cation exchange at low pH and via surface complexation under neutral and alkaline conditions. Whereas the cation exchange process leads to moderate sorption and is strongly dependent on salinity but not on pH, the surface complexation process is strongly dependent on pH but (almost) independent of ionic strength and leads to strong sorption in the conditions of interest for PA. This behaviour can be fairly well modelled with a simple thermodynamic model including cation exchange and a three-site sorption model (e.g. Bradbury & Baeyens 2011a?). The relationships and sorption parameters (e.g. sorption capacity, sorption constants) have been derived from disperse batch systems. There have been a few studies which have tested whether the data derived from disperse conditions also hold for compacted ones (Montavon et al. 2006; 2009; Van Loon & Glaus 2008). The results do not yield an unambiguous picture, however they suggest that sorption is equal or even stronger for cations sorbing via cation exchange, such as Cs+ (Montavon et al. 2006; Van Loon & Glaus 2008). Similar sorption behaviour was also shown for selenite (Montavon et al. 2009). However, for more strongly sorbing RN (e.g. lanthanides, actinides) which sorb via surface complexation, there is lack of data under compacted conditions and there is thus more uncertainty with regard to the validity of batch sorption data. A possibility to test the validity of applying sorption data from disperse conditions to compacted ones is to compare these with diffusion data on compacted samples. This can be done by analysing in-diffusion data of sorbing tracers and deducing Kd values from Da values according to eq. 6-4. Unfortunately, there are only few reliable diffusion data available, in particular for strongly sorbing tracers, which allow for such a comparison. This is because of the long diffusion times required, the poorly constrained geochemical boundary conditions and limited resolution of the experimental profiles (Bradbury & Baeyens 2002b). Nevertheless, as suggested by a preliminary comparison exercise by Bradbury & Baeyens (2002b) there appears to be a remarkable agreement in "batch Kd" (obtained from work of Bradbury & Baeyens 2002b) and "diffusion Kd" values (obtained from Japanese studies: Sato & Yui 1997; Sato 1998b) for Cs(I), Ni(II), Sm(III), Am(III), Zr(IV) and Np(V).
9.2 Derivation of sorption data
Following the discussion above, the RN sorption data derived here is principally based on well constrained batch sorption data under disperse conditions and extrapolated to in-situ conditions of the buffer. This is in line with recent safety assessments, such as

102
Nagra's project Opalinus Clay (Nagra 2002), Andra's project Dossier Argile (Andra 2005a) and SKB's project SR-Can (SKB 2006). The extrapolation of sorption data for the conditions of interest can in principle be derived from either thermodynamic sorption models, as for example proposed by Bradbury & Baeyens (2011b) for a number of RN or by the more empirical approach of conversion factors as also performed in previous safety assessments (Bradbury & Baeyens 2003, Ochs & Talerico 2004). In both approaches, the quality of the derived in-situ sorption data strongly relies on the quality of the underlying data sets and the use of proper calibration. Large uncertainties are particularly associated with the transfer of data obtained in simple electrolyte solution to complex repository site porewater conditions, since a number of complexation/surface interactions and speciation effects cannot be directly accounted for (Davis et al. 2005). Here, we mainly adopt the empirical approach of transferring batch sorption data to in-situ conditions via conversion factors. By this, in case more than one data set was available, the experimental data reflecting in-situ water chemistry best, could be chosen. This was of particular importance for the derivation of sorption values for the high alkaline bounding water, where sorption measurements at pH 10 of Berry et al. (2007) provided either an extra reference value (Np, Pu, Cm, Tc) or represent the only reference at such high pH (U(IV)). For the cation exchange of Cs, sorption values determined at low and high Na concentrations were used as source data depending on the Na concentration of the reference and bounding porewater. The derivation of sorption values for the bentonite buffer at the Olkiluoto site via conversion factors was based on the procedure of Bradbury & Baeyens (2003) and Ochs & Talerico (2004). Ochs & Talerico (2004) applied a slightly modified procedure of Bradbury & Baeyens (2003). The three main steps include (i) the data selection, which is based on the definition of data source hierarchy, (ii) the conversion to the in-situ conditions, in particular the corresponding pore water conditions, using conversion factors (CF), and (iii) the estimation of uncertainties, which is implemented as an uncertainty factor (UF) that depends on the conversion factors used (Wersin & Schwyn 2004). These three processes are briefly summarised below. The derivation of RN specific sorption data, expressed in terms of best estimate and limiting Kd values is discussed for each RN of interest in sections 10.1 to 10.4. Data sheets for each RN including, the speciation in the reference and bounding porewaters, source data information, CF and UF are provided in Appendix B2. The best estimate Kd values and UF for all reference and bounding porewaters are summarised in Table B-1. Table 11-1 provides a comparison of the best estimate Kd values for the two reference porewaters with the previously reported Kd values by Ochs & Talerico (2004).
9.2.1 Data selection
The first priority was given to literature sorption data, which has been derived from sorption isotherms and sorption edge measurements on bentonites and montmorillonites. The quality of the experiments as well as the experimental conditions were evaluated to ensure the best available data quality. Special attention was paid to data determined by PSI/NAGRA for the MX-80 bentonite (Bradbury & Baeyens 2011a). For elements, for which no reliable experimental data exist, data of chemical analogue elements were used. For some elements, both experimental data and chemical

103
analogue considerations were evaluated and the more conservative in-situ data chosen. In the case of neither experimental data nor chemical analogues, sorption data were based on a conservative expert judgment.
9.2.2 Conversion factors
Independent of the source of the sorption data, it is necessary to convert the original sorption data to the reference conditions of the repository site. To this end five conversion factors were defined, which include bentonite and groundwater composition parameters influencing the sorption process (Bradbury & Baeyens 2003a). In the following, these factors are briefly described: Mineralogy: The scaling was performed via the cation exchange capacity (CEC), which gives a measure of the sorption capacity of all planar sites.
data source
bentonite referenceCEC CEC
CECCF (9-1)
The CEC of the reference bentonite was set to 0.787 eq kg-1 (section 1.1, Table 1-1), which is identical to the CEC of the MX-80 bentonite used in the experiments reported by Bradbury & Baeyens (2011a). Hence, for experimental sorption data obtained from this source, the CFCEC equalled 1. The conversion approach over the CEC is also valid for elements sorbing via surface complexation, because the edge surface site capacity is proportional to the CEC (e.g. Braedbury & Baeyens 1998). It was further assumed that the selectivity coefficients governing sorption on the source and reference bentonite are equal. pH: Wherever available, sorption data close to the pH of the two reference groundwaters were chosen. Otherwise independent sorption edge data (RN sorption vs pH) were used to correct for the different pH values. The pH correction factor is calculated as the ratio of the sorption distribution coefficient (m3 kg-1) at the pH of the reference porewater (PW) (Rd
4, pH PW) and of the measurement pH (Rd, pH source).
source pH d,
PW pH d,pH R
RCF (9-2)
Speciation: The speciation correction factor is defined as the ratio of the fraction of sorbing species in the reference porewater (Fsorb-PW) and in the solution of the sorption experiments (Fsorb-source) (Bradbury & Baeyens 2003a).
4 Rd describes the experimentally determined distribution coefficient. In the context of RN transport models used for PA, the distribution coefficient is termed Kd.

104
esorb_sourc
PWsorbspeciation F
_FCF (9-3)
Following the argumentation of Ochs & Talerico (2004), Fsorb can be described as the fraction of the RN that has not formed sorption competitive complexes (RNcomplexed)
tot
complexedtotsorb RN
)RN(RNF
(9-4)
Changes in the speciation and sorption behaviour based on the hydrolysis of the RN are already accounted for in the pH conversion factor and are therefore not considered in the speciation conversion factor. Since the role of RN-carbonate complexes for the overall sorption of a RN is not entirely clear, two speciation correction factors Fsorb were distinguished based on the assumptions that (i) RN-carbonate complexes are sorption competitive (Fsorb) and (ii) RN-carbonate species form ternary surface complexes (Fsorb
with CO3 compl). The resulting Kd values for both concepts are provided in the sorption data sheets and for each RN a final choice is presented in the main text and in the summary Table 11-1. In general, it has to be kept in mind that the speciation conversion procedure remains a simplistic approach and that for example the weak sorption of cationic RN-Cl complexes is conservatively neglected, if those species were not present in a similar concentration under experimental conditions. This can significantly influence the Kd values estimated, in particular for the highly saline brine water, where Cl- is the dominant anion. Furthermore, the determination of the speciation correction factor strongly depends on stability constants in the thermodynamic database applied for the RN speciation. Chemical analogues: In case sorption data have to be derived from a chemical analogue, the sorption value of the analogue for the reference buffer situation was modified by an additional conversion factor taking into account the different aqueous speciation of the RN of interest and the analogue.
analogue
nuclideanalogue F
FCF (9-5)
Where Fnuclide is the fraction of the sorbing aqueous species of the RN and Fanalogue represents the fraction of the sorbing aqueous species of the analogue. Lab to field transfer factors: Despite the inherent difference between the dilute batch systems used for experimental sorption data determination and the field conditions of compacted bentonite, the conversion factor was assumed to be unity for all cases. This was reasoned by the similar BET surface areas observed for crushed and intact clays

105
and rocks and the similarity of Kd values obtained in batch sorption and diffusion experiments for some RN (see section 9.2 and Bradbury & Baeyens 2003).
9.2.3 Treatment of uncertainties
In general the uncertainties were handled in the same way as described in Bradbury & Baeyens (2003a). In brief, an overall Uncertainty Factor (UF) for the in-situ Kd value was calculated as the product of individual uncertainty factors for each CF (calculation of UFcf see below). The individual UF considered for the calculation of the overall UF are indicated for each RN in the RN sorption data sheet in Appendix B2. The upper and lower Kd values are finally given as Kd•UF and Kd/UF, respectively. UFsource: The uncertainty factor associated with Kd values derived from sorption isotherm or sorption edge measurements on montmorillonites/bentonites was estimated to be 1.6. This value is based on long-term experience in sorption research presented by Baeyens & Bradbury (1995). UFmodel: To sorption data obtained by model predictions, e.g. for radium and strontium, an uncertainty factor of 3 was assigned. UFCEC: The error in CEC values can be up to ±20%, which corresponds to an uncertainty factor of 1.3. UFpH: The CF for the pH is defined as the quotient of the sorption coefficient at the reference and source measurement pH (see above). Since the uncertainty factor associated with each of the two experimentally determined Kd value is 1.6, this results in a pH uncertainty factor of 2.6. UFspec: Based on the study of Hummel & Berner (2002), an uncertainty factor of 1.4 was assigned for the speciation conversion. However, it must be pointed out that the speciation CF uncertainty is very case sensitive and strongly depends on the completeness and the quality of the thermodynamic database. UFanalogue: If chemical analogue radionuclide data are used, then the overall uncertainty factor of the analogue was taken and multiplied with the speciation uncertainty factor of the radionuclide of interest. UFLabField: Despite that the lab to field transfer factor was set to unity an uncertainty factor of 2 was assigned. This corresponds to a potential loss of reactive sorption sites from laboratory to in-situ conditions of 50 %.

106

107
10 RADIONUCLIDE SORPTION DATA
10.1 Sorption values of actinides
10.1.1 Thorium (Th)
Thorium serves as a representative for the readily hydrolysable actinides and occurs entirely in the tetravalent oxidation state under bentonite porewater conditions. The calculated total solubility of Th in the in-situ reference and bounding porewaters ranges from 3.910-9 mol L-1 (saline KR20/465/1) to 1.610-8 mol L-1 (dilute, carbonate rich KR4/81/1) (Thorium sorption data sheet in Appendix B2). Sorption isotherms determined for Th(IV) on MX-80 in a synthetic porewater (pH 7.2-7.7) (Bradbury & Baeyens 2011a) show that thorium sorption is independent of the Th concentration between 510-12 and 210-8 M. For this concentration range an average sorption value of 63 m3 kg-1 was measured. Sorption edge measurements on Na-SWy1-montmorillonite further indicate that Th sorption reaches a plateau at pH values between 5 and 11 (Bradbury & Baeyens 2011a). Hence, for the determination of the in-situ sorption values no pH conversion factor was required. The largest uncertainty for in-situ Kd values is associated with the formation of Th-hydroxo-carbonate complexes and the formation of ternary Th-carbonate surface complexes. The close similarity of measured Kd values for the sorption isotherm (>35 % Th-hydroxo-carbonate complexes) and the Kd values in the carbonate free sorption edge measurements strongly suggest that sorption of Th-hydroxo-carbonate complexes contributes to the overall Th sorption behaviour. Hence, the Kd values assuming carbonate complex sorption were chosen as best estimate. This results in a Kd value of 63 m3 kg-1 for all relevant porewater conditions with an upper and lower limit of 282 and 14 m3 kg-1, respectively.
10.1.2 Protactinium (Pa)
The derivation of the in-situ Kd values for protactinium was based on the sorption edge measurements on Na-montmorillonite (SWy-1) by Bradbury & Baeyens (2006). These show a constant sorption value of 89 m3 kg-1 over a pH from 4 to 10.5. Speciation calculations indicate that under experimental and in-situ porewater conditions, Pa is almost exclusively present in the pentavalent oxidation state, with the neutral PaO2(OH) species dominating at pH between 7 and 8 and the anionic PaO2(OH)2
- being most important at pH > 9 (Pa sorption data sheet in Appendix B2). No speciation conversion factor is required, since Pa is not complexed by other anions in solution and the pH sorption edge fully accounts for the changing hydrolysis of Pa. Considering the different CEC capacities of the pure montmorillonite and the in-situ bentonite, a best estimate Kd value of 81 m3 kg-1 (limits 14-470 m3 kg-1) was derived for all in-situ porewaters conditions. Note that this Kd value is more than one order of magnitude higher than the previously estimated Kd values for Pa in bentonite buffers, based on Kd values measured for rocks (Bradbury & Baeyens 2003a) or based on the older sorption data of Allard et al. (1982) as presented in Yu & Neretnieks (1997) (Ochs & Talerico 2004). Single point sorption measurements on Kunigel-V1 bentonite at pH

108
10.1 under strongly reducing conditions and initial Pa concentrations of 1.310-11 M suggest Kd values of >260 m3 kg-1, corroborating our selected higher Kd value. Our proposed Kd value is also consistent with the Pa Kd value for illite under far-field conditions of 60 m3 kg-1 proposed by Hakanen et al. (2014).
10.1.3 Uranium (U)
The sorption behaviour of uranium is determined by its prevalent oxidation state in solution. Speciation calculations indicate that under in-situ conditions either U(IV) or U(VI) dominates, whereas U(V) plays a subordinate role (U sorption data sheet in Appendix B2). The dominant oxidation state strongly depends on the redox potential but is also influenced by pH and the presence of complexants in solution. Whereas U(IV) will only be present as the non-charged U(OH)4 species, U(VI) forms anionic carbonate complexes, which may in turn contribute to the stabilisation of the hexavalent oxidation state. The entirely different chemical behaviour of the two oxidation states results in a generally significant higher sorption of U(IV) compared with U(VI). In-situ sorption values for U were therefore first derived separately for the tetra- and hexavalent oxidation state, by scaling the speciation of each oxidation state to 100% (U sorption data sheet in Appendix B2). This allows for a better comparison of calculated and experimentally derived or modelled sorption data in literature. Finally, the total Kd value is calculated as the weighted sum of the two individual Kd values (Table 10-1). The minor contribution of U(V) sorption is conservatively neglected. Experimental data on U(IV) sorption on bentonite or montmorillonite is sparse and characterised by a large scatter, which might be related to difficulties in maintaining strongly reducing conditions during the experiments. We therefore chose Th(IV) as an analogue for the calculations and only refer to the experimental data for comparison. According to the linear free energy relationship (LFER), higher sorption of U(IV) than of Th(IV) is expected and the chosen analogue can therefore be considered conservative. Based on Th(IV) sorption values and the assumption of sorbing Th(IV)-carbonate complexes (see discussion for Th), a best-estimate Kd value of 63 m3 kg-1 (10-395 m3 kg-1, lower and upper limit, respectively) for U(IV) for all in-situ porewater conditions is given. Kd values for U(IV) sorption on MX-80 bentonite in synthetic groundwater reported by Grambow et al. (2006) span a range of ~5-140 m3 kg-1 in the pH range of 7-9. In their model, they predict a maximum Kd around pH 7 of 56 m3 kg-1 and a decrease of two orders of magnitude to pH 10. However, for U(IV) sorption on Kunigel-V1 in equilibrated deionised water at pH 10.1 still a Kd value of 18-28 m3 kg-1 was observed (Berry et al. 2007). For pH 8 and seawater, Berry et al. (2007) measured Kd values even as high as 230 m3 kg-1. Hence, the in-situ Kd value of U(IV) based on analogue consideration with Th is well supported by the experimental data for the pH range of 7-8. For a pH > 9, we account for the larger discrepancy between analogue derived and experimental data by an additional uncertainty factor of 1.5. The calculation of Kd values for U(VI) were based on the experimental data of Pabalan & Turner (1997). They determined a U(VI) sorption edge in the pH range of 2-9 for the SAz-1 Ca-montmorillonite (converted to Na form) in a 0.1 M NaNO3 solution. For the two porewaters with pH >9 we used the Kd value reported by Berry et al. (2007) for U(VI) sorption on Kunigel-V1 in equilibrated deionised water at pH 10.1. As the

109
sorption edge of Pabalan & Turner (1997) suggests a continuous decrease in sorption with increasing pH, this approach provides a pessimistic estimate for the high pH porewaters. In all experimental solutions, U(VI) was almost completely present as anionic (hydr)oxo-carbonate complexes according to thermodynamic calculations. This largely reflects the speciation for the U(VI) calculated for the reference and boundary porewaters using the Andra/Thermochimie database. Hence, a speciation CF of 1 is taken and no extra distinction for considering carbonate complexes sorption competitive is required. Best estimate in-situ Kd values for U(VI) span more than two orders of magnitude, ranging from 3.310-2 m3 kg-1 at pH >9 to 6.6 m3 kg-1 at pH 7.23 (brackish water KR6/135/8). The large range of Kd values for total U presented in Table 10-1 reflects the different sorption behaviour of the two oxidation states as well as the strong dependence of U sorption on pH. Table 10-1. Uranium Kd values and limits for reference and bounding porewaters.
The derivation of the suggested Kd values is based on the standard Andra/Thermochimie database. Including the stability constants of ternary earth alkaline uranyl carbonate complexes into the database leads to best estimate Kd values for the saline, brackish and dilute, carbonate rich porewater, which are between 5 and 10 times lower than the Kd values in Table 10-1. This is due to a shifting dominant redox-speciation from U(IV) to U(VI) in the thermodynamic calculations. However, the formation of such complexes in natural systems is still questionable, as discussed in the solubility section for U. We therefore suggest the Kd values based on the standard thermodynamic data of the Andra/Thermochimie database for next safety assessments until the formation of earth alkaline-uranyl-carbonate complexes in porewater systems has been better justified.
10.1.4 Neptunium (Np)
Speciation calculations with the Andra/Thermochimie database show that under in-situ conditions, Neptunium will be present in the tetravalent oxidation state, with the non-charged hydrolysed species (Np(OH)4) accounting for >80 % (Np sorption data sheet in Appendix B2). Some experimental data on Np(IV) sorption on bentonite exist in the open literature. Sabodina et al. (2006) measured a Np sorption edge for a Russian bentonite (CEC 0.27 eq kg-1) at ionic strengths of 0.001, 0.01, and 0.1 M NaClO4. According to speciation calculations, the spiked Np(V) was reduced to Np(IV) and experimental speciation is identical to the expected in-situ speciation. However, Kd values extracted from this study bear a significant uncertainty due to the graphical presentation of sorbed fractions instead of Rd values. The calculated in-situ sorption

110
values based on this dataset range from 86 to 168 m3 kg-1 and are presented in the Np sorption data sheet. Berry et al. (2007) report sorption values for Np (>99.9% Np(OH)4) on Kunigel-V1 for a pH of 10.4 (Eh ~-0.4V, Np initial: 610-9 M). These vary between 5 and 43 m3 kg-1 (scaled to in-situ CEC: 6-56 m3 kg-1) depending on solid-solution ratio and filtration method. Earlier sorption edge measurements on Kunigel-V1 by Nagasaki et al. (1999) would suggest in-situ Kd values between 20 and 30 m3 kg-1. However, speciation calculations indicate a constant oversaturation with respect to amorphous NpO2·2H2O, thus rendering these data less reliable. Due to the uncertainties in the experimental data, we also approached the in-situ Kd values using the actinide Th(IV) as a chemical analogue. This resulted in a Kd value of 63 m3 kg-1 for all relevant porewater conditions, if formation of Th and Np-carbonate surface complexes is assumed. If formation of surface Th and Np carbonate complexes were neglected, higher Kd values would result, because of the stronger Th-carbonate complex compared with the Np-carbonate complex. The in-situ Kd values based on the experimental work of Sabodina et al. (2006), where experimental and in-situ Np-speciation are identical, are higher than the Kd derived from analogue considerations. This is in accordance with LFER, which suggests that the choice of Th as analogue is a conservative one. We therefore - and because of the uncertainties in the experimental data - conservatively propose a best-estimate Kd of 63 m3 kg-1 for all in-situ conditions. The upper and lower uncertainty limits of 395 and 10 m3 kg-1, respectively, include all experimentally derived in-situ Kd values.
10.1.5 Plutonium (Pu)
In-situ sorption values were calculated first using the experimental Pu sorption pH edge on Russian Na-bentonite (Sabodina et al. 2006), which was determined in 0.001M NaClO4 in porewater equilibrated with the bentonite and at atmospheric pCO2. Given the uncertainty associated with the graphical representation of the experimental data (sorbed fractions instead of Rd values) we also approached the in-situ Pu sorption by analogue consideration with Am(III) and Th(IV). The use of two analogues was necessary, because under in-situ porewater conditions Pu will be present in the tri-or tetravalent oxidation state depending on solution pH. In the pH range of 7-8 Pu(III)-carbonate or sulphate complexes dominate (Am-analogue), whereas at a pH of 9-10 Pu(IV)(OH)4 contributes more than 75 % (Th-analogue). As for Am and Th, the largest uncertainty in Pu sorption is associated with the sorption behaviour of Pu-carbonate complexes. Experimental data for Am (next section) and Th (section 10.1.1.) strongly suggest the contribution of these carbonate complexes to the overall sorption. Similarly, speciation calculations of the experimental solutions of Sabodina et al. (2006) at the pH of interest show that highest sorption occurred where Pu-carbonate complexes contribute more than 80% to the overall Pu speciation. We therefore deem it justified to treat Pu-carbonate complexes as sorbing. The in-situ sorption values calculated based on Am and Th as analogue are higher than those derived from the experimental data of Sabodina et al. (2006), except for the brackish KR6/135/8 porewater (99 and 89 m3 kg-1, based on experimental data and analogue considerations, respectively) (Pu sorption data sheet, Appendix B2). For

111
conservative reasons we therefore propose the in-situ Kd values derived from the experimental data of Sabodina et al. (2006) treating Pu-carbonate complexes as sorbing (Table 10-2). The associated uncertainty limits include the Kd values calculated from analogue considerations and both data sets are presented in the Pu sorption data sheet. Pu sorption values measured for pH 9.4 at 60 °C on Kunigel-V1 range from 27 to 87 m3 kg-1, which correspond to 35-114 m3 kg-1 at in-situ CEC, well supporting the chosen in-situ Kd values (Berry et al. 2007). Table 10-2. Plutonium Kd values and limits for reference and bounding porewaters based on the experimental data of Sabodina et al. (2006).
10.1.6 Americium (Am) and Curium (Cm)
The chemistry of americium and curium is very similar, which is reflected in the almost identical speciation of both elements under in-situ conditions (see below and sorption data sheets). Thus, the same sorption behaviour is expected and we will propose one set of Kd values valid for both RN after a discussion of the available experimental data for each RN. For Am the study of Gorgeon (1994) represents the best available experimental sorption data. In this study, the sorption of Am on homo-ionic Na-smectite from Wyoming in 0.1 and 1 M NaClO4 solution over a pH range from 3 to 11 at atmospheric pCO2 was determined (Fig.10-1). The CEC of the Na smectite equals the CEC of the reference bentonite MX-80. Hence, the sorption value experimentally determined for a specific pH (Fig. 10-1) was converted in the in-situ porewater Kd value using only the speciation conversion factor. Speciation calculations show that americium in all in-situ porewaters occurs exclusively in the trivalent oxidation state (Am sorption data sheet, Appendix B2). Am(III)-carbonate complexes contribute between 35 and 90%, except in the brine porewater (> 50 % AmOSi(OH)2
2+) and high alkaline porewater (75% Am(OH)2+). Thus, the
definition of Am-carbonate complexes as sorption competitive or sorbing will significantly influence the derived in-situ sorption values. In the speciation calculation of the experimental solutions, which were considered to be in equilibrium with air and quartz, the high solubility of CO3
2- at alkaline pH resulted in ~100 % anionic Am-carbonate species for the reference pH of 9.6 and 10. The increased sorption values in the high pH range observed in the experiment therefore suggest that the formation of ternary Am-carbonate surface complexes significantly contribute to the overall sorption of americium. It has to be mentioned that the derived Kd values for Am are only valid for the case of Na-smectite. Whereas the sorption edge determined by Bradbury &

112
Baeyens (2006) for Na-smectite in 0.1 M NaClO4 reproduced the data of Gorgeon (1994), Rd values determined for Am sorption on Ca-smectite in 0.066 M CaCl2 solution were up to one order of magnitude lower than in the Na system.
Figure 10-1. Sorption edge of americium on smectite in 0.1M (●) and 1 M (○) NaClO4 solution at atmospheric pCO2. Figure taken from Bradbury & Baeyens (2003a); data from Gorgeon (1994).
Curium sorption on MX-80 bentonite in a rather dilute synthetic groundwater as expected for clay stones, as a function of pH (3-9) was reported by Grambow et al. (2006). For the speciation calculation with the Andra/Thermochimie database of the experimental solution at the pH values of interest, equilibration with quartz was assumed, since CmSiO(OH)3
2+ species already form at relatively low Si concentrations. Using the conversion factor model and the consideration of sorbing Cm-carbonate complexes, as experimentally demonstrated for Am, in-situ Cm Kd values for the pH range of 7-8 were calculated. These are a factor of 1.3 to 2 lower than the corresponding in-situ Kd values calculated for Am based on the data of Gorgeon (1994). Berry et al. (2007) report Kd values of 66 and 130 m3 kg-1 for Cm sorption on Kunigel-V1 at pH 10.1. Considering the different CEC capacities, these data well support the in-situ Kd values determined for Am in the high pH porewaters. We chose the in-situ Kd values derived from the experimental data of Cm for the pH range of 7-8. This is for conservative reasons and for the closer proximity of the experimental bentonite and synthetic porewater composition to the in-situ conditions compared with the experimental solutions used by Gorgeon (1994). For the high pH waters we chose the data for Am, where direct sorption edge measurements were

113
available. Both sorption data sheets are provided separately in Appendix B2 and the best estimate Kd values and associated upper and lower limits are summarised in Table 10-3. Table 10-3. Americium and curium Kd values and limits for reference and bounding porewaters. Two individual sorption data sheets are provided in the Appendix B2 for the different source data.
10.2 Sorption values of the groups IA to VIIA
10.2.1 Carbon (C)
Organic Carbon: 14C bound in organic carbon species has to be considered as non-sorbing. Inorganic Carbon: The sorption mechanism of inorganic 14C is different from most other radionuclides. Carbon is more efficiently bound through the incorporation in carbonate minerals than through other sorption processes. The removal of 14C is therefore driven by isotopic exchange, which results in the incorporation of 14C in the solid phase. The sorption of 14C therefore depends on the amount of calcite present in the bentonite, which could take part in the isotopic exchange and on the 14C concentration of the porewater. Because no final information on the mineralogy of the in-situ bentonite is available, the MX-80 bentonite is used as a best approximation. Bradbury & Baeyens (1997a) estimated for MX-80 that the fraction of bulk calcite accessible for isotopic exchange is 0.27 %. With 0.7 weight % calcite in the MX-80 bentonite (Müller-Vonmoos & Kahr 1983), the maximal exchangeable C is calculated to be around 1.910-4 mol per kg bentonite. The Kd value is then given by the ratio of the exchangeable C and the C concentration in the porewater, as equilibrium between both phases is assumed. The main uncertainty in these calculations lies in the calcite fraction accessible for isotopic exchange. We addressed this uncertainty by setting the exchangeable fraction to 1 % and 0.1 % for the calculation of upper and lower limit Kd values. Table 10-4 summarises the parameters used and the calculated Kd values for inorganic 14C, no extra sorption data sheet is provided.

114
Table 10-4. Inorganic carbon Kd values based on isotopic exchange with calcite and parameters used in calculation. No extra sorption data sheet is provided.
C inorg.
Saline KR20/465/1
Brackish KR6/135/8
Dilute, carbonate
rich KR4/81/1
Brine KR4/861/1
High alkaline Glacial melt water
pH porewater 7.8 7.23 7.69 7.42 10 9.62
C conc. porewater (mol L-1)
Calcite in bentonite (w.%)
Calcite 14C exchange (0.27 % of total calcite for best estimate Kd)
Molar weight calcite (g mol-1)
Ex. CO32- in calcite (mol kg-1)
Calculated best estimate Kd
(m3 kg-1)1.9E-04 2.1E-04 5.1E-05 2.2E-03 1.9E-02 6.7E-04
Kd upper limit (1% of calcite exchangeable)
7.1E-04 7.8E-04 1.9E-04 8.1E-03 7.0E-02 2.5E-03
Kd lower limit (0.1% of calcite exchangeable)
7.1E-05 7.8E-05 1.9E-05 8.1E-04 7.0E-03 2.5E-04
100
1.9E-04
0.7
0.27
9.8E-04
10.2.2 Caesium (Cs)
Caesium sorption on Na-montmorillonite occurs via cation exchange. Hence, Cs+ is therefore the only species considered as sorbing. In all reference and bounding porewaters Na is the dominant cation. The sorption of Cs is therefore characterised by a monovalent exchange of Na and Cs and is inversely proportional to the Na concentration. The following relationship can be formulated, which considers the competition effect between Cs and Na in the experimental and reference waters (Bradbury & Baeyens 2003a):
porewater
lab
labd
corrected Na labd
(Na)
(Na)
(Cs)K
(Cs)K (10-1)
Bradbury & Baeyens (2011a) measured Kd values for Cs sorption on MX-80 bentonite in synthetic porewater (0.568 M Na) for Cs concentrations between 510-9 and 510-2 M. At trace Cs concentrations (<10-8 M) a Kd of 510-2 m3 kg-1 was determined. Similarly, Grambow et al. (2006) report Cs sorption isotherms for MX-80 and synthetic groundwater. This groundwater was characterised by significantly lower Na concentration (Na = 0.026 M; I ≈ 0.06 M), and measured Kd values at Cs concentrations ≤10-8 M were around 310-1 m3 kg-1. Based on these experimental Kd values, the in-situ Kd values were calculated using the CF for the Na concentrations and the Cs speciation. Since cation exchange is independent of the pH, no CF for the pH is required. Kd values for in-situ conditions calculated on the basis of the Bradbury & Baeyens (2003a) isotherm are by a factor of 3.6 higher than those based on the data of Grambow et al. (2006). However, given an overall uncertainty factor of 4.5, both sorption values are covered with the upper and lower limits.

115
As a best estimate we propose the Kd values based on Bradbury & Baeyens (2003a) for Na-porewater concentrations > 0.1M and those based on Grambow et al. (2006) for Na <0.1M (Table 10-6). Thus the source data with Na-concentrations in experimental solutions best reflecting the respective in-situ Na concentration were applied. For the very dilute glacial melt porewater, a very high Kd value of 6.2 m3/kg results by applying this approach. This value is subject to a large uncertainty because of the lack of data at such low ionic strengths. Moreover, using such high Kd values to derive effective diffusivities from the "internal" or interlayer diffusion coefficient (see section 8.3.1, eq. 8-15) yields unrealistically high De values. In view of this we conservatively propose a Kd value for this dilute water assuming a 10 times higher sodium concentration in the porewater. Van Loon & Glaus (2008) showed that compaction of bentonite (Volclay KWK) to dry densities higher than 1300 kg m-3 significantly increased the sorption selectivity for Cs+, due to a reduction of the interlayer space and the low hydration tendency of Cs+ compared with Na+. The proposed Kd values can therefore be considered as conservative estimates for the in-situ bentonite conditions.
Table 10-5. Caesium Kd values and limits for reference and bounding porewaters based on Bradbury & Baeyens (2003a) (B&B) or Grambow et al. (2006) (Grambow).
Caesium (Cs)
Saline KR20/465/1
Brackish KR6/135/8
Dilute, carbonate
rich KR4/81/1
Brine KR4/861/1
High alkaline Glacial melt water
Literature source B&B B&B Grambow B&B B&B Grambow
Kd porewater (m3 kg-1) 6.2E-02 2.1E-01 4.3E-01 2.4E-02 2.8E-01 6.2E-01
Kd upper limit (Kd x UF) 2.8E-01 9.5E-01 1.9E+00 1.1E-01 1.2E+00 2.8E+00
Kd lower limit (Kd / UF) 1.4E-02 4.7E-02 9.6E-02 5.3E-03 6.2E-02 1.4E-01
10.2.3 Strontium (Sr)
Strontium sorption dominantly occurs via cation exchange, and surface sorption only plays a subordinate role. Sorption via cation exchange is very sensitive to porewater composition, i.e. the concentration of competing cations, but it is independent of pH. Sorption models with bentonite specific cation exchange selectivity coefficients allow to directly account for Sr speciation and the porewater chemistry. We therefore calculated the in-situ Kd values with a thermodynamic sorption model using the cation exchange selectivity coefficients determined for MX-80 bentonite of Bradbury & Baeyens (2002a). The sorption behaviour of radiogenic and stable Sr is considered identical and we therefore used the total Sr concentrations in the porewaters (Table 6-1) as initial Sr concentrations in the sorption model.The amount of external surface sites was defined according to Wieland et al. (1994) and a diffuse double layer was modelled with the Poisson-Boltzmann equation (Borkovec & Westall 1983) (PHREEQC keyword "diffuse_layer"). The thickness of the DDL depends on the ionic strength and was calculated for each in-situ porewater using the reciprocal Debye length (Stumm & Morgan 1996) and a Debye factor of 1.2 (Appendix C). In this model, the low ionic strengths in the dilute, carbonate rich and glacial melt bounding porewaters result in a free porosity close to zero, showing the limitations of this model. The minimisation of

116
the free porewater would generally result in an increasing proportion of Sr in the DDL and therefore increasing Kd values. However, due to the low ionic strength in these waters, competition for the interlayer sorption sites is low and most Sr (>98 %) is sorbed via cation exchange. Hence, surface sorption is of negligible importance for Sr and no modification of the diffuse double layer thickness in the sorption model was deemed necessary. For the very dilute glacial melt porewater, a very high Kd value of 1.2 m3 kg-1 results by applying this approach. In the same way as for Cs, this value is subject to a large uncertainty because of the lack of data at such low ionic strengths. Moreover, using such high Kd values to derive effective diffusivities from the "internal" or interlayer diffusion coefficient (see section 8.3.1, eq. 8-14) yields unrealistically high De values. In view of this we conservatively derived a Kd value for this dilute water assuming a ten times higher sodium concentration in the glacial melt porewater. Furthermore, to account for the model limitation, we increased the uncertainty factor for the two dilute bounding porewaters from 6 to 8. More information on model parameters is available in the strontium sorption data sheet (Appendix B2). The resulting Kd values are presented in Table 10-6. Table 10-6. Strontium and radium Kd values and limits for reference and bounding porewaters. The same values apply for radium (see section 10.2.4)
10.2.4 Radium (Ra)
Radium shows similar chemical behaviour as strontium. For the same reasons as discussed for Sr we chose a sorption model for the determination of in-situ sorption values. Since no appropriate selectivity coefficient for Ra was available in literature Sr was taken as analogue to derive sorption values. Because Sr occurs in much higher concentrations in the in situ porewater than radiogenic Ra from natural and waste-derived sources, the effect of lower concentration was tested with the cation exchange model presented in section 10.2.3 for Sr. This showed only a small influence on resulting Kd values, as shown in the radium sorption data sheet (Appendix B2). Therefore, the same Kd values as for Sr2+ (Table 10-6) are proposed.
10.2.5 Selenium (Se)
In the porewaters of the bentonite system, selenium is stable in the oxidation state (-II). Whereas several studies exist concerning the sorption of selenite (SeIV), no literature data exist on the sorption of selenide species on bentonite or pure smectites. Given the

117
dominance of the anionic Se species (HSe- or Se4-2 (glacial melt water)) (Se sorption
data sheet in Appendix B2) we propose a Kd of 0 for Se under the prevailing porewater conditions.
10.2.6 Tin (Sn)
Under in-situ porewater conditions, Sn is present in the tetravalent oxidation state. At a pH below 7.6, the neutral Sn(OH)4 species dominates, whereas at higher pH the anionic Sn(OH)5
- or Sn(OH)62- species prevail (Sn sorption data sheet in Appendix B2).
Bradbury & Baeyens (2003a) report a Sn sorption edge on conditioned SWy-1 Na montmorillonite in 0.1 M NaClO4. They observed constantly high Rd values of 890 m3 kg-1 for pH 4-7.5, decreasing to ~100 m3 kg-1 at pH >10. However, saturation indices calculated with the Andra/Thermochimie database indicate that Sn equilibrium concentrations in the experiments could be governed by SnO2 (am) precipitation. We therefore chose not to use the experimental Sn data but Th as an analogue. In contrast to Sn, Th does not form anionic hydroxide species. We accounted for this by restricting the sorbing fraction of Sn to the neutral Sn(OH)4 species. Th-carbonate complexes were considered as sorbing for the calculation of the speciation conversion factor. The resulting Kd values are summarised in Table 10-7. Table 10-7. Tin (Sn) Kd values and limits for reference and bounding porewaters.
10.2.7 Beryllium (Be)
Be has a much larger first hydrolysis constant compared with the other elements of group II. Thus, Be in solution is mainly present as hydrolysed Be and the contribution of free Be2+ is negligible (beryllium sorption data sheet in Appendix B2). Therefore, sorption via cation exchange is not very likely for Be and an adaptation of the sorption model of Sr and Ra is not advisable. The in-situ sorption data for Be in the bentonite buffer and the backfill were therefore calculated with the conversion factor approach. Ramesh et al. (2002) investigated the sorption of Be on a bentonite obtained from Indian Petro Chemicals Limited, Vadodara, India in the pH range of 1 to 8. The exchange capacity of the bentonite was given as 0.8 eq/kg and experiments were carried out with a solution of 30 mg L-1 Be (BeSO4·4H2O in double distilled deionized water) and a solid/liquid ratio of 5g/100ml. A Langmuir adsorption isotherm at pH 5 indicated a capacity of the bentonite for Be of 0.353 mmol g-1. In the pH range of 4-8, a constant Rd value of 0.182 m3 kg-1 was measured. However, initial Be concentrations in the experiments at near neutral pH exceeded the solubility limits, leaving considerable uncertainty to the data. However, in-situ sorption data based on the experimental data of Ramesh et al. (2002) were calculated for comparison and can be found in the Be sorption data sheet in Appendix B2.

118
You et al. (1989) reported Be sorption data for illite and montmorillonite in river and seawater. In these experiments, the addition of carrier-free Be-7 isotopes only resulted in a small concentration increase. Kd values determined for illite and montmorillonite in river water as well as illite in sea water varied between 180 and 360 m3 kg in the pH between 6 and 10. For Be sorption on montmorillonite in sea water a Kd around 50 m3 kg-1 was found. This data set was used to calculate best-estimate in-situ sorption data of beryllium, as also suggested by Hakanen et al. (2014) for the Olkiluoto far-field. Beryllium sorption on montmorillonite in sea water was conservatively selected as source data for all waters except the dilute, carbonate rich and glacial melt water, where the fresh water data was used. For the derivation of in-situ sorption data, only the free and hydrolysed Be species were considered sorbing. The different cation exchange capacities of montmorillonite and MX-80 reference bentonite were included by a CFCEC of 0.75. The upper limit was calculated as the best estimate Kd multiplied by the total UF of 6.3 (Table 10-8). Given the large discrepancies between the experimental data by Ramesh et al. (2002) and You et al. (1989), the lower limit Kd of Be was derived by analogue consideration with Ni. Ni was proposed as Be analogue by NAGRA for the Opalinus Clay (Bradbury & Baeyens 2003b), because the chemical properties of Be resemble more the ones of the divalent transition metals rather than the other alkaline earth metals. However, the speciation of Ni and Be in the reference and bounding porewaters differ significantly and the higher first hydrolysis constant would, according to the Linear Free Energy Relationship, suggest a stronger sorption of the Be complex than of Ni. We thus deem it justified to use the best estimate Ni-analogue derived Kd values as lower limit. The negatively charged Be(OH)3
- specie at high pH was treated as non-sorbing, since Ni(OH)3
- only play a very subordinate role. These suggest lower limit Kd values are close to the in-situ Kd values calculated based on the experimental data by Ramesh et al. (2002). Table 10-8. Beryllium Kd values and limits for reference and bounding porewaters.
Beryllium (Be) Saline KR20/465/1
Brackish KR6/135/8
Dilute, carbonate rich KR4/81/1
Brine KR4/861/1
High alkaline
Glacial melt water
Kd porewater (m3 kg-1)
3,9E+01 3,9E+01 1,2E+02 3,3E+01 4,2E+01 1,3E+02
Kd upper limit 2,5E+02 2,5E+02 7,7E+02 2,0E+02 2,7E+02 8,4E+02
Kd lower limit 6,5E-01 2,6E-01 5,7E-01 2,7E-01 7,4E-01 1,5E+00
10.2.8 Iodine (I)
Iodine is almost exclusively present as the anion I-. Sorption of I- on geological materials have been found to be very low. Bradbury & Baeyens (2003a) report a Kd value of ~510-4 m3 kg-1 for sorption of I- on MX-80 at pH of 7.5. In more recent anoxic experiments however, Bradbury & Baeyens observed no measurable sorption of I- o MX-80 (Bradbury & Baeyens 2010). We therefore propose to use a Kd of 0 for all cases. No sorption data sheet for iodine is provided.

119
10.2.9 Chlorine (Cl)
Chlorine is almost exclusively present as the anion Cl-. Given the negligible anion exchange capacity of clays at neutral to alkaline pH and the high background Cl- concentrations in most reference and bounding porewaters, a Kd of 0 for all in-situ conditions has to be assumed. No sorption data sheet for Cl is provided.
10.3 Sorption values of the transition elements IB to VIIIB
10.3.1 Zirconium (Zr)
Maximum zirconium concentrations in the porewaters range from 1.1 - 1.8 10-8 M (in equilibrium with amorphous Zr(OH)4 solid phases) and all dissolved Zr is present as the neutral Zr(OH)4 species according to speciation calculation with the Andra/ Thermochimie database (Zr sorption data sheet, Appendix B2). However, Ochs & Talerico (2004) and Bradbury & Baeyens (2003a) report an increasing importance of the anionic Zr(OH)5
- species at circum-neutral pH. This species is not included in the present database. Since no relevant experimentally determined sorption data of Zr was found in literature, Th(IV), which is also forming Th(OH)4 species is used as an analogue. Th-carbonate complexes were considered sorbing. In the simple conversion factor model, the presence of Zr(OH)5
- species would not change the calculated in-situ Kd values. But we accounted for the larger uncertainty of the role of Zr(OH)5
- species in sorption by doubling the UFspec for the calculation of the lower limit. This results in a best estimate Kd for Zr of 63 m3 kg-1 (lower limit 5 m3 kg-1) for all in-situ porewaters.
10.3.2 Nickel (Ni)
The derivation of in-situ Kd values for Ni is based on the sorption isotherm for MX-80 bentonite and synthetic porewater determined by Bradbury & Baeyens (2003a). In the Ni concentration range of 510-8 - 510-6 M a constant sorption value of 0.32 m3 kg-1 was measured. For the speciation conversion factor, the Ni speciation in the experimental synthetic porewater was re-calculated with the Andra/Thermochimie database, as for the in-situ reference waters at Ni concentrations of 10-6 and 10-8 M (Ni sorption data sheet in Appendix B2). In the pH range of 7-8 free Ni2+, Ni-chloro and Ni-sulphate complexes dominate depending on the prevalent anion in the porewater. At high pH, Ni is mainly present as the neutral Ni-hydroxide. Speciation conversion factors for the assumption of sorbing or sorption competitive Ni-carbonate complexes were almost identical due to the negligible formation of Ni-carbonate species. A pH conversion factor was obtained from the Ni sorption edge measurements on Na-montmorillonite (SWy-1) in 0.1 M NaClO4 by Baeyens & Bradbury (1997). Measuring and modelling of Ni sorption on Ca-montmorillonite indicated that sorption parameters for the Na and Ca form are identical within the uncertainty (Bradbury & Baeyens 1999). Table 10-9 summarises the best estimate and upper and lower limit Kd values for the in-situ porewaters (based on CFspec with CO3 compl). The higher pH in the high alkaline and glacial melt water porewaters results in a Kd value one order of magnitude higher than for the approximately neutral porewaters. Ni sorption values in the brine porewater are particularly low, because NiCl+ complexes (>70 %) are considered entirely sorption competitive in the simplistic conversion model. This Kd value can therefore be regarded as a very conservative estimate (see section 9.2).
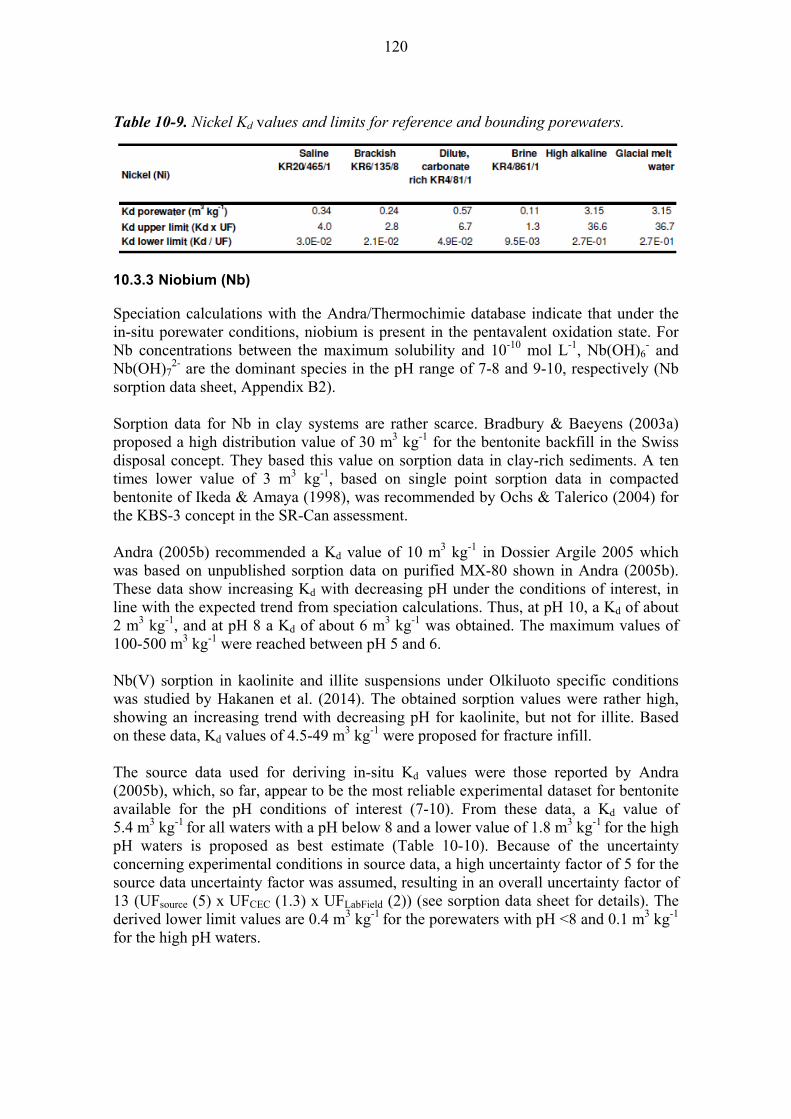
120
Table 10-9. Nickel Kd values and limits for reference and bounding porewaters.
10.3.3 Niobium (Nb)
Speciation calculations with the Andra/Thermochimie database indicate that under the in-situ porewater conditions, niobium is present in the pentavalent oxidation state. For Nb concentrations between the maximum solubility and 10-10 mol L-1, Nb(OH)6
- and Nb(OH)7
2- are the dominant species in the pH range of 7-8 and 9-10, respectively (Nb sorption data sheet, Appendix B2). Sorption data for Nb in clay systems are rather scarce. Bradbury & Baeyens (2003a) proposed a high distribution value of 30 m3 kg-1 for the bentonite backfill in the Swiss disposal concept. They based this value on sorption data in clay-rich sediments. A ten times lower value of 3 m3 kg-1, based on single point sorption data in compacted bentonite of Ikeda & Amaya (1998), was recommended by Ochs & Talerico (2004) for the KBS-3 concept in the SR-Can assessment. Andra (2005b) recommended a Kd value of 10 m3 kg-1 in Dossier Argile 2005 which was based on unpublished sorption data on purified MX-80 shown in Andra (2005b). These data show increasing Kd with decreasing pH under the conditions of interest, in line with the expected trend from speciation calculations. Thus, at pH 10, a Kd of about 2 m3 kg-1, and at pH 8 a Kd of about 6 m3 kg-1 was obtained. The maximum values of 100-500 m3 kg-1 were reached between pH 5 and 6. Nb(V) sorption in kaolinite and illite suspensions under Olkiluoto specific conditions was studied by Hakanen et al. (2014). The obtained sorption values were rather high, showing an increasing trend with decreasing pH for kaolinite, but not for illite. Based on these data, Kd values of 4.5-49 m3 kg-1 were proposed for fracture infill. The source data used for deriving in-situ Kd values were those reported by Andra (2005b), which, so far, appear to be the most reliable experimental dataset for bentonite available for the pH conditions of interest (7-10). From these data, a Kd value of 5.4 m3 kg-1 for all waters with a pH below 8 and a lower value of 1.8 m3 kg-1 for the high pH waters is proposed as best estimate (Table 10-10). Because of the uncertainty concerning experimental conditions in source data, a high uncertainty factor of 5 for the source data uncertainty factor was assumed, resulting in an overall uncertainty factor of 13 (UFsource (5) x UFCEC (1.3) x UFLabField (2)) (see sorption data sheet for details). The derived lower limit values are 0.4 m3 kg-1 for the porewaters with pH <8 and 0.1 m3 kg-1
for the high pH waters.

121
Table 10-10. Niobium Kd values and limits for reference and bounding porewaters.
Niobium (Nb)
Saline KR20/465/1
Brackish KR6/135/8
Dilute, carbonate
rich KR4/81/1
Brine KR4/861/1
High alkaline Glacial melt water
Kd porewater (m3 kg-1) 5.4 5.4 5.4 5.4 1.8 1.8
Kd upper limit (Kd x UF) 70.6 70.6 70.6 70.6 23.5 23.5
Kd lower limit (Kd / UF) 0.4 0.4 0.4 0.4 0.1 0.1
10.3.4 Molybdenum (Mo)
Molybdenum occurs under all reference and bounding porewater conditions exclusively as the anionic MoO4
2- species (≥ 99.9 %). Such oxo-anionic species are expected to sorb only weakly and sorption usually decreases with increasing pH. No molybdate sorption data on bentonite was found in literature. However, Motta & Miranda (1989) measured sorption isotherms of molybdate in 0.01 M NaCl and at 25 °C as well as 40 °C on montmorillonite at pH ≈ 4-4.5, and on illite at pH 8.2-8.9. From the isotherm for montmorillonite, a Kd of about 0.3-1 m3 kg-1 and from the isotherm for illite a Kd of 0.005 m3 kg-1 can be extracted. Goldberg et al. (1996) measured molybdate pH sorption edges (pH 2-12) for montmorillonite, illite and kaolinite.Sorption strongly decreased with increasing pH and could not be distinguished from zero at pH >7. At pH <5, where sorption could be well measured, strongest sorption was observed for montmorillonite. For the determination of sorption parameters for the far-field, Hakanen et al. (2014) measued Mo pH sorption edges (pH 6.5-9.5) for kaolinite KGa-1b and illite IMt-1 in a fresh and saline water representative for the Olkiluoto site. For kaolinite Rd values between 0.02 and 0.2 m3 kg-1 were determined in the pH range of 6.5 to 9, with no significant difference for the two waters. Sorption on illite showed a significant decrease with increasing pH and a strong dependency on the water type. In the fresh water, Rd values decreased from 0.2 m3 kg-1 at pH 6.5 to about 0.02 m3 kg-1 at pH 9. In the saline water, Rd values decreased from 0.1 m3 kg-1 at pH 6.5 to 7·10-4 m3 kg-1 at pH 9.3. Based on this experimental work, we deem it justified to consider sorption of Mo under in-situ conditions. For the derivation of in-situ Kd values we conservatively select the pH sorption edge on illite in saline solution, which exhibits the strongest pH dependency, as source data. Given the uncertainty in the relevant sorption sites, we do not use the CEC capacity to scale the experimental data on illite to MX-80 but rather assume sorption on montmorillonite to be equal to sorption on illite. Thus only the montmorillonite fraction in MX-80 is used for scaling. No scaling for speciation is required, as Mo is not complexed by other ions. Considering the UF for the source data, the scaling to bentonite (UFCEC is used) and the Lab-Field transfer an overall uncertainty factor of 4.16 results. However, in order to account for the conflicting literature data of Goldberg et al. (1996), who did not observe significant Mo sorption at pH >7, we added an extra UF of 5 for the determination of the lower limit Kd. Table 10-11 summarises the best estimate and lower/upper limit in-situ Kd values for Mo.

122
Table 10-11. Molybdenum Kd values and limits for reference and bounding porewaters.
Molybdenum (Mo)
Saline KR20/465/1
Brackish KR6/135/8
Dilute, carbonate rich
KR4/81/1
Brine KR4/861/1
High alkaline Glacial melt water
Kd porewater (m3 kg-1) 7.5E-03 2.1E-02 7.5E-03 1.5E-02 1.5E-04 3.4E-04
Kd upper limit (Kd x UF) 3.1E-02 8.7E-02 3.1E-02 6.2E-02 6.2E-04 1.4E-03
Kd lower limit (Kd / UF) 3.6E-04 1.0E-03 3.6E-04 7.2E-04 7.2E-06 1.6E-05
10.3.5 Technetium (Tc)
The relevant oxidation states of technetium in groundwaters are VII and IV. Speciation calculations with the Andra/Thermochimie database indicate that under in-situ porewater conditions, Tc will almost exclusively occur in the tetravalent state as the neutral TcO(OH)2 and at high pH also as the anionic TcO(OH)3
- species (Tc sorption data sheet in Appendix B2). No relevant sorption edge data for Tc(IV) were found in literature. We therefore use Th(IV) as analogue for the calculation of in-situ Kd values as already suggested in Ochs & Talerico (2004). At circum-neutral pH Th(IV) is also largely present as a non-charged hydrolised species (Th(OH)4), which is however not identical to the dominant Tc species. We account for the potential different sorption behaviour with an additional UF of 3 for the calculation of the lower limit. An additional difference between the two elements is the formation of carbonate complexes, which play a significant role in the speciation of Th but not of Tc. The consideration of sorbing carbonate complexes, justified for Th in section 10.3.1 therefore represents the more conservative approach in this case. The use of Th as analogue for Tc results in a best estimate Kd for Tc for all in-situ porewaters of 63 m3 kg-1 with a lower limits of 3 m3 kg-1 (Table 10-12). Berry et al. (2007) provide single point sorption measurements of Tc(IV) on Kunigel-V1 bentonite at pH 8.2 (equilibrated seawater) and pH 10 (equilibrated de-ionised water). The Kd values in these experiments are significantly lower with 6.9-8.8 and 1.5-1.7 m3 kg-1 at pH 8.2 and 10, respectively. Considering a CF for the CEC we therefore propose a best estimate Kd of 2 m3 kg-1 for the high alkaline and glacial melt bounding porewaters. Table 10-12: Technetium Kd values and limits for reference and bounding porewaters.
10.3.6 Palladium (Pd)
No relevant and reliable sorption data were found for palladium in the literature. Bradbury & Baeyens (2003a) and Ochs & Talerico (2004) suggest to use either of the chemical analogues Ni, Co, or Pb, despite their weaker hydrolysis constant. We chose Ni (including carbonate complexes) as analogue, for which sorption isotherms for MX-80 bentonite were available. Speciation calculations indicate that for all considered in-

123
situ porewaters, except for the brine, Pd will almost exclusively be present as Pd(OH)2 (concentration range from 10-10 mol L-1 up to the solubility limit of Pd(II) of ~410-6 mol L-1) (Pa sorption data sheet in Appendix B2). In comparison, Ni speciation in the pH range of 7-8 is dominated by free Ni2+. The Pd Kd values for these porewaters (saline, brackish, dilute, carbonate rich) can therefore be regarded as a very conservative estimate, because hydrolysed species are considered to sorb significantly stronger than free cationic species. In the brine porewater, ~99 % Pd-chloro-complexes can be expected due to the high Cl- concentrations. For this specific case, Pd sorption values are two orders of magnitude lower than for the other porewater conditions. The calculated Kd values are summarised in Table 10-13. Table 10-13. Palladium Kd values and limits for reference and bounding porewaters.
10.3.7 Silver (Ag)
Speciation calculations with the Andra/Thermochimie database show that in all in-situ porewaters, except the glacial melt water, Ag will entirely be present as Ag-chloro-complexes, which are assumed non-sorbing. Hence, Ag is considered as a non-sorbing RN in all in-situ porewaters except the glacial melt water. In the glacial melt water, 64 % free Ag+ can be expected. Kahn et al. (1995) measured sorption of Ag on a Pakistan bentonite (CEC= 0.77 eq kg-1) in 0.1 M NaNO3 solution. They observed a rather steep sorption edge in the pH region of 7.5 to 9, which does not coincident with Ag+ contributing nearly 100 %. Thus, we conservatively neglected this increasing Kd with increasing pH and base the in-situ Kd calculation on the experimentally determined Kd at pH 6.5 and a Ag concentration of 10-9 Mol, which is 3.2·10-2 m3 kg-1. The effect of the higher upper concentration limit in the buffer porewater (1·10-6 M in equilibrium with AgCl), which is not likely to finally occur in the porewater, was neglected in favour for the consistency with the far-field database by Hakanen et al. (2014). The experimentally determined Kd were scaled using the fraction of Ag+ in the glacial melt water and the CEC capacities of the experimental and MX-80 bentonite. Thus, an in-situ Kd of 2.1·10-2 m3 kg-1 is recommended for the glacial melt water. The uncertainty factor is calculated by also considering the uncertainty in the pH effect, resulting in an upper and lower limit of 3.2·10-1 m3 kg-1 and 1.4·10-3 m3 kg-1, respectively.
10.4 Sorption values of the lanthanides
10.4.1 Europium (Eu)
As for the actinides, a large uncertainty is associated with the formation and sorption behaviour of Eu-carbonate complexes. Speciation calculations indicate that under in-situ

124
groundwaters conditions, Eu-carbonate complexes could account from 0 (brine KR4/861/1) to more than 90 % (dilute, carbonate rich KR4/861/1) of the total Eu (Eu sorption data sheet in Appendix B2). We therefore compared in-situ sorption data derived by the conversion factor approach with those calculated with a sorption model using the surface complexation reactions and constants determined by Marques Fernandes et al. (2008). In the conversion factor approach, in-situ sorption values for Eu were calculated from the Eu sorption isotherm on MX-80 bentonite in synthetic groundwater measured by Bradbury & Baeyens (2003a) and an Eu sorption edge on Na-montmorillonite (SWy-1) determined in CO2-free 0.1 M NaClO4 (Bradbury & Baeyens 2002c). For the saline and dilute, carbonate rich water, the sorption edge on Na-montmorillonit (SWy-1) determined in 0.1 M NaClO4 at atmospheric pCO2, measured by Marques Fernandes et al. (2008), was chosen due to its closer similarity to the in-situ conditions. Under the CO2-free experimental conditions of Bradbury& Baeyens (2003), Eu sorption increased until the highest experimental pH (9.5). For the high alkaline porewaters, the pH conversion factor was conservatively determined with the Rd value measured at pH 9. For the sorption model we used the surface complexation constants and selectivity coefficient as determined and summarised in Marques Fernandes et al. (2008). They determined the Eu sorption edge on Na-montmorillonite (SWy-1) at equilibrium with atmospheric pCO2 and at constant TIC concentration of 20 mM. Eu sorption at atmospheric pCO2 above pH ~8 (TIC 0.61 mM) and at 20 mM TIC above pH 7.4 was lower compared with Eu sorption in the absence of carbonate. They modelled the experimental sorption data with a 2-site protolysis non-electrostatic surface complexation and cation exchange model by including surface complexation reactions on the strong site for ≡SsOEuCO3
0 and ≡SsOEuOHCO3-. For the modelling of in-situ Eu
sorption, we estimated a strong site capacity of 5.5 mmol L-1 porewater based on the strong site capacity of 2 mmol kg-1 montmorillonite as proposed by Bradbury & Baeyens (2005), a bentonite montmorillonite content of 75 % bentonite, and a target dry density of 1570 kg m-3 (Eu sorption data sheet in Appendix B2). In Figure 10-2 the in-situ Kd values obtained with the sorption model and the conversion factor approach are compared. Kd values from the sorption model are significantly higher than those calculated with the conversion factor approach. We therefore neglect these Kd values for conservative reasons. However, the work of Marques Fernandes et al. (2008) demonstrated that Eu carbonate complexes contribute to the overall sorption of Eu. Similarly, Ochs & Talerico (2004) showed that Da values based on Kd values considering Eu-carbonate complex sorption were well in accordance with experimentally determined Da values. Therefore, we suggest the Kd values based on the conversion factor approach assuming Eu-carbonate complex sorption as best estimate (Table 10-14). Kd values determined under the assumption of sorption competitive Eu-carbonate complexes are within the uncertainty range, except for the dilute, carbonate rich porewater. Bradbury & Baeyens (2002c) compared the sorption of Eu on Ca and Na-montmorillonite. Eu binding constants for the Na system were between 0.3 and 1 log units higher than for the Ca system. Hence, the Kd values summarised in Table 10-14 are only valid for the case of in-situ Na-bentonite. If a Ca-bentonite is chosen, the lower limit Kd values should be applied as best estimate.

125
Table 10-14. Europium Kd values and limits for reference and bounding porewaters.
1 E‐01
1 E+00
1 E+01
1 E+02
1 E+03
1 E+04
Saline
KR20/465/1
Brackish
KR6/135/8
Dilute,
carbonate
rich
KR4/81/1
Brine
KR4/861/1
High alkaline Glacial melt
water
Eu K
d (m
3 kg‐
1)
sorptionmodel
CF withsorption ofCO3‐complexes
CF no sorptionof CO3complexes
Figure 10-2. Comparison of Eu in-situ Kd values derived from the sorption model of Marques Fernandes et al. (2008), and with the conversion factor approach treating Eu-carbonate complexes either as sorbing or sorption competitive. Error bars indicate the upper and lower limit Kd values for the recommended Kd.
10.4.2 Samarium (Sm)
No relevant sorption data for samarium was found in literature. The calculation of in-situ Kd values is therefore based on Eu as a chemical analogue. The speciation of Sm was calculated with the Andra/Thermochimie database and closely followed the speciation of Eu. Hence, the best estimate in-situ Kd values for Sm are almost identical to those of Eu, whereas the upper and lower limits reflect the additional uncertainty introduced by the Sm speciation (Table 10-15).
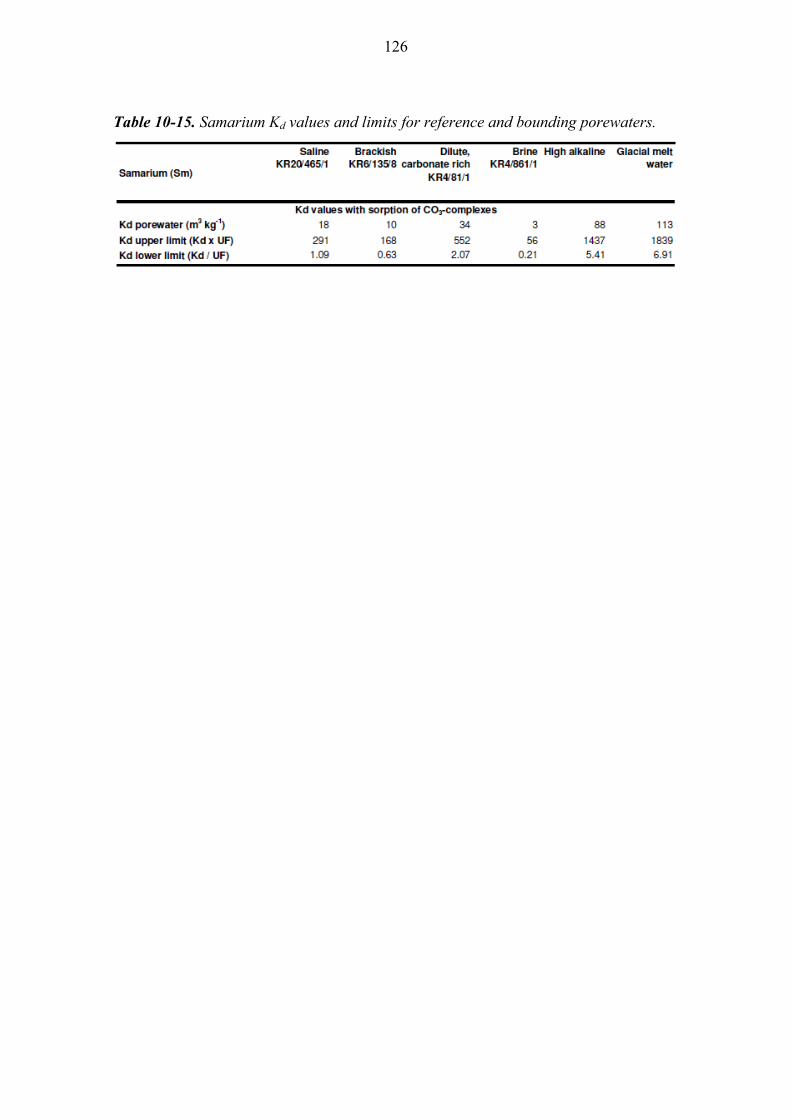
126
Table 10-15. Samarium Kd values and limits for reference and bounding porewaters.

127
11 DISCUSSION OF SORPTION DATA
11.1 Sorption competition
Most in-situ sorption values derived in this report are based on experimental data obtained in single radionuclide-bentonite/montmorillonite systems. However, the sorption and thus migration of a RN in nature might be influenced by sorption competition with other RN or major ions in the porewater. Sorption values based on sorption isotherms performed with synthetic porewaters already account for a potential competition effect for sorption sites between the major cations and metals originating from the clay in the porewater (Th, Cm, Cs, Ni, Co, Eu). Ra, Sr, and Cs, which mainly sorb via cation exchange, would be the RN affected most by competitive effects of major cations in solution (Ochs et al. 2003). The sorption values of these RN were calculated with sorption models or were based on the exchange with Na and therefore took into account the solution composition and cation exchange selectivity of the relevant elements. Experimental data by Bradbury & Baeyens (2005) suggest that sorption competition only occurs between RN with the same valence and a similar hydrolysis behavior. Thus, they anticipate competitive effects within the group of divalent cations (e.g. Ni, Co, Zn, Fe), within the trivalent actinides and lanthanides, and within the group of the tetravalent actinides. But according to their data no competition between RN of different groups would be expected. This is in line with the observations that carbon steel corrosion products (particularly Fe(II)) did not affect the sorption behavior of the tetravalent actinide Np (Xia et al. 2005), whereas Fe(II) in solution significantly reduced Ni(II) sorption on Opalinus Clay (Bradbury & Baeyens 2011b). This indicates that RN sorption occurs at different sets of the sorption active sites, specific for each group of RN (Bradbury & Baeyens 2005). Generally, according to the model of Bradbury & Baeyens (2005), RN sorption could be associated with cation exchange sites and strong and weak ≡SOH sites. However, high sorption at RN trace levels occurs dominantly at strong sorption sites (Bradbury & Baeyens 2005). In the experiments described above, concentrations of the competitive RN were chosen to be more than sufficient to saturate all strong sorption sites. Recently, Galunin et al. (2011) showed that sorption competition would mainly affect sorption at weak sites and therefore only be relevant if all strong sorption sites were fully occupied. Thus, competition effects on the sorption behavior of RN under in-situ conditions will largely depend on the proportion of strong sorption sites occupied by the different RN groups. In a first simplified evaluation of the relative pool sizes, the reaction of RN saturated porewater with "fresh" bentonite is considered. Because no information on the size of the different groups of strong sorption sites exists, we can only compare the total amount of strong sorption sites with the overall maximum RN concentration in the porewater. Bradbury & Baeyens (2005) propose a capacity of 2 mmol kg-1 montmorillonite for the strong sorption sites. With a bentonite dry density of 1570 kg m-3 and a montmorillonite content of 75 % (Table 1-1), an in-situ strong site capacity of 5.5 mmol L-1 porewater results. The sums of sorbing fractions based on RN

128
solubility in the porewaters and the RN speciation of all RN range from 5.210-3 mmol L-1 (glacial melt water) to 1.310-1 mmol L-1 (in brine KR4/861/1). From this it follows that RN would occupy less than 1 % (except for brine: 2.5 %) of the available strong sorption sites. Thus, the high availability of sorption sites in compacted bentonite in the early phases after canister failure will largely suppress competition effects between RN. However, it should be noted that this consideration is too simplified. The occupation of sorption sites at clay surfaces close to the canister will constantly increase with ongoing release of RN from the canister and potential effects of sorption competition in the bentonite will vary with time and the distance to the canister. Thus, a more rigorous assessment of the sorption competition effects would require the incorporation of competition in a reactive transport model.
11.2 General uncertainties
As outlined in sections 1.1 and 5.2, groundwater-born humic substances (HS) might affect speciation and hence sorption of some radionuclides, in particular of trivalent lanthanides and actinides (Hummel et al. 2000). For HS in the ppb range, a maximum sorption reduction effect for Eu of about one order of magnitude for Swiss groundwaters was estimated with the conservative roof approach (Hummel et al. 2000). The effect of water extractable organic matter on the sorption of Ni(II), Eu(III) and Th(IV) in Opalinus Clay was studied by Glaus et al. (2005). It was concluded that the effect of organic matter on sorption in Opalinus Clay was small for all metals (lower than a factor of five) in spite of uncertainties related to the experimental procedures. Concluding from these considerations for the Olkiluoto site, the effect of HS on sorption values in the buffer is rather uncertain in view of the lack of site-specific knowledge. Previous work suggests that the effect is restricted to trivalent metals and for this sorption reduction is less than an order of magnitude. As discussed in section 5.2, recent publications indicate that temperature can affect actinide and lanthanide complexation (Moore 2011; Di Giandomenico & Le Naour 2009; Skerencak et al. 2009; Vercouter et al. 2005) and hydrolysis (Rao et al. 2011; Le Naour et al. 2003; Trubert et al. 2003). The investigated complexes (nitrate-, sulfate-, fluorido- and tri-carbonato complex) tend to be stronger at higher temperature, which might lead to decreasing sorption behavior. However, the effects are rather small in the relevant temperature range (maximum 50 °C, after time required to fill a defective canister) and none of these complexes are expected in the in-situ porewaters. Nevertheless, increasing formation of other potentially sorption competitive complexes cannot be excluded and the temperature effect on complexation should be addressed in future work. Temperature effects on hydrolysis will be small compared with the effects of pH, which is accounted for by the wide range of pH in the bounding porewaters. For some elements, no or only poor experimental sorption data were available. In these cases, in-situ sorption data were derived based on chemical analogue considerations. For some RN-analogue pairs e.g. Sr/Ra, Sm/Eu, this approach is well-established and justified by the almost identical speciation in solution. In the case of U(IV), Np(IV) and Pu comparison between in-situ sorption databased on analogues (Th(IV), Am(III)) or experimental data, show a generally good agreement. In-situ sorption data for the trivalent lanthanoids and actinides (Eu, Am, Cm) based on individual experimental data

129
sets differ by significantly less than one order of magnitude. Similarly, the in-situ Kd values for Ni and Co, which are often used as analogues, correspond fairly well in particular at high pH. Thus, the use of chemical analogues is well supported by experimental data, given their similar speciation in solution. However, for Sn, Zr, Tc (analogue Th) and Pd (analogue Ni), speciation calculations indicate some significant differences. For Sn and Zr the absence of carbonate complexes as observed for Th, and for Pd the stronger hydrolysis constant compared with Ni, suggest that actual sorption might be stronger than determined by analogue considerations. In the case of Tc, the use of Th as analogue implies a rather high uncertainty and some experimental work would be desirable for future SA.
11.3 Comparison with previous assessments
Sorption values used in previous safety assessments were mostly the lower limit Kd values determined in the data and uncertainty assessment for the KBS-3 concept of SKB (Ochs & Talerico 2004). For scenario calculations so far, Kd values for brackish/dilute porewaters, saline porewaters and glacial melt water were distinguished (Pastina & Hellä 2010). In Table 11-1, the lower limit Kd values for these three scenarios calculated here specifically for Olkiluoto conditions are compared with the previous Kd values and the most important differences are highlighted. These differences arise from a variety of factors, which are discussed in the following. The composition of porewaters given in Ochs & Talerico (2004) (RPW, dilute brackish and HSPW, saline) differ in their composition from the corresponding reference porewaters calculated specifically for Olkiluoto site conditions (brackish water KR6/135/8 and saline water KR20/465/1). In particular the lower pH (7.0) of the HSPW, saline porewater compared with 7.8 for the KR20/465/1 reference porewaters affects RN speciation and calculated sorption values (e.g. Eu/Sm, Am/Cm, Ni). Differences in the elemental composition of the two SKB and in-situ reference porewaters only had a minor effect on the RN speciation and sorption behavior compared with the thermodynamic uncertainties (see below). In previous safety assessments, no data for the case of a glacial melt porewater was available and therefore either the Kd value for the dilute, brackish porewater was adopted or the Kd was set to zero. This gap is now closed and individual Kd values proposed for the assumption of glacial melt water intrusion. This results in the case of Sr and Ra to higher Kd values, due to the lower concentrations of competing cations. For most RN, the same data source and a similar procedure for data derivation were applied (see section 9.2). New experimental sorption data were available for Pa, Pu, Cm and Np, partly supporting the previously given Kd values (Pu, Cm) or justifying higher sorption values (Pa, Np). As in Ochs & Talerico (2004), Sr and Ra sorption values were calculated with a sorption model. However, the applied cation exchange constants and specific model parameters e.g. the diffuse double layer, differed. Nevertheless, for similar water compositions the resulting lower limit Kd values are almost identical, supporting the robustness of these models.

130
The summarised Kd values present lower limits and are therefore strongly influenced by the applied uncertainty. Ochs & Talerico (2004) selected an uncertainty factor of 2.5 for the source data, whereas in the present assessment an UF of 1.6 was chosen, as proposed by Bradbury & Baeyens (2003a). The derivation of sorption data strongly depends on the speciation of the RN and therefore on the thermodynamic database used. In particular for Nb and Zr, the Andra/Thermochimie database did not include the same species considered relevant in the speciation calculations of Ochs & Talerico (2004). In the previous assessments, only the weakly sorbing U(VI) species was considered. Considering the redox speciation under the expected porewater condition in this work resulted in higher sorption values for the total U pool. The relevance of alkaline earth-uranyl-carbonate complexes and their influence on the redox speciation - not considered in either assessment - however remains an unresolved question so far. The present assessment of RN sorption data includes in addition to the previously assessed scenarios three additional bounding porewater conditions. Whereas the lower limit Kd values of most RN (except for 14C, Sn and Tc) calculated for the dilute, carbonate rich water KR4/81/1 and the high alkaline water are higher than those for the reference porewaters, sorption values for the brine water KR4/861/1 often represent the lowest Kd value (Table 11-2). In the case of RN sorbing via cation exchange (Sr, Ra, Cs), the high concentration of competing cations, in particular Ca and Na, in the brine porewater decreases the sorption of the RN. For the other RN, low Kd values in brine porewater conditions are associated with a high fraction of RN-chloro complexes in the speciation calculation, which were considered non-sorbing following the procedure of Ochs & Talerico (2004). However, the formation of weak RN-chloro-complexes in the speciation calculation is a characteristic of the thermodynamic model with the standard Davies ionic strength correction applied in the Andra/Thermochimie database. Using the high ionic strength specific but still preliminary SIT (sub)database would not lead to RN-chloro complex formation since interaction is accounted for by using interaction coefficients between the metal and chloride. Omitting the weak chloride complexes would thus increase Kd values. In our view, the decrease of Kd values for the brine porewater is likely to be "artificial". Nevertheless, in view, of the lack of experimental data under such high salinities there still remains uncertainty in this respect. As a further point, it should be added that the brine porewater is only considered as bounding water for the early phase of repository evolution (<1 000 years) and is not expected to reach the canister once natural conditions are re-established (Appendix C).

131
Table 11-1. Comparison of the new lower limit Kd values with the Kd values of previous safety assessments as reported in Pastina & Hellä (2010), Table 3-5 ("P .& H. Table 3-5") (main source: Ochs & Talerico 2004). Marked values indicate new data differing by more than a factor of 10 (yellow: now >; orange now <). The comments indicate RN specific differences in the present and previous data derivation procedure.

132
Table 11-2. Compilation of lower limit Kd values for the reference porewaters and including the bounding porewaters. The lower limit determining bounding porewater is indicated for those RN where the absolute lower limit is not given by the reference porewaters.

133
Acknowledgements:
We greatly appreciate the scientific support of Tony Appelo (Amsterdam) for deriving porosity distribution in the bentonite, including the disposal of the Phyton file and parameter fitting as well as for his valuable comments of an earlier version of the manuscript. The work benefited from fruitful discussions and review comments on earlier report versions from the SAFCA team, in particular from Margit Snellman, Pirjo Hellä, Barbara Pastina, Paul Smith, Mikko Nykyri and Aimo Hautojärvi, and also from Martti Hakanen (University of Helsinki). The helpful discussion with Wolfgang Hummel (PSI) on humics is also acknowledged. We thank Eric Giffaut (Andra) for providing the newest version of the Thermochimie database. This report greatly benefited from the extensive review work of Mikazu Yui (JAEA), Martin Glaus (PSI), Michael Ochs (BMG Eng.), Ignasi Puigdomenech (SKB), Martti Hakanen and Heini Ervanne (both University of Helsinki).

134

135
REFERENCES
Altmaier M., Neck V., Denecke M.A., Yin R., Fanghänel T. (2006): Solubility of ThO2·xH2O(am) and the formation of ternary Th(IV)hydroxide-carbonate complexes in NaHCO3-Na2CO3 solutions containing 0-4 M NaCl. -Radiochim. Acta 94, 495–500.
Altmaier M., Neck V., Fanghänel T. (2008): Solubility of Zr(IV), Th(IV) and Pu(IV) hydrous oxides in CaCl2 solutions and the formation of ternary Ca-M(IV)-OH complexes. -Radiochim. Acta 96, 541–550.
Andersson J. (1999): SR 97: Data and data uncertainties. Compilation of data and data uncertainties for radionuclide transport calculations. SKB Technical Report, TR-99-09.
Andra (2005a): Dossier 2005 Argile. Réferentiel de comportement des radionucléides et des toxiques chimiques d'un stockage dans le Callovo-Oxfordien jusqu'à l'homme. Site de Meuse / Haute Marne. Rapport Andra no. C.NT.AMES.03.046.
Andra (2005b): Référentiel de comportement des radionuclides et des toxiques chimiques d'un stockage dans le Callovo-Oxfordien jusqu'à l'homme. Site Meuse/Haute Marne, Tome 1/2: Chapitres 1 à 4, Dossier 2005 Argile, Report no. C.RP.ASTR.04.0032
Andra (2009a): THERMOCHIMIE (VERSION 7b, 05/2009) - Chemical thermodynamic database. CD version provided by Andra.
Andra (2009b): THERMOCHIMIE project, mid-term report. Andra internal document.
Anttila M. (2005): Radioactive characteristics of the spent fuel of the Finnish nuclear power plants. Posiva Working Report 2005-71
Appelo C.A.J., Postma D. (2007): Geochemistry, groundwater and pollution. Balkema, Rotterdam., 2nd edition.
Appelo C.A.J. (2013): A review of porosity and diffusion in bentonite. Posiva Working Report 2013-29.
Appelo C.A.J., Van Loon L.R., Wersin P. (2010): Multicomponent diffusion of a suite of tracers (HTO, Cl, Br, I, Na, Sr, Cs) in a single sample of Opalinus Clay.- Geochim. Cosmochim. Acta 74, 1201-1219.
Appelo C.A.J., Wersin P. (2007): Multicomponent diffusion modelling in clay systems with application to the diffusion of tritium, iodide and sodium in Opalinus Clay.- Environ. Sci. Technol. 41, 5002-5007.
Baes C.F., Mesmer R.E. (1976): The hydrolysis of cations. Jon Wiley & Sons, New York, 489 pp.

136
Baeyens B., Bradbury M. (1995): A quantitative mechanistic description of Ni, Zn and Ca sorption on Na -montmorillonite. Part II: Sorption measurements. PSI Bericht Nr. 95-11. Paul Scherrer Institut, Villigen, Nagra Technical Report NTB 95-05, Wettingen, Switzerland.
Baeyens B., Bradbury M.H. (1997): A mechanistic description of Ni and Zn sorption on Na-montmorillonite. Part I: Titration and sorption measurements.- J. Contam. Hydrology 27, 199-222.
Berner U. (2002): Project Opalinus Clay: Radionuclide concentrations limits in the near-field of a repository for spent fuel and vitrified high-level waste. Nagra Technical Report NTB 02-10, Wettingen, Switzerland.
Berry A.J., Yui M., Kitamura A. (2007): Sorption studies of radioelements on geological materials. Japan Atomic Energy Agency, JAEA-Research Report 2007-074.
Birgersson M., Karnland O. (2009): Ion equilibrium between montmorillonite interlayer space and an external solution - Consequences for diffusional transport.- Geochim. Cosmochim. Acta 73, 1908-1923.
Borkovec M., Westall J. (1983): Solution of the Poisson-Boltzmann equation for surface excesses of ions in the diffuse layer at the oxide-electrolyte interface.- J. Electroanal. Chem. 150, 325-337.
Bosbach D., Böttle M., Metz V. (2010): Experimental study on Ra2+ uptake by barite (BaSO4). SKB Technical Report TR-10-43.
Bourg I.C., Sposito G., Bourg A.C.M. (2006): Tracer diffusion in compacted, water-saturated bentonite.- Clays Clay Min. 54, 363-374.
Bourg I.C., Sposito G., Bourg A.C.M. (2007): Modeling cation diffusion in compacted water-saturated sodium bentonite at low ionic strength.- Environ. Sci. Techn. 41:8118-8122.
Bradbury M.H., Baeyens B. (1997a): Far-field sorption databases for performance assessment of a L/ILW repository in an undisturbed Palfris Marl host rock. Nagra Technical Report NTB 96-05, Wettingen, Switzerland.
Bradbury M.H., Baeyens B. (1997b): A mechanistic description of Ni and Zn sorption on Na-montmorillonite. Part 11: Modelling.- J. Contam. Hydrol. 27, 223-248.
Bradbury M.H., Baeyens B. (1998): N2-BET surface area measurements on crushed and intact minerals and rocks: a proposal for estimating sorption transfer factors.- Nucl. Technol. 122, 250-253.
Bradbury M.H., Baeyens B. (1999): Modelling the sorption of Zn and Ni on Ca-montmorillonite.- Geochim. Cosmochim. Acta 63, 325-336.

137
Bradbury M.H., Baeyens B. (2002a): Porewater chemistry in compacted re-saturated MX-80 bentonite: physico-chemical characterisation and geochemical modelling. Nagra Technical Report NTB 01-08, Wettingen, Switzerland.
Bradbury M.H., Baeyens B. (2002b): A comparison of apparent diffusion coefficients measured in compacted Kunigel V1 bentonite with those calculated from batch sorption measurements and De(HTO) data: A case study for Cs(I), Ni(II), Sm(III), Am(III), Zr(IV) and Np(V). Nagra Technical Report NTB 02-17, Wettingen, Switzerland.
Bradbury M.H., Baeyens B. (2002c): Sorption of Eu on Na- and Ca-montmorillonites: Experimental investigations and modelling with cation exchange and surface complexation.- Geochim. Cosmochim. Acta 66, 2325-2334.
Bradbury M.H., Baeyens B. (2003a): Near-field sorption database for compacted MX-80 bentonite for performance assessment of a high-level radioactive waste repository in opalinus clay host rock. Nagra Technical Report NTB 02-18, Wettingen, Switzerland.
Bradbury M.H., Baeyens B. (2003b): Far-field sorption databases for Performance Assessment of a high-level radioactive waste repository in an undisturbed Opalinus Clay host rock.-Nagra Technical Report NTB 02-19, Wettingen, Switzerland.
Bradbury M.H., Baeyens B. (2005): Experimental measurements and modelling of sorption competition on montmorillonite.- Geochim. Cosmochim. Acta 69, 4187-4197.
Bradbury M.H., Baeyens B. (2006): Modelling sorption data for the actinides Am(III), Np(V) and Pa(V) on montmorillonite.- Radiochim. Acta 94, 619-625.
Bradbury M.H., Baeyens B. (2010): Comparison of the reference Opalinus Clay and MX-80 bentonite sorption databases used in the Entsorgungsnachweis with sorption databases predicted from sorption measurements on illite and montmorillonite. Nagra Technical Report NTB 09-07, Wettingen, Switzerland.
Bradbury M.H., Baeyens B. (2011a): Physico-Chemical Characterisation Data and Sorption Measurements of Cs, Ni, Eu, Th, U, Cl, I and Se on MX-80 Bentonite. Nagra Technical Report 09-08, Wettingen, Switzerland.
Bradbury M.H., Baeyens B. (2011b): Predictive sorption modelling of Ni(II), Co(II), Eu(IIII), Th(IV) and U(VI) on MX-80 bentonite and Opalinus Clay: A “bottom-up” approach.- Appl. Clay Sci. 52, 27-33.
Brouard C., Melkior T., Motellier S., Berne P., Thoby D., Yahiaoui S., Alincant D., Albert J.C. (2004): Projet GL - Migration de radionucléides dans la bentonite MX80. Rapport d'étude C.RP.3CEA.04.002 (internal report), data presented in Andra (2005b).
Bruno J., Bosbach D., Kulik D., Navrotsky A. (2007): Chemical Thermodynamics of Solid Solutions of interest in Nuclear Waste Management. OECD/NEA, Paris.

138
Cantrell K.J., Kaplan D.I., Wiestma T.W. (1995): Zero-valent iron for the in situ remediation of selected metals in groundwater.- J. Hazard. Mat. 42, 201-212.
Choi J.-W., Oscarson D.W. (1996): Diffusive transport through compacted Na- and Ca-bentonite.- J. Contam. Hydrol. 22, 189-202.
Courdouan A., Christl I., Rabung Th., Wersin P., Kretzschmar R. (2008): Proton and trivalent metal cation binding by dissolved organic matter in the Opalinus Clay and the Callovo-Oxfordian formation.- Environ. Sci. & Technol. 42, 5985-5991.
Cui D., Eriksen T.E. (1996): Reduction of pertechnetate by ferrous iron in solution: influence of sorbed and precipitated Fe(II).- Environ. Sci. Technol. 30, 2259-2262.
Cui D., Spahiu K. (2002): The reduction of U(VI) on corroded iron under anoxic conditions.- Radiochim. Acta 90, 623-628.
Cui D., Puranen A., Devoy J., Scheidegger A., Leupin O.X., Wersin P., Gens R., Spahiu K. (2009): Reductive immobilization of 79Se by iron canister under simulated repository environment .- Journal of Radioanalytical and Nuclear Chemistry 282, 349-354.
Cutter G.A. (1989): Selenium in fresh water systems - In: Occurrence and distribution of selenium, M. Ihnat (ed.). CRC Press, Boca Raton, Florida USA.
Davis J.A., Ochs M., Olin M., Payne T., Tweed C. (2005): NEA Sorption Project Phase II. OECD/NEA, Paris, 284 p.
Dickson B.L. (1990): Radium in groundwater. In IAEA: The environmental behaviour of radium. 1. Technical Reports Series 310. IAEA, Vienna, pp. 335-372.
Di Giandomenico M.V., Le Naour C. (2009): Complex formation between protactinium (V) and sulfate ions at 10 and 60°C. Inorganic Chimica Acta 362, 3253-3258.
Dong W., Brooks S.C. (2006): Determination of the formation constants of ternary complexes of uranyl and carbonate with alkaline earth Metlals (Mg2+, Ca2+,Sr2+, and Ba2+) using anion exchange method.- Environ. Sci. Technol. 40, 4689-4695.
Dong W., Brooks S.C. (2008): Formation of aqueous MgUO2(CO3)32- complex and
uranium anion exchange mechanism onto an exchange resin - Environ. Sci. Technol. 42, 1979-1983.
Duro L., Grivé M., Cera E., Gaona X., Domènech C., Bruno J. (2006): Determination and assessment of the concentration limits to be used in SR-Can. SKB Technical Report TR-06-32.
El Aamrani F., Casas I., De Pablo J., Duro L., Grivé M., Bruno J. (1999): Experimental and modelling study of the interaction between uranium(VI) and magnetite. SKB Technical Report TR-99-21.

139
Eriksen T E, Jacobsson A. (1981): Ion diffusion in compacted Na and Ca bentonites. KBS Technical Report 91-12, Svensk Kärnbränslehantering AB.
Eriksen T.E. (1982): Diffusion of hydrogen, hydrogen sulphide and large molecular weight anions in bentonite. KBS Technical Report 82-17.
Eriksen T.E., Jansson M., Molera M. (1999): Sorption effects on cation diffusion in compacted bentonite.- Eng. Geol. 54, 231-236.
Farrel, J., Bostick W.D., Jarabek R., Fiedor N. (1999): Uranium removal from groundwater using zero valent iron media.- Groundwater 37, 618-624.
Fiedor J.N., Bostick W.D., Jarabeck R.J., Farrell J. (1998): Understanding the mechanism of uranium removal from goundwater by zero-valent iron using X-ray photoelectron spectroscopy.- Environ. Sci. Technol. 32, 1466-1473.
Galunin E., Alba M.D., Santos M.J., Abrão T., Vidal M. (2011): Examination of competitive lanthanide sorption onto smectites and its significance in the management of radioactive waste.- Journal of Hazardous Materials 186, 1930-1941.
Garcia-Gutierrez M., Missana T., Mingarro M., Samper J., Dai Z., Molinero J. (2001): Solute transport properties of compacted Ca-bentonite used in FEBEX project.- Journal of Contaminant Hydrology 47, 127-137.
Garcia-Gutierrez M., Cormenzana J.L., Missana T., Mingarro M. (2004): Diffusion coefficients and accessible porosity for HTO and 36Cl in compacted FEBEX bentonite.- Applied Clay Science 26, 65-73.
Gimmi T., Kosakowski G., Glaus M.A. (2010): On the mobility of exchangable cations on clay surfaces. Clays in Natural & Engineered Barriers for Radioactive Waste Confinement 4th International Meeting – March 2010 – Nantes, France, Abstracts pp. 313-314.
Gimmi T., Kosakowski G. (2011): How mobile are sorbed cations in clays and clay rocks? - Environ. Sci. Technol. 45, 1443-1449.
Glaus M.A., Baeyens B., Lauber M., Rabung Th., Van Loon L.R. (2005): Influence of water-extractable organic matter from Opalinus Clay on the sorption and speciation of Ni(II), Eu(III) and Th(IV).- Applied Geochemistry 20, 443-451.
Glaus M., Baeyens B., Bradbury M.H., Jakob A., Van Loon L.R., Yaroshchuk A. (2007): Diffusion of 22Na and 85Sr in montmorillonite. Evidence of interlayer diffusion being the dominant pathway at higher compaction.- Environ. Sci. Technol. 41, 478-485.
Glaus M.A., Frick S., Rosse´ R., Van Loon L.R. (2010): Comparative study of tracer diffusion of HTO, 22Na+ and 36Cl- in compacted kaolinite, illite and montmorillonite.- Geochimica et Cosmochimica Acta 74, 1999-2010.
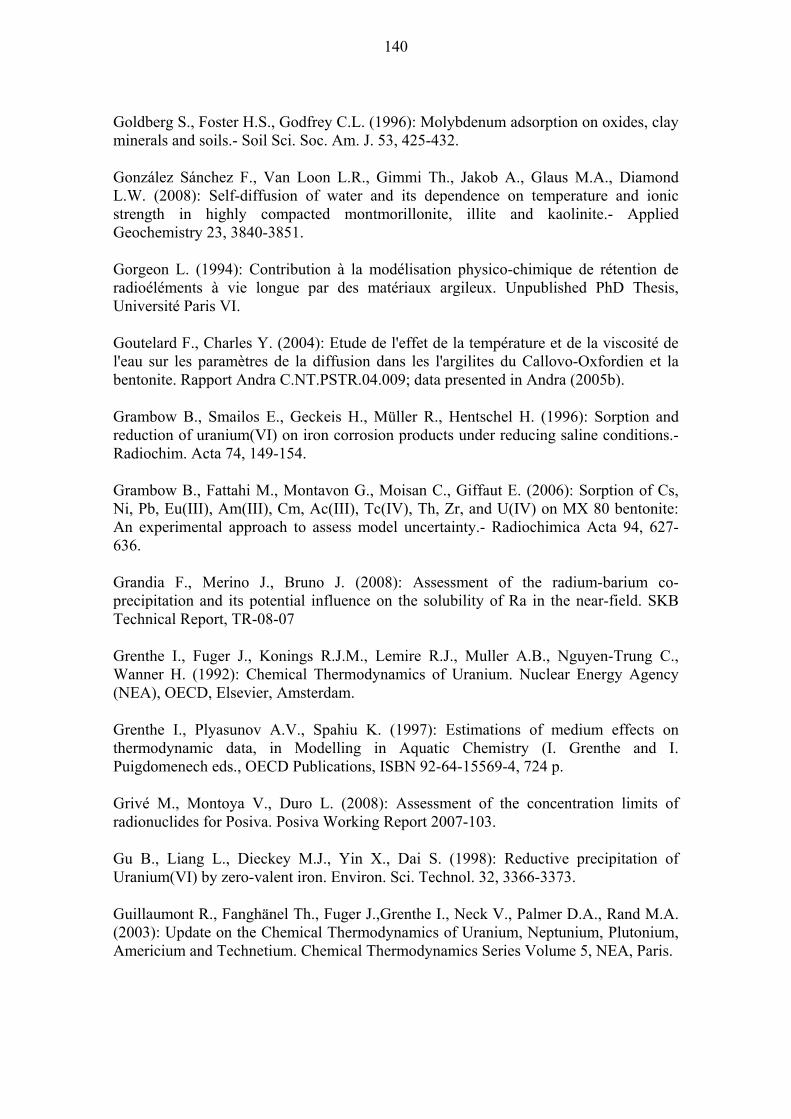
140
Goldberg S., Foster H.S., Godfrey C.L. (1996): Molybdenum adsorption on oxides, clay minerals and soils.- Soil Sci. Soc. Am. J. 53, 425-432.
González Sánchez F., Van Loon L.R., Gimmi Th., Jakob A., Glaus M.A., Diamond L.W. (2008): Self-diffusion of water and its dependence on temperature and ionic strength in highly compacted montmorillonite, illite and kaolinite.- Applied Geochemistry 23, 3840-3851.
Gorgeon L. (1994): Contribution à la modélisation physico-chimique de rétention de radioéléments à vie longue par des matériaux argileux. Unpublished PhD Thesis, Université Paris VI.
Goutelard F., Charles Y. (2004): Etude de l'effet de la température et de la viscosité de l'eau sur les paramètres de la diffusion dans les l'argilites du Callovo-Oxfordien et la bentonite. Rapport Andra C.NT.PSTR.04.009; data presented in Andra (2005b).
Grambow B., Smailos E., Geckeis H., Müller R., Hentschel H. (1996): Sorption and reduction of uranium(VI) on iron corrosion products under reducing saline conditions.- Radiochim. Acta 74, 149-154.
Grambow B., Fattahi M., Montavon G., Moisan C., Giffaut E. (2006): Sorption of Cs, Ni, Pb, Eu(III), Am(III), Cm, Ac(III), Tc(IV), Th, Zr, and U(IV) on MX 80 bentonite: An experimental approach to assess model uncertainty.- Radiochimica Acta 94, 627-636.
Grandia F., Merino J., Bruno J. (2008): Assessment of the radium-barium co-precipitation and its potential influence on the solubility of Ra in the near-field. SKB Technical Report, TR-08-07
Grenthe I., Fuger J., Konings R.J.M., Lemire R.J., Muller A.B., Nguyen-Trung C., Wanner H. (1992): Chemical Thermodynamics of Uranium. Nuclear Energy Agency (NEA), OECD, Elsevier, Amsterdam.
Grenthe I., Plyasunov A.V., Spahiu K. (1997): Estimations of medium effects on thermodynamic data, in Modelling in Aquatic Chemistry (I. Grenthe and I. Puigdomenech eds., OECD Publications, ISBN 92-64-15569-4, 724 p.
Grivé M., Montoya V., Duro L. (2008): Assessment of the concentration limits of radionuclides for Posiva. Posiva Working Report 2007-103.
Gu B., Liang L., Dieckey M.J., Yin X., Dai S. (1998): Reductive precipitation of Uranium(VI) by zero-valent iron. Environ. Sci. Technol. 32, 3366-3373.
Guillaumont R., Fanghänel Th., Fuger J.,Grenthe I., Neck V., Palmer D.A., Rand M.A. (2003): Update on the Chemical Thermodynamics of Uranium, Neptunium, Plutonium, Americium and Technetium. Chemical Thermodynamics Series Volume 5, NEA, Paris.

141
Hakanen, M., Ervanne, H. & Puukko, E. (2014): Safety case for the disposal of spent nuclear fuel at Olkiluoto: Radionuclide migration parameters for the Geosphere. Eurajoki, Finland: Posiva Oy. POSIVA 2012-41.
Hellä, P., Pitkänen, P., Löfman, J., Partamies, S., Vuorinen, U., Wersin, P., Safety Case for the Disposal of Spent Nuclear Fuel at Olkiluoto - Definition of Reference and Bounding Groundwaters, Buffer and Backfill Porewaters. Posiva Oy, Helsinki, Finland. POSIVA 2014-04. Hummel W., Berner U. (2002): Application of the Nagra / PSI TDB 01/01: Solubility of Th, U, Np and Pu. Nagra Technical Report NTB 02-12, Wettingen, Switzerland.
Hummel W., Berner U., Curti E., Pearson J.F., Thoenen T. (2002): Nagra /PSI Thermochemical Database 01/01. Nagra Technical Report NTB 02-16, Wettingen, Switzerland.
Hummel W., Glaus M.A., Van Loon L.R. (2000): Trace metal-humate interactions. II. The "conservative roof'' model and its application.- Applied Geochemistry 15, 975-1001.
Iida Y., Yamaguchi T., Tanaka T., Kitamura A., Nakayama S. (2007): Determination of the solubility limiting solid of selenium in the presence of iron under anoxic conditions. MOFAP 2007, France.
Ishidera T., Miyamoto S., Sato H. (2008): Effect of sodium nitrate on the diffusion of Cl- and I- in compacted bentonite.- Journal of Nuclear Science and Technology 45, 610-616.
Ikeda T., Amaya T. (1998): Model development of chemical evolution in repository vol.II, acquisition of nuclide migration data in near-field. PNC ZJ 1281 98-03.
Jensen D.J., Radke C.J. (1988): Cesium and strontium diffusion through sodium montmorillonite at elevated temperature.- Journal of Soil Science 39, 53-64.
Johnson L.H., Schwyn B. (eds.) (2008): Proceedings of a Nagra/RWMC Workshop on the release and transport of C-14 in repository environments. Nagra Arbeitsbericht NAB 08-22.
Jougnot D., Revil A., Leroy P. (2009): Diffusion of ionic tracers in the Callovo-Oxfordian clay-rock using the Donnan equilibrium model and the formation factor.- Geochim. Cosmochim. Acta 73, 2712-2726.
Kato H., Muroi M., Yamada N., Ishida H., Sato H. (1995): Estimation of effective diffusivity in compacted bentonite.-Mat. Res. Soc. Symp. Proc. 353, 277-284.
Kozaki T., Saito N., Fujishima A., Sato S., Ohashi H. (1998): Activation energy for diffusion of chloride ions in compacted montmorillonite.- J. Contaminant Hydrology 35, 67-75.

142
Kumpulainen S., Kiviranta L. (2010): Mineralogical and chemical characterization of various bentonites and smectite-rich clay materials. Posiva Working Report 2010-52.
Kvashnina K.O., Butorin S.M., Cui D., Vegelius J., Puranen A., Gens R., Glatzel P. (2009): Electron transfer during selenium reduction by iron surfaces in aqueous solution: High resolution X-ray absorption study.- J. Phys.: Conf. Ser. 190, 012191.
Laaksoharju M., Vuorinen U., Snellman M., Allard B., Petterson C., Helenius J., Hinkkanen H. (1994): Colloids or artefacts? A TVO/SKB cooperation project at Olkiuoto, Finland, Report YJT 94-01.
Langmuir D., Melchior D. (1985): The geochemistry of Ca, Sr, Ba and Ra sulfates in some deep brines from Palo Duro Basin, Texas.- Geochim. Cosmochim. Acta 49, 2423-2432.
Lee S.Y., Bondietti E.A. (1983): Technetium behavior in sulfide and ferrous iron solutions.- Mat. Res. Soc. Symp. Proc. 15, 315-322.
Le Naour C., Trubert D., Jaussaud C. (2003) : Hydrolysis of protactinium (V). II. Equilibrium constants at 40°C and 60°C: A solvent extraction study with TTA in the aqueous system Pa(V)/H2O/H+/Na+/ClO4
-.- J. Solution Chem. 33, 489-504.
Leroy P., Revil A., Coelho D. (2006): Diffusion of ionic species in bentonite.- J. Colloid Interface Sci. 296, 248-255.
Liger E., Charlet L., Van Cappellen P. (1999): Surface catalysis of uranium(VI) reduction by iron(II).- Geochim. Cosmochim. Acta 63, 2939-2955.
Mäkelä J., Manninen P. (2008): Molecular size distribution and spectroscopic properties of aquatic humic substances. Posiva Working Report 2008-36.
Marques Fernandes M., Baeyens B., Bradbury M.H. (2008): The influence of carbonate complexation on lanthanide/actinide sorption on montmorillonite.- Radiochim. Acta 96, 691-697.
Masurat P., Eriksson S., Pedersen K. (2010): Microbial sulphide production in compacted Wyoming bentonite MX-80 under in situ conditions relevant to a repository for high-level radioactive waste.- Applied Clay Science 47, 58-64.
Melkior T., Mourzagh D., Yahiaoui S.,Thoby D., Alberto J. C., Brouard C., Michau N. (2004): Diffusion of an alkaline fluid through clayey barriers and its effect on the diffusion properties of some chemical species.- Applied Clay Science 26, 99-107.
Melkior T., Gaucher E.B., Brouard C., Yahiaoui S., Thoby D., Clinard Ch., Ferrage E., Guyonnet D., Tournassat C., Coelho D. (2009): Na+ and HTO diffusion in compacted bentonite: Effect of surface chemistry and related texture.- Journal of Hydrology 370, 9-20.

143
Missana T., Maffiotte C., García-Gutiérrez M. (2003): Surface reaction kinetics between nanocrystalline magnetite and uranyl.- J. Colloid Interf. Sci., 261, 154-160.
Molera M., Eriksen T. (2002): Diffusion of 22Na+, 85Sr2+, 134Cs+ and 57Co2+ in bentonite clay compacted to different densities: experiments and modeling.- Radiochim. Acta 70, 753-760.
Montavon G., Alhajji E., Grambow B. (2006): Study of the interaction of Ni2+ and Cs+ on MX-80 bentonite; effect of compaction using the “capillary method”.- Environ. Sci. Technol. 40, 4672-4679.
Montavon G., Guo Z., Lützenkirchen J., Alhajji E., Kedziorek M.A.M., Bourg A.C.M., Grambow B. (2009): Interaction of selenite with MX-80 bentonite: Effect of minor phases, pH, selenite loading, solution composition and compaction.- Colloids and Surfaces A: Physicochem. Eng. Aspects 332, 71-77.
Moore D. A. (2011): Complexation of Plutonium (IV) with Fluoride at Variable Temperatures. Lawrence Berkeley National Laboratory: LBNL Paper LBNL-2128E. Retrieved from: http://escholarship.org/uc/item/48r3r721
Morrison S.J., Metzler D.R., Carpenter C.E. (2001): Uranium precipitation in a permeable reactive barrier by progressive irreversible dissolution of zerovalent iron. Environ. Sci. Technol. 35, 385-390.
Motta, M.M., Miranda, C.F. (1989): Molybdate adsorption on kaolinite, montmorillonite, and illite: Constant capacity modelling.- Soil Sci. Soc. Am. J. 53, 380-385.
Müller-Vonmoos M., Kahr G. (1983): Mineralogische Untersuchungen von Wyoming Bentonit MX-80 und Montigel. Nagra Technical Report NTB 83-12, Wettingen, Switzerland.
Muurinen A., Penttilä-Hiltunen P., Rantanen J., Uusheimo K. (1989): Diffusion of uranium and chloride in compacted sodium bentonite. YJT - Report, Teollisuuden Voima Oy, Helsinki.
Nagasaki S., Tanaka S., Suzuki A. (1999): Sorption of neptunium on bentonite and its migration in geosphere.- Colloids and Surfaces A: Physicochemical and Engineering Aspects 155, 137-143.
Nagra (2002): Project Opalinus Clay: Safety report. Demonstration of disposal feasibility for spent fuel, vitrified high-level waste and long-lived intermediate-level waste (Entsorgungsnachweis). Nagra Technical Report NTB 02-05, Wettingen, Switzerland.
Nakata K., Nagasaki S., Tanaka S., Sakamoto Y., Tanaka T., Ogawa H. (2002): Sorption and reduction of neptunium(V) on the surface of iron oxides.- Radiochimica Acta 90, 665-669.

144
Nakata K., Nagasaki S., Tanaka S., Sakamoto Y., Tanaka T., Ogawa H. (2004): Reduction rate of neptunium(V) in heterogeneous solution with magnetite.- Radiochimica Acta 92, 145-150.
Neretnieks I. (1982): Diffusivities of some dissolved constitutents in compacted wet bentonite clay MX-80 and the impact on radionuclide migration in the buffer. SKB, SKBF/KBS TR 82-27.
Nykyri M., Nordman H., Löfman J., Poteri A., Marcos N., Hautojärvi A. (2008): Radionuclide release and transport. RNT-2008. POSIVA 2008-06.
Ochs M., Lothenbach B., Shibata M., Sato H., Yui M. (2003): Sensitivity analysis of radionuclide migration in compacte bentonite: a mechanistic model approach.- Journal of Contaminant Hydrology 61, 313-328.
Ochs M., Talerico C. (2004): SR-Can: Data and data uncertainty: Migration parameters for the bentonite buffer in the KBS-3 concept. SKB Technical Report TR-04-18.
Ollila K. (2008): Solubility of UO2 in the high pH range in 0.01 to 0.1 M NaCl solution under reducing conditions. Posiva Working Report WR 2008-75.
O'Loughlin E.J., Kelly S.D., Cook R.E., Csencsits R., Kemner K.M. (2003): Reduction of uranium(VI) by mixed iron(II)/iron(III) hydroxide (green rust): formation of UO2 nanoparticles.- Environ. Sci. Technol. 37, 721-727.
Oscarson D.W. (1994): Surface diffusion: is it an important transport mechanism in compacted clays?- Clays, Clay Mineral. 42, 534-543.
Pabalan R.T., Turner D. R. (1997): Uranium(6+) sorption on montmorillonite: Experimental and surface complexation modelling study.- Aquatic Geochemistry 2, 203-226.
Parkhurst D.L., Appelo C.A.J. (1999): User's guide to PHREEQC (Version 2) - A computer program for speciation, batch reaction, one-dimensional transport, and inverse geochemical calculations. U.S. Geological Survey Water-Resources Investigations Report 99-4259.
Pastina B., Hellä P. (2006): Expected evolution of a spent nuclear fuel repository at Olkiluoto. POSIVA 2006-05.
Pastina B., Hellä P. (2010): Models and Data Report 2010. POSIVA 2010-01.
Peiffert, C., Nguyen-Trung, C., Landais, P. (1997): Etude experimentale de la solubilité des oxydes de Nb(V) crystallisé et amorphe dans des solutions aqueuses. Andra Rapport C RP 0CRE 97-003.

145
Peiffert C., Nguyen-Trung C., Palmer D.A., Laval J.P., Giffaut E. (2010): Solubility of B-Nb2O5 and the hydrolysis of Niobium(V) in aqueous solution as a function of temperature and ionic strength.- Journal of Solution Chemistry 39, 197-218.
Peuravuori J., Pihlaja K. (1997): Molecular size distribution and spectroscopic properties of aquatic humic substances.- Analytica Chimica Acta 337, 133-149.
Pitkänen P., Ahokas H., Ylä-Mella M., Partamies S., Snellman M., Hellä P. (ed.) (2007): Quality review of hydrochemical baseline data from the Olkiluoto site. POSIVA 2007-05.
Pocachard J., Mourzagh D., Melkior T., Alberto J.C., Barthès V., Thoby D., Abdelkader D., Duding B., André C., Marmier N. (2000): Etude méthodologique de l'influence d'additif et de l'influence du degré de compaction sur les propriété de la barrière ouvragée de type argile gonflante. Rapport Andra C RP 3CEA 00-005; data presented in Andra (2005b).
Posiva (2009): Olkiluoto site description 2008. POSIVA 2009-01.
Pouchon M.A., Curti E., Degueldre C., Tobler L. (2001): The influence of carbonate complexes on the solubility of zirconia: new experimental data. Progress in Nuclear Energy 38, 443–446.
Puranen A., Jonsson M., Dähn R., Cui D. (2009): Immobilization of selenate by iron in aqueous solution under anoxic conditions and the influence of uranyl.- Journal of Nuclear Materials 392, 519-524 .
Puranen A., Jonsson M., Dähn R., Cui D. (2010): Reduction of selenite and selenate on anoxically corroded iron and the synergistic effect of uranyl reduction.- Journal of Nuclear Materials 406, 230-237.
Rabung T., Altmaier M., Neck V., Fanghänel T. (2008): A TRLFS study of Cm(III) hydroxide complexes in alkaline CaCl2 solutions. Radiochim. Acta 96, 551–559.
Ramesh A., Rama Mohan K., Seshaiah K., Venkateswarlu Choudary N. (2002): Removal of beryllium from aqueous solutions by zeolite 4A and bentonite. -Separation Science and Technology 37:5, 1123-1134.
Rand M.H., Mompean F.J., Perrone J. (2009): Chemical thermodynamics of thorium. Chemical Thermodynamics Vol. 11. OECD Nuclear Energy Agency, 900pp.
Rao L., Tian G. (2011): The effect of temperature on the complexation of Cm(III) with nitrate in aqueous solutions.-Dalton Trans. 40, 914-918.
Rao L., Tian G., Di Bernard, P., Zanonato,P. (2011): Hydrolysis of Plutonium(VI) at Variable Temperatures (283-343 K).-Chemistry - A European Journal 17, 10985–10993.

146
Rovira M., El Aamrani S., Duro L., Giménez J., De Pablo J., Bruno J. (2007): Interaction of uranium with in situ anoxically generated magnetite on steel.- Journal of Hazardous Materials 147, 726-731.
Sabodina M.N., Kalmykov S.N., Sapozhnikov Y.A., Zakharova E.V. (2006): Neptunium, plutonium and 137Cs sorption by bentonite clays and their speciation in pore waters.- Journal of Radioanalytical and Nuclear Chemistry 270, 349-355.
Sato H. (1998a): Data setting for effective diffusion coefficients (De) of nuclides in the buffer for reference case in performance assessment of the geological disposal of high-level radioactive waste. PNC TN8410 98-097, Japan.
Sato H.(1998b): Diffusion behaviour of Se(-II) and Sm(lIl) in compacted sodium bentonite. Radiochim. Acta 82, 173-178.
Sato H., Suzuki S. (2003): Fundamental study on the effect of an orientation of clay particles on diffusion pathway in compacted bentonite.- Applied Clay Science 23, 51-60.
Sato H., Yui M. (1997): Diffusion of Ni in compacted bentonite. J. Nucl. Sci. Tech. 34 (3), 334-336.
Scott T.B., Allen G.C., Heard P.J., Lewis A.C., Lee D.F. (2005): The extraction of uranium from groundwaters on iron surfaces. Proceedings of the Royal Society A 461, 1247-1259.
Séby F., Potin-Gautier M., Giffault E., Borge G., Donard O.F.X. (2001): A critical review of thermodynamic data for selenium species at 25 °C.- Chemical Geology 171, 173-194.
SKB (2006): Long-term evaluation for KBS-3 repositories at Forsmark and Laxemar- a first evaluation. Main report of the SR-Can project. SKB Technical Report TR-06-09.
Skerencak A., Panak P.J., Hauser W., Neck V., Klenze R., Lindqvist-Reis P., Fanghänel T. (2009): TRLFS study on the complexation of Cm(III) with nitrate in the temperature range from 5 to 200 °C. -Radiochimica Acta 97, 385-393.
Spahiu K., Bruno J. (1995): A selected thermodynamic database for REE to be used in HLNW performance assessment exercises. SKB Technical Report TR 95-35.
Stumm W., Morgan J.J. (1996): Aquatic Chemistry. 3rd edition, John Wiley & Sons, New York.
Suzuki S., Sato H., Tachi Y. (2003): A technical problem in the through-diffusion experiments for compacted bentonite.- Journal of Nuclear Science and Technology 40 (9), 698-701.

147
Suzuki S., Sato H., Ishidera T., Fujii N. (2004): Study on anisotropy of effective diffusion coefficient and activation energy for deuterated water incompacted sodium bentonite.- Journal of Contaminant Hydrology 68, 23-37.
Tachi Y., Shibutani T., Sato H., Yui M. (2001): Experimental and modelling studies on sorption and diffusion of radium in bentonite.-Journal of Contaminant Hydrology 47 (2-4), 171-186.
Talerico C., Ochs M., Giffaut E. (2004): Solubility of Niobium(V) under Cementitious Conditions: Importance of Ca-niobate.- Material Research online Proceedings. Vol. 824 CC8.31.
Tournassat C. (2008): A predictive model fr anion exclusion in compacted Na-montmorillonite. 4th Annual Workshop Proceedings 6th EC-FP-FUNMIG IP, Karlsruhe, 24-27 November 2008, 123-142.
Trubert D., Le Naour C., Jaussaud C. (2002) : Hydrolysis of Protactinium(V). I. Equilibrium Constants at 25±C: A Solvent Extraction Study with TTA in the Aqueous System Pa(V)/H2O/H+/Na+/ClO¡.- Journal of Solution Chemistry 31, 261-277.
Trubert D., Le Naour C., Jaussaud C. and Mrad O. (2003): Hydrolysis of Protactinium(V). III. Determination of Standard Thermodynamic Data.- Journal of Solution Chemistry 32, 505-517.
Van Loon L.R., Glaus M.A. (2008): Mechanical compaction of smectite clays increases ion exchange selectivity for cesium.- Environ. Sci. Technol. 42, 1600-1604.
Van Loon L.R., Glaus M.A., Müller W. (2007): Anion exclusion effects in compacted bentonites: Towards a better understanding of anion diffusion.- Appl. Geochem. 22, 2356-2552.
Van Sheik J.C., Kemper W.D., Olsen S.R. (1966): Contribution of adsorbed cations to diffusion in clay-water systems.- Soil Sci. Soc. Am. J. 30, 17-22.
Vaughan D.J., Craig J.R. (1978): Mineral chemistry of metal sulfides. Cambridge University Press.
Vercouter T., Vitorge P., Amekraz B., Giffaut E., Solange H., Moulin C. (2005): Stabilities of the Aqueous Complexes Cm(CO3)3
3- and Am(CO3)33- in the Temperature
range 10-70°C.-Inorganic Chemistry 44, 5833-5843.
Vilhunen S., Manninen P. (2010): Comparable investigation of the molecular size distribution and the amount of humic substances isolated from ONKALO, Olkiluoto 2010. Posiva Working Report 2010-80.

148
Wagman D.D., Evans W.H., Parker V.B., Schumm R.H., Halow I., Bailey S.M., Churney K.L., Nuttal R.L. (1982): The NBS tables of chemical thermodynamic properties, selected values for inorganic and C2 and C2 organic substances in SI units.- J. Phys. Chem. Ref. Data, Vol. 11, Suppl. 2.
Wersin P., Schwyn B. (2004): Integrated approach for the development of geochemical databases used for the safety assessment. Nagra Technical Report NTB 03-06, Wettingen, Switzerland.
Wersin P., Curti E., Appelo C.A.J. (2004): Modelling bentonite-water interactions at high solid/liquid ratios: swelling and diffuse double layer effects.- Applied Clay Science 26, 249-257.
Wieland E., Wanner H., Albinsson Y., Wersin P., Karnland O. (1994): A surface chemical model of the bentonite-water interface and its implications for modelling the near-field chemistry in a repository for spent fuel. SKB Technical Report TR 94-26.
Xia X., Idemitsu K., Arima T., Inagaki Y., Ishidera T., Kurosawa S., Iijima K., Sato H. (2005): Corrosion of carbon steel in compacted bentonite and its effect on neptunium diffusion under reducing conditions. Applied Clay Science 28, 89-100.
Yim M.-S., Caron F. (2006): Life cycle and management of carbon-14 from nuclear power generation. Progress in Nuclear Energy 48, 2-36.
You C-F, Lee T., Li Y-H (1989): The partition of Be between soil and water. -Chemical Geology 77, 105-118.
Yu J.-W., Neretnieks I. (1997): Diffusion and sorption properties of radionuclides in compacted bentonite. SKB Technical Report TR 97-12.
Yui M., Azuma J., Shibata M. (1999): JNC thermodynamic database for performance assessment of high-level radioactive waste disposal system. JNC Technical Report JNC TN8400 99-070.

149
APPENDIX A - SOLUBILITY LIMITS
A1 Overview solubilities
Table A-1. Radionuclide solubilities (mol L-1) for all waters (this work)
canister waters groundwaters bentonite porewaters
Element reference
value saline
reference value
brackish
upper limit
referencevalue saline
referencevalue
brackish
upper limit
referencevalue saline
reference value
brackish
upper limit
Cm, Am 1.7e-06 6.0e-06 2.7e-05 1.1e-05 5.2e-06 6.8e-05 4.9e-07 6.3e-06 9.2e-06
Pu 1.2e-10 4.3e-10 3.0e-08 7.4e-09 1.1e-08 4.5e-07 8.4e-10 5.7e-09 9.9e-08
Np 9.6e-10 1.0e-09 1.3e-08 1.0e-09 1.1e-09 1.3e-08 9.1e-10 1.0e-09 2.1e-08
U 4.1e-09 2.4e-08 3.0e-07 3.3e-09 6.3e-09 6.0e-08 3.5e-09 3.7e-09 1.5e-07
Pa 1.0e-08 1.0e-08 1.0e-06 1.0e-08 1.0e-08 1.0e-06 1.0e-08 1.0e-08 1.0e-06
Th 2.7e-09 4.2e-09 8.8e-07 3.3e-09 6.3e-09 1.2e-06 3.6e-09 3.6e-09 7.5e-08
Ra 1.6e-11 6.7e-11 8.7e-05 1.7e-09 6.7e-11 8.6e-05 1.4e-11 5.7e-11 1.1e-04
Eu 5.4e-08 1.3e-07 1.25e-05 2.3e-07 2.0e-07 2.3e-05 6.2e-08 2.3e-07 2.9e-05
Sm 6.1e-08 3.6e-07 1.2e-05 6.4e-07 5.3e-07 2.1e-05 1.7e-07 6.3e-07 2.1e-05
Cs unlim. unlim. unlim. unlim. unlim. unlim. unlim. unlim. unlim.
I unlim. unlim. unlim. unlim. unlim. unlim. unlim. unlim. unlim.
Sn 1.1e-07 6.3e-08 1.3e-05 5.9e-08 5.7e-08 1.3e-05 8.4e-08 5.9e-08 1.2e-05
Ag 9.9e-06 5.1e-06 2.5e-04 1.0e-05 5.2e-06 2.5e-04 3.0e-05 1.4e-05 3.3e-04
Pd 3.7e-06 3.9e-06 1.2e-05 3.9e-06 3.9e-06 8.5e-05 3.4e-06 3.9e-06 1.5e-04
Tc 3.7e-09 3.9e-09 1.5e-08 3.8e-09 3.9e-09 1.5e-08 3.4e-09 3.8e-09 1.4e-08
Mo 3.1e-06 2.4e-06 unlim. 8.8e-09 2.3e-08 unlim. 3.3e-07 3.7e-08 unlim.
Nb 9.5e-07 1.9e-07 unlim. 1.5e-07 1.2e-07 unlim. 6.1e-07 1.5e-07 unlim.
Zr 1.7e-08 1.8e-08 9.2e-07 1.7e-08 1.8e-08 9.2e-07 1.5e-08 1.7e-08 9.2e-07
Sr 1.3e-04 7.4e-04 unlim. unlim. 8.7e-04 unlim. 1.0e-03 6.7e-04 unlim.
Se 5.8e-10 5.9e-11 3.4e-07 1.7e-09 4.9e-10 1.0e-06 1.4e-09 4.3e-10 8.1e-07
Be 1.4e-06 4.4e-06 4.4e-06 6.3e-06 7.1e-06 7.4e-06 1.9e-06 6.0e-06 6.0e-06
Ni 9.3e-05 8.3e-04 8.3-04 1.5e-03 unlim. unlim. 1.9e-04 1.5e-03 1.5e-03
Cl unlim. unlim. unlim. unlim. unlim. unlim. unlim. unlim. unlim.
Corg unlim. unlim. unlim. unlim. unlim. unlim. unlim. unlim. unlim.
Cinorg 5.2e-04 1.1e-03 unlim. 7.7e-04 1.7e-03 unlim. 9.3e-04 9.0e-04 unlim.

150
A2 Solubility data sheets
Speciation calculations for the canister and groundwaters given in the following solubility data sheets were calculated with the Andra/Thermochimie database. The dominant solution species, which were used for the calculation of the formal uncertainties, are marked in yellow.
Thorium (Th) solubility data sheet
Thorium (Th)
Saline KR20/465/1
Brackish KR6/135/8
Dilute, carbonate
rich KR4/81/1
Brine KR4/861/1
High alkaline Glacial melt water
LogK uncertainty (ANDRA db)
Solubility controlling solid phase
0.3
Solubility (mol
L-1)2.7E-09 4.2E-09 1.3E-08 1.1E-09 1.5E-09 2.1E-09
ThIV(OH)4 55.0 36.5 12.3 97.5 100.0 75.4 0.5
ThIV(OH)3CO3- 39.4 48.8 54.5 1.4 23.5 0.6
ThIV(OH)2(CO3)22- 4.9 10.9 31.3 0.8 0.4
ThIV(OH)2(CO3) 2.7 1.8 0.4
ThIV(OH)3+ 0.9 0.2
Sum (%) 100.2 99.8 99.9 99.8 100.0 99.7
Solubility (mol
L-1)3.3E-09 6.3E-09 2.0E-08 1.2E-09 1.5E-09 1.9E-09
ThIV(OH)4 45.7 24.1 8.0 89.7 100.0 81.5 0.5
ThIV(OH)3CO3- 43.0 51.7 49.6 6.0 17.7 0.6
ThIV(OH)2(CO3)22- 6.9 18.5 40.0 0.4
ThIV(OH)2(CO3) 4.6 2.2 0.4
ThIV(OH)3+ 3.9 0.2
Sum (%) 99.6 99.9 99.9 99.6 100.0 99.2
Species distribution (%)
ThO2:2H2O(am)
Inside the canister
Bentonite/rock interface
Species distribution (%)
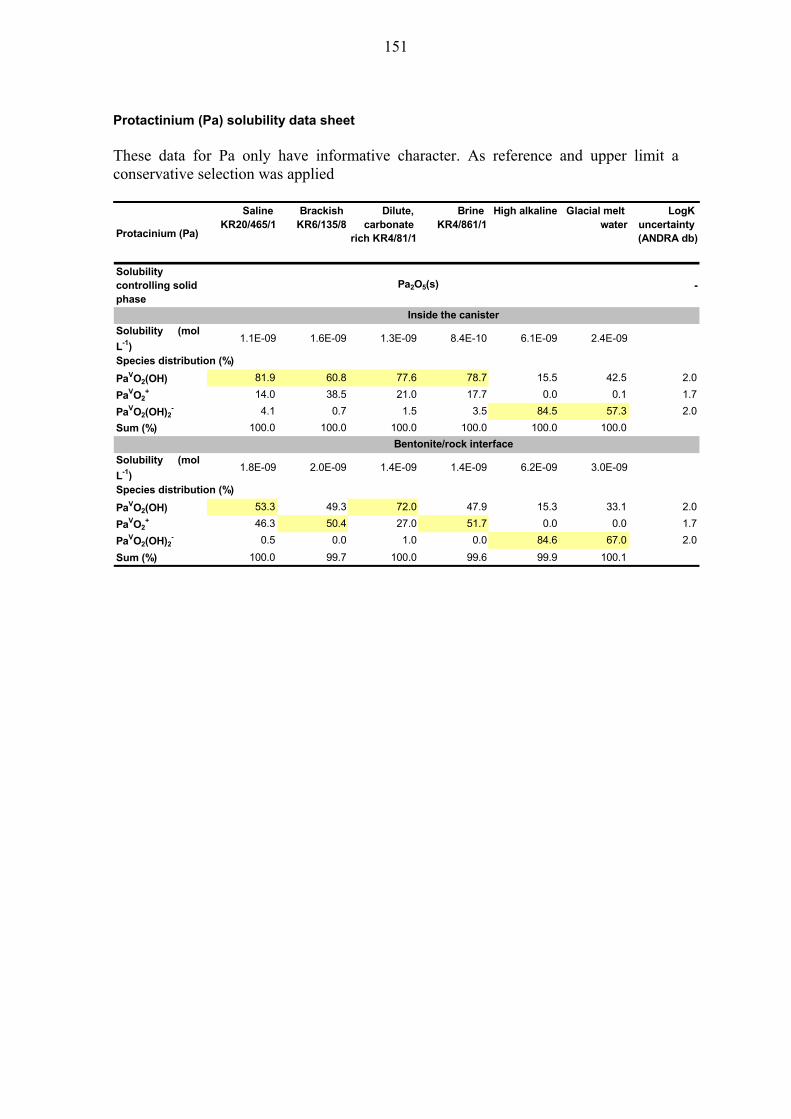
151
Protactinium (Pa) solubility data sheet These data for Pa only have informative character. As reference and upper limit a conservative selection was applied
Protacinium (Pa)
Saline KR20/465/1
Brackish KR6/135/8
Dilute, carbonate
rich KR4/81/1
Brine KR4/861/1
High alkaline Glacial melt water
LogK uncertainty (ANDRA db)
Solubility controlling solid phase
-
Solubility (mol
L-1)1.1E-09 1.6E-09 1.3E-09 8.4E-10 6.1E-09 2.4E-09
PaVO2(OH) 81.9 60.8 77.6 78.7 15.5 42.5 2.0
PaVO2+ 14.0 38.5 21.0 17.7 0.0 0.1 1.7
PaVO2(OH)2- 4.1 0.7 1.5 3.5 84.5 57.3 2.0
Sum (%) 100.0 100.0 100.0 100.0 100.0 100.0
Solubility (mol
L-1)1.8E-09 2.0E-09 1.4E-09 1.4E-09 6.2E-09 3.0E-09
PaVO2(OH) 53.3 49.3 72.0 47.9 15.3 33.1 2.0
PaVO2+ 46.3 50.4 27.0 51.7 0.0 0.0 1.7
PaVO2(OH)2- 0.5 0.0 1.0 0.0 84.6 67.0 2.0
Sum (%) 100.0 99.7 100.0 99.6 99.9 100.1
Species distribution (%)
Pa2O5(s)
Inside the canister
Bentonite/rock interface
Species distribution (%)

152
Uranium (U) solubility data sheet
Uranium (U)
Saline KR20/465/1
Brackish KR6/135/8
Dilute, carbonate
rich KR4/81/1
Brine KR4/861/1
High alkaline Glacial melt water
LogK uncertainty (ANDRA db)
Solubility controlling solid phase
1.09
Solubility (mol
L-1)4.1E-09 2.4E-08 9.4E-09 2.1E-09 3.0E-09 8.7E-09
UIV(OH)4 70.9 12.9 33.5 99.3 99.8 36.3 1.4
UVIO2(CO3)34- 22.7 57.2 52.0 37.9 0.04
UVIO2(CO3)22- 2.4 19.3 12.3 4.5 0.09
UVIO2(CO3) 0.1 2.0 0.3 0.03
UVIO2(OH)+ 0.1 0.24
UVIO2(OH)3- 0.2 20.0 0.42
UVO2+ 3.4 8.3 1.6 0.2 0.02
Sum (%) 99.6 99.8 99.7 99.3 100.0 98.9
Solubility controlling solid phase
UranophaneUO2:H20 1.09
Uranophane 5.06
Solubility (mol
L-1)3.3E-09 6.3E-09 2.0E-08 1.2E-09 1.5E-09 1.9E-09
UIV(OH)4 91.0 63.8 28.3 97.3 99.9 1.4
UIV(OH)3+ 1.6 1.3 0.2 2.1 -
UVIO2(CO3)34- 0.8 17.7 56.8 36.7 0.04
UVIO2(CO3)22- 6.1 12.9 4.2 0.09
UVIO2(CO3) 0.6 0.03
UVIO2(OH)2 1.4 0.07
UVIO2(OH)3- 57.1 0.42
UVO2+ 6.1 10.4 1.5 0.5 0.02
Sum (%) 99.5 100.0 99.7 99.8 99.9 99.4
UO2:H2O (am)
UO2:H2O (am)
Inside the canister
Bentonite/rock interface
Species distribution (%)
Species distribution (%)

153
Neptunium (Np) solubility data sheet
Neptunium (Np)
Saline KR20/465/1
Brackish KR6/135/8
Dilute, carbonate
rich KR4/81/1
Brine KR4/861/1
High alkaline Glacial melt water
LogK uncertainty (ANDRA db)
Solubility controlling solid phase
0.5
Solubility (mol
L-1)9.6E-10 1.0E-09 1.2E-09 6.8E-10 9.5E-10 1.0E-09
NpIV(OH)4 96.6 92.9 83.3 99.30 100.00 98.6 1.0
NpIV(CO3)(OH)3- 2.9 5.2 15.4 0.00 1.3 1.1
NpIV(OH)3+ 0.5 1.9 0.7 0.71 1.0
NpIV(OH)2(CO3)22- 0.00 1.5
Sum (%) 100.0 99.9 99.4 100.0 100.0 99.9
Solubility (mol
L-1)1.0E-09 1.1E-09 1.3E-09 7.0E-10 9.5E-10 1.0E-09
NpIV(OH)4 93.7 89.0 77.9 96.38 99.95 99.0 1.0
NpIV(CO3)(OH)3- 3.7 7.9 20.0 0.27 0.01 0.9 1.1
NpIV(OH)3+ 2.6 2.9 0.9 3.31 1.0
NpIV(OH)2(CO3)22- 1.1 1.5
Sum (%) 99.6 99.9 99.9 99.56 100.0 99.2
Species distribution (%)
NpO2:2H2O(am)
Inside the canister
Bentonite/rock interface
Species distribution (%)

154
Plutonium (Pu) solubility data sheet
Plutonium (Pu)
Saline KR20/465/1
Brackish KR6/135/8
Dilute, carbonate
rich KR4/81/1
Brine KR4/861/1
High alkaline Glacial melt water
LogK uncertainty (ANDRA db)
Solubility controlling solid phase
0.6
Solubility (mol
L-1)1.2E-10 4.3E-10 1.8E-09 1.2E-09 1.3E-11 1.4E-11
PuIII(SO4)+ 30.6 14.1 1.2 0.66
PuIII(CO3)+ 21.9 52.2 65.1 4.6 0.86
PuIII(SO4)2- 18.9 0.8 0.0 0.91
PuIII(OH)2+ 10.3 10.9 2.3 74.0 0.3
PuIII(OH)2+ 3.4 -
PuIII 4.5 15.6 17.1 0.67
PuIII(CO3)2- 2.3 2.8 26.8 0.86
PuIII(CO3)33- 2.9 10.6
PuIV(OH)4 10.5 3.1 0.8 99.2 99.8 0.5
PuIV(OH)3+ 0.3 0.3
Sum (%) 99.1 99.7 99.0 99.1 99.2 99.8
Solubility (mol
L-1)7.4E-09 1.1E-08 5.8E-09 3.4E-08 1.3E-11 1.4E-11
PuIII(SO4)+ 0.9 15.3 1.1 0.66
PuIII(CO3)+ 47.6 56.2 65.7 12.35 0.86
PuIII(SO4)2- 0.0 0.9 0.91
PuIII(OH)2+ 15.9 7.3 1.7 41.24 0.3
PuIII 34.0 17.1 0.8 45.92 0.67
PuIII(CO3)2- 1.3 3.0 27.1 0.86
PuIII(CO3)33- 3.0 10.6
PuIV(OH)4 98.8 100.0 0.5
PuIV(OH)3+ 0.3
Sum (%) 99.7 99.9 99.4 99.5 98.8 100.0
Species distribution (%)
PuO2:2H2O (am)
Inside the canister
Bentonite/rock interface
Species distribution (%)

155
Americium (Am) and curium (Cm) solubility data sheet
Americium (Am) and Curium (Cm)
Saline KR20/465/1
Brackish KR6/135/8
Dilute, carbonate
rich KR4/81/1
Brine KR4/861/1
High alkaline Glacial melt water
LogK uncertainty (ANDRA db)
Solubility controlling solid phase
Am(CO3)
(OH) (am)
LogK uncertainty of solid phase
1
Solubility (mol
L-1)1.7E-06 6.0E-06 1.9E-06 2.7E-05 1.2E-08 3.3E-08
AmIIIOSi(OH)32+ 53.6 37.6 9.5 83.59 20.5 16.2 0.13
AmIII(CO3)+ 29.5 46.6 69.6 11.2 0.4
AmIII(SO4)+ 5.6 1.7 0.15
AmIII(OH)2+ 3.8 2.7 6.12 1.5 0.5
AmIII3+ 3.4 7.7 0.0 -
AmIII(OH)2+ 1.6 0.3 73.9 50.6 0.7
AmIII(CO3)2- 2.0 1.6 18.2 19.2 0.6
AmIII(HCO3)2+ 1.7 0.8 0.55
AmIII(OH)3 4.1 1.5 0.5
Sum (%) 99.4 99.8 98.2 89.71 99.9 98.7
Solubility (mol
L-1)1.1E-05 5.2E-06 2.3E-06 6.8E-05 1.2E-08 2.3E-08
AmIIIOSi(OH)32+ 44.6 27.5 7.1 68.00 20.5 15.6 0.13
AmIII(CO3)+ 34.8 54.2 71.8 5.43 8.1 0.4
AmIII(SO4)+ 2.0 0.15
AmIII(OH)2+ 3.2 2.0 4.99 1.5 0.5
AmIII3+ 13.7 9.1 0.5 11.09 0.0 -
AmIII(OH)2+ 0.60 73.9 59.9 0.7
AmIII(CO3)2- 0.6 1.8 18.7 13.0 0.6
AmIII(HCO3)2+ 1.8 3.1 1.2 0.55
AmIIICl2+ 0.7 8.79 0.03
AmIII(OH)3 4.1 2.2 0.5
Sum (%) 99.4 99.6 99.3 98.89 99.9 98.9
Am(CO3)2Na:5H2O (s) Am(OH)3 (am)
0.5 0.8
Inside the canister
Bentonite/rock interface
Species distribution (%)
Species distribution (%)
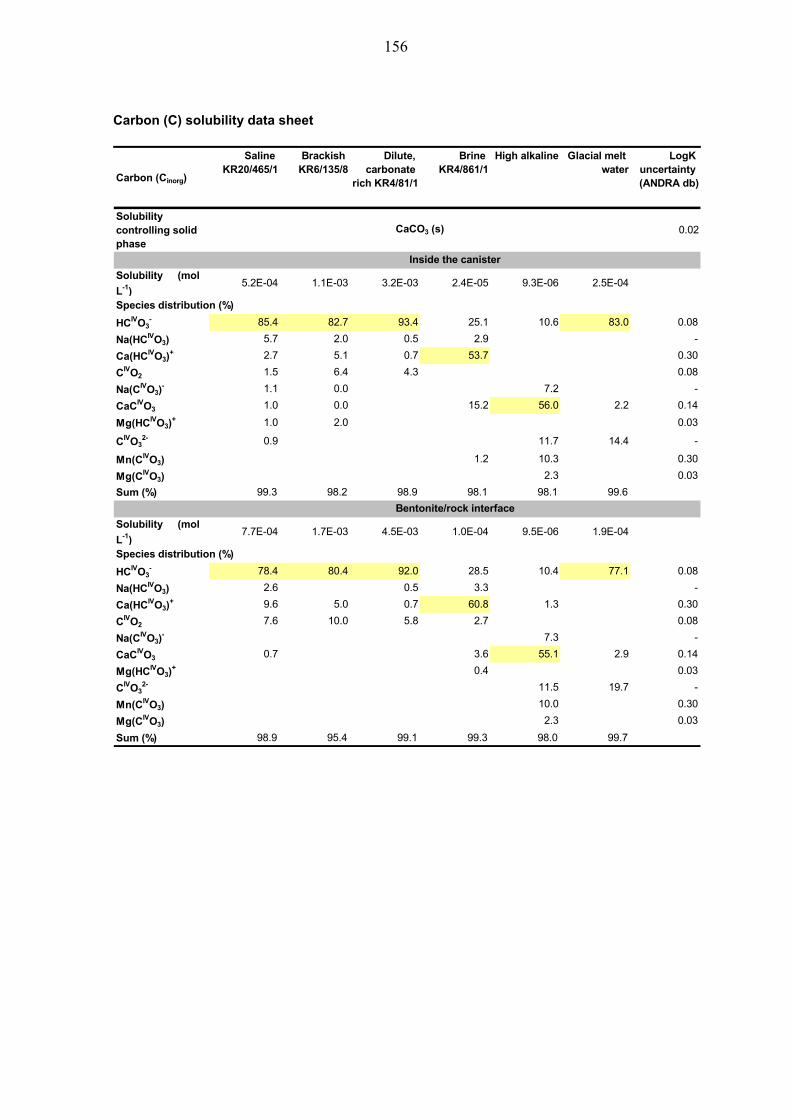
156
Carbon (C) solubility data sheet
Carbon (Cinorg)
Saline KR20/465/1
Brackish KR6/135/8
Dilute, carbonate
rich KR4/81/1
Brine KR4/861/1
High alkaline Glacial melt water
LogK uncertainty (ANDRA db)
Solubility controlling solid phase
0.02
Solubility (mol
L-1)5.2E-04 1.1E-03 3.2E-03 2.4E-05 9.3E-06 2.5E-04
HCIVO3- 85.4 82.7 93.4 25.1 10.6 83.0 0.08
Na(HCIVO3) 5.7 2.0 0.5 2.9 -
Ca(HCIVO3)+ 2.7 5.1 0.7 53.7 0.30
CIVO2 1.5 6.4 4.3 0.08
Na(CIVO3)- 1.1 0.0 7.2 -
CaCIVO3 1.0 0.0 15.2 56.0 2.2 0.14
Mg(HCIVO3)+ 1.0 2.0 0.03
CIVO32- 0.9 11.7 14.4 -
Mn(CIVO3) 1.2 10.3 0.30
Mg(CIVO3) 2.3 0.03
Sum (%) 99.3 98.2 98.9 98.1 98.1 99.6
Solubility (mol
L-1)7.7E-04 1.7E-03 4.5E-03 1.0E-04 9.5E-06 1.9E-04
HCIVO3- 78.4 80.4 92.0 28.5 10.4 77.1 0.08
Na(HCIVO3) 2.6 0.5 3.3 -
Ca(HCIVO3)+ 9.6 5.0 0.7 60.8 1.3 0.30
CIVO2 7.6 10.0 5.8 2.7 0.08
Na(CIVO3)- 7.3 -
CaCIVO3 0.7 3.6 55.1 2.9 0.14
Mg(HCIVO3)+ 0.4 0.03
CIVO32- 11.5 19.7 -
Mn(CIVO3) 10.0 0.30
Mg(CIVO3) 2.3 0.03
Sum (%) 98.9 95.4 99.1 99.3 98.0 99.7
Species distribution (%)
CaCO3 (s)
Inside the canister
Bentonite/rock interface
Species distribution (%)

157
Radium (Ra) solubility data sheet
Radium (Ra)
Saline KR20/465/1
Brackish KR6/135/8
Dilute, carbonate
rich KR4/81/1
Brine KR4/861/1
High alkaline Glacial melt water
LogK uncertainty (ANDRA db)
Solubility controlling solid phase
-
Solid solution x
Solubility (mol
L-1)1.6E-11 6.7E-11 7.2E-11 2.5E-08 1.8E-09 4.2E-10
RaII(SO4) 59.7 15.0 14.3 0.6 2.5 0.3
RaII 38.6 82.3 84.5 56.4 95.0 96.5 -
RaIICl+ 1.5 2.5 27.4 4.1 -
RaIICl2 16.2 0.3
RaII(HCO3)+ 0.6 -
Sum (%) 99.8 99.7 99.4 100.0 99.7 99.0
Solubility (mol
L-1)1.7E-09 6.7E-11 7.7E-11 2.4E-08 1.7E-09 4.1E-10
RaII(SO4) 0.6 15.0 13.5 0.6 2.5 0.3
RaII 94.8 82.2 85.3 56.5 95.2 96.4 -
RaIICl+ 4.1 2.5 27.3 4.1 -
RaIICl2 16.1 0.3
RaII(HCO3)+ 0.8 -
Sum (%) 99.5 99.7 99.5 100.0 99.9 98.9
Species distribution (%)
Ra(x)Ba(1-x)SO4
Inside the canister
Bentonite/rock interface
Species distribution (%)
0.000329

158
Strontium (Sr) solubility data sheet
Strontium (Sr)
Saline KR20/465/1
Brackish KR6/135/8
Dilute, carbonate
rich KR4/81/1
Brine KR4/861/1
High alkaline Glacial melt water
LogK uncertainty (ANDRA db)
Solubility controlling solid phase
SrSO4 0.16
SrCO3 0.02
Solubility (mol
L-1)1.3E-04 7.4E-04 1.8E-04 7.5E-02 4.9E-03 2.0E-05
Sr2+ 61.6 87.8 91.0 50.0 91.4 96.9 -
Sr(SO4) 33.1 6.2 5.3 0.8 0.05
SrCl+ 5.2 5.6 0.9 50.0 8.4 0.05
Sr(HCO3)+ 0.4 2.5 -
Sr(CO3) 1.8 -
Sum (%) 100.0 100.0 99.7 100.0 99.8 99.5
Solubility controlling solid phase
Strontianite (SrCO3)
Celestite (SrSO4)
SrSO4 0.16
SrCO3 0.02
Solubility (mol
L-1)5.0E-03 8.7E-04 1.8E-04 7.5E-02 5.1E-03 2.7E-05
Sr2+ 91.1 88.4 91.0 49.9 91.2 97.8 -
Sr(SO4) 0.0 5.3 4.9 0.0 0.0 0.0 0.05
SrCl+ 8.4 5.6 0.0 50.0 8.5 0.0 0.05
Sr(HCO3)+ 0.3 0.0 3.3 0.0 0.0 0.0 -
Sr(CO3) 0.0 0.0 0.0 0.0 0.0 1.3 -
Sum (%) 99.8 99.4 99.2 100.0 99.7 99.1
Strontianite (SrCO3)
Species distribution (%)
Inside the canister
Bentonite/rock interface
Species distribution (%)
Celestite (SrSO4) Strontianite (SrCO3)

159
Selenium (Se) solubility data sheet
Selenium (Se)
Saline KR20/465/1
Brackish KR6/135/8
Dilute, carbonate
rich KR4/81/1
Brine KR4/861/1
High alkaline Glacial melt water
LogK uncertainty (ANDRA db)
Solubility controlling solid phase
2.73
Solubility (mol
L-1)5.8E-10 5.9E-11 3.3E-10 8.2E-09 2.0E-07 5.9E-09
HSe-II- 99.9 100.0 100.0 100.0 100.0 91.9 0.4
Se-II32- 4.2 1.1
Se-II42- 3.8 1.3
Sum (%) 99.9 100.0 100.0 100.0 100.0 100.0
Solubility (mol
L-1)1.7E-09 4.9E-10 4.7E-10 1.2E-08 5.9E-09 1.3E-08
HSe-II- 100.0 100.0 100.0 99.8 99.9 0.9 0.4
Se-II32- 8.5 1.1
Se-II42- 90.6 1.3
Sum (%) 100.0 100.0 100.0 99.8 99.9 100.0
Species distribution (%)
FeSe2(s)
Inside the canister
Bentonite/rock interface
Species distribution (%)
Tin (Sn) solubility data sheet
Tin (Sn)
Saline KR20/465/1
Brackish KR6/135/8
Dilute, carbonate
rich KR4/81/1
Brine KR4/861/1
High alkaline Glacial melt water
LogK uncertainty (ANDRA db)
Solubility controlling solid phase
0.61
Solubility (mol
L-1)1.1E-07 6.3E-08 7.6E-08 7.0E-08 1.3E-05 4.2E-06
SnIV(OH)5- 57.0 23.7 34.1 54.6 52.4 78.8 0.53
SnIV(OH)4 42.5 76.2 65.9 45.2 0.0 1.2 0.44
SnIV(OH)62- 47.3 20.0 0.53
Sum (%) 99.5 99.9 100.1 99.8 99.7 99.9
Solubility (mol
L-1)5.9E-08 5.7E-08 6.9E-08 3.9E-08 1.3E-05 3.3E-06
SnIV(OH)5- 19.7 16.2 27.5 20.1 53.3 81.7 0.53
SnIV(OH)4 80.3 83.8 72.6 80.0 1.5 0.44
SnIV(OH)62- 47.0 16.8 0.53
Sum (%) 100.0 99.9 100.1 100.0 100.3 100.0
Species distribution (%)
SnO2(am)
Inside the canister
Bentonite/rock interface
Species distribution (%)

160
Beryllium (Be) solubility data sheet

161
Nickel (Ni) solubility data sheet
Nickel (Ni)
Saline KR20/465/1
Brackish KR6/135/8
Dilute, carbonate
rich KR4/81/1
Brine KR4/861/1
High alkaline Glacial melt water
LogK uncertainty (ANDRA db)
Solubility controlling solid phase
0.28
Solubility (mol
L-1)9.3E-05 8.3E-04 1.2E-04 6.2E-05 1.2E-07 1.4E-07
NiII 53.8 85.1 84.6 57.1 3.1 8.6 -
NiII(SO4) 32.4 6.2 5.5 0.03
NiII(SO4)22- 5.5 0.1 -
NiIIHS+ 3.5 0.1 1.7 0.2
NiIICl+ 3.2 4.0 0.6 42.1 0.6
NiII(OH)+ 0.5 0.2 0.7 0.8 3.6 7.3 0.14
NiII(HS)2 0.5 2.0 0.1
NiII(HCO3)+ 0.7 3.8 -
NiII(CO3) 0.3 4.1 3.6 0.4
NiII(OH)3- 4.8 1.1 0.3
NiII(OH)2 84.6 79.0 0.3
Sum (%) 99.4 96.7 99.3 99.9 99.8 99.7
Solubility (mol
L-1)1.5E-03 2.1E-03 2.3E-04 1.4E-03 1.2E-07 1.2E-07
NiII 92.8 88.4 84.3 57.6 3.0 4.3 -
NiII(SO4) 6.1 5.2 0.03
NiII(SO4)22- -
NiIIHS+ 0.1 1.7 0.2
NiIICl+ 6.1 4.0 0.6 42.2 0.0 0.6
NiII(OH)+ 0.5 0.1 3.5 5.3 0.14
NiII(HS)2 2.0 0.1
NiII(HCO3)+ 0.2 1.1 5.1 -
NiII(CO3) 4.1 1.9 0.4
NiII(OH)3- 4.9 1.8 0.3
NiII(OH)2 84.7 86.5 0.3
NiIIF+ 0.08
Sum (%) 99.1 99.5 100.0 100.0 99.9 99.9
Species distribution (%)
Ni(OH)2(s)
Inside the canister
Bentonite/rock interface
Species distribution (%)

162
Niobium (Nb) solubility data sheet Calculations with Andra/Thermochimie db
Niobium (Nb)
Saline KR20/465/1
Brackish KR6/135/8
Dilute, carbonate
rich KR4/81/1
Brine KR4/861/1
High alkaline Glacial melt water
LogK uncertainty (ANDRA db)
Solubility controlling solid phase
0.51
Solubility
(mol L-1)9.5E-07 1.9E-07 3.4E-07 5.2E-07 2.7E-03 1.3E-04
NbV(OH)6- 77.7 93.8 92.1 87.3 3.1 16.7 -
NbV(OH)72- 22.2 6.0 7.6 12.6 96.8 83.5 1.1
NbV(OH)5 0.1 0.4 0.2 0.1 0.3
Sum (%) 99.9 100.1 99.9 100.0 99.9 100.2
Solubility
(mol L-1) 1.5E-07 1.2E-07 2.4E-07 9.7E-08 2.8E-03 2.8E-04
NbV(OH)6- 94.5 95.3 94.1 97.0 3.0 11.8 -
NbV(OH)72- 4.9 3.8 5.7 2.9 97.2 88.3 1.1
NbV(OH)5 0.5 0.6 0.3 0.5 0.3
Sum (%) 99.9 99.7 100.2 100.4 100.2 100.0 0.0
Nb2O5(s)
Inside the canister
Bentonite/rock interface
Species distribution (%)
Species distribution (%)
Calculations with Nagra/PSI db
Niobium (Nb)
Saline KR20/465/1
Brackish KR6/135/8
Dilute, carbonate
rich KR4/81/1
Brine KR4/861/1
High alkaline Glacial melt water
Solubility controlling solid phase
Solubility (mol
L-1) 9.0E-05 3.4E-05 4.7E-05 8.3E-05 9.9E-03 2.4E-03
NbVO3- 85.0 57.7 68.3 89.8 99.9 99.4
NbV(OH)5 15.0 42.3 31.7 10.2 0.1 0.6
Sum (%) 100.0 100.0 100.0 100.0 100.0 100.0
Solubility (mol
L-1) 3.2E-05 2.6E-05 3.8E-05 3.0E-05 9.9E-03 3.6E-03
NbVO3- 55.8 45.8 60.9 71.6 99.9 99.6
NbV(OH)5 44.2 54.2 39.1 28.4 0.1 0.4
Sum (%) 100.0 100.0 100.0 100.0 100.0 100.0
Species distribution (%)
Species distribution (%)
Nb2O5(cr)
Inside the canister
Bentonite/rock interface

163
Molybdenium (Mo) solubility data sheet
Molybdenum (Mo)
Saline KR20/465/1
Brackish KR6/135/8
Dilute, carbonate
rich KR4/81/1
Brine KR4/861/1
High alkaline Glacial melt water
LogK uncertainty (ANDRA db)
Solubility controlling solid phase
MoO2 0.5
CaMoO4 0.33
Solubility (mol
L-1)3.1E-06 2.4E-06 1.6E-07 1.1E-10 4.2E-06 1.0E-04
MoVIO42- 99.9 99.8 99.7 99.9 100.0 100.0 -
Sum (%) 99.9 99.8 99.7 99.9 100.0 100.0
Solubility (mol
L-1)8.8E-09 2.3E-08 5.2E-08 1.1E-11 4.1E-06 9.9E-05
MoVIO42- 99.9 100.0 99.9 99.9 100.0 100.0 -
Sum (%) 99.9 100.0 99.9 99.9 100.0 100.0
Species distribution (%)
Inside the canister
Bentonite/rock interface
Species distribution (%)
MoO2(s) CaMoO4(s)
Technetium (Tc) solubility data sheet
Technetium (Tc)
Saline KR20/465/1
Brackish KR6/135/8
Dilute, carbonate
rich KR4/81/1
Brine KR4/861/1
High alkaline Glacial melt water
LogK uncertainty (ANDRA db)
Solubility controlling solid phase
0.5
Solubility (mol
L-1)3.7E-09 3.9E-09 4.0E-09 2.8E-09 4.6E-09 4.2E-09
TcIVO(OH)2 99.7 99.5 98.8 99.7 82.1 94.8 -
(TcIVO)(OH)3- 17.8 5.1 0.8
Sum (%) 99.7 99.5 98.8 99.7 99.9 99.9
Solubility (mol
L-1)3.8E-09 3.9E-09 4.0E-09 2.7E-09 4.6E-09 4.6E-09
TcIVO(OH)2 99.6 99.3 98.6 99.9 82.2 86.5 -
(TcIVO)(OH)3- 0.0 0.0 0.0 0.0 17.8 6.9 0.8
Sum (%) 99.6 99.3 98.6 99.9 100.0 99.9
TcO2:1.63H2O(s)
Species distribution (%)
Inside the canister
Bentonite/rock interface
Species distribution (%)

164
Palladium (Pd) solubility data sheet
Palladium (Pd)
Saline KR20/465/1
Brackish KR6/135/8
Dilute, carbonate
rich KR4/81/1
Brine KR4/861/1
High alkaline Glacial melt water
LogK uncertainty (ANDRA db)
Solubility controlling solid phase
0.5
Solubility (mol
L-1)3.7E-06 3.9E-06 4.0E-06 6.3E-06 3.8E-06 4.0E-06
PdII(OH)2 99.8 99.7 99.9 42.8 99.0 99.7 -
PdIICl42- 50.2 0.2
PdIICl3- 5.5 0.2
Sum (%) 99.8 99.7 99.9 98.5 99.0 99.7
Solubility (mol
L-1)3.9E-06 3.9E-06 4.0E-06 8.5E-05 3.8E-06 4.0E-06
PdII(OH)2 98.2 99.5 99.9 3.2 99.1 99.6 -
PdIICl42- 1.2 0.3 0.0 86.7 0.0 0.0 0.2
PdIICl3- 0.0 0.0 0.0 9.5 0.0 0.0 0.2
Sum (%) 99.4 99.8 99.9 99.4 99.1 99.6
Pd(OH)2(s)
Species distribution (%)
Inside the canister
Bentonite/rock interface
Species distribution (%)
165
Silver (Ag) solubility data sheet
Silver (Ag)
Saline KR20/465/1
Brackish KR6/135/8
Dilute, carbonate
rich KR4/81/1
Brine KR4/861/1
High alkaline Glacial melt water
LogK uncertainty (ANDRA db)
Solubility controlling solid phase
0.04
Solubility (mol
L-1)9.9E-06 5.1E-06 6.9E-07 2.5E-04 1.0E-05 1.6E-06
AgICl2- 57.9 71.6 47.7 13.6 58.2 -
AgICl32- 19.6 14.3 20.6 19.6 -
AgICl43- 19.5 7.8 65.7 18.9 -
AgICl 3.1 6.2 47.5 3.1 21.3 -
AgI+ 3.3 77.1 -
AgIBr 0.8 -
AgICO3- 1.2 0.3
Sum (%) 100.0 99.9 99.3 99.8 99.8 99.6
Solubility (mol
L-1)1.0E-05 5.2E-06 6.9E-07 2.5E-04 1.0E-05 1.6E-06
AgICl2- 58.3 71.5 47.4 13.6 57.8 -
AgICl32- 19.6 14.4 20.6 19.7 -
AgICl43- 18.9 7.9 65.9 19.2 -
AgICl 3.1 6.2 47.8 3.1 21.3 -
AgI+ 3.4 76.5 -
AgIBr -
AgICO3- 1.2 0.3
Sum (%) 99.9 99.9 98.6 100.0 99.9 99.0
Species distribution (%)
AgCl (cr)
Inside the canister
Bentonite/rock interface
Species distribution (%)
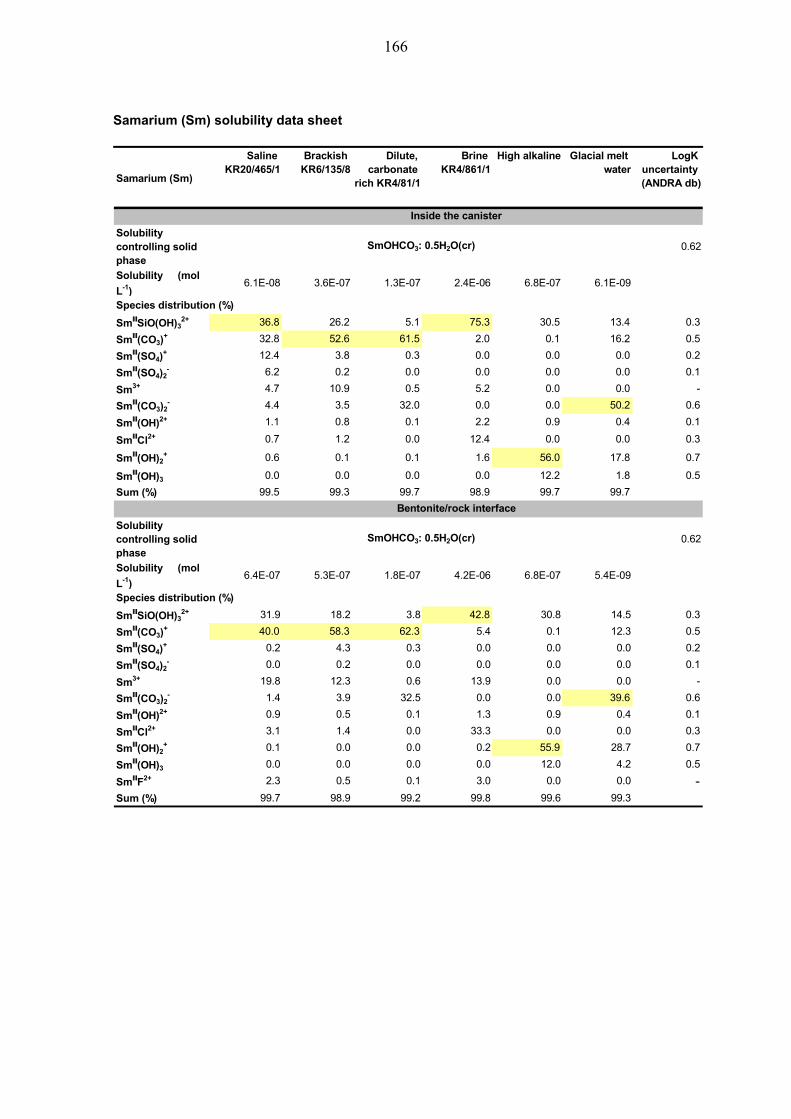
166
Samarium (Sm) solubility data sheet
Samarium (Sm)
Saline KR20/465/1
Brackish KR6/135/8
Dilute, carbonate
rich KR4/81/1
Brine KR4/861/1
High alkaline Glacial melt water
LogK uncertainty (ANDRA db)
Solubility controlling solid phase
0.62
Solubility (mol
L-1)6.1E-08 3.6E-07 1.3E-07 2.4E-06 6.8E-07 6.1E-09
SmIIISiO(OH)32+ 36.8 26.2 5.1 75.3 30.5 13.4 0.3
SmIII(CO3)+ 32.8 52.6 61.5 2.0 0.1 16.2 0.5
SmIII(SO4)+ 12.4 3.8 0.3 0.0 0.0 0.0 0.2
SmIII(SO4)2- 6.2 0.2 0.0 0.0 0.0 0.0 0.1
Sm3+ 4.7 10.9 0.5 5.2 0.0 0.0 -
SmIII(CO3)2- 4.4 3.5 32.0 0.0 0.0 50.2 0.6
SmIII(OH)2+ 1.1 0.8 0.1 2.2 0.9 0.4 0.1
SmIIICl2+ 0.7 1.2 0.0 12.4 0.0 0.0 0.3
SmIII(OH)2+ 0.6 0.1 0.1 1.6 56.0 17.8 0.7
SmIII(OH)3 0.0 0.0 0.0 0.0 12.2 1.8 0.5
Sum (%) 99.5 99.3 99.7 98.9 99.7 99.7
Solubility controlling solid phase
0.62
Solubility (mol
L-1)6.4E-07 5.3E-07 1.8E-07 4.2E-06 6.8E-07 5.4E-09
SmIIISiO(OH)32+ 31.9 18.2 3.8 42.8 30.8 14.5 0.3
SmIII(CO3)+ 40.0 58.3 62.3 5.4 0.1 12.3 0.5
SmIII(SO4)+ 0.2 4.3 0.3 0.0 0.0 0.0 0.2
SmIII(SO4)2- 0.0 0.2 0.0 0.0 0.0 0.0 0.1
Sm3+ 19.8 12.3 0.6 13.9 0.0 0.0 -
SmIII(CO3)2- 1.4 3.9 32.5 0.0 0.0 39.6 0.6
SmIII(OH)2+ 0.9 0.5 0.1 1.3 0.9 0.4 0.1
SmIIICl2+ 3.1 1.4 0.0 33.3 0.0 0.0 0.3
SmIII(OH)2+ 0.1 0.0 0.0 0.2 55.9 28.7 0.7
SmIII(OH)3 0.0 0.0 0.0 0.0 12.0 4.2 0.5
SmIIIF2+ 2.3 0.5 0.1 3.0 0.0 0.0 -Sum (%) 99.7 98.9 99.2 99.8 99.6 99.3
SmOHCO3: 0.5H2O(cr)
Species distribution (%)
Inside the canister
Bentonite/rock interface
Species distribution (%)
SmOHCO3: 0.5H2O(cr)

167
Europium (Eu) solubility data sheet
Europium (Eu)
Saline KR20/465/1
Brackish KR6/135/8
Dilute, carbonate
rich KR4/81/1
Brine KR4/861/1
High alkaline Glacial melt water
LogK uncertainty (ANDRA db)
Solubility controlling solid phase
1.15
Solubility (mol
L-1)5.4E-08 1.3E-07 5.4E-08 8.1E-07 2.2E-07 2.3E-09
EuIII(CO3)+ 37.5 57.6 62.3 2.4 0.1 17.4 0.5
EuIIISiO(OH)32+ 33.4 22.8 4.1 71.1 30.4 11.4 0.3
EuIII(SO4)+ 11.2 3.3 0.2 0.0 0.0 0.0 0.3
EuIII(SO4)2- 5.6 0.2 0.0 0.0 0.0 0.0 0.3
EuIII(CO3)2- 5.0 3.9 32.4 0.0 0.0 53.8 0.7
Eu3+ 4.3 9.5 0.4 4.9 0.0 0.0 -
EuIII(OH)2+ 1.2 0.8 0.1 2.7 1.1 0.4 0.4
EuIIICl2+ 0.7 1.2 0.0 12.9 0.0 0.0 0.4
EuIII(OH)2+ 0.5 0.1 0.1 1.5 55.9 15.2 0.7
Eu2+ 0.0 0.0 0.0 1.9 0.0 0.0 9.36
EuIIIF2+ 0.5 0.5 0.1 1.4 0.0 0.1 0.03
EuIII(OH)3 0.0 0.0 0.0 0.0 12.1 1.5 0.5
Sum (%) 100.0 99.8 99.9 98.8 99.7 99.8
Solubility controlling solid phase
1.15
Solubility (mol
L-1)2.3E-07 2.0E-07 7.5E-08 1.5E-06 2.2E-07 2.0E-09
EuIII(CO3)+ 45.0 63.0 63.0 6.2 0.1 13.7 0.5
EuIIISiO(OH)32+ 28.4 15.6 3.1 38.6 30.7 12.8 0.3
EuIII(SO4)+ 0.2 3.7 0.2 0.0 0.0 0.0 0.3
EuIII(SO4)2- 0.0 0.2 0.0 0.0 0.0 0.0 0.3
EuIII(CO3)2- 1.5 4.2 32.9 0.0 0.0 43.9 0.7
Eu3+ 17.7 10.5 0.4 12.7 0.0 0.0 -
EuIII(OH)2+ 1.0 0.6 0.1 1.5 1.1 0.5 0.4
EuIIICl2+ 3.1 1.3 0.0 33.4 0.0 0.0 0.4
EuIII(OH)2+ 0.1 0.0 0.0 0.2 55.7 25.3 0.7
Eu2+ 0.0 0.0 0.0 0.7 0.0 0.0 9.36
EuIIIF2+ 2.7 0.6 0.1 3.6 0.0 0.0 0.03
EuIII(OH)3 0.0 0.0 0.0 0.0 12.0 3.7 0.5
Sum (%) 99.5 98.6 99.3 96.8 99.5 99.3
Inside the canister
Bentonite/rock interface
Species distribution (%)
Eu(CO3)(OH):0.5H2O(s)
Eu(CO3)(OH):0.5H2O(s)
Species distribution (%)

168

169
APPENDIX B - SORPTION DATA
B1 Overview sorption
Table B-1. Compilation of best estimate Kd value for reference and bounding porewaters and the associated UF.
UF
Saline KR20/465/1
Brackish KR6/135/8
Dilute, carbonate
rich KR4/81/1
Brine KR4/861/1
High alkaline Glacial melt water
Thorium (Th) 63 63 63 63 63 63 4.48
Protactinium (Pa) 81 81 81 81 81 81 5.82
Uranium (U) 48 52 18 62 63 0.056 5.8-9.4
Neptunium (Np) 63 63 63 63 63 63 6.27
Plutonium (Pu) 22 99 66 84 23 24 5.82
Americium (Am) Curium (Cm)
50 32 79 20 137 135 4.48
Carbon (14C) 1.9E-04 2.1E-04 5.1E-05 2.2E-03 1.9E-02 6.7E-04 -
Radium (Ra) 1.5E-03 8.7E-03 1.1E-01 1.4E-04 1.8E-02 8.5E-01 6.00
Caesium (Cs) 6.2E-02 2.1E-01 4.3E-01 2.4E-02 2.8E-01 6.2E-01 4.48
Strontium (Sr) 1.5E-03 8.7E-03 1.1E-01 1.4E-04 1.8E-02 8.5E-01 6.00
Selenium (Se) 0 0 0 0 0 0 -
Tin (Sn) 31 50 39 45 0.24 1.14 6.27
Beryllium (Be) 39 39 122 33 42.17 133.22 6.30
Iodine (I) 0 0 0 0 0 0 -
Chloride (Cl) 0 0 0 0 0 0 -
Zirconium (Zr) 63 63 63 63 63 63 12.54/6.27
Nickel (Ni) 0.34 0.24 0.57 0.11 3.15 3.15 11.6
Niobium (Nb) 5.43 5.43 5.43 5.43 1.81 1.81 13
Molybdenum (Mo) 7.5E-03 2.1E-02 7.5E-03 1.5E-02 1.5E-04 3.4E-04 20.8/4.16
Technetium (Tc) 63 63 63 63 2 218.8 /6.3//
15.1
Palladium (Pd) 0.70 0.27 0.63 5.0E-03 3.12 3.14 16.3
Silver (Ag) 0 0 0 0 0 2.1E-02 16.0
Europium (Eu) 20 11 34 2.9 89 115 11.6
Samarium (Sm) 18 10 34 3.5 88 113 16.3
best estimate Kd value (m3 kg-1)

170
B2 Sorption data sheets
RN speciation in the free bentonite porewaters and the derivation of best estimate, lower and upper limit Kd. Species marked in yellow are considered not sorption competitive and are included in Fsorb. Species marked blue are included in addition to the yellow marked species for Fsorb with CO3-compl. The hydrolysation of these species is already accounted for by the by a pH sorption edge. Negatively charged hydrolysed (-carbonate) complexes are therefore not extra taken as sorption competitive. If RN Kd values were calculated based on analogue considerations, the Fsorb was defined individually depending on speciation of RN and analogue. Best estimate, lower limit and upper limit Kd recommended for SA are indicated in grey for RN with more than one calculation approach. Thorium (Th) sorption data sheet
Source data parameters and experimental conditions: Literature source: Bradbury & Baeyens (2011a) Mineralogy: MX-80; CEC = 0.79 eq kg-1 Solution composition: synthetic bentonite porewater (SBPW) Equilibrium concentration: <1•10-9 M pH: 7.2-7.7

171
Derivation of sorption values for in-situ reference and bounding porewaters:
Thorium (Th)
Saline KR20/465/1
Brackish KR6/135/8
Dilute, carbonate rich
KR4/81/1
Brine KR4/861/1
High alkaline Glacial melt water
source data B&B
2011a
solubility (mol L-1) in equillibrium with Th(OH)4
(am) 3.6E-09 3.6E-09 1.6E-08 9.3E-10 1.5E-09 2.1E-09 1.0E-09
Th(OH)3(CO3)- 50.4 45.5 51.7 6.6 24.6 32.2
Th(OH)4 37.1 41.5 10.0 90.9 100.0 74.4 63.4
Th(OH)2(CO3)2-2 11.2 8.6 36.8 0.9 2.5
Th(OH)2(CO3) 0.8 3.0 1.4 0.3 0.8
Th(OH)3+ 0.4 1.4 0.1 2.3 1.0
Th(OH)4(CO3)-2 0.1
sum 100 100 100 100 100 100 100
F sorb 0.38 0.43 0.10 0.93 1.00 0.74 0.64
F sorb with CO3-compl. 1.00 1.00 1.00 1.00 1.00 1.00 1.00
Kd source data (m3 kg-1)
CF CEC
CF pH
CF spec 0.58 0.67 0.16 1.45 1.55 1.15
CF spec with CO3-compl 1.00 1.00 1.00 1.00 1.00 1.00UF (UFsource x UFspec x
UFLabField)
Kd porewater (m3 kg-1) 37 42 10 91 98 73
Kd upper limit (Kd x UF) 164 188 44 408 438 326
Kd lower limit (Kd / UF) 8 9 2 20 22 16
Kd porewater (m3 kg-1) 63 63 63 63 63 63
Kd upper limit (Kd x UF) 282 282 282 282 282 282
Kd lower limit (Kd / UF) 14 14 14 14 14 14
Kd values with sorption of CO3-complexes
4.48
Kd values if CO3-complexes were sorption competitive
species distribution (%)
derivation of in-situ Kd values
1
1
63

172
Protactinium (Pa) sorption data sheet Source data parameters and experimental conditions: Literature source: Bradbury & Baeyens (2006) Mineralogy: Na-montmorillonite (SWy-1) CEC = 0.87 ± 0.035 eq kg-1 Solution composition: 0.1 M NaClO4 Equilibrium concentration: <1•10-13 M Sorption edge measurements: pH 3-10.5 Derivation of sorption values for in-situ reference and bounding porewaters:
Uranium (U) sorption data sheet Source data parameters and experimental conditions: U(IV): analogue Th(IV) U(VI): Literature source: Pabalan & Turner (1997) (for pH 7-8) Mineralogy: Ca-montmorillonite (SAz-1), converted in Na-form. CEC = 1.2 eq kg-1 Solution composition: 0.1 M NaNO3 Initial concentration: ~2•10-7 M Literature source: Berry et al. (2007) (for pH >9) Mineralogy: Kunigel-V1 bentonite; CEC = 0.6 eq kg-1 Solution composition: De-ionised water equilibrated with bentonite Initial concentration: 1.5•10-7 M
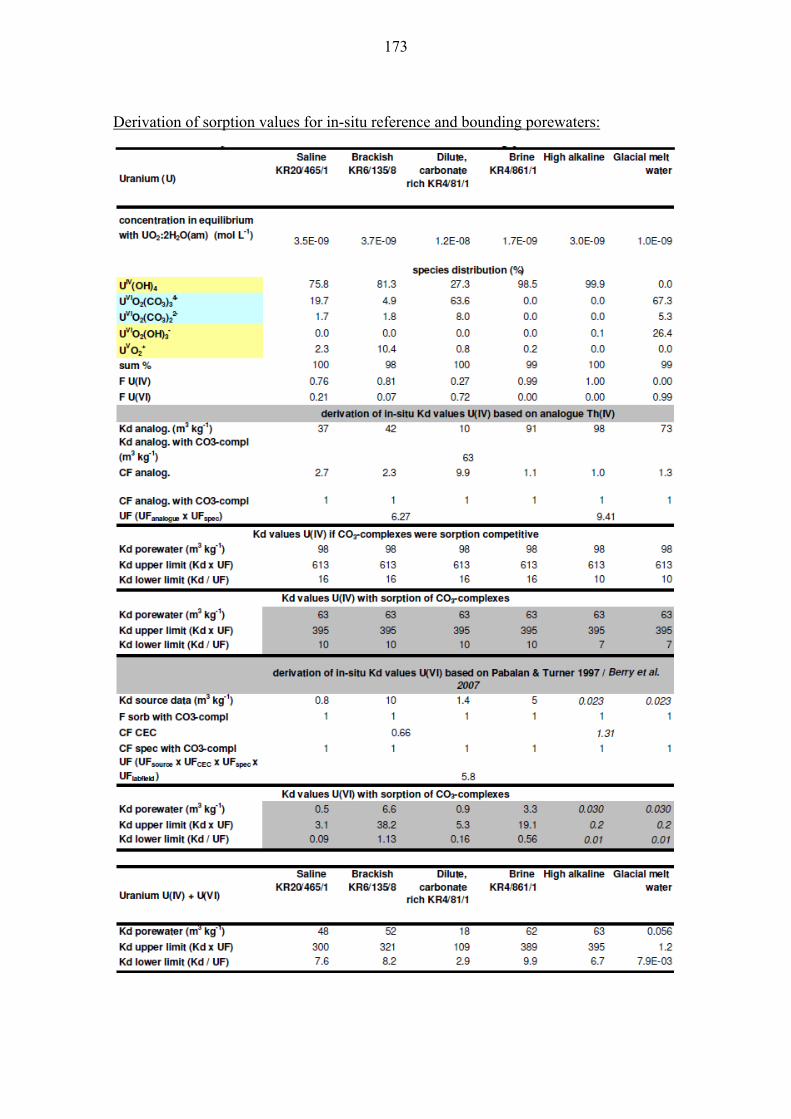
173
Derivation of sorption values for in-situ reference and bounding porewaters:

174
Neptunium (Np) sorption data sheet
Source data parameters and experimental conditions: 1) Selected chemical analogue: Thorium (data source: Bradbury & Baeyens 2010) and 2) Literature source: Sabodina et al. (2006) Mineralogy: Na-Bentonite from Russia CEC = 0.27 eq kg-1 Solution composition: 0.001 M NaClO4 in porewater equilibrated with bentonite Initial Np concentration: 1.2•10-8 M Sorption edge measurements: pH 2-10

175
Derivation of sorption values for in-situ reference and bounding porewaters:
Neptunium (Np)
Saline KR20/465/1
Brackish KR6/135/8
Dilute, carbonate
rich KR4/81/1
Brine KR4/861/1
High alkaline Glacial melt water
solubility (mol L-1) in equillibrium with NpO2:2H2O
(am) 9.1E-10 1.0E-09 1.2E-09 5.5E-10 9.5E-10 1.0E-09
NpIV(OH)4 93.9 93.2 81.0 97.8 100.0 98.5
NpIV(CO3)(OH)3- 5.3 4.3 17.5 0.3 1.4
NpIV(OH)3+ 0.7 2.5 0.6 1.9
NpIV(OH)2(CO3)22- 0.1 0.1 0.9 0.0
sum 100.0 100.0 100.0 100.0 100.0 99.8
F sorb 0.95 0.96 0.82 1.00 1.00 0.99
F sorb with CO3-compl. 1.00 1.00 1.00 1.00 1.00 1.00
Kd source data (m3 kg-1)
F sorb analog.
F sorb analog with CO3-compl. source
CF CEC
CF pH
CF analog 1.49 1.51 1.28 1.57 1.57 1.55
CF analog with CO3-compl 1.00 1.00 1.00 1.00 1.00 1.00
UF (UFTh x UFspec. analogue)
Kd porewater (m3 kg-1) 94 95 81 99 99 98
Kd upper limit (Kd x UF) 588 595 507 620 622 613
Kd lower limit (Kd / UF) 15 15 13 16 16 16
Kd porewater (m3 kg-1) 63 63 63 63 63 63
Kd upper limit (Kd x UF) 395 395 395 395 395 395
Kd lower limit (Kd / UF) 10 10 10 10 10 10
Kd source data 58 37 45 40 45 28
CF CEC
CF pH
CF spec with CO3-compl 1.0 1.0 1.0 1.0 1.0 1.0UF (UFsource x UFCEC x UFspec.
x UFLabField )
Kd porewater (m3 kg-1) 168 107 131 118 131 83
Kd upper limit (Kd x UF) 976 622 764 687 764 481
Kd lower limit (Kd / UF) 29 18 23 20 23 14
6.27
Kd values if CO3-complexes were sorption competitive
Kd values with sorption of CO3-complexes
species distribution (%)
derivation of in-situ Kd values based on Th analogue
1
1
63
0.64
1.00
derivation of Kd values based on Sabodina et al. 2006 pH sorption edge
2.91
1
5.82

176
Plutonium (Pu) sorption data sheet
Source data parameters and experimental conditions: 1) Literature source: Sabodina et al. (2006) Mineralogy: Na-Bentonite from Russia CEC = 0.27 eq kg-1 Solution composition: 0.001 M NaClO4 in porewater equilibrated with bentonite Initial Pu concentration: 3.2•10-10 M Sorption edge measurements: pH 2-10 and 2) Selected chemical analogues: Americium (pH range 7-8) and Thorium(IV) (pH >9)

177
Derivation of sorption values for in-situ reference and bounding porewaters:
Plutonium (Pu)
Saline KR20/465/1
Brackish KR6/135/8
Dilute, carbonate
rich KR4/81/1
Brine KR4/861/1
High alkaline Glacial melt water
Pu concentration in equilibrium with
PuO2:2H2O(am) (mol L-1) 7.48E-09 4.37E-08 1.54E-08 5.14E-09 1.68E-11 1.35E-11
PuIII(SO4)+ 34.3 23.8 1.4 0.0
PuIII(CO3)+ 23.5 37.0 58.6 29.4
PuIII(SO4)2- 28.3 2.0 0.1
PuIII(OH)2+ 6.2 11.3 2.0 53.7 1.4
PuIII3+ 3.7 24.5 0.7 15.3
PuIII(CO3)2- 3.2 1.2 31.5 0.1
PuIII(CO3)33- 0.5 5.6
PuIII(OH)2+ 0.2 0.1 0.1 1.4 5.8
PuIII(OH)3 0.0 16.2
PuIV(OH)4 0.2 0.1 0.1 76.5 99.7( )3
sum % 100.0 99.9 99.9 100.0 100.0 99.7
F sorb 0.10 0.36 0.03 0.71 1.00 1.00
F sorb with CO3-compl. 0.37 0.74 0.99 1.00 1.00 1.00
Kd source data (m3 kg-1) 20 45 23 28 8 8
CF CEC
CF pH
CF spec 0.13 2.50 0.04 2.13 1.00 1.00
CF spec with CO3-compl 0.37 0.75 0.99 1.01 1.00 1.00UF (UFsource x UFCEC x UFspec
x UFLabField)
Kd porewater (m3 kg-1) 7.5 328.2 2.6 175.9 22.8 23.8
Kd upper limit (Kd x UF) 43.8 1911.6 15.0 1024.7 132.8 138.5
Kd lower limit (Kd / UF) 1.3 56.4 0.4 30.2 3.9 4.1
Kd porewater (m3 kg-1) 21.8 99.0 65.6 83.5 22.8 23.8
Kd upper limit (Kd x UF) 127.0 576.4 382.2 486.4 132.8 138.5
Kd lower limit (Kd / UF) 3.7 17.0 11.3 14.3 3.9 4.1
Kd analog. (m3 kg-1) 53 45 9 55 98 73
Kd analog. (m3 kg-1) with CO3-compl 65 67 113 36 63 63
CF spec 1.22 2.11 1.82 4.85 1.00 1.34
CF spec with CO3-compl 0.72 1.33 1.08 3.35 1.00 1.00
UF (UFanalog x UFspec)
Kd porewater (m3 kg-1) 65.1 95.7 15.8 264.9 97.7 97.7
Kd upper limit (Kd x UF) 408.5 600.5 99.3 1661.5 613.0 613.0
Kd lower limit (Kd / UF) 10.4 15.3 2.5 42.2 15.6 15.6
Kd porewater (m3 kg-1) 46.4 89.5 121.6 120.1 63.0 63.0
Kd upper limit (Kd x UF) 290.9 561.1 762.7 753.3 395.1 395.1
Kd lower limit (Kd / UF) 7.4 14.3 19.4 19.2 10.0 10.0
Kd values if CO3-complexes were sorption competive
5.8
Kd values with sorption of CO3-complexes
species distribution (%)
derivation of in-situ Kd values based on Sabodina et al. 2006
2.91
6.3 6.3
Kd values with sorption of CO3-complexes
Kd values if CO3-complexes were sorption competitive
1
derivation of in-situ Kd values based on analogue Am(III) or Th(IV)
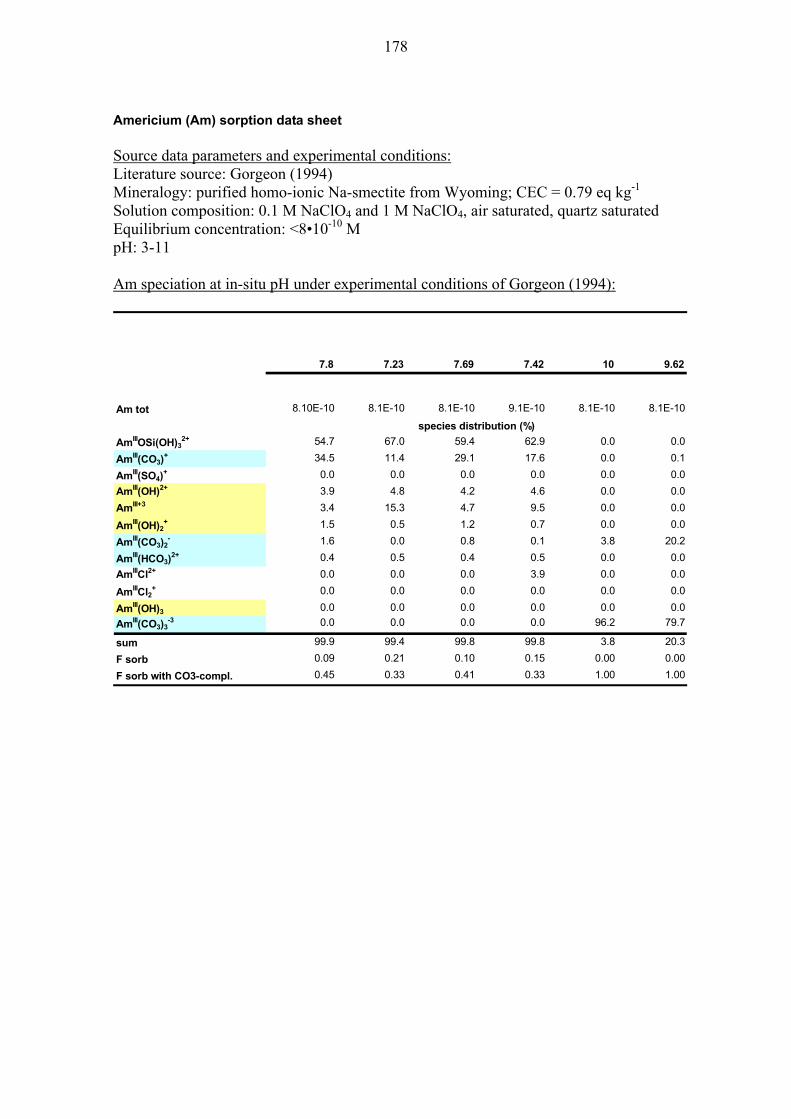
178
Americium (Am) sorption data sheet Source data parameters and experimental conditions: Literature source: Gorgeon (1994) Mineralogy: purified homo-ionic Na-smectite from Wyoming; CEC = 0.79 eq kg-1 Solution composition: 0.1 M NaClO4 and 1 M NaClO4, air saturated, quartz saturated Equilibrium concentration: <8•10-10 M pH: 3-11 Am speciation at in-situ pH under experimental conditions of Gorgeon (1994):
7.8 7.23 7.69 7.42 10 9.62
Am tot 8.10E-10 8.1E-10 8.1E-10 9.1E-10 8.1E-10 8.1E-10
AmIIIOSi(OH)32+ 54.7 67.0 59.4 62.9 0.0 0.0
AmIII(CO3)+ 34.5 11.4 29.1 17.6 0.0 0.1
AmIII(SO4)+ 0.0 0.0 0.0 0.0 0.0 0.0
AmIII(OH)2+ 3.9 4.8 4.2 4.6 0.0 0.0
AmIII+3 3.4 15.3 4.7 9.5 0.0 0.0
AmIII(OH)2+ 1.5 0.5 1.2 0.7 0.0 0.0
AmIII(CO3)2- 1.6 0.0 0.8 0.1 3.8 20.2
AmIII(HCO3)2+ 0.4 0.5 0.4 0.5 0.0 0.0
AmIIICl2+ 0.0 0.0 0.0 3.9 0.0 0.0
AmIIICl2+ 0.0 0.0 0.0 0.0 0.0 0.0
AmIII(OH)3 0.0 0.0 0.0 0.0 0.0 0.0
AmIII(CO3)3-3 0.0 0.0 0.0 0.0 96.2 79.7
sum 99.9 99.4 99.8 99.8 3.8 20.3
F sorb 0.09 0.21 0.10 0.15 0.00 0.00
F sorb with CO3-compl. 0.45 0.33 0.41 0.33 1.00 1.00
species distribution (%)
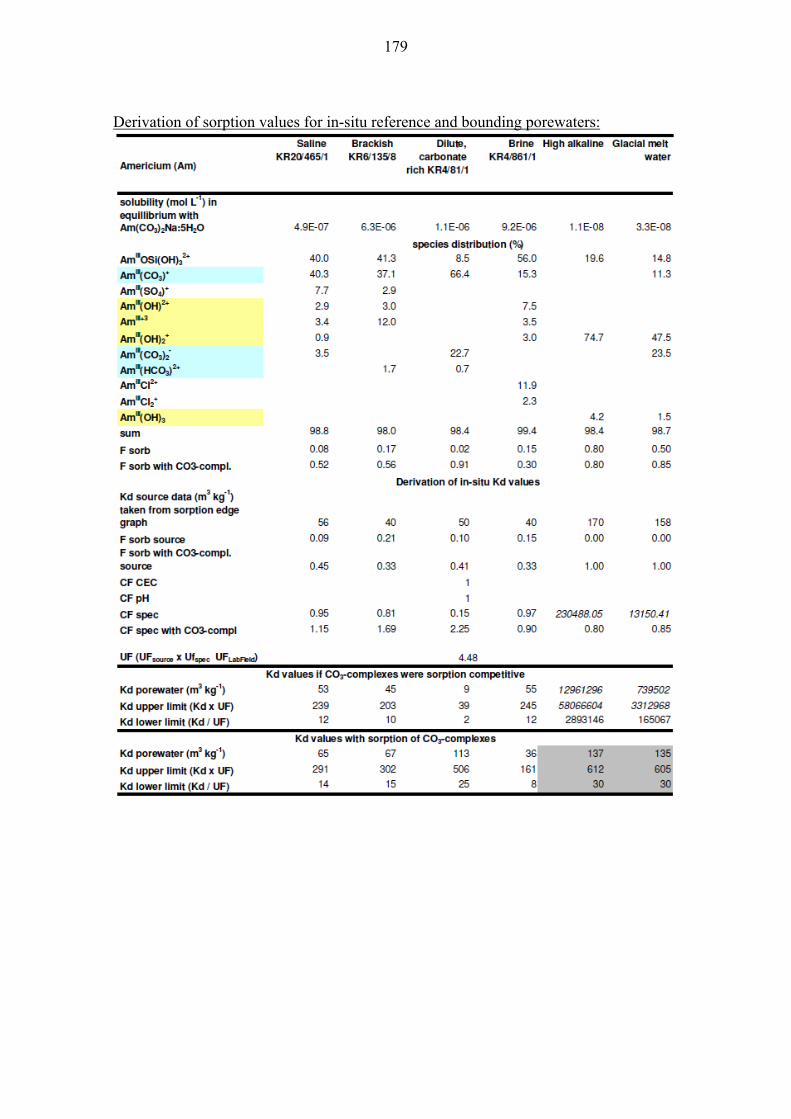
179
Derivation of sorption values for in-situ reference and bounding porewaters:

180
Curium (Cm) sorption data sheet Source data parameters and experimental conditions: Literature source: Grambow et al. (2006) Mineralogy: MX-80 bentonite; CEC = 0.787 eq kg-1 Solution composition: synthetic porewater EST 2, quartz saturated assumed Initial concentration: 5•10-8 M pH: 3-9 Cm speciation at in-situ pH under experimental conditions of Grambow et al. (2006):
7.8 7.23 7.69 7.42
Cm tot 5.01E-08 5.01E-08 5.01E-08 5.01E-08
CmCO3+ 18.5 15.0 18.2 16.7
CmSiO(OH)3+2 67.3 57.9 66.4 62.4
CmSO4+ 3.5 11.2 4.5 7.8
Cm(CO3)2- 0.3 0.1 0.2 0.1
Cm+3 3.3 10.5 4.2 7.3
Cm(OH)+2 4.8 4.1 4.7 4.4
Cm(OH)2+ 2.1 0.5 1.6 0.8
CmCl+20.0 0.1 0.0 0.1
sum 99.8 99.4 99.7 99.6
F sorb 0.10 0.16 0.11 0.13
F sorb with CO3-compl. 0.29 0.31 0.29 0.30
species distribution (%)

181
Derivation of sorption values for in-situ reference and bounding porewaters:

182
Radium (Ra) sorption data sheet Sorption model parameters: Thermodynamic sorption model in PhreeqC using the Andra/Thermochimie database Solid-solution ratio: 3.63 kg L-1 (dry density of 1570 kg m-3) CEC: 0.787 eq kg-1 Cation exchange selectivity coefficients: Bradbury & Baeyens (2002a) Radium selectivity coefficient = Sr selectivity coefficient taken as analogue (KRaNa = 2.8) External surface sites: 0.0284 eq kg-1 (Wieland et al. 1994) DDL thickness calculated from the reciprocal Debye length and a Debye multiplier of 1.2 Derivation of sorption values assuming total Ra of 10-11 M:
Radium (Ra)
Saline KR20/465/1
Brackish KR6/135/8
Dilute, carbonate rich
KR4/81/1
Brine KR4/861/1
High alkaline Glacial melt water
Glacial melt water
Na x 10
initial concentration
(mol L-1)
cation exchange (%) 72.64 95.32 99.18 31.13 94.20 98.06 97.88
surface sorption (%) 3.95 1.25 0.59 2.80 4.35 1.92 2.09
solution (%) 23.41 3.43 0.23 66.07 1.46 0.02 0.03
UF (UFmodel x UFLabField) 6 6 8 6 6 8 8
Kd m3 kg-1 9.0E-04 7.8E-03 1.2E-01 1.4E-04 1.9E-02 1.5E+00 1.1E+00
Kd upper limit (Kd x UF) 5.4E-03 4.7E-02 9.6E-01 8.5E-04 1.1E-01 1.2E+01 8.4E+00
Kd lower limit (Kd / UF) 1.5E-04 1.3E-03 1.5E-02 2.4E-05 3.1E-03 1.9E-01 1.3E-01
1.E-11
These calculations have informative character only. The finally recommended sorption data for Ra is taken form Sr. Derivation of sorption values for in-situ reference and bounding porewaters: see sorption data sheet for strontium

183
Caesium (Cs) sorption data sheet Source data parameters and experimental conditions: Literature source 1: Bradbury & Baeyens (2011a) Mineralogy: MX-80; CEC = 0.79 eq kg-1 Solution composition: synthetic bentonite porewater (SBPW) Equilibrium concentration: <1•10-8 M pH: ~7.6 Na concentration: 0.568 mol L-1
Literature source 2: Grambow et al. (2006) Mineralogy: MX-80, CEC = 0.79 eq kg-1 Solution composition: synthetic groundwater EST site water 1 pH: 2.9-10.4 Na concentration: 0.0264 M Cs speciation and Na concentration in experiments
Caesium (Cs)
Bradbury & Baeyens
2011a
Grambow et al. 2006
concentration (mol L-1) 1.00E-08 1.00E-08
Cs+ 81.5 97.9
CsCl 18.6 2.2
sum 100.1 100.0
F sorbing species via cation exchange with Na 0.82 0.98
Na porewater (mol L-1) 0.568 0.0264

184
Derivation of sorption values for in-situ reference and bounding porewaters:
Caesium (Cs)
Saline KR20/465/1
Brackish KR6/135/8
Dilute, carbonate
rich KR4/81/1
Brine KR4/861/1
High alkaline Glacial melt water
assumed total concentration
(mol L-1) 9.6E-09 1.0E-08 1.0E-08 8.5E-09 1.0E-08 1.0E-08
Cs+ 88.6 91.8 98.9 52.6 92.9 100.0
CsCl 11.3 8.2 1.1 47.1 0.0
sum 99.9 100.0 100.0 99.6 92.9 100.0
F sorbing species via cation exchange with Na 0.89 0.92 0.99 0.53 0.93 1.00
Na porewater (mol L-1) 0.50 0.15 0.02 0.77 0.12 0.02
Kd source data (m3 kg-1)
CF Na lab- Na porewater 1.14 3.77 25.75 0.73 4.90 36.88
CF pH
CF speciation 1.09 1.13 1.21 0.64 1.14 1.23UF (UFsource x UFspeciation x
UFLabField)
Kd porewater (m3 kg-1) 6.2E-02 2.1E-01 1.6E+00 2.4E-02 2.8E-01 2.3E+00
Kd upper limit (Kd x UF) 2.8E-01 9.5E-01 7.0E+00 1.1E-01 1.2E+00 1.0E+01
Kd lower limit (Kd / UF) 1.4E-02 4.7E-02 3.5E-01 5.3E-03 6.2E-02 5.0E-01
Kd source data (m3 kg-1)
CF Na lab- Na porewater 0.05 0.18 1.20 0.03 0.23 1.71
CF pH
CF speciation 0.91 0.94 1.01 0.54 0.95 1.02UF (UFsource x UFspeciation x
UFLabField)
Kd porewater (m3 kg-1) 1.7E-02 5.8E-02 4.3E-01 6.5E-03 7.7E-02 6.2E-01
Kd upper limit (Kd x UF) 7.6E-02 2.6E-01 1.9E+00 2.9E-02 3.4E-01 2.8E+00
Kd lower limit (Kd / UF) 3.8E-03 1.3E-02 9.6E-02 1.4E-03 1.7E-02 1.4E-01
4.48
0.35
derivation of in-situ Kd valuesbased on Bradbury & Baeyens 2003
derivation of in-situ Kd values based on Grambow et al. 2006
not required for cation exchange
4.48
species distribution (%)
not required for cation exchange
0.05
Strontium (Sr) sorption data sheet Sorption model parameters: Thermodynamic sorption model in PhreeqC using the Andra/Thermochimie database Solid-solution ratio: 3.63 kg L-1 (dry density of 1570 kg m-3) CEC: 0.787 eq kg-1 Cation exchange selectivity coefficients: Bradbury & Baeyens (2002a) External surface sites: 0.0284 eq kg-1 (Wieland et al. 1994) DDL thickness calculated from the reciprocal Debye length and a Debye multiplier of 1.2

185
Derivation of sorption values for in-situ reference and bounding porewaters:
Strontium (Sr)
Saline KR20/465/1
Brackish KR6/135/8
Dilute, carbonate rich
KR4/81/1
Brine KR4/861/1
High alkaline Glacial melt water
Glacial melt water
Na x 10
initial concentration
(mol L-1) 1.8E-04 2.0E-04 1.2E-05 3.3E-03 1.6E-04 3.9E-06 3.9E-06
cation exchange (%) 80.42 95.50 99.00 30.46 94.13 98.05 97.87
surface sorption (%) 3.90 1.27 0.62 3.30 4.38 1.93 2.10
solution (%) 15.67 3.08 0.25 66.25 1.52 0.02 0.03
UF (UFmodel x UFLabField) 6 6 8 6 6 8 8
Kd m3 kg-1 1.5E-03 8.7E-03 1.1E-01 1.4E-04 1.8E-02 1.2E+00 8.5E-01
Kd upper limit (Kd x UF) 8.9E-03 5.2E-02 8.7E-01 8.4E-04 1.1E-01 9.3E+00 6.8E+00
Kd lower limit (Kd / UF) 2.5E-04 1.4E-03 1.4E-02 2.3E-05 3.0E-03 1.5E-01 1.1E-01
Selenium (Se) sorption data sheet Speciation for in-situ reference and bounding porewaters:

186
Tin (Sn) sorption data sheet Th(IV) used as analogue Only the Sn(OH)4 species is considered sorbing due to the different hydrolysis of Sn compared with the analogue Sn. Derivation of sorption values for in-situ reference and bounding porewaters:
Beryllium (Be) sorption data sheet Approach 1: Literature source: Ramesh et al. (2002) Mineralogy: bentonite obtained from Indian Petro Chemicals Limited, Vadodara, India; CEC = 0.8 eq kg-1 solution composition: 30 mg L-1 Be (BeSO4·4H2O in double distilled deionized water) pH: 4-8 Approach 2: Ni used as analogue best estimate values marked in red are recommended as lower limit Kd Approach3: Literature source: You et al. (1989) Mineralogy: montmorillonite solution composition: river and sea water marked in yellow: recommended best estimate data

187
Derivation of sorption values for in-situ reference and bounding porewaters:

188
Zirconium (Zr) sorption data sheet Th(IV) used as analogue Derivation of sorption values for in-situ reference and bounding porewaters:
Zirconium (Zr)
Saline KR20/465/1
Brackish KR6/135/8
Dilute, carbonate
rich KR4/81/1
Brine KR4/861/1
High alkaline Glacial melt water
solubility (mol L-1) in equillibrium with Zr(OH)4
(am,aged) 1.5E-08 1.7E-08 1.8E-08 9.8E-09 1.7E-08 1.8E-08
Zr(OH)4 100 100 100 100 100 100
sum 100 100 100 100 100 100
F sorbing species 1 1 1 1 1 1
Kd analogue Th (m3 kg-1)
F sorbing source data
CF anal. speciation 1 1 1 1 1 1
UF UL (UFTh x UFspec )
UF LL (UFTh x (2x UFspec ) )
Kd porewater (m3 kg-1) 63 63 63 63 63 63
Kd upper limit (Kd x UF) 395 395 395 395 395 395
Kd lower limit (Kd / UF) 5.0 5.0 5.0 5.0 5.0 5.0
12.54
species distribution (%)
Derivation of in-situ Kd values
63
1
6.27

189
Nickel (Ni) sorption data sheet Source data parameters and experimental conditions: Literature source sorption isotherm: Bradbury & Baeyens (2003a) Mineralogy: MX-80; CEC = 0.79 eq kg-1 Solution composition: synthetic bentonite porewater (SBPW) pH: 7.6 Literature source sorption pH edge: Baeyens & Bradbury (1997b) Mineralogy: Na-montmorillonite (SWy-1) Solution: 0.1 M NaClO4 Ni concentration: NiTOT < 10-7 M Derivation of sorption values for in-situ reference and bounding porewaters:

190
Niobium (Nb) sorption data sheet Source data parameters and experimental conditions: Literature source sorption edge data: unpublished, reported in Andra (2005b) Mineralogy: montmorillonite exctracted from MX-80; estimated CEC = 0.87 eq kg-1 Solution composition: not reported pH: 2-11 Nb concentration: not reported Derivation of sorption values for in-situ reference and bounding porewaters:
Niobium (Nb)
Saline KR20/465/1
Brackish KR6/135/8
Dilute, carbonate
rich KR4/81/1
Brine KR4/861/1
High alkaline Glacial melt water
solubility (mol L-1) in equilibrium with Nb2O5 (s) 6.1E-07 1.5E-07 4.1E-07 1.2E-07 2.8E-03 2.1E-04
Nb(OH)6- 82.8 94.3 90.4 96.8 3.0 13.3
Nb(OH)7-2 17.1 5.3 9.4 2.9 97.0 86.7
Nb(OH)5 0.1 0.5 0.2 0.3
sum % 100 100 100 100 100 100
Nb concentration (mol L-1) 1.04E-10 1.01E-10 1.00E-10 1.17E-10 1.01E-10 1.00E-10
Nb(OH)6- 82.8 94.3 90.4 96.8 3.1 13.6
Nb(OH)7-2 17.1 5.3 9.4 2.9 96.9 86.4
Nb(OH)5 0.1 0.5 0.2 0.3 0.0 0.0
Kd source data (m3 kg-1) 6 6 6 6 2 2
F sorbing source data
CF CEC 0.90 0.90 0.90 0.90 0.90 0.90
CF pH 1.00 1.00 1.00 1.00 1.00 1.00
CF speciation 1.00 1.00 1.00 1.00 1.00 1.00UF (UFsource x UFspec x UFpH
x UFLabField) 13.0 13.0 13.0 13.0 13.0 13.0
Kd porewater (m3 kg-1) 5.4 5.4 5.4 5.4 1.8 1.8
Kd upper limit (Kd x UF) 70.6 70.6 70.6 70.6 23.5 23.5
Kd lower limit (Kd / UF) 0.42 0.42 0.42 0.42 0.14 0.14
species distribution (%)
derivation of in-situ Kd values

191
Molybdenum (Mo) sorption data sheet Source data parameters and experimental conditions: Literature source pH sorption edge: Hakanen et al. (2014) Mineralogy: illite IMt-1 Solution composition: saline reducing Olkiluoto water simulant (OLSR) pH: 6.5-9.2 Derivation of sorption values for in-situ reference and bounding porewaters:
Molybdenum (Mo)
Saline KR20/465/1
Brackish KR6/135/8
Dilute, carbonate
rich KR4/81/1
Brine KR4/861/1
High alkaline Glacial melt water
Mo concentration (mol/L) 3.39E-07 3.66E-08 1.27E-07 9.80E-12 4.14E-06 9.97E-05
MoO4-2 100.0 100.0 100.0 99.9 100.0 100.0
HMoO4- 0.0 0.0 0.0 0.1 0.0 0.0
sum % 100 100 100 100 100 100
Kd source data (m3 kg-1) 1.0E-02 2.8E-02 1.0E-02 2.0E-02 2.0E-04 4.5E-04
CF montmorillonite content
UF UL (UFsource x UFCEC x
UFLabField) UF LL (UFsource x UFCEC x
UFLabField x 5)
Kd porewater (m3 kg-1) 7.5E-03 2.1E-02 7.5E-03 1.5E-02 1.5E-04 3.4E-04
Kd upper limit (Kd x UF) 3.1E-02 8.7E-02 3.1E-02 6.2E-02 6.2E-04 1.4E-03
Kd lower limit (Kd / UF) 3.6E-04 1.0E-03 3.6E-04 7.2E-04 7.2E-06 1.6E-05
20.80
species distribution (%)
derivation of in-situ Kd values
0.75
4.16

192
Technetium (Tc) sorption data sheet Source data parameters and experimental conditions: Th(IV) used as analogue for pH 7-8; Berry et al. (2007) for pH >9 Mineralogy: Kunigel-V1 bentonite, CEC = 0.6 eq kg-1 Solution: deionised water equilibrated with bentonite, pH 10 > 99% TcO(OH)2 expected Derivation of sorption values for in-situ reference and bounding porewaters:
Technetium (Tc)
Saline KR20/465/1
Brackish KR6/135/8
Dilute, carbonate
rich KR4/81/1
Brine KR4/861/1
High alkaline Glacial melt water
Tc concentration in equilibrium with TcO2:1.63
H2O (mol L-1) 3.4E-09 3.8E-09 4.0E-09 2.2E-09 4.6E-09 4.4E-09
TcIVO(OH)2 99.5 99.6 98.5 99.9 82.0 89.9
TcIV(OH)3CO3- 0.4 0.3 1.5 0.1
(TcIVO)(OH)3- 0.2 0.1 0.1 18.0 6.2
TcVIIO4- 3.8
sum % 100 100 100 100 100 100
F sorb with CO3-compl. 1.00 1.00 1.00 1.00 1.00 1.00
Kd analog Th, source
(m3 kg-1) 63 63 63 63 1.6 1.6
CF CEC
F sorb with CO3-compl. analog. 1.00 1.00 1.00 1.00 1.00 1.00
CF analogue with CO3-compl. 1.00 1.00 1.00 1.00 1.00 1.00
UF (UFTh x UFspec )
Kd porewater (m3 kg-1) 63 63 63 63 2.1 2.1
Kd upper limit (Kd x UF) 395 395 395 395 32 32
Kd lower limit (Kd / UF) 3.3 3.3 3.3 3.3 0.14 0.14
species distribution (%)
derivation of in-situ Kd values
lower limit: 18.8 / upper limit: 6.3 15.1
1.3 -

193
Palladium (Pd) sorption data sheet Analogue: Nickel (Ni) Only the neutral Pd(OH)2 species is considered sorbing to account for the different speciation of Pd and Ni. Derivation of sorption values for in-situ reference and bounding porewaters:

194
Silver (Ag) sorption data sheet Literature source sorption value: Kahn et al. (1995) Mineralogy: bentonite from Pakistan; CEC = 0.77 eq kg-1 Solution composition: 0.1 M NaNO3
Ag concentration: 10-9 M pH: 6.5, the pH sorption edge is conservatively neglected Speciation in in-situ reference and bounding porewaters:
Silver (Ag)
Saline KR20/465/1
Brackish KR6/135/8
Dilute, carbonate rich
KR4/81/1
Brine KR4/861/1
High alkaline Glacial melt water
Ag concentration in equilibrium with AgCl (cr)
(mol L-1) 3.0E-05 1.4E-05 1.0E-06 3.3E-04 1.0E-05 9.9E-07
AgCl 0.9 2.2 32.7 0.1 3.1 33.4
AgCl2- 35.0 51.0 64.1 14.6 58.2 1.0
AgCl3-2 22.3 21.1 1.8 24.3 19.6
AgCl4-3 41.7 25.6 0.1 61.1 18.9
Ag+ 1.3 63.9
AgCO3- 1.3
sum % 99.9 99.9 100.0 99.9 99.8 99.6
F sorbing species 0.00 0.00 0.01 0.00 0.00 0.64
Kd source data (m3 kg-1) 3.2E-02
F sorbing source data 1
CF CEC
CF speciation 0.64UF (UFsource x UFCEC x UFspec
x UFpH x UFLabField)
Kd porewater (m3 kg-1) 0.00 0.00 0.00 0.00 0.00 2.1E-02
Kd upper limit (Kd x UF) 0.00 0.00 0.00 0.00 0.00 3.2E-01
Kd lower limit (Kd / UF) 0.00 0.00 0.00 0.00 0.00 1.4E-03
speciation for equilibrium concentration and 1E-10
15.14
species distribution (%)
derivation of in-situ Kd values
1.02

195
Europium (Eu) sorption data sheet Source data parameters and experimental conditions: Conversion factor approach: Literature source sorption value: Bradbury & Baeyens (2011a) Mineralogy: MX-80 CEC = 0.79 eq kg-1 Solution composition: synthetic porewater Eu equilibrium concentrations: 5•10-5 - 5•10-11 pH: 7.6 Literature source sorption pH edge used for all waters except saline and dilute, carbonate rich water Bradbury & Baeyens (2002c) Mineralogy: Na-montmorillonite (SWy-1) Solution: 0.1 M NaClO4, CO2-free Eu concentration: EuTOT ~1.3 10-7 M pH range: 4-9 Literature source sorption pH edge used for saline and carbonate rich water: Marques Fernandes et al. (2008) Mineralogy: Na-montmorillonite (SWy-1) Solution: 0.1 M NaClO4, pCO2 = 10-3.5 Eu concentration: EuTOT ~1.3 10-7 M pH range: 4-9 Sorption model parameters: Non-electrostatic double layer thermodynamic sorption model in PhreeqC using the Andra/Thermochimie database Solid-solution ratio: 3.63 kg L-1 (dry density of 1570 kg m-3) CEC: 0.787 eq kg-1 Strong site capacity: 1.5 mmol kg-1 bentonite (based on 2 mmol kg-1 montmorillonite proposed by Bradbury & Baeyens (2005) and montmorillonite content of 75 %). Surface complexation constants and cation exchange selectivity coefficient: Marques Fernandes et al. (2008).

196
Derivation of sorption values for in-situ reference and bounding porewaters with conversion factor approach:
The pH conversion factor for the high alkaline and glacial melt water is conservatively calculated with the Kd value measured for pH 9.

197
Derivation of sorption values for in-situ reference and bounding porewaters with sorption model:
Europium (Eu)
Saline KR20/465/1
Brackish KR6/135/8
Dilute, carbonate rich
KR4/81/1
Brine KR4/861/1
High alkaline Glacial melt water
initial concentration (mol L-1) 9.20E-10 3.4E-09 7.83E-10 5.0E-09 7.3E-08 3.30E-11
cation exchange (%) 0.0019 0.0314 0.0866 0.0002 0.0000 0.0004
surface sorption (%) 100.00 99.96 99.47 99.99 100.00 99.99
solution (%) 0.00051 0.00086 0.00029 0.00028 0.00002 0.00001
UF (UFmodel x UFLabField) 6 6 6 6 6 6
Kd m3 kg-1 54 32 94 98 1723 1995
Kd upper limit (Kd x UF) 323 191 565 587 10340 11972
Kd lower limit (Kd / UF) 9.0 5.3 15.7 16.3 287 333

198
Samarium (Sm) sorption data sheet Analogue: Europium (Eu) Derivation of sorption values for in-situ reference and bounding porewaters:

199
APPENDIX C- REFERENCE BENTONITE PORE WATERS
Reference bentonite porewaters and water compositions for near-field solubilities and sorption values P. Wersin, D. Rosch
1 INTRODUCTION
The results from safety assessment (SA) calculations hinge on good input data. Among these, the radionuclide-specific solubilities and sorption/diffusion values in the near-field are of outmost importance. These data are often referred to as geochemical databases for the near-field (e.g. Wersin & Schwyn, 2004). The compartments where these databases are applied are schematically illustrated in Fig. 1. In order to derive appropriate data, the geochemical boundary conditions, such as pH, Eh and porewater composition in the bentonite buffer and inside the canister need to be known. The chemistry of these waters is determined on one hand by the mineral composition and surface properties of the clay buffer material and on the other by the geochemical conditions in the surrounding rock and the materials present inside the canister. The exchange between the buffer and the rock occurs by solute diffusion and chemical reactions in the clay involving dissolution/precipitation, cation exchange and surface complexation reactions. This will at first induce transient conditions, but in the long run (i.e. several decades up to 1000 years) there will be diffusive equilibrium between the bentonite and the near-field water bodies. The groundwater will evolve with time and be affected mainly by the change in climatic conditions. These changes however occur over a long time scale compared to the transient state in the buffer. Thus, the effect of changing groundwater composition on bentonite porewater can be approximated by assuming complete mixing and equilibrium with the surrounding groundwater. This is commonly done in safety assessments (e.g. Curti & Wersin, 2002) by assuming chemical equilibrium between the compacted bentonite and the surrounding groundwater and then defining so-called reference bentonite waters. These reference bentonite waters serve to provide realistic bentonite water compositions, including pH, Eh and dissolved carbonate. The latter parameters are particularly relevant for affecting the solubilities and sorption of many radionuclides (RN). This chemical equilibrium approach for defining reference bentonite waters is also adopted here. The scope is to account for the temporal evolution of the composition which parallels that of the groundwater in the host rock. This in turn has been approximated by defining reference and bounding groundwater compositions for different times after repository closure (see Appendix D and chapter 2 for further details). During the initial stage after buffer emplacement, the saturation of the

200
bentonite with saline-type groundwater (represented as KR20/465/1) will occur. The saturation time in the conditions expected at the repository level may be very long, up to 1000´s of years, as most of the boreholes will be dry, and the maximum level of inflow according to the target properties of the rock based on the rock suitability criteria is 0.1 L/min. The porewater chemistry will be regulated by surface reactions in the clay and dissolution of salts, such as gypsum. This is represented in the conceptual bentonite model by assuming a closed system with regard to CO2 and equilibrium with gypsum for the early-type porewater. In the long run, extensive diffusional exchange with the surrounding groundwater will occur and hence the bentonite porewater composition will be "conditioned" by the groundwater chemistry. The expected water exchange rate in one deposition hole in saturated conditions will likely be very low, about 1 L/year. Diffusional exchange is approximated for the later-type porewaters by assuming an open system with regard to CO2 which is controlled by the pCO2 of the groundwater. Moreover, due to the much lower sulphate concentrations in the groundwater than in the bentonite porewater gypsum will have dissolved and no longer control sulphate concentrations in the buffer.
porewaterinflow
solubilitiesCeq
RN releaseRN diffusion & retardation
sorption / diffusion valuesKd / De,
diffusiveexchange
RN fluxfrom NF
waste canister bentonite buffer crystalline host rock
UO2diss.IRF
montmorilloniteaccessory mineralsporewaterporewater
inflow
solubilitiesCeq
RN releaseRN diffusion & retardation
sorption / diffusion valuesKd / De,
diffusiveexchange
RN fluxfrom NF
waste canister bentonite buffer crystalline host rock
UO2diss.IRF
montmorilloniteaccessory mineralsporewater
Figure 1. Sketch showing concept for safety assessment (SA) calculations with compartments and pathways for radionuclides (RN).
From the expected hydrochemical evolution of the groundwater at repository depth and due to effect of repository construction and operation, reference and bounding groundwaters have been recently defined (Hellä et al. 2014, Appendix D). This has led to the definition of reference groundwaters and a number of bounding waters for different time periods. The resulting groundwaters considered for the modelling of the bentonite porewaters are listed in Appendix D.. The scope of the work presented here is to derive the bentonite porewater compositions in contact with the reference and bounding groundwaters under the assumption of thermodynamic equilibrium. The calculations are based on the thermodynamic model for compacted bentonite of Wersin et al. (2004) and recent work on porosities in bentonite (Appelo, 2013, Tournassat, 2008). Taking these results, the water compositions inside a defective canister are then derived, as basis for the assessment of radionuclide solubilities. The change in redox potential in the canister environment due
201
to presence of iron corrosion products needs to be accounted for. The geochemical code PHREEQC V.2 (Parkhurst & Appelo, 1999) and thermodynamic database ThermoChimie 7b (Andra, 2009) is applied for the geochemical calculations. The task consisted of the following steps:
Update of the thermodynamic bentonite model of Wersin et al. (2004) by accounting for new considerations of Appelo (2013) on the distribution of porosities in "free", diffuse double layer and interlayer water.
Compare the results obtained from this updated model with those from previously proposed models (Bradbury & Baeyens, 2002; Wersin et al., 2004).
Propose reference and bounding waters for the bentonite porewater to be used for the assessment of RN sorption values for different time periods.
Propose reference and bounding waters for the water inside the canister to be used for the assessment of RN solubilities for different time periods.
2 DEFINING THE GEOCHEMICAL SYSTEM
2.1 Reference and bounding bentonite porewaters for different time windows
The derivation of the reference bentonite porewaters is carried out on the basis of the reference groundwater concept (Hellä et al. 2014). Thus, the reference porewaters are regarded as the most plausible bentonite porewater composition for a specific time window. The bounding porewaters on the other hand represent extreme water compositions with regard to solubility concentrations and sorption values in the near-field. The bounding waters are thus used to help to define the upper solubility limits and the lower sorption value limits, respectively. Table 1 shows the selected water-types used for bentonite porewaters for the different time windows in comparison with the corresponding groundwater types (compositions thereof in Appendix D). In the following the selection of different bounding waters is briefly justified. Operational period (0-100 years): For this period, no bentonite porewaters are defined, because no solubility and sorption data are needed to be specified. This is justified by (1) the very improbable canister failure and (2) the slow water saturation process in the buffer and even more so in the canister. Early phase of the evolution (up to 1000 years): The porewater is calculated for the dilute, carbonate rich water, for the high alkaline water and the brine water. The brine water is considered as extreme bounding water for conservative reasons even though it is not expected to enter the repository level once natural conditions are re-established. The dilute water is omitted because the bicarbonate concentration is only intermediate compared to the dilute, carbonate rich water. With a high pH of 10, the high alkaline water is also clearly a bounding water.

202
Temperate period (until next glaciation): For the dilute, carbonate rich water, the same considerations as for the early phase are valid. The high alkaline water based on brackish water was not included for bentonite waters, but instead the corresponding one for saline water was applied. This later water is more conservative in the sense that it contains higher concentrations of potential complexing agents, such as sulphate or chloride. Melting phase of next glaciation: The glacial melt water as a very dilute groundwater is selected as bounding water as is done for the bounding groundwater. After next glaciation: For this long period, we consider all bounding waters except for that affected by cement leachates, selected for the previous periods because of the large uncertainty in the climatic predictions. The reference bentonite porewater based on saline groundwater (KR20/465/1) is considered equal for early and later time periods. Thus, gypsum saturation is assumed which leads to a rather high sulphate concentration, also for later periods. This assumption is conservative with regard to solubility and sorption considerations.
Table 1. Time frames with the corresponding reference and bounding groundwaters (Hellä et al. 2014, summary of water composition in Appendix D) vs. bentonite porewaters.
Time frame Reference water Groundwater
Reference water Bentonite porewat.
Bounding waters Groundwater
Bounding waters Bentonite porewat.
Operational period (0-100 years)
Saline water based on KR20/465/1
Dilute, carbonate rich water, based KR4/81/1
Brine water, based on KR4/861/1
High alkaline water, based on the saline reference water titrated with Ca(OH)2
Early phase of the evolution (up to 1000 years)
Saline water based on KR20/465/1
Saline water based on KR20/465/1
Dilute, carbonate rich water based on KR4/81/1
High alkaline water, see above
Dilute water, based on KR6/58/1
Sulphate rich saline water, see above
Dilute, carbonate rich water based on KR4/81/1
High alkaline water, see above
Brine water, based on KR4/861/1
Temperate period (up to 10 000 years, until next glaciation)
Brackish water based on KR6/135/8
Brackish water based on KR6/135/8
Dilute, carbonate rich water,see above
High alkaline water, based on the brackish reference water titrated with Ca(OH)2
Dilute water, see above
Dilute, carbonate rich water, see above
High alkaline water, see above
Melting phase of next glaciation
Brackish water, see above
Brackish water, see above
Glacial melt water, ice melting water (Grimsel water)
Glacial melt water, ice melting water (Grimsel water)
After next glaciation (~100 000 years)
Current type of water with sign of melt water, based on KR20/465/1
Saline water based on KR20/465/1
Glacial melt water, see above High alkaline water, see above
Glacial melt water, see above Dilute, carbonate rich water,see above
Brine water, see above

203
2.2 Bentonite material
The reference buffer material used in Posiva's safety assessments so far is sodium Wyoming bentonite, whose commercial name is MX-80. The selection of the buffer material is still in progress and several different high-grade bentonite materials are under investigation (e.g. Kumpulainen & Kiviranta, 2010), including for example calcium bentonites from Milos, Greece or sodium dominated bentonites from Kutch (India). The main design requirement is a montmorillonite content of at least 75 wt% (Pastina & Hellä, 2010). For the purpose of defining reference bentonite waters, MX-80 bentonite is considered as buffer material. The composition of MX-80 may vary slightly, depending on the batch analysed and the treatment procedure after mining. Thus, somewhat variable mineralogical compositions are reported in the literature (e.g. Müller-Vonmoos & Kahr, 1983; Karnland et al., 2006). Here we consider the analytical data provided by Müller-Vonmoos & Kahr (1983) and Bradbury & Baeyens (2002) for the modelling of porewater compositions, since the model we apply is based on these data (see chapter 3). It should be noted that the use of slightly different mineral composition or cation exchange capacity (CEC) values, such as those provided by Karnland et al. (2006) and presented in Pastina & Hellä (2010), only barely affects the modelling results.
3 THE GEOCHEMICAL BENTONITE MODEL
3.1 Description
The geochemistry of the compacted bentonite buffer is influenced by the clay microstructure on one hand and by dissolution of accessory minerals on the other. Concerning the microstructure, considerable uncertainties exist regarding the pore size distribution which in turn affects electrochemical and diffusional properties (e.g. Muurinen 2006; Appelo, 2013; Birgersson & Karnland, 2009). Here we apply a geochemical model concept based on different compartments (Table 2). It includes three different types of water-filled porosities (Fig. 2): namely the interlayer water between the clay tetrahedral-octahedral-tetrahedral layers (TOT layers) (1), the diffuse double layer water (DDL water), which is bound through electrostatic surface interactions to the external surfaces (2) and the non-interacting/free external water (3). The cation exchange sites (filled mainly by Na+, Ca2+ and Mg2+) are located between the negatively charged TOT layers. As constituent of the crystallographic structure, the interlayer water is considered devoid of anions and does not participate in the geochemical reactions (Bradbury and Baeyens, 2002; Appelo, 2013). Above a dry density of 1 kg/dm3, the interlayer porosity becomes a significant part of the total porosity. At a dry density of 1.8 kg/dm3, almost all of the porosity is located in the interlayer (Muurinen, 2009, Appelo, 2013). The diffuse double layer water is different with an excess of cations which counterbalance the negative charge of the external surfaces, but both cations and anions are present. The composition and extent of the DDL depend on surface charge and ionic strength. The DDL water contacts free porewater with a balanced charge. The solid volume contains the montmorillonite particles and the accessory minerals, the latter of which affect porewater chemistry by

204
dissolution/precipitation reactions. This model concept is based on that proposed by Wersin et al. (2004) and similar to microstructure models proposed by Tournassat (2008), Bourg et al. (2003; 2006; 2008) and many others.
external water
+
+
+
+
+
clayparticle
DDL
DDL
-
- -
-
-
-
-+
+
+
++
+
+
+
+
+++ +++ +++
+++
+++ +++ +++
+++
+
+
+
+
++
+
+
+
+
+
+
+
+
+
-
-
- + + -
1 23
12
3
interlayer water with exchanged cations
diffuse double layer with excess positive charge
charge balanced external porewater
1 nm
Figure 2. Different water types in bentonite according to model concept (Wersin et al. 2004).
Table 2. Schematic illustration of the different compartments for compacted MX-80 bentonite at dry density of 1.57 kg/dm3. The porosity fractions correspond to the values for the saline groundwater (KR20/465/1, Table 3) and are calculated by application of equations given in the text.
The total porosity is split into the three different porosities according to geometrical and electrostatic properties of the bentonite system. The distribution of these porosities is a function of the density (S/L ratio), the specific surface area, the stacking number and the thickness of the DDL, where the stacking number is defined as the average number of

205
TOT layers of a single montmorillonite particle. In a compacted bentonite it is not possible to directly measure the specific surface area, the stacking number and the DDL thickness. These three unknown parameters were fitted using the experimentally determined anion accessible porosity εan as a function of the montmorillonite density. The anion accessible porosity is determined by anion diffusion experiments in bentonite (for details see Appendix C II). If these parameters are defined we can specify the interlayer, DDL and free porosities. The following derivations are based on considerations of Appelo (2013) and partly on Tournassat (2008). The interlayer porosity is influenced by the montmorillonite surface area, the mass (i.e. montmorillonite/liquid ratio) and the TOT stacking number and can be expressed by (Appelo 2013):
p
tmA IL
mmmmIL
11
2 (1)
where Amm is the total surface of montmorillonite (487 m2/g), mmm is the mass of montmorillonite (1.37 kg/L), tIL interlayer thickness and p is the stacking number of the TOT layers of montmorillonite particles. The interlayer thickness depends on the dry density. With a dry density of 1.57 kg/dm3 and a montmorillonite mass of 1.39 kg/L (mmm. i.e. normalised to total volume minus the volume of the impurities), we are in the "transition zone" of 2 - 3 water layers (Appelo, 2013). The corresponding densities normalised to montmorillonite are 1.35 kg/L (limit2) and 1.6 kg/L (limit3). The thickness of two water layers is 0.62 ּ◌10-9 m and for three water layers 1.0 ּ◌10-9 m. For our bentonite conditions with a dry density of 1.57 kg/dm3, the average thickness of the interlayer is calculated by:
99 100.1limit2limit3
limit211062.0
limit2limit3
limit2
mmmmIL
mmt (2)
which yields a value of 0.94 ּ◌10-9 m. A higher stacking number results in an increase of interlayer porosity. With a stacking number of 25, the maximum interlayer porosity (approx. 0.38, for a dry density of 1.57 kg/dm3) remains constant upon further increasing of the stacking number (Appelo, 2013). The thickness of the DDL is calculated from Debye length κ-1, which can be expressed as (Tournassat 2008):
I
101 10037.3 (3)
and the multiplier of Debye lengths (fDDL) (Appelo, 2013) which is not measurable and must be estimated by fitting, as outlined in Appendix CII. Once this parameter is obtained, the DDL can be calculated from (Appelo, 2013):
DDLDDL ft 1 (4)
which is used to determine the DDL porosity εDDL:

206
p
mAt mmmm
DDLDDL (5)
The fraction of free porosity can then be calculated if the total porosity εtot is known.
grain
drytot
1 (6)
DDLILtotfree (7)
Where ρdry is the MX-80 bentonite dry density and ρgrain is the grain density of the bentonite. The parameters used for calculating the different porosity fractions are compiled for the two reference and four bounding bentonite waters in Table 3.
Table 3. Calculated porosities for MX-80 bentonite according to Appelo (2013).
For all waters we use a stacking number of 4.8 and a Debye multiplier of 1.2 (see Appendix CII). With this approximation, non-zero free porosities are obtained for ionic strengths >0.04 M. For the most diluted bounding waters a free porosity of zero would thus result with this estimation procedure. This highlights the limitation of this procedure and the uncertainty in the free and DLL porosity fractions for dilute conditions (see also discussion in Appendix CII). As indicated from sensitivity checks (not shown), porewater model results are barely sensitive for variations of free and DDL distributions under dilute conditions. In view of this finding, we arbitrarily increase the ionic strength to 0.049 M and 0.045 M for the dilute water (KR4/81/1) and Grimsel water, respectively, in order to derive the porosity distribution.
3.2 Model implementation in PHREEQC
Model parameters used for the cation exchange and surface complexation reactions as well as implemented accessory minerals are shown in Table 4. Physical and mineralogical data of MX-80 are presented in Table 5.

207
Model for saline reference water (KR20/465/1) After emplacement in the repository it is expected that the saline water similar to sample KR20/465/1 will saturate the bentonite. In the model it is assumed that the porewater is conditioned by the initial conditions in the bentonite. To account for this, the computation scheme in PHREEQC contains the following steps. In a first step, a very small amount of pure water is put into equilibrium with the initial exchanger composition of the clay and the accessory minerals (quartz, calcite, kaolinite and gypsum) (Table 4). The partial pressure of CO2 is set to atmospheric conditions. This water represents the initial bentonite porewater and is necessary for the pre-equilibration of the exchanger and surface sites for the second step. The concentration changes due to this equilibrium reaction are kept very small as a result of the tiny amount of water used. Afterwards, the resulting solution is rescaled up to 1 kg of water which represents as mentioned the initial bentonite porewater before contacting the groundwater. To preserve the initial chloride groundwater concentration in the solution, an appropriate concentration of Na+ and Cl- is added to the pure initial water, some of which are incorporated in the DDL. For the sake of simplicity, this correction is only done in the model for dominant ions Na+ and Cl-. Cation exchange is calculated with the selectivity coefficients of Bradbury and Baeyens (2002) and is expressed relative to the selectivity constant of Na+ (KNaX). The external surface sites are expressed with the surface complexation model of Dzombak and Morel (1990) and explicitly including the calculation of the diffuse layer based on the Poisson-Boltzmann equation (Borkovec & Westall 1983) (PHREEQC keyword "-diffuse_layer"). By adapting the thickness of the DDL, we can adjust the DDL water volume to the required value (DDL porosity). The DDL volume depends on the ionic strength (Equations 3, 4). The thickness of the DDL is calculated with the requested volume of water in the DDL, the surface area and the solid/liquid ratio. The amount of external surface sites is equal to 3.6% of the CEC (Wieland et al., 1994). In the second step, the calculated cation exchange- and external surface sites and the accessory minerals in the bentonite are equilibrated with the surrounding groundwater. Further, the appropriate mass of interlayer water is removed (PHREEQC keyword REACTION), thereby only the free porewater and the DDL water are left for the calculation of final concentrations. Model for the other groundwaters For all other groundwaters, some adaptations in the model approach are necessary. They will be in contact with the saturated bentonite a long time after the saline groundwater (KR20/465/1) is in equilibrium with the bentonite. Therefore, the gypsum reservoir will be used up and the CO2 partial pressure will be conditioned by that of the surrounding groundwater. The pre-equilibration of the exchanger and surface sites is done with the composition of the surrounding groundwater, and thus the previous "history" of the surface composition is not accounted for. In the second step, the bentonite porewater is equilibrated (by dissolving or precipitating until equilibrium is reached) with calcite, kaolinite, quartz and pCO2 of the groundwater whereas gypsum is only allowed to precipitate under supersaturated conditions. Further, for the glacial melt water, the DDL

208
composition was calculated with the Donnan approximation implemented in PHREEQC (PHREEQC keyword "-donnan") (Appelo & Wersin 2007) because of convergence problems when applying the implemented Poisson-Boltzmann model (Borkovec & Westall 1983). In the Donnan approximation, an average concentration in the DDL is calculated based on a single potential in the DDL rather than calculating DDL concentrations by iteratively adapting the surface potentials until the charge in the DDL counters the surface charge (Appelo & Wersin 2007).
Table 4. Overview of model parameters and MX-80 bentonite properties. 1) Bradbury & Baeyens, 1997; 2) Bradbury & Baeyens, 2002; 3) Wieland et al., 1994; 4) Andra Database ThermoChimie 7b, (Andra 2009) 5) Defined according Gaines-Thomas convention.
Parameter Value Reference
System parameters
Temperature (°C) 25
Atmosphere log p(CO2) (bar) 10-3.44
Surface complexation / External surface sites
BET surface area (m2/g) 31.50 1)
Surface site concentration (eq/kg) 0.0284 3)
Surface complexation constants, log Kint
≡SOH + H+ = ≡SOH2+ 5.4 3)
≡SOH = ≡SO- + H+ -6.7 3)
Ion Exchange / Internal surface sites
Internal surface area of montmorillonite (m2/g) 487
Cation exchange capacity (CEC; eq/kg) 0.787 2)
Initial occupancies (equivalent fraction)
Na+ 0.848, Ca2+ 0.084, Mg2+ 0.051, K+ 0.017
2)
Selectivity coefficients, KC 5)
2NaX + Ca2+ = CaX2 + 2Na+ 2.6 2)
NaX + K+ = KX + Na+ 4.0 2)
2NaX + Mg2+ = MgX2 + 2Na+ 2.2 2)
Saturated solids, log Ks0
Quartz SiO2(s) + 2H2O = H4SiO4 -3.74 4)
Calcite CaCO3(s) = Ca2+ + CO32- -8.48 4)
Gypsum CaSO4 + 2H2O(s) = 2H2O + Ca2+ + SO42- -4.61 4)
Soluble solids, inventory (mol/kg)
Halite NaCl (mol/kg) 1.35x10⁻³ 2)
The solid/liquid ratio is calculated with the dry density (ρdry), the saturated density (ρsat) and a water density of 1 kg/dm3 (Equation 8).
drysat
dryw
S/L (8)
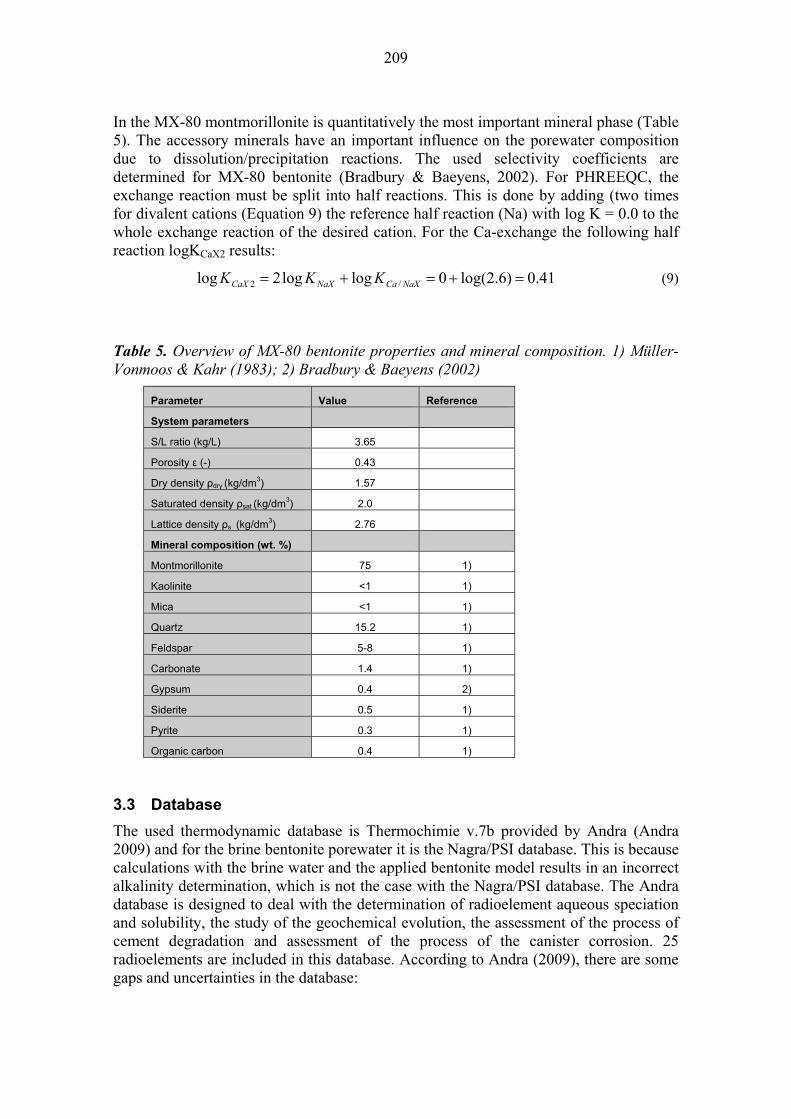
209
In the MX-80 montmorillonite is quantitatively the most important mineral phase (Table 5). The accessory minerals have an important influence on the porewater composition due to dissolution/precipitation reactions. The used selectivity coefficients are determined for MX-80 bentonite (Bradbury & Baeyens, 2002). For PHREEQC, the exchange reaction must be split into half reactions. This is done by adding (two times for divalent cations (Equation 9) the reference half reaction (Na) with log K = 0.0 to the whole exchange reaction of the desired cation. For the Ca-exchange the following half reaction logKCaX2 results:
41.0)6.2log(0loglog2log /2 NaXCaNaXCaX KKK (9)
Table 5. Overview of MX-80 bentonite properties and mineral composition. 1) Müller-Vonmoos & Kahr (1983); 2) Bradbury & Baeyens (2002)
Parameter Value Reference
System parameters
S/L ratio (kg/L) 3.65
Porosity ε (-) 0.43
Dry density ρdry (kg/dm3) 1.57
Saturated density ρsat (kg/dm3) 2.0
Lattice density ρs (kg/dm3) 2.76
Mineral composition (wt. %)
Montmorillonite 75 1)
Kaolinite <1 1)
Mica <1 1)
Quartz 15.2 1)
Feldspar 5-8 1)
Carbonate 1.4 1)
Gypsum 0.4 2)
Siderite 0.5 1)
Pyrite 0.3 1)
Organic carbon 0.4 1)
3.3 Database
The used thermodynamic database is Thermochimie v.7b provided by Andra (Andra 2009) and for the brine bentonite porewater it is the Nagra/PSI database. This is because calculations with the brine water and the applied bentonite model results in an incorrect alkalinity determination, which is not the case with the Nagra/PSI database. The Andra database is designed to deal with the determination of radioelement aqueous speciation and solubility, the study of the geochemical evolution, the assessment of the process of cement degradation and assessment of the process of the canister corrosion. 25 radioelements are included in this database. According to Andra (2009), there are some gaps and uncertainties in the database:

210
The aqueous speciation is likely to be governed by the carbonate system. Therefore special attention was given to complexation data of metals by carbonates. Nevertheless, a more comprehensive review of the metal-carbonate aqueous thermodynamic equilibrium still must be conducted.
The database is mainly tested on near-neutral conditions. The validation for hyperalkaline pH conditions (cement interaction, pH >10) is not sufficient.
A general lack of enthalpy and/or entropy values has been manifested. Many of these values are obtained by estimations by using different procedures reported in the open literature and other relationships implemented from chemical analogies. But not all estimations were checked for accuracy due to the lack of experimental data.
In spite of these shortcomings, it is considered that the Thermochimie database provides a good and useful thermodynamic dataset for many applications in Posiva's programme including geochemical modelling of the bentonite system (e.g. cement-bentonite interactions) or radionuclide speciation calculations. For the geochemical bentonite model used here, the shortcomings listed above are not relevant, the pH being restricted to the range of 7 to 10 and the temperature being limited to 25 °C.
3.4 Model testing with three different groundwaters
The model has been tested with three different water compositions from dilute to brine concentrations. To check the plausibility of the groundwater compositions we have made a speciation calculation with PHREEQC (Table 6). The charge balance is in the acceptable range in all the waters. In all samples, calcite is slightly oversaturated and gypsum is undersaturated. The calcite oversaturation results from the calculation temperature of 25 °C, rather than that measured (11 -12 °C). This temperature was selected for all reference and bounding bentonite waters because (1) of the higher reliability of thermodynamic data at standard conditions and (2) the small temperature difference with regard to expected conditions. The measured SiO2 concentrations for the saline and the brine groundwaters indicate a weak quartz oversaturation, suggesting equilibrium with a slightly more soluble SiO2 form. The redox potential, as calculated from the measured sulphate and sulphide and C(4)/C(-4) concentrations, indicates clearly reducing conditions for these Olkiluoto groundwaters. For the glacial melt water, no redox couples can be deduced from the given analysis.

211
Table 6. Composition of the reference and bounding groundwaters. Calculated values obtained with PHREEQC assuming T = 25°C. "-" means missing data.
Groundwater Reference groundwater
Saline Olkiluoto
Bounding
groundwater,
Brine Olkiluoto
Bounding
groundwater,
Glacial melt water
Grimsel
Analysis (mmol/L) KR20/465/1 KR4/861/1 Smith et al., 2007
Depth (m) -360.71 -818.75 -
TDS (g/L) 10.54 69.1 0.0827
Ionic strength (meq/L) 218 1395 1.2
pH 7.4 7.8 9.6
Eh (mV) - - -200
Alkalinity 0.66 0.2 0.45
DIC 0.55 0.08 -
SO42- 0.21 - 0.061
S2-tot 0.00561 - -
Cl 180.5 1212.98 0.16
Na 114.8 424.1 0.69
K 0.28 0.56 0.005
Ca 32.4 391.72 0.14
Mg 2.6 4.52 0.00062
Fe 0.0023 0.036 3 ּ◌10-6
Sr 0.16 1.84 0.002
SiO2 0.17 0.12 0.25
PHREEQC calculations
Eh (mV) -240; S(6)/S(-2) -335; C(4)/C(-4) -
Charge balance (%) 1.07 0.16 -5.51
HCO3- 0.542 0.051 0.21
pCO2 -2.97 -4.32 -5.48
pO2 -37.48 -74.62 -58.24
S.I. Calcite 0.14 0.82 0.1
S.I. Gypsum -1.88 - -3.64
S.I. Quartz 0.31 0.12 -0.16
S.I. = saturation index
Results from the test waters The property of the compacted clay with its different porosities leads to a free porewater with enriched concentrations compared to the external groundwater for all three test waters (Table 7). Thus, the free porewater shows a higher ionic strength. The obtained exchanger composition reflects the ratio of the major cations in the groundwater.

212
Table 7. Resulting porewater, sorption sites and diffuse double layer composition for a detailed view on the model outputs.
Sal
ine
wat
er
KR
20/4
65/1
, A
ND
RA
da
taba
se
Brin
e w
ater
K
R4/
861/
1,
PS
I da
taba
se
Gla
cial
mel
t w
ater
(G
rimse
l),
AN
DR
A
data
base
log p(CO2) (bar) -3.20 -4.61 -5.48
pH 7.80 7.42 9.62
Eh (mV) -245 -318 -201
Alkalinity (meq/kgw) 0.86 0.11 0.51
Ionic Strength (meq/kgw) 533.1 3402.6 2.01
Na 519.61 887.03 1.54
K 2.75 1.18 0.010
Mg 10.90 9.54 0.0012
Ca 11.43 824.78 0.11
Cl 353.36 2555.50 0.31
SO42- 105.95 - 0.12
S-2 0.011 - -
HCO3- 0.98 0.086 0.28
Sr 0.19 3.89 0.0039
Si 0.19 0.077 0.31
Mn 0.01 0.084 9.51E-06
Fe 0.0028 0.076 5.42E-06
F 0.084 0.18 0.71
Br 1.03 9.19 -
B 0.19 0.17 -
Calcite 0.0 0.0 0.0
Gypsum 0.0 - -3.51
Siderite -1.35 -1.97 -3.50
FeS(am) -0.78 - -27.03
Magnetite -1.54 -2.33 4.00
NaX 2293.5 1344.4 126.7
CaX2 193.4 750.2 1366.0
MgX2 67.5 11.4 5.2
KX 48.8 5.5 3.2
≡SOH 24.9 20.7 43.4
≡SOH2+ 0.4 0.3 1.6
≡SO- 78.5 83.0 59.0
Na 440.46 570.0 15.7
Ca 39.79 690.0 50.8
Mg 16.53 8.1 0.2
Cl 124.28 1070.0 0.008
Surface charge (meq/kgw) -355.66 -920.0 -120.0
DDL thickness (nm) 1.91 0.78 4.18
Free water 29 42 3
Water in DDL external 22 9 48
Interlayer water 49 49 49
DDL (mmol/kgw)
Water fractions (%)
Free porewater (mmol/kgw)
Saturation index S.I.
Exchange ions (mmol/kgw)
Edge sites (mmol/kgw)

213
Saline water: Except for Ca concentration, all concentrations in the free water are higher than in the initial groundwater. Due to calcite precipitation the Ca concentration is lower. The pH is increased from 7.4 to 7.8 which arise from buffering by edge sites. The ionic strength is also increased from 218 meq/L to 533 meq/L. This is because The Cl concentration reflects the anion exclusion effect accounted for in the model. In total, 0.51 L water is external relative to 3.65 kg bentonite. The concentration can be calculated by multiplying the initial Cl concentration of 180.5 mmol/L with 1/0.51. In the initial solution gypsum is undersaturated with a S.I. of -1.88. In the model, gypsum saturation is assumed and as a consequence a part of the gypsum reservoir from the initial bentonite is dissolved to reach equilibrium conditions. This leads to a high sulphate concentration in the free porewater besides the anion exclusion effect. For all other calculated porewaters (reflecting later time periods), gypsum will be removed by dissolution and outdiffusion after a relatively short time period. Thus the sulphate concentration will then be conditioned by that in the surrounding groundwater. Brine water: All concentrations in the free porewater are higher compared to the starting solution therefore the ionic strength increases from 1180 meq/L to 3402.6 meq/L. The pH shows a change from 7.8 to 7.42.This is because of edge site buffering reactions in the clay and calcite precipitation. Glacial melt water: With a value of 9.62, the pH does not change significantly during the reaction with the bentonite. Through the interaction with the bentonite, the ionic strength increases slightly. Due to the dilute conditions, gypsum is strongly undersaturated.
3.5 Comparison with different models
The conceptual uncertainties of the thermodynamic model for compacted bentonite, in particular those related to the clay microporosity are still significant in spite of the progress made in recent years. One way to address conceptual model uncertainty is to compare results obtained from different models. Here we compare the model proposed here with those of Wersin et al. (2004) and Bradbury & Baeyens (2002). In the following the two alternative models and the results obtained from them are briefly described:
Wersin et al. (2004) Since the model applied here is based on that of Wersin et al. (2004), it is obvious that they are similar. The principal difference is that interlayer water is assumed to participate in the chemical reactions and thus the total porosity is made up of free and DDL water. The results for both saline and brackish water are presented in Table 8. These indicate that the concentrations of major ions are generally more dilute (by a factor of 2), which arises from the larger fraction of water assumed in the clay. Otherwise differences are rather minor. Bradbury & Baeyens (2002) Main features of this model are that surface protonation/deprotonation to edge sites is described with a non-electrostatic three site model and that interlayer water is excluded from geochemical reactions. Thus, only one type of water - free water - is

214
assumed to fill the anion-accessible porosity. The site capacity of edge site is about 10 % of CEC which is larger than that of Wersin et al. (2004) or of the model presented here (3.6 %). In terms of cation exchange, the models are identical, since all of them are based on the same experimental data presented in Bradbury & Baeyens (2002) and apply selectivity constants according to the Gaines Thomas convention. In the model of Bradbury & Baeyens (2002), very low anion available porosities (a few %) are assumed, which these authors base on early chloride diffusion experiments of Muurinen et al. (1987). However, from chloride diffusion experiments and later experimental work of Muurinen (2006; 2009; 2010), the chloride-accessible porosity in compacted bentonite at a dry density of 1600 kg/m3 is indicated to be about 20-25 % of the total porosity. Hence, when applying the model of Bradbury & Baeyens (2002) we assume that 20 % of total porosity is available to geochemical reactions.
The results for the saline and brackish waters are presented in Table 8. The concentrations of major ions are highest and pH is slightly lower for the Bradbury & Baeyens model compared to the other two models. This difference arises mainly from the smaller fraction of water available leading a concentration effect, displacement of Ca2+ from the exchanger and to the precipitation of calcite:
CaX2 + 2Na+ + CO2(g) + H2O CaCO3 + 2NaX + 2H+ (10)
Overall, the comparison between the three models indicates that the model applied yields intermediate composition relative to the two other models. The main parameter affecting composition is the fraction of water assumed for geochemical reactions. Other factors, such edge site concentration and type of surface complexation model (electrostatic vs. non-electrostatic) are of less relevance. From the perspective of defining reference waters for solubilities and sorption data, the differences obtained in the different models are not very significant. Larger differences arise from the uncertainty in the groundwater compositions which is accounted for by defining bounding waters. This underlines the robustness of the thermodynamic modelling approach in spite of the inherent conceptual uncertainties.

215
Table 8. Comparison of three different models with the two reference groundwaters KR20/465/1 and KR6/135/8.
Sal
ine
wat
er
KR
20/4
65/1
Sal
ine
wat
er
KR
20/4
65/1
Sal
ine
wat
er
KR
20/4
65/1
Bra
ckis
h w
ater
K
R6/
135/
8
Bra
ckis
h w
ater
K
R6/
135/
8
Bra
ckis
h w
ater
K
R6/
135/
8
ModelModel applied in this report
Wersin 2004 Bradbury 2002Model applied in this report
Wersin 2004 Bradbury 2002
log p(CO2) -3.20 -3.55 -2.85 -2.70 -2.70 -2.70
pH 7.80 7.87 7.70 7.23 7.34 7.12
Eh (mV) -245 -249 -240 -207 -213 -201
Alkalinity (meq/kgw) 0.86 0.45 1.41 0.75 0.95 0.47
Ionic Strength (meq/kgw) 533.1 291.8 1118.3 271.2 147.29 603.8
Na 519.6 237.1 1323.7 150.8 81.86 372.28
K 2.75 2.6 7.02 0.92 0.47 2.13
Mg 10.90 6.7 27.69 14.39 7.35 29.91
Ca 11.43 15.3 7.98 30.67 15.92 55.68
Cl 353.36 180.5 929.3 222.29 118.32 595.2
SO42- 105.95 51.2 235.71 9.42 4.80 17.62
S-2 0.011 0.0057 0.03 0.0012 0.0006 0.0030
HCO3- 0.98 0.51 1.85 0.90 1.05 0.78
Sr 0.19 0.098 0.80 0.20 0.10 0.46
Si 0.19 0.190 0.18 0.17 0.18 0.16
Mn 0.0082 0.0041 0.03 0.041 0.021 0.11
Fe 0.0028 0.0014 0.012 0.011 0.006 0.029
F 0.084 0.043 0.25 0.032 0.016 0.08
Br 1.03 0.53 3.01 0.33 0.17 0.86
B 0.19 0.10 0.601 0.11 0.057 0.29
Saturation index S.I. Calcite 0.0 0.0 0.0 0.0 0.0 0.0
Siderite -1.35 -1.75 -0.78 -1.15 -1.17 -1.11
FeS(am) -0.78 -1.19 -0.02 -1.61 -1.98 -1.07
Magnetite -1.54 -1.70 -0.94 -2.28 -2.33 -2.19
NaX 2293.5 2322.0 2286.0 996.0 1248.3 1050.9
CaX2 193.4 181.5 197.6 674.2 589.2 652.9
MgX2 67.5 66.3 66.9 252.3 215.3 244.9
KX 48.8 47.6 48.8 24.2 13.1 24.0
≡SOH 24.9 27.3 205.9 49.7 49.5 252.0
≡SOH2+ 0.4 0.5 1.4 2.4 2.4 5.9
≡SO- 78.5 76.1 84.2 51.9 52.1 34.1
Free water 29 77.5 20 24 77.5 20
Water in DDL external 22 22.5 - 27 22.5 -
Interlayer water 49 - 80 49 - 80
Water fractions (%)
Free porewater (mmol/kgw)
Exchange ions (mmol/kgw)
Edge sites (mmol/kgw)
4 REFERENCE BENTONITE POREWATERS FOR ASSESSMENT OF SOLUBILITIES
In case of a canister failure, bentonite porewater will enter inside the canister via a small hole and lead to anoxic corrosion of the iron insert and iron corrosion products will form at the steel surfaces. We assume that this water will correspond to a diluted

216
porewater which is squeezed into the canister by swelling forces and a new osmotic equilibrium between external water (in the canister) and internal porewater will be established (Muurinen 2006; Karnland 1998). The redox potential inside the canister will be low and controlled by the formation of magnetite from the steel canister. For the calculations, we assume redox control by magnetite/Fe2+ equilibrium, where Fe2+ concentrations are fixed by those in the bentonite porewater (Curti & Wersin, 2002) (Table 9). The overall reaction of Fe0 to magnetite is pH neutral (Equation 11).
2H4
4O
3Fe O
24H 3Fe (11)
Table 9. Used logFe2+ activities in the solubility water calculations. The logFe2+ activity for the high alkaline water set to 10 to keep the pH at 10.
KR20/465/1 KR6/135/8 KR4/81/1 KR4/861/1 High alkaline
Glacial melt water
logFe2+
activity -6.395 -5.564 -5.642 -4.903 -10.0 -9.916
The calculated reference and bounding waters are shown in Table CI-1 (Appendix CI). Note that for the high alkaline water no reaction with the clay is assumed. This water-type corresponds to an artificial water determined by titration of present-day saline groundwater with Ca(OH)2 to yield a pH of 10. Thus, this water represents an extreme groundwater composition affected by cementitious leachates, which has not been "neutralised" by buffering reactions in the clay.
5 REFERENCE BENTONITE POREWATERS FOR ASSESSMENT OF SORPTION VALUES
For the determination of RN sorption values, the concentration of the free porewater (e.g. pH, carbonate concentration), and the sorption properties of the clay (e.g. cation exchange and edge site composition) is of interest. The reference and bounding porewaters together with their surface compositions are given in Table CI-2. In general, the redox potential is fixed with the sulphate/sulphide redox couple (Table 10). This represents the redox conditions of the surrounding groundwaters. For the glacial melt water, no sulphate and sulphide concentrations are available. Moreover, it questionable that under these conditions sulphate reduction will occur. Here we assume that redox conditions are fixed by the Fe(III)/Fe(II) where Fe3+ activities are controlled by ferrihydrite. In the case of the deep groundwater (KR4/861/1), conditions are very reducing with high methane and low sulphate and sulphide concentrations. Here it assumed that the redox pair C(4)/C(-4) sets redox conditions.
Table 10. Depending on the groundwater the redox determination varies.
KR20/465/1 KR6/135/8 KR4/81/1 KR4/861/1 High alkaline
Glacial melt water
Redox fixation
S(6)/S(-2) S(6)/S(-2) S(6)/S(-2) C(4)/C(-4) S(6)/S(-2) Fe+II/Ferrihydrite(am)

217
Acknowledgements We greatly appreciate the scientific support of Tony Appelo (Amsterdam) for deriving porosity distribution in the bentonite and for his valuable comments of an earlier version of the manuscript.
REFERENCES
Andra (2009): ThermoChimie project, mid-term report. Andra internal document.
Appelo C.A.J. (2013): A review of porosity and diffusion in bentonite. Posiva Working Report 2013-29.
Appelo C.A.J., Wersin P. (2007): Multicomponent diffusion modelling in clay systems with application to the diffusion of tritium, iodide and sodium in Opalinus Clay. Environ. Sci. Technol. 41, 5002–5007.
Birgersson M., Karnland O. (2009): Ion equilibrium between montmorillonite interlayer space and an external solution - Consequences for diffusional transport. Geochim. Cosmochim. Acta 73, 1908-1923.
Bolt G.H. and de Haan F.A.M. (1979): Anion exclusion in soil: in Soil Chemistry B. Physico-Chemical Models, G. H. Bolt, ed., Elsevier, Amsterdam, 233-257.
Borkovec M., Westall J. (1983): Solution of the Poisson-Boltzmann equation for surface excesses of ions in the diffuse layer at the oxide-electrolyte interface. J. Electroanal. Chem. 150, 325-337.
Bourg I.C., Sposito G., Bourg A.C.M. (2003): Modelling diffusion and adsorption in compacted bentonite: a critical review. J. Contam. Hydrol. 61, 293-302.
Bourg I.C., Sposito G., Bourg A.C.M. (2006): Tracer diffusion in compacted, water-saturated bentonite. Clays Clay Min. 54, 363-374.
Bourg I.C., Sposito G., Bourg A.C.M. (2008): Modelling the diffusion of Na+ in compacted water-saturated Na-bentonite as a function of pore water ionic strength. Applied Geochemistry 23, 3635-3641.
Bradbury M.H., Baeyens B. (1997): A mechanistic description of Ni and Zn sorption on Na-montmorillonite. Part II. Modelling. J. Contam. Hydrol. 27, 223-248.
Bradbury M.H., Baeyens B. (2002): Porewater chemistry in compacted re-saturated MX-80 bentonite: physico-chemical characterisation and geochemical modelling. Nagra Technical Report NTB 01-08, Wettingen, Switzerland.

218
Curti E., Wersin P. (2002): Assessment of porewater chemistry in the bentonite backfill for the Swiss SF/HLW repository. Nagra Technical Report NTB 02-09, Wettingen, Switzerland.
Dzombak D.A., Morel F.M.M. (1990): Surface complexation modelling: hydrous ferric oxide. Wiley- Interscience.
Karnland O. (1998): Bentonite swelling pressure in strong NaCl solutions. POSIVA 98-01.
Karnland O., Olsson S., Nilsson U. (2006): Mineralogy and sealing properties of various bentonites and smectite-rich clay materials. SKB Technical Report TR-06-30.
Kumpulainen S., Kiviranta L. (2010): Mineralogical and chemical characterization of various bentonite and smectite-rich clay materials. Posiva Working Report 2010-52.
Müller-Vonmoos M., Kahr G. (1983): Mineralogische Untersuchungen von Wyoming Bentonit MX-80 und Montigel. Nagra Technical Report NTB 83-12, Wettingen, Switzerland.
Muurinen A. (2006): Ion concentration caused by an external solution into the porewater of compacted bentonite. Posiva Working Report 2006-96.
Muurinen A. (2009): Studies on the chemical conditions and microstructure in the reference bentonites of Alternative Buffer Materials Project (ABM) in Äspö. Posiva Working Report 2009-42.
Muurinen A. (2010): Studies on the chemical conditions and microstructure in package 1 of Alternative Buffer Materials Project (ABM) in Äspö. Posiva Working Report 2010-11.
Muurinen A., Penttilä-Hiltunen P., Rantanen J., Uusheimo K. (1987): Diffusion of uranium and chloride in compacted sodium bentonite. YJT - Report, Teollisuuden Voima Oy, Helsinki.
Parkhurst D.L., Appelo C.A.J. (1999): User's guide to PHREEQC (Version 2) - A computer program for speciation, batch reaction, one-dimensional transport, and inverse geochemical calculations. U.S. Geological Survey Water-Resources Investigations Report 99-4259.
Pastina B., Hellä P. (2010): Models and data report. POSIVA 2010-01.
Smith P., Nordman H., Pastina B., Snellman M., Johnson L. (2007): Safety assessment for a KBS-3H spent nuclear fuel repository at Olkiluoto- Radionuclide transport report. POSIVA 2007-07 and SKB R-08-38, Posiva Oy, Olkiluoto, Finland and Swedish Nuclear Fuel and Waste Management Co (SKB), Stockholm, Sweden.

219
Tournassat C. (2008): A predictive model for anion exclusion in compacted Na-montmorillonite. 4th Annual Workshop Proceedings 6th EC-FP - FUNMIG IP, Karlsruhe, 24-27 November 2008, pp. 123-141.
Wersin P., Curti E., Appelo C.A.J. (2004): Modelling bentonite-water interactions at high solid/liquid ratios: swelling and diffuse double layer effects. Applied Clay Science 26, 249-257.
Wersin P., Schwyn B. (2004): Integrated approach for the development of geochemical databases used for safety assessment. Nagra Technical Report NTB 03-06, Wettingen Switzerland.
Wieland E., Wanner H., Albinsson Y., Wersin P., Karnland O. (1994): A surface chemical model of the bentonite-water interface and its implications for modelling the near-field chemistry in a repository for spent fuel. SKB Technical Report TR 94-26.

220
Appendix CI Waters for RN solubilities and sorption values
Table CI-1. Reference canister waters and bounding canister waters for RN solubilities. Units in mmol/L unless otherwise indicated.
Saline water KR20/465/1
Brackish water
KR6/135/8
Dilute, carbonate rich
water, KR4/81/1
Brine water, KR4/861/1,
with PSI database
High alkaline water
Glacial melt water,
(Grimsel water)
log p(CO2) -3.60 -2.69 -2.39 -5.27 -8.30 -5.48
pH 7.94 7.33 7.63 7.87 10.0 9.56
Eh (mV) -232 -163 -226 -346 -398 -304
Alkalinity (meq
L-1)0.48 0.95 3.06 0.02 1.89 0.42
Ionic Strength
(meq L-1)311 143 17.28 1297 214 1.26
Na 265 76.9 11.25 421 113 0.79
K 1.40 0.47 0.23 0.56 0.28 0.005
Mg 5.57 7.34 0.64 4.53 2.63 0.0006
Ca 13.64 15.93 1.17 391 33.36 0.13
Cl 180 113 10.03 1213 182 0.16
SO42- 61.89 4.80 0.98 - 0.21 0.06
S-2 0.005 0.0006 0.00030 - 0.0057 -
CO3 tot 0.52 1.05 3.20 0.009 0.23
Sr 0.10 0.10 0.006 1.85 0.16 0.0020
Si 0.19 0.18 0.18 0.15 1.88 0.29
Mn 0.004 0.02 0.003 0.04 0.006 4.85E-06
Fe 0.0024 0.010 0.010 0.16 8.54E-07 3.47E-06
F 0.043 0.016 0.032 0.08 0.051 0.36
Br 0.53 0.17 0.018 4.36 0.61 -
B 0.10 0.06 0.027 0.08 0.12 -
Calcite 0.0 0.0 0.0 0.0 0.0 0.0
Quartz 0.0 0.0 0.0 0.0 0.0 0.0
Siderite -1.47 -0.94 -0.13 -1.81 -5.67 -3.6
FeS(am) -0.99 -1.75 -1.73 - -2.44 -
Magnetite 0.00 0.00 0.00 0.00 0.00 0.00
Reference canister waters Bounding canister waters
Wat
er in
sid
e ca
nis
ter
Sat
ura
tio
n in
dex
S.I.

221
Table CI-2. Reference porewaters and bounding porewaters for RN sorption values. Units in mmol/L unless otherwise indicated.

222
Appendix CII Porosity calculations The main problem for the derivation of porosity distribution in compacted bentonite is to obtain accurate experimental data which can be used for porosity calculations. For some parameters it is not possible to measure them directly in an experiment therefore it is necessary to derive them from other system parameters. Non-measurable parameters include the stacking number p, the montmorillonite surface area Amm and the Debye multiplier fDDL. These are fitted with the approach of Appelo (2013), based on anion accessible porosities measured as a function of montmorillonite density. The anion accessible porosity εan is defined as follows (Appelo, 2013):
DDLfreeAn DDLfreean (12)
According to equation (12) the free porosity and a part of the DDL is accessible for anions. The term AnDDLfree determine which fraction of the DDL porosity is accessible for anions. In detail equation (12) is written as:
2
4
1mA11
2mA(
2
mmmmmmmm
aapt
p
tDDLDDL
ILtotan (13)
where
DDLIa
freeChargeExt
(14)
ChargeExtfree is the amount of external surface charge which is not occupied by cations and is a function of the activity coefficient of the cations, the ionic strength and the logKNaSu (the sodium surface complexation constant). The external surface charge and logKNaSu are based on the model approach of Appelo & Wersin (2007) in which the cation exchange is expressed as surface complexation reaction (different from this report). This is done by combining Dzombak and Morel's (1990) surface complexation model with the Donnan approximation of the diffuse double layer. The empty surface sites and their charges are compensated in the diffuse double layer, approximated by the Donnan volume. The model parameters are then fitted to match the experimental data (anion accessible porosity and montmorillonite density). This model parameter optimization is done with PEST (non-linear, least squares parameter optimization program). The optimized values from the experiment fitting are p = 4.8 stacks, Amm = 487 m2/g and fDDL = 5. Using a Debye multiplier of 5.0 and a stacking number of 4.8 the solution must have at least an ionic strength of 0.5 M otherwise the resulting free porosity is zero. The high value may arise from uncertainties in fitted experimental data. The
223
underlying experiments are questionable because the dissolution of accessory minerals was neglected in most of them. The discrepancy might also be related to the irregular porespace in bentonite with pores closed off by overlapping DDL’s. Bolt and de Haan (1979) calculated Debye multiplier values of around 2 for a variety conditions, decreasing with ionic strength and when divalent cations are in solution. Because of this discrepancy, we arbitrarily fix the anion free multiplier to 1.2.

224

225
APPENDIX D- REFERENCE AND BOUNDING GROUNDWATER COMPOSITION
Composition of the reference and the bounding groundwaters (Hellä et al. 2014)

226
LIST OF REPORTS
POSIVA-REPORTS 2012
_______________________________________________________________________________________
POSIVA 2012-01 Monitoring at Olkiluoto – a Programme for the Period Before Repository Operation Posiva Oy ISBN 978-951-652-182-7 POSIVA 2012-02 Microstructure, Porosity and Mineralogy Around Fractures in Olkiluoto
Bedrock Jukka Kuva (ed.), Markko Myllys, Jussi Timonen, University of Jyväskylä Maarit Kelokaski, Marja Siitari-Kauppi, Jussi Ikonen, University of Helsinki Antero Lindberg, Geological Survey of Finland Ismo Aaltonen, Posiva Oy ISBN 978-951-652-183-4
POSIVA 2012-03 Safety Case for the Disposal of Spent Nuclear Fuel at Olkiluoto - Design Basis 2012 Posiva Oy ISBN 978-951-652-184-1 POSIVA 2012-04 Safety Case for the Disposal of Spent Nuclear Fuel at Olkiluoto - Performance Assessment 2012 Posiva Oy ISBN 978-951-652-185-8 POSIVA 2012-05 Safety Case for the Disposal of Spent Nuclear Fuel at Olkiluoto - Description of the Disposal System 2012 Posiva Oy ISBN 978-951-652-186-5 POSIVA 2012-06 Olkiluoto Biosphere Description 2012 Posiva Oy ISBN 978-951-652-187-2 POSIVA 2012-07 Safety Case for the Disposal of Spent Nuclear Fuel at Olkiluoto - Features, Events and Processes 2012 Posiva Oy ISBN 978-951-652-188-9 POSIVA 2012-08 Safety Case for the Disposal of Spent Nuclear Fuel at Olkiluoto - Formulation of Radionuclide Release Scenarios 2012 Posiva Oy ISBN 978-951-652-189-6

POSIVA 2012-09 Safety Case for the Disposal of Spent Nuclear Fuel at Olkiluoto - Assessment of Radionuclide Release Scenarios for the Repository System 2012 Posiva Oy ISBN 978-951-652-190-2 POSIVA 2012-10 Safety case for the Spent Nuclear Fuel Disposal at Olkiluoto - Biosphere Assessment BSA-2012 Posiva Oy ISBN 978-951-652-191-9 POSIVA 2012-11 Safety Case for the Disposal of Spent Nuclear Fuel at Olkiluoto - Complementary Considerations 2012 Posiva Oy ISBN 978-951-652-192-6 POSIVA 2012-12 Safety Case for the Disposal of Spent Nuclear Fuel at Olkiluoto - Synthesis 2012 Posiva Oy ISBN 978-951-652-193-3 POSIVA 2012-13 Canister Design 2012 Heikki Raiko, VTT ISBN 978-951-652-194-0 POSIVA 2012-14 Buffer Design 2012 Markku Juvankoski, VTT ISBN 978-951-652-195-7 POSIVA 2012-15 Backfill Design 2012 Posiva Oy ISBN 978-951-652-196-4 POSIVA 2012-16 Canister Production Line 2012 – Design, Production and Initial State of the Canister Heikki Raiko (ed.), VTT Barbara Pastina, Saanio & Riekkola Oy Tiina Jalonen, Leena Nolvi, Jorma Pitkänen & Timo Salonen, Posiva Oy ISBN 978-951-652-197-1 POSIVA 2012-17 Buffer Production Line 2012 – Design, Production, and Initial State of the Buffer Markku Juvankoski, Kari Ikonen, VTT Tiina Jalonen, Posiva Oy ISBN 978-951-652-198-8

POSIVA 2012-18 Backfill Production Line 2012 - Design, Production and Initial State of the Deposition Tunnel Backfill and Plug Paula Keto (ed.), Md. Mamunul Hassan, Petriikka Karttunen, Leena Kiviranta, Sirpa Kumpulainen, B+Tech Oy Leena Korkiala-Tanttu, Aalto University Ville Koskinen, Fortum Oyj Tiina Jalonen, Petri Koho, Posiva Oy Ursula Sievänen, Saanio & Riekkola Oy ISBN 978-951-652-199-5 POSIVA 2012-19 Closure Production Line 2012 - Design, Production and Initial State of Underground Disposal Facility Closure Ursula Sievänen, Taina H. Karvonen, Saanio & Riekkola Oy David Dixon, AECL Johanna Hansen, Tiina Jalonen, Posiva Oy ISBN 978-951-652-200-8 POSIVA 2012-20 Representing Solute Transport Through the Multi-Barrier Disposal System by Simplified Concepts Antti Poteri. Henrik Nordman, Veli-Matti Pulkkanen, VTT Aimo Hautojärvi, Posiva Oy Pekka Kekäläinen, University of Jyväskylä, Deparment of Physics ISBN 978-951-652-201-5 POSIVA 2012-21 Layout Determining Features, their Influence Zones and Respect Distances at the Olkiluoto Site Tuomas Pere (ed.), Susanna Aro, Jussi Mattila, Posiva Oy Henry Ahokas & Tiina Vaittinen, Pöyry Finland Oy Liisa Wikström, Svensk Kärnbränslehantering AB ISBN 978-951-652-202-2 POSIVA 2012-22 Underground Openings Production Line 2012 – Design, Production and Initial State of the Underground Openings Posiva Oy ISBN 978-951-652-203-9 POSIVA 2012-23 Site Engineering Report Posiva Oy ISBN 978-951-652-204-6 POSIVA 2012-24 Rock Suitability Classification, RSC-2012 Tim McEwen (ed.), McEwen Consulting Susanna Aro, Paula Kosunen, Jussi Mattila, Tuomas Pere, Posiva Oy Asko Käpyaho, Geological Survey of Finland Pirjo Hellä, Saanio & Riekkola Oy ISBN 978-951-652-205-3 POSIVA 2012-25 2D and 3D Finite Element Analysis of Buffer-Backfill Interaction Martino Leoni, Wesi Geotecnica Srl ISBN 978-951-652-206-0

POSIVA 2012-26 Climate and Sea Level Scenarios for Olkiluoto for the Next 10,000 Years Natalia Pimenoff, Ari Venäläinen & Heikki Järvinen, Ilmatieteen laitos ISBN 978-951-652-207-7 POSIVA 2012-27 Geological Discrete Fracture Network Model for the Olkiluoto Site, Eurajoki, Finland: version 2.0 Aaron Fox, Kim Forchhammer, Anders Pettersson, Golder Associates AB Paul La Pointe, Doo-Hyun Lim, Golder Associates Inc. ISBN 978-951-652-208-4 POSIVA 2012-28 Safety Case for the Disposal of Spent Nuclear Fuel at Olkiluoto - Data Basis for the Biosphere Assessment BSA-2012 Posiva Oy ISBN 978-951-652-209-1 POSIVA 2012-29 Safety Case For The Disposal of Spent Nuclear Fuel at Olkiluoto - Terrain and Ecosystems Development Modelling in the Biosphere Assessment BSA-2012 Posiva Oy ISBN 978-951-652-210-7 POSIVA 2012-30 Safety Case for the Disposal of Spent Nuclear Fuel at Olkiluoto - Surface and Near-surface Hydrological Modelling in the Biosphere Assessment BSA-2012 Posiva Oy ISBN 978-951-652-211-4 POSIVA 2012-31 Safety Case for the Disposal of Spent Nuclear Fuel at Olkiluoto - Radionuclide Transport and Dose Assessment for Humans in the Biosphere Assessment BSA-2012 Posiva Oy ISBN 978-951-652-212-1 POSIVA 2012-32 Safety Case for the Disposal of Spent Nuclear Fuel at Olkiluoto - Dose Assessment for the Plants and Animals in the Biosphere Assessment BSA-2012 Posiva Oy ISBN 978-951-652-213-8 POSIVA 2012-33 Underground Openings Line Demonstrations Stage 1, 2012 Seppo Mellanen , Genpro Solutions Oy Jari Gerlander,Kalle Hollmén,Saanio & Riekkola Oy Susanna Aro, Antti Joutsen, Sanna Mustonen, Posiva Oy ISBN 978-951-652-214-5
leinonen_ritva
Yliviivaus

POSIVA 2012-34 Seismic Activity Parameters of the Olkiluoto Site Jouni Saari, ÅF-Consult Oy ISBN 978-951-652-215-2 POSIVA 2012-35 Inspection of Disposal Canisters Components Jorma Pitkänen, Posiva Oy ISBN 978-951-652-216-9 POSIVA 2012-36 Analyses of Disposal Canister Falling Accidents Juha Kuutti, Ilkka Hakola, Stephania Fortino, VTT ISBN 978-951-652-217-6 POSIVA 2012-37 Long-Term Safety of the Maintenance and Decommissioning Waste of the Encapsulation Plant Olli Nummi, Jarkko Kyllönen, Tapani Eurajoki, Fortum Power and Heat ISBN 978-951-652-224-4 POSIVA 2012-38 Human Factors in NDT of the EB-Weld ISBN 978-951-652-225-1 POSIVA 2012-39 Safety Case for the Disposal of Spent Nuclear Fuel at Olkiluoto: Radionuclide Solubility Limits and Migration Parameters for the Canister and the Buffer Paul Wersin,Mirjam Kiczka,Dominic Rosch, Gruner AG, Switzerland ISBN 978-951-652-219-0