
Safety Assessment of an Aging Offshore Jacket Platform by ...
17
Safety Assessment of an Aging Offshore Jacket Platform by Integrating Analytic Hierarchy Process and Grey Clustering Method Xingxian Bao 1,∗ , Aixia Cao 2 and Fuzhen Qin 2 1 School of Petroleum Engineering, China University of Petroleum (East China), Qingdao 266580, Shandong, China 2 School of Ship Engineering, Qingdao Huanghai University, Qingdao, 266427, Shandong, China ∗ Correspondence: [email protected] Abstract: It is a significant task to assess the safety of the aging offshore jacket platform in order to extend the service life. This paper analyzes the multiple risk factors of an aging jacket platform in Bohai Bay, China and builds the safety evaluation index system, which includes three levels, namely, the target layer, the first-grade indicators layer and the second-grade indicators layer. The target layer consists of three first-grade indicators: ocean environments, structure status, and human and organizational factors. Each first-grade indicator is divided into three second-grade indicators. The weight of each indicator is calculated by analytic hierarchy process to weaken subjective effect. Grey clustering method is applied to estimate the failure risk of the platform in Bohai Bay qualitatively and quantitatively. The assessment standard is divided into five grades and the whitening function of each grey cluster is determined by the assessment scheme. The grey evaluation weight vector of each second-grade indicator is calculated by the table dispatching method. Through layer by layer calculation, the grey assessment value of the target layer is finally estimated by making the grey assessment weight vector single-value and the grey grade is determined according to the maximum principle. The evaluation results show quantitatively that the failure risk grade of the jacket platform in Bohai Bay is medium and the safety assessment method is reasonable and feasible. Keywords: aging offshore jacket platform; safety assessment; analytic hierarchy process; grey clustering method 1. Introduction Offshore jacket platforms have been widely used in offshore oil and gas exploitation. There are more than 5,000 different types of jacket platforms in different seas in the world. Safety is a significant challenge for offshore platforms due to the demanding ocean environment, structure damage and the fire and explosion risk associated with hydrocarbons [1-3]. Adequate performance Preprints (www.preprints.org) | NOT PEER-REVIEWED | Posted: 20 August 2016 doi:10.20944/preprints201608.0182.v1
Transcript of Safety Assessment of an Aging Offshore Jacket Platform by ...

Safety Assessment of an Aging Offshore Jacket Platform by
Integrating Analytic Hierarchy Process and Grey Clustering
Method
Xingxian Bao1,∗, Aixia Cao2 and Fuzhen Qin2
1 School of Petroleum Engineering, China University of Petroleum (East China), Qingdao 266580, Shandong,
China 2 School of Ship Engineering, Qingdao Huanghai University, Qingdao, 266427, Shandong, China ∗ Correspondence: [email protected]
Abstract: It is a significant task to assess the safety of the aging offshore jacket platform in order to extend the service life. This paper analyzes the multiple risk factors of an aging jacket platform in Bohai Bay, China and builds the safety evaluation index system, which includes three levels, namely, the target layer, the first-grade indicators layer and the second-grade indicators layer. The target layer consists of three first-grade indicators: ocean environments, structure status, and human and organizational factors. Each first-grade indicator is divided into three second-grade indicators. The weight of each indicator is calculated by analytic hierarchy process to weaken subjective effect. Grey clustering method is applied to estimate the failure risk of the platform in Bohai Bay qualitatively and quantitatively. The assessment standard is divided into five grades and the whitening function of each grey cluster is determined by the assessment scheme. The grey evaluation weight vector of each second-grade indicator is calculated by the table dispatching method. Through layer by layer calculation, the grey assessment value of the target layer is finally estimated by making the grey assessment weight vector single-value and the grey grade is determined according to the maximum principle. The evaluation results show quantitatively that the failure risk grade of the jacket platform in Bohai Bay is medium and the safety assessment method is reasonable and feasible. Keywords: aging offshore jacket platform; safety assessment; analytic hierarchy process; grey clustering method
1. Introduction
Offshore jacket platforms have been widely used in offshore oil and gas exploitation. There
are more than 5,000 different types of jacket platforms in different seas in the world. Safety is a
significant challenge for offshore platforms due to the demanding ocean environment, structure
damage and the fire and explosion risk associated with hydrocarbons [1-3]. Adequate performance
Preprints (www.preprints.org) | NOT PEER-REVIEWED | Posted: 20 August 2016 doi:10.20944/preprints201608.0182.v1

of the platforms is ensured by designing for a service life of 20 years or so. However, up to date,
most of the jacket platforms have already attained or exceeded their original design life. The use
of the existing structures will in many cases, even with major upgrading of the present condition,
be preferable from an economic point of view compared to installing new buildings. Accordingly,
there is a need to assess existing offshore structures during operation, for instance, because of
planned change of function or occurrence of damage or need to extend the service life.
A safety assessment of existing jacket platform should prove that the risk of structural failure
is acceptable [4]. In order to achieve this, several assessment procedures are proposed in
specifications and standards. The most general accepted standard for offshore structures is the ISO
13819-1 “Petroleum and natural gas industries - Offshore Structures – Part 1: General
Requirements” [5]. This standard gives general design rules and general rules for assessment of
existing structures. The NORSOK N-001 [6], which is a Norwegian regulation for structural
design, also refers to ISO 13819-1 for assessment of existing structures. However, ISO 13819-1 is
a rather general standard, not very specific on how to perform assessment. The standard gives
some indications, such as design code format, reserve strength ratio format and a probabilistic
format. More details are given in other standards, like API RP2A-WSD [7], ISO/DIS 13822 [8]
and ISO/CD 19902 [9]. However, there are some arguments against all these methods [4]. Design
codes are claimed to be very conservative, as after some years of experience the knowledge of the
structure is increased compared with design. The increased information should not be disregarded
since they may make it possible to perform more accurate analysis. Methods based on reserve
strength ratio do formally only check the reserve strength of a structure [10] and will not cover
possible failure modes as fatigue and wave-in-deck. Structural reliability methods typically
account for capacity versus loading, particularly deal with the uncertainties of structural loads and
their effects as well as resistance [1, 11, 12]. However, the structural reliability methods are not
sufficiently mature at present time, as the reliability approaches are not consistent with the
derivation of the reliability target levels [4].
Accidents of offshore structures are not usually caused by a single failure or mistake, but by
the confluence of a whole series, or chain, of errors. To reduce the risk, some risk analysis
techniques have been used in offshore industry for almost 20 years, and have contributed to the
reduction of the incidence rate of severe accidents in many circumstances [13]. For instance, a
Preprints (www.preprints.org) | NOT PEER-REVIEWED | Posted: 20 August 2016 doi:10.20944/preprints201608.0182.v1

systemic approach considering all the aspects that may lead to hazardous events is adopted in
offshore platforms safety assessment. A systemic approach means considering all functional
entities that constitute the offshore system as a whole, exploring patterns and inter-relationships
within subsystems and seeing undesired events as the products of the working of the system [14].
However, the systemic approach mainly uses descriptive, not predictive models, and is thus often
not very effective in determining ways to prevent accidents. In order to explore causal
relationships in offshore structures safety assessment, some conventional tools have been widely
used, including Fault Tree Analysis (FTA), Event Tree Analysis (ETA), Failure Mode and Effects
Analysis (FMEA), and Hazard and Operability Studies (HAZOP). Currently, the statistic analysis
method, which is both qualitative and quantitative, is drawing more and more attention. For
instance, grey correlation analysis [15], Monte-Carlo method [16], BP neural network method [17],
fuzzy comprehensive evaluation [18] and support vector machines method [19] have been applied
to the risk assessment in engineering field.
The aim of the paper is to contribute to offshore platforms safety assessment by proposing a
methodology to model evaluation system and determine the grade of the failure risk. We take an
aging offshore jacket platform in Bohai Bay, China as a case. The analytic hierarchy process (AHP)
is applied to establish the assessment index system with three layers, considering multiple risk
factors in complicated ocean environments, structure status, and human and organizational factors
(HOFs). The weight of each index is also calculated by AHP to weaken subjective effect. Through
the layer by layer calculation, the failure risk of the jacket platform is finally evaluated
qualitatively and quantitatively by the grey clustering method.
2. The Target Platform in Bohai Bay, China
The target platform studied in this paper is a steel jacket production platform that was built in
1998 in Bohai Bay, China. The original design life is 20 years. The jacket structure is 48m high
and the water depth at the site is 19.5m. The production platform consists of two parts: the
metering platform and the well group platform, which are connected by a trestle bridge. The
metering platform and the well group platform are secured to the sea floor with 4 piles and 6 piles,
respectively. The diameter of the pipes varies from 1.3m to 0.4m with depth, and the thickness
Preprints (www.preprints.org) | NOT PEER-REVIEWED | Posted: 20 August 2016 doi:10.20944/preprints201608.0182.v1
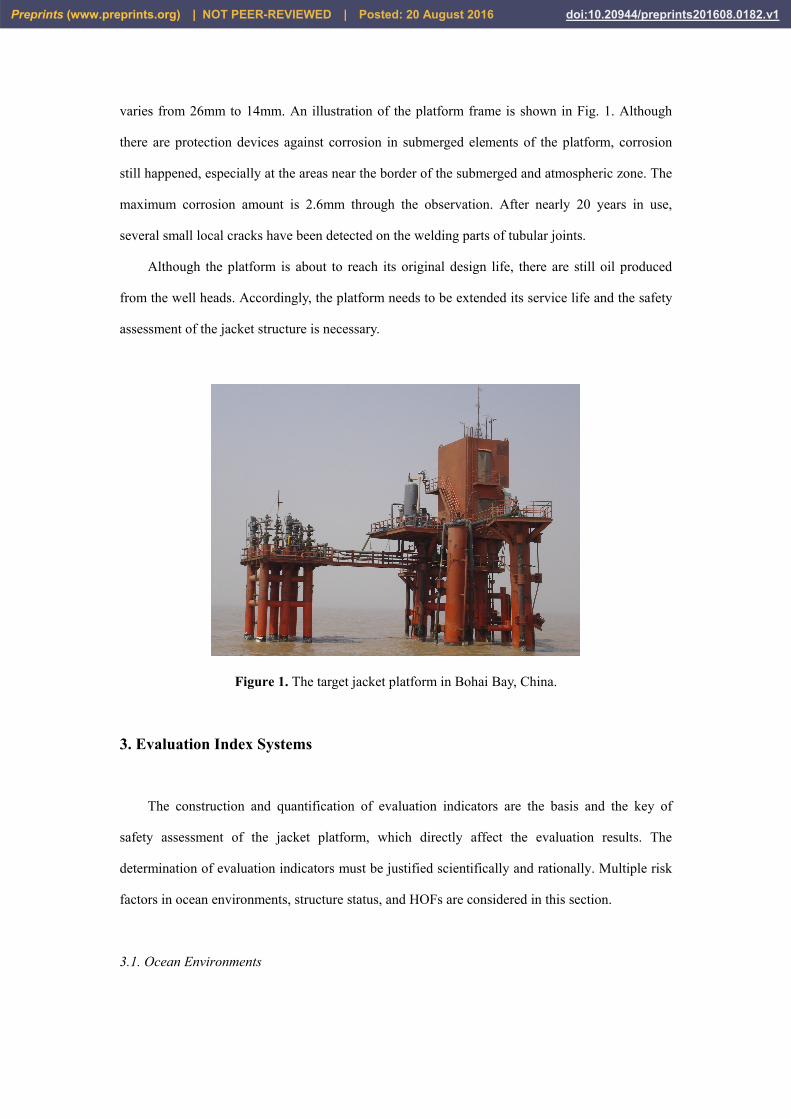
varies from 26mm to 14mm. An illustration of the platform frame is shown in Fig. 1. Although
there are protection devices against corrosion in submerged elements of the platform, corrosion
still happened, especially at the areas near the border of the submerged and atmospheric zone. The
maximum corrosion amount is 2.6mm through the observation. After nearly 20 years in use,
several small local cracks have been detected on the welding parts of tubular joints.
Although the platform is about to reach its original design life, there are still oil produced
from the well heads. Accordingly, the platform needs to be extended its service life and the safety
assessment of the jacket structure is necessary.
Figure 1. The target jacket platform in Bohai Bay, China.
3. Evaluation Index Systems
The construction and quantification of evaluation indicators are the basis and the key of
safety assessment of the jacket platform, which directly affect the evaluation results. The
determination of evaluation indicators must be justified scientifically and rationally. Multiple risk
factors in ocean environments, structure status, and HOFs are considered in this section.
3.1. Ocean Environments
Preprints (www.preprints.org) | NOT PEER-REVIEWED | Posted: 20 August 2016 doi:10.20944/preprints201608.0182.v1

The platform is threatened by complicated ocean environments during its service life. The
main ocean environment factors are considered as follows.
3.1.1. Environmental Loads
Environmental loads are loads imposed on the platform by natural phenomena including
wind, wave, current and ice. Environmental loads also include the variation in hydrostatic pressure
and buoyancy on members caused by changes in the water level due to waves and tides. Based on
50-year-return-period standard in the target sea, the average wind speed of 10 minutes is 28m/s,
the average wind speed of one minute is 30.5m/s, and the gust wind speed of 3 seconds is 33.6m/s.
The maximum wave height is 10.2m, and the corresponding wave period is 10.3s. The maximum
current speed is 1.69m/s. The maximum ice thickness is 0.4m and the ultimate compressive
strength is 2.24MPa.
3.1.2. Earthquakes
Seismic effects should be considered in platform assessment for areas that are determined to
be seismically active. Earthquake activity may trigger soil liquefaction and submarine slides,
which causes instability of the subsurface soils at the platform site and may result in collapse of
the platform. The offshore platform in Bohai Bay is located in the intersection of
Tan-Lu earthquake zone and Zhangjiakou-Bohai earthquake zone. There has been 4 recorded
earthquakes of M >7.0 in 1548, 1597, 1888 and 1969 in Bohai Bay, respectively.
3.1.3. Scour
Scour is removal of seafloor soils caused by currents and waves. Such erosion can be a
natural geologic process or can be caused by structural elements interrupting the natural flow
regime near the seafloor. Scour can result in removal of vertical and lateral support for foundations,
causing undesirable settlements of mat foundations and overstressing of foundation elements. The
scour amount of the platform is about 1.2m through the observation.
Preprints (www.preprints.org) | NOT PEER-REVIEWED | Posted: 20 August 2016 doi:10.20944/preprints201608.0182.v1

3.2. Structure Status
Structure status of the platform reflects the circumstance of service and the condition of
health, including the dead loads and live loads of the jacket platform, some types of damage
during its service life.
3.2.1. Dead Loads and Live Loads
Dead loads are the weights of the platform structure and any permanent equipment and
appurtenant structures which do not change with the mode of operation. The total mass of the
platform is about 1216800 kg.
Live loads are the loads imposed on the platform during its use and which may change either
during a mode of operation or from one mode of operation to another. Since the oil is transferred
by the submarine pipelines, the main live loads of the platform include the weight of living
quarters and other life support equipment, and the forces exerted on the structure from vessel
mooring.
3.2.2. Corrosion
Corrosion may seriously affect the structural capacity of systems due to the thickness
reduction of the structural steel. After some time of increasing corrosion, the tensile stress can
reach a critical value and can cause corrosion cracks [20, 21], and the bearing capacity of
structures will also be reduced. Design features to prevent or reduce the effect of corrosion
including the use of coating, cathodic protection and/or a plate thickness allowance. However,
because these methods are not fail-safe, corrosion and its negative effects on ultimate strength and
fatigue resistance are to be considered during operation.
Studies have shown that the general corrosion rate for steel in seawater is about 0.1 mm/year.
However, corrosion rates fluctuate between 0.04 to 1.2 mm/year and in some cases corrosion rates
up to 3 mm/year have been found in some ballast tanks in tankers [22]. The corrosion rate exhibits
Preprints (www.preprints.org) | NOT PEER-REVIEWED | Posted: 20 August 2016 doi:10.20944/preprints201608.0182.v1

a very large scatter depending upon location in the structure. The sea environment, i.e. in Bohai
Bay as compared to West Africa or Gulf of Mexico, is also a factor of influence on corrosion rates.
However this aspect has not yet been quantified. The corrosion is not homogeneous and the
maximum corrosion amount of the platform is 2.6mm through the observation.
3.2.3. Fatigue
Fatigue is one of the most common damage types that may occur when structures are
subjected to repetitive or cyclic load patterns. Fatigue damage begins with cracks that initiate in
structural elements, and may continue with their growth and with initiation of other cracks [23,
24].
Fatigue strength is commonly described by SN-curves that have been obtained by laboratory
experiments. Fracture mechanics methods have been adopted to assess the different stages of
crack growth, including calculation of residual fatigue life. However, a significant amount of
cracks inspections in North Sea fixed platforms suggested that the prediction methods were
conservative and that the likelihood of fatigue cracks was much less than initially anticipated. This
fact indicates that it is difficult to accurately assess the fatigue cracks growth status [1].
Due to lack of access inside the underwater jacket structure, inspections have been carried
out on the outside by divers or by remotely operated vehicles. This fact implies in general high
inspection costs. According to the observation of the jacket platform, several small local cracks
have been detected on the welding parts of tubular joints.
3.3. Human and Organizational Factors
Surveys conducted by different individuals and safety bodies have revealed that about
75-96% of marine casualties are fully/partially caused by human and organizational errors [25].
Studies [26-28] have shown that HOFs contribute to 75% of fires and explosions, 89-96% of
collisions, 75% of allisions, 79% of towing vessel groundings and 84–88% of tanker accidents.
From human behavior and organization theory point of view, some researchers investigated
human and organizational error classification and grouped them into four basic categories: skill
Preprints (www.preprints.org) | NOT PEER-REVIEWED | Posted: 20 August 2016 doi:10.20944/preprints201608.0182.v1

based errors, decision based errors, perceptual errors, and violation errors [29]. Each basic group
could include some factors. Significant factors associated with skill-based errors, for example,
may include failed to prioritize attention, inadvertent use of system controls, omitted step in
procedure, omitted checklist item, poor technique, and over controlled the system. Decision based
errors include improper procedure, misdiagnosed emergency, wrong response to emergency,
exceeded ability, inappropriate maneuver, and poor decision. Perceptual errors happen due to
misjudged distance and visual illusion. Violation errors may include violated training rules, failed
to properly prepare for the mission, not current/qualified for the mission, and intentionally
exceeded the limits of the vessel [13].
Fire, blast, and accidental loading events (e.g. collision from ships, dropped objects) are the
main accidents caused by HOFs, which could lead to partial or total collapse of an offshore
platform resulting in loss of life and/or environmental pollution. For the target production platform
in Bohai Bay, there are some oil and gas treatment and measuring equipments, so the fire and blast
risks should be considered in the offshore platform safety assessment. Although the platform is
unattended most of the time, some periodical inspections and supplies are necessary. Hence the
accidental loading events, for instance, collision from ships are also supposed to be considered.
4. Method and Application
4.1. Analytic Hierarchy Process
The analytic hierarchy process (AHP) is a structured technique for organizing and
analyzing complex decisions, based on mathematics and psychology. The procedure for using the
AHP can be briefly summarized below [30].
1) Construct a hierarchy containing the target layer and the indicators layer, and the criteria
for evaluating the indicators.
2) Establish the judgment matrix based on pairwise comparisons of the indicators.
3) Calculate the weight vectors and check the consistency.
This paper constructs the evaluation index system of safety assessment of aging offshore
jacket platform in Bohai Bay, China that includes three levels, namely, the target layer, the
Preprints (www.preprints.org) | NOT PEER-REVIEWED | Posted: 20 August 2016 doi:10.20944/preprints201608.0182.v1
first-grade indicators layer and the second-grade indicators layer. The target layer consists of three
first-grade indicators: ocean environments, structure status, and HOFs. Each first-grade indicator
is divided into three second-grade indicators. There are nine second-grade indicators in total
analyzed in this paper. Ten evaluators are selected to give each second-grade indicator a grade, and
then the pairwise comparison matrix is established. The weights of evaluating indicators are
determined by computing the greatest eigenvalue and eigenvector of the matrix. The consistency
ratio of a pairwise comparison matrix is the ratio of its consistency index to the corresponding
random index. The reader is referred to the subject textbook [30] for a detailed treatise on AHP.
4.2. Grey Clustering Method
Grey clustering method adopts the grey whitening functions in common clustering analysis,
which is mainly applied to study the uncertainties of system model and make forecasts and
decisions. The meaning of grey can be expressed as the characteristics between black and white.
The grey system focuses deeply on what partial or limited information the system can provide, and
tries to describe its total feature from this [31]. The grey statistic method is proposed and applied
to safety assessment of the jacket platform in Bohai Bay, China in this section. The basic
definition and approach are described in a step-by-step manner as following.
4.2.1. Grey Whitening Function
Assume f(x) is a linear monotonic function of x and ( ) [ ]0,1f x ∈ . Then f(x) is called the
whitening weight function and x is the grey number. If there are g evaluation grey cluster, the
corresponding whitening function and threshold value is named ( ) ( ) ( )1 2, ,... , gf x f x f x and
1 2, ,... , gλ λ λ , respectively. The evaluation result depends on the assessment standard which is
divided into five grades in this paper: “very high”, “high”, “medium”, “low”, “very low” , g=5.
These qualitative indexes are assigned values accordingly in order to transfer them into
quantitative indexes. The score of each grade is 9, 7, 5, 3 and 1, respectively, i.e.,
Preprints (www.preprints.org) | NOT PEER-REVIEWED | Posted: 20 August 2016 doi:10.20944/preprints201608.0182.v1
[ ] [ ]1 2 3 4 5, , , , = 9,7,5,3,1λ λ λ λ λ . Their whitening functions are expressed as
( )1
1 ,0 991, 9 10
x xf x
x
≤ <= ≤ ≤
(1)
( )( )
2
1 , 0 771 10 ,7 103
x xf x
x x
≤ <= − ≤ ≤
(2)
( )( )
3
1 , 0 551 10 ,5 105
x xf x
x x
≤ <= − ≤ ≤
(3)
( )( )
4
1 , 0 331 10 ,3 107
x xf x
x x
≤ <= − ≤ ≤
(4)
( ) ( )5
1, 0 11 10 ,1 109
xf x
x x
≤ <= − ≤ ≤
(5)
4.2.2. Grey Evaluation Weight
The score of each evaluator is considered as a grey number in grey evaluation model.
Assuming x evaluators give marks dij1, dij2,..., dijx to evaluation indicator Uij, then the whitening
function which evaluators consider Uij to belong to the lth grey cluster is
( ) ( ) ( )1 2, ,... ,l ij l ij l ijxf d f d f d respectively. The total quantity of whitening function which belongs
to the lth evaluation grey cluster is ( )1
x
l ijhh
f d= , and then the total quantity of whitening function of
the entire evaluation grey cluster is ( )1 1
g x
l ijhl h
f d= = . The grey evaluation weight of the lth evaluation
grey cluster is defined as
( )
( )1
1 1
, 1,2,
x
l ijhh
ijl g x
l ijhl h
f dr l g
f d
=
= =
= =
(6)
The grey evaluation weight vector of all evaluation grey clusters is
1 2, ,... , , 1, 2,... , , 1, 2,... ,ij ij ij ijg ir r r r i m j n = = = (7)
Preprints (www.preprints.org) | NOT PEER-REVIEWED | Posted: 20 August 2016 doi:10.20944/preprints201608.0182.v1

The above computational processes can be accomplished by table dispatching method which
is listed in Table 1.
Table 1. The table dispatching method calculating the grey evaluation weight∗
Grey cluster dij1 dij2 … dijx sum Evaluation weight
1 f1(dij1) f1(dij2) … f1(dijx) 1 1
2 f2(dij1) f2(dij2) … f2(dijx) 2 2
… …
g fg(dij1) fg(dij2) … fg(dijx) g g
sum
∗ Note that ( ) 1 2 g1
, where 1,2, , .x
ijl l l l ijhh
r f d l g=
= = = = + + + ,
4.2.3. Grey Assessment Value
Assume that the first-grade indicator objective iU is composed of 1 2, ,... ,ii i inU U U , the
weight vectors of iU are written as 1 2, ,...ii i i inA a a a , = . Note that ija is calculated by AHP
and should have to meet specific conditions, i.e., in
10 and 1ij ij
ja a
=
≥ = . Then the grey
comprehensive assessment weight vector of iU is defined as
1 2, ,... ,i i i i i igB A R b b b = × = , (8)
where the grey evaluation weight matrix iR is written as
11 12 11
21 22 22
1 2
, 1, 2,... ,
i i i gi
i i i gii
im im imgim
r r rrr r rr
R i m
r r rr
= = =
(9)
Preprints (www.preprints.org) | NOT PEER-REVIEWED | Posted: 20 August 2016 doi:10.20944/preprints201608.0182.v1

To target layerU , consisting of all evaluation indicators 1 2, ,... , mU U U , the weight vectors are
written as [ ]1 2, ,... mA a a a ,= . Note thatm
10 and 1i i
ia a
=
≥ = . Then the grey comprehensive
assessment weight vector of U is defined as
1 2, ,... , gB A R b b b = × = , (10)
where the grey evaluation weight matrix R is comprised of iB , written as
1
2
m
BB
R
B
=
, 1, 2,... ,i m = . (11)
Usually the grey grade can be determined according to the maximum principle. However,
sometimes the result will be distorted because of losing too much information. The assessment
weight vector B will be dealt with by making it single-value in this paper. The grey
comprehensive assessment value will be calculated as follow
T
1 2 1 1 2 2, ,... , ...g g gW B b b bλ λ λ λ λ λ = × = + + + (12)
Taking the grey assessment value W as the grey number, then the whitening weight function
of W is denoted as ( ) ( ) ( )1 2, ,... , gf W f W f W . The grey grade is determined according to the
maximum principle.
4.3. Application
According to the principles of the AHP, the pairwise comparison matrix and the weights are
calculated based on the overall consideration and statistical analysis of the multiple risk factors of
the aging jacket platform. The weight vectors of first-grade evaluation indicators affecting safety
of the platform are written as A= [0.2667, 0.4011, 0.3322]. The consistency ratio is 0.005, which
indicates that the weighted coefficients are reasonable and efficient. The importance ranking for
the first-grade evaluation indicator is structure status > HOFs > ocean environments. So the
structure status is the most noticeable factor in the safety assessment of the jacket platform. The
Preprints (www.preprints.org) | NOT PEER-REVIEWED | Posted: 20 August 2016 doi:10.20944/preprints201608.0182.v1

weight vectors of second-grade evaluation indicators are written as A1= [0.2047, 0.4370, 0.3583],
A2= [0.2720, 0.3584, 0.3696], A3= [0.3747, 0.3337, 0.2816] for ocean environments, structure
status, and HOFs, respectively. The consistency ratios are 0.006, 0.005 and 0.006, respectively.
The importance ranking for the second-grade evaluation indicator are earthquakes > scour >
environmental loads, fatigue > corrosion > dead loads and live loads, and fire > blast > accidental
loading events, respectively. The safety assessment of the jacket platform has the characteristics of grey. The grey
clustering method is applied in this paper to evaluate the safety of the platform. The grey
evaluation weight vectors of indicators are calculated by the table dispatching method. Take for
example, the grey evaluation weights of environmental loads are given in Table 2.
Table 2. The grey evaluation weights of environmental loads.
Grey
cluster 2 3 1 2 2 3 1 3 3 2 Σ
Evaluation
weight
1 f1(2) f1(3) f1(1) f1(2) f1(2) f1(3) f1(1) f1(3) f1(3) f1(2) 2.4444 0.0941
2 f2(2) f2(3) f2(1) f2(2) f2(2) f2(3) f2(1) f2(3) f2(3) f2(2) 3.1429 0.1209
3 f3(2) f3(3) f3(1) f3(2) f3(2) f3(3) f3(1) f3(3) f3(3) f3(2) 4.4000 0.1693
4 f4(2) f4(3) f4(1) f4(2) f4(2) f4(3) f4(1) f4(3) f4(3) f4(2) 7.3333 0.2822
5 f5(2) f5(3) f5(1) f5(2) f5(2) f5(3) f5(1) f5(3) f5(3) f5(2) 8.6667 0.3335
Σ 25.9873
The grey evaluation weight vectors of the other indicators can be calculated according to the
above method. All the grey evaluation weight vectors of nine indicators are as follows.
[ ]11 0.0941,0.1209,0.1693,0.2822,0.3335r =
[ ]12 0.1651,0.2123,0.2743,0.1959,0.1524r =
[ ]13 0.0992,0.1275,0.1785,0.2973,0.2975r =
[ ]21 0.1200,0.1543,0.2161,0.2867,0.2229r =
[ ]22 0.4444,0.2352,0.1411,0.1008,0.0785r = (13)
[ ]23 0.3756,0.2643,0.1586,0.1133,0.0882r =
Preprints (www.preprints.org) | NOT PEER-REVIEWED | Posted: 20 August 2016 doi:10.20944/preprints201608.0182.v1

[ ]31 0.3608,0.2706,0.1624,0.1160,0.0902r =
[ ]32 0.3089,0.2926,0.1756,0.1254,0.0975r =
[ ]33 0.2362,0.2885,0.2094,0.1496,0.1163r =
Then the grey evaluation weight matrix of iU can be written as
11
1 12
13
0.0941 0.1209 0.1693 0.2822 0.33350.1651 0.2123 0.2743 0.1959 0.15240.0992 0.1275 0.1785 0.2973 0.2975
rR r
r
= =
21
2 22
23
0.1200 0.1543 0.2161 0.2867 0.22290.4444 0.2352 0.1411 0.1008 0.07850.3756 0.2643 0.1586 0.1133 0.0882
rR r
r
= =
(14)
31
3 32
33
0.3608 0.2706 0.1624 0.1160 0.09020.3089 0.2926 0.1756 0.1254 0.09750.2362 0.2885 0.2094 0.1496 0.1163
rR r
r
= =
The grey comprehensive assessment weight vector of iU is
[ ]1 1 1 0.1270,0.1632,0.2185,0.2499,0.2415B A R= × =
[ ]2 2 2 0.3307,0.2240,0.1680,0.1560,0.1214B A R= × = (15)
[ ]3 3 3 0.3048,0.2803,0.1784,0.1274,0.0991B A R= × =
Accordingly, the grey evaluation weight matrix of U can be written as
1
2
3
0.1270 0.1632 0.2185 0.2499 0.24150.3307 0.2240 0.1680 0.1560 0.1214 ,0.3048 0.2803 0.1784 0.1274 0.0991
BR B
B
= =
(16)
and the grey comprehensive assessment weight vector of U is
[ ]0.2678, 0.2265, 0.1849, 0.1715, 0.1460B A R= × = . (17)
Finally, the grey comprehensive assessment value is calculated as follow
[ ]T1 2 5, ,... , =5.5807.W B λ λ λ= × (18)
To all evaluation grey clusters, the whitening weight functions of the grey comprehensive
assessment value are
Preprints (www.preprints.org) | NOT PEER-REVIEWED | Posted: 20 August 2016 doi:10.20944/preprints201608.0182.v1

( ) ( ) ( ) ( ) ( )1 2 3 4 50.6201, 0.7972, 0.8839, 0.6313, 0.4910.f W f W f W f W f W= = = = = (19)
Obviously, ( )3f W is the maximum value and it can be concluded that the grey grade of the
failure risk of the platform is “medium”. That means the failure of the aging offshore jacket
platform is occurred possibly which is consistent with the test report from a third party. Regular
maintenance or periodically detect for the platform and facilities should be carried out in order to
ensure safety and extend the service life.
5. Conclusions
1. The safety evaluation index system of an aging offshore jacket platform in Bohai Bay, China
is proposed, which consists of three levels and nine risk factors in ocean environments,
structure status, and HOFs, respectively.
2. AHP method is adopted to weigh the risk factors and grey clustering method is applied to
estimate the failure risk of the jacket platform qualitatively and quantitatively. The evaluation
results suggest that the grade of the risk is medium and the failure is possible to occur which
is in agreement with the test report from a third party. It indicates this evaluation method is
objective and efficient.
3. The impact factors of the safety of the aging platform in Bohai Bay are comprehensive;
especially structure status and HOFs will lead to direct or potential hazards. In order to
extend the service life, regular maintenance or periodically detect for the platform and
facilities should be implemented.
Acknowledgments: The research works are supported by the National Natural Science
Foundation of China (No. 51309239), Fundamental Research Funds for the Central Universities
(Grant No. 16CX02057A), National Key Research and Development Plan (No.
2016YFC0303800), High School Science and Technology Project of Shandong Province (No.
J15LB55), and Science and Technology Project of Qingdao Huanghai University (No.
2015DXKJ19).
Author Contributions: Bao, X.X. and Cao, A.X. analyzed the data; Bao, X.X. wrote the paper
Preprints (www.preprints.org) | NOT PEER-REVIEWED | Posted: 20 August 2016 doi:10.20944/preprints201608.0182.v1
and Qin, F.Z. checked the whole paper.
Conflicts of Interest: The authors declare no conflict of interest.
References
1. Moan, T. Reliability-based management of inspection, maintenance and repair of offshore structures.
Structure and Infrastructure Engineering 2005, 1, 33-62.
2. Bao, X.X. Modal parameters identification based on noise reduction for jacket type offshore platforms.
Journal of Vibroengineering 2014, 16, 1219-1230.
3. Bao, X.X.; Wang, J.R.; Li, H.J. A safety assessment method on aging offshore platforms with damages. In
Proceedings of the Nineteenth International Offshore and Polar Engineering Conference, Osaka, Japan, 21-26
June 2009; pp. 612-616.
4. Ersdal, G.; Langen, I. On assessment of existing offshore structures. In Proceedings of the Twelfth
International Offshore and Polar Engineering Conference, Kitakyushu, Japan, 26-31 May 2002; pp. 426-433.
5. ISO. ISO 13819-1 Petroleum and natural gas industries – Offshore structures – Part 1: General
requirements. ISO 1995.
6. NORSOK. NORSOK N-001 Structural Design. Rev. 3, NTS, Norway, 2000.
7. API RP-2A WSD. Recommended Practice for Planning, Designing and Constructing Fixed Offshore
Platforms—Working Stress Design. API Recommended Practice 2A-WSD (RP 2A-WSD), Twenty-first
edition, December 2000.
8. ISO. ISO/DIS 13822 Bases for design of structures – Assessment of existing structures. ISO 2000.
9. ISO. ISO/CD 19902 Design of fixed steel jackets, Draft E. June 2001.
10. Thandavamoorthy, T.S.; Madhava Rao, A.G.; Santhakumar, A.R. Behavior of internally ring-stiffened joints
of offshore platforms. Journal of Structural Engineering 1999, 125, 1348-1352.
11. Aghakouchak, A.A.; Stiemer, S.F. Fatigue reliability assessment of tubular joints of existing offshore
structures. Canadian Journal of Civil Engineering 2001, 28, 691-698.
12. Torres, M.A.; Ruiz, S.E. Structural reliability evaluation considering capacity degradation over time.
Engineering Structures 2007, 29, 2183-2192.
13. Ren, J.; Jenkinson, I.; Wang, J; Xu, D.L.; Yang, J.B. A methodology to model causal relationships on
offshore safety assessment focusing on human and organizational factors. Journal of Safety Research 2008,
39, 87-100.
14. Beard, A.N. Some ideas on a systemic approach. Fire Safety Journal 1989, 14, 193-197.
15. Li, C.L.; Wu, S.G.; Zhu, Z.Y.; Bao, X.X. The assessment of submarine slope instability in Baiyun Sag using
gray clustering method. Natural Hazards 2014, 74, 1179-1190.
16. Khan, R.A.; Ahmad, S. Bi-linear fatigue and fracture approach for safety analysis of an offshore structure.
Journal of Offshore Mechanics & Arctic Engineering 2014, 136, 158-163.
17. Wang, S.; Zhang, N.; Wu, L.; Wang, Y. Wind speed forecasting based on the hybrid ensemble empirical
mode decomposition and GA-BP neural network method. Renewable Energy 2016, 94, 629-636.
18. Lai, C.; Chen, X.; Chen, X.; Wang, Z.; Wu, X.; Zhao, S. A fuzzy comprehensive evaluation model for flood
risk based on the combination weight of game theory. Natural Hazards 2015, 77, 1243-1259.
19. Ortac-Kabaoglu, R.; Eksin, I.; Yesil, E.; Guzelkaya, M. An active fault tolerant control method based on
support vector machines. Journal of Intelligent & Fuzzy Systems 2015, 29, 1761-1768.
20. Liang, M.T.; Lan, J.J. Reliability analysis for the existing reinforced concrete pile corrosion of bridge
substructure. Cement and Concrete Research 2005, 35, 540-550.
21. Zhang, Y.M.; Tan, T.K.; Xiao, Z.M.; Zhang, W.G.; Ariffin, M.Z. Failure assessment on offshore girth
Preprints (www.preprints.org) | NOT PEER-REVIEWED | Posted: 20 August 2016 doi:10.20944/preprints201608.0182.v1
welded pipelines due to corrosion defects. Fatigue & Fracture of Engineering Materials & Structures 2015,
39, 453-466.
22. TSCF. Guidance Manual for Tankers Structures. Tanker Structure Cooperative Forum and IACS, Whitherby
Publishers: London, 1997.
23. Dong, W.; Moan. T.; Gao, Z. Fatigue reliability analysis of the jacket support structure for offshore wind
turbine considering the effect of corrosion and inspection. Reliability Engineering & System Safety 2012, 106,
11-27.
24. Yeter, B.; Garbatov, Y.; Soares, C.G. Fatigue damage assessment of fixed offshore wind turbine tripod
support structures. Engineering Structures 2015, 101, 518-528.
25. Rothblum, A.M. Human error and marine safety. In US Coastguard Research and Development Centre,
2000.
26. Bryant, D.T. The Human element in shipping casualties. Report prepared for the Department of Transport.
United Kingdom: Marine Directorate, 1991.
27. Transportation Safety Board of Canada. Working paper on tankers involved in shipping accidents 1975-1992,
1994.
28. UK P&I Club. Analysis of major claims Bermuda: The United Kingdom Mutual Steam Ship Assurance
Association (Bermuda) Limited, 1992.
29. Baker, C.C.; MaCafferty, D.B. Accident database review of human element concerns: what do the results
mean for classification? Human factors in ship design, safety and operation, London: Royal Institution of
Naval Architects, 23-24 February 2005.
30. Saaty, T.L. The analytical hierarchy process. McGraw-Hill, New York, 1980.
31. Bindu, M.; Chandulal, A.J. Evaluating web sites using COPRAS-GRA combined with grey clustering.
International Journal of Engineering Science and Technology 2010, 2, 5280-5294.
© 2016 by the authors; licensee Preprints, Basel, Switzerland. This article is an open access article distributed under the terms and conditions of the Creative Commons by Attribution (CC-BY) license (http://creativecommons.org/licenses/by/4.0/).
Preprints (www.preprints.org) | NOT PEER-REVIEWED | Posted: 20 August 2016 doi:10.20944/preprints201608.0182.v1


