Safe Passage: A Student's Perspective
24
Safe Passage: A Student's Perspective Safe Passage Student Survey (Washington, DC) February - April 2020
Transcript of Safe Passage: A Student's Perspective

Safe Passage: A Student's Perspective
Safe Passage Student Survey (Washington, DC)February - April 2020

Partner Agencies and Organizations
Office of the Student Advocate
The Office of the Student Advocate is an independent office, housed in the District of Columbia State Board of Education. Our office developed the Safe Passage Survey, and conducted more than 20 focus groups with DC public and charter school students. The following staff members helped develop and facilitate the survey and focus groups:
Dan Davis, Chief Student AdvocatePhillip Copeland, Student AdvocateRenatta Landrau, Program Associate
Urban Institute
The Urban Institute provided written analysis of the Safe Passage Survey which was used in the creation of this report. Kelia Washington and Megan Gallagher analyzed the Safe Passage Survey and provided a summary to The Office of the Student Advocate.
Keila Washington, Research AnalystMegan Gallagher, Senior Research Associate
The following organizations and agencies either organized a focus group, provided a space for focus groups, or distributed the Safe Passage Survey:
Black Swan AcademyDC Public LibraryDC State Board of Education, Student Advisory CommitteeGlobal KIDSMikva, DCOffice of the Deputy Mayor for EducationPathways 2 Power, Thurgood Marshall Academy PCSTeaching for ChangeYoung Women's Project
Stakeholders and Community Partners
1

Table of Content
3 Overview / Background
4 Survey Results:By the Numbers
5 Methods
6What Makes Students Feel Uncomfortable or in Danger
8 How Students Rate Their Safety and Why
10 Key Themes from Survey
15 How Students Travel to School
16 Student Level of Safety:On the Bus, On the Train, and by Walking
19 Summary / Recommendations
2
20 Appendix

Overview
In 2020, the Office of the Student Advocate (OSA) administered surveys and conducted focus groups with students to better understand their experiences traveling to and from school. OSA collaborated with the Urban Institute to provide analysis of select data from the survey results. More than one-third of students reported feeling uncomfortable or in danger. When asked more specifically about their level of safety, more than half of the respondents reported feeling either uncomfortable, concerned, afraid, or in danger while traveling to-and-from school. This analysis explores what make them feel that way and whether that varies across ward of residence.
The safety of students traveling to-and-from school must be ensured before we can adequately address the academic achievement of all students. Prior to school shutdowns in response to COVID-19, OSA worked to understand more about the issue of student safety and safe passage through data collection from the perspective of students. Over the course of several months early in 2020, OSA administered surveys and conducted focus groups with students. The resulting survey sample included 452 students from 27 different schools. We spoke with 235 students from 15 District of Columbia Public Schools (DCPS) and 217 students from 12 Public Charter Schools (PCS). Survey data was collected by sending a link directly to students during focus group meetings across the District. Students answered questions on topics including the their perceptions of safety, their neighborhoods, and their routes to and from school. These student responses can be used to mobilize students in addition to informing other stakeholders who are seeking more effective and innovative solutions to ensure student safety that go beyond policing. The Urban Institute became involved with this effort in June 2020, several months after the DC Office of the Student Advocate collected the data. The Urban Institute provided analytical support to OSA by coding open ended survey items, organizing focus group responses, and mapping survey responses. The results from Urban’s analysis are presented in this memo.
Background
3

Survey Results: By the Numbers
452
Total Students who completed the survey.
15
DC Public Schools
12
Public Charter Schools
8
Students surveyed across all 8 wards.
Anacostia HS, Ballou HS, Banneker HS, Cardozo Education Campus,
Columbia Heights Education Campus, Duke Ellington School for the Arts,
Eastern HS, Hart MS, H.D. Woodson HS, Kramer MS, McKinley Technology HS, Roosevelt HS, Roosevelt STAY HS, School Without Walls, and Wilson HS.
Basis, Capital City, DC International, Friendship Collegiate Academy,
Idea, Inspired Teaching, KIPP DC College Preparatory, Meridian
Middle School, Paul, SEED, Thurgood Marshall Academy, and Washington Leadership Academy.
4

Methods
The survey completed by students used a combination of close-ended and open-ended questions. The close-ended questions provided a baseline when understanding the perspective of the student respondents. The open-ended questions provided context to the responses from close-ended questions. QUALITATIVE ANALYSISWe coded two open-ended survey questions. The first asked about what makes students feel uncomfortable or in danger. Q8: If you ever feel uncomfortable or in danger, could you describe what makes you feel that way? The second question asked students to provide an example describing why they chose a specific level of safety (safe/uncomfortable/concerned/afraid/in danger). Q12: Can you give an example describing why you chose the level of safety from the previous question? The codebook was developed between the Urban Institute and OSA staff. It included themes that the Urban Institute and OSA staff wanted to extract from the data (inductive) as well as themes that were observed in the open-ended responses (deductive). Open-ended responses could be coded multiple times if they reflected more than one theme. The codebook is available in Appendix Table A1.
5

What Makes Students Feel Uncomfortable
or in Danger?
When students were asked if they ever felt uncomfortable or in danger traveling to school, over a third of them chose that they felt that way. About 62 percent of students stated that they did not feel uncomfortable or in danger (Table 1).
Response Count Percentage
Yes 164 36.0%
No 280 61.5%
Missing 11 2.4%
Total 455 100%
Students who reported feeling uncomfortable or in danger traveling to school were able to describe what made them feel that way. Students reported a variety of sources of discomfort. Their responses were coded into consistent themes for analysis shown on Table 2. More than 25 percent of students who responded mentioned non-protective people, who are people they encounter that made them feel uncomfortable. Another 12 percent reported that traditional routes, like bus or metro routes, made them feel uncomfortable, and about 10 percent reported that perceived or observed violence made them feel uncomfortable.
Q7: Do you ever feel uncomfortable or in danger traveling to school?
TABLE 1
6

What Makes Students Feel Uncomfortable
or in Danger?
Code Name Count Percentage
Avoidance 3 1.8%
COVID 4 2.4%
Darkness 3 1.8%
Drugs 7 4.3%
Environment 5 3.0%
Hypervigilance 5 3.0%
Neighborhood / Home 5 3.0%
Non-protective People 45 27.4%
Protective Factors 3 1.8%
Routes - traditional 19 11.6%
Routes - nontraditional 1 0.6%
Street Harassment 6 3.7%
Surveillance 5 3.0%
Time – after school 6 3.5%
Time – before school 1 0.6%
Uncertainty 2 1.2%
Violence 16 9.8%
Weapons 8 4.9%
Q8: If you ever feel uncomfortable or in danger, could you describe what makes you feel that way?(Where Q7 = Yes)
TABLE 2
7

How Students Rate Their Safety and Why
Even though about 62 percent of our respondents reported not feeling uncomfortable or in danger traveling to school in earlier questions, only 42 percent of students reported feeling safe later in the survey (Figure 1).
Q10: Using the scale below, how would you rate the level of safety you feel traveling to and from school?
FIGURE 1
Safe: 42.0 %
Uncomfortable: 27.5 %
Concerned: 21.5 %
Afraid: 3.3 %In Danger: 0.4 %
Missing: 5.3 %
*A breakdown of students' safety levels by ward can be found in Appendix Figure A1. Students were asked to provide an example to describe why they felt the way they did. Students reported a variety of examples describing why they did not feel safe, which were coded into consistent themes for analysis highlighted in Table 3.
8

How Students Rate Their Safety and Why
Code Name Count Percentage
Avoidance 2 0.8%
COVID 4 1.6%
Darkness 5 2.0%
Drugs 8 3.1%
Environment 17 6.4%
Hypervigilance 22 8.2%
Neighborhood / Home 8 3.0%
Non-protective People 34 12.7%
Protective Factors 8 3.0%
Routes - traditional 33 12.4%
Routes - nontraditional 1 0.4%
Street Harassment 16 6.0%
Surveillance 16 6.0%
Time – after school 6 2.2%
Time – before school 5 1.9%
Uncertainty 27 10.1%
Violence 27 10.1%
Weapons 15 5.6%
Q11: Can you give an example describing why you chose the level of safety from the previous question? (Where Q10 = Uncomfortable, Concerned, Afraid, or In Danger)
TABLE 3
9

The most common themes in the second open-ended question shown in Table 3 were: people who posed a threat to the student’s safety (13 percent), transportation routes where the student experienced problems (12 percent), the student’s uncertainty about what might happen during travel (10 percent), or examples of fights or other forms of violence (10 percent). Looking across both of the open-ended questions from the survey data, the following key themes and illustrative quotes emerged from the analysis:
Key Themes from Survey
PEOPLE WHO THREATEN STUDENT SAFETYStudents often mentioned people who they perceived as a threat to their safety. We categorized these responses as Non-Protective People. This theme was often coded with other themes, such as Street Harassment, Drugs, Weapons, and Violence. There were only a few instances where students mentioned their peers as a source of feeling unsafe. In most cases, these non-protective people were adults.
"People in the middle of the street or a group of people in the side of sidewalk."
“I've been touched inappropriately/ grabbed by people on multiple occasions, especially when I go home later in the evening.” -Student Residing in Ward 7
-Student Residing in Ward 3
“Because it's not that I feel unsafe, just very uncomfortable. People make me uncomfortable when I don't know them, and I don't plan to know them. Also, grown men try to flirt with me and that makes me incredibly uncomfortable. “
-Student Residing in Ward 7
“I feel uncomfortable because people would come talk to me or stare at me making weird faces and I would move, and they would sometimes follow me.”
-Student Residing in Ward 8
10

Key Themes from Survey
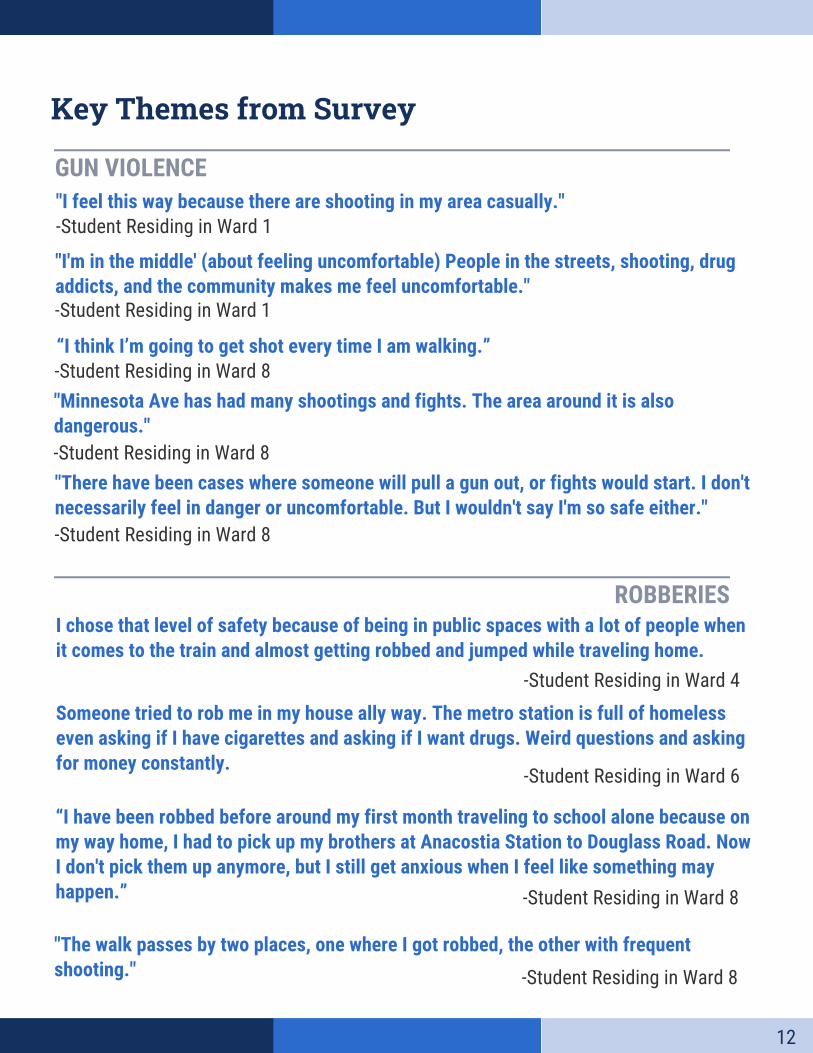
FIGHTS, GUN VIOLENCE, & ROBBERIESThe theme of violence was used to capture different types of violence, including fights, gun violence, and actual or attempted robberies. Some students did mention that they were witness to violence in terms of fights or victims of violence, including robberies. The frequency of gun violence in students’ communities was noted by many as the source of feeling unsafe traveling to and from school. However, many of the mentions of violence referenced fights that would occur on their routes to and from school.
"I chose that level of safety because of being in public spaces with a lot of people when it comes to the train and almost getting robbed and jumped while traveling home."
-Student Residing in Ward 4
“Because anyone can come up to the school, my friends have been jumped walking out of school, by other kids.” -Student Residing in Ward 5
"Whenever I am by myself and there is a crowd around me or whenever people start fighting on the bus." -Student Residing in Ward 5
FIGHTS
"I walk past a rival school that will fight you and I have been on the train were people tried to fight me." -Student Residing in Ward 5
"When I'm going home I feel comfortable but its uncomfortable when people fighting."-Student Residing in Ward 7
"There will be fights which is dangerous."-Student Residing in Ward 7
11
ROBBERIES
Key Themes from Survey
“I think I’m going to get shot every time I am walking.”-Student Residing in Ward 8
"I feel this way because there are shooting in my area casually."-Student Residing in Ward 1
"I'm in the middle' (about feeling uncomfortable) People in the streets, shooting, drug addicts, and the community makes me feel uncomfortable."-Student Residing in Ward 1
GUN VIOLENCE
“I have been robbed before around my first month traveling to school alone because on my way home, I had to pick up my brothers at Anacostia Station to Douglass Road. Now I don't pick them up anymore, but I still get anxious when I feel like something may happen.” -Student Residing in Ward 8
"Minnesota Ave has had many shootings and fights. The area around it is also dangerous."-Student Residing in Ward 8"There have been cases where someone will pull a gun out, or fights would start. I don't necessarily feel in danger or uncomfortable. But I wouldn't say I'm so safe either."-Student Residing in Ward 8
"The walk passes by two places, one where I got robbed, the other with frequent shooting." -Student Residing in Ward 8
Someone tried to rob me in my house ally way. The metro station is full of homeless even asking if I have cigarettes and asking if I want drugs. Weird questions and asking for money constantly. -Student Residing in Ward 6
I chose that level of safety because of being in public spaces with a lot of people when it comes to the train and almost getting robbed and jumped while traveling home.
-Student Residing in Ward 4
12

Key Themes from Survey
HYPERVIGILANCE, SURVEILLANCE, & UNCERTAINTY
The theme hypervigilance was coded inductively, and was used to code responses related to increased or constant awareness of surroundings during travel to and from school. During focus group discussions, students most often said that they felt safe, but always had to be aware of their surroundings. Surveillance and uncertainty then arose in these discussions and as a theme throughout the coding process. Surveillance was used to code mentions of being watched or fear of being watched during travel to and from school. Uncertainty was used to code mentions of unpredictability or a lack of knowing what will happen while traveling to and from school. There were numerous instances where students mentioned the need to be vigilant as they traveled to and from school. The theme of Hypervigilance was coded in tandem with instances of uncertainty and feeling surveilled. The uncertainty of students’ passage to school as well the feeling and reality of being watched could be feeding into their need to be hypervigilant. In some responses, being hypervigilant was expressed as a protective factor in how the student navigated the passage to and from school safely.
"I feel safe but at the same time I have to watch my surrounds because some places aren't safe but I'm not concerned, afraid, or in danger just that I have to pay attention."
-Student Residing in Ward 6
"I feel sometimes targeted. I always look back."-Student Residing in Ward 8
"Sometimes I just feel the need to put my head back as I walk and watch my surroundings." -Student Residing in Ward 8
HYPERVIGILANCE
13

Key Themes from Survey
"Crossing the street feeling like I'm being watched."-Student Residing in Ward 6
"I feel like people are watching me. "-Student Residing in Ward 1
"I described my safety as uncomfortable because I sometimes feel like someone is watching me."-Student Residing in Ward 4
SURVEILANCE
"Im always concerned because anything can happen at any moment."
-Student Residing in Ward 8
UNCERTAINTY
"Because when groups of people stare at me on the train."-Student Residing in Ward 6
"I chose this cause sometime I'm safe but sometime that are older creeps while I am walking up the hill looking at me."-Student Residing in Ward 7
"I'm always concerned because every day is a new day and you are prescribed with certain situations you have to face." -Student Residing in Ward 8
“Because you won't never know what's going on because people different every day.”
-Student Residing in Ward 8
"Anything can happen. Since I walk, I feel more vulnerable."-Student Residing in Ward 8
14
"When I'm traveling to school and back home I feel uncomfortable [because] people will stare at me while I'm walking."-Student Residing in Ward 8
"I say concerned because you never know when anything going to happen."-Student Residing in Ward 7

How Students Travel to School
Students within Washington, DC have many modes of transportation available to them. Many of the respondents used multiple modes of transportation while traveling to school. Almost two-thirds of students reported taking the bus to school every day, followed by more than half of students reported taking the train. Several of the students who get dropped off by car indicated using a ride sharing mobile application. The fewest number of students reported walking to school.
15
Q4: How do you travel to and from school? Select all options that apply.FIGURE 2
The Walk: 43.3 %
The Bus: 23.3 %
The Train: 24.2 %
Other: 9.2 %
FIGURE 3Q9: If you ever feel uncomfortable or in danger, which part of your route is unsafe? Select all that apply.
Even though 36 percent of students reported feeling uncomfortable or in danger for question 7 , a majority of student respondents acknowledged feeling unsafe somewhere along their route for question 9. Even though the least amount of students surveyed reported walking to school, Figure 3 also highlights that students felt uncomfortable or in danger while walking the most.
147
287
252
202
Walk or Bike
Bus
Metro Train
Drive / Dropped off by Car

Safe Uncomfortable Concerned Afraid In Danger Missing
TABLE 4
Student Level of Safety on the Bus
FIGURE 4
Nearly 75 percent of the students surveyed who take the bus use at least one of the five bus routes shown on Table 4.
4.9%
Route Count Percentage
P6 56 19.5%
W4 45 15.7%
B2 43 15.0%
V2 37 12.9%
A2 34 11.8%
TOP 5 METRO BUS ROUTES
0.3%3.1%
21.2%
29.6%
40.8%
16
About 63 percent of survey respondents ride the bus traveling to school. Even though more than a third of students indicated that they felt safe traveling on the bus, about 54 percent of them reported feeling unsafe. Being unsafe is defined as a student feeling either uncomfortable, concerned, afraid or in danger.
Figure 4 shows the levels of safety indicated by students who ride the bus while traveling to school. This information was pulled from the responses for question 10 based on the students who used the bus.

Safe Uncomfortable Concerned Afraid In Danger Missing
Student Level of Safety on the Train
About 56 percent of survey respondents use Metro trains. Many of those students use more than one station. Even though more than a third of students indicated that they felt safe traveling on the train, about 58 percent of them reported feeling unsafe.
17
FIGURE 5
The most commonly mentioned stations for students in the survey are Anacostia (11 percent), NoMa (13 percent), Congress Heights (4 percent), Southern Avenue (3 percent), and Rhode Island Ave (4 percent) metro stations.
Five Most Frequented Metro Stations
3.6%
22.6%
31.3%
38.9%
Figure 5 shows the levels of safety indicated by students who ride the train when traveling to school. This information was pulled from the responses for question 10 based on the students who used the train.
3.6%

Safe Uncomfortable Concerned Afraid In Danger Missing
Student Level of Safety while Walking
Even though students reported exclusively walking, or riding a bike, to school the least, walking had the lowest safety rating among those students. Nearly 60% of students reported feeling unsafe while walking at any point along their path to school.
18
FIGURE 6
Though students who walked reported the lowest percentage rating of safety across all modes of transportation, more students reported feeling unsafe while taking the bus or train: 88 students reported feeling unsafe while walking, compared to 136 students who took the train, and 156 students who took the bus.
Figure 6 shows the levels of safety indicated by students who walk at any point while traveling to school. This information was pulled from the responses for question 10 based on the students who walked.
5.4%
20.4%
33.3%35.4%
4.8%
0.7%

Summary
The safe passage of our students traveling to and from school is paramount, but we know various instances of harassment and violence jeopardizes the mental, emotional, and physical safety of our children. The following recommendations should be considered when addressing Safe Passage:
19
Recommendations
This report summarizes data from a survey administered by OSA to better understand how safe students feel traveling to and from school. The students’ responses highlight common themes as well as some unique experiences. Although only a fraction of DC’s school population completed the survey, the responses that were collected elevate concerns regarding safe passage.
1. Redefining Safety: Even though most students reported that they felt safe
traveling to and from school, a significant portion of those same students said that they felt either uncomfortable or concerned while traveling to school. A majority of students in the focus groups mentioned they must always be aware of their surroundings. There needs to be an intentional standardization of what safety means at all DC public and charter schools.
2. Address Street Harassment: While conversations regarding safe passage revolve around acts of violence in our communities, an alarming amount of students experience traumatic instances of street harassment. From adults making inappropriate comments towards students, to instances of sexual harassment and assault, too many students worry about these interactions on a daily basis. Community centered solutions to address street harassment should be coordinated within the District.
3. Make mental health resources more accessible for students: In the limited sample of students surveyed, a significant amount have been the victim of harassment, assault, or robbery. Unless the trauma of these events are addressed, closing the achievement gap will be even more difficult. There needs to be a coordinated effort to provide mental health supports to all DC students.

Appendix
20

Appendix
21

Contact Us:
22
For additional information, or for any questions related to the Safe Passage of our students traveling to and from school, please contact us using any form of communication listed below:
Phone: (202)741-4692Email: [email protected]: https://studentadvocate.dc.gov
Follow Us:
@DCAdvocate
@dc.advocate
@dc_advocate

441 4TH ST, NW, Suite 723N | Washington, DC 20001 | 202.741.4692 | [email protected] | studentadvocate.dc.gov