SAFE HARBORblueir.investproductions.com/~/media/Files/J/Jetblue-IR...2 SAFE HARBOR This presentation...
57
1
Transcript of SAFE HARBORblueir.investproductions.com/~/media/Files/J/Jetblue-IR...2 SAFE HARBOR This presentation...

1

2
SAFE HARBOR
This presentation contains forward-looking statements within the meaning of the Private Securities Litigation Reform Act of 1995, Section 27A of the Securities
Act of 1933, as amended, or the Securities Act, and Section 21E of the Securities Exchange Act of 1934, as amended, or the Exchange Act, which represent
our management's beliefs and assumptions concerning future events. When used in this presentation document and in documents incorporated herein by
reference, the words “expects,” “plans,” “anticipates,” “indicates,” “believes,” “forecast,” “guidance,” “outlook,” “may,” “will,” “should,” “seeks,” “targets” and
similar expressions are intended to identify forward-looking statements. Forward-looking statements involve risks, uncertainties and assumptions, and are
based on information currently available to us. Actual results may differ materially from those expressed in the forward-looking statements due to many
factors, including, without limitation, our extremely competitive industry; volatility in financial and credit markets which could affect our ability to obtain debt
and/or lease financing or to raise funds through debt or equity issuances; our significant fixed obligations and substantial indebtedness; volatility in fuel prices,
maintenance costs and interest rates; our reliance on a high daily aircraft utilization; our ability to implement our growth strategy; our limited number of
suppliers; our ability to attract and retain qualified personnel and maintain our culture as we grow; our reliance on a limited number of suppliers; our
dependence on the New York and Boston metropolitan markets and the effect of increased congestion in these markets; our reliance on automated systems
and technology; our being subject to potential unionization, work stoppages, slowdowns or increased labor costs; our presence in some international emerging
markets that may experience political or economic instability or may subject us to legal risk; reputational and business risk from information security breaches
or cyber-attacks; changes in or additional domestic or foreign government regulation; changes in our industry due to other airlines' financial condition; acts of
war or terrorism; global economic conditions or an economic downturn leading to a continuing or accelerated decrease in demand for air travel; the spread of
infectious diseases; adverse weather conditions or natural disasters; and external geopolitical events and conditions. It is routine for our internal projections
and expectations to change as the year or each quarter in the year progresses, and therefore it should be clearly understood that the internal projections,
beliefs and assumptions upon which we base our expectations may change prior to the end of each quarter or year. Further information concerning these and
other factors is contained in the Company's Securities and Exchange Commission filings, including but not limited to, the Company's 2017 Annual Report on
Form 10-K and its Quarterly Reports on Form 10-Q. In light of these risks and uncertainties, the forward-looking events discussed in this presentation might
not occur. We undertake no obligation to update any forward-looking statements to reflect events or circumstances that may arise after the date of this
presentation.
The following presentation also includes certain “non-GAAP financial measures” as defined in Regulation G under the Securities Exchange Act of 1934. We
refer you to the reconciliations made available in our Quarterly Reports on Form 10-Q and Annual Reports on Form 10-K (available on our website at
jetblue.com and at sec.gov) and in our second quarter earnings call (furnished on July 24th, 2018), which reconcile the non-GAAP financial measures included
in the following presentation to the most directly comparable financial measures calculated and presented in accordance with U.S. GAAP.
3

3
Robin Hayes, Chief Executive Officer
• Introduction
Marty St. George, EVP Commercial and Planning
Andres Barry, President, JetBlue Travel Products
• Our Competitive Advantage
• Building Blocks: Network & Product Offering
9:20 am – 9:40 am Question & Answer Session
9:40 am – 9:50 am Break
Bonny Simi, President, JetBlue Technology Ventures
Joanna Geraghty, President and Chief Operating Officer
Steve Priest, EVP Chief Financial Officer
• Introducing JetBlue Technology Ventures
• Building Blocks: Fleet, Cost & Capital Allocation
• Path to EPS Growth through 2020 and Beyond
10:40 am – 11:00 am Question & Answer Session
AGENDA: 2018 INVESTOR DAY
8:30 am – 9:20 am
9:50 am – 10:40 am

ROBIN HAYESCEO
5
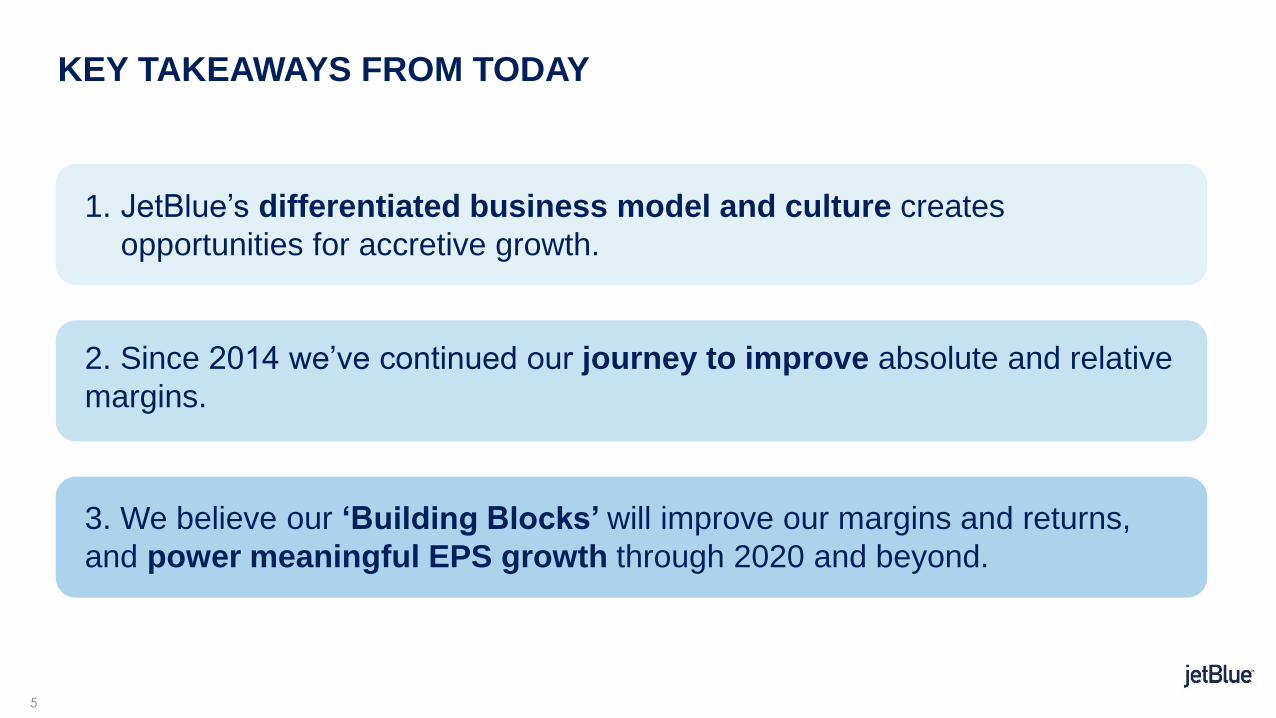
KEY TAKEAWAYS FROM TODAY
1. JetBlue’s differentiated business model and culture creates
opportunities for accretive growth.
2. Since 2014 we’ve continued our journey to improve absolute and relative
margins.
3. We believe our ‘Building Blocks’ will improve our margins and returns,
and power meaningful EPS growth through 2020 and beyond.
6
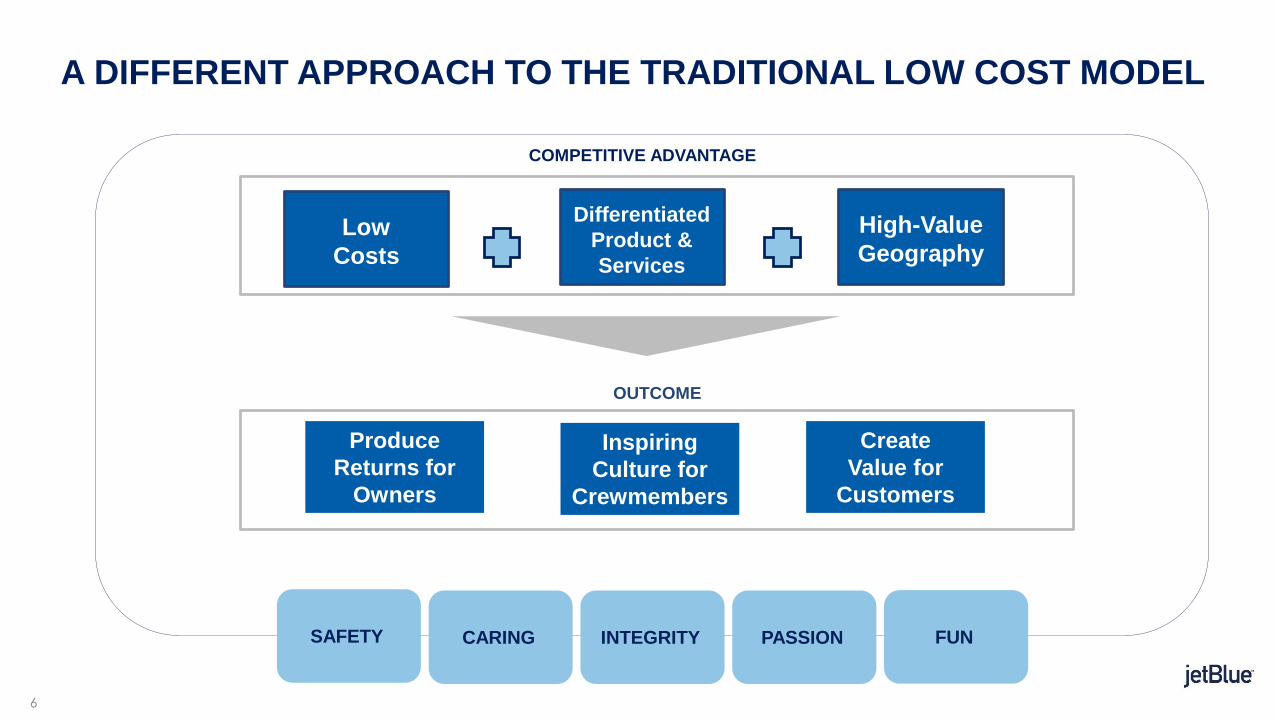
A DIFFERENT APPROACH TO THE TRADITIONAL LOW COST MODEL
Produce
Returns for
Owners
Inspiring
Culture for
Crewmembers
Create
Value for
Customers
High-Value
Geography
COMPETITIVE ADVANTAGE
OUTCOME
SAFETY CARING INTEGRITY PASSION FUN
Low
Costs
Differentiated
Product &
Services
7
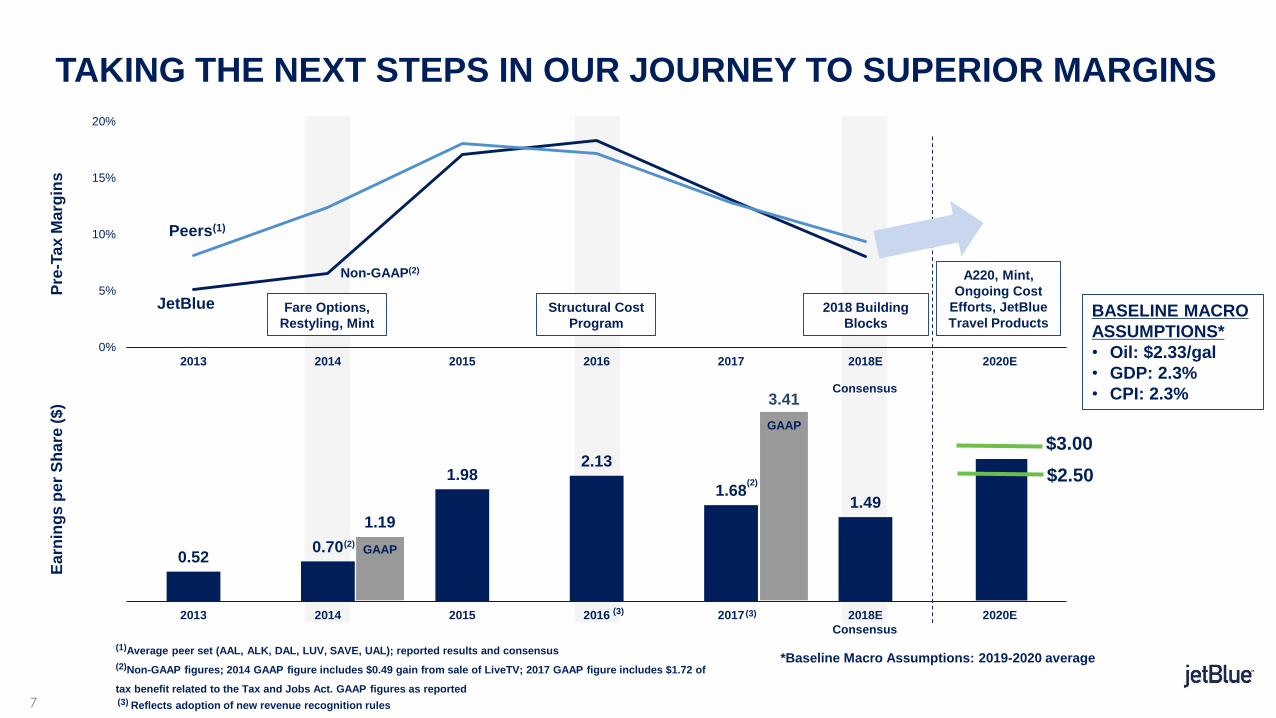
TAKING THE NEXT STEPS IN OUR JOURNEY TO SUPERIOR MARGINS
Consensus
Consensus
Fare Options,
Restyling, Mint
Structural Cost
Program
2018 Building
Blocks
Pre
-Ta
x M
arg
ins
Ea
rnin
gs
pe
r S
ha
re (
$)
JetBlue
(1)Average peer set (AAL, ALK, DAL, LUV, SAVE, UAL); reported results and consensus
(2)Non-GAAP figures; 2014 GAAP figure includes $0.49 gain from sale of LiveTV; 2017 GAAP figure includes $1.72 of
tax benefit related to the Tax and Jobs Act. GAAP figures as reported
Peers(1)
A220, Mint,
Ongoing Cost
Efforts, JetBlue
Travel Products
3.41
GAAP
1.19
GAAP
BASELINE MACRO
ASSUMPTIONS*
• Oil: $2.33/gal
• GDP: 2.3%
• CPI: 2.3%
*Baseline Macro Assumptions: 2019-2020 average
$2.50
$3.00
Non-GAAP(2)
(2)
(2)
Non-
GAAP
Non-
GAAP
0%
5%
10%
15%
20%
2013 2014 2015 2016 2017 2018E 2020E
(3) (3)
(3) Reflects adoption of new revenue recognition rules
0.520.70
1.982.13
1.681.49
2013 2014 2015 2016 2017 2018E 2020E

8
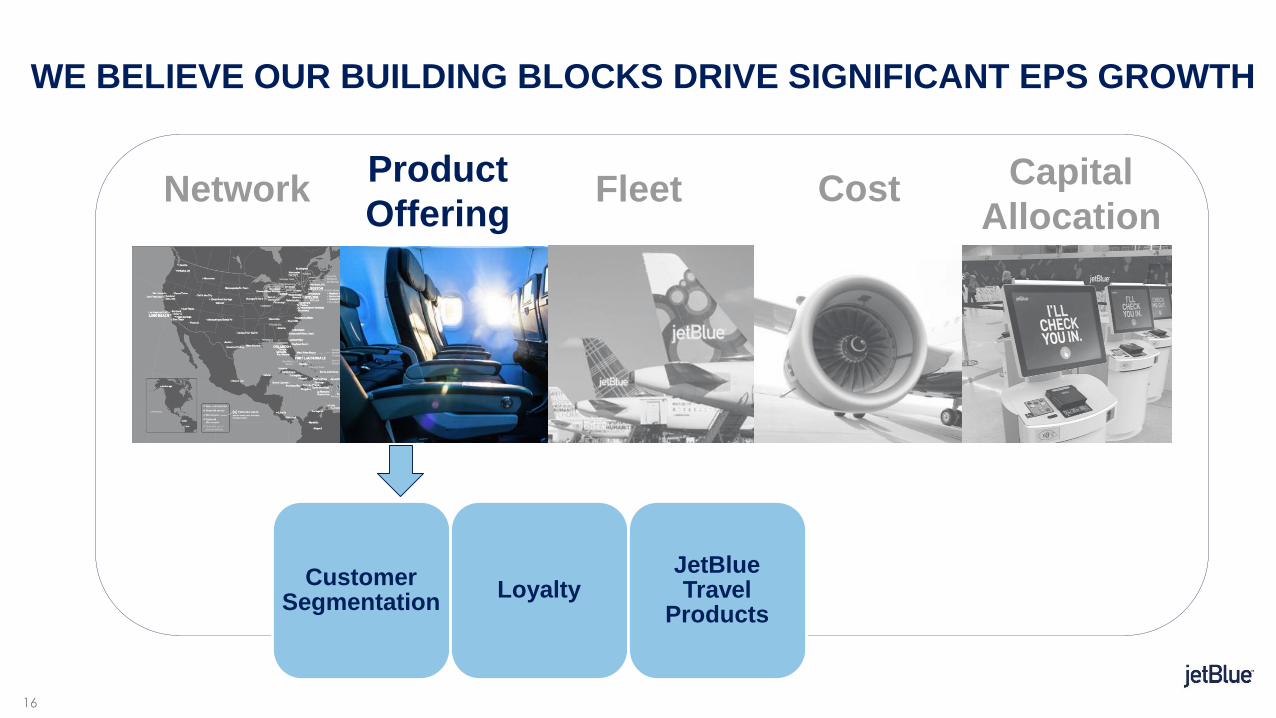
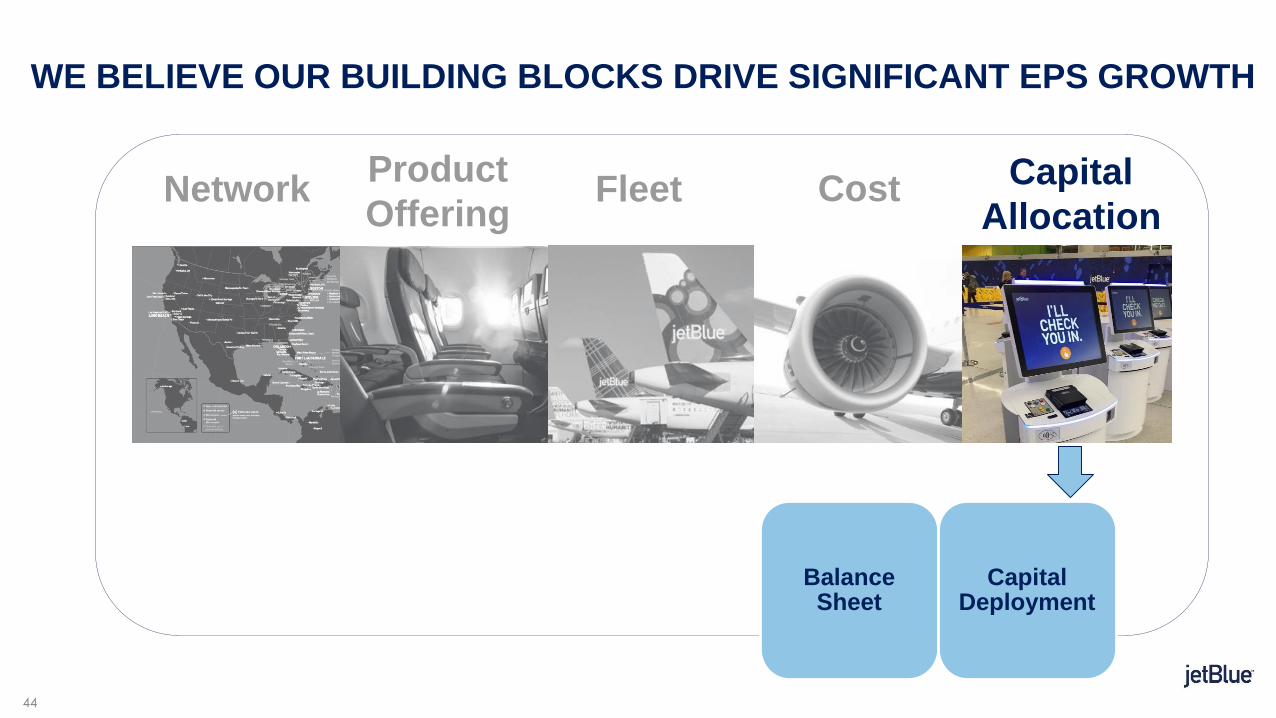
WE BELIEVE OUR BUILDING BLOCKS DRIVE SIGNIFICANT EPS GROWTH
NetworkProduct
OfferingFleet Cost Capital
Allocation
MARTY ST. GEORGEEVP COMMERCIAL AND PLANNING
ANDRES BARRYPRESIDENT, JETBLUE TRAVEL PRODUCTS
10
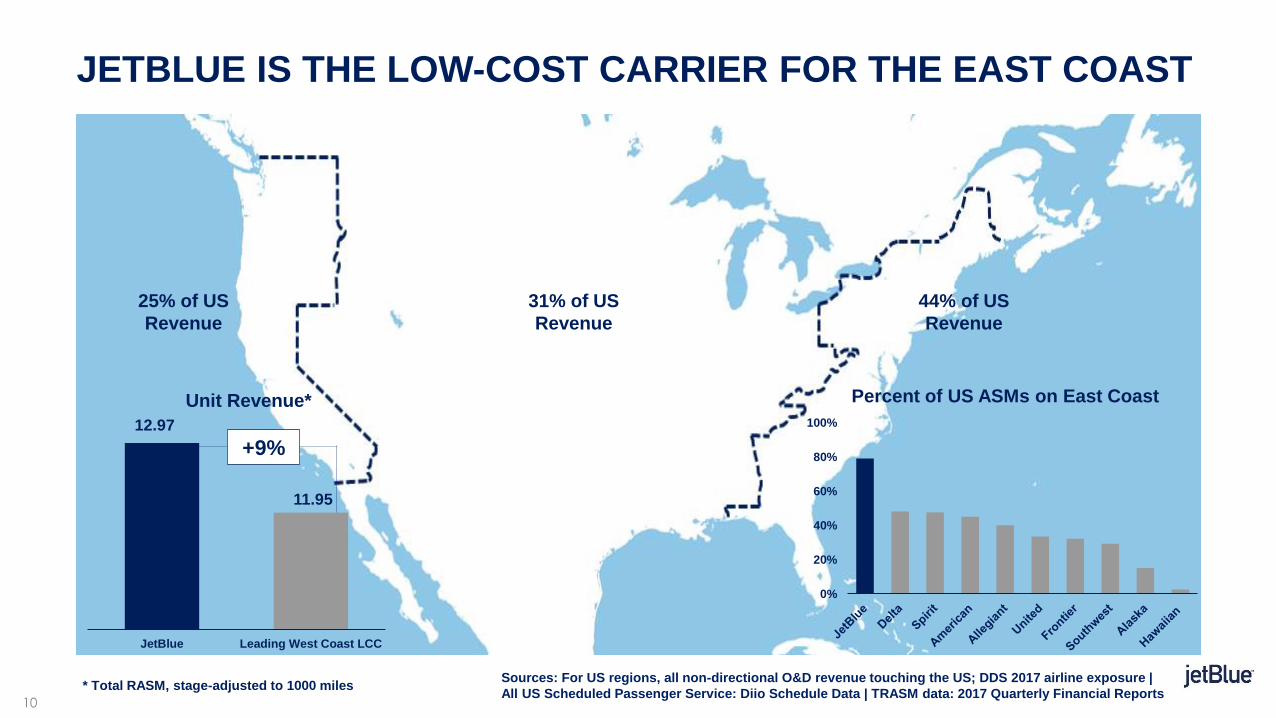
JETBLUE IS THE LOW-COST CARRIER FOR THE EAST COAST
31% of US
Revenue
25% of US
Revenue
44% of US
Revenue
0%
20%
40%
60%
80%
100%
Percent of US ASMs on East Coast
* Total RASM, stage-adjusted to 1000 miles
11.95
JetBlue Leading West Coast LCC
Unit Revenue*
+9%12.97
Sources: For US regions, all non-directional O&D revenue touching the US; DDS 2017 airline exposure |
All US Scheduled Passenger Service: Diio Schedule Data | TRASM data: 2017 Quarterly Financial Reports
11
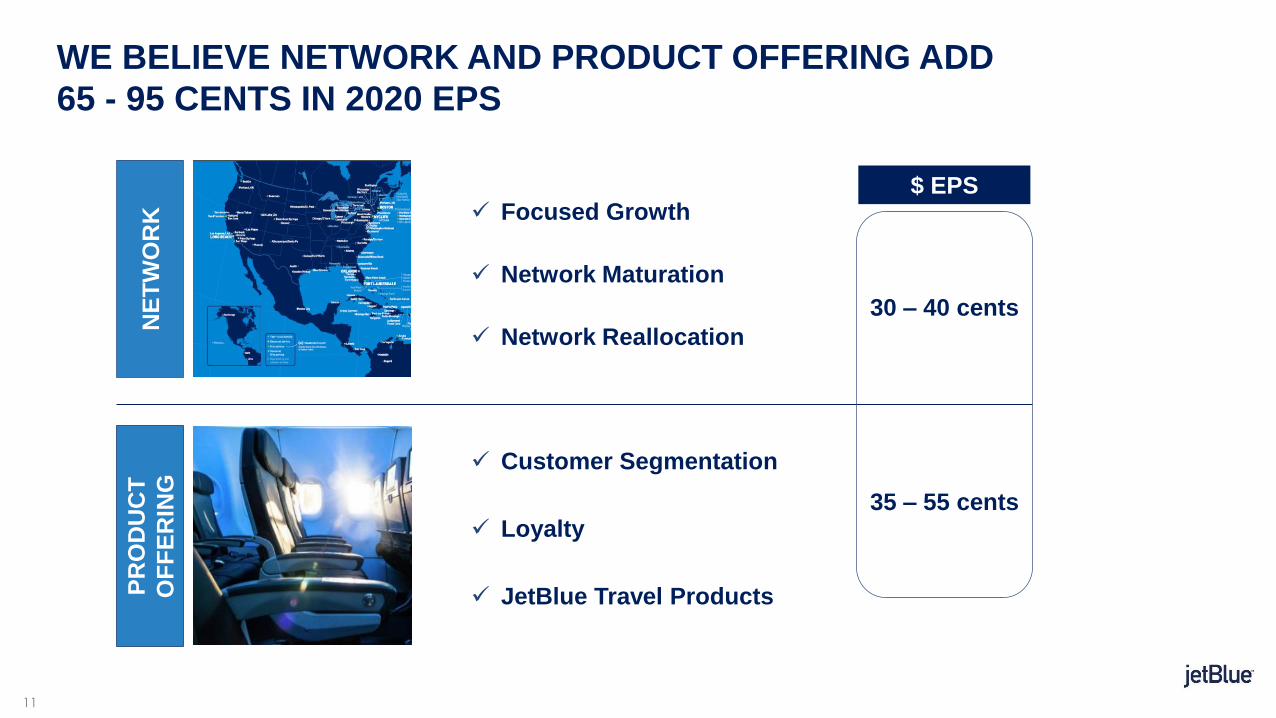
Focused Growth
Network Maturation
Network Reallocation
WE BELIEVE NETWORK AND PRODUCT OFFERING ADD
65 - 95 CENTS IN 2020 EPS
NE
TW
OR
KP
RO
DU
CT
OF
FE
RIN
G
Customer Segmentation
Loyalty
JetBlue Travel Products
$ EPS
35 – 55 cents
30 – 40 cents

12
Focused Growth
Network Maturation
Network Reallocation
NetworkProduct
OfferingFleet Cost Capital
Allocation
WE BELIEVE OUR BUILDING BLOCKS DRIVE SIGNIFICANT EPS GROWTH
13
(20%)
(10%)
0%
10%
20%
30%
40%
50%
0% 10% 20% 30% 40% 50% 60% 70% 80%Carr
ier
SL
A P
RA
SM
Pre
miu
m v
s O
thers
Seat Share
OA B6
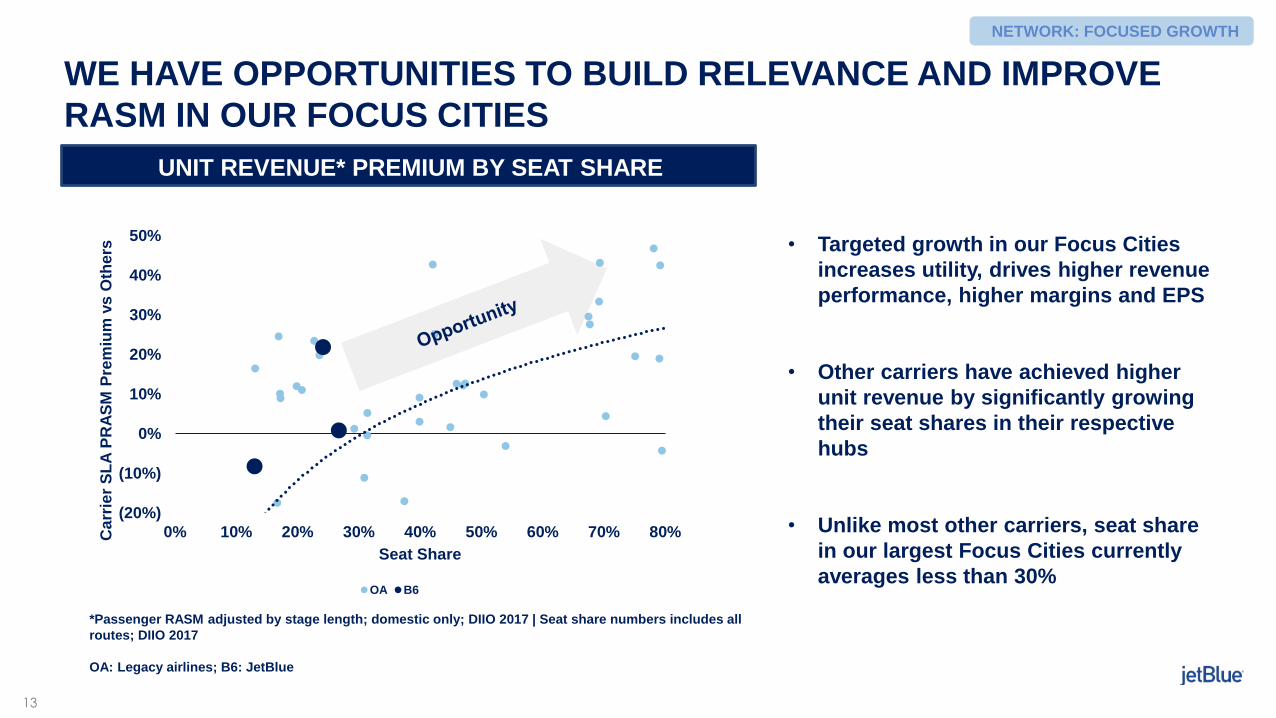
WE HAVE OPPORTUNITIES TO BUILD RELEVANCE AND IMPROVE
RASM IN OUR FOCUS CITIES
UNIT REVENUE* PREMIUM BY SEAT SHARE
NETWORK: FOCUSED GROWTH
*Passenger RASM adjusted by stage length; domestic only; DIIO 2017 | Seat share numbers includes all
routes; DIIO 2017
OA: Legacy airlines; B6: JetBlue
• Targeted growth in our Focus Cities
increases utility, drives higher revenue
performance, higher margins and EPS
• Other carriers have achieved higher
unit revenue by significantly growing
their seat shares in their respective
hubs
• Unlike most other carriers, seat share
in our largest Focus Cities currently
averages less than 30%
14
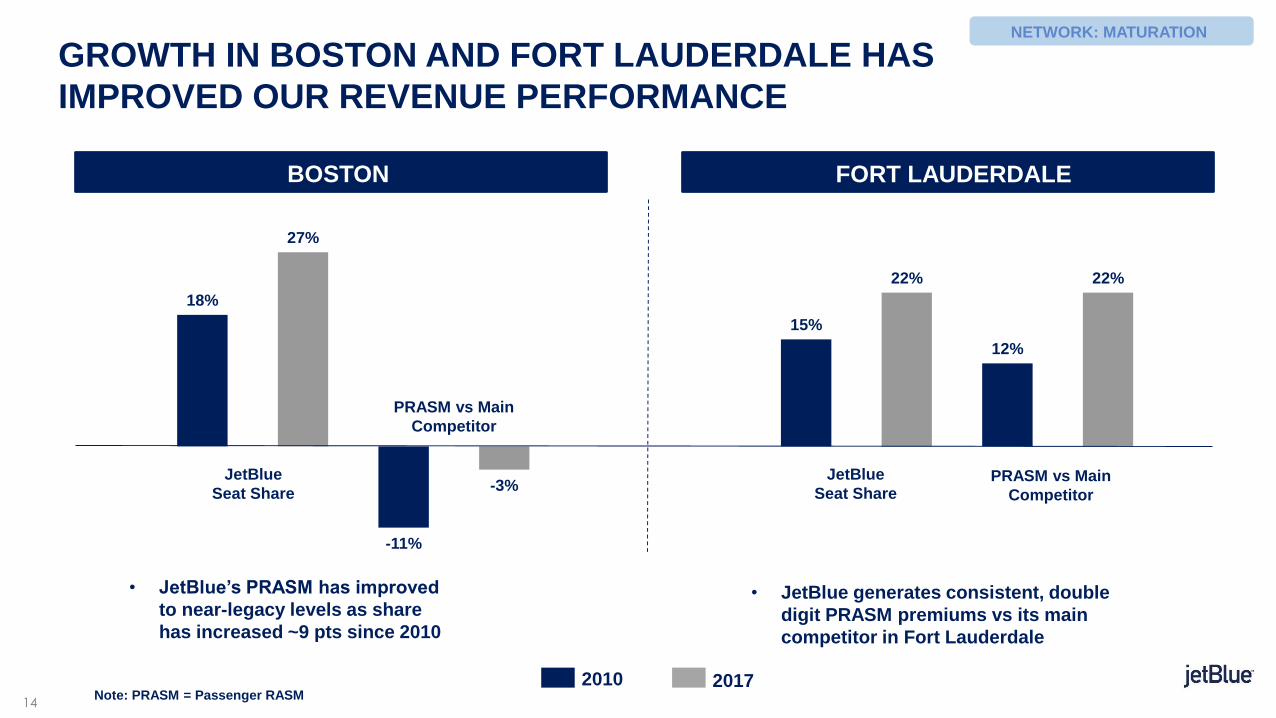
18%
27%
-11%
-3%
15%
22%
12%
22%
GROWTH IN BOSTON AND FORT LAUDERDALE HAS
IMPROVED OUR REVENUE PERFORMANCE
• JetBlue generates consistent, double
digit PRASM premiums vs its main
competitor in Fort Lauderdale
NETWORK: MATURATION
FORT LAUDERDALEBOSTON
• JetBlue’s PRASM has improved
to near-legacy levels as share
has increased ~9 pts since 2010
2010 2017
PRASM vs Main
Competitor
JetBlue
Seat SharePRASM vs Main
Competitor
JetBlue
Seat Share
Note: PRASM = Passenger RASM
15
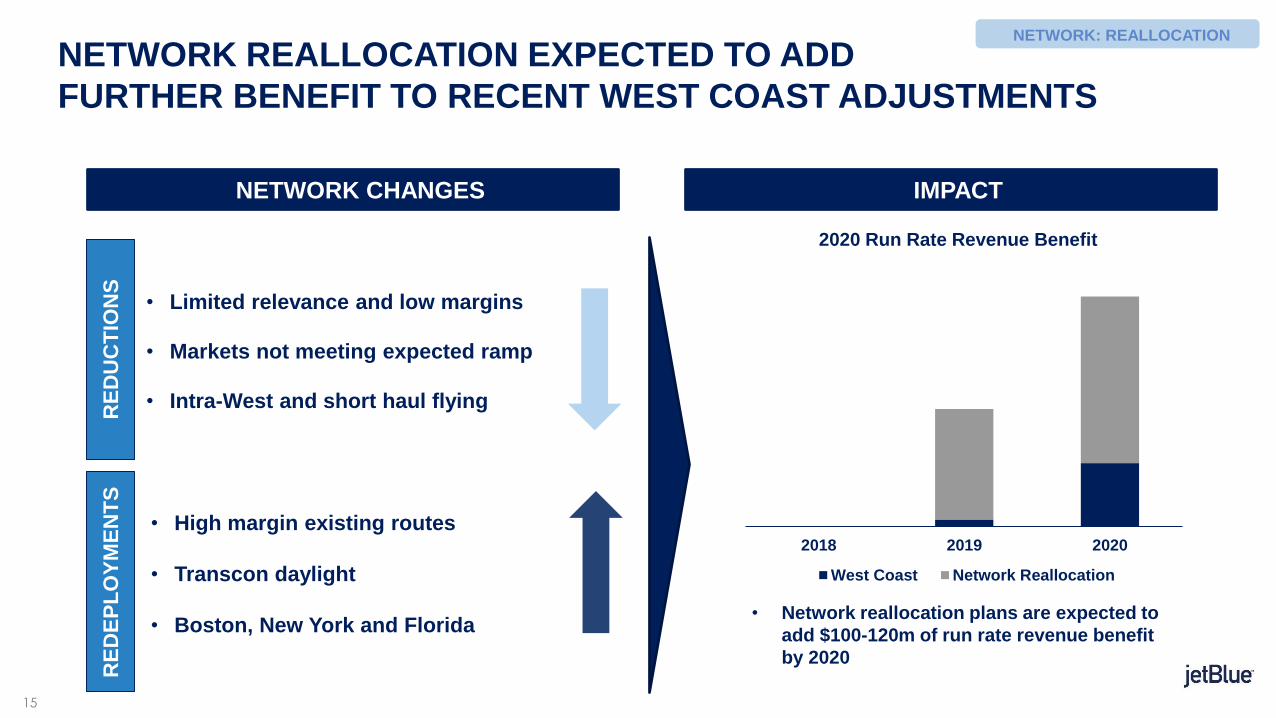
NETWORK REALLOCATION EXPECTED TO ADD
FURTHER BENEFIT TO RECENT WEST COAST ADJUSTMENTS
NETWORK: REALLOCATION
NETWORK CHANGES IMPACT
• Limited relevance and low margins
• Markets not meeting expected ramp
• Intra-West and short haul flying
• High margin existing routes
• Transcon daylight
• Boston, New York and Florida
RE
DU
CT
ION
SR
ED
EP
LO
YM
EN
TS
• Network reallocation plans are expected to
add $100-120m of run rate revenue benefit
by 2020
2020 Run Rate Revenue Benefit
2018 2019 2020
West Coast Network Reallocation
16
Customer Segmentation
LoyaltyJetBlue Travel
Products
NetworkProduct
OfferingFleet Cost Capital
Allocation
WE BELIEVE OUR BUILDING BLOCKS DRIVE SIGNIFICANT EPS GROWTH

17
OUR VALUE PROPOSITION TRANSLATES INTO
SOLID REVENUE PERFORMANCE
VALUE PROPOSITION
Differentiated Product & Services
UNIT REVENUE*
• Our value proposition, aligned to a high value
geography, generates higher RASM
PRODUCT OFFERING
*Total RASM, stage-adjusted to 1000 miles; for full network for all
carriers, 2017
Source: DIIO and company reports
12.97
14.37
11.94
8.99
JetBlue Legacies LCCs ULCC
18
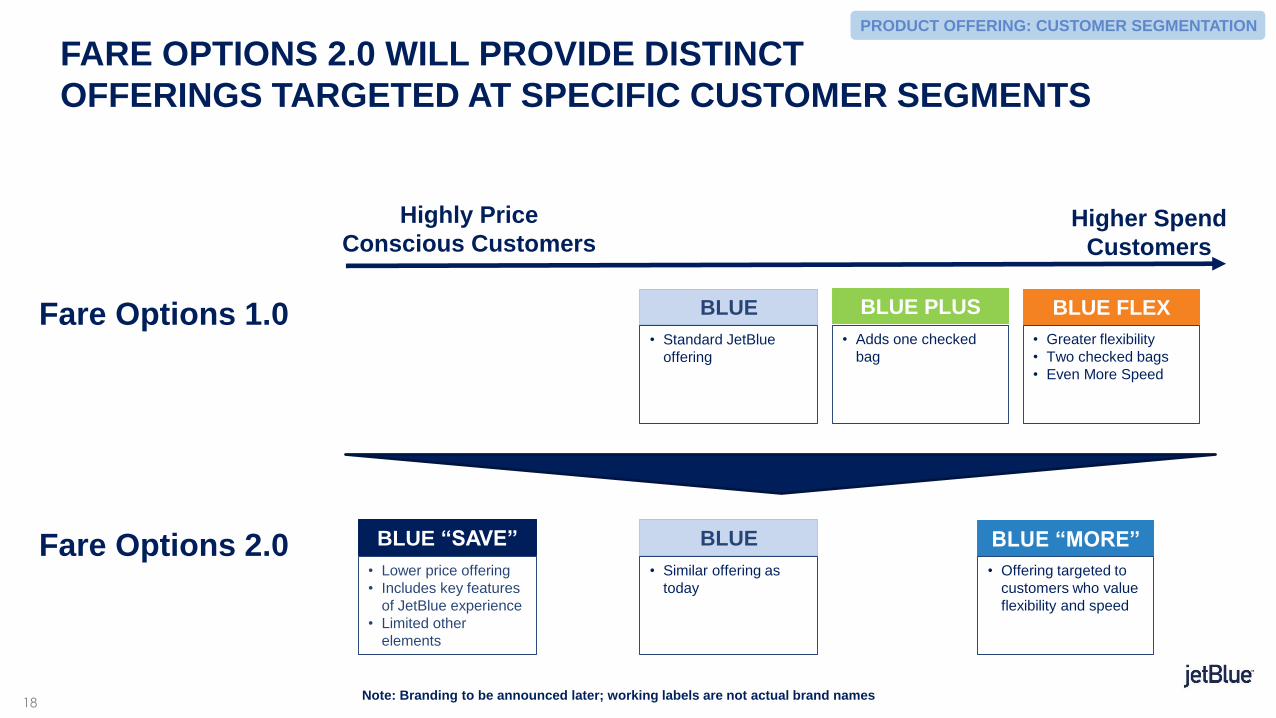
FARE OPTIONS 2.0 WILL PROVIDE DISTINCT
OFFERINGS TARGETED AT SPECIFIC CUSTOMER SEGMENTS
Higher Spend
Customers
Fare Options 1.0
Fare Options 2.0 BLUE “SAVE”
• Lower price offering
• Includes key features
of JetBlue experience
• Limited other
elements
BLUE
• Standard JetBlue
offering
BLUE PLUS
• Adds one checked
bag
BLUE
• Similar offering as
today
PRODUCT OFFERING: CUSTOMER SEGMENTATION
Highly Price
Conscious Customers
BLUE “MORE”
• Offering targeted to
customers who value
flexibility and speed
BLUE FLEX
• Greater flexibility
• Two checked bags
• Even More Speed
Note: Branding to be announced later; working labels are not actual brand names
19
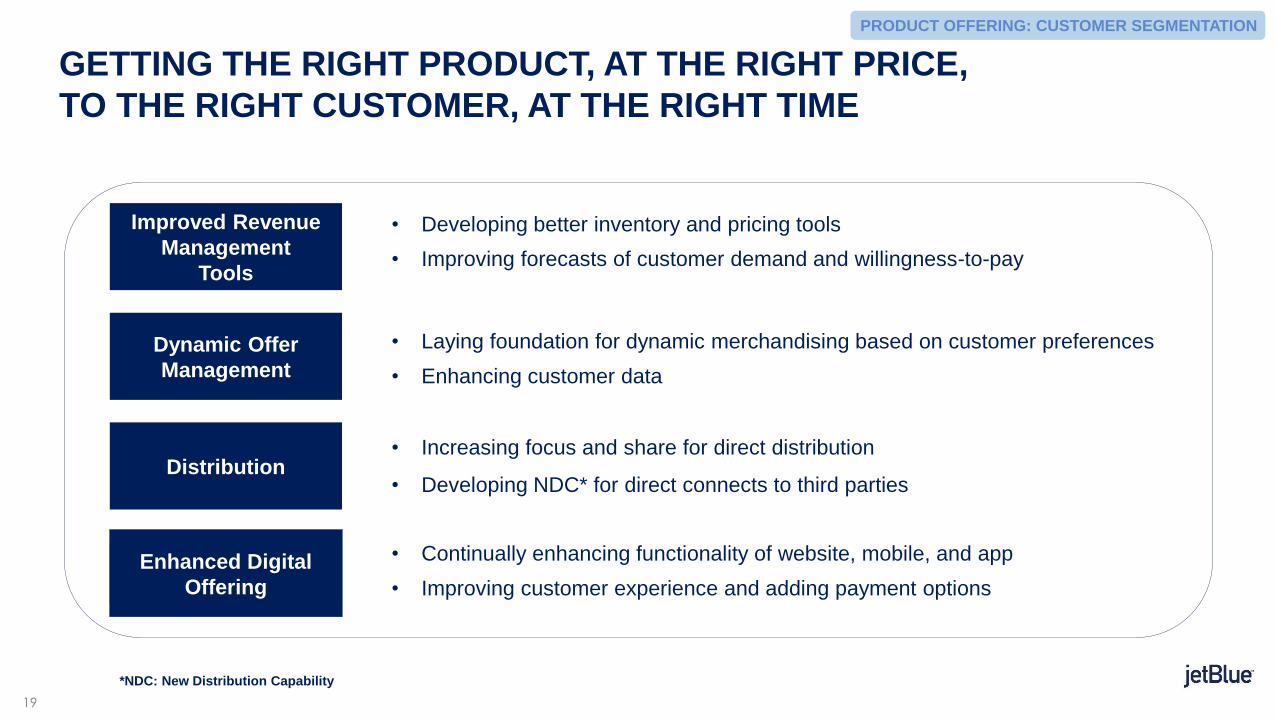
GETTING THE RIGHT PRODUCT, AT THE RIGHT PRICE,
TO THE RIGHT CUSTOMER, AT THE RIGHT TIME
PRODUCT OFFERING: CUSTOMER SEGMENTATION
Improved Revenue
Management
Tools
Dynamic Offer
Management
Distribution
• Developing better inventory and pricing tools
• Improving forecasts of customer demand and willingness-to-pay
• Laying foundation for dynamic merchandising based on customer preferences
• Enhancing customer data
• Increasing focus and share for direct distribution
• Developing NDC* for direct connects to third parties
• Continually enhancing functionality of website, mobile, and app
• Improving customer experience and adding payment options
*NDC: New Distribution Capability
Enhanced Digital
Offering
20
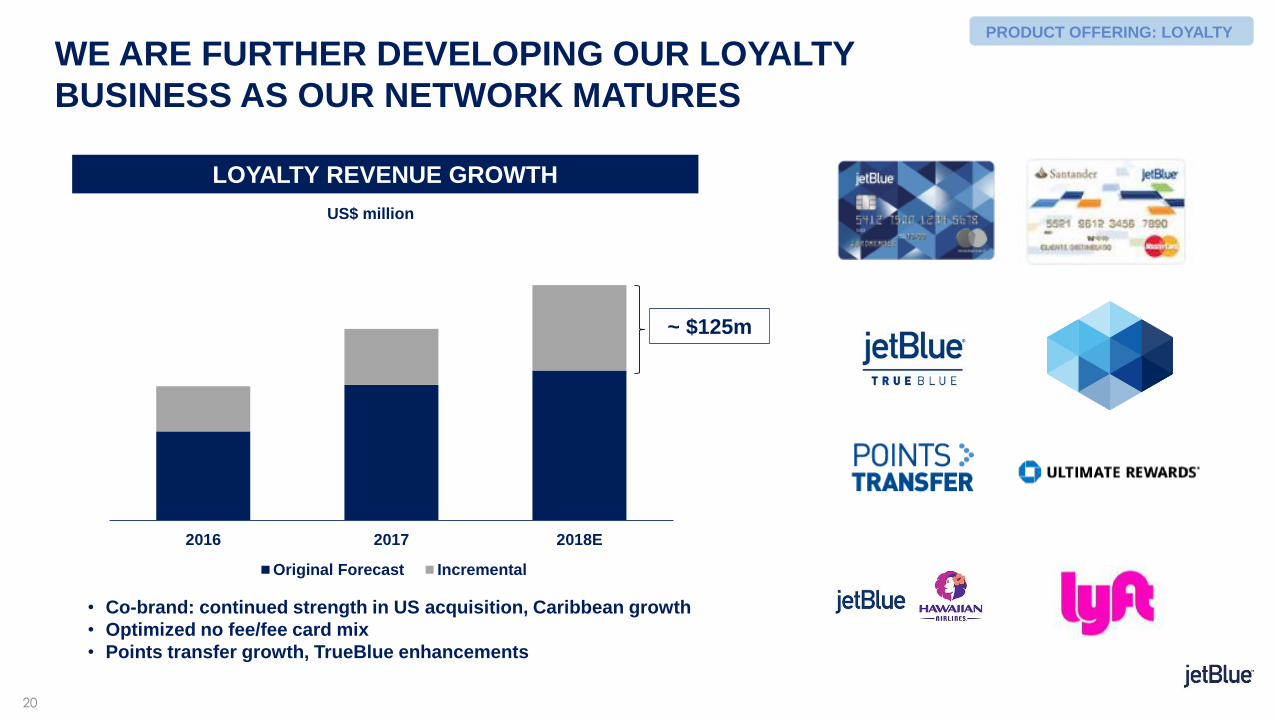
2016 2017 2018E
Original Forecast Incremental
WE ARE FURTHER DEVELOPING OUR LOYALTY
BUSINESS AS OUR NETWORK MATURES
• Co-brand: continued strength in US acquisition, Caribbean growth
• Optimized no fee/fee card mix
• Points transfer growth, TrueBlue enhancements
LOYALTY REVENUE GROWTH
PRODUCT OFFERING: LOYALTY
US$ million
~ $125m
21
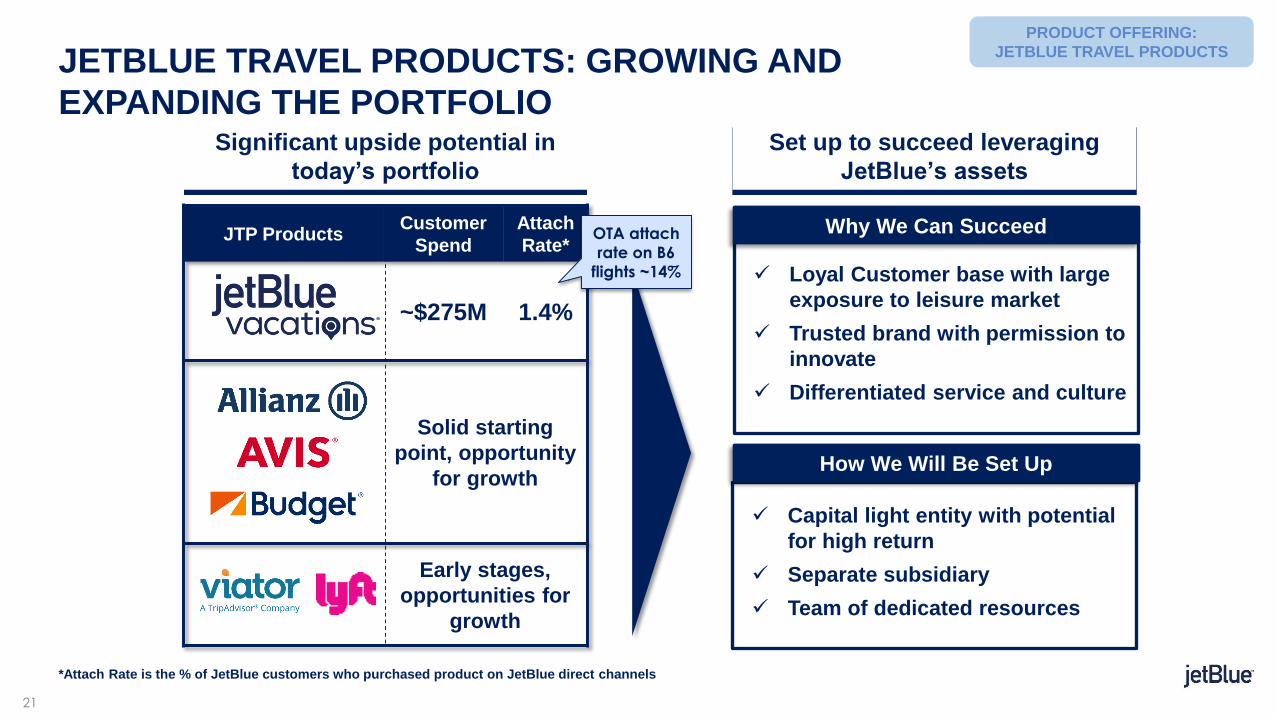
JETBLUE TRAVEL PRODUCTS: GROWING AND
EXPANDING THE PORTFOLIO
PRODUCT OFFERING:
JETBLUE TRAVEL PRODUCTS
Loyal Customer base with large
exposure to leisure market
Trusted brand with permission to
innovate
Differentiated service and culture
Why We Can Succeed
Capital light entity with potential
for high return
Separate subsidiary
Team of dedicated resources
How We Will Be Set Up
*Attach Rate is the % of JetBlue customers who purchased product on JetBlue direct channels
Significant upside potential in
today’s portfolio
Set up to succeed leveraging
JetBlue’s assets
JTP ProductsCustomer
Spend
Attach
Rate*
~$275M 1.4%
Solid starting
point, opportunity
for growth
Early stages,
opportunities for
growth
OTA attach
rate on B6
flights ~14%

22
FOCUSING ON TRAVEL SPEND BEYOND AIR,
ENABLING CAPITAL-LIGHT EARNINGS GROWTH
Lending
Ride sharing
Insurance
Ground transport
Activities
Hotels
Car rentals
2022
2020
2018 Today
+$20-30m(focus on customer growth)
+~$100m
Incremental Operating Income
PRODUCT OFFERING:
JETBLUE TRAVEL PRODUCTS

23
$20
$21
$22
$23
$24
$25
$26
$27
$28
$29
$30
2013 2014 2015 2016 2017 2018E
OUR ANCILLARY OFFERINGS CONTINUE TO
SHOW STRONG GROWTH
HISTORICAL*
$ per Customer
Baggage* + Change fees
Loyalty
Vacations
Even More
Other**
Total
~$11.50
~$8.00
~$6.50
~$1.50
~$2.00
~$29.50
2018E CAGR ‘13-18E
8.4%
13.1%
2.6%
9.3%
(10.3)%
6.0%
*Buy up from Blue Fare to other Fare Options not included
PRODUCT OFFERING: CUSTOMER SEGMENTATION
• Our value proposition and customer segmentation has
generated high ancillary growth over the past five years
**Decline reflects substantial reduction in charter and cargo businesses
CURRENT

24
NETWORK AND PRODUCT OFFERING
CONTRIBUTION BUILDS THROUGH 2020
Network
Product
Offering
2019 20202018
Reallocation
Customer
Segmentation
Loyalty
JetBlue Travel
Products
BEYOND
2020BUILDING BLOCKS
NETWORK AND PRODUCT OFFERING: TIMING
Growth and
Expansion
Identified Network
changes
Recent Ancillary
Changes
Fare Options
2.0 and Other
Note: Box denotes period of highest anticipated impact to revenue
Network Reallocation and Product Offering are expected to add $350 - $400m in revenue by 2020

QUESTION & ANSWER SESSION
BONNY SIMIPRESIDENT, JETBLUE TECHNOLOGY VENTURES

27
Silicon Valley
WE ARE INVESTING IN TOMORROW’S TECHNOLOGY
TO ENHANCE JETBLUE TODAY
JETBLUE TECH VENTURES

28
… AND TO ENHANCE JETBLUE’S ECOSYSTEM INTO THE FUTURE
Increase
Revenue
40% support JetBlue in
< 2 years60% impact
2-10 years
Evolving
Regional
Travel
Seamless
Customer
Journey
Innovation in
Distribution,
Revenue and
Loyalty
Future of
Maintenance
and Operations
Technology-
Powered
Magnificent
Service
Seamless
Customer
Journey
Technology
to Support
our Crew
Future of
Maintenance
and
Operations
Innovation in
Distribution,
Revenue and
Loyalty
Evolving
Regional
Travel
JETBLUE TECH VENTURES
JOANNA GERAGHTYPRESIDENT AND CHIEF OPERATING OFFICER
STEVE PRIESTEVP CHIEF FINANCIAL OFFICER
30
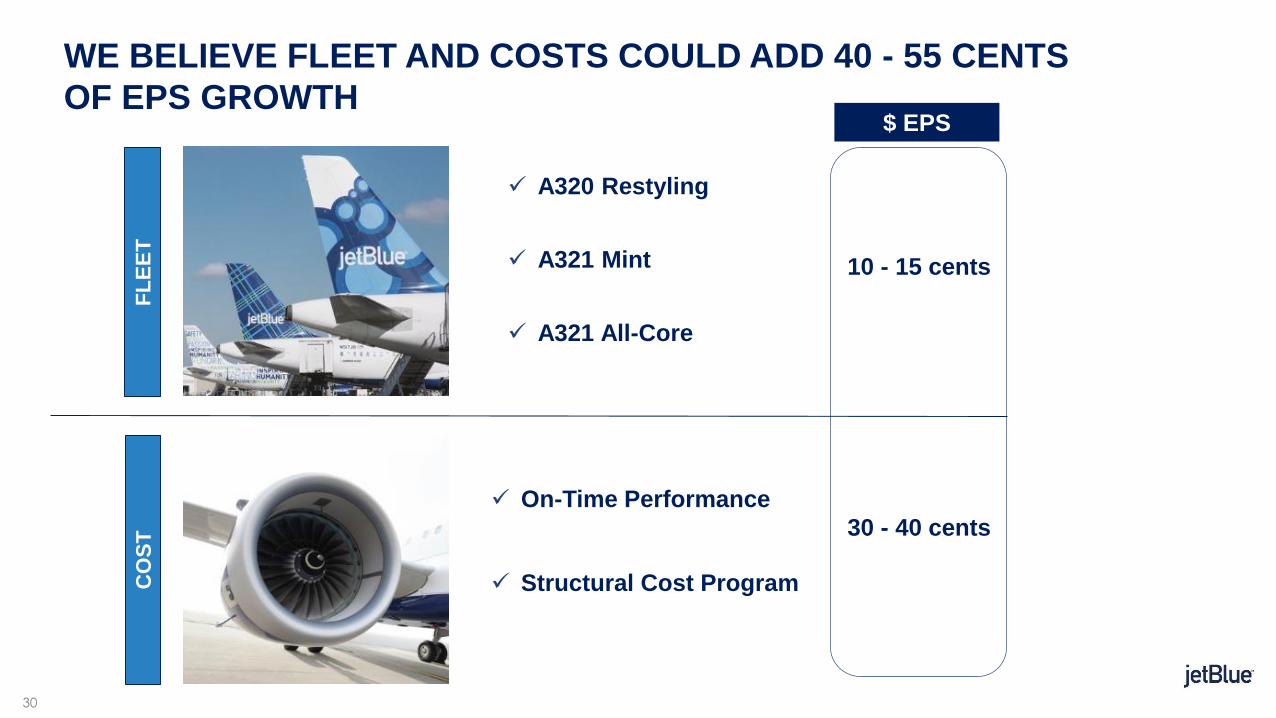
A320 Restyling
A321 Mint
A321 All-Core
WE BELIEVE FLEET AND COSTS COULD ADD 40 - 55 CENTS
OF EPS GROWTH
FL
EE
T$ EPS
On-Time Performance
Structural Cost ProgramCO
ST 30 - 40 cents
10 - 15 cents
31
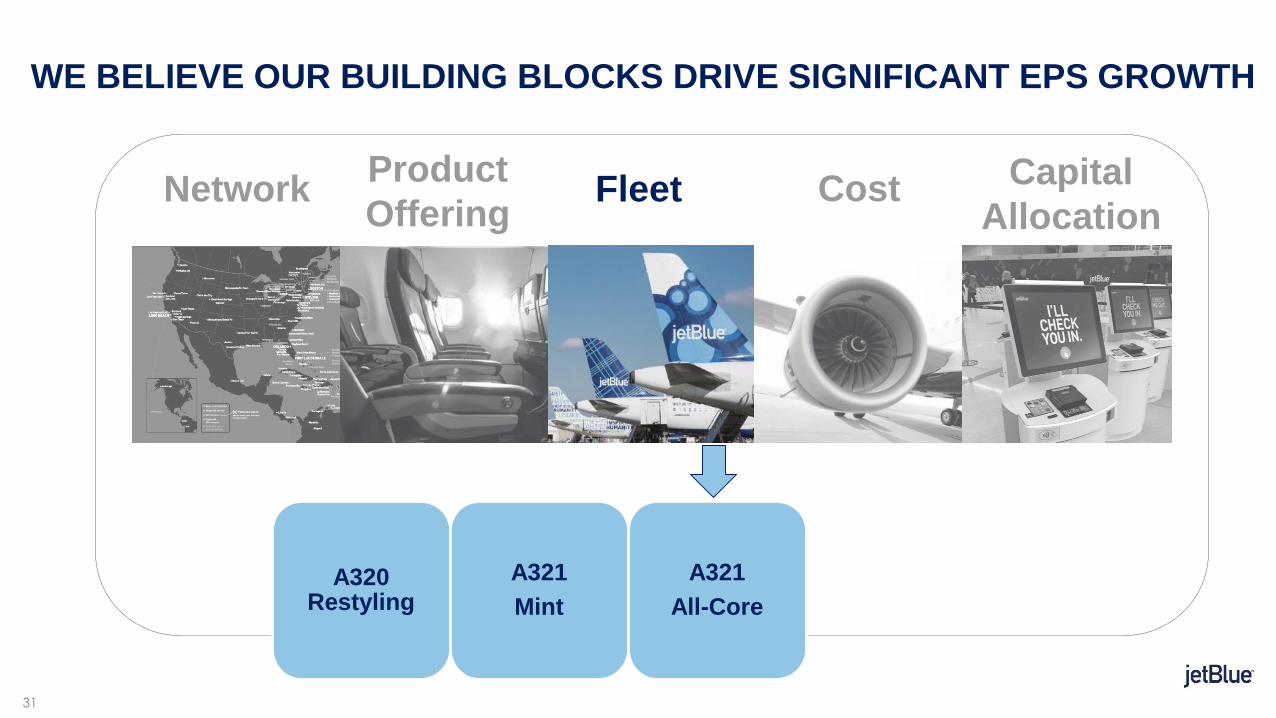
NetworkProduct
OfferingFleet Cost Capital
Allocation
A320 Restyling
A321
Mint
A321
All-Core
WE BELIEVE OUR BUILDING BLOCKS DRIVE SIGNIFICANT EPS GROWTH

32
WE ARE RESHAPING OUR FLEET TO IMPROVE RETURNS
A320 A321 CEOs
• Largest fleet
• Restyling
program to add
12 seats
• New “Core”
product
showing
improved NPS
and operational
benefits
• Adds fuel
efficiency
• New “Core”
product
• Extends benefits
of CEO
configurations
to latest
generation
aircraft
• Flexible
platform
• Newest product
• Lowest fuel and
non-fuel cost
platform
• Step change in
maintenance
cost
A321 NEOs
• Largest aircraft
• New “Core”
product with
highest NPS
• Margin-
accretive in
Mint and All-
Core
configurations
A220sE190
• Helped build
relevance in
BOS markets
• High RASM
contribution
• Higher cost
platform;
cost
headwinds
to come
2020* & BEYOND2019*2013*2000* 2005*
FLEET: OVERVIEW
*Note: Denotes year of first delivery for each fleet type

33
WE EXPECT A320 RESTYLING WILL IMPROVE MARGINS
AND RETURNS
% A320 FLEET RESTYLED ASM CONTRIBUTION**
OPPORTUNITY (2018-2021)
∆ Revenue
∆ Cost
∆ Income
∆ Capital
Incremental ROIC*
12 added seats
New “Core” product
Higher NPS
Operational benefit
$220 - 235m
$150 - 155m
$70 - 80m
$435 - 455m
16 - 20%
Program started late
2017; ramping up
according to schedule
ASM contribution is
back end loaded and
goes beyond 2020
1H18 2H18 1H19 2H19 1H20 2H20 1H19 2H19 2020 2021
*Anticipated fully realized benefit in 2021
FLEET: A320 RESTYLING
BENEFITS
**Incremental YoY ASM growth contributed by restyled aircraft
2%8%
25%
53%
78%
100%
0.5%
1.1%
2.3%
1.0%

34
A321 IS A MARGIN BUILDER IN BOTH MINT AND ALL-CORE
MARGIN% OF SYSTEM ASMs
• Adding Mint aircraft opportunistically
• Adds value-accretive ASMs
• Most efficient platform
• Increases margins in both Mint and All-Core
configurations
0%
5%
10%
15%
20%
25%
30%
35%
2014 2015 2016 2017
All-Core Mint System (ex-321)
FLEET: A321 MINT
AND ALL-CORE
16 pts
All-Core
Aircraft
Mint
Aircraft
3% 5%
12% 14% 15%
2%
7%
7%
13%
19%
2014 2015 2016 2017 2018E
A320s & E190s

35
NetworkProduct
OfferingFleet Cost Capital
Allocation
On-Time Performance
Structural Cost Program
WE BELIEVE OUR BUILDING BLOCKS DRIVE SIGNIFICANT EPS GROWTH

36
ON-TIME PERFORMANCE INITIATIVES HELP MANAGE
THE COST OF COMPLEX AIRSPACE
COSTS: ON-TIME PERFORMANCE
• Focus to preserve margins during peak
seasons:
- Partnering with the FAA
- Tactical investments in schedules
and turn time
- Continuous improvement efforts
74%
76%
78%
80%
82%
84%
86%
10.0 11.0 12.0 13.0 14.0
LGA
BOS
EWR
JFK
Ind
us
try O
n-T
ime
Pe
rfo
rma
nc
e (
A1
4)
Industry Unit Revenue**
ON-TIME PERFORMANCE VS UNIT REVENUE
OA* Hubs & JetBlue Northeast
Focus City Airports
ON-TIME PERFORMANCE INITIATIVES
YoY on-time performance (A14) improving
on good and bad ATC days since buffers
and decompressed turns were
implemented
Our high value geography is associated with a congested
airspace and lower on-time performance
**Passenger RASM, stage-adjusted*OA: Other Airlines Source: Diio 4Q 2017
37
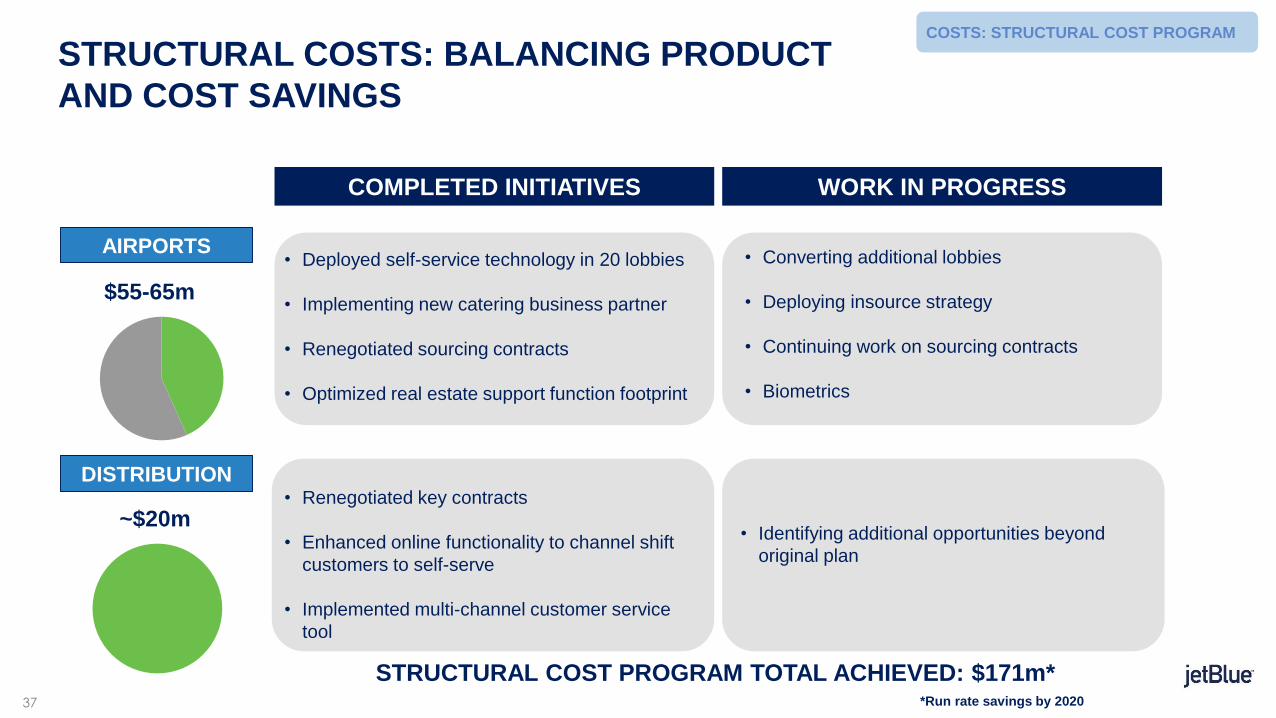
STRUCTURAL COSTS: BALANCING PRODUCT
AND COST SAVINGS
AIRPORTS
DISTRIBUTION
COMPLETED INITIATIVES WORK IN PROGRESS
• Deployed self-service technology in 20 lobbies
• Implementing new catering business partner
• Renegotiated sourcing contracts
• Optimized real estate support function footprint
• Converting additional lobbies
• Deploying insource strategy
• Continuing work on sourcing contracts
• Biometrics
• Renegotiated key contracts
• Enhanced online functionality to channel shift
customers to self-serve
• Implemented multi-channel customer service
tool
• Identifying additional opportunities beyond
original plan
COSTS: STRUCTURAL COST PROGRAM
$55-65m
~$20m
STRUCTURAL COST PROGRAM TOTAL ACHIEVED: $171m**Run rate savings by 2020

38
STRUCTURAL COSTS: ADDRESSING TECH OPS
COST PRESSURES AND TARGETED CORPORATE SPENDING
TECH OPS
CORPORATE
COMPLETED INITIATIVES WORK IN PROGRESS
• Signed multiyear NEO engine deal
• Signed enhanced CF34 LLPs – E190s
• Completed heavy MX RFP – A320s
• Renegotiated key sourcing contracts
• Negotiating V2500 RFP
• Negotiating heavy MX RFP – A321 & E190
• Optimizing airframe component strategy
• Consolidating line MX business partners
• Support center review
• Rationalized business partner spend
• Deployed data center storage refresh
• Reviewing software license utilization and
contracts
• Reviewing sourcing contracts
COSTS: STRUCTURAL COST PROGRAM
$100-125m
$75-90m
STRUCTURAL COST PROGRAM TOTAL ACHIEVED: $171m**Run rate savings by 2020Note: MX = Maintenance; RFP = Request for Proposal
39
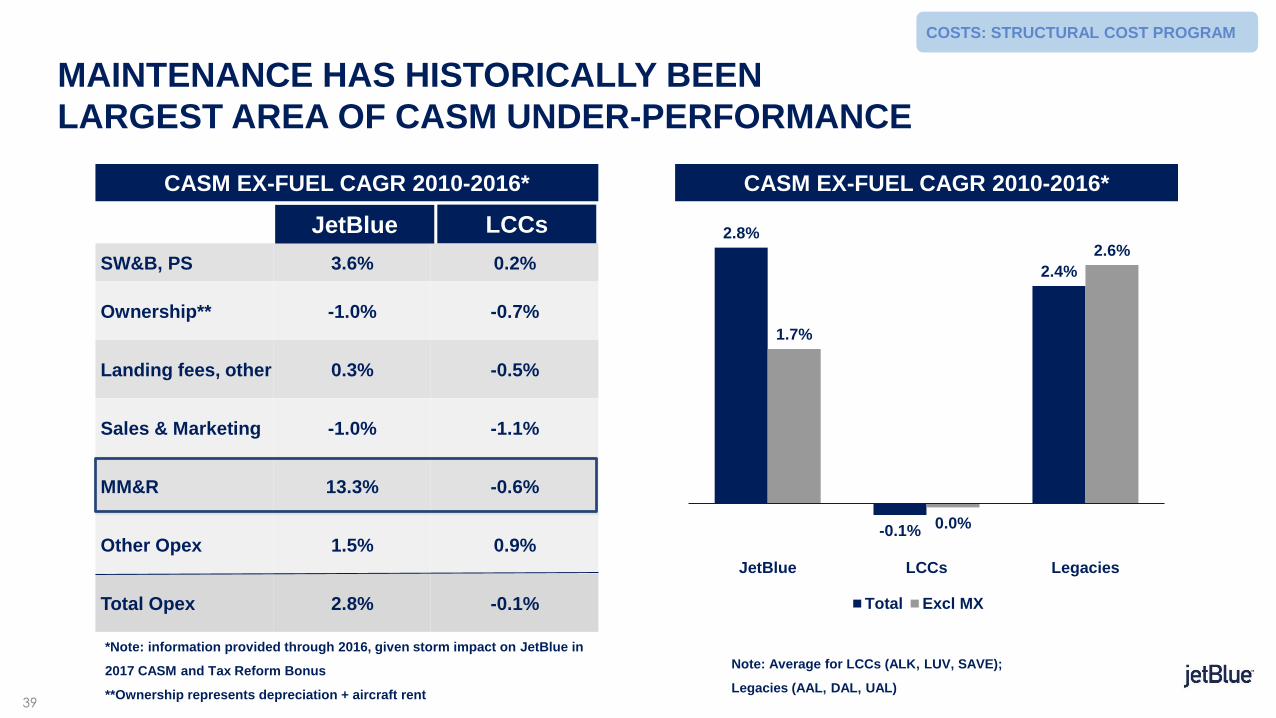
MAINTENANCE HAS HISTORICALLY BEEN
LARGEST AREA OF CASM UNDER-PERFORMANCE
CASM EX-FUEL CAGR 2010-2016* CASM EX-FUEL CAGR 2010-2016*
SW&B, PS 3.6% 0.2%
Ownership** -1.0% -0.7%
Landing fees, other 0.3% -0.5%
Sales & Marketing -1.0% -1.1%
MM&R 13.3% -0.6%
Other Opex 1.5% 0.9%
Total Opex 2.8% -0.1%
JetBlue LCCs
Note: Average for LCCs (ALK, LUV, SAVE);
Legacies (AAL, DAL, UAL)
COSTS: STRUCTURAL COST PROGRAM
*Note: information provided through 2016, given storm impact on JetBlue in
2017 CASM and Tax Reform Bonus
**Ownership represents depreciation + aircraft rent
2.8%
-0.1%
2.4%
1.7%
0.0%
2.6%
JetBlue LCCs Legacies
Total Excl MX

40
BROAD INITIATIVES TO TACKLE OUTSIZED MAINTENANCE
INFLATION
MAINTENANCE CASM CAGR STRUCTURAL CHANGES
TO ADDRESS HEADWINDS2010-2016*
COSTS: STRUCTURAL COST PROGRAM
• Long term contract on heavy maintenance: mutual
incentives for JetBlue + business partner to
become more efficient
• Optimize maintenance program to better fit high
utilization network
• E190 exit + A220 entry: opportunity to refine
approach to managing components
• Leveraging fleet size to structure contractual
terms for engine maintenance
*Note: information provided through 2016, given storm impact on
JetBlue CASM in 2017
8%
5%
24%
13%
-1%
13%
29%
16%
Airframe
Repairs
Engine
Maintenance
Component
Repairs
Total
Maintenance
A320 family E190
41
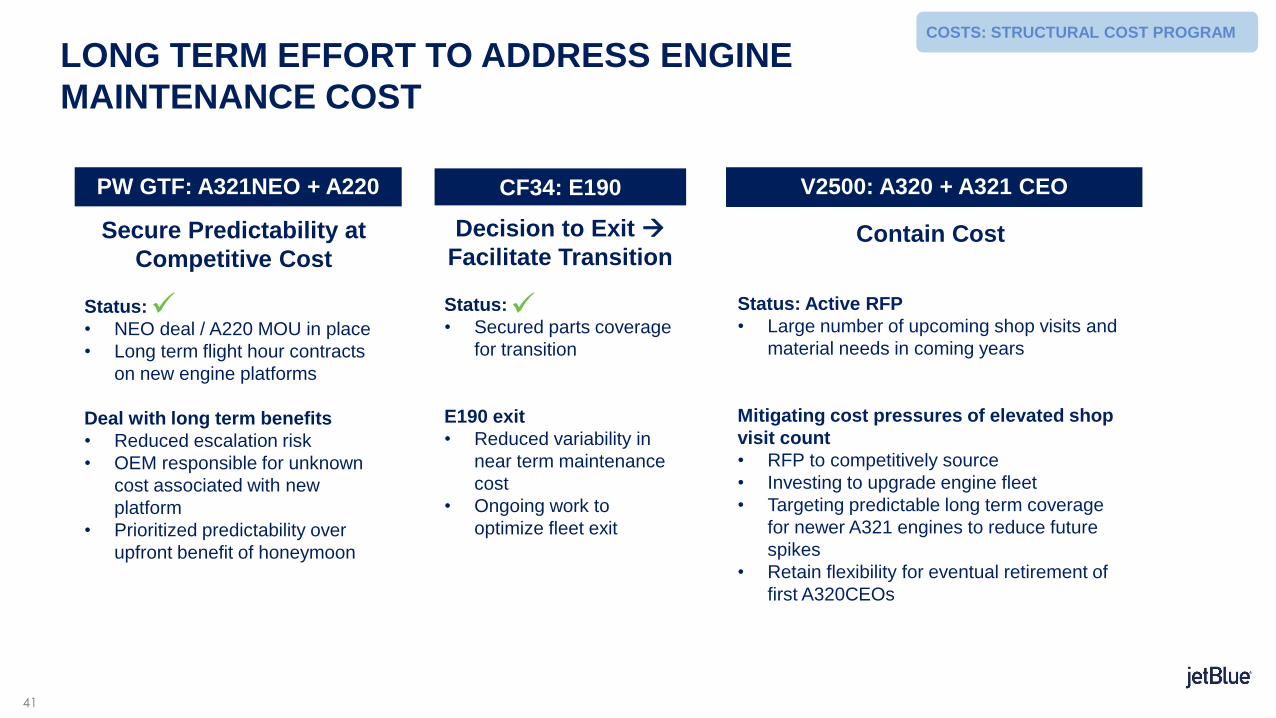
LONG TERM EFFORT TO ADDRESS ENGINE
MAINTENANCE COST
Secure Predictability at
Competitive Cost
Status:
• NEO deal / A220 MOU in place
• Long term flight hour contracts
on new engine platforms
Deal with long term benefits
• Reduced escalation risk
• OEM responsible for unknown
cost associated with new
platform
• Prioritized predictability over
upfront benefit of honeymoon
PW GTF: A321NEO + A220
Decision to Exit
Facilitate Transition
Status:
• Secured parts coverage
for transition
E190 exit
• Reduced variability in
near term maintenance
cost
• Ongoing work to
optimize fleet exit
Contain Cost
Status: Active RFP
• Large number of upcoming shop visits and
material needs in coming years
Mitigating cost pressures of elevated shop
visit count
• RFP to competitively source
• Investing to upgrade engine fleet
• Targeting predictable long term coverage
for newer A321 engines to reduce future
spikes
• Retain flexibility for eventual retirement of
first A320CEOs
V2500: A320 + A321 CEO
COSTS: STRUCTURAL COST PROGRAM
CF34: E190
42
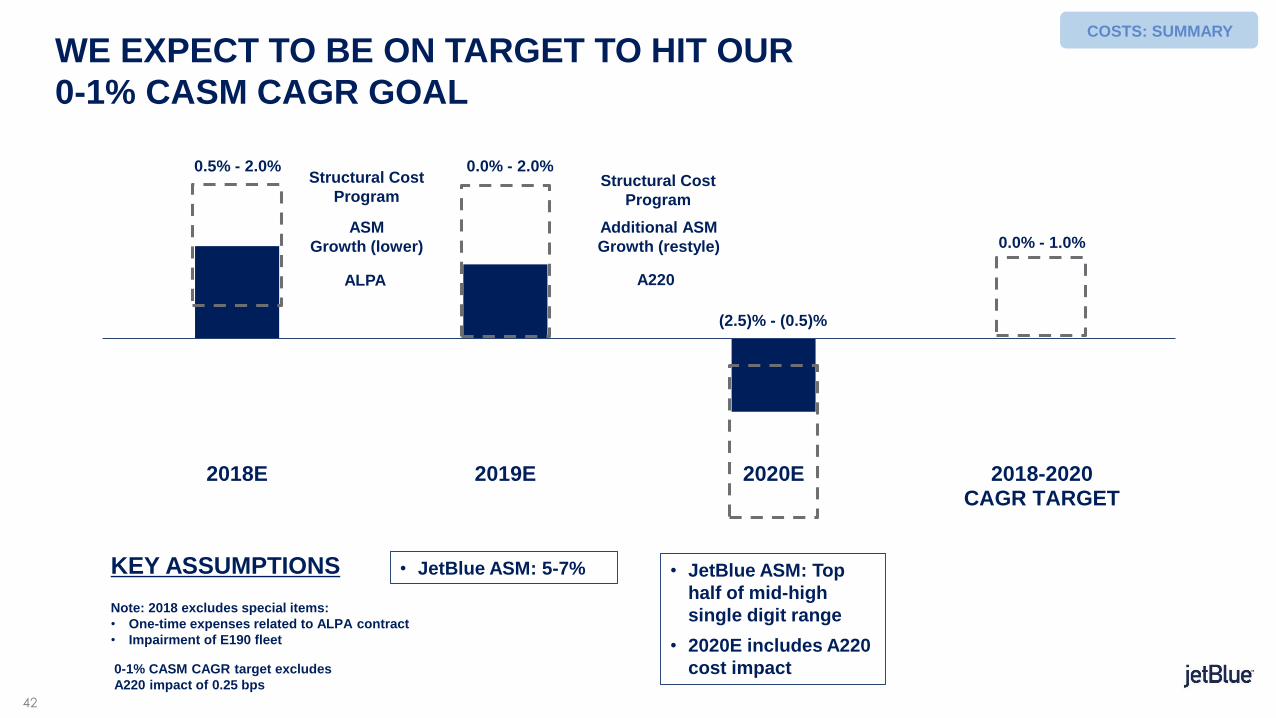
2018E 2019E 2020E 2018-2020CAGR TARGET
WE EXPECT TO BE ON TARGET TO HIT OUR
0-1% CASM CAGR GOAL
• JetBlue ASM: 5-7%
Structural Cost
Program
ASM
Growth (lower)
Structural Cost
Program
Additional ASM
Growth (restyle)
A220
0.5% - 2.0% 0.0% - 2.0%
(2.5)% - (0.5)%
0.0% - 1.0%
• JetBlue ASM: Top
half of mid-high
single digit range
• 2020E includes A220
cost impact
KEY ASSUMPTIONS
ALPA
COSTS: SUMMARY
Note: 2018 excludes special items:
• One-time expenses related to ALPA contract
• Impairment of E190 fleet
0-1% CASM CAGR target excludes
A220 impact of 0.25 bps

43
Differentiated
Products and
Services
WE ARE ALSO RESHAPING JETBLUE ECONOMICS BEYOND 2020
Loyalty
JetBlue Travel Products
A321 NEO
A220
JetBlue Technology Ventures
Revenue
Enhancing
Cost
Reducing
FL
EE
TP
RO
DU
CT
OF
FE
RIN
G
44
NetworkProduct
OfferingFleet Cost Capital
Allocation
Balance Sheet
Capital Deployment
WE BELIEVE OUR BUILDING BLOCKS DRIVE SIGNIFICANT EPS GROWTH
45
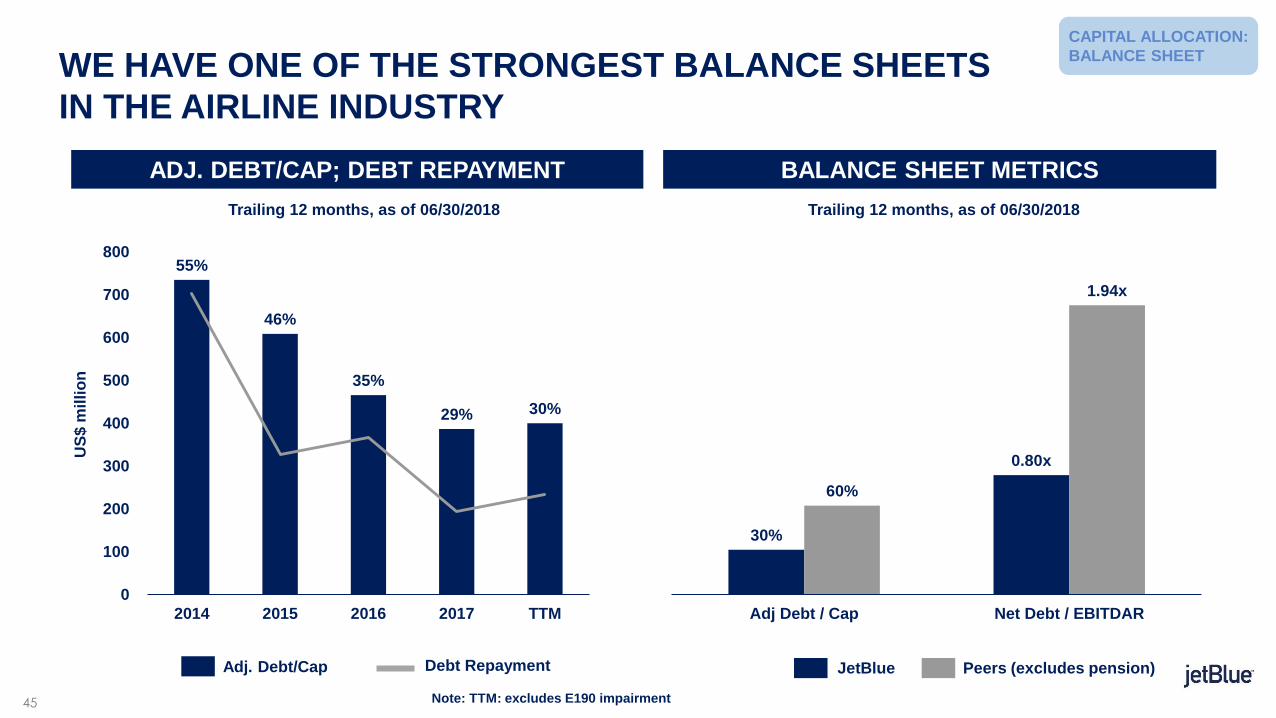
WE HAVE ONE OF THE STRONGEST BALANCE SHEETS
IN THE AIRLINE INDUSTRY
BALANCE SHEET METRICSADJ. DEBT/CAP; DEBT REPAYMENT
CAPITAL ALLOCATION:
BALANCE SHEET
Trailing 12 months, as of 06/30/2018 Trailing 12 months, as of 06/30/2018
Adj. Debt/Cap Debt Repayment
US
$ m
illi
on
JetBlue Peers (excludes pension)
55%
46%
35%
29% 30%
0%
10%
20%
30%
40%
50%
60%
0
100
200
300
400
500
600
700
800
2014 2015 2016 2017 TTM
30%
0.80x
60%
1.94x
Adj Debt / Cap Net Debt / EBITDAR
Note: TTM: excludes E190 impairment

46
WE MAINTAIN A STRONG BALANCE SHEET AS WE
RETURN EXCESS CAPITAL
CAPITAL DEPLOYED SHARE REPURCHASES vs MARKET CAP*
*Net share buybacks as % of market capitalization
CAPITAL ALLOCATION:
CAPITAL DEPLOYMENT
73% 70%
8%
27% 17%
6%
JetBlue Peers
Capex Net Debt Paydown
Share repurchase Dividend
Acquisition
Trailing 12 months, as of 06/30/2018Trailing 12 months, as of 06/30/2018
6.7%
6.2%
2.0%
4.1%
JetBlue Legacy LCC Industrials
Source: Company reports; Bloomberg

47
2018 2019 2020
OUR CAPEX IS FOCUSED ON FLEET REINVESTMENT
CAPITAL DEPLOYED GROWTH-ACCRETIVE CAPEX
$1.0 – 1.2 b
$1.3 – 1.5 b $1.4 – 1.6 b
US$
ORDER BOOK
Note: As of October 2, 2018, four remaining A321 CEO deliveries in 2018
CAPITAL ALLOCATION:
CAPITAL DEPLOYMENT
4
1315 16 15 14
12
5 48
19 22
2
2018 2019 2020 2021 2022 2023 2024 2025
A321 CEO/NEO A220
4
13
20 20
23
33 34
2
48
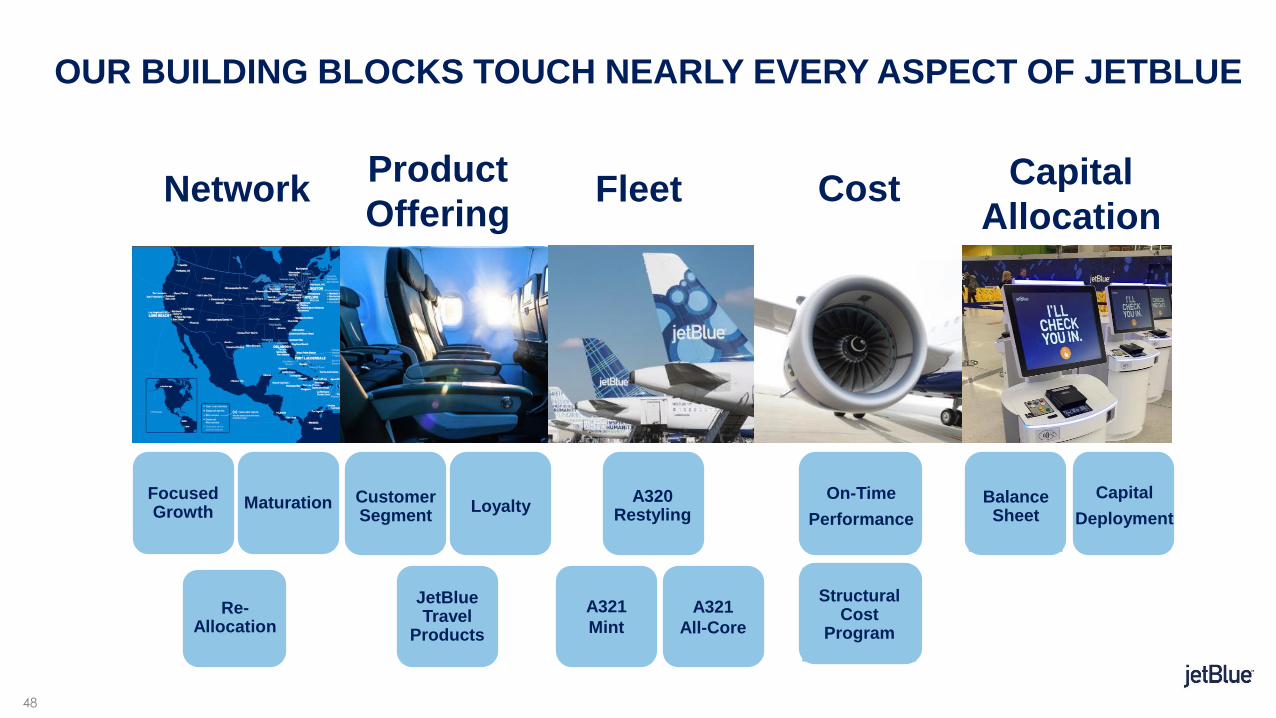
OUR BUILDING BLOCKS TOUCH NEARLY EVERY ASPECT OF JETBLUE
Re-Allocation
LoyaltyCustomer Segment
JetBlue Travel
Products
A320 Restyling
A321
Mint
On-Time
Performance
Capital
Deployment
Focused Growth
Maturation Balance Sheet
A321
All-Core
NetworkProduct
OfferingFleet Cost Capital
Allocation
Structural Cost
Program

49
Focused
Growth
Network
Maturation
NETWORK
Network
Reallocation
WE EXPECT OUR BUILDING BLOCKS WILL DRIVE EPS GROWTH
OVER TIME
Customer
Segmentation
Loyalty
PRODUCT
OFFERING
Structural Cost
Program
On-Time
Performance
COST
Capital
Deployment
CAPITAL
ALLOCATION
A320
Restyling
A321
Mint
FLEET
JetBlue Travel
Products
30 - 40c
A321
All-Core
Balance
Sheet
35 - 55c
10 - 15c
30 - 40c
> 7c
50
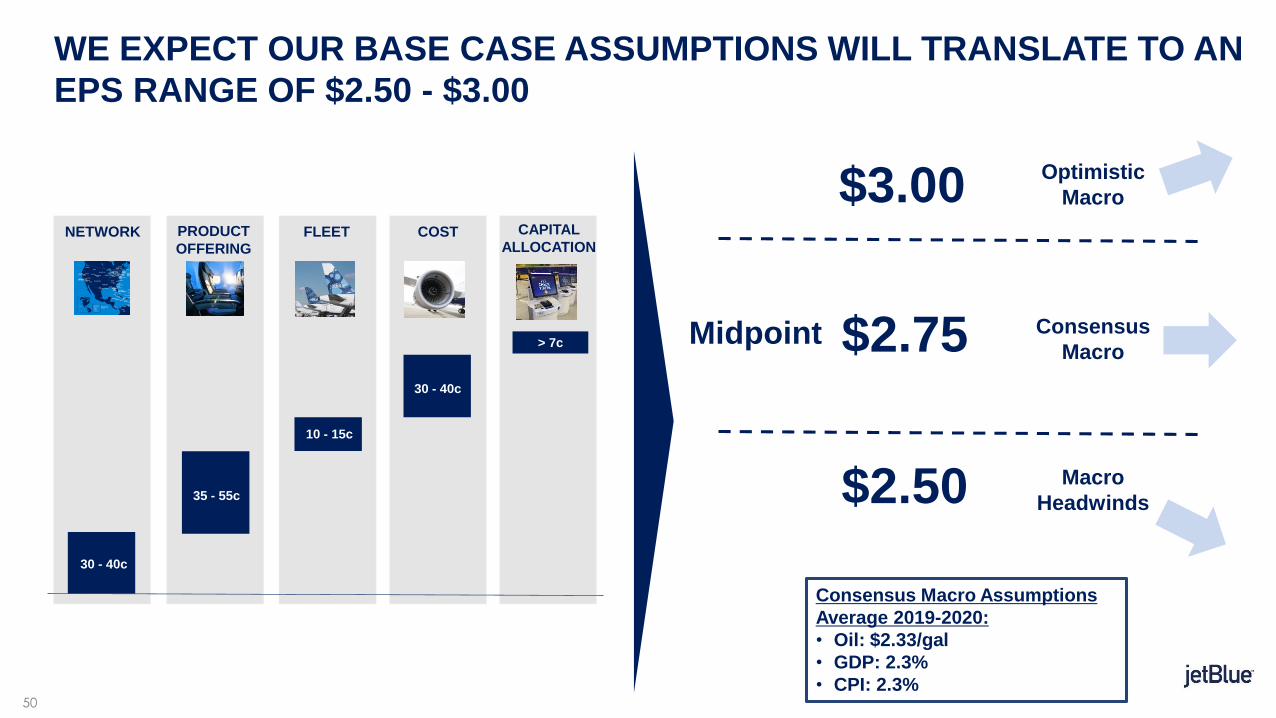
WE EXPECT OUR BASE CASE ASSUMPTIONS WILL TRANSLATE TO AN
EPS RANGE OF $2.50 - $3.00
Consensus Macro Assumptions
Average 2019-2020:
• Oil: $2.33/gal
• GDP: 2.3%
• CPI: 2.3%
$3.00
$2.75
$2.50 Macro
Headwinds
Consensus
Macro
Optimistic
Macro
Midpoint
NETWORK PRODUCT
OFFERINGCOST CAPITAL
ALLOCATIONFLEET
30 - 40c
35 - 55c
10 - 15c
30 - 40c
> 7c

51
1.13x
2018 2020E
7.3%
2018 2020E
WE BELIEVE OUR BUILDING BLOCKS WILL IMPROVE OUR
MARGINS AND PRODUCE HIGHER RETURNS
NOPAT MARGIN ASSET TURNS ROIC
• Beyond 2020 start to see ROIC benefits of A220
• Working to reach and sustain Pre-Tax Margin and ROIC in teens
~10%
~1.1X
NOPAT: Net Operating Profit after Taxes* Asset Turns: Revenue / Invested Capital* ROIC: NOPAT / Invested Capital*
CAPITAL ALLOCATION:
RETURN ON CAPITAL
8.2%
2018 2020E
11.0%
13.0%
*Note: Refer to Appendix for definitions and calculation formulas
52
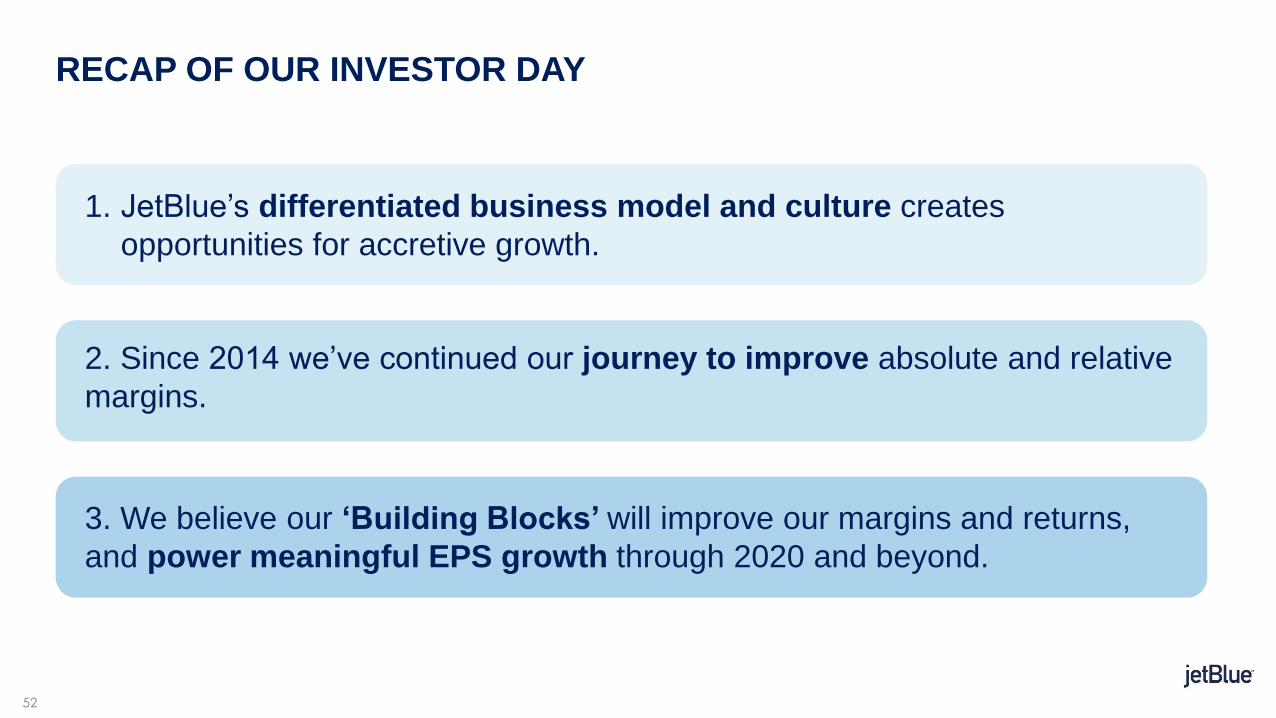
RECAP OF OUR INVESTOR DAY
1. JetBlue’s differentiated business model and culture creates
opportunities for accretive growth.
2. Since 2014 we’ve continued our journey to improve absolute and relative
margins.
3. We believe our ‘Building Blocks’ will improve our margins and returns,
and power meaningful EPS growth through 2020 and beyond.

QUESTION & ANSWER SESSION
54
APPENDIX: NOTE ON NON-GAAP FINANCIAL MEASURES
JetBlue sometimes uses non-GAAP measures that are derived from the Consolidated Financial Statements,
but that are not presented in accordance with generally accepted accounting principles ("GAAP"). JetBlue
believes these non-GAAP measures provide a meaningful comparison of our results to others in the airline
industry and our prior year results. Investors should consider these non-GAAP financial measures in addition
to, and not as a substitute for, our financial performance measures prepared in accordance with GAAP. We
believe our special items distort our overall trends and that our metrics and results are enhanced with the
presentation of our results excluding the impact of special items. For 2014, our special item includes the
$241 million gain on the sale of LiveTV, a wholly-owned subsidiary of JetBlue. For 2017, our special item
includes a $570 million tax benefit from the measurement of our deferred taxes to reflect the impact of the
enactment of the Tax Cut and Jobs Act of 2017.
Please refer to our 2014 Annual Report Form 10-K filed with the SEC on February 12, 2015, and our 2017
Annual Report Form 10-K filed with the SEC on February 16, 2018 for a reconciliation of these non-GAAP
financial measures.

55
APPENDIX: MACRO ASSUMPTIONS
Variable 2019 2020 Average
GDP 2.6 2.0 2.3
CPI 2.2 2.3 2.3
Jet Fuel ($/gallon) 2.32 2.34 2.33
SOURCES:
GDP and CPI:
• 2019: Blue Chip Average consensus (July 2018)
• 2020: Bloomberg
Jet Fuel:
• 2019 Brent consensus (as of 09/10/2018) + Heating Oil/Brent Crack +
US Gulf Coast Jet Basis + 2018’s Net Premium
• 2020: Similar to 2019; Brent consensus carried forward flat from Q4 2019
56
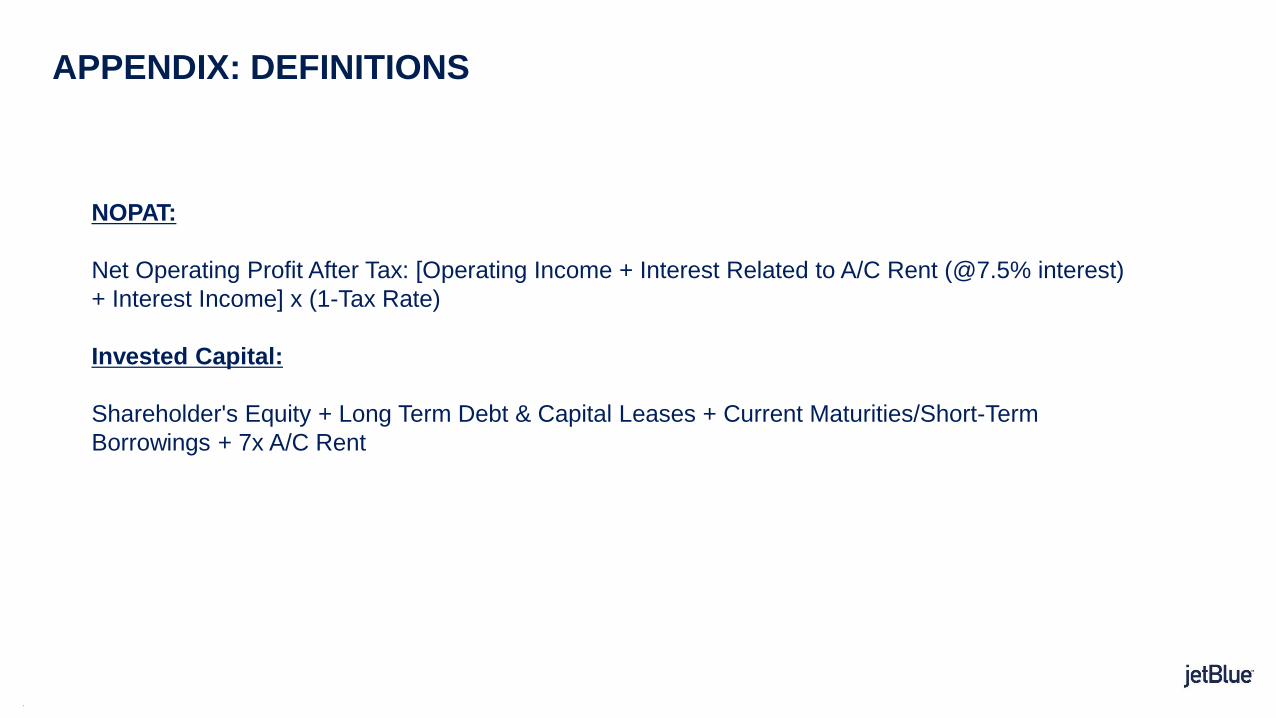
APPENDIX: DEFINITIONS
NOPAT:
Net Operating Profit After Tax: [Operating Income + Interest Related to A/C Rent (@7.5% interest)
+ Interest Income] x (1-Tax Rate)
Invested Capital:
Shareholder's Equity + Long Term Debt & Capital Leases + Current Maturities/Short-Term
Borrowings + 7x A/C Rent

5757