SAE Formula Car Data Acquisition & Display System February 25, 2015 Advisor : Professor Steven...
70
SAE Formula Car Data Acquisition & Display System February 25, 2015 Advisor : Professor Steven Gutschlag Ahmed Albitar John Gertie Justin Ibarra Sean Lenz
-
Upload
ferdinand-copeland -
Category
Documents
-
view
218 -
download
1
Transcript of SAE Formula Car Data Acquisition & Display System February 25, 2015 Advisor : Professor Steven...

SAE Formula CarData Acquisition & Display System
February 25, 2015
Advisor : Professor Steven Gutschlag
Ahmed Albitar John Gertie
Justin Ibarra Sean Lenz

Problem Description
• Acquire 5 Key data points from SAE Formula Car
• RPM
• Speed
• Oil Pressure
• Water Temperature
• Battery Voltage
• Aggressive Notification system to alert driver if data exceeds threshold values
• Multi-mode touch screen display
• Wireless transmission of data to off-track computer
• Data Logger 2

Agenda• System block diagram
• Division of Labor
• Sensor interfacing
• Interfacing transceiver with LabVIEW
• Interfacing microcontroller with Amulet
3

System Block Diagram
Sensors
Microcontroller
(ATmega128)
Amulet LCD
Wireless Transceive
r
UART
RS-232
Laptop(LabVIEW
GUI)
UART
5V Power Supply
4

Division of Labor
• Ahmed
• Sensor selection & interfacing
• Justin & John
• Interface microcontroller with HyperTerminal
• Test microcontroller with simulated sensor data
• Interface microcontroller with LabVIEW
• Sean
• Prepared LabVIEW to receive wireless data
• Interface microcontroller with Amulet 5

System Block Diagram
Sensors
Microcontroller
(ATmega128)
Amulet LCD
Wireless Transceive
r
UART
RS-232
Laptop(LabVIEW
GUI)
UART
5V Power Supply
Ahmed
Sean
John & Justin
6

Outline for Ahmed
• Original Schedule
• Subsystem Block Diagram
• Updated Schedule
• Research
• Temperature sensor
• Pressure sensor
• RPM and velocity sensor
• Remaining tasks 7

Original Schedule
8

Subsystem Block Diagram
9

Updated Schedule
10

Research
• Mechanical Engineering Meetings
• Temperature Sensor
• Dimensions
• Hall-Effect sensor
• Cost Analysis
11

Current Temperature Sensor
• ProSense TTD25N-20-0300F-H
• $ 126
• Analog output: 4 to 20mA
• Operating Voltage: 10 to 30VDC
• Temperature range: 0-300 F
• ¼ NPT
• Cable : CD12L-0B-020-A0
12
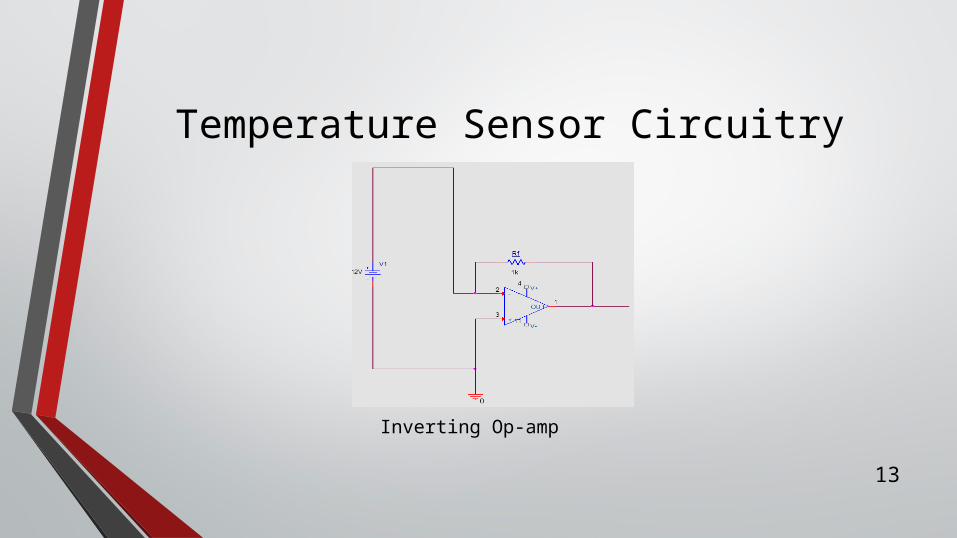
Temperature Sensor Circuitry
13
Inverting Op-amp

Temperature Sensor Testing
• Within 3 percent accuracy
• T = m × Io +k ( Io = V×Rf)
• m = 10418.75
• k = -59.48
• Linear Sensor
14

Temperature vs Current graphs
15

Current Pressure Sensor
• ProSense PTD25-20-0100H
• $126
• Analog output: 4 to 20mA
• Operating Voltage: 9.6 to 32VDC
• PSI range: 0 to 100
• ¼ NPT
• Cable : CD12L-0B-020-C016

Pressure Sensor Circuitry
17
Inverting Op-amp

RPM and Velocity Sensor
• Mechanical Engineering sensor
• Supply voltage: 4.5 - 24 V DC
• Supply current: 10 - 20 mA
• Output signal type: Pulse 0-50 V
• Sensing distance : 0.5 to 2 mm
• Operating temperature range: -40 to 150 Celsius
18

Remaining Work
• Create Sensor’s Circuitry
• Test the Sensors
• Install the Sensors
• Test the System
19

Remaining Schedule
20
● Subsystem Block Diagram
● Schedule/Percentage complete
● Hardware & Software Used
● Design analysis and approach
● ADC Code
● Testing with simulated sensor data
● Interfacing with LabView
● Research conclusion
● Results
● Remaining Work
Outline for John & Justin
21

Subsystem Block Diagram
22

Schedule
23
Complete Incomplete

24
• 100% complete with microcontroller to Aerocomm transceiver communication
• 100% complete with Aerocomm transceiver to Aerocomm transceiver wireless communication
• 80% complete with wireless transmission to LABview
Percentage Completed
25
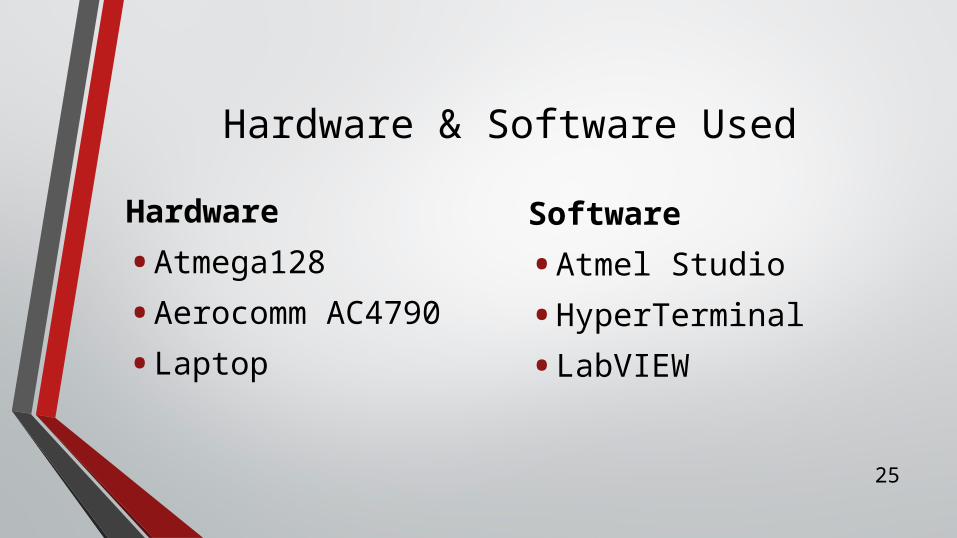
Hardware & Software Used
Hardware
• Atmega128
• Aerocomm AC4790
• Laptop
Software
• Atmel Studio
• HyperTerminal
• LabVIEW

26
• Familiarize myself with progress John made last semester involving the wireless transmission.
• Look over Aercomm manual to understand how it sends and receives data wirelessly.
• Research how LABview interacts with incoming signals.
• Look over microcontroller datasheet as to understand what each of the pins on it are use for and how they are initialized in code.
• Researching error codes and what most likely cause certain ones we were receiving.
Additional Research Needed

27
• Design a system that receives data from incoming signals.•A to D converter
• Design a system that transmits the data receive wirelessly between two transceivers.
• Design a system that displays the wirelessly sent data values in LABview•Real time
•Accurate
Design Approach

28
• First analyze wireless transmission•Look on hyperterminal to make sure data sent is the correct number of bytes
•Look on hyperterminal to analyze the bytes and make sure the values change as input sensor values change
• Use oscilloscope to view output of pins•Correct high and low voltage signals.
•Allows us to see the frequency of data being received and sent.
• View data received in LABview to make sure it is same as on hyperterminal.•Allows us to verify LABview is analyzing incoming signals correctly.
Analysis Approach

29
• Software•No new software needed to be purchase
• Microcontroller•Atmega128 -chip costs about 12$
• Aerocomm AC4790board and transceivers•Board and transceivers -45$
•Using from previous years projects.
Cost consderations
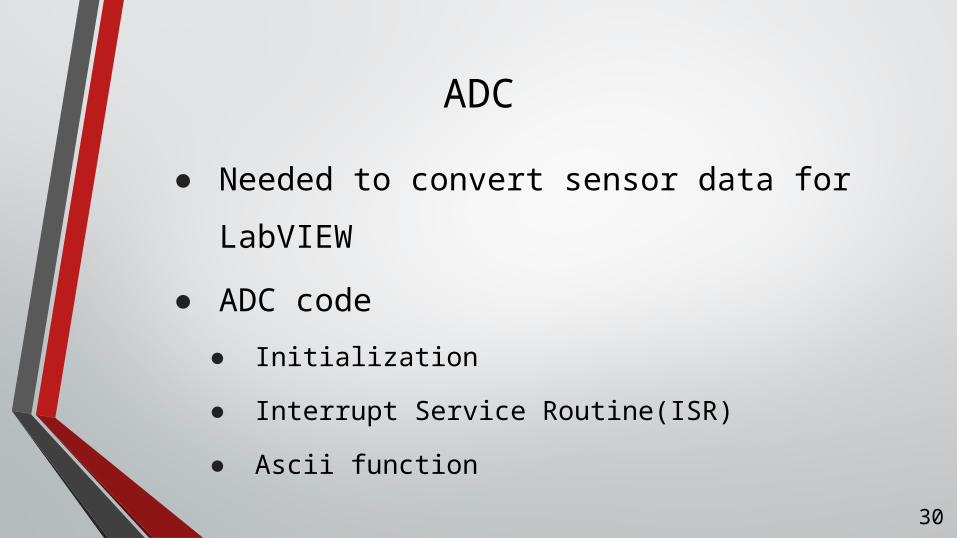
● Needed to convert sensor data for
LabVIEW
● ADC code
● Initialization
● Interrupt Service Routine(ISR)
● Ascii function
ADC
30
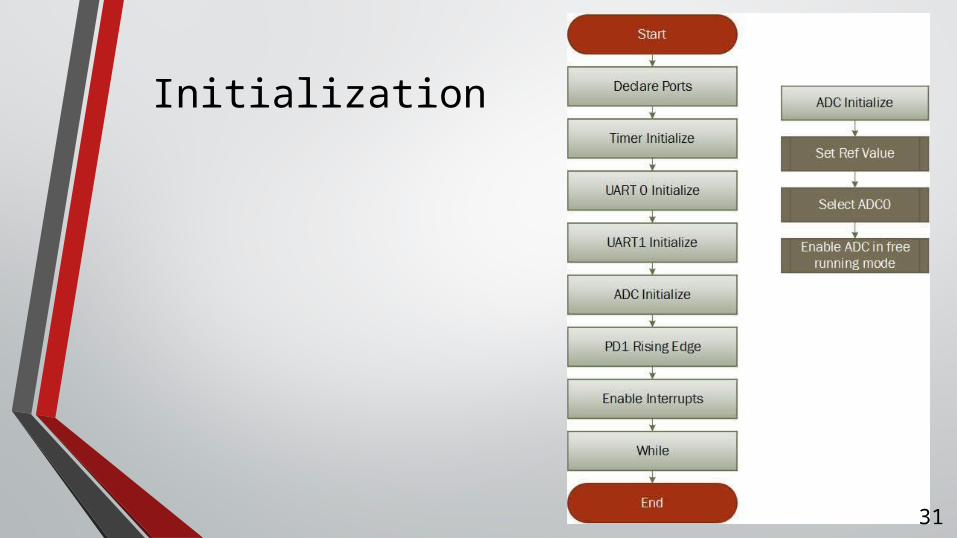
Initialization
31

ISR
32

• Linear Output• Oil Pressure, Water Temperature, Battery Voltage
• Simulated with Power Supply
• Pulse Output• Tachometer, Speedometer
• Simulated with the Wave Generator
Testing with Simulated Data
33

• Communication Protocol
• Universal Asynchronous Receiver/Transmitter(UART)
• Transmission Type
• Ascii
• Sent using packets
Interfacing with LabView
34

35
LabVIEW Packets
• 16 byte array
• 2 bytes dedicated to water temperature
• 2 bytes dedicated to oil pressure
• 4 bytes dedicated to MPH
• 4 bytes dedicated to RPM
• Other bytes to be used for flags

Research
• Sensor output signal types
• Sending packets through Aerocomm
• Atmel Studio error codes
36

Results
• Simulated sensor data displayed in HyperTerminal
• LabVIEW interfaced with transceiver
37
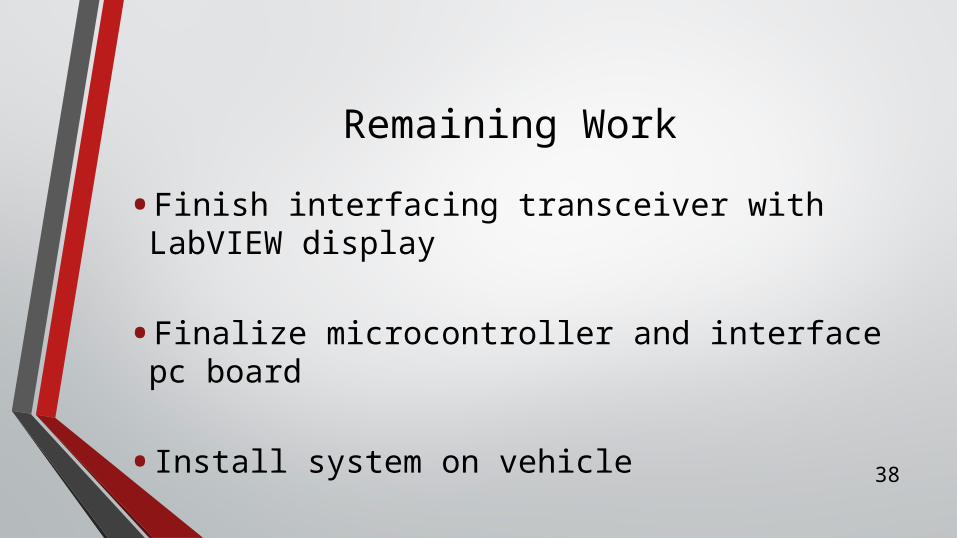
Remaining Work
• Finish interfacing transceiver with LabVIEW display
• Finalize microcontroller and interface pc board
• Install system on vehicle38

39
Sean’s Agenda• Schedule
• Gantt Chart
• Research
• HW/SW Interface
• Serial Communication
• ATmega128 to Amulet LCD
• Aerocomm to LabVIEW
• Results
• Remaining Work

40
Sean’s Schedule% Completed Remaining Work
ID Task Name Finish DurationQ4 14 Q1 15
Nov Dec Jan Feb
123456
0w11/20/2014Progress Presentation 1
13.4w2/17/2015Amulet LCD
4w12/12/2014Labview GUI
15w2/27/2015HW/SW Interface
3w3/2/2015Test system
0w2/24/2015Progress Presentation 2
% Complete
100%
100%
90%
80%
30%
100%

41
Research
• Amulet serial communication protocol
• LabVIEW Instrument I/O Assistant
• Troubleshooting errors

Hardware & Software
Equipment
• Amulet LCD
• ATmega128 (microcontroller)
Software
• GEMstudio Pro (Amulet display software)
• Atmel Studio 6.1 (microcontroller software)
• LabVIEW 2014
42

43
Amulet LCD
• Serial Protocol
• UART
• Ascii
• 9600 bps baud rate
• Transmit specific protocol to access variables
• Microcontroller is master
• Initializes communication
• Amulet is slave
• Full Protocol- Responds only if Amulet receives valid message

44
Amulet LCD
• Internal RAM (IR) is memory on the Amulet.
• 256 byte variables
• 256 word variables (word = 2 bytes)
• 199 string variables
• Can receive 14 different command messages from microcontroller
• Can access internal RAM on Amulet
• Changing and copying variables
• Jump to different pages on display
• Draw pixel, line, or box
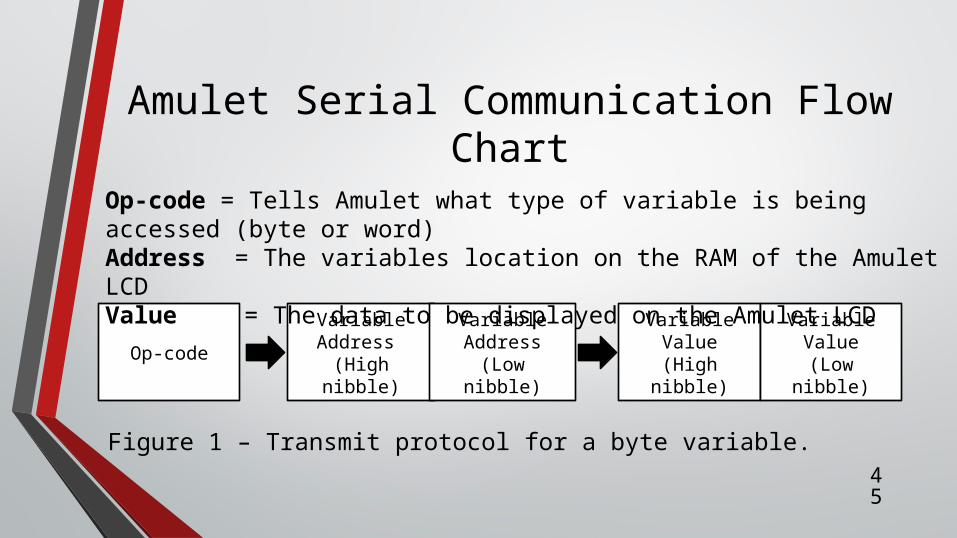
Amulet Serial Communication Flow Chart
Op-codeVariable Address
(High nibble)
Variable Address
(Low nibble)
Variable Value
(High nibble)
Variable Value
(Low nibble)
Op-code = Tells Amulet what type of variable is being accessed (byte or word)Address = The variables location on the RAM of the Amulet LCDValue = The data to be displayed on the Amulet LCD
Figure 1 – Transmit protocol for a byte variable.
45

46
Amulet Protocol AsciiExample: microcontroller sets internal RAM (IR) word variable to specific value (0x02C9)
Figure 3 – Serial communication flow chart

47
UART Transmit
• 1V per division
• 0.5ms per division
• Transmission contains:
{0x00, 0xD6, 0x31}
48
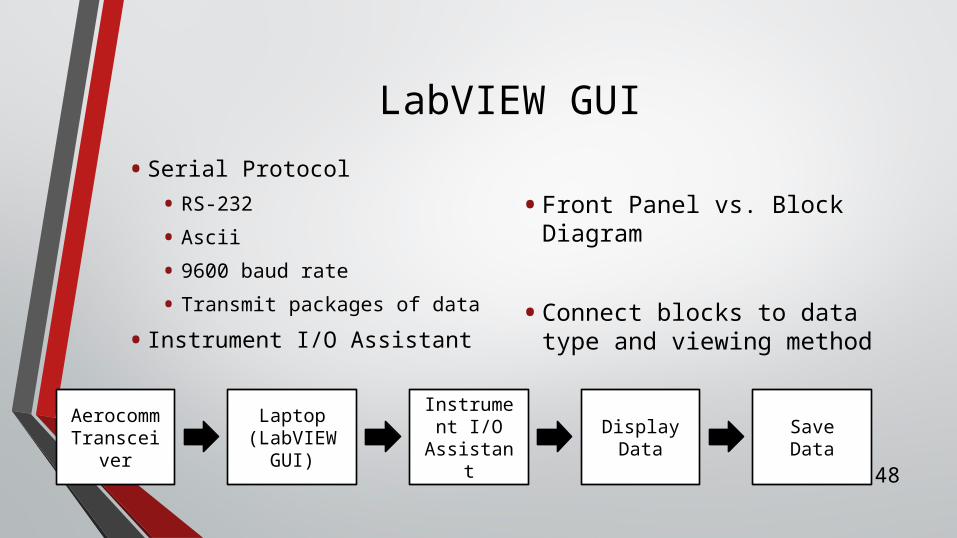
LabVIEW GUI
• Serial Protocol
• RS-232
• Ascii
• 9600 baud rate
• Transmit packages of data
• Instrument I/O Assistant
• Front Panel vs. Block Diagram
• Connect blocks to data type and viewing method
Aerocomm
Transceiver
Laptop(LabVIEW
GUI)
Instrument I/O
Assistant
Display Data
Save Data
49
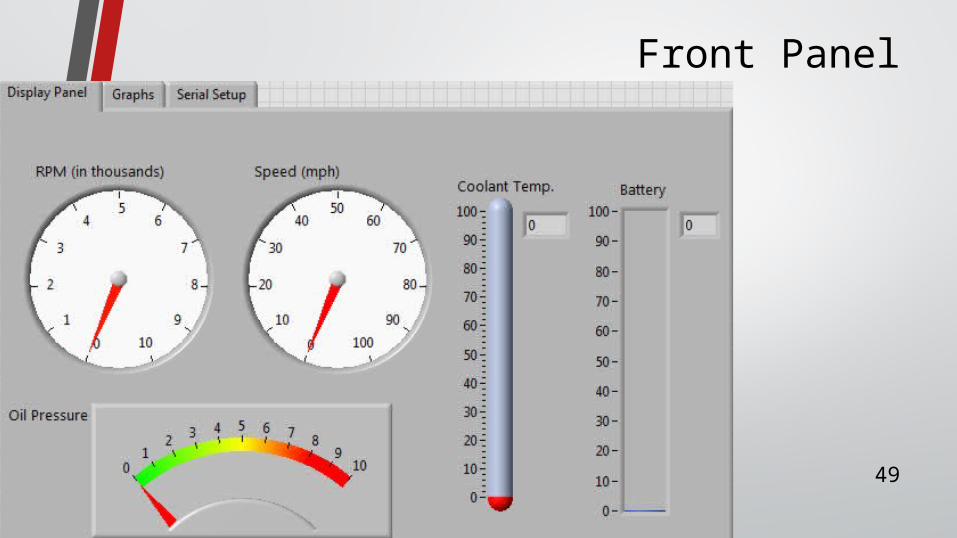
Front Panel

50
Serial Communication Setup

51
Block Diagram

52

53

54
Results
• Successful interface between ATmega128 and Amulet LCD
• Data sent and displayed on the Amulet LCD
• Successful interface between Aerocomm Transceiver and LabVIEW GUI
• Data sent and displayed on the LabVIEW GUI

55
Remaining Work
• LabVIEW
• Set up data log feature
• Connect data to graph results over time
• Simulations to test system (on LabVIEW and Amulet LCD)
• From function generator
• From sensors
• Hardware/Software Interface
• Power supply circuitry for Amulet

Questions?
56

Appendix
57

Initialization
58

ISR
59
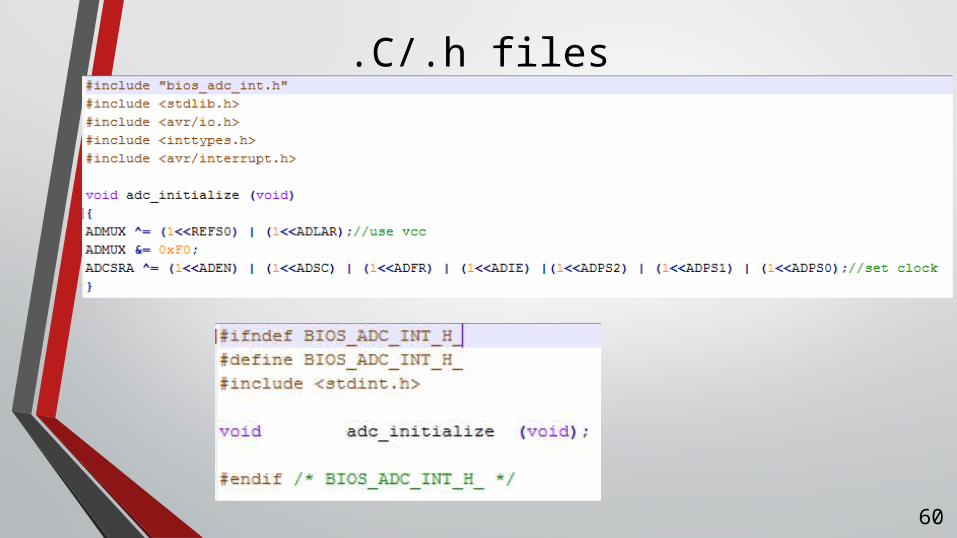
.C/.h files
60
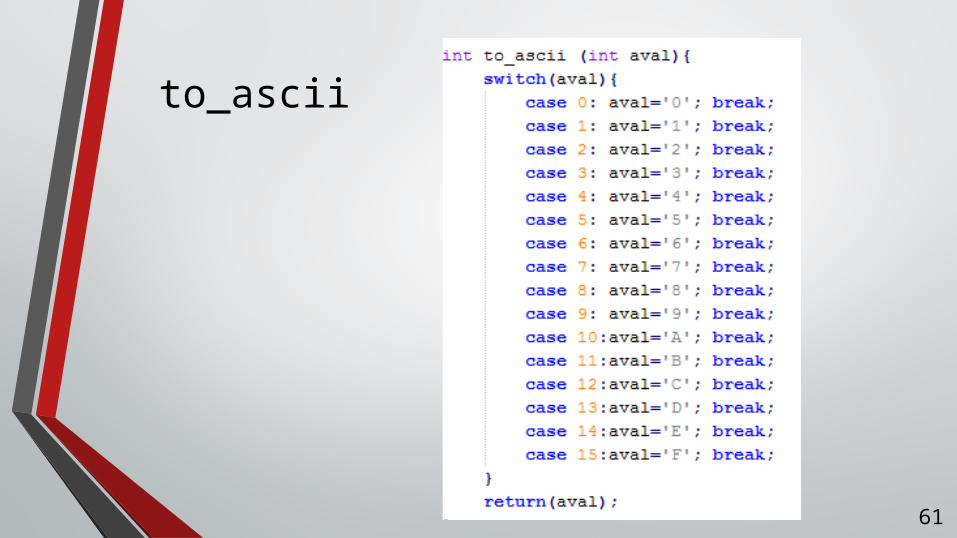
to_ascii
61

62
Current Date 2/24/15
ID Task Name Finish Duration % CompleteQ3 14 Q4 14 Q1 15 Q2 15
Sep Oct Nov Dec Jan Feb Mar Apr May
12
3
4
56
7
8
910111213
151617181920
100%10.4w11/7/2014RF Communication
100%3w9/17/2014Board to board communication
100%3w10/8/2014Board to HyperTerminal
100%3w10/29/2014Microcontroller to HyperTerminal
100%13.4w11/28/2014Amulet LCD GUI
100%2w9/10/2014Display setup
100%6w10/22/2014Display pseudo data
100%5w11/26/2014UART communication w/ microcontroller
90%4w12/12/2014LabVIEW off track GUI
80%15w2/27/2015HW/SW interface
100%0w11/20/2014Progress Presentation
30%3w3/2/2015Simulate values to test system
0%4w3/25/2015Install system to car
100%0w2/24/2015Progress Presentation
0%3w3/24/2015Final Testing
0%.8w3/31/2015Project Demonstration
0%0w4/9/2015Final Presentation
0%0w4/15/2015Student Expo
0%0w4/24/2015Poster Presentation to ECE board
0%.8w5/5/2015Final Report
14

63
Atmega128 Electrical CharacteristicsVcc = 3.3V

64
3.3V Logic Levels (TTL)
Voh – output highVih – input high
Vol – output lowVil – input low
Vcc – power supplyGnd - Ground

Amulet Ascii Transmit Protocol Example
MicrocontrollerSet Byte Variable
Amulet Response
MicrocontrollerSet Word Variable
Amulet Response
Figure 2 – Serial communication flow chart 65

66

67
UART Receive (Echo)
• 1V per division
• 1ms per division

68
UART Transmit/ECHO
Blue: TransmitPurple: Receive
1V per division
2.5ms per division

69

70