SAE Aero Design - The College of Engineering, Informatics ...
38
SAE Aero Design Final Report Ali Alqalaf, Jasem Alshammari, Dong Yang Cao, Darren Frankenberger, Steven Goettl, and John Santoro Team 16 Submitted towards partial fulfillment of the requirements for Mechanical Engineering Design II – Spring 2016 Department of Mechanical Engineering Northern Arizona University Flagstaff, AZ 86011
Transcript of SAE Aero Design - The College of Engineering, Informatics ...

SAE Aero Design
Final Report
Ali Alqalaf, Jasem Alshammari, Dong Yang Cao,
Darren Frankenberger, Steven Goettl, and John Santoro
Team 16
Submitted towards partial fulfillment of the requirements for Mechanical Engineering Design II – Spring 2016
Department of Mechanical Engineering
Northern Arizona University Flagstaff, AZ 86011

Table of Contents
1) Introduction……………………………………………………………………………....2
2) Problem Definition…………………………………………………………………….26
Need Statement……………………………………………………………………….2
Project Goals…………………………………………………………………………2
Objectives…………………………………………………………………………….3
Constraints…………………………………………………………………………36
3) Concept Generation…………………………………………………………………..719
4) Fabrication…………………………………………………………………………..2014
Wing……………………………………………………………………………..2021
Fuselage…………………………………………………………………………2122
Tail……………………………………………………………………………….222
5
Electronics……………………………………………………………………….2526
Difficulties……………………………………………………………………….262
7
5) Flight Calculations…………………………………………………………………..2728
6) Final Design……………………………………………………………………….....2931
7) Testing………………………………………………………………………………..3132
8) Bill of Materials………………………………………………………………………....33
9) Project Plan………………………………………………………………………….3435
10)Conclusions………………………………………………………………………...…....35
11)Acknowledgements……………………………………………………………………..36
12)References…………………………………………………………………………….....37
1

1) Introduction The SAE Aero Design Competition is an event that is held annually for college students.
Teams from all over the country gather and compete in three unique classes: Regular, Micro, and
Advanced. The capstone team is tasked by Dr. John Tester, NAU SAE Club advisor, with the
design and construction of an airplane that adheres to the requirements of the Regular class
competition. There are many constraints that the competition has to make the task complex and
difficult. The competition provides a chance for engineering students to learn something about
designing and building a product and having fun while doing it. Most learning has been done in
the classroom, so this project gives engineering students the chance to get hands on experience
which will help in the future for the engineering profession. This report includes the problem
definition, concept generation, fabrication, and testing of the aircraft.
2) Problem Definition
Need Statement Northern Arizona University does not have an airplane design to compete in the SAE
Aero design competition, so the team is tasked with the design and construction of the airplane.
Project Goals The goal of this project is to design and build an airplane that satisfies all SAE Aero
design competition requirements and bring it to competition. This project will be very
educational in the manufacturing process, as well as the design aspects that will be needed to
complete the airplane. Writing a report and orally presenting the final product is required, so the
team will compile an exceptional report and presentation detailing the design and manufacturing
processes.
2

Objectives Table 01. Objectives
Objective Measurement Unit of Measurement
Carry max payload Weight Force pounds (lb)
Carry a payload from point A
to B
Distance Feet (ft)
Small turning radius Distance Feet (ft)
Table 1 contains the objectives that the team has decided are critical for the project.
Carrying a max payload is important as the competition adheres to teams that can lift the most
weight. To complete a circuit and get a score in the competition, the payload must be moved
from one point to another. A small turning radius for the aircraft allows for faster circuit
completion resulting in a higher score in the competition.
Constraints
1. Aircraft Dimension Requirement
The dimension must not exceed 175 inches [1].
2. Material and Equipment Restrictions for Regular Class
The use of Fiber – Reinforced plastic (FRP) is not allowed, except in the motor mount,
propeller, landing gear and control linkage component. Also, not allowed is the use of rubber
bands to make the wing retain to fuselage. Furthermore, any types of gyroscopic or other
stability assistance are not allowed [1].
3. Aircraft System Requirements
The airplane requires the use of a electric single motor, gearboxes, belt drive systems,
and propeller shaft extensions are allowed in tow condition (onetoone propeller to motor RPM
should be maintained) and the prop(s) must rotate at motor RPM [1]. The battery should have: 6
3

cell (22.2 volt) Lithium Polymer (LiPoly/LiPo) battery pack. The minimum requirements for
LiPo battery are: 3000 mAh, 25c) and homemade batteries are prohibited [1]. A 2015 version
1000 watt power limiter from the SAE supplier is required and supplied by Neumoters.com [1].
For the radio system the battery should have a minimum capacity of 1000 mAh [1].
4. Payload Requirements
For the payload, the team will focus on the interior dimension and we must follow the
requirements in Table 2 [1].
Table 02. Length Width Height Tolerance For Payload Bay
Length Width Height Tolerance
10.00”
4.00” 4.00”
+ 0.125”, 0.000”
The airplane should have one or more removable access for the payload bay. The payload
interior surfaces have to be unbroken and smooth. The payload must also be secured to the
airframe, as well as contain payload plates. The only penetrations are allowed in the payload bay
surfaces is payload support assembly. The support assembly for the payload must be removable
and the bay will never considered as payload [1].
5. Other Requirements
The airplane must take off within a maximum distance of 200 ft. Likewise, the airplane
must land within a maximum distance of 200 ft. Also, the time to complete all aerial tasks must
be no more than 180 seconds [1].
4

6. Quality Function Deployment and House of Quality
In Table 3 below, compared are the regular class design requirements with engineering
requirements. These comparisons are given a score, then the engineering requirements are ranked
by importance. Safety, material and motor were found to be the most important.
Table 03. Quality Function Deployment
Regular Class Design Requirements Weights Size Safety Material Motor Gear Box Battery
Radio System
Interior Dimension
AIRCRAFT DIMENSION REQUIREMENT 5 9 1 0 0 1 0 0 9
MATERIAL AND EQUIPMENT
RESTRICTIONS FOR REGULAR CLASS
5 3 9 9 9 1 3 3 1
AIRCRAFT SYSTEM REQUIREMENTS 5 3 9 3 9 1 9 9 0
PAYLOAD REQUIREMENTS 5 3 3 9 3 1 3 0 9
Raw score 90 110 105 105 20 75 60 95
Scaled 1 1 1 1 1 1 1 1
Relative Weight 14% 17% 16% 16% 3% 11% 9% 14%
Rank 5 1 2 2 8 6 7 4
In the house of quality, Table 4 below, the team took the engineering requirements from the
Quality Function Deployment, Table 3, above to compare them with each other. The comparison
will help the team know which requirements are related with the others.
5

Table 04. House of Quality
6

7) Concept Generation
a. Airfoil
Table 05. Airfoil Weighted Decision Matrix
Decision Factors S1223 CH10 USA22 S1210
Criteria Wt. 1 2 4 5 Criteria Definition
Coefficient of Lift (max) 0.2 5 4 4 2 Coefficient of
Lift (max) The airfoil with the highest maximum lift
coefficient
Design Lift Coefficient 0.1 4 3 2 2 Design Lift
Coefficient The airfoil with the proper ideal or design lift
coefficient
Coefficient of Drag (min) 0.1 2 4 3 1 Coefficient of
Drag (min) The airfoil with the lowest minimum drag
coefficient
Lift to Drag Ratio 0.3 5 2 5 5 Lift to Drag Ratio The airfoil with the highest lifttodrag ratio
Lift Curve Slope (max) 0.1 5 5 1 3 Lift Curve
Slope (max) How much flexibility of site layout is possible
without CSS and PHP code
Pitching Moment Coefficient 0.1 4 2 2 2
Pitching Moment Coefficient
The airfoil with the lowest (closest to zero; negative or positive) pitching moment coefficient
Stall Quality 0.1 5 2 2 4 Stall Quality The proper stall quality in the stall region (the variation must be gentle, not sharp).
Weighted Scores 4.5 3.0 3.3 3.1
The decision matrix above compares airfoils.The team determined that the lift to drag
7

ratio was most important with the maximum coefficient of lift coming in a close second. This
was determined because the airfoil with best lift to drag ratio will be most effective for carrying a
payload. The highest coefficient of lift combined with the highest lift to drag ratio will give us
the best performing airfoil design. The airfoil the team chose based on the criteria was the S1223
airfoil. b. Sweep and Taper Wing Configuration
Table 06. Sweep and Taper Wing Configuration Weighted Decision Matrix Decision Factors RECTANGLE TAPER DELTA Which wing configuration do I use? Criteria Wt. 1 2 3 Criteria Definition Weight 0.2 3 4 3 Weight overall wing weight
loading 0.2 4 3 3 loading Eases and facilitates the loading and unloading of loads and cargo into and
out of cargo aircraft Coefficient of
Lift (max) 0.2 5 4 3
Coefficient of Lift (max)
The wing configuration with the highest maximum lift coefficient
Coefficient of Drag (min)
0.2 3 4 3 Coefficient of Drag (min)
The airfoil with the lowest minimum drag coefficient
Lift to Drag Ratio
0.2 5 4 4 Lift to Drag
Ratio The airfoil with the highest lifttodrag
ratio Weighted Scores 4.0 3.8 3.2
The criteria that were deemed most important for the sweep and taper of the wings were:
weight, loading, maximum coefficient of lift, minimum coefficient of drag, and lifttodrag ratio.
The rectangle beats out the other two designs as it as a higher lifttodrag ratio, higher maximum
coefficient of drag, and easier in loading and unloading.
8

c. Landing Gear Configuration
Table 07. Landing Gear Configuration Weighted Decision Matrix
Decision Factors Tail Dragger
Attached Below The Wing
Bars Attached To Fuselage
Parabolic Landing Support
Attached to Fuselage With Support Bar
Criteria Wt. 1 2 3 4 5 Weight 0.16 5 1 1 4 3
Strength 0.16 3 4 3 3 5 Coefficient
of Drag 0.16 5 1 2 4 2
Control 0.5 1 5 4 2 4 Weighted Scores 2.6 3.5 3.0 2.8 3.6
The decision matrix above compares different landing gear configurations. The team
decided that the control of the aircraft on the ground was the most critical criteria. This was
decided because the team wants to make sure the landing and takeoff will not be an issue at the
competition. The team’s advisor and mentor both told the team that other teams’ aircrafts had
9

crash landings which was the most common way for aircrafts to get eliminated. The criteria that
gave the attached to fuselage with a support bar the edge on the other designs, is the strength and
weight. These criterias are also critical because the strength is needed so that the landing gear
does not collapse while landing.
d. Fuselage Design
(From left to right Rectangular Prism, Cylindrical, Bar Design and Triangular Prism)
Table 08. Fuselage Design Weighted Decision Matrix
Decision Factors
Rectangular Prism Cylindrical Bar
Design Triangular Prism
Criteria Wt. 1 2 3 4 Criteria Definition
Weight 0.3 5 5 2 5 Weight Overall weight that the fuselage adds to the plane
Strength 0.3 4 2 3 5 Strength How much force the fuselage design can have exerting on
it before it breaks
Coefficient of Drag 0.3 4 5 2 3
Coefficient of Drag
The fuselage with the lowest minimum drag coefficient
Length 0.1 5 4 3 4 Length The shortest fuselage the plane can have
Weighted Scores 4.4 4.0 2.4 4.3
10

The fuselage is another critical design because it must keep drag to a minimum with also
be strong with the least amount of weight and length. The less length the fuselage has, the more
width we can give the wing which creates more lift. The strength, weight and coefficient of drag
are weighted more because those criteria will affect the flight of the aircraft more than the length
of the fuselage. The team decided that the length of the rectangular prism would be easier to
minimize than the triangular prism design, while keeping the strength of the fuselage as well.
The team also decided that the aircraft could get more volume with a rectangular prism which
makes loading and unloading the payload bay much easier. The coefficient of drag was also less
because the team believed the rectangular prism would have a more continuous airflow over the
fuselage when it joins with the horizontal and vertical stabilizers.
e. Vertical and Horizontal Stabilizers
Conventional Tail Ttail Dual Tail Triple Tail Twin Tail
11

Table 09. Vertical and Horizontal Stabilizers Decision Matrix
Decision Factors Conventiona
l Tail Ttail
Dual Tail
Triple Tail
Twin Tail
Criteria Wt. 1 2 3 4 5 Criteria Definition
Stability Coefficient
0.30 4 3 3 3 4 Stability Coeffici
ent
The higher the stability coefficient, the straighter the airplane will move
pitching control (up and down)
0.25 4 4 3 2 4
pitching control (up and down)
The horizontal stabilizer prevent up and down motion of the nose of the airplane
yaw control (right and left)
0.25 4 4 3 3 5
yaw control (right
and left)
The vertical stabilizer prevent the airplane from swinging side to side
Weight 0.20 4 4 3 2 3 Weight The weight of the tail
Weight Scores 4.0 3.7 3.0 2.6 4.1
The decision matrix above shows the design scores for vertical and horizontal stabilizers. The
stabilizers job is to pitch (up and down) and yaw (right and left) the airplane. The twin tail design wins
because it is more stable than most of the other tails. Furthermore, having two vertical stabilizers will help
in being more effective upon other tails in yawing. Also, the height is cut in half if one was to use just one
vertical stabilizer.
f. Wing Placement Configuration
(From left to right Monowing High Placement Monowing Low Placement Biplane)
12

Table 10. Wing Placement Configuration Weighted Decision Matrix
Decision Factors Monowing Low
Placement Monowing High Placement
Biplane
Criteria Wt. 1 2 3 Criteria Definition
Weight 0.1 5 4 2 Weight overall wing weight
Loading 0.1 4 5 3 loading Eases and facilitates the loading and unloading of loads and cargo into and out of cargo aircraft
Coefficient of Lift (max)
0.2 5 4 5 Coefficient of
Lift (max) The wing configuration with the highest maximum lift coefficient
Coefficient of Drag (min)
0.2 4 5 3 Coefficient of Drag (min)
The airfoil with the lowest minimum drag coefficient
Lift to Drag Ratio
0.4 4 5 2 Lift to Drag
Ratio The airfoil with the highest lifttodrag ratio
Weighted Scores 4.3 4.7 2.9
Based on the criteria, the top two designs were the monowing high and low placement.
Low placement beats the high wing placement slightly in weight and maximum coefficient of
lift. The high placement design beats out the low placement design, because it offers a smaller
coefficient of drag, higher lifttodrag ratio, and ease of loading.
g. Payload Configuration
13

Table 11. Payload Configuration Weighted Decision Matrix
Decision Factors Box w/ Hinged Lid
Spring Loaded Plates
Removable Center
Seam Box
Box w/ Sliding Lid
Criteria Wt. 1 2 3 4 Criteria Definition Payload (max) 0.15 3 3 3 3 Payload (max) Overall payload weight
Weight 0.40 3 2 1 4 Weight Total weight of configuration
Cost 0.30 2 1 3 2 Cost Cost of payload configuration material
Ease of Construction 0.15 4 1 3 4 Ease of
Construction Time required to construct
Weighted Scores 2.9 1.7 2.2 3.3
Shown above are the payload configuration design concepts. Also above, is the decision
matrix for the payload configuration. The payload configuration holds the payload in place in the
fuselage. In terms of criteria, weight was deemed the most important, followed by cost, and
payload and ease of construction. Design option 1 and design option 4 were the two highest
ranking designs. Design option 4, the box with the sliding lid as it slightly edged option 1 in
regards to weight and cost.
14
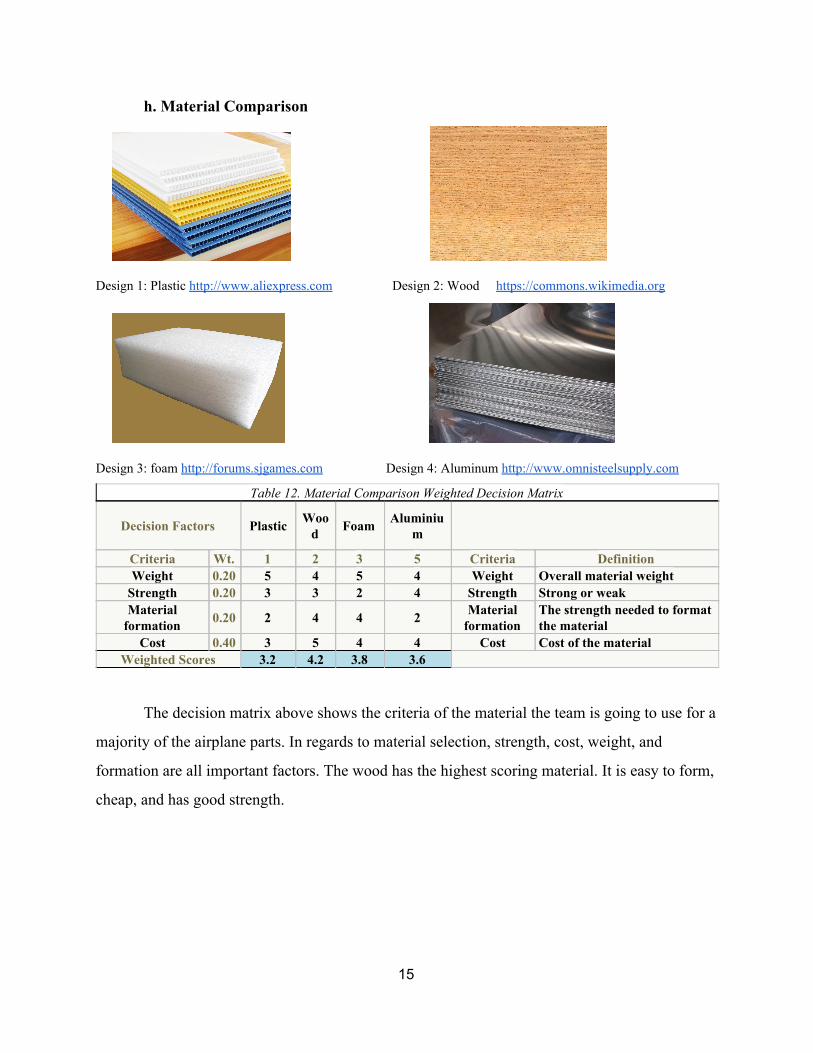
h. Material Comparison
Design 1: Plastic http://www.aliexpress.com Design 2: Wood https://commons.wikimedia.org
Design 3: foam http://forums.sjgames.com Design 4: Aluminum http://www.omnisteelsupply.com Table 12. Material Comparison Weighted Decision Matrix
Decision Factors Plastic Wood
Foam
Aluminium
Criteria Wt. 1 2 3 5 Criteria Definition Weight 0.20 5 4 5 4 Weight Overall material weight Strength 0.20 3 3 2 4 Strength Strong or weak Material formation 0.20 2 4 4 2 Material
formation The strength needed to format the material
Cost 0.40 3 5 4 4 Cost Cost of the material Weighted Scores 3.2 4.2 3.8 3.6
The decision matrix above shows the criteria of the material the team is going to use for a
majority of the airplane parts. In regards to material selection, strength, cost, weight, and
formation are all important factors. The wood has the highest scoring material. It is easy to form,
cheap, and has good strength.
15

i. Receiver
design 1, 2, 3: www.spektrumrc.com
Table 13. Receiver Weighted Decision Matrix
Decision Factors
4 Channel Aircraft Receiver
6 Channel Aircraft Receiver
7 Channel Aircraft Receiver
Criteria Wt. 1 2 3 Criteria Definition
weight 0.3 5 5 0 weight
The receiver with the minimum weight
loading 0.2 3 3 2 loading
The receiver with minimum loading
time period recorded 0.2 5 5 5
time period recorded
The receiver with the suitable time period recorded
altitude recorded 0.2 4 5 4 altitude
recorded The receiver with the expected altitude recorded
Quality 0.1 5 4 5 Quality
The receiver should be with the best quality
Weighted Scores 4.2 4.3 2.5
The decision matrix above compares different aircraft receivers. The team decided that
the most important criteria is the weight of the receiver, with loading time period recorded,
altitude recorded and quality following. Based on these criteria and the scorings, the team used a
6 channel aircraft receiver.
16

j. Transmitter
design 4, 5, 6: www.spektrumrc.com
Table 14. Transmitter Configuration Weighted Decision Matrix
Decision Factors
5 channel Transmitte
r 6 channel transmitter
7 channel transmitte
r Which transmitter do I use? Criteria Wt. 1 2 4 Criteria Definition Weight 0.2 4 1 5 Weight overall transmitter weight
loading 0.3 2 0 0 loading transmitter loading should be as small as possible
attenuate transmit signal 0.2 5 3 3
attenuate transmit
signal
the transmitter should transmit suitable signal to the radio station
gains 0.1 5 5 5 gains the ability of gaining signals losses 0.2 3 4 1 losses the ability of losses signals
Weighted Scores 3.5 2.1 2.3
This decision matrix above compares transmitters. Weight, loading, signal, gains, and losses are
all important criteria when choosing a transmitter. Based on the criteria, and their relative
weights, the team used a 5 channel transmitter.
k. Servo
17

Table 15. Servo Decision Matrix
Decision Factors Standard servo
RC servo
high power servo
Criteria Wt. 1 2 3 Criteria Definition
Torque coefficient
0.3 3 0 5 Torque
coefficient The higher the torque coefficient the better the servo is
Speed 0.2 3 3 5 Speed The faster the speed is the butter servo Size 0.2 0 0 4 Size to fit the plane
Voltage 0.3 0 3 5 Voltage higher the voltage leads to faster servo movement and more power
Weighted Scores 1.5 1.5 4.8
In the decision matrix for the servo shown are the different criteria: torque coefficient,
speed, size, and voltage. Also shown are the design concepts. From there, the team chose the
torque coefficient and the size are the criteria that were to be focused on because the torque
coefficient will decide how powerful the handling will be and for the size the team is committed
to certain area specialty with the wing.
l. Speed Controller
Table 16. Speed Controller Decision Matrix
Decision Factors ESC:B500 3D/X
ESC,EC5 (V2)
12S MAX HEAVY DUTY
BEC
Criteria Wt. 1 2 3 Criteria Definition voltage
coefficient 0.3 0 3 5
voltage coefficient
coefficient of receiver battery
current coefficient
0.2 5 0 3 current
coefficient the larger the current coefficient the more power can handle
speed stability
0.3 0 3 5 speed
stability control force to hold the airplane in certain
speed option 0.2 5 5 5 speed option to have the the variety of speed Weighted Scores
2.0 2.8 4.6
18

The criteria chosen for the speed controller are: voltage coefficient, current coefficient,
speed stability, and speed option. The speed stability was deemed to be the most important
criteria, as it assists in controlling the airplane. Based on the decided criteria and weights, the
determined speed controller that the team will use is a 12S max heavy duty BEC. m. Motor Size
Table 17. Motor Size Weighted Decision Matrix
Decision Factors Brushed Brushless Which wing configuration do I use? Criteria Wt. 1 2 Criteria Definition
Weight 0.10 3 4 Weight Overall weight that the motor adds to the plane
Thrust 0.30 3 5 Thrust The amount of reaction force that the motor can create using the propeller
Thrust to Weight Ratio
0.40 4 4 Thrust to Weight
Ratio The ratio between how much weight the motor adds to how much thrust it creates
Control 0.20 3 4 Control How easy the pilot can control the plane's speed
Weighted Scores 3.4 4.3
The brushless motor is necessary because the control and thrust to weight ratio are better
than the brushed motor. The brushed motor just does not produce enough control or thrust which
makes the brushless motor much better for the aircraft. The brushless motor is significantly more
efficient than the brushed motor and that is why is performed better in the decision matrix.
4) Fabrication
19

Wing
Figure 01. Final Wing Design
Figure 02. Center Piece of Wing
The wing has a specific rib shape to create the most lift with minimal speeds, which are
20

the conditions our plane will be flying with in the competition. The design that we decided to go
with is the S1223 airfoil. This design is specific to the SAE competition for lifting a lot of weight
without moving at high speeds. The team decided to max out the length of the wing to try and
carry a payload of twenty pounds. Our final product for the wing comes out to be 99 inches. The
wing will carry all of the payload weight which gives us the ability to make the fuselage lighter
than normal. The center structure is 3D printed with ABS plastic to ensure the strength that will
be needed to hold the weight of the payload. The final wing design gets the most lift that can be
obtained with the speeds that plane will be flying at.
Fuselage
Figure 03. Final Fuselage Design
The team decided to go with a rectangular prism design instead of using a bar tail or a
cylindrical shaped fuselage. The team decided to use birch sheets of wood to build the fuselage
with. The team laser cut the pieces and implemented a notched design to help make the
construction more efficient. The notch design made each piece line up with each other perfectly
just like a puzzle piece. These notches also allowed for better contact surfaces for the glue to
21

adhere to. This fuselage is hollow which makes the plane a lot less lighter than alternate designs
for a fuselage. The final design is lighter than alternate fuselage designs, which allows the plane
to handle carrying more weight for the competition which will result in the team’s success in
competition.
Tail
Figure 04. Tail Design
Above is the tail design for our airplane on solid works. This twin tail design will be
attached by super gluing the wooden parts, while attaching the aluminum pipe by washers in
each side and put a screw through it.
22

Figure 05. Tail design views
The figure above shows the front, top, and right view for our tail design.
Figure 06. Tail design
23

The figure above shows that each part of the vertical and horizontal stabilizer moves each way,
up, and down, and right and left.
Figure 07. Tail Construction
The figure above shows the construction of the tail. The right two pieces are the
horizontal stabilizer, and the two left pieces are the vertical stabilizer. As shown six rips are used
for the horizontal stabilizer and four for the vertical.
Figure 08. Tail Monokote
The figure above shows the processing of applying monokote the stabilizers.
24

Figure 09. Finalized Tail Construction
The figure above shows the finalized construction of the stabilizers. The stabilizers will be
attached to the fuselage.
Electronics
Figure 10. Functional Diagram
Shown above is the functional diagram for the electrical components of the aircraft. Red
wires are positive, and black wires are negative. Blue wires denote servo wires. The battery is
connected to the electronic speed control (ESC), which is then connected to the motor with a
variable controller allowing for different power settings. The arming plug is connected to the
battery as well, providing a killswitch. This is required by competition rules. Also wired to the
25

battery is the battery eliminator circuit (BEC). Connected to the BEC is the receiver via a servo
wire. This eliminates the need for a separate battery for the receiver. Configured to the receiver
are the servos connected to the different control surfaces. The rudder servo and nose gear servo
are connected via a yharness, and one will be reversed giving the proper control to the user.
There will be one elevator servo and two aileron servos connected to the receiver as well via a
yharness. Finally, the receiver is configured to the transmitter wirelessly via a 2.4 Ghz signal.
Figure 11 Figure 12 Figure 13
Shown above are a few examples of the electronics implemented in the final design.
Illustrated in Figure 8 is a servo mounted to the wing. Connecting the electronics required a lot
of soldering, shown in Figure 9. Figure 10 shows the propeller attached to the motor mounted to
the nose of the fuselage.
Difficulties The team ran into many obstacles throughout the fabrication of the plane. Most of the
obstacles that we came across were simply buying things like nuts, washers, bolts, glue, sticks
and balsa sheeting to complete the components in the best manner possible. One of the biggest
difficulties that the team ran into was the monokote that needed to be put on every external
surface of the plane. The monokote process takes very delicate work. The sheets need to be
ironed on to each of the contact points of the exterior surfaces on the plane. This process is
tedious and needs to be done with delicacy in order for the monokote to be able to shrink to a
tight fit. The monokote must be a tight fit in order for the air to flow as smooth as possible
preventing turbulence. While heating the monokote with a heat gun to make it shrink, it is very
26

easy to put a hole in the surface. The monokote also needed more surface area to stick to than the
team had anticipated. To move past this obstacle with a good final product on the wing,
horizontal stabilizer and vertical stabilizer the team glued on balsa sheeting along the edges of
each of the components. This resulted in much tighter fit monokote which will in the end make
the plane flights go much smoother.
5) Flight Calculations
Figure 14. Flight calculation inputs.
Above is the inputted information into the online calculator that solves for the performance of
the aircraft with the selected final components.
Figure 15. Flight calculation results
27
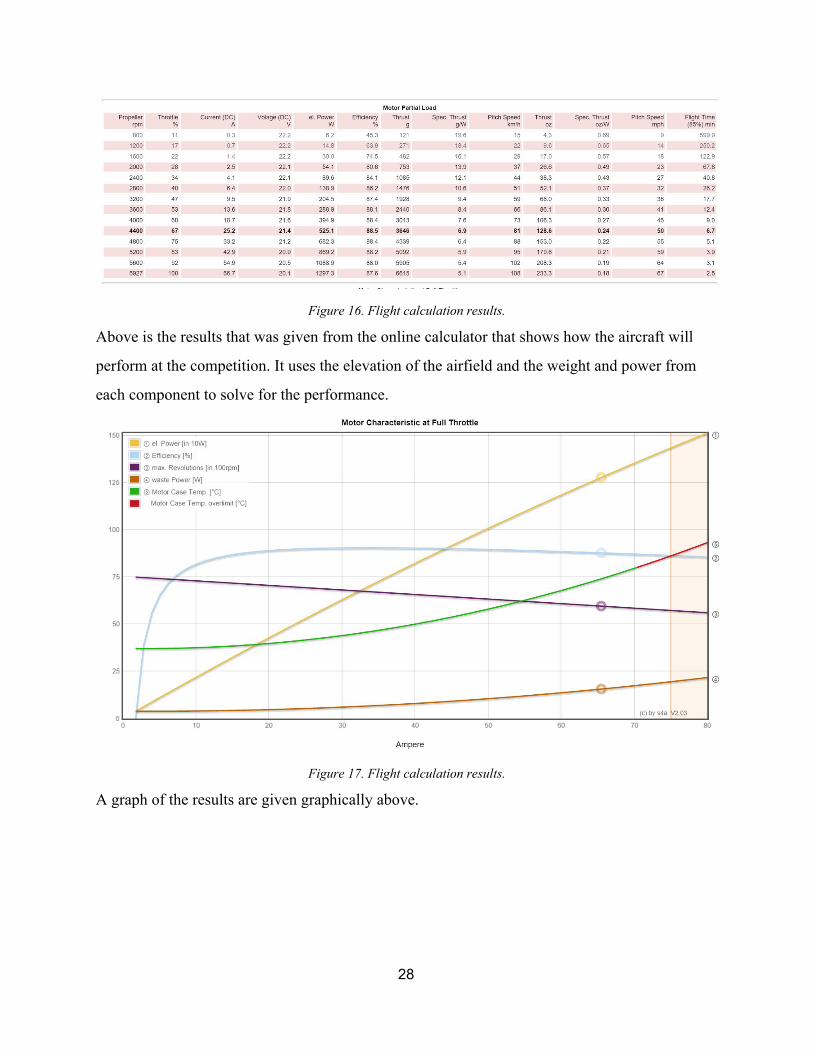
Figure 16. Flight calculation results.
Above is the results that was given from the online calculator that shows how the aircraft will
perform at the competition. It uses the elevation of the airfield and the weight and power from
each component to solve for the performance.
Figure 17. Flight calculation results.
A graph of the results are given graphically above.
28

6) Final Design
The final design and fabrication of the aircraft has the dimensions of 99” wingspan by
55” fuselage length by 19” tall to the tip of the vertical stabilator. The total combined linear
dimensions of the aircraft is 173”. This is just 2” short of the 175” dimension constraint. The
aircraft features heavy duty aluminum tricycle landing gear able to absorb the high stress of
landing with a payload. Attached to the landing gear are 4” tubeless rubber tires on high strength
plastic wheels. The aircraft features unique control surfaces utilizing a stabilator design approach
which provides more control than traditional control surface designs. Mounted on the front of the
aircraft is a 22.2 volt dc motor with a 18” diameter propeller attached to it. The figures below
show the aircraft after the fabrication phase.
Figure 14. Final Design North West Isometric
Figure 15. Final Design North Isometric
29

Figure 16. Final Design North East Isometric
In addition, the team made multiple modifications to the final prototype. Currently, the
team’s motor has its coil exposed to the air. During flight, this exposure could lead to moisture or
debris interfering with the motor causing a malfunction. To prevent this from happening, a
cowling will be added to cover the motor. The cowling will be designed and manufactured using
rapid prototyping. Secondly, the vertical stabilizers in the current design are subject to a small
amount of deflection. To fix this, a small bar will be added to the vertical stabilizers to achieve
more stability and control. Thirdly, the nose gear servo needs adjustment, as a reverse servo is
required for the current design. Finally, in the current design, the aircraft’s center of gravity lies
at about a half chord. To achieve balance, an aircraft’s center of gravity needs to lie at a quarter
chord from the leading edge of the wing. The team will accomplish this by moving internal
electrical components towards the front of the airplane’s fuselage. Also, the insertion of payload
plates will help the team obtain a more desirable center of gravity. Shown in Figure 17 below is
the team’s final prototype with the modifications added.
30

Figure 17. Final Prototype with modifications.
7) Testing To test the aircraft we followed the competition objectives. The team was going to have
the plane take off and land within the same 200 feet of runway and fly a 360 degree degree turn
in order to complete these objectives. From start to finish the pilot had 3 minutes to finish the
entire process.
During the testing the team had to make some on the scene modifications to ensure the
test could be done. A modification that the team had to make was adding size to the front tire so
that the propeller would not hit the ground while taking off and landing. The team did this by
adding material around the tire continuously all around the tire. This was a necessary fix because
when the propeller would hit the ground the plane would naturally start to turn. This fixed the
team’s problem and allowed for effective testing of the plane.
The testing of the aircraft ended in a crash. The team evaluated the testing videos and the
plane after the crash carefully. The team concluded that the aileron horn lost connection to the
aileron itself resulting in a loss of a critical control surface to the plane. The pilot had no way of
getting the plane back into control without this feature on the plane. This caused the plane to dip
and weave out of control to an inevitable nose dive into the ground. The test had poor results but
the team was still able to get useful information that can help modify future manufacturing
process of a plane. Figure 18 below illustrates the testing result.
31

Figure 18. Testing Result
32

8) Bill of Materials Table 18. Bill of Materials
Table 5 above shows the bill of materials for the team’s aircraft. The motor, battery,
ESC/BEC (Electronic Speed Control/Battery Eliminator Circuit), balsa, and ABS plastic take up
the bulk of the airplane costs. The receiver and servos also add a significant amount of cost.
Funds will be received from NAU SAE, specifically for the ABS. The ABS threedimensional
print is needed for the center of our wing because it must be one solid piece to have the amount
of strength that needed to support the weight of the aircraft. The landing gear, motor mount, and
aluminum sheeting will all be machined. The arming plug and power limiter are specified SAE
competition requirements.
33

9) Project Plan Tables 19 and 20 below show the project plan that the SAE Aero team followed
throughout the year.
Table 19. Project Plan 1st Semester
34

Table 20.. Project Plan 2nd Semester.
10) Conclusions
The SAE Aero design team was tasked by Dr. John Tester to design and build an RC
aircraft for the SAE Aero Regular class competition. The team constructed the aircraft, which
fulfilled all design constraints and objectives. The majority of airplane was constructed out of
birch wood and rapid prototyped components. Testing resulted in loss of the aircraft and revealed
design flaws in the connections of the control surfaces. These flaws will be rectified in future
iterations of the aircraft. Overall, the team gained invaluable knowledge in the mechanical
engineering design process, which will be demonstrated in industry for years to come.
35

11) Acknowledgements
Dr. Srinivas Kosaraju Capstone Advisor
Dr. John Tester
Technical Advisor NAU Mechanical Engineering Department
Machine shop Provided many materials/components of the aircraft
Mr. Craig Howdeshell, Coconino High School
Provided use of wood laser cutter Mr. Seth Lawrence
Technical Advisor
36

12) References [1] WhatWhenHow, “Tail design”, Conventional Tail, Ttail, Dual Tail, Triple Tail and Twin Tail. Available: whatwhenhow.com.
[2] National Aeronautics and Space Administration, ”structures and materials”, aircraft background, P34.
[3] P. J. Pritchard, Introduction to Fluid Mechanics 8th Edition. Fox and McDonald. Wiley, 2011.
[4] M. H. Sadraey, Aircraft design: a systems engineering approach. Hoboken, New Jersey: Wiley, 2012.
[5] “Airfoil Tools,” Airfoil Tools. [Online]. Available at: http://airfoiltools.com/. [Accessed: 2015].
[6] Flight calculations. Ecalc Calc for Airplanes. [Online]. Available at: http://www.ecalc.ch/
37