SACO RIVER AND CAMP ELLIS BEACH SECTION 111 SHORE ...
200
SACO RIVER AND CAMP ELLIS BEACH SECTION 111 SHORE DAMAGE MITIGATION STUDY APPENDIX H REMOTE SENSING ARCHAEOLOGY SURVEY FINAL TECHNICAL REPORT
Transcript of SACO RIVER AND CAMP ELLIS BEACH SECTION 111 SHORE ...

SACO RIVER AND CAMP ELLIS BEACH
SECTION 111 SHORE DAMAGE MITIGATION STUDY
APPENDIX H
REMOTE SENSING ARCHAEOLOGY SURVEY FINAL TECHNICAL REPORT


FINAL TECHNICAL REPORT
REMOTE SENSING ARCHAEOLOGICAL SURVEY
Camp Ellis Beach Saco, Maine
Contract No. W912WJ-09-D-0001-0019
Prepared For: United States Army Corps of Engineers New England District 696 Virginia Road Concord, MA 01742 Prepared By: Fathom Research, LLC 1213 Purchase Street, Ste 315 New Bedford, MA 02740
For: Woods Hole Group, Inc. 81 Technology Park Drive East Falmouth, MA 02536
And: The Public Archaeology Laboratory, Inc. 210 Lonsdale Avenue Pawtucket, RI 02860 July 2010

This page intentionally left blank

FINAL TECHNICAL REPORT
REMOTE SENSING ARCHAEOLOGICAL SURVEY
CAMP ELLIS BEACH
Saco, Maine
Prepared by:
David S. Robinson, M.A., R.P.A. Principal Investigator
Fathom Research, LLC
1213 Purchase Street, Suite 315 New Bedford, Massachusetts 02740
Submitted to:
The Public Archaeology Laboratory, Inc. 210 Lonsdale Avenue
Pawtucket, Rhode Island 02860
Woods Hole Group, Inc. 81 Technology Park Drive
East Falmouth, Massachusetts 02536
Prepared for:
U.S. Army Corps of Engineers, New England District 696 Virginia Road
Concord, Massachusetts 01742-2751
May 2010


MANAGEMENT ABSTRACT A systematic remote sensing archaeological survey was performed in November 2009 for the U.S. Army Corps of Engineers, New England District’s proposed nearshore breakwaters and jetty-spur project study area at Camp Ellis Beach, Saco, in York County, Maine. The investigation involved archival research, field survey to record marine geophysical and geotechnical data, and analysis and synthesis of the research and survey results to assess the Project study area’s archaeological sensitivity and to determine the presence/absence of prehistoric and historic period submerged archaeological deposits within it. The survey was authorized and conducted under contract with the U.S. Army Corps of Engineers, New England District to comply with Section 106 of the National Historic Preservation Act of 1966 as amended (1976, 1980, 1992, 1999) (36 CFR 800). Performance of the remote sensing archaeological reconnaissance survey resulted in the conclusions that Project study area:
possesses a low archaeological sensitivity for containing contextually intact formerly terrestrial and/or maritime-related submerged prehistoric archaeological deposits and a moderate archaeological sensitivity for containing submerged historic archaeological deposits, although contains no previously identified National Register-eligible or listed prehistoric or historic archaeological properties;
contains no remote sensingl or geotechnical evidence of contextually intact paleosols with
prehistoric archaeological sensitivity and: contains no remote sensing evidence of submerged historic period shipwrecks or maritime
infrastructure. Based on the results of this study, no further archaeological investigation of the offshore portion of the proposed Camp Ellis Beach nearshore breakwaters and jetty-spur project area is recommended.
H-i

TABLE OF CONTENTS 1 INTRODUCTION.................................................................................................................................... 6
Scope......................................................................................................................................................... 6 Authority ................................................................................................................................................... 6 Project Description.................................................................................................................................... 7 Nature of Study ......................................................................................................................................... 7 Project Personnel....................................................................................................................................... 7 Disposition of Project Materials ............................................................................................................... 8
2 METHODOLOGY .................................................................................................................................. 9
3 ENVIRONMENTAL CONTEXT ........................................................................................................ 14 Bedrock Geology .................................................................................................................................... 15 Surficial Geology .................................................................................................................................... 15 Marine Transgression and Site Preservation........................................................................................... 17 Post-Glacial Environmental Conditions and Human Settlement Patterns .............................................. 18
4 CULTURAL CONTEXT ...................................................................................................................... 20
Prehistoric Period Culture History .......................................................................................................... 20 Paleoindian Period (11,500-9500 B.P.) .............................................................................................. 20 Archaic Period (9500-3000 B.P.)........................................................................................................ 22 Ceramic Period (3000-450 B.P.)......................................................................................................... 27
Historic Period Culture History .............................................................................................................. 28 5 RESULTS AND RECOMMENDATIONS.......................................................................................... 36
Archival Research Results ...................................................................................................................... 36 Prehistoric Archaeological Sensitivity................................................................................................ 36 Historic Archaeological Sensitivity .................................................................................................... 36
Archaeological Field Survey Results ...................................................................................................... 37 Geotechnical Data Review Results ......................................................................................................... 37 Recommendations................................................................................................................................... 38
BIBLIOGRAPHY..................................................................................................................................... 39 FIGURES APPENDICES
A PROJECT SCOPE-OF-WORK B CRE SURVEY REPORT C INVENTORY OF SIDE-SCAN SONAR ANOMALIES
D INVENTORY OF MAGNETIC ANOMALIES E GEI GEOTECHNICAL BORINGS DATA
H-ii

LIST OF TABLES
Table 2-1. Camp Ellis Beach Survey Area Corner Point Coordinates............................................... 10 Table 4-1. Maine’s Comprehensive Planning Prehistoric Period Archaeology Study Units ............. 21
H-iii

LIST OF FIGURES
Figure 1-1. General location of the Camp Ellis Beach project area within the State of Maine (source:
Fathom 2010). Figure 3-1. Excerpt of USGS quadrangle map showing Camp Ellis Beach project survey area
location at the mouth of the Saco River, Saco, Maine (source: Fathom 2010). Figure 3-2. Approximate limit of the marine invasion of land following the recession of the
Wisconsin glaciations (source: Kendall 1996:33). Figure 3-3. Relative sea-level curve for the coast of Maine for the last 14,000 years (source: Crock et
al. 1993). Figure 4-1. Samuel de Champlain’s 1605 map showing a Native American settlement at the mouth of
the Saco River, Saco, Maine (source: Bourque 2001:116). Figure 4-2. Map of native tribal territories and European trading posts and settlements 1620-1676
(source: Bourque 2001:130). Figure 4-3. Map of the original landholdings of the Saco settlement along the east bank of the Saco
River during the early eighteenth century (source: Owen 1891). Figure 5-1. Bathymetric contours (0.5 ft contour interval) as recorded within the Camp Ellis Beach
project survey area (source: CRE 2009). Figure 5-2. Side-scan sonar mosaic with inventoried side-scan sonar anomalies and NAE’s proposed
breakwater and jetty-spur structures (source: CRE 2009). Figure 5-3. Sunken modern geotechnical boring drill-barge and displaced drill bits within the Camp
Ellis Beach project survey area (source: NAE 2009). Figure 5-4. Ambient magnetic field strength, survey vessel track lines, side-scan sonar and
magnetometer anomaly locations and the NAE’s proposed breakwater and jetty-spur structures (source: CRE 2009).
Figure 5-5. Contoured acoustic basement depths (2 ft contour interval) as recorded along sub-bottom
profile transects “A” and “B” where substantial acoustic penetration was achieved with the 10 kHz sub-bottom profiler (source: CRE 2009).
Figure 5-6. Representative examples of 10 kHz sub-bottom profiles recorded in the Camp Ellis
Beach project survey area (source: CRE 2009).
H-iv

CHAPTER ONE
INTRODUCTION This report presents the results of a remote sensing marine archaeological survey of the U.S. Army Corps of Engineers, New England District’s (NAE) proposed nearshore breakwaters and jetty-spur project study area at Camp Ellis Beach, Saco, in York County, Maine (Figure 1-1). The NAE plans to install the breakwaters and jetty-spur as part of a Section 111 (Mitigation of Damages Caused by Federal Navigation Projects) NAE study. Marine archaeological survey work was conducted within the proposed study area to identify and document any remote sensing target areas with potential to be historic period archaeological deposits (e.g. the remains of abandoned historic vessels or coastal infrastructure) or intact paleosols with archaeological sensitivity for containing prehistoric archaeological deposits (e.g., formerly terrestrial ancient Native American habitation sites inundated by post-glacial sea level rise, watercraft and coastal infrastructure). The archaeological survey was conducted by Fathom Research, LLC, (Fathom), under a sub-consultant’s contract with the Public Archaeology Laboratory, Inc. (PAL), in conjunction with project surveyors, CR Environmental, Inc. (CRE). Fathom, PAL, and CRE’s work on the project was performed in support of the Woods Hole Group, Inc. (WHG)’s and their environmental services contract with the NAE. The project was conducted in accordance with NAE’s project Scope-of-Work (SOW) and the approved work and safety plans for the investigation. Scope As a federal undertaking, the NAE’s proposed breakwater and jetty-spur installation project is subject to review under Section 106 of the National Historic Preservation Act (NHPA) of 1966 as amended (1976, 1980, 1992, 1999) (36 CFR 800). Section 106 requires all federal agencies take into account the effect of their undertaking on cultural resources listed or determined eligible for listing in the National Register of Historic Places (National Register) (36 CFR 60). The agency must also afford the Advisory Council on Historic Preservation the opportunity to comment on the undertaking. The Section 106 process is coordinated at the state level by the State Historic Preservation Office (SHPO), which in Maine operates within the offices of the Maine Historic Preservation Commission (MHPC). The scope of the archaeological investigations (Appendix A) included archival research, fieldwork consisting of a marine geophysical survey utilizing a magnetometer, side-scan sonar, a sub-bottom profiler, and a single-beam fathometer, and review of geotechnical (boring) data provided by the NAE. The fieldwork and report assist NAE in complying with Section 106 of the NHPA for the proposed project. The report is also a scholarly document that fulfills the mandated legal requirements and serves as a scientific reference and planning tool for future professional studies. Authority The survey was authorized by NAE to comply with the National Historic Preservation Act of 1966 (P.L. 89-665; 80 Stat. 915) as amended (16 U.S.C. 470 et seq.); the National Environmental Policy Act of 1969 (P.L. 91-190; 83 Stat. 852; 42 U.S.C. 4321 et seq.); the Archaeological Resources Protection Act of 1979 (P.L. 96-95; 93 Stat. 721; 16 U.S.C. 470 et seq.); the Abandoned Shipwreck Act of 1987 (P.L. 100-298; 102 Stat. 432; 43 U.S.C. 2102); the National Maritime Heritage Act of 1994 (P.L. 103-451; 108 Stat. 4769; 16 U.S.C. 5401); the Advisory Council on Historic Preservation, Protection of Historic Properties (36 CFR 800); the National Register of Historic Places, Nominations by States and Federal Agencies (36 CFR Part 60); and the U.S. Army Corps of Engineers’ Regulations ER 1105-2-50, Planning,
H-1

Environmental Resources, Chapter 3, Historic Preservation; the Secretary of the Interior’s Standards and Guidelines for Identification (1983); the MHPC’s Contract Archaeology Guidelines; and the Maine Department of Educational and Cultural Services State Historic Preservation Officer’s Standards for Archaeological Work in Maine (27 MRSA S.509). The remote sensing archaeological survey was performed following the requirements of the NAE’s Project SOW in consultation with the historic and prehistoric state archaeologists at the MHPC. No state permit was required to conduct the non-disturbance remote sensing survey. All fieldwork was conducted in accordance with the Accident Prevention Plan (APP) and the Activity Hazards Analyses (AHA) prepared by WHG for the project. Both the APP and AHA were approved by the NAE Safety Office prior to commencement of field activities, as per the requirements of the USACE’s Safety and Health Requirements Manual (EM 385-1-1 15 Sept 2008). Project Description Camp Ellis Beach is situated in southeastern Maine, in York County, within the town of Saco, approximately 16 miles (mi) (25.7 kilometers [km]) south of Portland. The Saco River Federal Navigation Project consists of an 8-foot (ft) (2.4-meter [m]) deep channel that varies from 100 to 200 ft (30.5 to 61 m) wide. The channel is protected by a 4,800-ft (1463-m) long jetty to the south and a 6,600-ft (2011-m) long jetty to the north. Camp Ellis Beach lies adjacent to the north jetty and extends about 2,500 ft (762 m) north to Ferry Beach. Installation of the navigation channel jetties has resulted in an increased rate of erosion of Camp Ellis Beach. The proposed installation of the breakwaters and jetty-spur are intended to mitigate this erosion. Nature of Study Fathom and project surveyors, CRE, conducted a remote sensing marine archaeological survey to identify and document any remote sensing target areas with potential to be prehistoric or historic period vessel remains or infrastructure, as well as any sub-bottom profiler reflectors suggestive of intact paleosols with prehistoric period archaeological sensitivity. The archaeological tasks performed for the investigation consisted of archival research, marine remote sensing field survey, and a review of geotechnical data (i.e., core logs) provided by the NAE. Archival research involved a review of primary and secondary documents needed to prepare environmental and historical context narratives of the survey area. The field investigation consisted of vessel-based marine archaeological survey using a towed and hull-mounted array of remote sensing instruments to document potential cultural features on and under the harbor floor, in accordance with the field methodology required by the NAE SOW. The archival research and fieldwork were designed to collect sufficient information to make preliminary determinations of National Register eligibility for any identified resources. Project Personnel Fathom staff involved in the project included David Robinson (principal investigator/project manager) and Ward McIntyre (project assistant/field observer). PAL project staff included Deborah Cox (project manager). CRE project staff involved in the survey included John Ryther (marine operations manager) and Christopher Wright (senior hydrographer). WHG’s Lee Weishar served as the overall project manager. All work for the project performed in support of WHG’s contract with the NAE (Contract No. W912WJ-09-D-0001).
H-2

Disposition of Project Materials All information generated during the project by Fathom is currently on file at Fathom’s main offices, 1213 Purchase Street, Suite 315, New Bedford, Massachusetts. Fathom will serve as a temporary curation facility for these materials until such time as the U.S. government designates a permanent repository that meets the requirements under 36 CFR 79.
H-3

CHAPTER TWO
METHODOLOGY
The systematic, interdisciplinary research methodologies employed in this investigation followed those outlined in the NAE SOW (see Appendix A). The two principal goals of this investigation were: 1) assess the archaeological sensitivity of the Camp Ellis Beach project area and; 2) determine the presence or absence of archaeological properties within it. These goals were met through a combination of archival research and remote sensing archaeological field survey. Archaeological sensitivity is defined as the likelihood for archaeological sites to be present within a particular area based on different categories of information. In the case of the Camp Ellis Beach project area, such sites could potentially include submerged historic period watercraft and infrastructure and prehistoric period settlement sites, watercraft and infrastructure. Assessment of the Camp Ellis Beach project area’s archaeological sensitivity involved conducting archival research to identify and consider previously documented offshore (and adjacent onshore) archaeological resources, the environmental and geomorphological history and sedimentary environment of Camp Ellis Beach area, and regional prehistoric through historic period settlement, subsistence and maritime activity patterns. For this aspect of the investigation a review of the following sources was completed:
National and State Registers for any archaeological properties in the proposed Camp Ellis Beach project study area that have been listed on or are determined eligible for listing;
Cultural resource management reports and historic and prehistoric site file databases at, and maintained on the world wide web by, the MHPC;
Massachusetts Board of Underwater Archaeological Resources (BUAR) – Paul Sherman
Collection of Shipwreck Notes and Information;
National Oceanic and Atmospheric Administration’s (NOAA) on-line Automated Wreck and Obstruction Information System (AWOIS);
Northern Maritime Research’s Northern Shipwreck Database (NSWDB) (Version 2002);
Bruce D. Berman’s Encyclopedia of American Shipwrecks (1972);
Environmental studies providing information about the geomorphological history of the region
and the effects of the Holocene marine transgression, and; Published and unpublished primary and secondary sources in the research library at MHPC, the
Special Collections Department of the Raymond H. Fogler Library at the University of Maine-Orono, the Maine State Archives and State Library (Augusta), and in the research library at Fathom.
In addition to the archival research that Fathom performed for the project, a remote sensing marine archaeological survey was completed by Fathom and project surveyors, CRE, on November 4, 2009. The field investigation methodology followed the specifications outlined in the NAE’s project SOW and
H-4
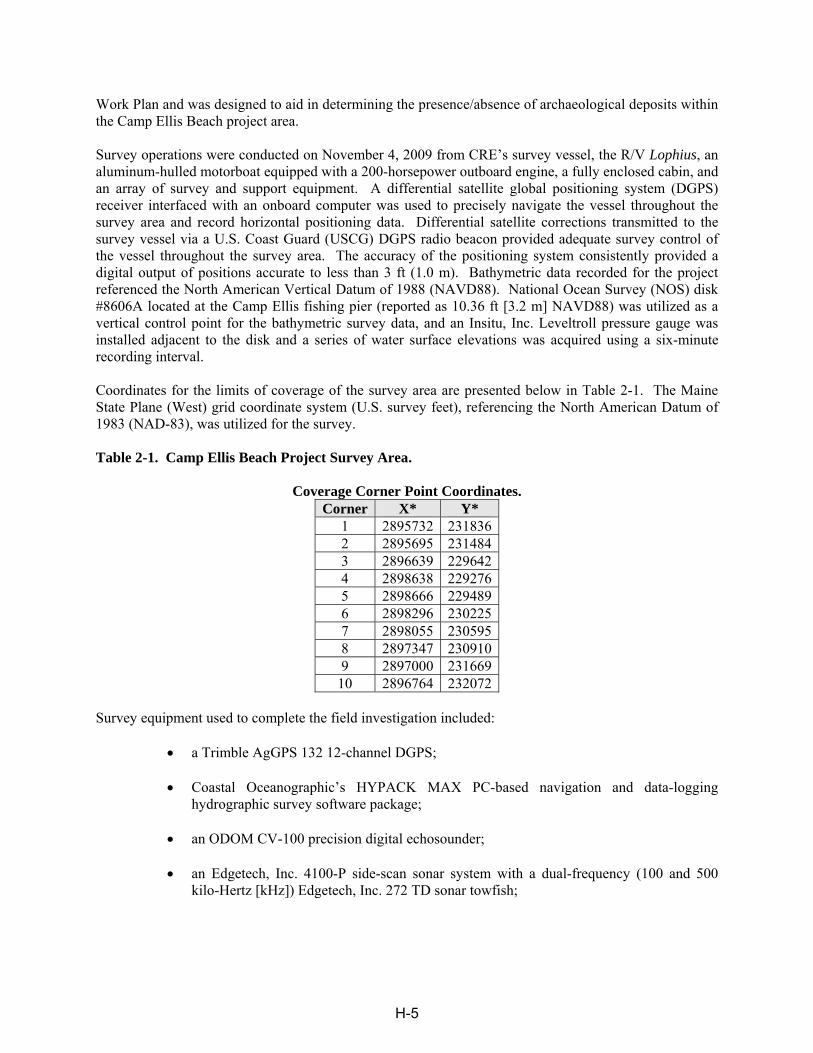
Work Plan and was designed to aid in determining the presence/absence of archaeological deposits within the Camp Ellis Beach project area. Survey operations were conducted on November 4, 2009 from CRE’s survey vessel, the R/V Lophius, an aluminum-hulled motorboat equipped with a 200-horsepower outboard engine, a fully enclosed cabin, and an array of survey and support equipment. A differential satellite global positioning system (DGPS) receiver interfaced with an onboard computer was used to precisely navigate the vessel throughout the survey area and record horizontal positioning data. Differential satellite corrections transmitted to the survey vessel via a U.S. Coast Guard (USCG) DGPS radio beacon provided adequate survey control of the vessel throughout the survey area. The accuracy of the positioning system consistently provided a digital output of positions accurate to less than 3 ft (1.0 m). Bathymetric data recorded for the project referenced the North American Vertical Datum of 1988 (NAVD88). National Ocean Survey (NOS) disk #8606A located at the Camp Ellis fishing pier (reported as 10.36 ft [3.2 m] NAVD88) was utilized as a vertical control point for the bathymetric survey data, and an Insitu, Inc. Leveltroll pressure gauge was installed adjacent to the disk and a series of water surface elevations was acquired using a six-minute recording interval. Coordinates for the limits of coverage of the survey area are presented below in Table 2-1. The Maine State Plane (West) grid coordinate system (U.S. survey feet), referencing the North American Datum of 1983 (NAD-83), was utilized for the survey. Table 2-1. Camp Ellis Beach Project Survey Area.
Coverage Corner Point Coordinates. Corner X* Y*
1 2895732 2318362 2895695 2314843 2896639 2296424 2898638 2292765 2898666 2294896 2898296 2302257 2898055 2305958 2897347 2309109 2897000 231669
10 2896764 232072 Survey equipment used to complete the field investigation included:
a Trimble AgGPS 132 12-channel DGPS; Coastal Oceanographic’s HYPACK MAX PC-based navigation and data-logging
hydrographic survey software package;
an ODOM CV-100 precision digital echosounder;
an Edgetech, Inc. 4100-P side-scan sonar system with a dual-frequency (100 and 500 kilo-Hertz [kHz]) Edgetech, Inc. 272 TD sonar towfish;
H-5

a Marine Magnetics, Inc. MiniExplorer high resolution marine magnetometer system, and;
a SyQwest 10-kHz Stratabox sub-bottom profiling system.
The survey was conducted to provide full seabed coverage within a 500-ft (152-m) buffer surrounding the proposed Camp Ellis Beach wave-break structures identified on a CAD plan provided to CRE by the NAE. Data was acquired along a series of planned parallel primary survey track lines spaced 50 ft (15.2 m) apart and oriented generally east – west across the longitudinal axis of the project area. The primary survey track lines were augmented by survey of “cross-tie” transects spaced 200 ft (61 m) apart and oriented north-to-south, perpendicular to the primary track lines. Side-scan sonar, magnetometer, sub-bottom profiler, and fathometer data were acquired simultaneously along all survey lines. The side-scan sonar was operated using a 25-m [82-ft] sweep range setting, thus providing greater than 200 percent sonar coverage of the seabed within the project area (i.e., all portions of the seabed were imaged at least twice). Due to the relatively shallow depth of the water within the survey area, the magnetometer sensor’s altitude above the seabed never exceeded the water’s maximum recorded depth (14 ft [4.3 m]). Data generated by the survey were reviewed by Fathom field personnel as they were recorded in the field and after they were post-processed and plotted by CRE. Post-processing of the data involved reconstructing survey track lines to include adjustments for sensor layback and offset, the selection and plotting of the locations of side-scan sonar and magnetic anomalies, the creation and plotting of side-scan sonar data in a mosaic format, the plotting of water depth, magnetic, and sub-bottom profiler data as color-coded contour maps, and the plotting of select sub-bottom profiles. Criteria utilized for interpreting the various types of survey data (both during and after the survey) and selecting anomalies as targets of potential archaeological interest, either individually or collectively with other anomalies, relies on a combination of factors. These factors include the type of data being considered, environmental conditions, the predicted types of resources likely to be encountered, survey-design parameters employed, and the scientific knowledge and practical experience of the archaeologist. Consideration and interpretation of acoustic data produced by a side-scan sonar and sub-bottom profiler is comparatively straightforward. Acoustic targets appear as visual anomalies in the ambient visual field of the sea floor in either plan view (as in the case of a side-scan sonar record) or in profile (as in the case of the sub-bottom profiler record). A side-scan sonar target is selected as a possible archaeological target based on its appearance, that is, whether or not it appears to be a shipwreck or some type of submerged historic coastal infrastructure, or if it cannot be eliminated as being one of these types of cultural resources. The size of each target, its height above the sea floor, and the relative density of its constituent parts are all obtainable from the sonar record. Sub-bottom profiler targets generally fall into one of two categories of archaeological interest: those that appear to be shallowly buried, discrete, non-geological deposits or those that appear to be buried geological features. The former can be associated with shipwrecks, and if so, often have corresponding anomalous deflections within the magnetometer data and side-scan sonar data (e.g., low to moderate intensity and moderate duration magnetic signatures accompanied by sometimes subtle, yet distinct, changes in bottom composition). The latter are sometimes associated with anomalies in the magnetic data and/or changes in sea floor that are visible in the both the side-scan sonar and sub-bottom profiler data sets. Sub-bottom reflectors that are geological in nature and buried beneath the surface of the sea floor result from changes in sediment density caused by modern marine sedimentation processes, post-glacial inundation sequences, pre-submergence depositional events, or older geological processes. Some
H-6

reflectors have characteristics that are readily identifiable as relict elements of the pre-submergence paleolandscape, such as paleochannel features, beach/shoreline features, and upland terraces; however, conclusive determination of the specific nature and cause of the acoustic reflector requires physical evidence obtained through geotechnical surveying (i.e., vibratory cores or deep borings). Interpretation of magnetic data is typically less straightforward. Anomalies of archaeological interest can range from several to several thousand gammas in intensity and measure tens or hundreds of ft in duration, depending on the characteristics of the source and its distance from the point of measurement (i.e., the magnetometer sensor). Even though a considerable body of magnetic signature data for shipwrecks is available, it is impossible to positively associate any specific magnetic signature with a particular type or age of shipwreck or any other feature (Pearson and Saltus, Jr. 1991:49). Variations in iron content, condition, and distribution of a ship’s archaeological remains, as well as the survey’s design parameters (particularly track line interval and sensor tow depth) combine to influence the intensity and configuration of the anomaly produced. For archaeological surveys conducted at a tight survey track line interval (i.e., 50 ft [15 m] or less), however, such as the survey for this project, general patterns are observable in the magnetic data that provide some indication as to whether or not the target may be a shipwreck rather than a geological deposit or isolated modern debris. Shipwreck sites commonly consist of a centrally concentrated area of large debris associated with primary hull remains that is surrounded by a more diffuse distribution of relatively smaller debris (i.e., secondary hull components and associated cargo, armament, etc.). Generally speaking, such deposits are detectable in magnetic data as “complex” anomalies (a cluster of magnetic anomalies with signatures consisting of dipolar and/or monopolar anomalies) occurring on multiple adjacent survey track lines that are accompanied by correlating side-scan sonar and/or sub-bottom profiler anomalies. In contrast, when a survey is conducted at a track line interval wider than 50 ft, in which case the magnetometer sensor is more likely to be further away from the source, anomalies associated with shipwrecks are typically lower in intensity, less complex in signature, and may be detectable on just a single line or even not at all. The reasons for these differences, the magnetometer’s limited range of detection, and its implications for archaeological surveys are discussed fully by Aneskiewicz (1986), Bell and Nowak (1993), and Breiner (1973). By comparison, magnetic anomalies associated with geological deposits are often distributed in regular patterns extending over broad areas of the sea floor, while those associated with modern isolated debris can exhibit high intensity magnetic signatures, but typically are detected for only brief durations and usually on a single track line. As noted above, the strength and signature characteristics of magnetic anomalies associated with shipwrecks vary widely depending on a number of factors, including environmental conditions (i.e., local geology [sea floor sedimentary and bedrock characteristics], water depth/distance from shore, and proximity to nearby human infrastructure [e.g., overhead bridges and electrical wires, submarine cables and pipelines, active shipping ports, dumping grounds, etc.]). In part, environmental factors are also a constraint on the types of resources that will be present/absent from a particular project area. In all cases, interpretation and the target selection process are significantly enhanced by the ability to cross-correlate different types of remote sensing data collected simultaneously from multiple instruments with different detection capabilities. Rather than select anomalies and targets in isolation from each different data set, all of the data are examined for the presence of any correlations between them that provide clues as to the possible identity of a particular target. Additionally, data associated with spurious
H-7

13
sources can be recorded as such during the field survey and eliminated from further consideration during the subsequent examination of the post-processed data. The remote sensing survey data recorded during the Camp Ellis Beach survey were interpreted alone and in conjunction with the results from the NAE’s geotechnical boring program and the project’s archival research and to determine the presence/absence of any anomalies or targets representing archaeological deposits. Review of the geophysical and geotechnical data and archival research results provides the necessary information to formulate preliminary statements about resource significance and make recommendations regarding avoidance or further archaeological investigation and site evaluation of identified resources.
H-8

CHAPTER THREE
ENVIRONMENTAL CONTEXT Environmental settings, conditions, and natural resources are important factors to consider when assessing the potential for the presence of archaeological deposits, including early prehistoric settlements submerged by eustatic sea level rise. As Renfrew (1976) notes, “because archaeology recovers almost all of its basic data by excavation, every archaeological problem starts as a problem in geoarchaeology.” The complexity and variability of geological processes make every region or site geologically unique, and sediments comprising the seabed with the Camp Ellis Beach project area are no exception. Understanding the evolving and dynamic geomorphic landscape of the harbor, some or all of which was once likely exposed land available for human habitation, is essential for assessing the potential archaeological sensitivity of the Camp Ellis Beach project area. Geomorphology assists in reconstructing the paleoenvironment of an area and is particularly useful for interpreting early Holocene (i.e., Paleoindian and Early Archaic Period) sites in areas that are physically different from the time corresponding with the earliest archaeological evidence of human habitation in the region, circa (ca.) 11,500 years before present (B.P.), especially when they have been inundated by marine transgression. The submergence, and, thus, burial, erosion and apparent obscurity of inundated landforms, can make it difficult to assess an area’s original pre-submergence topography and current archaeological potential (Hasenstab 1991). The Camp Ellis Beach project area is situated in Maine State waters off of the Seaboard Lowland section of the New England Province in charted Mean Lower Low Water (MLLW) water depths of 0 to 5 ft in an exposed eastward-facing location in the Saco Bay portion of the Gulf of Maine. The project area is located within the town of Saco on the north bank of the mouth of the Saco River (Figure 3-1). The Saco River and its 1,703 square-mile (sq-mi) (4411 square-kilometer [sq-km]) drainage system stretch approximately 105-mi (169 km) in a generally southeasterly direction from Saco Lake in the White Mountains of New Hampshire to the river’s mouth at Saco Bay on the Atlantic seaboard. The Saco River is one of the largest river systems in southern Maine and gives rise to the state’s largest beach and salt marsh system (Woods Hole Group Environmental Laboratories and Aubrey Consulting, Inc. 2006 [WHGEL and ACI 2006]; Kelley et al. 1989; Kelley et al. 1995). The Saco is navigable for 7 mi (11.3 km) from the sea, up to the dams in the Biddeford-Saco city center (Hebert 1951). The Saco inlet is classified as a riverine-associated tidal inlet. The inlet experiences significant freshwater discharge, particularly in the late winter and early spring (WHGEL and ACI 2006 citing Fitzgerald et al. 2002). Historically, navigation of the inlet was impeded by the presence of a significant tidal delta at the inlet’s mouth. Navigational hazards associated with the delta became more problematic during the middle nineteenth century when the increased import of coal and export of textiles to and from Biddeford and Saco’s manufacturing industries required the services of increasingly larger and deeper drafted ships (WHGEL and ACI 2006 citing Kelley and Anderson 2000). Navigational improvements to the Saco River and the stabilization of its inlet were initiated in 1827 by the United States Army Corps of Engineers (USACE). Construction of coastal engineering structures at the mouth of the Saco River commenced in 1866. Construction and modification of coastal structures continued in the area until 1969 (WHGEL and ACI 2006). At the turn of the twentieth century, the Camp Ellis Beach shoreline began experiencing significant erosion following a brief period of accretion (WHGEL and ACI 2006 citing USACE 1955 and Kelley and Anderson 2000). Today, the Maine Geological Survey classifies Camp Ellis Beach as “Highly Erosional.” Highly erosional shorelines are defined as those shorelines that have high erosional rates (more than two
H-9

ft per year, if known), have high reinforced seawalls along their frontal dunes, are in need of beach replenishment to replace eroded sand, and have no recreational opportunities for about half the tidal cycle (WHGEL and ACI 2006 citing Maine State Planning Office 1998). To date, erosion at Camp Ellis Beach has been responsible for the loss of more than 30 homes and repetitive storm damage to roads and streets (Slovinsky and Dickson 2003). Saco’s presently varied topography, fresh and salt water resources, and abundant floral and faunal species together comprise a wide range of onshore and coastal ecozones, some of which actually would have extended eastward out into the project area and beyond when Saco Bay’s floor was sub-aerially exposed prior to inundation by postglacial sea level rise (Belknap et al. 1989:31–32; Crock et al. 1993:182). In addition to the attractiveness of its varied landscape and resources, the Maine coast’s oceanic climate regime produces a pattern of precipitation evenly distributed throughout the year with a more equable temperature range than that of Maine’s more northerly and exposed interior locations. Mean annual temperatures range from about 65o Fahrenheit (F) (18.3o Celsius [C]) in the summer to 24o F (-4.4o C) in the winter. Bedrock Geology The Saco embayment lies on a foundation of pre-Quaternary igneous and metamorphic rock (Osberg et al. 1985). These Precambrian- and Paleozoic-age Cape Elizabeth and Kittery formations have been traced directly from coastal outcrops to the subsurface (Osberg et al. 1985; Belknap et al. 1989; Belknap and Shipp 1991). Subsequent fluvial erosion and Pleistocene glacial scouring have altered the basement to create an irregular upper surface featuring abundant narrow ridges and pinnacles. Bedrock is exposed within about eight percent of the bay, cropping out on the shallow submerged margins of all islands in the Bay seaward of the peninsulas at Biddeford Pool and Prouts Neck. These basement features form Ram Island, approximately 1,700 ft (518 m) north of the project area, and Eagle Island, which lies about one mi (1.6 km) east of Ferry Beach, also located north of the project area. Surficial Geology The surficial geology of Saco Bay is characterized by a complex interplay of multiple episodes of glaciation, isostatic crustal movement, and eustatic changes in sea level that combined to sculpt the area’s present landscape and create its surficial geological record. On at least 20 different occasions during the Pleistocene epoch (ca. 2 million to 10,000 B.P.) of the early Quaternary period, great ice caps grew and coalesced with extensive ice fields in the mountain ranges. These ice fields then periodically expanded and contracted as the climatic conditions fluctuated between cold and warm (Waters 1992). The most recent of these periodic glacial episodes, the Wisconsin glaciation, began ca. 30,000 B.P., when large continental ice sheets developed in northern North America (i.e., the Cordilleran Ice Sheet formed within the northwest and the Laurentide Ice Sheet formed in the northeast) and in northern Europe (Roberts 1996; Waters 1992). The Laurentide Ice Sheet spread outward from a point in eastern/central Canada, passing over Saco and the Camp Ellis Beach project area before reaching its terminal position at ca. 21,000 B.P. about 155 mi (250 km) south of Camp Ellis Beach at the present locations of Long Island, New York, Block Island, Rhode Island, and Cape Cod, Martha’s Vineyard and Nantucket, Massachusetts (Brown 1997; Knebel et al. 1992; Oldale 1985a, 1985b). Tons of “clastic” or fragmented stone debris embedded and transported in the Laurentide glacial ice sheet eroded and polished the underlying bedrock of the areas over which it passed, scouring New England’s highest mountains, as well as its valleys and flat plains before being eventually deposited as glacial “drift”
H-10
along the base, sides, and terminus of the glacier (Waters 1992). The southeasterly-southerly flow of glacial ice across the Maine landscape is evidenced by bedrock striations and friction cracks caused by the glacial advance (Crock et al. 1993). The drift that was deposited on the landscape was composed of “unstratified” drift, defined by geologists as sediment deposited directly by ice transport, as well as “stratified” drift, which is composed of deposits created by running water in contact with ice (Waters 1992). More specifically, the poorly sorted, unstratified deposits of boulders, cobbles, pebbles, sand, silt, and clay that were deposited directly from the ice comprise what is called “till,” while stratified drift consists of morphologically differentiated, well-sorted, glacial deposits of sand and gravel that form geological features known as “eskers” and “kames” or “drumlins” (Oldale et al. 1994). Water that evaporated from the ocean basins created and nourished the massive ice sheets covering much of North America and Europe during the Wisconsin glaciation. The lowered temperatures resulted in reduced runoff to the ocean basins from melting snow and ice. Consequently, sea levels fell worldwide exposing extensive portions of the North American continental shelf (i.e., the low, sloping platform extending seaward from the present coastline). The peak of the Wisconsin glacial episode (ca. 21,000 to 18,000 B.P.) corresponds with a period of glacial maximum “low stand” in sea level off the eastern seaboard that is interpreted to have been about 330 ft (100 m) below our present day sea level (Gilman et al. 1988). A sustained climatic shift toward a cycle of global warming caused the Wisconsin glacial ice sheet to began receding at about 18,000 B.P. Meltwater from the shrinking ice sheets was funneled into glacial lakes, rivers and the world’s ocean basins. Sea level rose rapidly. As the Laurentide Ice Sheet retreated northwestward across Saco and the rest of Maine at ca. 14,000 to 12,000 B.P., ice and sea were in contact (i.e., the ice’s retreat and marine submergence occurred simultaneously) and a significant portion of the eastern part of Maine was inundated by a marine transgression (Belknap and Kraft 1985). The late Pleistocene marine invasion reached its apparent maximum between 12,600 and 12,400 B.P., the extent of which varied across Maine and was largely dependent upon local topographic conditions (Crock et al. 1993; citing Smith and Hunter 1989 and Stuiver and Borns 1975) (Figure 3-2). As the ice melted, discontinuous ice-proximal glacial deposits and glaciomarine muds accumulated on the seabed. Large amounts of glacially pulverized rock fragments, known as “rock-flour,” were discharged directly into the sea from the retreating Wisconsin glacier and, later, into rock-flour-laden subaerial glacial meltwater streams. This glacial runoff produced deposits of a glacio-marine sedimentary unit composed primarily of stiff, bluish gray to olive-gray silty clay referred to in Maine as the “Presumpscot Formation.” Along the coast of Maine, the glacio-marine Presumpscot Formation sediment unit is layered and draped in a manner that suggests rapid deposition with little disturbance from physical or biological processes. The formation overlies the later of the two aforementioned post-Wisconsin drift sequence deposits and is interspersed with generally thin (i.e., less than 6 inches [in] [15.24 centimeters (cm)] thick) lenses of sand and gravel believed to be the result of ice rafting. In many areas, it is oxidized near its upper surface (i.e., the upper 3 to 6 ft [1 to 2 m]), because of its subaerial exposure after the subsequent marine regression of the late Pleistocene and early Holocene epochs. Deglaciation of the Maine coast was followed shortly thereafter by a rapid isostatic crustal rebound of the land, which produced an equally rapid concomitant regression in relative local sea level within the Gulf of Maine (Oldale et al. 1993). As isostatic rebound of the crust progressed, the seabed in the area was exposed horizontally. The regressing shoreline passed today’s Maine shoreline between ca. 12,000 and 11,500 B.P. (Crock et al. 1993) before sea level reached a post-glacial low stand of approximately 180 to 213 ft (55 to 65 m) below present sea level at ca. 9500 B.P. (i.e., corresponding with the 10,000 B.P. start
H-11

of the Holocene epoch) (Crock et al. 1993; citing Belknap et al. 1989 and Shipp et al. 1989) (Figure 3-3). During the regression and low stand, heterogeneous, texturally diverse, fluvial and estuarine sediments were deposited in small channels that were cut into the subaerially exposed upper drift and glacio-marine sediments. These deposits include fluvial, estuarine, and marine mud, sand, and gravel, and freshwater and saltwater peat (Knebel et al. 1992; Oldale and Bick 1987; Oldale et al. 1994; Redfield 1967). Shortly after reaching its post-glacial low stand, isostatic rebound of the land appears to have slowed relative to the rate of eustatic sea level rise from the melting glaciers, causing the re-submergence of the formerly exposed shelf. Initially, the late Pleistocene to early Holocene local sea level rise was rapid (an average of about 42 ft [13 m] per 1,000 years between ca. 9500 and 5000 B.P.) before slowing dramatically to a rate of only 5 ft (1.5 m) per 1,000 years between ca. 5000 and 1500 B.P., and just 1.6 ft (50 cm) per 1,000 years from 1500 B.P. to the present (Crock et al. 1993 citing Young et al. 1992). As the shelf re-submerged, sediments were eroded and redistributed by wave and tidal current regimes. A majority of the basement bedrock within Saco Bay and the Camp Ellis Beach project area is uncomfortably overlain by late Wisconsinan glacial till and/or glaciomarine silt and clay (i.e., the Presumpscott Formation), which, as noted above, comprises the majority of the Pleistocene deposits in the region (Bloom 1963). Kelley et al. (1986) infer from their remote sensing survey work in the bay that a thick deposit of sand derived from the Saco River covers the floor of Saco Bay and is the source of sand for the area’s beaches. Further detail about the composition of Saco Bay’s surficial geology reported by Kelley et al. (1995) indicates that mixed rock and gravel is the most common seafloor environment within the bay, occupying about 30 percent of its total area. Rippled coarse sand and gravel cover approximately nine percent of the Bay floor and are concentrated in areas south of Prouts Neck and Richmond Island. Medium-fine sand is found in water depths less than 50 ft directly offshore of many beaches in the region, with a northward fining trend in grain size of the sediment located in waters of 16 to 23 ft (5 to 7 m) in depth (Farrell, 1972; Kelly et al. 1995). Muddy sand, mapped by Kelly et al. in 1995, covers the Bay’s Shelf Valleys between Prouts Neck and Cape Elizabeth and delineates an area where glacial-marine sediment crops out on the seafloor and may represent a lag deposit (Kelley et al. 1989). According to Kelley et al. (1995), the majority of the Saco embayment just seaward of Camp Ellis Beach is covered by Holocene sand with large ripple fields or narrow linear sand bands. Seaward of these sand bedforms, bedrock and gravel are predominant north of Biddeford Pool and Wood Island, rippled gravel is prevalent south of Prouts Neck, and the center of the bay is dominated by muddy sand and bedrock outcrops. Analysis performed by the NAE and its consultants (e.g., WHGEL and ACI 2006) has indicated that more than 6 million cubic-yards (c-yd) (4.6 million cubic-meters [c-m]) of sand was eroded from the Camp Ellis beachfront between 1859 and 1955, amounting to average annual loss of 81,000 c-yd (61,929 c-m) (WHGEL and ACI 2006; USACE 1955; Kelley and Anderson 2000). By 1995, the NAE reported erosion rates of 3 ft (1.0 m) per year along the shore immediately adjacent to the project survey area. This erosion has been attributed by the USACE, in part, to the construction of the Saco River inlet jetty (USACE 1995; Saco Bay Regional Beach Management Plan 2000). Marine Transgression and Site Preservation Generally speaking, episodes of marine transgression are essentially periods of erosion, a destructive process that creates less than ideal depositional sequences from an archaeological perspective (Belknap and Kraft 1985; Kraft 1971, 1985; Kraft et al. 1983, 1987). Marine transgression proceeds in one of two ways: by “shoreface” retreat, when the coastline slowly regresses inland, or by “stepwise” retreat, when in-place drowning of coastal features occurs (Waters 1992).
H-12

Shoreface retreat describes the erosion of previously deposited sediments by wave and current processes as the shoreline transgresses. It is the dominant inundation regime during the marine transgression process (Waters 1992). As sea level rises, beach face and shoreface erosional zones sequentially pass across the subaerially exposed portions of the shelf. Older sediments that had been deposited in coastal and terrestrial environments inland of the post-glacial low-stand shoreline are reworked, first by the swash and backwash processes of the beach face, and then by the waves and currents associated with the upper shoreface breaker and surf zones. The erosion associated with the slow and continuous transgression of the sea reworks these deposits into a thin unconformable geological unit of transgressive lag (i.e., gravel and coarse sand deposits) forming the top of a time-transgressive geological unit known as the “marine unconformity” (i.e., the surface defined by the top of the buried paleosol and the base of the overlying marine deposit). Reworked terrestrial and coastal sediments are referred to as “palimpsest sediments” (Swift et al. 1971), and the erosional surface, marked by the depth of the maximum disturbance by transgression, is called the “ravinement” surface. This surface often shows up quite clearly in sub-bottom profiler data and can be a useful indicator for determining the presence/absence of relict paleolandforms (Belknap and Kraft 1985; Kraft 1971; Waters 1992:276–277). Given its exposed nature and the reported dramatic erosion of the shorefront adjacent to the Camp Ellis Beach project area, the more destructive regime of shoreface retreat is clearly the prevailing marine transgressive regime (Rampino and Sanders 1980; Sanders and Kumar 1975a, 1975b). Post-Glacial Environmental Conditions and Human Settlement Patterns Colonization of the region by flora during and after deglaciation is characterized by continuous changes, particularly between 14,000 and 9,000 years ago. This time frame is considered to be a marker of a transition from an open tundra-like environment to a woodland environment, and eventually a closed forest environment across much of the New England region (Davis and Jacobson 1985). Pollen and macrofossil studies from regional lake cores suggest species responded individually to climatic changes over time as the ice front retreated northward. Woodland vegetation, dominated by poplar and spruce, is believed to have spread along the coastal lowlands up to New Brunswick by ca. 12,000 B.P., and pushed into interior portions of the region by ca. 11,000 B.P. As archaeologist Bruce Bourque notes, “An observer in Maine 11,000 years ago would have seen a mosaic environment of tundra, shrubs, and trees arranged in patterns determined by latitude, elevation, local soil conditions, drainage, and exposure” (Bourque 2001:16). The transition from woodlands to closed forests initially began in southern Maine ca. 12,000 B.P., and then developed rapidly over the region between ca. 11,000 and 10,000 B.P. The closed forests were initially dominated by spruce, balsam fir, birch, and poplar, but pine emerged as the dominant species approximately 1,000 years after closure of the forests. The simultaneous emergence of pine and the demise of spruce signaled a warming trend that reached its peak sometime ca. 5000 B.P. Studies from lake cores suggest this warming trend was characterized by a drier climate and lower water levels, particularly between ca. 8000 and 6000 B.P. (Almquist et al. 2001). Cooler, wetter conditions prevailed after ca. 4500 B.P., resulting in an increase in birch, followed by a return of spruce after ca. 2000 B.P. (Almquist-Jacobson and Sanger 1995). Past archaeological research in northern New England has provided some indication regarding the range of environmental variables that most often correlate with human settlement and land use patterns during both the prehistoric and historic time periods. Contemporary modeling of prehistoric archaeological site locations has considered several environmental variables (e.g., proximity to water, topographic setting, soil type, and availability of natural resources), of which proximity to water ranks among the highest for
H-13

19
predicting site location. To date, more than 95 percent of the recorded prehistoric sites in Maine have been identified along the margins of water bodies (Spiess 1992). Evidence for prehistoric human activity in the interior of Maine has commonly been found on level, moderately well-drained land surfaces near the shores of rivers, lakes, streams, and sometimes overlooking marshes and wetlands. These bodies of water would likely have represented important resource areas and transportation routes for prehistoric peoples. Along the coast, hundreds of prehistoric sites have been identified in Maine. Typically, these sites are located on southern or protected exposures adjacent to both fresh water and resource-rich areas, such as mud flats. The location of the proposed Camp Ellis Beach project fits the model for high potential prehistoric land use, because of its proximity to both a major river (i.e., the Saco River) and its location adjacent to the river’s mouth and its resource-rich confluence with the open ocean. Many of the same environmental factors that were attractive to pre-contact inhabitants were also attractive to European colonists visiting and settling in the area during the historic period. Early on in the historic period, shortly after the time of European contact, the area was favored as an excellent place to log, hunt, fish, trap, and trade with local Native populations. Rich fishing opportunities afforded by the convergence of fresh and salt waters near the mouth of the Saco River encouraged European exploration and exploitation of that resource as early as the 1500s. Seemingly limitless forests of pine, spruce, oak, and tamarack, and the region’s vast system of lakes, rivers, and streams that provided easily obtainable sources of power for the milling and transportation of lumber to deep water ports and shipyards along the coast, as well as the necessary ingredients for the extensive shipping and shipbuilding industries that fueled Biddeford and Saco’s early economies and supported their resident human populations.
H-14
CHAPTER FOUR
CULTURAL CONTEXT Prehistoric Period Culture History An understanding of regional long-term human settlement and subsistence practices is critical to assessing and interpreting the archaeological sensitivity and record of any project area. The following chapter provides an overview of the regional prehistoric through historic culture history of the Camp Ellis Beach project area. This review is by no means exhaustive, but provides a general framework from which to predict and interpret archaeological deposits encountered during the marine archaeological investigation of the project area. The information for this context has been drawn from a review of the sources described earlier in the methodology chapter of this report (Chapter Two) as well as those sources that are included in the report’s bibliography. The current inventory of known prehistoric sites documents a lengthy sequence of Native American settlement in coastal Maine and the nearby Maritime Provinces of Canada. Maine’s Southwest Coast physiographic region of the Atlantic Coastal Plain where the Camp Ellis Beach project area is located is part of the larger Maritime Peninsula, a geographic formation and culture area that has been home to human populations for at least 10,500 years, and whose unique ecology influenced the prehistoric human groups who have lived there (Bourque 2001:xvii). Maine’s archaeological record suggests a regional cultural history that is both complex and dynamic, and strongly linked to the resource-rich sea and the region’s major rivers (Bourque 2001). This is particularly true of the Native groups that lived on Maine’s coasts beginning about 7,000 years ago (Bourque 2001:xvi). The importance of the sea to Maine’s Native peoples continued even long after European contact, as Native mariners were quick to adopt European nautical technologies and use sailing vessels for conducting trade and warfare far from their home territories (Bourque 2001:xvi; Duncan 1992:129–130; 144–147). There is a considerable degree of consensus among archaeologists regarding broad patterns of regional cultural history throughout the Northeast, although debates continue about how and to what extent these patterns are related to each other over space and time. As a result of this consensus, the archaeological record of Maine has been organized into three major cultural periods: the Paleoindian Period (11,500–9500 B.P.); the Archaic Period (9500–3000 B.P.); and the Ceramic Period (3000–450 B.P.). These periods are further subdivided based on similarities in artifact forms and cultural adaptations over broad regions (Table 4-1) (Spiess 1990). Paleoindian Period (11,500–9500 B.P.) The Paleoindian Period in Maine corresponds with a time when much of the landscape was vegetated in a mosaic environment of tundra, shrubs, and trees, the locations of which were patterned by latitude, elevation, local soil conditions, drainage, and exposure (Bourque 2001:16, 17). As the Camp Ellis Beach project area became free from its ice and water overburden, tundra vegetation (mosses, lichen, grasses, and sedge) appeared. Thickets of willow and alder, and then stands of hardier trees, such as poplar and spruce followed (Bourque 2001:16). By ca. 11,000 B.P., an intermediate woodland environment consisting of a mix of open areas of tundra and stands of closed-canopy poplar, spruce, and birch forest would have likely prevailed in the area.
H-15

Table 4-1. Maine’s Comprehensive Planning Prehistoric Period Archaeological Study Units (after Spiess 1990).
Time Period Study Unit 11,500 – 10,200 B.P. Fluted Point Paleoindian Tradition 10,200 – 9,500 B.P. Late Paleoindian Tradition 10,000 – 6,000 B.P. Early and Middle Archaic Traditions 6,000 – 4,200 B.P. Late Archaic: Laurentian Tradition 6,000 – 2,000 B.P. Late Archaic: Small-Stemmed Point Tradition 4,500 – 3,700 B.P. Late Archaic: Moorehead Phase 3,900 – 3,000 B.P. Late Archaic: Susquehanna Tradition 3,000 – 450 B.P. Ceramic Period
Although Maine’s late Pleistocene environment was generally similar to today’s subarctic taiga (i.e., the area near treeline) or arctic tundra zones, it was probably biologically richer (Bourque 2001:17). In addition to its vegetation, Maine and the rest of the Northeast at this time supported a large and varied population of late Pleistocene mammal species that included mammoth, mastodon, horse, muskox, and caribou, as well as walrus, bearded seal, and cold-water species of shellfish, suggestive of a marine environment that was similar to that of the southern Labrador coast today (Bourque 2001:16). Our understanding of subsistence and settlement patterns of Paleoindians in Maine is growing and becoming more refined, although some of the even basic aspects, such as diet, geographic range, and dating of sites remain unclear (Bourque 2001:20). Part of the reason for this may be attributed to the poor preservation of organic remains in most terrestrial contexts in the Northeast, which has left a frustratingly small archaeological record, consisting of just stone, wood, and charcoal cultural materials, and calcined bone, available for interpretation. Another part of the reason may also lie in the paucity of marine archaeological research conducted to date focusing on the inundated paleolandscape and the prehistoric period submerged archaeological deposits it contains. Ironically, it is this least-studied landscape – the intact elements of the coastal environment of the Paleoindian and Early to Middle Archaic periods that now lie offshore of the present Maine coastline, which, because of the submerged environment’s uniquely preservative qualities, may hold the best evidence of Maine’s earliest inhabitants. Based on the currently available archaeological data recovered solely from the terrestrial context, archaeologists have characterized Paleoindians as highly mobile hunter-gatherers who were largely reliant on caribou that were presumably abundant at that time (Spiess et al. 1998). While caribou would have been a principal focus for Maine’s Paleoindian population, they also invariably would have exploited a broad range of other resources that would have been available to them at the time (e.g., small mammals, fish, birds, and plants) (Bourque 2001:36). Generally speaking, Paleoindian Period peoples crafted tools from very fine lithic materials obtained from a limited number of sources scattered widely throughout the region. An abundance of exotic lithic materials at early Paleoindian sites suggests frequent long-distance movement and/or broad-ranging exchange networks. Most Paleoindian site locations that have been documented to date are quite different from those of later time periods, and are typically removed from present-day water bodies (Spiess et al. 1998). However, some of the more studied Paleoindian archaeological deposits, such as, the Munsungan Lake, Michaud, and Varney Farm sites, as well as the Magalloway Valley Paleoindian Complex (i.e., the Vail and Adkins sites) described by archaeologist Bruce Bourque as one of the “richest clusters of
H-16

Paleoindian sites known anywhere in the Northeast” (Bourque 2001:27), are all proximal to areas with (or that once held) lakes, rivers, streams, brooks, or bogs. Paleoindian Period peoples seemed to have preferred sandy soils on which to locate their settlements. Such locations may have been chosen simply because they were relatively dry and well-drained, as compared to the otherwise wet early postglacial terrain (Bourque 2001:35). The sites seem also to be strategically located at points above low-lying terrain that may have been suitable habitat for caribou and other game animals. Maine’s Paleoindian archaeological deposits are typically indicative of short-term habitations by small groups of people, perhaps in some cases by even a single extended family. While smaller sites prevail, a handful of larger Paleoindian sites are known to exist in the region as well, such as the Magalloway Valley Paleoindian Complex present at the Vail and Adkins sites in northwestern Maine (Gramly 1982, 1988), the Debert Site in Nova Scotia (MacDonald 1968), and the Bull Brook Site in Massachusetts (Grimes 1979; Grimes et al. 1984). It is hypothesized that these sites possibly represent seasonal gathering places for larger groups. The end of the Paleoindian Period and subsequent transition into the Early Archaic is poorly understood, although increasing perceptions of subtle cultural changes during the Paleoindian Period have led some archaeologists to suggest a three-phase Paleoindian occupation in Maine that may help explain some of these transitional differences (Bourque 2001:34–36; Wilson and Spiess 1990). Archaeological evidence indicates that during the later Paleoindian Period, fluted spear points were replaced by smaller, unfluted points. Other point styles also emerge in the region, most notable of which are long, slender lanceolate points with a distinctive parallel flaking technology (Cox and Petersen 1997; Doyle et al. 1985; Will and Moore 2002). These technological changes coincide with the transformation of the environment from relatively open woodlands to more closed forests. By the Early Archaic Period, the archaeological record contains a dramatically different material culture than that recovered from sites dating to the Paleoindian Period (e.g., abundant use of quartz, barbed bone spears, and a new range of implements [i.e., adzes, gouges, and whetstones] created by pecking and grinding less-brittle granular rock types) (Bourque 2001:37–74). The presence of an important Paleoindian site (the Debert Site) off the Bay of Fundy coast in Nova Scotia (MacDonald 1968), suggests that Paleoindian Period peoples were present in and familiar with the coastal Maritimes region, and that such sites may yet be found along the Maine coast in the future, perhaps even underwater; however, no Paleoindian Period sites have been reported within the Camp Ellis Beach project area or on the adjacent shoreline. While it is hypothetically possible for such sites to exist anywhere within the Camp Ellis Beach project area, rising sea levels and the destructive shore-face marine transgressional regime that probably prevailed during the inundation of the survey area between ca. 6000 and 3000 B.P., as well as the subsequent and aggressive erosional regime presently impacting the area, have probably eroded and destroyed them. Archaic Period (9500–3000 B.P.) Spanning about a 6,500-year time frame, the Archaic Period represents the longest archaeologically defined cultural period in the region. It is divided into three sub-periods (Early [10,000–8000 B.P.), Middle [8000–6000 B.P.], and Late [6000–3500 BP]). Based on inferences from artifact assemblages, the Archaic Period consists of a complex mosaic of cultures with varied lifestyles and wide reaching external relations (Bourque 2001:74). In general, the period is characterized by archaeologists as one in which there are important elements that remain continuous, but also sharp discontinuities as well, with evidence
H-17

of arrivals and departures of distinct groups, and important changes in subsistence, mortuary practices, technology, and other patterns that are still being identified in the archaeological record. In addition to the cultural changes that occurred during the Archaic Period, there were also dramatic changes in Maine’s flora and fauna during this time. Paleontological studies indicate a time of global warming accompanied by a drop in precipitation known as the “Hypsithermal” period, which occurred between about 9000 and 5500 B.P. (McWeeney 1999:8). During the Archaic Period, woodlands replaced tundra, and boreal tree species (spruce, poplar, and birch) declined, and were followed by oak and eastern hemlock. Animal species that had sustained Paleoindian hunters diminished and then disappeared altogether, to be replaced by fauna from unglaciated areas south and west of the region (e.g., moose, deer, bear, and other smaller mammals) (Bourque 2001:37). Marine conditions in the Gulf of Maine also became increasingly favorable for biological productivity during the middle of the Archaic Period, as lower sea levels and shifts in the Gulf Stream and Labrador currents likely increased water temperatures while decreasing tidal amplitudes, making them lower than those of today (Bourque 2001:45). Paleontological evidence recovered from the eastern Gulf of Maine indicates that marine animal communities of the Middle Archaic were significantly different than today’s, with warm-water species, such as oysters and quahogs, present in abundance (Bourque 2001:45). The Gulf of Maine region may contain the largest number of radiocarbon-dated Early and Middle Archaic archaeological sites in New England, among the most diverse eighth millennium ground stone technologies in North America, and a well-established mortuary tradition of elaboration dating from as early as 8000 to 7000 B.P. (Robinson and Petersen 1993:61). Subsistence and settlement patterns and the assemblages they produced were different from those of the Paleoindian Period, as evidenced by the stronger correlation of sites with present-day water bodies, a lithic tool assemblage that included quartz cores and unifaces, ground-stone tools, such as abraders, choppers, stone rods, full channeled gouges, and low numbers of bifacially flaked lithic tools, and subsistence practices that are reconstructed as including an apparent spring seasonal emphasis on fish spawning runs, fishing for perch, sucker and eels, some hunting of large mammals, hunting or trapping of beaver, muskrat, woodchuck, various birds, and turtles, and the collection of a variety of plant resources, as evidenced by charred nutshells and seeds. That many sites dating from the Early Archaic occur along inland waterways suggests waterborne travel and fishing were important activities of Archaic Period peoples (Bourque 2001:42). Unlike the prevalence of exotic lithic materials found in Paleoindian assemblages, tools of the subsequent Archaic Period were typically produced from local stone, often collected in cobble form, and lack the finely crafted, chipped-stone spear points that characterize the Paleoindian Period. Instead, scrapers, flake tools, and minimally modified unifacial tools made from quartz dominate the assemblages. Projectile points resembling forms common in the Carolinas, where they may have originated, appear during the Early Archaic, and include “bifurcate” points with notched bases as well as small amounts of the Kirk Corner Notched type (Bourque 2001:41). Additionally, a new stone tool technology (i.e., adzes, gouges, and stone rods used for whetstones) manufactured from less-brittle granular rock types through pecking and grinding techniques appears for the first time in Maine’s archaeological record during the Early Archaic, and becomes increasingly elaborate through the period (Bourque 2001:42; Robinson 1992). Given that these stone tools are intended for woodworking, it may be inferred that their appearance and increased presence in the archaeological record reflects an expansion of wood technology that would presumably have included dugout log boats, food vessels, and fish weirs (Bourque 2001:42). In addition to tools manufactured from stone, tools made from bone and antler, including barbed spears, have also been found in small numbers from Early Archaic sites in Maine (Bourque 2001:41).
H-18

Mortuary practices first appear in the archaeological record of the Maritime Peninsula region during the Early Archaic Period, with three mortuary sites dating from ca. 8500 B.P. found in northern New England: 1) the Tableland Site on the Merrimack River, Manchester, NH; 2) the Morrill’s Point Site at the mouth of the Merrimack River, Salisbury, MA, and 3) the Ormsby Site on the Androscoggin River, Brunswick, ME. All three sites contained cremation burials, although grave furnishings (i.e., red ocher and stone tools) were present just at the Tableland and Morrill’s Point sites (Bourque 2001:43). By the Middle Archaic Period, chipped-stone spear points, bifurcate projectile points, and heavy woodworking tools (occasionally supplemented by a southern type of grooved axe), all of which were present during the Early Archaic, become increasingly more abundant. Finely ground and polished winged spear-throwing weights, and stylistically local ground slate lance points and “ulus,” which are a semi-lunar stone knife, also appear. Middle Archaic sites occur in Maine’s interior as well as along its coast, but even then are nearly always associated with bodies of water, suggesting a continued or growing dependence on fishing as an important subsistence strategy and a strong maritime focus. Most sites from the period are small and represent brief seasonal encampments of 25 to 50 individuals. Archaeological evidence of a coastal focus during the Middle Archaic is concentrated along the central Maine coast, northeast of the Camp Ellis Beach project area, where even islands were occupied ― another clear indication for manufacture and use of reliable watercraft. Mortuary practices of Middle Archaic peoples are poorly represented in the archaeological record of Maine and in New England in general, with only about five such sites identified (three of which are in Maine). The use of red ocher and inclusion of burial furniture (i.e., projectile points, spear-thrower weights, adzes, gouges, and stone rods) in Early Archaic burials continues in the Middle Archaic, as well. Taken together, these various technological and mortuary attributes of the Gulf of Maine’s Early and Middle Archaic cultures form a core of cultural traits that are distinct from cultural assemblages to the north and south. This distinctive nature has led archaeologists to label this Early and Middle Archaic pattern as the “Gulf of Maine Archaic Tradition” (Robinson and Petersen 1993:68). The archaeological record of the Late Archaic Period in Maine is sparse for the sixth and fifth millennia B.P.; however, archaeological evidence of human occupation dating from ca. 5000 B.P. is much more abundant in the form of two distinct cultures from this period in Maine’s prehistoric history: 1) the Vergennes phase, and; 2) the Small Stemmed Point tradition. Vergennes phase culture sites are fairly common at interior locations between the Kennebec River and St. John drainages, and a few typical artifacts have been found as far northeast as Nova Scotia. The relative scarcity of Vergennes sites in New Hampshire, western Maine, and along Maine’s coast, suggest that this culture’s influence came primarily from the St. Lawrence Valley, and had an insignificant impact on the White Mountains region and coastal New England (Bourque 2001:46–49). The robust Otter Creek spear point typifies the phase, and suggests reliance upon large terrestrial game, which is supported by the fact that Vergennes sites are confined to interior sections of the Northeast. Additional artifacts typically found on Vergennes sites include plummets, gouges, ulus, and flat rocks expediently chipped around their edges to create what archaeologists have termed “choppers.” The significance of the Vergennes phase and its influence in Maine archaeology is debated, with some archaeologists seeing it as an intrusive culture of small, mobile hunting populations that originated in the St. Lawrence River valley, while others equate the culture’s less formal tool styles and beautifully
H-19

polished ulus as a technological continuation of those of Maine’s coastal and near coastal Middle Archaic sites (Bourque 2001:46–49). While Vergennes phase people mainly occupied Maine’s interior upland areas and focused on terrestrial game, the Small Stemmed Point or narrow point tradition peoples mainly occupied the Gulf of Maine coast, where they practiced a mixed economy that included pursuit of large fish, such as cod and swordfish. The Small Stemmed tradition is characterized by archaeological deposits that have yielded thousands of small, narrow-stemmed projectile points, often found along with triangular points, both of which are generally made of quartz. Other associated stone artifacts include adzes, gouges, plummets, spear-thrower weights, and fully-grooved net weights. All of these artifact forms appear to have origins in the Middle Archaic. Small Stemmed sites found east of the Kennebec River pre-date by about 1,000 years the same types of sites located in southern New England. The earliest dated Small Stemmed sites in Maine occur in the central coastal region of the state, with the oldest coastal archaeological deposit (± 5290 B.P.) located in Penobscot Bay, on North Haven Island, northeast of the Camp Ellis Beach project area, in the Occupation 1 deposit at the important Turner Farm Site (Sanger and Kellogg 1989:119). Available archaeological evidence indicates that between 5000 and 4500 B.P., the Small Stemmed tradition produced a striking new culture named for the pioneering Maine archaeologist, Warren K. Moorehead, who worked extensively on sites of this period. Termed the “Moorehead Phase,” the most extensively studied site produced by this culture is the second component of the Turner Farm Site (Occupation 2), the contents of which were subjected to intensive analysis by Spiess and Lewis (2001) and provide a detailed record of subsistence activities during the centuries between ca. 4500 and 4000 B.P. The most striking element of the faunal assemblage from Occupation 2 is the abundance of swordfish remains, which although present on other sites, were first found at Turner Farm, and thereby provided the original indication of this formidable prey’s importance. Other major food resources present at Occupation 2 included cod, deer, and shellfish – both the soft-shelled clam and the locally extinct quahog or hardshell variety. Noticeably absent from the assemblage were shallow-water fish species and sea mammals, such as seals and porpoise, which apparently were little used. Together, the evidence examined at Occupation 2 indicates the presence of a substantial year-round population at the site, who used it as a home base. Generally speaking, Moorehead Phase sites are only found east of the Kennebec River. In addition to its distinctively coastal settlement pattern, the Moorehead phase is primarily known for its mortuary practices, which included the lavish use of red ocher, giving rise to the term “the Red Paint People,” and the offering of grave goods, such as gouges, slate spear points, and stone rods (Moorehead 1922; Robinson 1992; Willoughby 1898). Present understanding of how the Moorehead phase culture may have developed focuses on its relationship to the marine environment. Sometime between 6000 and 4000 B.P., as the biological productivity of the Gulf of Maine reached high levels, a local population settled along the coast of central and eastern Maine to exploit the region’s rich resources and growing stocks of cod and swordfishes, developing a highly distinctive material culture and unprecedented mortuary ceremonialism along the way (Bourque 2001:51–61). Surprisingly, the innovative and highly successful Moorehead phase maritime hunting peoples disappear abruptly from the archaeological record at around 3800 B.P., and don’t seem to leave any vestiges of their culture in those that succeeded them locally. The Moorehead phase was replaced at the close of the Late Archaic Period by another distinct cultural tradition, known as the Susquehanna tradition. Susquehanna tradition sites appear in Maine’s archaeological record between 3700 and 3400 B.P. (Bourque 1995, 2001; Sanger 1979). Initially
H-20

recognized by archaeologists working in the Susquehanna River valley region of southern New York and eastern Pennsylvania, Susquehanna tradition sites are widespread throughout eastern North America and are common in Maine, occurring as far east as the St. John River in New Brunswick, with a few Susquehanna tradition artifacts recently recognized from sites across the Bay of Fundy in southern Nova Scotia (Bourque 2001:62). Once again, the Turner Farm Site proves to be the best source of data about this distinctive culture, with the largest and richest Susquehanna archaeological deposit in Maine comprising Occupation 3 there (Bourque 2001:62). The Susquehanna tradition’s technology, subsistence practices, and mortuary rituals are striking in their uniformity and marked difference from those of preceding cultures. Diagnostic tool forms of the Susquehanna tradition are the largest and most skillfully manufactured stone artifacts of the prehistoric period. Susquehanna artisans excelled not only in their production of chipped-stone tools, but also worked bone by grinding, as opposed to scraping with a stone tool, as was done during the Moorehead phase. Susquehanna craftspeople also produced ground- and pecked-stone tools such as adzes and gouges, which were functionally similar to those of earlier cultures, but were different in their detail and in their use of different lithic materials, and lithic bowls sculpted from steatite, a soft, easily worked, metamorphic stone. The Susquehanna culture was also distinctly different from the Moorehead phase in its diet, preferring terrestrial game and “mast” resources (i.e., nuts, acorns, beech nuts, butternuts, hickory nuts, and walnuts) to maritime resources, as is evident from the Turner Site Occupation 3’s faunal refuse remains and diet indicators resulting from isotopic analysis of the site’s human skeletal population (Bourque 2001:62–66). The Susquehanna tradition’s elaborate mortuary rituals differed dramatically from those of the Moorehead phase’s Red Paint People. Despite a very large number of Susquehanna habitation sites throughout Maine, only a half-dozen or so Susquehanna cemeteries have been identified in the state, as compared to the 44 known cemeteries associated with the Moorehead phase culture. This difference may be attributed to two factors: Susquehanna occupation of the region was too brief to generate a larger number of burials, and/or, unlike the Moorehead cemeteries which included all members of their populations, the Susquehanna tradition’s burial practices were more exclusive. However, age and sex do not appear to have been a basis for burial in the Susquehanna cemetery at Turner Farm. Other major distinctly different elements of the Susquehanna tradition burials are the “ritualized manipulation of the dead,” consisting of the removal of whole or partial human remains from their place of initial interment to combine them with the remains of other individuals for ceremonial use in bundle burials or commitment to cremation pyres along with rich arrays of grave furnishings (Bourque 2001:62–66). Archaeological evidence of the Susquehanna tradition disappears from the archaeological record in Maine by ca. 3400 B.P. This disappearance coincides with a “Little Ice Age” (McWeeney 1999:10) and a transition in the temperate southern character of Maine’s woods back to northern hardwoods and hemlock of a colder climate, which may have resulted in a southward territorial contraction of Maine’s Susquehanna tradition population. The relationships between the various Late Archaic traditions continue to be a source of debate among Maine archaeologists. At the root of the discussion is whether the various archaeological assemblages of the Late Archaic reflect local, long-term cultural adaptations, or movement of people into the region with different cultures. Whatever the origins of the cultural changes observed, they again roughly coincide with increasing changes in the environment that provided more favorable habitat for deer and possibly other modern species of fauna as well.
H-21

No Archaic Period archaeological sites are documented within the project study area or on the adjacent shoreline. As in the case of Paleoindian Period sites, it is hypothetically possible that archaeological deposits dating from the Archaic Period could be present anywhere within the project survey area. If present, sites dating from the Middle and Late Archaic periods would likely possess features and artifact assemblages strongly coastal or maritime in nature, as the sea level rise model for the Gulf of Maine indicates that the position of the shoreline would have passed from the deepest to the shallowest portions of the project survey area between ca. 6000 and 3000 B.P. This time period corresponds with the end of the Middle Archaic at ca. 6000 B.P. and spans the entire 3,000 years of the Late Archaic Period. The destructive shore-face marine transgressional regime that probably prevailed along Camp Ellis Beach’s exposed coast and the aggressive erosional regime presently impacting the area are likely to have eroded and destroyed any Archaic Period archaeological deposits that may have been present within the project survey area. Ceramic Period (3000–450 B.P.) The introduction of pottery manufacture and use in Maine defines the onset of what Maine archaeologists call the Ceramic Period (Sanger 1979). In other parts of the Northeast, this cultural period is referred to as the Woodland Period. The differences between the two terms is mainly that hunting and gathering for food remained the primary means of subsistence throughout much of Maine and the Maritimes, while a reliance on horticulture and a tendency toward larger, more permanent settlement patterns developed in other regions during the same time period. Ceramics first appear in the archaeological record of Maine ca. 3000 B.P., and they persist until contact with Europeans when clay pots were replaced in favor of iron and copper kettles that were traded for beaver pelts and other animal furs. Bourque’s report of archaeological evidence and Samuel de Champlain’s documented observations of the Maine coast indicate maize was being cultivated in western Maine as early as 1000 B.P., and along the Maine coast as far east as Saco by the first decade of the seventeenth century (Bourque 2001:87). The picture that emerges from Ceramic Period sites is one showing long-standing cultural adaptation to the diversified use of local resources. In addition, the nature of artifact forms and certain types of stone recovered from Ceramic Period sites indicate broad trade and communication networks with peoples located far to the north, south, and west. By the end of the period, historical and archaeological evidence suggests horticulture was practiced in southern Maine. The Ceramic Period ends with European contact around 450 years ago. At this time, most of the artifacts attributable to pre-contact inhabitants of Maine disappear from the archaeological record. During the Ceramic Period and at the time of European contact, New England and the Maritime provinces were populated by Eastern Algonquian speakers. Maine’s major river drainages, including the Saco and many smaller coastal drainages, were occupied by the Eastern Abenaki (Snow 1978a:67). The name of the Eastern Abenaki derives from wapanahki, their own name for themselves, which means “dawn land people” or “easterners” (Snow 1978b:137). The territory of the Eastern Abenakis was covered by a mixed white pine, hemlock, and hardwood forest along the coast, transitioning to a spruce and fir forest in the interior. Neither the soil nor the climate was adequately warm enough to allow for cultivation of the available domesticates within most of Maine (Snow 1978b:138). Consequently, the subsistence pattern of the period primarily involved a seasonal round of hunting and gathering with summer residences based along the coast and winter residences in the interior. Ceramic Period archaeological evidence indicates a strong maritime focus over much of the Maine coast, which did not exist during the preceding Susquehanna tradition (Bourque 2001:84). Native peoples living
H-22

along the coast were heavily reliant on marine resources and exploited springtime runs of alewives, salmon, shad, eel, smelt, and other fish with hooks, leisters, purse-nets, and weirs. Some fishing was done with harpoons, particularly for sturgeon, which were attracted to the surface by torches at night. Harpoons were also used to hunt harbor seals, porpoise and various water fowl. Lobsters and crabs were caught in shallow water using spears. Shellfish, particularly clams, were a staple of native coastal inhabitants (Snow 1978b:139). Cod was taken, but in insignificant numbers relative to the amount of smaller fish that were sought, such as winter flounder and longhorn sculpin (Bourque 2001:84). Swordfish are markedly absent from Ceramic Period faunal assemblages, possibly as a result of becoming locally extinct due to cooling water temperatures in the Gulf of Maine (Bourque 2001:84). Two extinct species of animal were also exploited by Ceramic Period People – the great auk, a flightless, penguin-like relative of the puffin, and the sea mink, both of which were hunted into extinction during the nineteenth century (Bourque 2001:85). Coastal peoples were quite mobile as compared to other Eastern Algonquians, and utilized watercraft for travel, hunting, and fishing. The first Europeans to arrive in the Northeast recorded three basic types of watercraft: dugout canoes, birch bark canoes, and hide-covered kayaks. Throughout northern New England and the Maritime Peninsula, birch bark canoes were used exclusively for interior travel, while dugouts made from large trees were used in coastal waters. Ceramic Period sites are abundant in Maine, along both the coast and in the Maine interior (Sanger 1979). Along the coast, they are most visible in the form of shell middens, which have attracted the attention of professional and amateur archaeologists since the late nineteenth century (Wyman 1868). Shell midden sites contain discarded shells of clams, oysters, mussels, and quahogs, bones of both terrestrial and marine animals, as well as broken pottery sherds and discarded stone and bone tools. Sites in the interior are most common along waterways, ponds, and lakes. Assemblages from the interior differ from coastal sites in that bone assemblages are poorly represented because of differences in preservation. No Ceramic Period archaeological sites are documented within the project study area or on the adjacent shoreline of Camp Ellis Beach, although late Ceramic to Contact period sites have been reported onshore in the surrounding area: approximately 0.3 mi (0.5 km) to the south on the Biddeford side of the lower Saco River (ME 005.003, ME 005.006, ME 005.011, ME 005.015, and ME 005.016); approximately one mi (1.6 km) to the north, near Long and Short ponds (ME 005.007); and approximately one mi (1.6 km) southeast on Basket Island (ME 005.013). Unidentified Ceramic Period sites potentially present within the project area would have been entirely maritime, rather than terrestrial, in nature, as present sea level rise models indicate the entire project study area would have been underwater by the start of the Ceramic Period. As is the case for sites from the earlier prehistoric periods, the exposed nature of Camp Ellis Beach and the aggressive erosional regime presently impacting the area make it unlikely that any Ceramic Period archaeological sites that may have been present within the project survey area have not been destroyed by erosion. Historic Period Culture History Undocumented visitations by coastal fishermen from many nations and adventurous woodsmen may have occurred at Saco prior to its settlement by non-Native peoples. The first documented evidence of European incursion into the area is that of the French-sponsored explorer and Italian navigator Giovanni da Verrazano, who sailed along the Maine coast in 1524 while searching for a northwest passage to the Pacific and the wealth of China and the Spice Islands that would rival the Portuguese route around the Cape of Good Hope (Duncan 1992:22). Verrazano found the natives of this coast hostile, unlike those he
H-23

had encountered farther south, suggesting that they had had previous unpleasant dealings with Europeans (e.g., Portuguese fishermen who had been in the area since ca. 1522 [Brasser 1978:80]) who had perhaps been slave traders or dishonest merchants. The clearest evidence for Verrazano’s presence along the Maine coast is the label at the head of one of the large inlets on his brother’s map indicating the location of the Abenaki’s fictitious beautiful city of gold – “Oranbega,” later called “Norumbega,” situated on the present site of the city of Bangor (Duncan 1992:22). Spain’s Estevan Gomes, also seeking a northwest passage to the Orient, visited coastal Maine the year after Verrazano’s voyage when he sailed up the Penobscot River as far as present-day Bangor before realizing that it was just a river with a broad mouth and not the much sought after entrance of a northwest passage (Baker et al. 1994:xxv). The native peoples that greeted Gomes were, apparently, more friendly than those Verrazano met the year before, although tales of Norumbega, the City of Gold, were either un-compelling to Gomes or went untold, as the area as depicted on his map from the voyage is inscribed with the words, “no gold here” (Duncan 1992:23). Despite Gomes’s pronouncement, the alluringly imaginative concept of a northern El Dorado – the paradisiacal Native American kingdom of Norumbega at the head of Penobscot Bay – was sustained throughout the middle sixteenth century by the Bay’s prominence on early maps, Verrazano’s idyllic description of native encampments, and boosting of the legend of a mythical city at the head of the Penobscot by French explorer Jacques Cartier following his three voyages to Canada in the 1530s (Baker et al. 1994:xxv). Ironically, Gomes repaid the relative friendliness of Maine’s native inhabitants by capturing a group of them (58 people) to bring back to Spain with him (Brasser 1978:80). In addition to the lure of wealth and discovery of a northwest passage, the English were attracted to the region for other reasons as well. Under Sir Humphrey Gilbert’s direction, the English planned to build a naval station and a manorial settlement in Norumbega from which they could, among other things, harass Spain’s West Indian holdings (Baker et al. 1994:xxv). The English plan of colonization was put into action when Gilbert’s expeditionary five-ship fleet got underway in June 1583 to establish England’s first permanent settlement in America. The effort ended prematurely shortly thereafter, however, when in September, after failing to even make the Maine coast, Gilbert’s boat sank with all hands while trying to return home to England. Despite its subsequent failure, the expedition was the first serious attempt at English colonization in America and in Maine (Duncan 1992:26). French and English incursions into the area continued unabated through the seventeenth and eighteenth centuries as the two nations struggled with each other and the area’s native inhabitants for control of the region through a series of armed conflicts and treaties. In 1603, a few days after the death of Queen Elizabeth, Martin Pring set sail from Bristol, England, for the New World for the purposes of trading baubles and trinkets for sassafras and furs with America’s natives, and in the process became the first European in recorded history to visit and navigate the lower Saco River (Owen 1891). Pring arrived in the New World at Penobscot Bay first, but finding no one to trade with there, continued southwestward along the Maine coast to Saco Bay. According to his log, he cleared a sandbar at the mouth of the Saco River and then sailed a distance of 5 mi (8 km) up-river (Owen 1891). Although Pring observed evidence of camp fires along the river’s banks, none of the area’s native inhabitants showed themselves and Pring was forced to leave the lower Saco empty-handed and continue his quest for trade goods toward the south (Owen 1891). In the same year as Pring’s voyage, King Henry IV of France granted the Atlantic Coast from the Hudson River to Cape Breton to Pierre du Guast, Sieure de Monts with instructions to “explore, govern, open mines, and Christianize the Indians” (Davis 1950:19). Sieure de Monts established briefly occupied settlements first on St. Croix Island in 1604, and then at a more favorable location across the Bay of Fundy at present-day Digby, named “Port Royal,” by the French, who remained there only until
H-24

1607 during the initial settlement attempt. Three years later, in 1606, King James I of England granted much of the same area to the Plymouth Company. A settlement was established in 1607 by the English in the middle of the grant at Sagadahoc, near present day Phippsburg, Maine, although it was abandoned the following year. In July of 1604, de Monts and Samuel de Champlain explored the Maine coast and spent two days at the mouth of the Saco River (Owen 1891). Champlain, who was serving as the de Monts expedition’s official geographer, produced and published in 1605 a detailed map of the Saco Bay area clearly showing a large Native American village, called “Choacoet” at the river’s mouth in the same general area as the present-day location of the University of New England’s Biddeford campus. Champlain’s depiction of the Choacoet included a longhouse protected by a palisade and a scattering of many smaller camps and cornfields on both sides of the river (Figure 4-1). Champlain’s map was accompanied by a narrative description characterizing the area at the river’s mouth, including Wood Island:
I here visited an island beautifully clothed with a fine growth of forest trees, particularly of the oak and walnut, and overspread with vines that in their season produce excellent grapes. We named it the island of Bacchus. At high water we weighed anchor and ran up the small river barred at its mouth. There is but half a fathom of water on the bar at low tide and about nine, sometimes twelve feet, at high tide; within, there is a depth of four, five and six fathoms. As soon as we had cast anchor, a number of Indians appeared on the banks of the river and began to dance. This river is called by the natives Chouacoet (Owen 1891).
In his narrative, Champlain further described the village’s inhabitants as a large group of sedentary horticulturalists who resided year-round at the village site:
They plant their corn in May and harvest it in September…The fixed abodes, the cultivated fields, and the fine trees led us to the conclusion that the climate here is more temperate and better…than at other places on this coast…The Indians remain permanently in this place, and have large wigwams surrounded by palisades framed of rather large trees placed one against the other; and into this they retire when their enemies come to make war against them (Baker 1988:3).
Prior to European contact, the population of the region’s Abenaki peoples (excluding the Penacook and Micmac) may have been as high as 40,000 (i.e., 20,000 eastern; 10,000 western; and 10,000 maritime). Disease brought by Europeans, however, decimated the Native population. Early contacts with European fishermen resulted in at least two major epidemics among the Abenaki as early as the 1500s: 1) an unknown sickness sometime between 1564 and 1570; and 2) typhus in 1586. The highest rate of Native mortality resulting from European-borne disease occurred during the decade just before English settlement of Massachusetts in 1620, when three separate epidemics swept across New England and the Canadian Maritimes. Maine’s Abenaki were hit especially hard in 1617, when a 75 percent mortality rate prevailed, and the population of the eastern Abenaki plummeted to about 5,000 individuals (Sultzman 1997). Unfortunately, Champlain was the first and last European to describe in writing the Native American settlements of the lower Saco in their intact state. In 1607, the Abenaki settlement at Chouacoet was attacked by another group of native peoples from the North. This inter-tribal warfare continued for
H-25

several years and resulted in great losses for Saco’s native inhabitants. The surviving population was further ravaged by the “virgin soil epidemics” between 1616 and 1619 (Hardiman 1996a, 1996b). In 1613, an English man-of-war under the command of Samuel Argall, Governor of Virginia, was sent to drive off the French and immediately lay siege to its settlements in Maine, taking into custody many of its inhabitants. These actions were significant as the first in a long-lasting campaign of violence between France and England as they fought for dominance in the New World and struggled for possession of the lands comprising today’s eastern Maine and Canada. In 1620, the Plymouth Company was reincorporated under the name of the Plymouth Council by the King for “the planting, ruling, ordering, and governing of New England in America,” a territory that included the coastal lands from Philadelphia to Central Newfoundland (Owen 1891). Conflicts such as King Phillip’s War in 1675, King William’s War of 1689, and Queen Anne’s War of 1702, however, largely prevented extensive settlement of the region. Not until the signing of the Peace of Utrecht in 1713 did conditions became more conducive for settlement in the area. The open conflict waged between English, French, and Native elements during the French and Indian War (1754–1763) again curtailed settlement of Maine’s eastern lands, and its outcome forever changed the cultural landscape of the region. The war ended with the expulsion of the French from North America in 1759, and the loss of most of Maine’s Native territorial rights to the English (Snow 1978b). Until the fall of Quebec in 1759, the few settlements east of Pemaquid were those of coastal fishermen (Duncan 1992:190). This remained the case until Massachusetts Governor Thomas Pownall decided to undertake an expedition to retake the eastern lands and build a fort on today’s Fort Point to control the land adjacent to and within the waters of the Penobscot River. The fort was completed in 1759 and named Fort Pownall in honor of the Massachusetts governor. A brisk trade was initiated with the local Native peoples, and with the War over and the fort completed, a steady stream of settlers flooded into Maine. Between 1761 and 1790, Maine’s population rose from about 17,500 to 96,000 persons (Duncan 1992:190). Within a little more than a decade of Champlain’s exploration of the lower Saco, its dramatic falls, islands, safe harbor, and abundant natural resources began attracting European settlers under the Plymouth Council charter. To prove that Maine’s climate was not too severe for settlement, Sir Fernando Gorges, a prime-mover in securing both the original Plymouth Company charter of 1606 and the subsequent Plymouth Council charter of 1620, sent the captain of his vessel, Richard Vines, and his 32-man crew to the lower Saco to spend the winter of 1616-1617 there. The effort was a success and is memorialized in the name “Winter Harbor” - the location near Biddeford Pool where Vines and his men went into winter quarters (Hardiman 1996a; 1996b; Owen 1891). From 1616 to 1630, Saco Bay was frequented by fishermen and adventurers. One of the latter, Christopher Levett, who visited the lower Saco area in 1623, found that its Abenaki inhabitants who had managed to survive the attacks and plagues, had abandoned their permanent settlements. Instead, Saco’s native presence in the lower Saco area had been reduced to just seasonal visits and the establishment of temporary camps, most notably on today’s Factory Island, formerly known as “Indian Island,” and it remained so for the remainder of the seventeenth through the late-eighteenth centuries (Hardiman 1996a, 1996b).
H-26

The 1616 winter voyage was the first of several voyages to the Maine coast for Vines. In 1630, he finally made Saco his permanent home after he, John Oldham, Thomas Lewis and Richard Bonython were granted patents to tracts of land situated at the river’s mouth (Owen 1891). The grants were made on the condition that Vine and the others would jointly transport 50 people to plant and inhabit their respective tracts to the advancement of the “general Plantation of that country and the strength and safety thereof amongst the natives or any other invaders” (Owen 1891). Colonization of the lower Saco began immediately upon the issue of the patents with Vines taking possession of his plantation on west side of the river in June of 1630, and the other taking theirs on both banks of the river the following year. The first permanent European colonists on the east side of the river (present day Saco) lived near the river’s mouth and included patentees Lewis and Bonython, and settlers Foxwell, Watts, and Warwick (Owen 1891). Although the settlement spanned both sides of the river in what is today the two separate cities of Biddeford and Saco, the settlement was known then simply as the “Saco” settlement. The name Saco itself is attributed to the Abenaki word for “flowing out” or “outlet” and to the word “Sawacotuck” meaning the “mouth of the tidal stream” (Hardiman 1996a, 1996b; ). The area’s first European settlers included fishermen, traders, lumberjacks and farmers. By 1636, at least 37 families had settled in the area, making Saco one of the first and largest permanent settlements in Maine (Figure 4-2). In 1653, the settlement on this grant, along with the Winter Harbor area on south side of the river, were organized officially as Saco and recognized in the General Court in 1659 (Hardiman 1996a; 1996b). Foreshadowing the development of future industries in Saco, Benjamin Blackman purchased 100 acres (ac) of land that included the mill privileges on the east side of the Saco Falls and built a sawmill there in 1680. The fledgling Saco settlement thrived and slowly expanded inland up until the area was raided at the beginning of King Phillip’s War (1675-1678), when a series of conflicts with the region’s native inhabitants began. These wars eventually led to the destruction and abandonment of all houses and mills near the falls and the displacement of the area’s settlers back to the earlier settlement sites at the mouth of the river by the outbreak of King William’s War in 1690. For most of the remainder of the seventeenth century, the area remained sparsely settled due to the devastation wrought by years of conflict between the Native American inhabitants and European colonists. It was not until after the signing of the Treaty of Utrecht of 1713 that any significant resettlement effort was made in Saco. After 1713, the Saco side of the river quickly developed and became a prosperous farming, fishing and lumbering community. Prominent among Saco’s early settlers and entrepreneurs was William Pepperell, a merchant from Kittery, who in 1716 purchased 5,000 ac and timber rights to an additional 4,500 ac on the east side of the Saco River (Hardiman 1996a; 1996b). Pepperell sold off parts of his holdings to millwright Nathaniel Weare and mariner Humphrey Scamman to help further develop his lumbering business (Figure 4-3). In 1718, Saco’s principal roads - Main Street and the Portland, Buxton, and Ferry Roads, were laid out on the eastern side of the river. The following year, the former Saco settlement area (i.e., the area including present-day Biddeford and Saco) was renamed and incorporated as the town of Biddeford, the fourth township in Maine. The new town of Biddeford continued to grow steadily throughout the eighteenth century, as the area’s enormous resources for fishing, lumbering, shipbuilding, and water-powered milling attracted new settlers to both banks of the lower Saco River. Pepperell donated four ac of land to the eastern part of Biddeford (present day Saco) for use as a village common, a burying ground, and the site for a new meetinghouse. In 1762, settlers on the eastern bank of the Saco separated from Biddeford and received a separate incorporation for about 17,500 ac of land under the name of Pepperellborough, in honor of the recently
H-27

deceased Sir William Peperellborough, a major proprietor of the area’s lands (Hardiman 1996a, 1996b; Hebert 1951; Owen 1891; Varney 1882). Thus, the new town of Saco eventually came to be bounded by the river and Biddeford to the southwest, Scarborough to the northeast, Buxton to the west and northwest, and with Old Orchard Beach and Saco Bay to the east. The long course of the Saco from the White Mountains in New Hampshire provided endless supplies of natural resources and countless potential markets for trade goods. Farming, lumbering, and ship building bloomed and prospered during the middle eighteenth century, and the settlement of Saco became concentrated on the riverfront at the falls. Colonel Thomas Cutts of Kittery came to Saco in 1758 and embarked on extensive enterprises, buying a share of Indian or Factory Island. Initially, Cutts built a house and a small store on the island and engaged in shipbuilding and navigation, developing a very profitable and extensive timber trade with the West Indies. By the late 1700s, Cutts owned nearly the entire island. At the start of the American Revolution, the volume of international commerce coming in and out of the port required the town’s government to establish a customs house near the town wharves. Between 1762 and 1800, the town’s population grew from 540 to 1,842 people (Hardiman 1996a, 1996b; Hebert 1951; Owen 1891; Varney 1882). In 1805, the town dropped the awkward Pepperellborough name for the area’s original and simpler Abenaki name, Saco, and embarked upon what was a century-long transformation into a major industrial city and port. Development of the industrial center on Factory Island was paralleled by the rapid growth of Saco’s commercial center near the falls around Pepperell Square, originally call the ‘haymarket.’ The square was ideally situated between the mills above the falls and the wharves below the falls, and was at the cross-roads to the upper and lower bridges to Cutts Island (Hardiman 1996a, 1996b; Hebert 1951; Owen 1891; Varney 1882). Saco’s principal industries throughout the first half of the nineteenth century were sawmilling and shipbuilding. In 1800, there were 17 sawmills in operation near the falls, milling 50,000 board feet per day. By 1827, Saco’s sawmills were producing and shipping 21 million board feet of lumber per year. Heavy industry arrived in Saco in 1811 when Cutts and his business partner, Joseph Calef, established the Saco Iron Works and erected an iron-rolling and iron-slitting mill and installed 11 machines for making nails. The nail factory was followed in 1825 by the purchase of Cutts Island with its tremendous water power potential, and thriving iron works. In 1826, the Saco Manufacturing Company was established by a group of Boston capitalists who constructed the first of many of Saco’s cotton milling factories. At 210 ft (64 m) long-x-47 ft (14.3 m) wide-x-seven stories tall, and powered by water directed through a canal cut through solid rock, the brick cotton mill complex employed 400 people working 1,200 spindles and 300 looms, and was the largest of its kind in the United States at that time. The venture ended prematurely in 1830, when the mill burned to the ground, but the seed of industry was planted and a new corporation, the York Manufacturing Company, built a larger brick cotton mill complex on the same site in 1831. The massive York mill complex consisted of five separate mills employing 1,200 people operating about 35,000 spindles and 800 looms that produced 6 million yards of cotton goods annually. The York and its successors milled cotton goods on Factory Island from 1831 to 1958 (Hardiman 1996a, 1996b; Hebert 1951; Owen 1891; Varney 1882). The opening of the mills in 1826 had far-reaching effects that led to the urbanization of Saco, as the factories brought new prosperity to the area and generated business for merchants, shippers, farmers and tenement owners. With the development of massive cotton mills on the western falls of the Saco River, the sister cities of Biddeford and Saco became leaders of manufacturing in the industrial age. The enormous milling operations attracted skilled workers from other urban centers, including the textile
H-28

centers of England and Scotland. The arrival of the Portland, Saco, and Portsmouth Railroad in 1842 ushered in a new era of transportation of goods and passengers in and out of Saco. Between 1820 and 1850, Saco’s population more than doubled from 2,532 to 5,797. The second half of the nineteenth century saw an even more massive influx of immigrants into the region from Europe and Quebec. Irish immigrants arrived in the 1840s and 1850s, French Canadians in the 1850s, 1860s and 1870s, and eastern Europeans in the 1880s and 1890s (Hardiman 1996a, 1996b; Hebert 1951; Owen 1891; Varney 1882). The growth of a technically-skilled population in Saco attracted other technical industries to the area, including foundries, belting and harnessing factories, and, most importantly, machine shops. By the middle of the nineteenth century, the dramatic expansion of the cotton mills erected by the York Company, the Saco Company, the Laconia Company, and the Pepperell Company in Biddeford pulled the center of commerce to York Square on Factory Island. Over the subsequent 25 years, Saco added dozens of industries to its downtown and riverfront (e.g., cotton mills, machine shops, iron foundries, and cigar factories) (Hardiman 1996a, 1996b; Hebert 1951; Owen 1891; Varney 1882). In 1850, Biddeford first surpassed Saco in population and by the end of the century it was more than double the size of Saco. Saco’s population dropped for the first time in over a century between 1860 and 1870. The Civil War and the Panic of 1873 both caused temporary declines in the cotton textile industry and in local farming, as the supply of southern cotton was interrupted and the farmers of the northeast abandoned their infertile hill farms for the more fertile lands and greater opportunities of the Midwest and the western United States. Whole towns that were occupied for one or two generations were then abandoned (Baker 1986). Saco’s economy continued to prosper through the second half of the century, despite stagnant population figures for the period. By the late 1800s, Saco had four saw-mills, three planning and molding mills, three door, sash and blind factories, several carriage factories, a tannery, a bleachery, as well as belting, boot and shoe, loom-harness, soap, and other types of factories. Saco was incorporated as a city in 1867 to better enable it to meet the pressures of growth and the increased need for services for its citizens. Part of the problem with administering services came from the development of a large suburb nearly four miles from City Hall at Old Orchard. The petition to separate Old Orchard from Saco passed in 1883, and created the city’s second major drop in population in 20 years. Expansions at the York Mills in the 1880s and other improvements in the economy led to a flurry of long overdue public improvement projects (e.g., the construction of a sewer system, the establishment of the Saco and Biddeford Water Company, and the continued improvement of navigation into the river). After the turn of the twentieth century, Saco experienced its first period of sustained population growth since before the Civil War, but the majority of the growth was in the out-lying areas, particularly in Camp Ellis and Ferry Beach. In 1900, one third of the population lived in the city’s three downtown wards within half of a mile of York Square; by 1950, these three wards only accounted for a fifth of the population. Because York Mills remained the city’s largest employer, the downtown commercial district continued to prosper and several building were erected before the stock market crash in 1929 and the Great Depression of the 1930s that followed in its wake. During World War II, Saco’s economy began to undergo significant changes. The city’s lumber milling industry began to decline, with the last Saco River log drive in 1943. Saco’s long-standing position as a major textile manufacturing center also declined. The pace of this decline was greatly accelerated by the closing of the York Division of Bates Manufacturing in 1958. For over a century, the York Mills had been Saco’s largest employer and tax payer. Economic development efforts have created new
H-29

opportunities through the establishment of business parks, and the development of tourism and retail. Redevelopment and adaptive reuse of Saco’s mill district has become an increasingly important part of Saco’s economic stimulus effort, as has the promotion of the city’s natural recreation areas, which include Ferry State Beach Park, the Saco River, the Saco Heath, the Saco Bay Trails and Camp Ellis Beach.
H-30

CHAPTER FIVE
RESULTS AND RECOMMENDATIONS Archival Research Results Prehistoric Archaeological Sensitivity No previously documented prehistoric sites are recorded in the Camp Ellis Beach project survey area, or in the immediate adjacent onshore area (i.e., within 0.25 mi [0.4 km]). However, MPHC’s prehistoric site files do contain records of six Native American archaeological sites, dating from the late Ceramic to Contact periods, which are located less than one mi (1.6 km) from the project survey area. The location of the proposed project also fits the model for high-potential prehistoric land use, because of its proximity to a major river, the river’s mouth, and its resource-rich confluence with the open ocean. Review of available environmental data and sea level rise curves for coastal Maine (Sanger 1988; Price and Spiess 2007 citing Barnhardt et al. 1995) indicates that the entire Camp Ellis Beach project survey area was likely exposed land available for human occupation from the beginning of the Paleoindian period (ca. 11,500 B.P.) up until the start of the Late Archaic period (ca. 6000 B.P.). Between about 6000 B.P. and 3000 B.P., a time frame corresponding with the beginning of the Late Archaic period to the start of the Ceramic period, the area was gradually inundated by what likely would have been a destructive marine transgressive process of shore-face retreat, as rising sea level caused the shoreline and surf-zone to migrate landward across the project survey area. By the beginning of the Ceramic period (3000 B.P.), the project survey area would have been entirely underwater. While it is hypothetically possible that the project survey area could contain terrestrial and maritime activity-associated prehistoric archaeological deposits spanning the entire prehistoric cultural sequence, one can only conclude that the combined effects from the area’s inundation through the destructive shore-face retreat process, its exposure to high-energy impacts from wind-driven oceanic waves and tidal currents, and the recent and significant erosion that Camp Ellis Beach has been experiencing have very likely eroded and destroyed any archaeologically sensitive paleosols and prehistoric sites that might have been present within the project area. Consequently, the Camp Ellis Beach project area is assessed as having a low potential for containing contextually intact, formerly terrestrial and/or maritime-related prehistoric and contact period Native American archaeological deposits. Historic Archaeological Sensitivity Review of the MHPC historic sites online database and other available shipwreck databases for the region report 24 vessel casualties along the Saco and Biddeford coasts; however, none of the historic archaeological sites (i.e., shipwrecks or coastal infrastructure) are recorded within the project survey area or on the adjacent shore. Review of Saco’s post-contact period history, however, indicates that the lower Saco was the site of some of the earliest European incursions into the New World, as well as the location of some of the earliest European settlements in the Northeast, particularly near the river’s mouth. Archival research also indicates that Saco has a long, rich history of maritime activity, including fishing and local, regional and international trade, with the mouth of the river being the focus of vessel traffic for over 400 years. Considering these variables, one might conclude initially that the project area has high archaeological sensitivity. However, most shipwrecks that are reported and included in the available databases are those that occurred close enough to land to be witnessed and recorded by shore-side observers. Given the close proximity of the project area to both shore and an active harbor entrance, it
H-31

seems unlikely that if a shipwreck had occurred within the project area, that its presence would have gone un-noticed and undocumented in the historic record. It is, however, possible that the wrecks of smaller, older vessels from the contact and early post-contact periods may have grounded and wrecked on Camp Ellis Beach and been lost to history without being documented. Taking into account each of these considerations, the Camp Ellis Beach project area is assessed as having a moderate potential for containing contextually intact historic period archaeological deposits. Archaeological Field Survey Results CRE’s remote sensing survey of the Camp Ellis Beach project area produced a high quality, comprehensive data set for determining the presence/absence of historically significant submerged archaeological deposits (Appendix B). Recorded water depths within the project survey area ranged from -5.5 to -14 ft (-1.7 to -4.3 m) below the NAVD88 Elevation (i.e., approximately +0.15 to -8.75 ft [+0.5 to -2.7 m] MLLW) (Figure 5-1). Analysis of the recorded side-scan sonar data indicated that the bay floor’s sediments within the survey area are variable in nature, with fine sands appearing to comprise a majority of the substrate, particularly in its northern portion. Sand ripples and low-magnitude sand waves (i.e., sand waves with a 2 ft (0.6 m) wavelength and 0.2 to 0.6 ft [0.6 to 0.2 m] amplitude) were observed throughout the survey area. A ledge outcrop was observed along the eastern boundary of the survey area. A total of 22 side-scan sonar anomalies, comprising 17 separate targets (i.e., some of the anomalies were the same target seen on and inventoried from adjacent survey track lines), and 9 separate magnetic anomalies (Appendices C and D) were inventoried during the survey. Recorded side-scan targets were generally small, linear and low profile, and ranged in size from just 4.80 to 22.18 ft (1.5 to 6.8 m) long, 0.77 to14.25 ft (0.2 to 4.3 m) wide, and 0.00 to 5.33 ft (0 to 1.6 m) tall. Recorded magnetic anomalies ranged from 16 to 112 gammas in amplitude and 8 to 125 ft (2.4 to 38 m) in duration. There were only three instances of correlation between side-scan sonar targets and magnetic anomalies (see Appendices C and D). The side-scan sonar and magnetometer anomalies recorded in the project survey area were interpreted to be associated with a sunken modern core drilling barge and its associated steel boring tubes and debris (Figures 5-2 and 5-3), other pieces of isolated modern debris, or exposed and buried geological features. Buried deposits of maffic rock (i.e., stone with ferromagnetic properties) were observed to produce two roughly northeasterly trending magnetic “ridges” in the ambient magnetic field (Figure 5-4). None of the documented remote sensing targets or anomalies is interpreted to be archaeological deposits. Sub-bottom profile data acquired during the survey was limited to a penetration of depth of just 2 to 5 ft (0.6 to 1.5 m) below the bay floor, except in two areas where the profiler’s acoustic signal penetrated the substrate to the acoustic basement, located approximately 26 ft (8 m) below the bay floor’s surface (Figure 5-5). No acoustic reflectors indicative of buried cultural or geological features of interest were observed in the sub-bottom profiler data. Geotechnical Data Review Results Logs and a locator map for 20 geotechnical boring samples recovered in the Camp Ellis project area and documented by GEI Consultants, Inc. (GEI) and provided to Fathom by the NAE, were reviewed for comparison with the sub-bottom profiler data and for evidence of possible stratified paleosols (Appendix E). Analysis of geotechnical boring data revealed that the recovery depths of the borings ranged from 24 to 100 ft (7.3 to 30.5 m). The stratigraphic sequence observed in most of the samples consisted of an upper stratum composed of sand mixed with silt and gravel ranging from 2 to 52 ft (0.6 to 16 m) thick, overlying a thick stratum of clay (the Presumpscot Formation). In several cases (i.e., boring samples FD-
H-32

38
03, FD-05, FD-06a, and FD-18) a basement of compacted gravel or bedrock was encountered under the sand and/or clay strata at depths below the bay floor’s surface ranging from 23 to 48 ft (7 to 15 m). Based on the review of the available boring logs, none of the boring samples appeared to contain sediments with characteristics strongly suggestive of archaeologically sensitive stratified paleosol deposits. Recommendations While the lands adjacent to the Camp Ellis Beach project area have a long history of human activity reflecting a coastally-oriented, maritime-based settlement pattern and economy that spans most of the prehistoric through historic periods, a systematic multidisciplinary investigation consisting of archival research, remote sensing archaeological field survey, and a review of available geotechnical data from the Camp Ellis Beach project area revealed it contains no remote sensing targets/anomalies or buried geological features that are suggestive of archaeological deposits or archaeologically sensitive paleosols. Based on the combined results from this study, no additional archaeological investigation of the proposed Camp Ellis Beach nearshore breakwaters and jetty-spur project area is recommended.
H-33

BIBLIOGRAPHY
Almquist, H., A. C. Dieffenbacher-Krall, R. Flanagan-Brown, and D. Sanger 2001 The Holocene Record of Lake Levels of Mansell Pond, Central Maine, USA. The
Holocene 11:189-201. Almquist-Jacobson, H., and D. Sanger 1995 Holocene Climate and Vegetation in the Milford Drainage Basin, Maine, U.S.A., and
Their Implications for Human History. Vegetation History and Archaeobotany 4:122-222.
Aneskiewicz, Richard J. 1986 Marine Archaeology: A Problematic Approach to Resolution of Unidentified Magnetic
Anomalies. Proceedings from the Seventh Annual Gulf of Mexico Information Transfer Meeting, U.S. Department of the Interior, Minerals Management Service, Gulf of Mexico OCS Regional Office, New Orleans, LA.
Baker, Emerson W., Edwin A. Churchill, Richard S. D’Abate, Kristine L. Jones, Victor A. Kondrad, and Harold E. L. Prins (eds.) 1994 American Beginnings: Exploration, Culture, and Cartography in the Land of
Norumbega. University of Nebraska Press, Lincoln, NE. Baker, Emerson W. 1986 The York County Archaeological Survey: Report on the 1985 Season. Submitted to the
Maine Historic Preservation Commission and the Old York Historical Society. 1987 Archaeology in the Saco Area. Retrieved from the world wide web: http://www.sacomaine.org/community/history/archaeology.shtml. 1988 Report on the York County Archaeological Survey – Part Three. Presented to the Maine
Historic Preservation Commission. York Institute Museum, Saco, ME. Barnhardt, Walter, A., W. Roland Gehrels, Daniel F. Belknap, and Joseph T. Kelley 1995 Late Quaternary Relative Sea-level Change in the Western Gulf of Maine: Evidence for
a Migrating Forebulge. Geology 23(4):317-320. Belknap, D. F. and R. C. Shipp 1991 Seismic Stratigraphy of Glacial Marine Units, Maine Inner Shelf. In Glacial Marine
Sedimentation; Paleoclimatic Significance: Geological Society of America, Special Paper 261 (Anderson, J. B., and G. M. Ashley, eds.) pp. 137-157.
Belknap, Daniel F., R. Craig Shipp, Robert Stuckenrath, Joseph T. Kelley, and Harold W. Borns, Jr. 1989 Holocene Sea-Level Change in Coastal Maine. In Neotectonics of Maine: Studies in
Seismicity, Crustal Warping, and Sea-Level Change (Anderson, Walter A. and Harold W. Borns, eds.). Maine Geological Survey, Department of Conservation Bulletin 40, Augusta, ME.
H-34

Belknap, Daniel F., and John C. Kraft 1985 Influence of Antecedent Geology on Stratigraphic Preservation Potential and Evolution
of Delaware’s Barrier Systems. In Barrier Islands (Oertel, G. F., and S. P. Leatherman, eds.). Special issue of Marine Geology 63:235–262.
Bell, David L., and Thaddeus A. Nowak 1993 Some Quality Control Considerations of Remote Sensing Survey for Archaeological
Sites. In Underwater Archaeology Proceedings from the Society for Historical Archaeology (Sheli O. Smith, ed.), pp. 145–150. Society for Historical Archaeology, Tucson, AZ.
Berman, Bruce D. 1972 Encyclopedia of American Shipwrecks. The Mariners Press, Boston, MA. Bloom, A. L. 1963 Late Pleistocene Fluctuations of Sea-Level and Post-Glacial Rebound in Coastal Maine.
American Journal of Science 261:862-879. Bourque, B. J. 1995 Diversity and Complex Society in Prehistoric Maritime Societies: A Gulf of Maine
Perspective. Plenum Press, New York, NY. 2001 Twelve Thousand Years: American Indians in Maine. University of Nebraska Press,
Lincoln, NE. Brasser, T. J. 1978 Early Indian-European Contacts. In Handbook of North American Indians: Northeast
(Vol. 15), edited by Bruce G. Trigger, Smithsonian Institution, Washington, D.C. Breiner, Sheldon 1973 Applications Manual for Portable Magnetometers. Geometrics, Sunnyvale, CA. Brown, A. G. 1997 Floodplain Archaeology and Environmental Change. Cambridge Manuals in
Archaeology, Cambridge, UK. Caldwell, D. W. 1998 Roadside Geology of Maine. Mountain Press Publishing Company, Missoula, MN. Cox, Belinda J., and James B. Petersen 1997 The Varney Farm (36-57 ME): A Late Paleoindian Encampment in Western Maine.
Maine Archaeological Society Bulletin 37(2):25–49. Crock, John G., James B. Petersen, and Ross M. Anderson 1993 “Scalloping for Artifacts: A Biface and Plummet from Eastern Blue Hill Bay,” in
Archaeology of Eastern North America 21:179–182.
H-35

Davis, Harold A. 1950 An International Community on the St. Croix (1604-1930). University Press, Orono, ME. Davis, Ronald B., and George L. Jacobson, Jr. 1985 Late Glacial and Early Holocene Landscapes in Northern New England and Adjacent
Areas of Canada. Quaternary Research 23:341-68. Dincauze, Dena F. 1976 The Neville Site: 8,000 Years at Amoskeag, Manchester, New Hampshire. Peabody
Museum Monographs 4. Harvard University, Cambridge, MA. 1993 Fluted Points in the Eastern Forest. In From Kostenki to Clovis: Upper Paleolithic Paleo-
Indian Adaptations. Chapter 20, edited by Olgo Soffer and N.D. Praslov, pp. 279–292. Plenum Press, New York, NY.
Dincauze, D. F., and M. L. Curran 1983 PaleoIndians as Generalists: An Ecological Perspective. Paper presented at the annual
meeting of the Society for American Archaeology, Pittsburgh, PA. Dincauze, Dena F., and Mitchell Mulholland 1977 Early and Middle Archaic Site Distributions and Habitats in Southern New England.
Annals of the New York Academy of Sciences 288:439–456. Doyle, R., N. Hamilton, J. Petersen, and D. Sanger 1985 Late Paleo-Indian Remains from Maine and their Correlations in Northeastern Prehistory.
Archaeology of Eastern North America 13:1–34. Duncan, Roger F. 1992 Coastal Maine: A Maritime History. W. W. Norton & Company, Inc., New York, NY. Farrell, S. C. 1972 Present Coastal Processes, Recorded Changes, and the Post-Pleistocene Geologic
Record of Saco Bay, Maine. Unpubl. PhD dissertation. University of Massachusetts, Amherst.
Fish, John Perry 1989 Unfinished Voyages, A Chronology of Shipwrecks: Maritime Disasters in the Northeast
United States from 1606 to 1956. Lower Cape Publishing, Orleans, MA. Fitzgerald, Duncan M., and Peter S. Rosen (editors) 1987 Glaciated Coasts. Academic Press, Inc., San Diego, CA. Fitzgerald, D. M., I. V. Buynevich, R. A. Davis, Jr., and M. S. Fenser 2002 New England Tidal Inlets with Special Reference to Riverine-Associated Inlet Systems.
Geomorphology 48:179-208.
H-36

Fletcher, Charles H., and John F. Wehmiller (editors) 1992 Quaternary Coasts of the United States: Marine and Lacustrine Systems. Society for
Sedimentary Geology, Special Publication No. 48, Tulsa, OK. Flint, Richard Foster 1971 Glacial and Quaternary Geology. John Wiley & Sons, Inc., New York, NY. Gates, Olcott 1989 The Geology and Geophysics of the Passamaquoddy Bay Area, Maine and New
Brunswick, and Their Bearing on Local Subsidence. In Neotectonics of Maine: Studies in Seismicity, Crustal Warping, and Sea Level Change, edited by Walter A. Anderson, and Harold W., Borns, Jr. Maine Geological Survey (Department of Conservation), Bulletin 40:11–24.
Gilman, Richard A., Carleton A. Chapman, Thomas V. Lowell, and Harold W. Borns, Jr.
1988 The Geology of Mount Desert Island: a Visitor’s Guide to the Geology of Acadia National Park (Bulletin 38). Maine Geological Survey, Department of Conservation, Augusta, ME. Gramly, Richard M. 1982 The Vail Site: A Paleo-Indian Encampment in Maine. Bulletin of the Buffalo Society of
Natural Sciences (Volume 30). Buffalo, NY. 1988 The Adkins Site: A Palaeo-Indian Habitation and Associated Stone Structure.
Persimmon Press, Buffalo, NY. Grimes, J. R. 1979 A New Look at Bull Brook. Anthropology 3(1-2):109–130. Grimes, John R., William Eldridge, Beth G. Grimes, Antonio Vacarro, Nicholas Vacarro, and Antonio Orsini 1984 Bull Brook II. Archaeology of Eastern North America 12:159–183. Hardiman, Thomas 1996a An Introduction to Saco History. Retrieved from the world wide web:
http://www.sacomaine.org/community/history/introduction.shmtl. 1996b Downtown Saco History. Retrieved from the world wide web:
http://www.sacomaine.org/community/history/downtown.shmtl. Hasenstab, Robert 1991 Wetlands as a Critical Variable in Predictive Modeling of Prehistoric Site Locations: A
Case Study from the Passaic Basin. Man in the Northeast 42:39–61. Hebert, Richard A. 1951 Modern Maine: Its Historic Background, People and Resources (Vol. II). Lewis
Historical Publishing Company, Inc., New York, NY.
H-37

Hayward, John 1839 The New England Gazetteer. Israel S. Boyd and William White, Boston, MA. Hooke, Roger LeB., Alice R. Kelley, Harold W. Borns, Jr., George Jacobson, Brian S. Robinson, and David Sanger 2006 Glacial and Archaeological Features of the Penobscot Lowland, Central Maine: A
Guidebook Prepared for the 69th Annual Field Conference of the Northeastern Friends of the Pleistocene, June 2-4, 2006, Orono, Maine. Climate Change Institute, University of Maine, Orono, ME.
Hughes, T. J., H. W. Borns, J. L. Fastook, M. R. Hyland, J. S. Kite, and T. V. Lowell 1985 Models of Glacial Reconstruction and Deglaciation Applied to Maritime Canada and
New England. In Late Pleistocene History of Northeastern New England and Adjacent Quebec, edited by H.W. Borns, P. LaSalle, P., and W.P. Thompson. Geological Society of America, Special Paper 197.
Hunter, Lewis E., Ross D. Powell, and Geoffrey W. Smith 1996 Facies Architecture and Grounding-Line Fan Processes of Morainal Banks during the
Deglaciation of Coastal Maine. Geological Society of America Bulletin 85:1022–1038. Johnson, Frederick 1942 The Boylston Street Fishweir. A Study of the Archaeology, Biology, and Geology of a
Site on Boylston Street in the Back Bay District of Boston, Massachusetts. Papers of the Robert S. Peabody Foundation for Archaeology (Vol. 2), Phillips Academy, Andover, MA.
Kelley, J. T. 1987 An Inventory of Coastal Environments and Classification of Maine’s Glaciated
Shoreline. In Glaciated Coasts, edited by D. Fitzgerald and P. Rosen. Academic Press, New York, NY.
2000 The Retreat of Glacial Ice in Maine, 14,000-11,000 B.P. (map). In Twelve Thousand
Years: American Indians in Maine, by Bruce J. Bourque. University of Nebraska Press, Lincoln, NE.
Kelley, J. T. and W. A. Anderson 2000 The Maine Shore and the Army Corps: A Tale of Two Harbors, Camp Ellis and Wells,
Maine. Maine Policy Review 9: 20-35. Kelley, Joseph T., and Daniel F. Belknap 1989 Geomorphology and Sedimentary Framework of Penobscot Bay and Adjacent Inner
Continental Shelf. Open-File No. 89-3. Maine Geological Survey, Department of Conservation, Augusta, ME.
1991 Physiography, Surficial Sediments, and Quaternary Stratigraphy of the Inner Continental
Shelf and Nearshore Region of the Gulf of Maine. Continental Shelf Research 11(8-10):1265–1283.
H-38

Kelley, J. T., and D. F. Belknap, D. M. FitzGerald, D. C. Barber, S. M. Dickson, S. van Heteren, P. A. Manthorp, and L. K. Fink
1995 A Sand Budget for Saco Bay, Maine. Maine Geological survey Open-file Report 95-1, Maine Geological Survey, Augusta, ME. Kelley, J. T., D. F. Belknap, R. C. Shipp 1986 Variability in the Evolution of Two Adjacent Bedrock-Framed Estuaries in Maine. In
Estuarine Variability, edited by D. Wolfe. Academic Press, Orlando, FL. Kelley, Joseph T., Steven M. Dickson, and Daniel F. Belknap 2005 Maine’s History of Sea-Level Changes. Maine Geological Survey. Retrieved from the
world wide web: http://www.maine.gov/doc/nrimc/mgs/explore/marine/facts/sealevel.htm.
Kelley, Joseph T., Daniel F. Belknap, R. Craig Shipp, and Sarah B. Miller 1989 An Investigation of Neotectonic Activity in Coastal Maine by Seismic Reflection
Methods. In Neotectonics of Maine: Studies in Seismicity, Crustal Warping, and Sea Level Change, edited by Walter A. Anderson, Harold W. Borns. Maine Geological Survey (Department of Conservation), Bulletin 40:157–204.
Kelley, J. T., S. M. Dickson, D. F. Belknap, and R. Stuckenrath 1992 Sea Level Change and Late Quaternary Sediment Accumulation on the Southern Maine
Inner Continental Shelf. Society of Economic Paleontologist and Mineralogist 48:23–34. Kelley, J. T., A. R. Kelley and O. H. Pilkey
1989 Living with the Coast of Maine. Duke University Press, Durham, NC. Kelley, J. T., R. C. Shipp, and D. F. Belknap 1987a Geomorphology and Sedimentary Framework of the Inner Continental Shelf of
Southwestern Maine. Maine Geological Survey, Open File Report 87-5, Augusta, ME. 1987b Geomorphology and Sedimentary Framework of the Inner Continental Shelf of South
Central Maine. Maine Geological Survey, Open File Report 87-19, Augusta, ME. Kendall, David L. 1996 Glaciers & Granite: A Guide to Maine’s Landscape and Geology. North Country Press,
Unity, ME. Knebel, H. J. 1985 Holocene Depositional History of a Large, Glaciated Estuary, Penobscot Bay, Maine.
Marine Geology 65:305–324. Knebel, H. R., J. Rendigs, R. N. Oldale, and M. H. Bothner 1992 Sedimentary Framework of Boston Harbor Massachusetts, SEPM Special Publications
No. 48, Quaternary Coasts in the United States: Marine and Lacustrine Systems.
H-39

Kraft, John C. 1971 Sedimentary Facies Patterns and Geologic History of a Holocene Marine Transgression.
Geological Society of America Bulletin 82:2131–2158. 1985 Marine Environments: Paleogeographic Reconstructions in the Littoral Region.
Archaeological Sediments in Context (Stein, Julie K. and William R. Farrand, editors). Peopling of the Americas Edited Volume Series (Vol. 1), Center for the Study of Early Man, Institute for Quarternary Studies, University of Maine- Orono, Orono, ME.
Kraft, John C., Daniel F. Belknap, and I. Kayan 1983 Potentials of Discovery of Human Occupation Sites on the Continental Shelves and
Nearshore Coastal Zone. In Quaternary Coastlines and Marine Archaeology: Towards the Prehistory of Land Bridges and Continental Shelves Edited by P.M. Masters and N.C. Flemming, pp. 87–120. Academic Press, London, UK.
Kraft, J. C., D. F. Belknap, and J. M. Demarest 1987 Prediction of Effects of Sea-Level Change from Paralic and Inner Shelf Stratigraphic
Sequences. In Climate: History, Periodicity, and Predictability Edited by Michael R. Rampino, John E. Sanders, Walter S. Newman, and L.K. Konigsson. Van Nostrand Reinhold, New York, NY.
MacDonald, G. 1968 Debert: A Palaeo-Indian Site in Central Nova Scotia. National Museum of Man,
Anthropology Papers, No. 16, Ottawa, Canada. Massachusetts Board of Underwater Archaeological Resources (BUAR) – Paul Sherman Collection of Shipwreck Notes and Information n.d. Notes on file at the BUAR, Office of Coastal Zone Management, Boston, MA. McWeeny, Lucinda J. 1999 A Review of Late Pleistocene and Holocene Climate Changes in Southern New England.
Bulletin of the Archaeological Society of Connecticut 62:3-18. Moorehead, W. K. 1922 A Report on the Archaeology of Maine. The Andover Press, Andover, MA. Northern Maritime Research 2002 Northern Shipwrecks Database. Electronic database (CD-ROM), Northern Maritime
Research, Bedford, Nova Scotia. Oldale, Robert N. 1985a Late Quaternary Sea-Level History of New England: A Review of the Published Sea-
Level Data. Northeastern Geology 7:192–200. 1985b Rapid Postglacial Shoreline Changes in the Western Gulf of Maine and the PaleoIndian
Environment. American Antiquity (50)1:145–150.
H-40

Oldale, Robert N., and Jennifer Bick 1987 Maps and Seismic Profiles Showing the Geology of the Inner Continental Shelf,
Massachusetts Bay, Massachusetts. Miscellaneous Field Study Map MF-1923, U.S. Department of Interior, U. S. Geological Survey, Washington, D.C.
Oldale, Robert N., Steven M. Colman, and Glenn A. Jones 1993 Radiocarbon Ages from Two Submerged Strandline Features in the Western Gulf of
Maine and a Sea-Level Curve for the Northeastern Massachusetts Coastal Region. Quaternary Research 40:38–45.
Oldale, Robert N., Harley J. Knebel, and Michael H. Bothner 1994 Submerged and Eroded Drumlins off Northeastern Massachusetts. Geomorphology
9:301–309. O’Leary, Wayne M. 1998 Maine Sea Fisheries: The Rise and Fall of a Native Industry, 1830–1890. Northeastern
University Press, Boston, MA. Osberg, P. H., A. M. Hussey II, and G. M. Boone 1985 Bedrock Geologic Map of Maine. Maine Geological Survey, Augusta, ME. Ostericher, C. 1965 Bottom and Subbottom Investigations of Penobscot Bay, Maine in 1959. U.S. Nav.
Ocean. Off. Tech. Rept. TR-173. Owen, Daniel E. 1891 Old Times in Saco: A Brief Monograph of Local Events. Biddeford Times Printers, Saco,
ME. Pearson, Charles E., and Allen R. Saltus 1991 Remote Sensing Survey of the Atchafalaya Basin Main Channel, Atchafalaya Channel
Training Project, Sts. Martin and Mary Parishes, Louisiana. Report prepared for the U.S. Army Corps of Engineers - New Orleans District, New Orleans, LA. Coastal Environments, Inc., Baton Rouge, LA.
Pelletier, Bertrand G., and Brian S. Robinson 2005 Tundra, Ice and a Pleistocene Cape on the Gulf of Maine: A Case of PaleoIndian
Transhumance. Archaeology of Eastern North America. 33:163–176. Pirazzoli, P. A., and J. Pluet 1991 World Atlas of Holocene Sea-Level Changes. Elsevier Science, New York, NY. Price, Franklin and Arthur Spiess 2007 A New Submerged Prehistoric Site and Other Fishermen’s Reports Near Mount Desert
Island. Maine Archaeological Society Bulletin 47(2):21-35.
H-41

Rampino, Michael R., and John E. Sanders 1980 Holocene Transgression in South-Central Long Island, New York. Journal of
Sedimentary Petrology 50:1063–1080. Redfield, A. C. 1967 Postglacial Change in Sea Level in the Western North Atlantic Ocean. Science 157:687–
692. Renfrew, Colin 1976 Archaeology and the Earth Sciences. In Geoarchaeology: Earth Science and the Past.
Edited by D.A. Davidson and M.L. Shackley, pp. 1–5. Duckworth, London, UK. Roberts, David C. 1996 A Field Guide to Geology: Eastern North America. Houghton Mifflin Company, New
York, NY. Robinson, B. S. 1992 Early and Middle Archaic Occupation in the Gulf of Maine Region: Mortuary and
Technological Patterning. In Early Holocene Occupation in Northern New England, edited by B.S. Robinson, J.B. Petersen, and A.K. Robinson. Occasional Publications in Maine Archaeology, No. 9. The Maine Historic Preservation Commission, Augusta, ME.
2003 Multiple Boundaries of the Moorhead Burial Tradition. Northeast Anthropology 66:15–
27. Robinson, Brian S., and James B. Petersen 1993 Perceptions of Marginality: The Case of the Early Holocene in Northern New England.
Northeast Anthropology 46:61–75. Rolde, Neil 1990 Maine: A Narrative History. Tilbury House, Publishers, Gardiner, ME. Rowe, William H. 1948 The Maritime History of Maine: Three Centuries of Shipbuilding & Seafaring. W. W.
Norton & Company, Inc., New York, NY. Saco Bay Regional Beach Management Plan
2000 Retrieved from the world wide web: http://smrpc.org/landuse/Coastal/Saco%20Bay%20Plan%20Final.pdf.
Sanders, John E., and Naresh Kumar 1975a Evidence of Shoreface Retreat and In-place “Drowning” During Holocene Submergence
of Barrier’s Shelf off Fire Island, New York. Geological Society of America Bulletin 86:65–76.
1975b Holocene Shoestring Sand on Inner Continental Shelf off Long Island, New York.
American Association of Petroleum Geologists Bulletin 59:997–1009.
H-42

Sanger, David 1979 Discovering Maine’s Archaeological Heritage. Maine Historic Preservation
Commission, Augusta, ME. 1988 Maritime Adaptations in the Gulf of Maine. Archaeology of Eastern North America
16:81–89. Sanger, David, and Douglas C. Kellogg 1989 Prehistoric Archaeology and Evidence of Coastal Subsidence on the Coast of Maine. In
Neotectonics of Maine: Studies in Seismicity, Crustal Warping, and Sea-Level Change, edited by Walter A. Anderson and Harold W. Borns. Maine Geological Survey (Department of Conservation) Bulletin 40, Augusta, ME.
Schnitker, Detmar 1974 Postglacial Emergence of the Gulf of Maine. Geological Society of America Bulletin
85:491–494. Schnitker, D., D. Belknap, T. Bacchus, J. Friez, B. Lusardi, and D. Popek 2001 Deglaciation of the Gulf of Maine. In Deglacial History and Relative Sea-Level Changes,
Northern New England and Adjacent Canada, edited by T. Weddle and M. Retelle. Geological Society of America Special Paper 351.
Shipp, R. Craig, Daniel K. Belknap, and Joseph T. Kelley 1989 A Submerged Shoreline on the Inner Continental Shelf of the Western Gulf of Maine.
Studies in Maine Geology 5:11–28. Maine Geological Survey, Augusta, ME. Slovinsky, Peter A., and Stephen M. Dickson 2003 Variation of Beach Morphology Along the Saco Bay Littoral Cell. An Analysis of
Recent Trends and Management Alternatives. Open File Report 03-78, Maine Geological Survey Department of Conservation.
Smith, Geoffrey W. 1985 Chronology of Late Wisconsinan Deglaciation of Coastal Maine. In Late Pleistocene
History of Northeastern New England and Adjacent Quebec, edited by H. W. Borns, P. LaSalle, and W. B. Thompson. Geological Society of America Special Paper 197.
Smith, G. W., and L. E. Hunter 1989 Late Wisconsinan Deglaciation of Coastal Maine. Studies in Maine Geology 6:13–32.
Maine Geological Survey, Augusta, ME. Snow, Dean 1978a Eastern Abenaki. In Handbook of North American Indians: Northeast (Vol. 15), edited
by Bruce G. Trigger, Smithsonian Institution, Washington, DC. 1978b Late Prehistory of the East Coast. In Handbook of North American Indians: Northeast
(Vol. 15), edited by Bruce G. Trigger, Smithsonian Institution, Washington, DC. 1980 The Archaeology of New England. Academic Press, New York, NY.
H-43

Spiess, A.E. 1990 Maine’s Unwritten Past: State Plan for Prehistoric Archaeology (2nd Draft). Report on
file with the Maine Historic Preservation Commission, Augusta, ME. 1992 Maine Prehistoric Archaeological Sites: Introduction and Management. Report on file
with the Maine Historic Preservation Commission, Augusta, ME. Spiess, Arthur E., and Robert A. Lewis 2001 The Turner Farm Fauna: 5000 Years of Hunting and Fishing in Penobscot Bay, Maine.
Occasional Publications in Maine Archaeology Number Eleven. The Maine State Museum, The Maine State Historic Preservation Commission, and the Maine State Archaeological Society, Augusta, ME.
Spiess, Arthur E., Bruce J. Bourque, and R. Michael Gramly 1983 Early and Middle Archaic Site Distribution in Western Maine. North American
Archaeologist 4(3):225–244. Spiess, Arthur, Deborah Wilson, and James Bradley 1998 Paleoindian Occupation in the New England-Maritimes Region: Beyond Cultural
Ecology. Archaeology of Eastern North America 26:201–264. Stuiver, Minze, and Harold W. Borns 1975 Late Quaternary Marine Invasion in Maine: Its Chronology and Associated Crustal
Movement. Geological Society of America Bulletin 86:99–104. Sultzman, Lee 1997 Abenaki History. Maine.gov - Maine Native American History. Retrieved from the
world wide web: http://www.tolatsga.org/aben.html. Swift, Donald, Daniel J. Stanley, and Joseph R. Curray 1971 Relict Sediments on Continental Shelves: A Reconsideration. Journal of Geology
79:322–346. Thompson, W. B., and H. W. Borns, Jr. (eds.) 1985 Surficial Geologic Map of Maine. Maine Geological Survey, Department of
Conservation, Augusta, ME. Thompson, W. B., Kristine J. Crossen, Harold W. Borns, Jr., and Bjorn G. Andersen 1989 Glaciomarine Deltas of Maine and Their Relation to Late Pleistocene-Holocene Crustal
Movements. In Neotectonics of Maine: Studies in Seismicity, Crustal Warping, and Sea-Level Change, edited by Walter A. Anderson and Harold W. Borns. Maine Geological Survey (Department of Conservation) Bulletin 40, Augusta, ME.
U.S. Army Corps of Engineers 1955 Beach Erosion Control Report on Cooperative Study of Saco, Maine. Waltham, MA. 2008 Safety and Health Requirements Manual (EM 385-1-1 [15 September 2008]. Department
of the Army, U.S. Army Corps of Engineers, Washington, DC.
H-44

50
U.S. Coast and Geodetic Survey 1879 Atlantic Coast Pilot: Eastport to Boston. Government Printing Office, Washington, D.C. Varney, George J. 1882 A Gazetteer of the State of Maine with Numerous Illustrations. B. B. Russell, Boston,
MA. Vaughn, Alden 1965 New England Frontier: Puritans and Indians, 1620-1675. Norton Press, New York, NY. Waters, Michael R. 1992 Principals of Geoarchaeology: A North American Perspective. University of Arizona
Press, Tucson, AZ. Will, R., and E. Moore 2002 Recent Late Paleoindian Finds in Maine. Bulletin of the Maine Archaeological Society
42(1):1–14. Wilson, Deborah, and Arthur Spiess 1990 Study Unit I: Fluted Point PaleoIndian. Maine Archaeological Society Bulletin 30(1):15-
32. Williamson, William D. 1832 The History of the State of Maine; from its First Discovery, A.D. 1602, to the Separation,
A.D. 1820, Inclusive (Two volumes). Glazier, Masters & Company, Hallowell, ME. Willoughby, C. C. 1898 Prehistoric Burial Places in Maine. Archaeological and Ethnological Papers of the
Peabody Museum I(6). Harvard University, Cambridge, MA. Woods Hole Group Environmental Laboratories and Aubrey Consulting, Inc. 2006 Saco River and Camp Ellis Beach Section 111 Project, Saco River and Camp Ellis
Beach, ME. Final Draft Report prepared by Woods Hole Group Environmental Laboratories, Raynham, MA, and Aubrey Consulting, Inc., East Falmouth, MA. Prepared for the U.S. Army Corps of Engineers, New England District, Concord, MA.
Wyman, Jeffries 1868 A Recent Examination of Shell Heaps on Goose Island in Casco Bay, Maine. Boston
Society of Natural History Proceedings 11:288–289. Young, Robert S., Daniel F. Belknap, and David A. Sanger 1992 Geoarchaeology of St. John’s Bay, Maine. Geoarchaeology 7(3):209–249.
H-45

H-46

FIGURES
H-47

H-48

Project Area
Figure 1-1. General location of the Camp Ellis Beach project area within the state of Maine (source: Fathom).
Remote Sensing Archaeological Survey, Camp Ellis Beach Project, May 2010
H-49

Pro
ject
Are
a
Fig
ure
3-1
. E
xcer
pt
of U
SG
S q
uad
ran
gle
map
sh
owin
g C
amp
Ell
is B
each
pro
ject
su
rvey
are
a lo
cati
on a
t th
e m
outh
of
the
Sac
o R
iver
, S
aco,
Mai
ne
(sou
rce:
Fat
hom
201
0).
R
emot
e S
ensi
ng
Arc
hae
olog
ical
Su
rvey
, Cam
p E
llis
Bea
ch P
roje
ct, M
arch
201
0
H-50
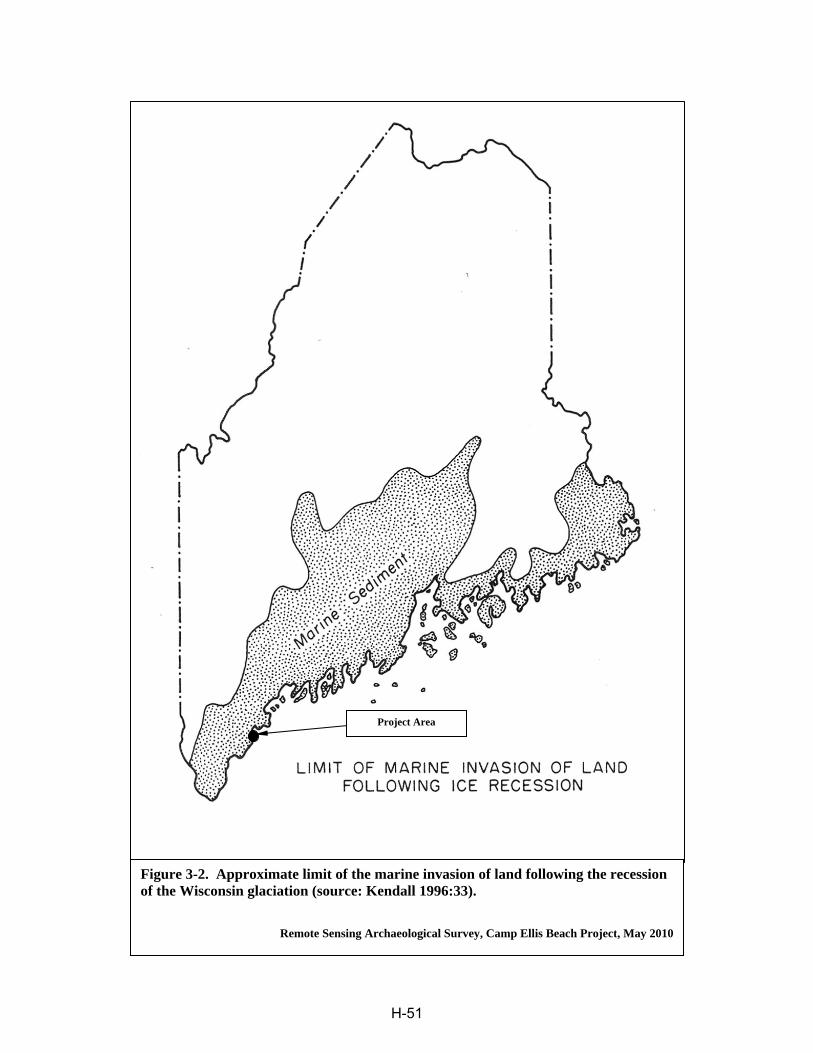
Project Area
Figure 3-2. Approximate limit of the marine invasion of land following the recession of the Wisconsin glaciation (source: Kendall 1996:33).
Remote Sensing Archaeological Survey, Camp Ellis Beach Project, May 2010
H-51

Figure 3-3. Relative sea-level curve for the coast of Maine for the last 14,000 years (source: Crock et al. 1993).
Remote Sensing Archaeological Survey, Camp Ellis Beach Project, May 2010
H-52

Project Area
Figure 4-1. Samuel de Champlain’s 1605 map showing a Native American settlement at the mouth of the Saco River, Saco, Maine (source: Bourque 2001:116).
Remote Sensing Archaeological Survey, Camp Ellis Beach Project, May 2010
H-53

Project Area
Figure 4-2. Map of native tribal territories and European trading posts and settlements 1620-1676 (source: Bourque 2001:130).
Remote Sensing Archaeological Survey, Camp Ellis Beach Project, May 2010
H-54

Project Area
Figure 4-3. Map of the original landholdings of the Saco settlement along the east bank of the Saco River during the early eighteenth century (source: Owen 1891).
Remote Sensing Archaeological Survey, Camp Ellis Beach Project, May 2010
H-55

Figure 5-1. Bathymetric contours (0.5 ft contour interval) as recorded within the Camp Ellis Beach project survey area (source: CRE 2009).
Remote Sensing Archaeological Survey, Camp Ellis Beach Project, May 2010
H-56
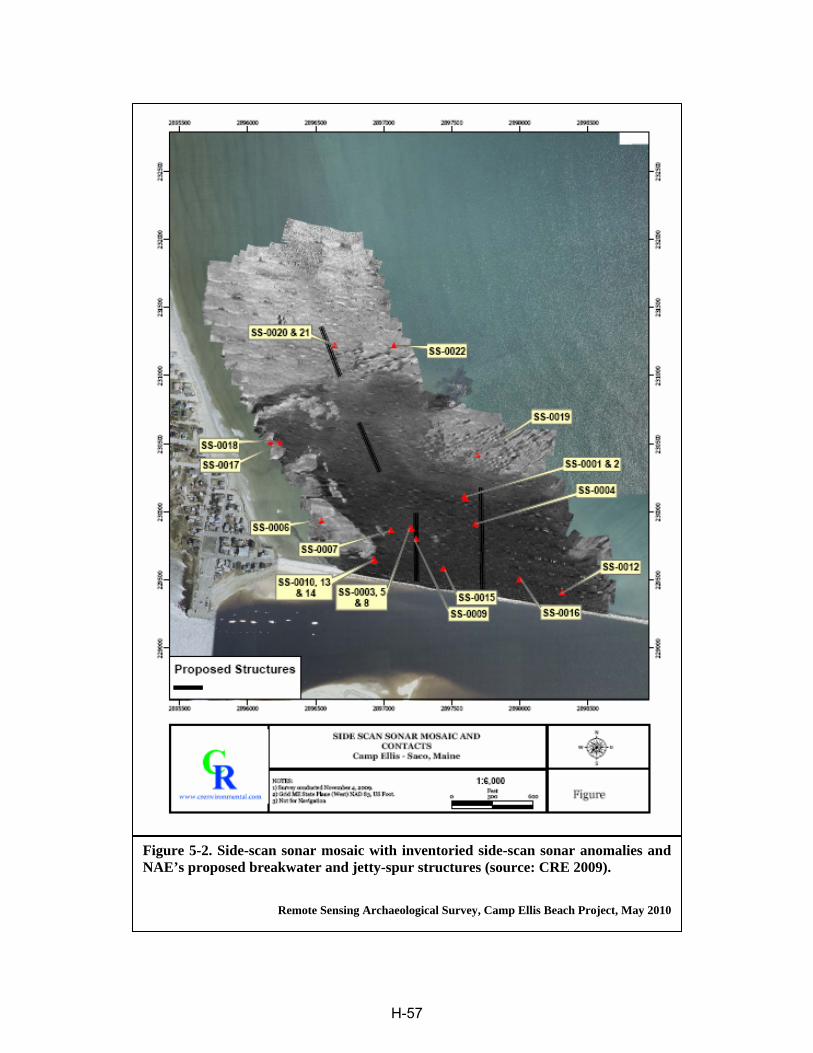
Figure 5-2. Side-scan sonar mosaic with inventoried side-scan sonar anomalies and NAE’s proposed breakwater and jetty-spur structures (source: CRE 2009).
Remote Sensing Archaeological Survey, Camp Ellis Beach Project, May 2010
H-57

Drill Bit
Drill-Barge
Figure 5-3. Sunken modern geotechnical boring drill-barge and displaced drill bits within the Camp Ellis Beach project survey area (source: NAE 2009).
Remote Sensing Archaeological Survey, Camp Ellis Beach Project, May 2010
H-58

Figure 5-4. Ambient magnetic field strength, survey vessel track lines, side-scan sonar and magnetometer anomaly locations and the NAE’s proposed breakwater and jetty-spur structures (source: CRE 2009).
Remote Sensing Archaeological Survey, Camp Ellis Beach Project, May 2010
H-59

Figure 5-5. Contoured acoustic basement depths (2 ft contour interval) as recorded along sub-bottom profile transects “A” and “B” where substantial acoustic penetration was achieved with the 10 kHz sub-bottom profiler (source: CRE 2009).
Remote Sensing Archaeological Survey, Camp Ellis Beach Project, May 2010
H-60

Figure 5-6. Representative examples of 10 kHz sub-bottom profiles recorded in the Camp Ellis Beach project survey area (source: CRE 2009).
Remote Sensing Archaeological Survey, Camp Ellis Beach Project, May 2010
H-61

H-62

APPENDIX A:
PROJECT SCOPE-OF-WORK

H-63

H-64

H-65

H-66

H-67

H-68

H-69
H-70

H-71

H-72

H-73

H-74

H-75
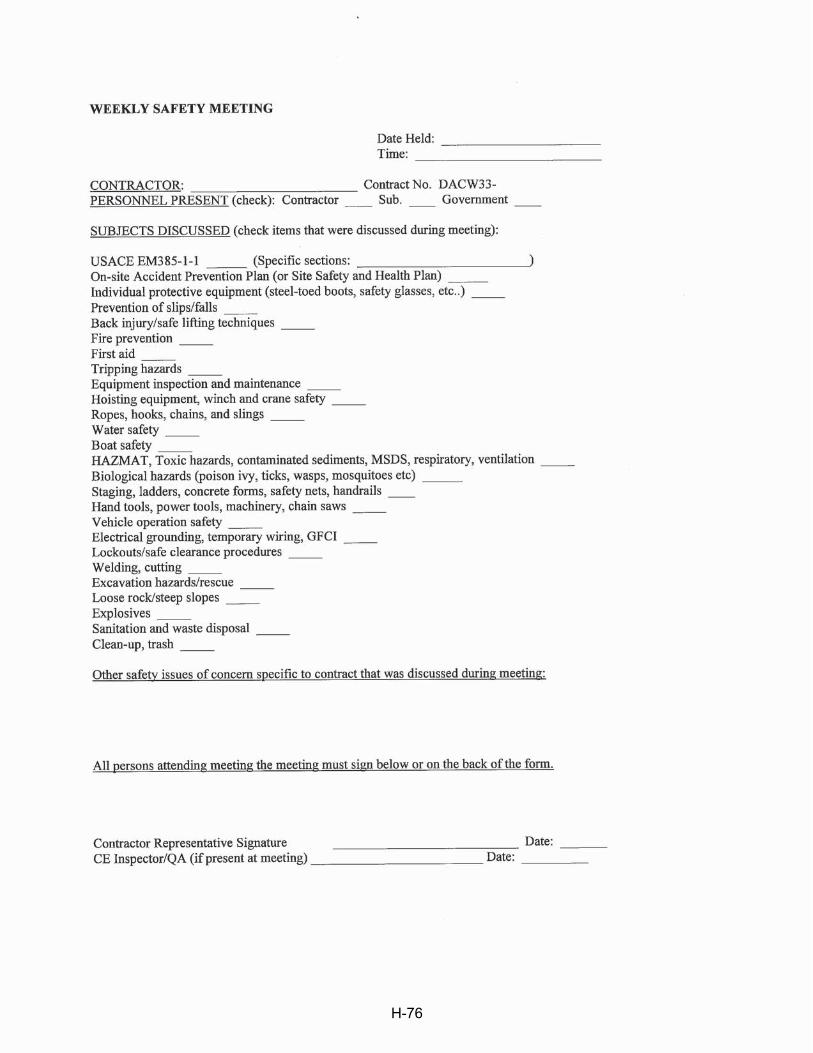
H-76

H-77

H-7
8

H-7
9

H-8
0

H-8
1

H-8
2
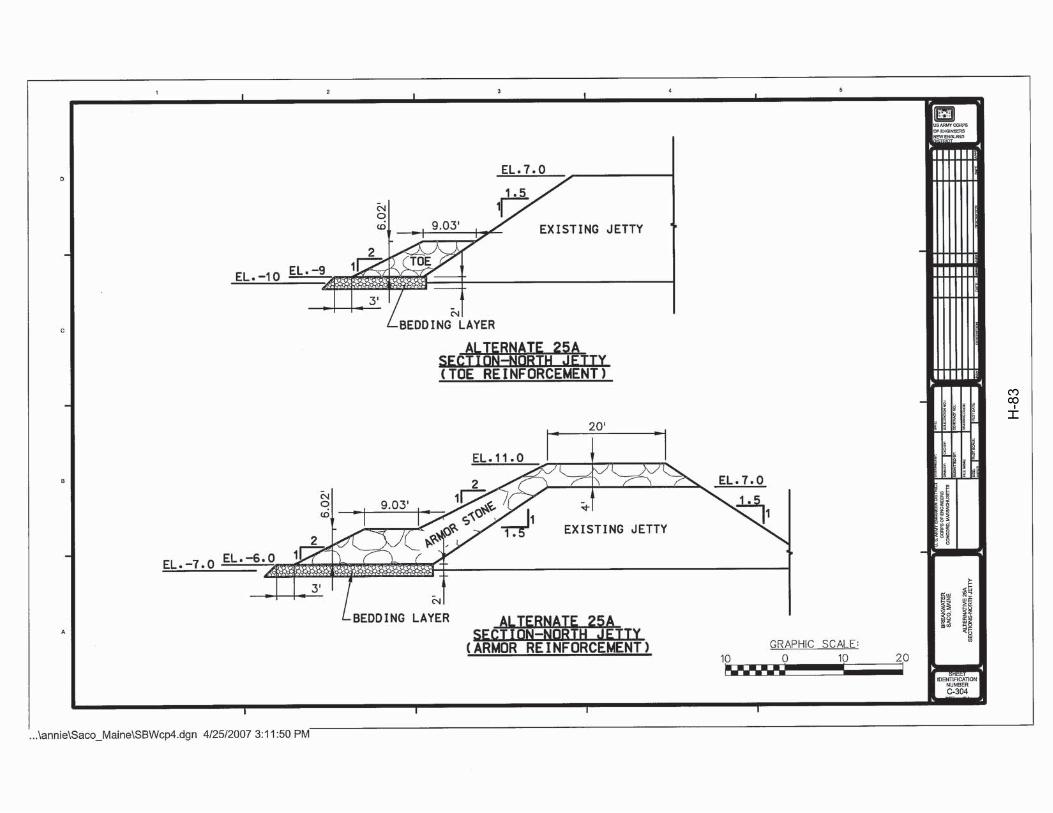
H-8
3

H-8
4
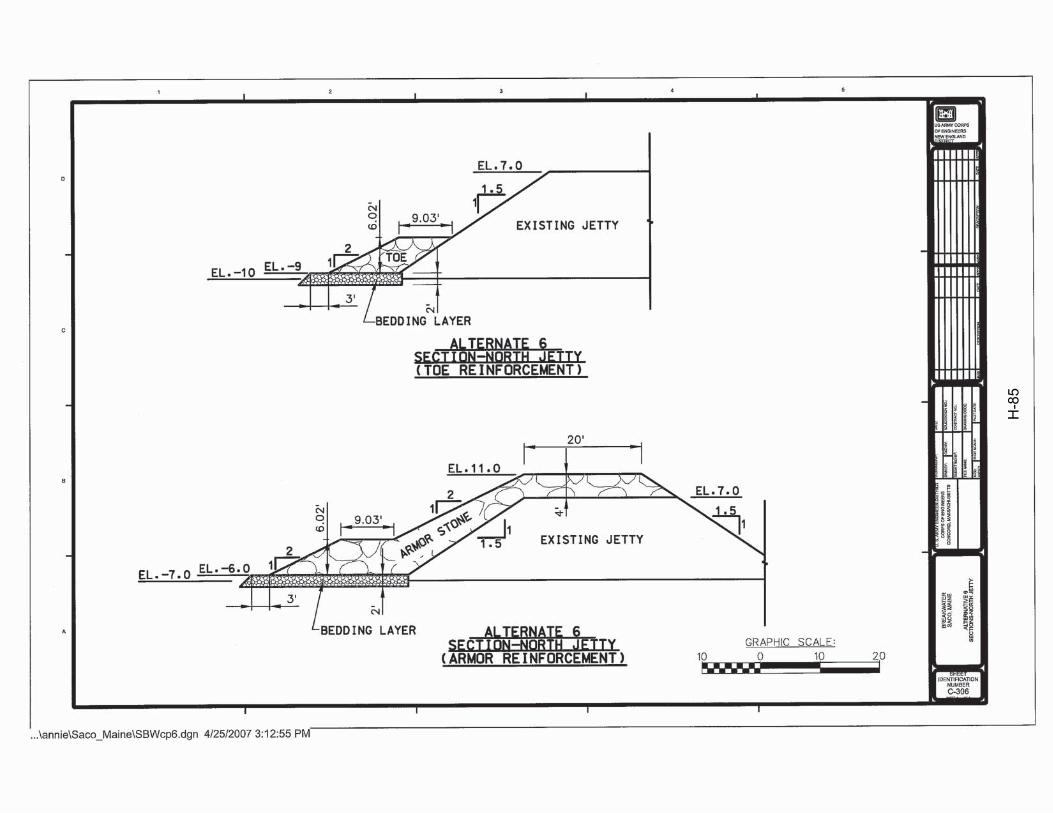
H-8
5

H-86

APPENDIX B:
CRE SURVEY REPORT


639 Boxberry Hill Road, East Falmouth, MA 02536 Phone/fax 508 563-7970 www.crenvironmental.com
March 13, 2010 Mr. David Robinson Fathom Research LLC Suite 315 1213 Purchase Street New Bedford, MA 02536 Re: Hydrographic and Geophysical Surveys, Camp Ellis, Saco Maine 1.0 INTRODUCTION CR Environmental, Inc. (CR) performed bathymetric, side-scan sonar, sub-bottom sonar and magnetic surveys adjacent to the jetty and breakwater on the northern side of the mouth of the Saco River in Saco, ME on November 4, 2009. The surveys were conducted in order to document existing seabed morphometry and to aid an archaeological investigation being conducted by Fathom Research, LLC. The survey area was conservatively designed to provide full seabed coverage within a 500 foot buffer surrounding potential installation locations of wave break structures identified on a CAD plan provided by ACOE. This report summarizes survey and processing methods and presents the results of the geophysical survey. 2.0 GEOPHYSICAL SURVEY METHODS The survey and sampling operations were performed from CR’s aluminum survey and sampling vessel, the R/V Lophius. This vessel is equipped with a 200 horsepower gas outboard, 4-man cabin, over-the-side transducer mounts, 1kW generator, GPS antenna brackets, and a hydraulic A-frame. Using HYPACK MAX hydrographic survey software, a set of survey transects spaced 50 feet apart was digitally created and these planned lines were occupied by the survey vessel. Background imagery including an electronic nautical chart and orthophotos obtained from USGS were also imported to HYPACK to aid survey design and real-time analysis. The primary transects were augmented by perpendicular “cross-tie” transects spaced 200-feet apart to allow verification and statistical analyses of bathymetric data accuracy. Navigation for all aspects of the survey work was accomplished using a Trimble AgGPS 132 12-channel channel Differential Global Positioning System (DGPS) capable of receiving the U.S. Coast Guard (USCG) Beacon corrections and the OMNISTAR subscription-based satellite differential correction service. The DGPS consistently provided a digital output of positions accurate to less than 1.0 meter. The DGPS system
H-87

639 Boxberry Hill Road, East Falmouth, MA 02536 Phone/fax 508 563-7970 www.crenvironmental.com
2
was interfaced to a laptop computer running HYPACK MAX hydrographic survey software. HYPACK continually recorded vessel position and depth data in the Maine West State Plane grid, NAD83 (US Survey Foot), and provided a steering display for the vessel captain. 2.1 Bathymetric Survey The bathymetric data acquisition system consisted of an ODOM CV-100 precision digital echosounder and DGPS interfaced via Ethernet and serial connections to a laptop computer running HYPACK hydrographic survey software. The echosounder’s transducer was mounted to the rail of the survey vessel amidships using a high strength adjustable boom. The DGPS antenna was attached to the top of the transducer boom, eliminating the need to correct for horizontal offsets. The transducer depth below the water surface was checked and recorded at the start and end of the survey. Echo sounder accuracy was verified at the start and end of the survey by comparing echo sounder water depth measurements to known water depths obtained using a surveyor’s staff and the “bar check” method. For the bar check method, a metal plate was lowered beneath the echo sounder’s transducer to several known distances (i.e., 5.0, 10.0 and 15.0 feet) below the water surface. These calibrations were consistently accurate to within 0.1 feet throughout the survey. Additional calibrations were conducted by collecting water column profiles of sound velocity calculated based on measurements of temperature and salinity performed using a Seabird SBE19 water quality profiler. ACOE requested that bathymetric data be vertically referenced to NAVD88. Vertical control for the bathymetric survey was provided by ACOE and consisted of a National Ocean Service (NOS) survey disk (#8606A) located on the Camp Ellis fishing pier. The elevation of this control point was reported as 10.36 feet NAVD88. An Insitu, Inc. Leveltroll pressure gage was installed adjacent to the disk and a series of water surface elevations was acquired using a six-minute recording interval.
2.2 Bathymetric Data Processing Methods Bathymetric data were processed using the HYPACK Single-Beam Processor Module. Components of bathymetric processing included removal of outlying soundings associated with water column interference (e.g., fish, vegetation or mid-water column debris) and conversion of soundings to elevations based on recorded tide data. Data were exported from HYPACK as a delimited ASCII text file, with columns for Easting (X), Northing (Y), and Elevation (Z). This data set was imported to Golden Software, Inc. Surfer V.9.1 Surface Modeling Software. A grid of seabed elevations was created using a triangulation interpolation method and a 20-ft node interval. A contour map depicting bottom elevations using a 0.5-ft contour interval was created from this grid. A relief map was created using conventional hydrographic spectrum shading and 5-fold vertical exaggeration. This map
H-88

639 Boxberry Hill Road, East Falmouth, MA 02536 Phone/fax 508 563-7970 www.crenvironmental.com
3
was exported as a georeferenced TIF image file and incorporated into an ESRI ArcGIS project for comparison with other data layers. Statistical analysis of 255 co-located soundings collected along perpendicular tracklines demonstrated a mean difference between measurements of 0.13 feet (standard deviation = 0.267 feet), likely a result of acquisition in extensive fields of shore-parallel sand waves (see Section 3.2). The 95th percentile confidence interval surrounding the mean difference between compared soundings was calculated as 0.033 feet.
2.3 Side-Scan Sonar Data Acquisition Side scan sonar data were acquired using an Edgetech, Inc. 4100-P system. The system consisted of an Edgetech 272 TD towfish interfaced to a topside processor via an Analog Control Interface (ACI) circuit. The ACI allowed adjustment of both port and starboard signal gains as judged necessary by the sonar operator. Control of the ACI and sonar signal settings was accomplished using Chesapeake Technology, Inc. SonarWizMAP acquisition software. Sonar data were collected using a 500-kHz frequency and 82 ft (25 meter) range scale. Data were acquired along all primary survey transects (spaced 50 feet apart) to ensure >200-percent insonification of the bottom (i.e., all portions of the seabed were imaged at least twice). The towfish was deployed from the vessel’s bow A-frame and the position of the towfish relative to the DGPS antenna was recorded to allow correction during processing. A draft sonar mosaic was produced in real-time during the survey to ensure adequate survey coverage and to allow identification of noteworthy features.
2.4 Side Scan Sonar Data Processing Side scan sonar data were processed using a combination of Chesapeake Technology, Inc. SonarWiz software and HYPACK’s implementation of GeoCoder software developed by NOAA’s Center for Coastal and Ocean Mapping Joint Hydrographic Center. SonarWiz was used to examine raw sonograms and to digitize and measure bottom features of interest. GeoCoder was used to create a mosaic best suited for substrate characterization through the use of innovative beam-angle correction algorithms. Sonar data processed using SonarWiz has been projected to the Maine West State Plane grid (NAD83, US Foot). The mosaic created using Geocoder was projected to UTM Zone 19 North (NAD83, US Foot). Processing of raw side scan sonar data in each software suite consisted of adjustments of data for signal attenuation and georeferencing of sonar imagery (i.e., projection of the sonar data into real-space coordinates). Additional details regarding processing methods are provided below, and results are presented in Section 3.2. For both processing approaches, water column portions of the acoustic returns were removed during the inspection of each survey transect. Data were then adjusted for
H-89

639 Boxberry Hill Road, East Falmouth, MA 02536 Phone/fax 508 563-7970 www.crenvironmental.com
4
signal attenuation with distance using moderate Time Varied Gain (TVG) corrections. Finally, georeferenced transect data and mosaics were created from these processed data. Sonar resolution is defined as the ability of the sonar system to discriminate between two adjacent objects of a particular size and separation. This resolution decreases with increasing range from the sensor due to signal spreading. The theoretical resolution of the side scan sonar data is determined by swath width (range setting), frequency, beam width, ping duration, and vessel speed. Data collected for this survey using a 500 kHz frequency and 25 meter range has a resolution of approximately 5 to 25 cm (~2 to 10 inches) depending on the range. The resolution of the final georeferenced sonar mosaic was set to 0.4 ft per pixel (about 15 cm). Note that sonar “waterfall” image (uncorrected raw data) resolution was not constrained by this pixel size determination. The mosaic was incorporated into a GIS database for comparison with other data (e.g., bathymetry).
2.5 Magnetic Data Acquisition
Magnetic data were collected simultaneously with other data along the same set of survey transects. Magnetic data were acquired using a Marine Magnetics, Inc. MiniExplorer high resolution marine magnetometer system. The magnetic data acquisition system consisted of towfish-mounted Overhauser magnetic sensor and a pressure/depth sensor, an onboard power supply and serial interface, and a data acquisition computer. The 1 Hz data stream from the magnetic sensor was routed to the HYPACK navigation computer via serial port. HYPACK recorded magnetic readings in nanoTeslas (nT – 1 nT = 1 gamma) as a separate field within the same raw data file containing bathymetric soundings. The position of the magnetometer towfish was calculated in real-time using a HYPACK mobile device driver which considered “cable out” relative to the DGPS antenna, the cable catenary curve, and the effects of vessel course corrections. The magnetometer towfish was kept as close to the seabed as practical. The sensor was consistently deployed at a great enough distance from the survey vessel to preclude the potential for magnetic interference from the hull or the vessel’s electronics.
2.6 Magnetic Data Processing
Magnetometer data were processed using HYPACK’s Single-Beam Processor Module. Each magnetic survey transect was first inspected in profile format for characteristic signals which indicate the presence of ferrous anomalies. Processed magnetic measurements were merged into a single ASCII comma-delimited database containing all total field (TF) magnetic intensity measurements for the survey area. The database contained fields for Northing, Easting, and magnitude. This combined data set was imported to Golden Software, Inc. Surfer V.9.1 Surface Modeling Software. A grid of magnetic intensity was created using triangulation interpolation methods and a 10 ft node interval. A contour map was created from this grid depicting TF magnetism using a 1-gamma contour interval and the map was exported in SHP and DXF formats. A second map was created using spectrum shading and this map was exported as a georeferenced TIF image file.
H-90

639 Boxberry Hill Road, East Falmouth, MA 02536 Phone/fax 508 563-7970 www.crenvironmental.com
5
2.7 Sub-Bottom Sonar Data Acquisition
Sub-bottom data were collected using a SyQwest 10-kHz Stratabox sub-bottom profiling system on the same set of survey transects used for bathymetric acquisition. The Stratabox system consists of a cone-shaped transducer mounted to a vertical boom on the amidships rail, an on-board signal processor and amplifier, and a data acquisition computer. Data were recorded using proprietary StrataBox software running on a dedicated laptop computer. The computer was interfaced to the DGPS through a serial port. Offsets between the transducer and the DGPS antenna were recorded to allow for position correction during data processing.
2.8 Sub-Bottom Sonar Data Processing
Stratabox 10 kHz profile data were processed using Chesapeake Technology’s SonarWeb software. Appropriate adjustments to TVG were made during processing. Sub-bottom profiles were exported in JPG format with accompanying HTML-navigable indices and GIS shapefiles (polygons) of transect navigation data, with the width of the polygons corresponding to sonar range settings. Two profile segments were selected and annotated to illustrate data quality, penetration and sub-surface geology. All sub-bottom data products have been projected to the Maine West State Plane grid (NAD83, US Foot). 3.0 BATHYMETRIC AND GEOPHYSICAL SURVEY RESULTS 3.1 Bathymetric Results A bathymetric contour map of the survey area is presented on Figure 1. Soundings were successfully collected from approximately NAVD88 El. -5.4 feet to El. -14 feet (approximately +0.15 feet MLLW to -8.75 feet MLLW). The bathymetric data has been statistically demonstrated to have an uncertainty of less than +/- 0.2 foot. 3.2 Side Scan Sonar Results A side scan sonar mosaic and the locations of digitized sonar Contacts are shown on Figure 2. Sonar contacts of potential anthropogenic origin were digitized and are depicted and described Appendix A. For some objects, multiple (redundant) images and measurements have been provided using data collected along adjacent track lines. A ledge outcrop was observed along the eastern boundary of the survey area. Side scan sonar data suggest that the dominant surficial substrates within the survey area are fine sands. The data suggests that surficial sands are finer in the northern half of the survey area. Sand ripples and low magnitude waves were widespread (e.g., see Appendix A, Contacts SS-0001, SS-0010). The wavelengths and amplitudes of most sand waves were approximately 2 feet, and 0.2 – 0.6 feet, respectively. Some of the sonar contacts appear to be associated with the reported location of drilling barge wreckage and debris (see Contacts SS-0005, SS-0006, and SS-0010).
H-91

639 Boxberry Hill Road, East Falmouth, MA 02536 Phone/fax 508 563-7970 www.crenvironmental.com
6
3.3 Magnetic Survey Results A map depicting survey area magnetism, magnetic measurements (track lines), and magnetic anomalies digitized during profile inspection is presented as Figure 3. The side scan sonar mosaic and Contacts are included on this Figure to allow comparison of data sets. Details describing digitized magnetic anomalies are provided on Table 1. Magnetic anomalies M-6 and M-9 appeared to be associated with the barge wreckage described above. Many of the other magnetic anomalies in the southern portion of the survey area were of low magnitude and duration and may be associated with smaller debris from this drilling barge. The map of total field magnetism identified two roughly northeasterly trending magnetic “ridges”associated with underlying geology. 3.4 Sub-Bottom Sonar Results The sub-bottom sonar system penetrated approximately 2 to 5 feet of sediment throughout the majority of the survey area. Penetration was substantially greater in two regions of the survey area. An isopach map depicting acoustic basement in these regions of the survey area is presented as Figure 4. This map also identifies the two transect segments selected for annotation (see Figure 5). 4.0 ELECTRONIC DELIVERABLES A project DVD is enclosed, and includes this letter report, figures, geophysical data in HTML navigable and GIS/CAD compatible formats, and bathymetry in CAD and GIS compatible DXF format. Bathymetric point data is included in ASCII text format. It was a pleasure working with Fathom on this project. Please feel free to contact us if you have any questions regarding the report or data products. Sincerely, CR Environmental, Inc. Christopher F. Wright Senior Hydrographer John H. Ryther Jr. Marine Operations Manager
H-92

TABLE 1
MAGNETIC ANOMALIES OBSERVED IN PROFILE DATACamp Ellis, Saco Maine(Values in nanoTeslas)
ID TIME X Y BACKGROUND ANOMALY MAGNITUDE SIGNATURE LENGTH (FEET) LINE NOTES
M-1 9:38:27 2896860.68 230260.65 53037.13 52993.2 -43.93 MP- 55 015_0937 Complex. May be related to M-2M-2 9:38:41 2896990.98 230243.65 53042.14 53067.23 25.09 MP+ 64 015_0937 Complex. May be related to M-1M-3 9:57:55 2897992.07 229894.37 53102.25 53035.85 -66.4 MP- 8 011_0955M-4 10:01:54 2898270.27 229798.68 53165.75 53153.2 -12.55 MP- 17 010_1001 Single scan.M-5 10:02:55 2897751.98 229885.87 53084.05 53059.68 -24.37 MP- 25 010_1001 Single scan, but with minor signature on either side.M-6 10:14:34 2896668.17 229919.42 53108.43 53220.38 111.95 MP+ 125 007_1014 Single scan, but with minor signature on either side.M-7 10:16:14 2897571.68 229762.66 53113.87 53026.16 -87.71 MP- 30 007_1014M-8 10:20:43 2897851.38 229663.67 53181.04 53164.05 -16.99 MP- 25 006_1019 Single scan.M-9 10:22:07 2897135.68 229777.06 53133.31 53104.36 -28.95 MP- 24 006_1019 Single scan, but with minor signature on either side.
Notes:
1 1.0 nanoTesla (nT) = 1 "Gamma".2 Length estimated from beginning of signature to end of signature as distance along trackline.3 MP = Monopolar. +/- indicate signature orientation relative to background. 4 Scaled profiles are included in Appendix B. Anomaly locations are shown on Figure 4.
H-93
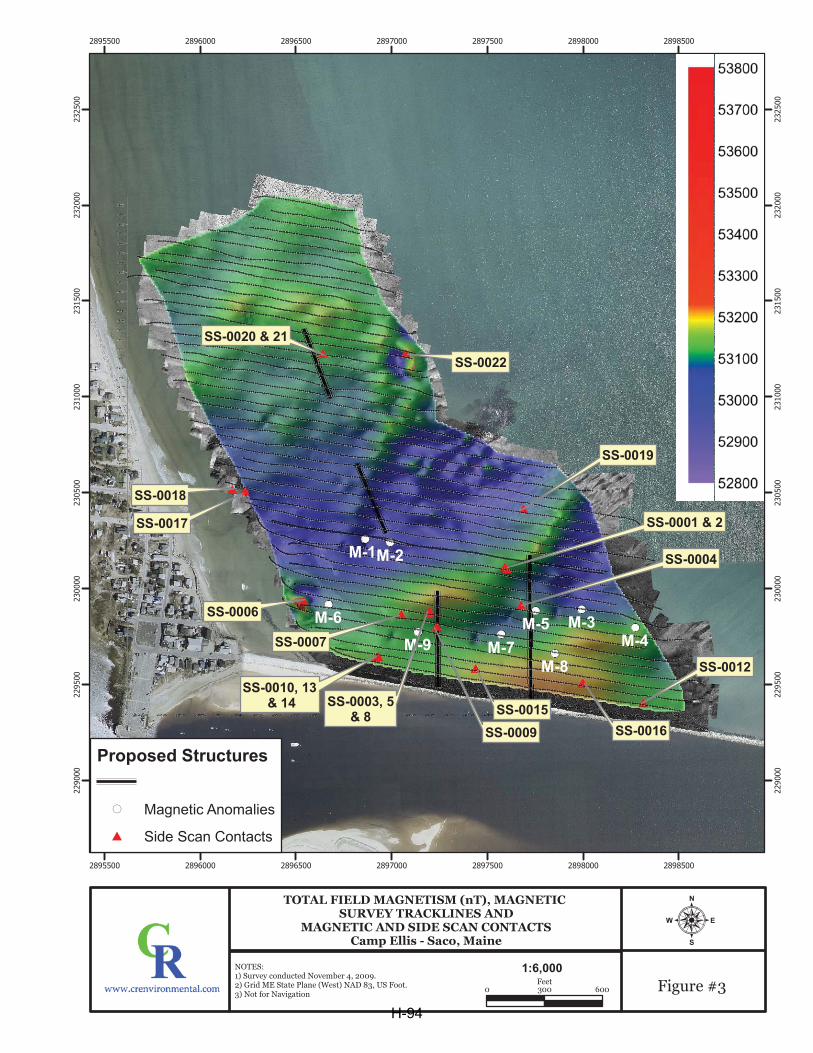
TOTAL FIELD MAGNETISM (nT), MAGNETIC SURVEY TRACKLINES AND
MAGNETIC AND SIDE SCAN CONTACTSCamp Ellis - Saco, Maine
M-9M-8
M-7
M-6 M-5M-4
M-3
M-2M-1
2895500
2895500
2896000
2896000
2896500
2896500
2897000
2897000
2897500
2897500
2898000
2898000
2898500
2898500
229000
229000
229500
229500
230000
230000
230500
230500
231000
231000
231500
231500
232000
232000
232500
232500
Figure #30 300 600Feet
NOTES:1) Survey conducted November 4, 2009.2) Grid ME State Plane (West) NAD 83, US Foot.3) Not for Navigation
:
Proposed Structures
!( Magnetic Anomalies
# Side Scan Contacts
1:6,000
SS-0022
SS-0020 & 21
SS-0018
SS-0017
SS-0006
SS-0019
SS-0001 & 2
SS-0004
SS-0012
SS-0016SS-0015
SS-0010, 13 & 14
SS-0007
SS-0003, 5& 8
SS-0009
H-94

SIDE SCAN SONAR MOSAIC ANDCONTACTS
Camp Ellis - Saco, Maine
##
# ##
## #
#
#
#
#
###
#
##
#
## #
2895500
2895500
2896000
2896000
2896500
2896500
2897000
2897000
2897500
2897500
2898000
2898000
2898500
2898500
229000
229000
229500
229500
230000
230000
230500
230500
231000
231000
231500
231500
232000
232000
232500
232500
Figure #20 300 600Feet
NOTES:1) Survey conducted November 4, 2009.2) Grid ME State Plane (West) NAD 83, US Foot.3) Not for Navigation
:
Proposed Structures
1:6,000
SS-0022
SS-0020 & 21
SS-0018
SS-0017
SS-0006
SS-0019
SS-0001 & 2
SS-0004
SS-0012
SS-0016SS-0015
SS-0010, 13 & 14
SS-0007
SS-0003, 5& 8
SS-0009
H-95
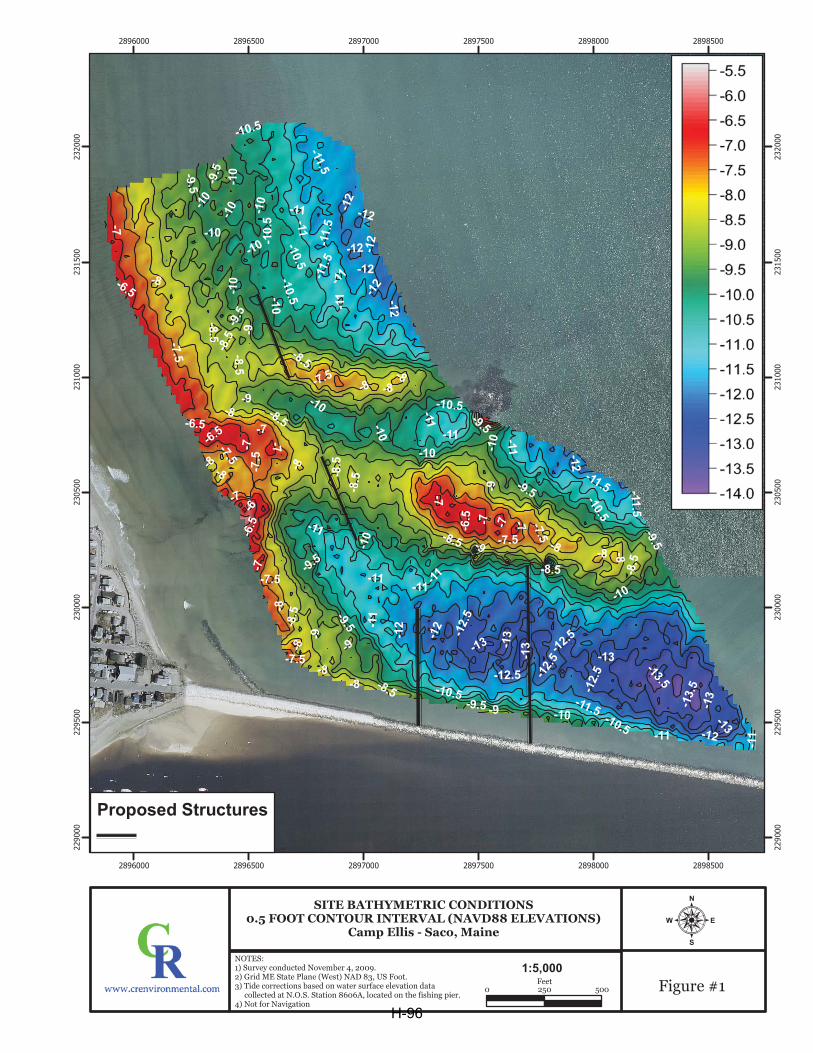
SITE BATHYMETRIC CONDITIONS0.5 FOOT CONTOUR INTERVAL (NAVD88 ELEVATIONS)
Camp Ellis - Saco, Maine
-9
-8
-9.5
-8.5
-11
-7.5
-7
-10
-12
-10.5 -11.5 -13-1
2.5
-6.5
-6
-13.5
-13.
5
-10
-11
-7.5
-10
-11-8
-11.5
-12
-6.5
-10
-8.5
-11
-8.5
-10
-13
-8.5
-12-10
-12
-12
-8
-8.5
-9
-11
-12.5
-9.5
-13
-10.5
-10.5
-7.5
-13
-8
-11.5-8
-11
-12.5
-11.
5
-8-13
-11
-7.5
-10
-8
-7 -10
-6.5
-7
-12.5
-9.5
-10
-8
-11.5
-12
-7-12
-13
-10.5
-11
-9.5
-10
-8
-10.5
-8.5
-7.5
-9.5
-6.5
-8
-7.5
-8.5
-7-12
-9.5
-10
-10.5
-7
-11
-11
-12
-11.
5-10
-8.5
-8
-8-8
.5
-11
-8
-7
-11
-10
-8.5
-6.5
-9
-8.5
-9.5
-9
-7.5
-10.
5
-11
-10.5
-12
-8
-12
-9.5
-9
-7-7
-7.5
-10
-8
-10
-12.
5
-9
-9.5
-9
-7
-8.5
-11
2896000
2896000
2896500
2896500
2897000
2897000
2897500
2897500
2898000
2898000
2898500
2898500
229000
229000
229500
229500
230000
230000
230500
230500
231000
231000
231500
231500
232000
232000
Figure #10 250 500Feet
NOTES:1) Survey conducted November 4, 2009.2) Grid ME State Plane (West) NAD 83, US Foot.3) Tide corrections based on water surface elevation data collected at N.O.S. Station 8606A, located on the fishing pier.4) Not for Navigation
:
Proposed Structures
1:5,000
H-96

AREAS OF SUBSTANTIAL SUB-BOTTOM SONARPENETRATION AND ESTIMATED ACOUSTIC BASEMENT -
2.0 FOOT CONTOUR INTERVALCamp Ellis - Saco, Maine
!.
!.
!.
!.
!.
!.
!.
!.
!.
!.!.
!.
!.
!.
!.
!.
!.
!.
!.FD-20
FD-19
FD-18
FD-17
FD-16
FD-15
FD-14
FD-13
FD-12 FD-11
FD-10
FD-09
FD-08
FD-05
FD-04
FD-03
FD-02
FD-01
FD-06A
2896000
2896000
2896500
2896500
2897000
2897000
2897500
2897500
2898000
2898000
229000
229000
229500
229500
230000
230000
230500
230500
231000
231000
231500
231500
232000
232000
Figure #40 250 500Feet
NOTES:1) Survey conducted November 4, 2009.2) Grid ME State Plane (West) NAD 83, US Foot.3) Magnetic and side scan base layers included for spatial reference.4) Not for Navigation
:
!. ACOE BORINGS
Proposed Structures
1:5,000
PROFILE "A"
PROFILE "B"
H-97

H-98

APPENDIX A
SIDE SCAN SONAR CONTACTS
H-99

H-100
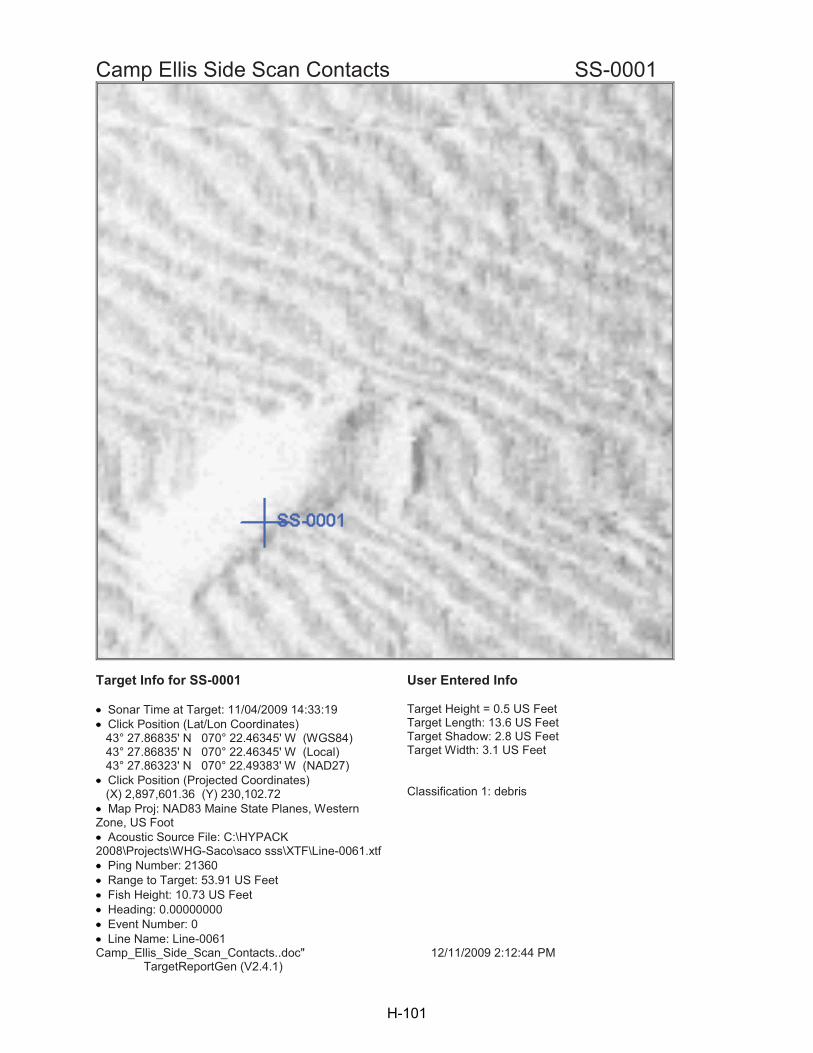
Camp Ellis Side Scan Contacts SS-0001
Target Info for SS-0001 User Entered Info
Sonar Time at Target: 11/04/2009 14:33:19Click Position (Lat/Lon Coordinates)43° 27.86835' N 070° 22.46345' W (WGS84)43° 27.86835' N 070° 22.46345' W (Local)43° 27.86323' N 070° 22.49383' W (NAD27)Click Position (Projected Coordinates)(X) 2,897,601.36 (Y) 230,102.72Map Proj: NAD83 Maine State Planes, Western
Zone, US FootAcoustic Source File: C:\HYPACK
2008\Projects\WHG-Saco\saco sss\XTF\Line-0061.xtfPing Number: 21360Range to Target: 53.91 US FeetFish Height: 10.73 US FeetHeading: 0.00000000Event Number: 0Line Name: Line-0061
Target Height = 0.5 US FeetTarget Length: 13.6 US FeetTarget Shadow: 2.8 US FeetTarget Width: 3.1 US Feet
Classification 1: debris
Camp_Ellis_Side_Scan_Contacts..doc" 12/11/2009 2:12:44 PM TargetReportGen (V2.4.1)
H-101

Camp Ellis Side Scan Contacts SS-0002
Target Info for SS-0002 User Entered Info
Sonar Time at Target: 11/04/2009 14:39:48Click Position (Lat/Lon Coordinates)43° 27.87055' N 070° 22.46550' W (WGS84)43° 27.87055' N 070° 22.46550' W (Local)43° 27.86542' N 070° 22.49588' W (NAD27)Click Position (Projected Coordinates)(X) 2,897,592.35 (Y) 230,116.06Map Proj: NAD83 Maine State Planes, Western
Zone, US FootAcoustic Source File: C:\HYPACK
2008\Projects\WHG-Saco\saco sss\XTF\Line-0062.xtfPing Number: 31713Range to Target: 21.47 US FeetFish Height: 14.06 US FeetHeading: 0.00000000Event Number: 0Line Name: Line-0062
Target Height = 0.0 US FeetTarget Length: 13.6 US FeetTarget Shadow: 0.0 US FeetTarget Width: 0.9 US Feet
Classification 1: debris
Camp_Ellis_Side_Scan_Contacts..doc" 12/11/2009 2:12:44 PM TargetReportGen (V2.4.1)
H-102

Camp Ellis Side Scan Contacts SS-0003
Target Info for SS-0003 User Entered Info
Sonar Time at Target: 11/04/2009 14:56:30Click Position (Lat/Lon Coordinates)43° 27.83183' N 070° 22.55362' W (WGS84)43° 27.83183' N 070° 22.55362' W (Local)43° 27.82670' N 070° 22.58400' W (NAD27)Click Position (Projected Coordinates)(X) 2,897,201.83 (Y) 229,881.81Map Proj: NAD83 Maine State Planes, Western
Zone, US FootAcoustic Source File: C:\HYPACK
2008\Projects\WHG-Saco\saco sss\XTF\Line-0011.xtfPing Number: 58413Range to Target: 82.90 US FeetFish Height: 16.05 US FeetHeading: 0.00000000Event Number: 0Line Name: Line-0011
Target Height = 0.0 US FeetTarget Length: 15.8 US FeetTarget Shadow: 0.0 US FeetTarget Width: 0.9 US Feet
Classification 1: debris
Camp_Ellis_Side_Scan_Contacts..doc" 12/11/2009 2:12:45 PM TargetReportGen (V2.4.1)
H-103

Camp Ellis Side Scan Contacts SS-0004
Target Info for SS-0004 User Entered Info
Sonar Time at Target: 11/04/2009 15:02:37Click Position (Lat/Lon Coordinates)43° 27.83745' N 070° 22.44630' W (WGS84)43° 27.83745' N 070° 22.44630' W (Local)43° 27.83233' N 070° 22.47667' W (NAD27)Click Position (Projected Coordinates)(X) 2,897,676.81 (Y) 229,914.80Map Proj: NAD83 Maine State Planes, Western
Zone, US FootAcoustic Source File: C:\HYPACK
2008\Projects\WHG-Saco\saco sss\XTF\Line-s10.xtfPing Number: 68195Range to Target: 80.65 US FeetFish Height: 16.41 US FeetHeading: 0.00000000Event Number: 0Line Name: Line-s10
Target Height = 0.0 US FeetTarget Length: 9.8 US FeetTarget Shadow: 0.0 US FeetTarget Width: 1.7 US Feet
Classification 1: debris
Camp_Ellis_Side_Scan_Contacts..doc" 12/11/2009 2:12:46 PM TargetReportGen (V2.4.1)
H-104

Camp Ellis Side Scan Contacts SS-0005
Target Info for SS-0005 User Entered Info
Sonar Time at Target: 11/04/2009 15:03:28Click Position (Lat/Lon Coordinates)43° 27.83016' N 070° 22.55537' W (WGS84)43° 27.83016' N 070° 22.55537' W (Local)43° 27.82503' N 070° 22.58574' W (NAD27)Click Position (Projected Coordinates)(X) 2,897,194.07 (Y) 229,871.69Map Proj: NAD83 Maine State Planes, Western
Zone, US FootAcoustic Source File: C:\HYPACK
2008\Projects\WHG-Saco\saco sss\XTF\Line-s10.xtfPing Number: 69560Range to Target: 47.30 US FeetFish Height: 16.41 US FeetHeading: 0.00000000Event Number: 0Line Name: Line-s10
Target Height = 0.0 US FeetTarget Length: 22.2 US FeetTarget Shadow: 0.0 US FeetTarget Width: 0.8 US Feet
Classification 1: debris
Camp_Ellis_Side_Scan_Contacts..doc" 12/11/2009 2:12:46 PM TargetReportGen (V2.4.1)
H-105
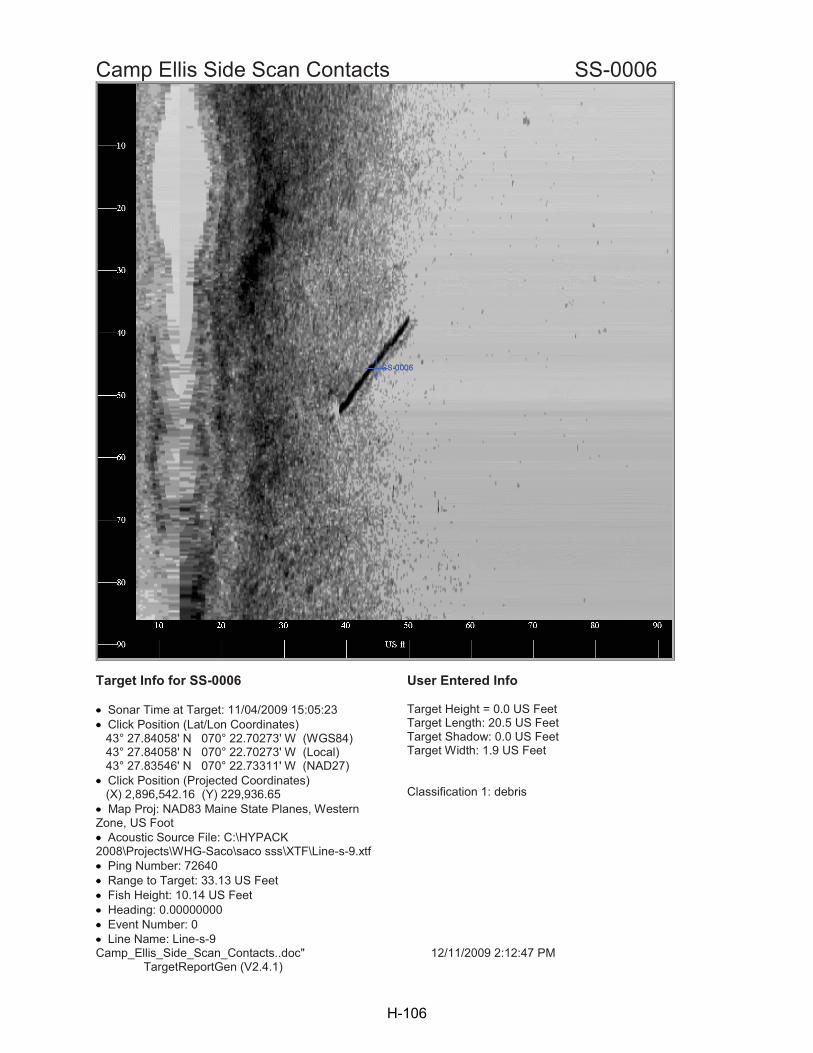
Camp Ellis Side Scan Contacts SS-0006
Target Info for SS-0006 User Entered Info
Sonar Time at Target: 11/04/2009 15:05:23Click Position (Lat/Lon Coordinates)43° 27.84058' N 070° 22.70273' W (WGS84)43° 27.84058' N 070° 22.70273' W (Local)43° 27.83546' N 070° 22.73311' W (NAD27)Click Position (Projected Coordinates)(X) 2,896,542.16 (Y) 229,936.65Map Proj: NAD83 Maine State Planes, Western
Zone, US FootAcoustic Source File: C:\HYPACK
2008\Projects\WHG-Saco\saco sss\XTF\Line-s-9.xtfPing Number: 72640Range to Target: 33.13 US FeetFish Height: 10.14 US FeetHeading: 0.00000000Event Number: 0Line Name: Line-s-9
Target Height = 0.0 US FeetTarget Length: 20.5 US FeetTarget Shadow: 0.0 US FeetTarget Width: 1.9 US Feet
Classification 1: debris
Camp_Ellis_Side_Scan_Contacts..doc" 12/11/2009 2:12:47 PM TargetReportGen (V2.4.1)
H-106

Camp Ellis Side Scan Contacts SS-0007
Target Info for SS-0007 User Entered Info
Sonar Time at Target: 11/04/2009 15:06:20Click Position (Lat/Lon Coordinates)43° 27.82960' N 070° 22.58750' W (WGS84)43° 27.82960' N 070° 22.58750' W (Local)43° 27.82448' N 070° 22.61788' W (NAD27)Click Position (Projected Coordinates)(X) 2,897,051.86 (Y) 229,868.69Map Proj: NAD83 Maine State Planes, Western
Zone, US FootAcoustic Source File: C:\HYPACK
2008\Projects\WHG-Saco\saco sss\XTF\Line-s-9.xtfPing Number: 74140Range to Target: 27.49 US FeetFish Height: 15.15 US FeetHeading: 0.00000000Event Number: 0Line Name: Line-s-9
Target Height = 0.0 US FeetTarget Length: 8.5 US FeetTarget Shadow: 0.0 US FeetTarget Width: 1.5 US Feet
Classification 1: debris
Camp_Ellis_Side_Scan_Contacts..doc" 12/11/2009 2:12:48 PM TargetReportGen (V2.4.1)
H-107

Camp Ellis Side Scan Contacts SS-0008
Target Info for SS-0008 User Entered Info
Sonar Time at Target: 11/04/2009 15:06:35Click Position (Lat/Lon Coordinates)43° 27.83166' N 070° 22.55374' W (WGS84)43° 27.82654' N 070° 22.58411' W (NAD27)Click Position (Projected Coordinates)(X) 2,897,201.31 (Y) 229,880.83Map Proj: NAD83 Maine State Planes, Western
Zone, US FootAcoustic Source File: C:\HYPACK
2008\Projects\WHG-Saco\saco sss\XTF\Line-s-9.xtfPing Number: 74557Range to Target: 21.19 US FeetFish Height: 14.45 US FeetHeading: 0.00000000Event Number: 0Line Name: Line-s-9
See SS-0007
Camp_Ellis_Side_Scan_Contacts..doc" 12/11/2009 2:12:48 PM TargetReportGen (V2.4.1)
H-108

Camp Ellis Side Scan Contacts SS-0009
Target Info for SS-0009 User Entered Info
Sonar Time at Target: 11/04/2009 15:15:34Click Position (Lat/Lon Coordinates)43° 27.81894' N 070° 22.54559' W (WGS84)43° 27.81894' N 070° 22.54559' W (Local)43° 27.81382' N 070° 22.57597' W (NAD27)Click Position (Projected Coordinates)(X) 2,897,237.17 (Y) 229,803.46Map Proj: NAD83 Maine State Planes, Western
Zone, US FootAcoustic Source File: C:\HYPACK
2008\Projects\WHG-Saco\saco sss\XTF\Line-s7.xtfPing Number: 88922Range to Target: 39.20 US FeetFish Height: 16.22 US FeetHeading: 0.00000000Event Number: 0Line Name: Line-s7
Target Height = 0.0 US FeetTarget Length: 16.3 US FeetTarget Shadow: 0.0 US FeetTarget Width: 2.7 US Feet
Classification 1: debris
Camp_Ellis_Side_Scan_Contacts..doc" 12/11/2009 2:12:49 PM TargetReportGen (V2.4.1)
H-109

Camp Ellis Side Scan Contacts SS-0010
Target Info for SS-0010 User Entered Info
Sonar Time at Target: 11/04/2009 15:24:03Click Position (Lat/Lon Coordinates)43° 27.79314' N 070° 22.61489' W (WGS84)43° 27.79314' N 070° 22.61489' W (Local)43° 27.78802' N 070° 22.64526' W (NAD27)Click Position (Projected Coordinates)(X) 2,896,930.14 (Y) 229,647.48Map Proj: NAD83 Maine State Planes, Western
Zone, US FootAcoustic Source File: C:\HYPACK
2008\Projects\WHG-Saco\saco sss\XTF\Line-s5.xtfPing Number: 102488Range to Target: 49.25 US FeetFish Height: 13.93 US FeetHeading: 0.00000000Event Number: 0Line Name: Line-s5
Target Height = 2.6 US FeetTarget Length: 14.9 US FeetTarget Shadow: 11.1 US FeetTarget Width: 11.7 US Feet
Classification 1: debris
Camp_Ellis_Side_Scan_Contacts..doc" 12/11/2009 2:12:50 PM TargetReportGen (V2.4.1)
H-110

Camp Ellis Side Scan Contacts SS-0011
Target Info for SS-0011 User Entered Info
Sonar Time at Target: 11/04/2009 15:25:59Click Position (Lat/Lon Coordinates)43° 27.77088' N 070° 22.37369' W (WGS84)43° 27.77088' N 070° 22.37369' W (Local)43° 27.76575' N 070° 22.40407' W (NAD27)Click Position (Projected Coordinates)(X) 2,897,997.09 (Y) 229,509.59Map Proj: NAD83 Maine State Planes, Western
Zone, US FootAcoustic Source File: C:\HYPACK
2008\Projects\WHG-Saco\saco sss\XTF\Line-s5.xtfPing Number: 105561Range to Target: 36.92 US FeetFish Height: 16.97 US FeetHeading: 0.00000000Event Number: 0Line Name: Line-s5
Target Height = 1.5 US FeetTarget Length: 11.8 US FeetTarget Shadow: 3.6 US FeetTarget Width: 6.6 US Feet
Classification 1: debris
Camp_Ellis_Side_Scan_Contacts..doc" 12/11/2009 2:12:50 PM TargetReportGen (V2.4.1)
H-111
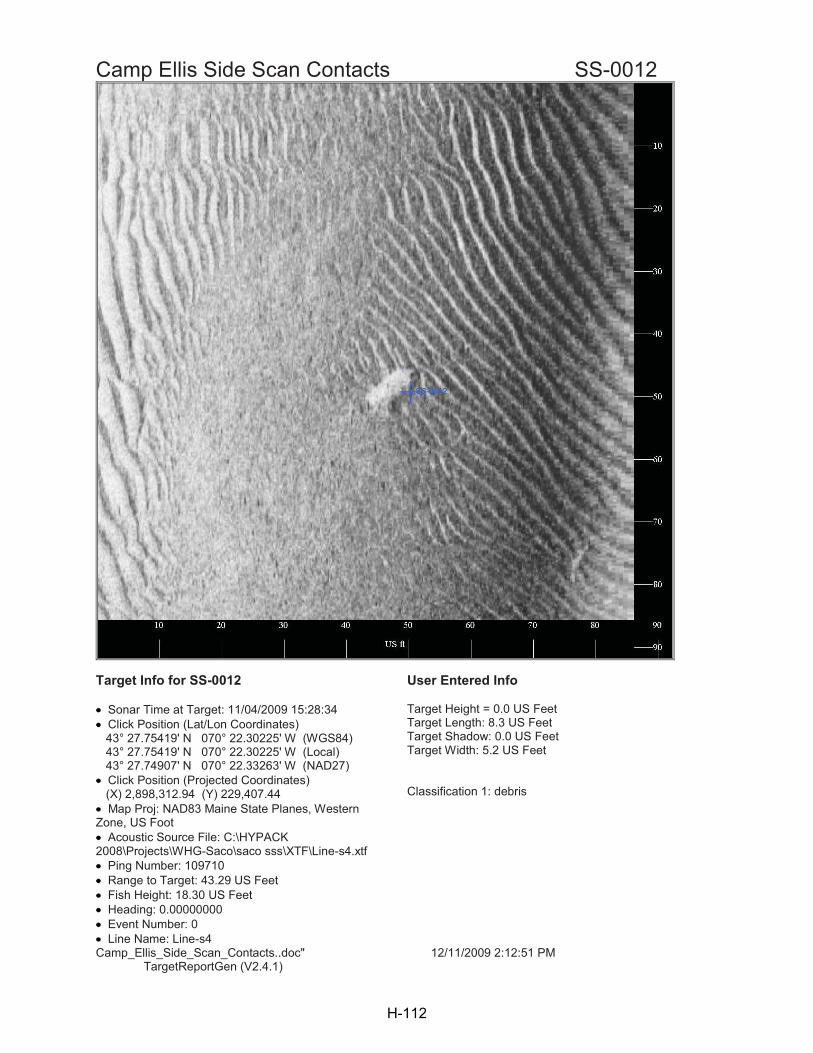
Camp Ellis Side Scan Contacts SS-0012
Target Info for SS-0012 User Entered Info
Sonar Time at Target: 11/04/2009 15:28:34Click Position (Lat/Lon Coordinates)43° 27.75419' N 070° 22.30225' W (WGS84)43° 27.75419' N 070° 22.30225' W (Local)43° 27.74907' N 070° 22.33263' W (NAD27)Click Position (Projected Coordinates)(X) 2,898,312.94 (Y) 229,407.44Map Proj: NAD83 Maine State Planes, Western
Zone, US FootAcoustic Source File: C:\HYPACK
2008\Projects\WHG-Saco\saco sss\XTF\Line-s4.xtfPing Number: 109710Range to Target: 43.29 US FeetFish Height: 18.30 US FeetHeading: 0.00000000Event Number: 0Line Name: Line-s4
Target Height = 0.0 US FeetTarget Length: 8.3 US FeetTarget Shadow: 0.0 US FeetTarget Width: 5.2 US Feet
Classification 1: debris
Camp_Ellis_Side_Scan_Contacts..doc" 12/11/2009 2:12:51 PM TargetReportGen (V2.4.1)
H-112

Camp Ellis Side Scan Contacts SS-0013
Target Info for SS-0013 User Entered Info
Sonar Time at Target: 11/04/2009 15:31:07Click Position (Lat/Lon Coordinates)43° 27.79221' N 070° 22.61736' W (WGS84)43° 27.79221' N 070° 22.61736' W (Local)43° 27.78709' N 070° 22.64773' W (NAD27)Click Position (Projected Coordinates)(X) 2,896,919.19 (Y) 229,641.88Map Proj: NAD83 Maine State Planes, Western
Zone, US FootAcoustic Source File: C:\HYPACK
2008\Projects\WHG-Saco\saco sss\XTF\Line-s4.xtfPing Number: 113786Range to Target: 21.54 US FeetFish Height: 13.52 US FeetHeading: 0.00000000Event Number: 0Line Name: Line-s4
Target Height >= 1.2 US FeetTarget Length: 17.1 US FeetTarget Shadow: 2.0 US FeetTarget Width: 14.2 US Feet
Classification 1: debris
Camp_Ellis_Side_Scan_Contacts..doc" 12/11/2009 2:12:52 PM TargetReportGen (V2.4.1)
H-113
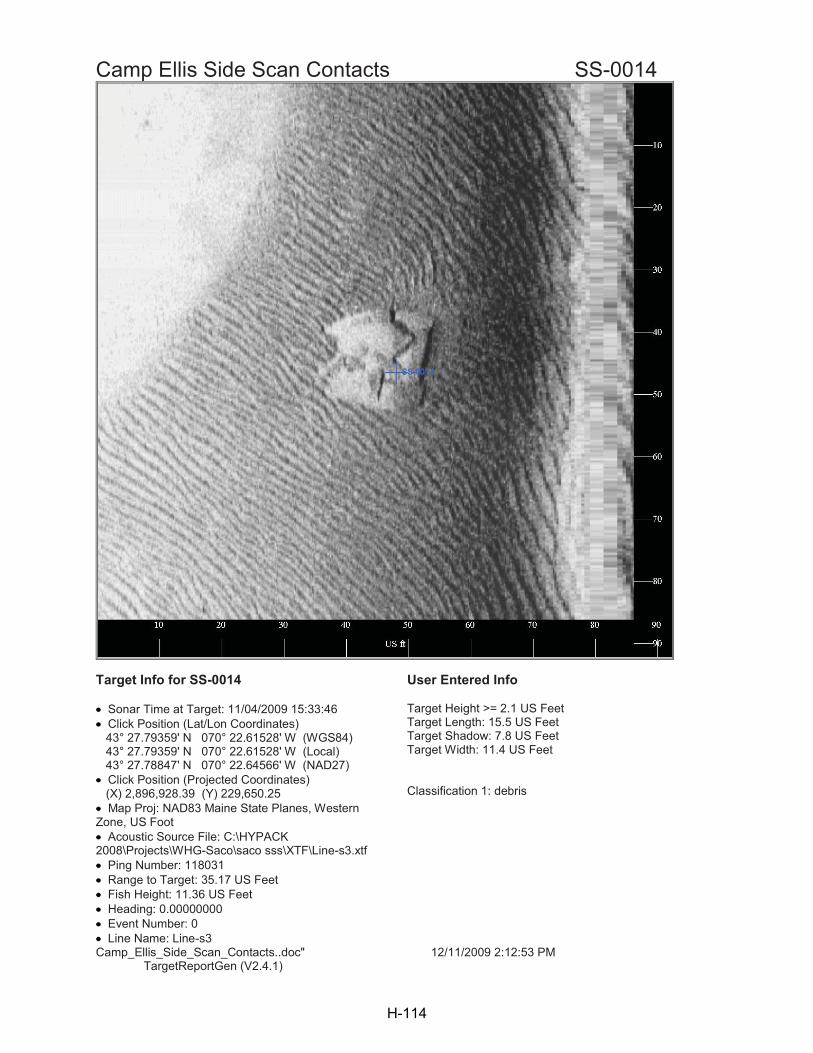
Camp Ellis Side Scan Contacts SS-0014
Target Info for SS-0014 User Entered Info
Sonar Time at Target: 11/04/2009 15:33:46Click Position (Lat/Lon Coordinates)43° 27.79359' N 070° 22.61528' W (WGS84)43° 27.79359' N 070° 22.61528' W (Local)43° 27.78847' N 070° 22.64566' W (NAD27)Click Position (Projected Coordinates)(X) 2,896,928.39 (Y) 229,650.25Map Proj: NAD83 Maine State Planes, Western
Zone, US FootAcoustic Source File: C:\HYPACK
2008\Projects\WHG-Saco\saco sss\XTF\Line-s3.xtfPing Number: 118031Range to Target: 35.17 US FeetFish Height: 11.36 US FeetHeading: 0.00000000Event Number: 0Line Name: Line-s3
Target Height >= 2.1 US FeetTarget Length: 15.5 US FeetTarget Shadow: 7.8 US FeetTarget Width: 11.4 US Feet
Classification 1: debris
Camp_Ellis_Side_Scan_Contacts..doc" 12/11/2009 2:12:53 PM TargetReportGen (V2.4.1)
H-114

Camp Ellis Side Scan Contacts SS-0015
Target Info for SS-0015 User Entered Info
Sonar Time at Target: 11/04/2009 15:34:45Click Position (Lat/Lon Coordinates)43° 27.78336' N 070° 22.49987' W (WGS84)43° 27.78336' N 070° 22.49987' W (Local)43° 27.77824' N 070° 22.53025' W (NAD27)Click Position (Projected Coordinates)(X) 2,897,438.90 (Y) 229,586.80Map Proj: NAD83 Maine State Planes, Western
Zone, US FootAcoustic Source File: C:\HYPACK
2008\Projects\WHG-Saco\saco sss\XTF\Line-s3.xtfPing Number: 119579Range to Target: 61.53 US FeetFish Height: 12.80 US FeetHeading: 0.00000000Event Number: 0Line Name: Line-s3
Target Height = 0.0 US FeetTarget Length: 12.3 US FeetTarget Shadow: 0.0 US FeetTarget Width: 2.7 US Feet
Classification 1: debris
Camp_Ellis_Side_Scan_Contacts..doc" 12/11/2009 2:12:53 PM TargetReportGen (V2.4.1)
H-115

Camp Ellis Side Scan Contacts SS-0016
Target Info for SS-0016 User Entered Info
Sonar Time at Target: 11/04/2009 15:35:48Click Position (Lat/Lon Coordinates)43° 27.77060' N 070° 22.37257' W (WGS84)43° 27.77060' N 070° 22.37257' W (Local)43° 27.76547' N 070° 22.40295' W (NAD27)Click Position (Projected Coordinates)(X) 2,898,002.01 (Y) 229,507.86Map Proj: NAD83 Maine State Planes, Western
Zone, US FootAcoustic Source File: C:\HYPACK
2008\Projects\WHG-Saco\saco sss\XTF\Line-s3.xtfPing Number: 121259Range to Target: 66.03 US FeetFish Height: 14.06 US FeetHeading: 0.00000000Event Number: 0Line Name: Line-s3
Target Height = 1.2 US FeetTarget Length: 8.7 US FeetTarget Shadow: 6.0 US FeetTarget Width: 5.5 US Feet
Classification 1: debris
Camp_Ellis_Side_Scan_Contacts..doc" 12/11/2009 2:12:54 PM TargetReportGen (V2.4.1)
H-116

Camp Ellis Side Scan Contacts SS-0017
Target Info for SS-0017 User Entered Info
Sonar Time at Target: 11/04/2009 15:56:31Click Position (Lat/Lon Coordinates)43° 27.93500' N 070° 22.77298' W (WGS84)43° 27.93500' N 070° 22.77298' W (Local)43° 27.92988' N 070° 22.80336' W (NAD27)Click Position (Projected Coordinates)(X) 2,896,232.77 (Y) 230,511.03Map Proj: NAD83 Maine State Planes, Western
Zone, US FootAcoustic Source File: C:\HYPACK
2008\Projects\WHG-Saco\saco sss\XTF\Line-s18.xtfPing Number: 154410Range to Target: 39.13 US FeetFish Height: 10.82 US FeetHeading: 0.00000000Event Number: 0Line Name: Line-s18
Target Height = 0.5 US FeetTarget Length: 11.0 US FeetTarget Shadow: 1.7 US FeetTarget Width: 1.9 US Feet
Classification 1: debris
Camp_Ellis_Side_Scan_Contacts..doc" 12/11/2009 2:12:55 PM TargetReportGen (V2.4.1)
H-117

Camp Ellis Side Scan Contacts SS-0018
Target Info for SS-0018 User Entered Info
Sonar Time at Target: 11/04/2009 16:05:07Click Position (Lat/Lon Coordinates)43° 27.93631' N 070° 22.78772' W (WGS84)43° 27.93631' N 070° 22.78772' W (Local)43° 27.93119' N 070° 22.81809' W (NAD27)Click Position (Projected Coordinates)(X) 2,896,167.57 (Y) 230,519.17Map Proj: NAD83 Maine State Planes, Western
Zone, US FootAcoustic Source File: C:\HYPACK
2008\Projects\WHG-Saco\saco sss\XTF\Line-s20.xtfPing Number: 168141Range to Target: 66.51 US FeetFish Height: 11.81 US FeetHeading: 0.00000000Event Number: 0Line Name: Line-s20
Target Height = 0.0 US FeetTarget Length: 15.0 US FeetTarget Shadow: 0.0 US FeetTarget Width: 3.7 US Feet
Classification 1: debris
Camp_Ellis_Side_Scan_Contacts..doc" 12/11/2009 2:12:56 PM TargetReportGen (V2.4.1)
H-118

Camp Ellis Side Scan Contacts SS-0019
Target Info for SS-0019 User Entered Info
Sonar Time at Target: 11/04/2009 16:08:35Click Position (Lat/Lon Coordinates)43° 27.92027' N 070° 22.44369' W (WGS84)43° 27.92027' N 070° 22.44369' W (Local)43° 27.91515' N 070° 22.47407' W (NAD27)Click Position (Projected Coordinates)(X) 2,897,689.60 (Y) 230,417.90Map Proj: NAD83 Maine State Planes, Western
Zone, US FootAcoustic Source File: C:\HYPACK
2008\Projects\WHG-Saco\saco sss\XTF\Line-s21.xtfPing Number: 173703Range to Target: 23.64 US FeetFish Height: 13.16 US FeetHeading: 0.00000000Event Number: 0Line Name: Line-s21
Target Height = 0.0 US FeetTarget Length: 4.8 US FeetTarget Shadow: 0.0 US FeetTarget Width: 1.2 US Feet
Classification 1: debris
Camp_Ellis_Side_Scan_Contacts..doc" 12/11/2009 2:12:56 PM TargetReportGen (V2.4.1)
H-119

Camp Ellis Side Scan Contacts SS-0020
Target Info for SS-0020 User Entered Info
Sonar Time at Target: 11/04/2009 16:52:58Click Position (Lat/Lon Coordinates)43° 28.05306' N 070° 22.68102' W (WGS84)43° 28.05306' N 070° 22.68102' W (Local)43° 28.04794' N 070° 22.71140' W (NAD27)Click Position (Projected Coordinates)(X) 2,896,641.48 (Y) 231,227.20Map Proj: NAD83 Maine State Planes, Western
Zone, US FootAcoustic Source File: C:\HYPACK
2008\Projects\WHG-Saco\saco sss\XTF\Line-s33.xtfPing Number: 244681Range to Target: 60.29 US FeetFish Height: 16.35 US FeetHeading: 0.00000000Event Number: 0Line Name: Line-s33
Target Height >= 5.3 US FeetTarget Length: 12.6 US FeetTarget Shadow: 29.1 US FeetTarget Width: 5.3 US Feet
Classification 1: debris
Camp_Ellis_Side_Scan_Contacts..doc" 12/11/2009 2:12:57 PM TargetReportGen (V2.4.1)
H-120

Camp Ellis Side Scan Contacts SS-0021
Target Info for SS-0021 User Entered Info
Sonar Time at Target: 11/04/2009 16:59:19Click Position (Lat/Lon Coordinates)43° 28.05320' N 070° 22.68124' W (WGS84)43° 28.05320' N 070° 22.68124' W (Local)43° 28.04808' N 070° 22.71162' W (NAD27)Click Position (Projected Coordinates)(X) 2,896,640.51 (Y) 231,228.07Map Proj: NAD83 Maine State Planes, Western
Zone, US FootAcoustic Source File: C:\HYPACK
2008\Projects\WHG-Saco\saco sss\XTF\Line-s35.xtfPing Number: 254820Range to Target: 49.85 US FeetFish Height: 17.26 US FeetHeading: 0.00000000Event Number: 0Line Name: Line-s35
Target Height = 4.3 US FeetTarget Length: 12.9 US FeetTarget Shadow: 16.6 US FeetTarget Width: 6.6 US Feet
Classification 1: debris
Camp_Ellis_Side_Scan_Contacts..doc" 12/11/2009 2:12:58 PM TargetReportGen (V2.4.1)
H-121

Camp Ellis Side Scan Contacts SS-0022
Target Info for SS-0022 User Entered Info
Sonar Time at Target: 11/04/2009 17:00:08Click Position (Lat/Lon Coordinates)43° 28.05338' N 070° 22.58329' W (WGS84)43° 28.05338' N 070° 22.58329' W (Local)43° 28.04826' N 070° 22.61366' W (NAD27)Click Position (Projected Coordinates)(X) 2,897,073.95 (Y) 231,228.05Map Proj: NAD83 Maine State Planes, Western
Zone, US FootAcoustic Source File: C:\HYPACK
2008\Projects\WHG-Saco\saco sss\XTF\Line-s35.xtfPing Number: 256142Range to Target: 27.10 US FeetFish Height: 18.90 US FeetHeading: 0.00000000Event Number: 0Line Name: Line-s35
Target Height = 0.0 US FeetTarget Length: 6.9 US FeetTarget Shadow: 0.0 US FeetTarget Width: 5.4 US Feet
Classification 1: debrisDescription: Appears partially buried.
Camp_Ellis_Side_Scan_Contacts..doc" 12/11/2009 2:12:59 PM TargetReportGen (V2.4.1)
H-122

AP
PE
ND
IX B
MA
GN
ETO
ME
TER
PR
OFI
LES
H-123

H-124

MAGNETIC TRANSECT 015_0937
52980
52990
53000
53010
53020
53030
53040
53050
53060
53070
53080
53090
53100
53110
53120
53130
53140
53150
0 200 400 600 800 1000 1200 1400 1600 1800
DISTANCE ALONG LINE (FEET)
TO
TA
L F
IEL
D (n
T)
M-1
M-2
H-125

MAGNETIC TRANSECT 011_0955
53020
53030
53040
53050
53060
53070
53080
53090
53100
53110
53120
53130
53140
53150
53160
53170
53180
53190
53200
53210
0 200 400 600 800 1000 1200 1400 1600 1800 2000
DISTANCE ALONG LINE (FEET)
TO
TA
L F
IELD
(nT)
M-3
H-126
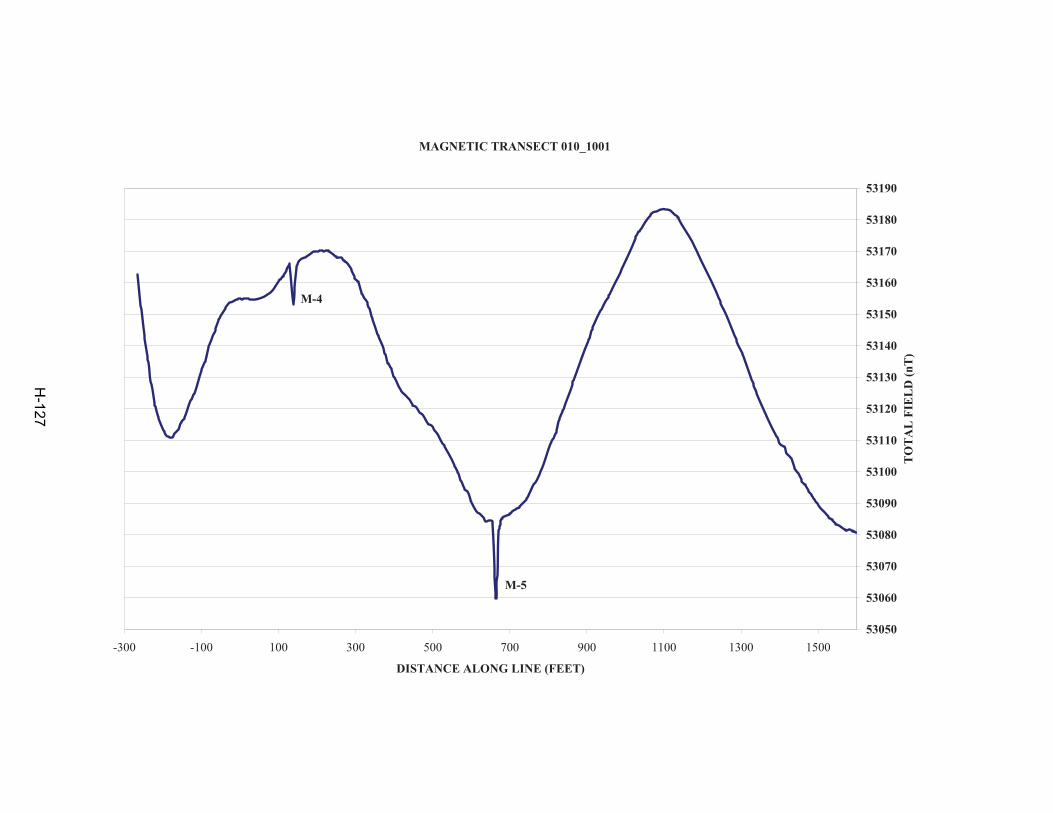
MAGNETIC TRANSECT 010_1001
53050
53060
53070
53080
53090
53100
53110
53120
53130
53140
53150
53160
53170
53180
53190
-300 -100 100 300 500 700 900 1100 1300 1500
DISTANCE ALONG LINE (FEET)
TO
TAL
FIE
LD (n
T)
M-4
M-5
H-127

MAGNETIC TRANSECT 007_1014
530105302053030530405305053060530705308053090531005311053120531305314053150531605317053180531905320053210532205323053240
0 200 400 600 800 1000 1200 1400 1600 1800 2000
DISTANCE ALONG LINE (FEET)
TO
TA
L F
IELD
(nT)
M-6
M-7
H-128

MAGNETIC TRANSECT 006_1019
53090
53100
53110
53120
53130
53140
53150
53160
53170
53180
53190
53200
-500 0 500 1000 1500 2000
DISTANCE ALONG LINE (FEET)
TO
TA
L F
IELD
(nT)
M-8
M-9
H-129

H-130

APPENDIX C:
INVENTORY OF SIDE-SCAN SONAR ANOMALIES


ID TIME X Y LENGTH WIDTH HEIGHT CORRELATION LINE NOTES
SS-0001 14:33:19 2897601.36 230102.72 13.56 3.15 0.53 Line-0061 small area of bottom disturbance; assoc. w/SS-0002SS-0002 14:39:48 2897592.35 230116.06 13.56 0.87 0.00 Line-0062 low relief linear target - modern debris; assoc. w/SS-0001SS-0003 14:56:30 2897201.83 229881.81 15.79 0.90 0.00 M9 Line-0011 low relief linear target - modern debris; same target as SS-0005 and SS-0008SS-0004 15:02:37 2897676.81 229914.80 9.82 1.67 0.00 M5 Line-s10 small area of bottom disturbanceSS-0005 15:03:28 2897194.07 229871.69 22.18 0.77 0.00 M9 Line-s10 low relief linear target - modern debris; same target as SS-0003 and SS-0008SS-0006 15:05:23 2896542.16 229936.65 20.48 1.89 0.00 M6 Line-s-9 low relief linear target - modern debrisSS-0007 15:06:20 2897051.86 229868.69 8.51 1.53 0.00 M9 Line-s-9 low relief linear target - modern debrisSS-0008 15:06:35 2897201.31 229880.83 15.79 0.90 0.00 M9 Line-s-9 low relief linear target - modern debris; same target as SS-0003 and SS-0005SS-0009 15:15:34 2897237.17 229803.46 16.25 2.71 0.00 M9 Line-s7 low relief linear target - modern debrisSS-0010 15:24:03 2896930.14 229647.48 14.86 11.71 2.55 Line-s5 low relief amorphous target - modern debris; same target as SS-0013 and SS-0014 SS-0011 15:25:59 2897997.09 229509.59 11.81 6.59 1.49 Line-s5 low relief amorphous target - modern debris SS-0012 15:28:34 2898312.94 229407.44 8.34 5.20 0.00 Line-s4 low relief amorphous target - modern debris SS-0013 15:31:07 2896919.19 229641.88 17.12 14.23 1.15 Line-s4 low relief amorphous target - modern debris; same target as SS-0010 and SS-0014 SS-0014 15:33:46 2896928.39 229650.25 15.47 11.44 2.06 Line-s3 low relief amorphous target - modern debris; same target as SS-0010 and SS-0013 SS-0015 15:34:45 2897438.90 229586.80 12.26 2.72 0.00 M9 Line-s3 low relief oblong target - modern debrisSS-0016 15:35:48 2898002.01 229507.86 8.75 5.46 1.16 Line-s3 low relief amorphous target - modern debris SS-0017 15:56:31 2896232.77 230511.03 10.99 1.87 0.46 Line-s18 low relief oblong target - modern debrisSS-0018 16:05:07 2896167.57 230519.17 15.04 3.65 0.00 Line-s20 low relief linear target - modern debrisSS-0019 16:08:35 2897689.60 230417.90 4.80 1.16 0.00 Line-s21 low relief oblong target - modern debrisSS-0020 16:52:58 2896641.48 231227.20 12.60 5.31 5.33 Line-s33 moderate relief oblong target - rock or modern debris; same target as SS-0021SS-0021 16:59:19 2896640.51 231228.07 12.89 6.58 4.32 Line-s35 moderate relief oblong target - rock or modern debris; same target as SS-0020SS-0022 17:00:08 2897073.95 231228.05 6.86 5.41 0.00 Line-s35 low relief 'L'-shaped target - modern debris
Notes:
1 Reported coordinates are Maine State Plane (US feet), West Zone, referencing NAD-83.
(dimensions in US feet)
INVENTORY OF SIDE-SCAN SONAR ANOMALIESCamp Ellis Beach, Saco Maine
H-131

H-132

APPENDIX D:
INVENTORY OF MAGNETIC ANOMALIES


ID TIME X Y BACKGROUND ANOMALY MAGNITUDE SIGNATURE DURATION LINE CORRELATION NOTES
M-1 9:38:27 2896860.68 230260.7 53037.13 52993.2 -43.93 MP- 55 015_0937 Complex. May be related to M-2.M-2 9:38:41 2896990.98 230243.7 53042.14 53067.23 25.09 MP+ 64 015_0937 Complex. May be related to M-1.M-3 9:57:55 2897992.07 229894.4 53102.25 53035.85 -66.4 MP- 8 011_0955M-4 10:01:54 2898270.27 229798.7 53165.75 53153.2 -12.55 MP- 17 010_1001 Single scan.M-5 10:02:55 2897751.98 229885.9 53084.05 53059.68 -24.37 MP- 25 010_1001 SS-0004 Single scan, but with minor signature on either side.M-6 10:14:34 2896668.17 229919.4 53108.43 53220.38 111.95 MP+ 125 007_1014 SS-0006 Single scan, but with minor signature on either side.M-7 10:16:14 2897571.68 229762.7 53113.87 53026.16 -87.71 MP- 30 007_1014M-8 10:20:43 2897851.38 229663.7 53181.04 53164.05 -16.99 MP- 25 006_1019 Single scan.
M-9 10:22:07 2897135.68 229777.1 53133.31 53104.36 -28.95 MP- 24 006_1019
SS-0003, SS-0005, SS-0007, SS-0008,SS-0009, SS-0015 Single scan, but with minor signature on either side.
Notes:
1 1.0 nanoTesla (nT) = 1 "Gamma"; Duration is measured in US feet and estimated from beginning of signature to end of signature as distance along trackline.2 MP = Monopolar. +/- indicate signature orientation relative to background. 3 Scaled profiles are included in Appendix B of CRE's attached report. Anomaly locations are shown in Figure 5-_.4 Reported coordinates are Maine State Plane (US feet), West Zone, referencing NAD-83.
(magnitude values in nanoTeslas)
INVENTORY OF MAGNETIC ANOMALIESCamp Ellis Beach, Saco Maine
H-133

H-134

APPENDIX E:
GEI GEOTECHNICAL BORINGS DATA


BORING LOCATIONS RELATIVETO SIDE SCAN MOSAIC AND MAGNETIC RELIEF MAP
Camp Ellis - Saco, Maine
!.
!.
!.
!.
!.
!.!.
!.
!.
!.
!.!.
!.
!.
!.
!.
!.
!.
!.
!.
FD-20
FD-19
FD-18
FD-17
FD-16
FD-15
FD-14
FD-13
FD-12 FD-11
FD-10
FD-09
FD-08
FD-07
FD-05
FD-04
FD-03
FD-02
FD-01
FD-06A
2895500
2895500
2896000
2896000
2896500
2896500
2897000
2897000
2897500
2897500
2898000
2898000
229500
229500
230000
230000
230500
230500
231000
231000
231500
231500
232000
232000
232500
232500
Figure #na0 250 500Feet
NOTES:1) Survey conducted November 4, 2009.2) Grid ME State Plane (West) NAD 83, US Foot.3) Not for Navigation
:
!. ACOE_BORINGS
Proposed Structures
1:5,000
H-135

NORTHING: HOR. DATUM:
VERT. DATUM:
EASTING:DATE
BORING LOCATION:
0
5
10
15
20
25
30
1 of 2
BORING LOG
(tsf)NO. STR
ATA
SOIL / BEDROCK DESCRIPTIONSvIN.
RECIN.
PEN6 IN.PER
BLOWSSAMPLE INFORMATION
andTYPEDEPTH
FT.
PROJECT NAME:
GEI PROJECT NUMBER:
CITY/STATE: PAGE
SURFACE ELEVATION (FT):
DRILLED BY:
LOGGED BY:
TOTAL DEPTH (FT):
HOLECASINGWATER
DEPTH (FT)TIME
GROUNDWATER INFORMATION
DATE START:
REMARKS
DATE END:
GEI Consultants, Inc.1021 Main StreetWinchester, MA 01890
STRATIGRAPHIC LEGEND
- CLAY
- ORGANIC SILT
- SILT
- SAND
BLOWS PER 6 inch - 140lb. hammer falling 30 inchesPEN - Penetration length of sampler or core barrelREC - Recovery length of sampleU - 3 inch Shelby tube sampleQD - Pocket penetrometerSv - Shear strength from torvaneS - 2 inch O.D Split spoon sampleTSF - Tons per square footS' - 3 inch O.D Split spoon sample
- SILTY SAND
- GRAVEL
S1
S2
S3
S4
S5
S6
S1: POORLY GRADED SAND (SP); Fine to medium sand, ~25% coarse sand, ~5% non plastic fines, Gray.
Top of SILTY SAND at about 4'
S2: SILTY SAND (SM); Fine sand, ~20% slightly plastic fines, occasional shell, Dark Gray, one-3" layer sandy silt (ML-MH), medium plasticity,possibly organic
S3: SILTY SAND (SM); Fine sand, ~10% medium to coarse sand, ~20%slightly plastic fines, ~10% subangular to subrounded fine gravel (black),Gray.
Wash color change at 14'
S4: CLAYEY SAND (SC); Fine sand, ~35% low plasticity fines, Tan.
Top of CLAY at about 18'
S5: LEAN CLAY (CL); Low plasticity, ~5% fine sand, Top 12" Gray withblack layers, Bottom 12" Olive Gray.
Top of SAND at about 22'
Wash color changes every 6"-12" from 20'-25' (tan/gray)
S6: POORLY GRADED SAND WITH SILT (SP-SM); Fine to mediumsand, ~10% non plastic fines, ~5% coarse sand, Tan.
0.250.300.600.65
14
18
11
4
24
15
24
24
24
24
24
24
2344
3112
14101317
78106
WOR/18"3
13162326
FD-19
FD-19
FD-19
Camp Ellis Beach
04376-0
Saco, maine
-0.6
New Hampshire Boring
Steve Sarandis
47.5'
11/09/05
11/09/05
MLLW
B. Thompson
NAD 83 (m)4813312.79 388726.89
H-136

REMARKS(tsf)IN.IN.6 IN.NO.
35
40
45
50
55
60
SOIL / BEDROCK DESCRIPTION
STR
ATADEPTH
FT.
BORING LOG
2 of 2
PAGE
SAMPLE INFORMATION
SvRECPENPERBLOWS
andTYPE
PROJECT NAME:
CITY/STATE:
GEI PROJECT NUMBER:
STRATIGRAPHIC LEGEND
- CLAY
- ORGANIC SILT
- SILT
- SAND
GEI Consultants, Inc.
Winchester, MA 018901021 Main Street
BLOWS PER 6 inch - 140lb. hammer falling 30 inchesPEN - Penetration length of sampler or core barrelREC - Recovery length of sampleU - 3 inch Shelby tube sampleQD - Pocket penetrometerSv - Shear strength from torvaneS - 2 inch O.D Split spoon sampleTSF - Tons per square footS' - 3 inch O.D Split spoon sample
- SILTY SAND
- GRAVEL
S7
S8
S9
S10
S7: WELL-GRADED SAND WITH GRAVEL (SW); Fine to coarse sand,~20% subrounded fine gravel, ~5% non plastic fines, Brown.
S8: WELL-GRADED SAND WITH GRAVEL (SW); Fine to coarse sand,~30% subrounded fine gravel, ~5% non plastic fines, Dark Gray.
S9: WELL-GRADED SAND WITH GRAVEL (SW); Similar to S8.
S10: WELL-GRADED SAND WITH GRAVEL (SW); Fine to coarse sand, ~35% subrounded fine to coarse gravel (some gravel pieces fracturedduring sampling), ~5% non plastic fines, Dark Brown.
Bottom of Boring at 47.5'
1. Boring advanced using drive and wash technique with 4" (HW) casingfrom 0-47.5'.
2. Unable to drive casing past 47.5'.
14
17
8
15
24
24
24
24
30231818
21202623
1081111
26255055
FD-19
Camp Ellis Beach
Saco, maine
04376-0
H-137

NORTHING: HOR. DATUM:
VERT. DATUM:
EASTING:DATE
BORING LOCATION:
0
5
10
15
20
25
30
1 of 2
BORING LOG
(tsf)NO. STR
ATA
SOIL / BEDROCK DESCRIPTIONSvIN.
RECIN.
PEN6 IN.PER
BLOWSSAMPLE INFORMATION
andTYPEDEPTH
FT.
PROJECT NAME:
GEI PROJECT NUMBER:
CITY/STATE: PAGE
SURFACE ELEVATION (FT):
DRILLED BY:
LOGGED BY:
TOTAL DEPTH (FT):
HOLECASINGWATER
DEPTH (FT)TIME
GROUNDWATER INFORMATION
DATE START:
REMARKS
DATE END:
GEI Consultants, Inc.1021 Main StreetWinchester, MA 01890
STRATIGRAPHIC LEGEND
- CLAY
- ORGANIC SILT
- SILT
- SAND
BLOWS PER 6 inch - 140lb. hammer falling 30 inchesPEN - Penetration length of sampler or core barrelREC - Recovery length of sampleU - 3 inch Shelby tube sampleQD - Pocket penetrometerSv - Shear strength from torvaneS - 2 inch O.D Split spoon sampleTSF - Tons per square footS' - 3 inch O.D Split spoon sample
- SILTY SAND
- GRAVEL
S1
S2
S3
S5
S6
S4
S1: POORLY GRADED SAND (SP); Fine to medium sand, ~5% fines,Tan-Gray.
S2: Top 3" - POORLY GRADDED SAND (SP); Similar to S1 with ~10%coarse subrounded gravel.
S2: Bot. 7" - SILTY SAND WITH GRAVEL (SM); Fine to coarse sand,~25% fine to coarse gravel, ~15% slightly plastic fines, Tan-Gray.
S3: POORLY GRADED SAND WITH SILT (SP-SM); Fine to mediumsand, ~10% non plastic fines, 50% subrounded coarse gravel, bottom 1"is clayey sand, ~40% low plastic sand, Tan.
S4: CLAYEY SAND (SC); Mostly fine sand, ~35% low plasticity fines,layers of sandy clay and silty fine sand, layers ranging 1/2" -2" thick, onepiece angular gravel @ top of sample, gravel fractured during sampling,Tan.
S5: POORLY GRADED SAND WITH SILT (SP-SM); Fine to mediumsand, ~10% silt, clay layers throughout sample, 1/2" in length, ~1.5" areaof liquefaction, no silt in area, Brown-Tan.
S6: WELL-GRADED SAND (SW); Mostly fine to coarse sand, ~15% finesubangular gravel, <5% fines, Tan.
10
10
9
24
17
24
24
24
24
24
24
2246
12111113
3522145
19736
8677
12131722
FD-18
FD-18
Camp Ellis Beach
04376-0
Saco, maine
-2.3
New Hampshire Boring
Kevin Duffy
46.5'
FD-1811/8/05
11/8/05
MLLW
B. Thompson
NAD 83 (m)4813388.88 388629.94
H-138

REMARKS(tsf)IN.IN.6 IN.NO.
35
40
45
50
55
60
SOIL / BEDROCK DESCRIPTION
STR
ATADEPTH
FT.
BORING LOG
2 of 2
PAGE
SAMPLE INFORMATION
SvRECPENPERBLOWS
andTYPE
PROJECT NAME:
CITY/STATE:
GEI PROJECT NUMBER:
STRATIGRAPHIC LEGEND
- CLAY
- ORGANIC SILT
- SILT
- SAND
GEI Consultants, Inc.
Winchester, MA 018901021 Main Street
BLOWS PER 6 inch - 140lb. hammer falling 30 inchesPEN - Penetration length of sampler or core barrelREC - Recovery length of sampleU - 3 inch Shelby tube sampleQD - Pocket penetrometerSv - Shear strength from torvaneS - 2 inch O.D Split spoon sampleTSF - Tons per square footS' - 3 inch O.D Split spoon sample
- SILTY SAND
- GRAVEL
S7
S8
S9
S10
S7: WELL-GRADED SAND (SW); Similar to S6.
Hard drilling at 33.0'
S8: WELL-GRADED SAND WITH GRAVEL (SW); Mostly fine to coarsesand, ~20% fine to coarse gravel, ~5% non plastic fines, Tan.
S9: WELL-GRADED SAND WITH GRAVEL (SW); Similar to S8.
Top of SILTY SAND at about 43.5'
S10: Interface of glacial till and weathered rock. One piece fracturedrock, less weathered.
Bottom of Boring at 46.5'
1. Boring advanced from 0-46' using drive and wash technique with 4"(HW) casing
16
16
13
3
24
24
24
18
14131922
18171816
13172113
6585100
FD-18
Camp Ellis Beach
Saco, maine
04376-0
H-139

NORTHING: HOR. DATUM:
VERT. DATUM:
EASTING:DATE
BORING LOCATION:
0
5
10
15
20
25
30
1 of 2
BORING LOG
(tsf)NO. STR
ATA
SOIL / BEDROCK DESCRIPTIONSvIN.
RECIN.
PEN6 IN.PER
BLOWSSAMPLE INFORMATION
andTYPEDEPTH
FT.
PROJECT NAME:
GEI PROJECT NUMBER:
CITY/STATE: PAGE
SURFACE ELEVATION (FT):
DRILLED BY:
LOGGED BY:
TOTAL DEPTH (FT):
HOLECASINGWATER
DEPTH (FT)TIME
GROUNDWATER INFORMATION
DATE START:
REMARKS
DATE END:
GEI Consultants, Inc.1021 Main StreetWinchester, MA 01890
STRATIGRAPHIC LEGEND
- CLAY
- ORGANIC SILT
- SILT
- SAND
BLOWS PER 6 inch - 140lb. hammer falling 30 inchesPEN - Penetration length of sampler or core barrelREC - Recovery length of sampleU - 3 inch Shelby tube sampleQD - Pocket penetrometerSv - Shear strength from torvaneS - 2 inch O.D Split spoon sampleTSF - Tons per square footS' - 3 inch O.D Split spoon sample
- SILTY SAND
- GRAVEL
S1
S2
S3
S4
S5
S6
S1: POORLY GRADED SAND WITH SILT (SP-SM); Fine sand, ~10%non plastic fines, top 8" light brown, bottom 6" gray.
S2: Top 4" - Similar to the bottom 6" of S1.
S2: Bot. 4" - SILTY SAND WITH GRAVEL (SM); Fine to coarse sand,~15% slightly plastic fines, ~20% subangular fine gravel, Tan, BrownMottlen.
Difficulty washing out casing from 5-13'. Large amount of gravel inwash/rollerbit binding up inside casing.
S3: SILTY GRAVEL WITH SAND (GM); Fine to coarse subangulargravel, ~15% slightly plastic fines, ~25% fine to coarse sand, Tan.
S4: SILTY GRAVELWITH SAND (GM); Fine to coarse subangulargravel, ~15% slightly plastic fines, ~30% fine to coarse sand, Tan.
S5: Top 3" - WELL-GRADED GRAVEL WITH SAND (GW); Fine tocoarse subrounded gravel, ~25% fine to medium sand,~5% fines, Gray.
S5: Bot. 6" - POORLY GRADED SAND WITH SILT (SP-SM); Fine sand, ~10% non plastic fines, Light Brown.
S6: WELL-GRADED SAND WITH SILT (SW-SM); Fine to medium sand,~10% non plastic fines, ~5% coarse sand, ~5% fine subrounded gravel,Light Brown.
Hard Drilling at 27'.
14
8
3
5
9
13
24
24
24
24
24
24
7678
101067
691213
15201713
1524911
14889
Offshore
FD-17
Camp Ellis Beach
04376-0
Saco, maine
-4.9
New Hampshire Boring
Steve Sarandis
32.0'
11/03/05
11/03/05
MLLW
B. Thompson
NAD 83 (m)4813613.17 388537.53
H-140

REMARKS(tsf)IN.IN.6 IN.NO.
35
40
45
50
55
60
SOIL / BEDROCK DESCRIPTION
STR
ATADEPTH
FT.
BORING LOG
2 of 2
PAGE
SAMPLE INFORMATION
SvRECPENPERBLOWS
andTYPE
PROJECT NAME:
CITY/STATE:
GEI PROJECT NUMBER:
STRATIGRAPHIC LEGEND
- CLAY
- ORGANIC SILT
- SILT
- SAND
GEI Consultants, Inc.
Winchester, MA 018901021 Main Street
BLOWS PER 6 inch - 140lb. hammer falling 30 inchesPEN - Penetration length of sampler or core barrelREC - Recovery length of sampleU - 3 inch Shelby tube sampleQD - Pocket penetrometerSv - Shear strength from torvaneS - 2 inch O.D Split spoon sampleTSF - Tons per square footS' - 3 inch O.D Split spoon sample
- SILTY SAND
- GRAVEL
S7S7: Three pieces of coarse gravel in tip sample.
Bottom of Boring at 32'.
1. Advanced boring from 0-32' using drive and wash technique with 4"(HW) casing.
2. Stopped boring at 32' and returned drilling barge to dock due todeteriorating weather conditions.
02420152118
FD-17
Camp Ellis Beach
Saco, maine
04376-0
H-141

NORTHING: HOR. DATUM:
VERT. DATUM:
EASTING:DATE
BORING LOCATION:
0
5
10
15
20
25
30
1 of 3
BORING LOG
(tsf)NO. STR
ATA
SOIL / BEDROCK DESCRIPTIONSvIN.
RECIN.
PEN6 IN.PER
BLOWSSAMPLE INFORMATION
andTYPEDEPTH
FT.
PROJECT NAME:
GEI PROJECT NUMBER:
CITY/STATE: PAGE
SURFACE ELEVATION (FT):
DRILLED BY:
LOGGED BY:
TOTAL DEPTH (FT):
HOLECASINGWATER
DEPTH (FT)TIME
GROUNDWATER INFORMATION
DATE START:
REMARKS
DATE END:
GEI Consultants, Inc.1021 Main StreetWinchester, MA 01890
STRATIGRAPHIC LEGEND
- CLAY
- ORGANIC SILT
- SILT
- SAND
BLOWS PER 6 inch - 140lb. hammer falling 30 inchesPEN - Penetration length of sampler or core barrelREC - Recovery length of sampleU - 3 inch Shelby tube sampleQD - Pocket penetrometerSv - Shear strength from torvaneS - 2 inch O.D Split spoon sampleTSF - Tons per square footS' - 3 inch O.D Split spoon sample
- SILTY SAND
- GRAVEL
S1
S2
S3
S4
S5
U1
S1: POORLY GRADED SAND WITH SILT (SP-SM); Fine to very finesand sand, ~10% non plastic fines, Gray.
Top of CLAY at about 4.5'
S2: LEAN CLAY (CL); Low to medium plasticity, ~5% fine sand, laminaof silty fine sand, Light Gray.
S3: LEAN CLAY (CL); Medium plasticity, ~5% fine sand, Gray withlayers and zones of black, medium dry strength.
U1: LEAN CLAY (CL); Simialr to S3.
S4: LEAN CLAY (CL); Simialr to S3.
S5: LEAN CLAY (CL); Simialr to S3.
0.250.25
0.250.30
0.250.300.25
0.200.20
13
24
24
24
24
24
24
24
24
24
24
24
7688
1121
WOR/12"
WOH/12"
PUSH/24"
WOR/24"
WOR/24"
Offshore
FD-16
Camp Ellis Beach
04376-0
Saco, maine
-4.0
New Hampshire Boring
Steve Sarandis
70.0'
11/02/05
11/02/05
MLLW
Greg Leavitt
NAD 83 (m)4813802.11 388312.85
H-142

REMARKS(tsf)IN.IN.6 IN.NO.
35
40
45
50
55
60
65
SOIL / BEDROCK DESCRIPTION
STR
ATADEPTH
FT.
BORING LOG
2 of 3
PAGE
SAMPLE INFORMATION
SvRECPENPERBLOWS
andTYPE
PROJECT NAME:
CITY/STATE:
GEI PROJECT NUMBER:
STRATIGRAPHIC LEGEND
- CLAY
- ORGANIC SILT
- SILT
- SAND
GEI Consultants, Inc.
Winchester, MA 018901021 Main Street
BLOWS PER 6 inch - 140lb. hammer falling 30 inchesPEN - Penetration length of sampler or core barrelREC - Recovery length of sampleU - 3 inch Shelby tube sampleQD - Pocket penetrometerSv - Shear strength from torvaneS - 2 inch O.D Split spoon sampleTSF - Tons per square footS' - 3 inch O.D Split spoon sample
- SILTY SAND
- GRAVEL
S6
S7
S8
S9
S10
S11
S12
S13
S6: LEAN CLAY (CL); Medium plasticity, ~5% fine sand, Dark Gray withBlack.
S7: LEAN CLAY (CL); Medium plasticity, ~5-10% fine sand, Olive Gray.
S8: LEAN CLAY (CL); Similar to S7.
S9: LEAN CLAY (CL); Similar to S7.
S10: LEAN CLAY (CL); Similar to S7.
S11: Top 6"; LEAN CLAY (CL); Similar to S7.
Top of SILTY SAND at 55.5'
S11: Bot. 18" SILTY SAND (SM); Fine sand, ~20% slightly plastic fines,fragmented layers of Sandy Silt (ML), up to 1" thick, Dark Gray.
S12: SILTY SAND (SM); Fine sand, ~15% slightly plastic fines, bottom 6" has numerous layers of sandy silt, Gray.
S13: POORLY GRADED SAND WITH SILT (SP-SM); Fine sand, ~10%non-plastic fines, Gray.
0.200.25
0.200.20
0.300.300.30
0.350.350.35
0.350.40
24
24
24
24
24
24
24
24
24
24
24
24
24
24
24
24
WOR/24"
WOR/24"
WOR/24"
WOR/24"
WOR/12"
34
WOR476
2117
591014
FD-16
Camp Ellis Beach
Saco, maine
04376-0
H-143

REMARKS(tsf)IN.IN.6 IN.NO.
70
75
80
85
90
SOIL / BEDROCK DESCRIPTION
STR
ATADEPTH
FT.
BORING LOG
3 of 3
PAGE
SAMPLE INFORMATION
SvRECPENPERBLOWS
andTYPE
PROJECT NAME:
CITY/STATE:
GEI PROJECT NUMBER:
STRATIGRAPHIC LEGEND
- CLAY
- ORGANIC SILT
- SILT
- SAND
GEI Consultants, Inc.
Winchester, MA 018901021 Main Street
BLOWS PER 6 inch - 140lb. hammer falling 30 inchesPEN - Penetration length of sampler or core barrelREC - Recovery length of sampleU - 3 inch Shelby tube sampleQD - Pocket penetrometerSv - Shear strength from torvaneS - 2 inch O.D Split spoon sampleTSF - Tons per square footS' - 3 inch O.D Split spoon sample
- SILTY SAND
- GRAVEL
Bottom of Boring at 70.0'Advanced boring to 70' with roller bit, attempted to sample; hole wouldnot stay open.Drilling and wash indicated sand at 70'.
1. Advanced boring from 0 to 10' using drive and wash technique with 4"(HW) casing.
2. Advanced boring open hole below 10'.
3. Advanced boring to 70' with roller bit, attempted to sample but holewould not stay open. Drilling and wash water indicate we are still in sand. Did not have sufficient time to advance the casing to 70' to continueboring.
FD-16
Camp Ellis Beach
Saco, maine
04376-0
H-144

NORTHING: HOR. DATUM:
VERT. DATUM:
EASTING:DATE
BORING LOCATION:
0
5
10
15
20
25
30
1 of 1
BORING LOG
(tsf)NO. STR
ATA
SOIL / BEDROCK DESCRIPTIONSvIN.
RECIN.
PEN6 IN.PER
BLOWSSAMPLE INFORMATION
andTYPEDEPTH
FT.
PROJECT NAME:
GEI PROJECT NUMBER:
CITY/STATE: PAGE
SURFACE ELEVATION (FT):
DRILLED BY:
LOGGED BY:
TOTAL DEPTH (FT):
HOLECASINGWATER
DEPTH (FT)TIME
GROUNDWATER INFORMATION
DATE START:
REMARKS
DATE END:
GEI Consultants, Inc.1021 Main StreetWinchester, MA 01890
STRATIGRAPHIC LEGEND
- CLAY
- ORGANIC SILT
- SILT
- SAND
BLOWS PER 6 inch - 140lb. hammer falling 30 inchesPEN - Penetration length of sampler or core barrelREC - Recovery length of sampleU - 3 inch Shelby tube sampleQD - Pocket penetrometerSv - Shear strength from torvaneS - 2 inch O.D Split spoon sampleTSF - Tons per square footS' - 3 inch O.D Split spoon sample
- SILTY SAND
- GRAVEL
U1U1: LEAN CLAY (CL); Medium plasticity, <5% fine sand, Olive-gray
Bottom of Boring at 17.0'1. This hole was advanced adjacent to FD-15 to a depth of 15' to take anundisturbed sample. Shelby tube sample was taken from 15' to 17'.
2424
FD-15A
FD-15A
Camp Ellis Beach
04376-0
Saco, maine
NM
New Hampshire Boring
Steve Sarandis
17.0'
FD-15A9/11/05
9/11/05
MLLW
B. Thompson
NAD 83 (m)4813907.55 388279.65
H-145

NORTHING: HOR. DATUM:
VERT. DATUM:
EASTING:DATE
BORING LOCATION:
0
5
10
15
20
25
30
1 of 2
BORING LOG
(tsf)NO. STR
ATA
SOIL / BEDROCK DESCRIPTIONSvIN.
RECIN.
PEN6 IN.PER
BLOWSSAMPLE INFORMATION
andTYPEDEPTH
FT.
PROJECT NAME:
GEI PROJECT NUMBER:
CITY/STATE: PAGE
SURFACE ELEVATION (FT):
DRILLED BY:
LOGGED BY:
TOTAL DEPTH (FT):
HOLECASINGWATER
DEPTH (FT)TIME
GROUNDWATER INFORMATION
DATE START:
REMARKS
DATE END:
GEI Consultants, Inc.1021 Main StreetWinchester, MA 01890
STRATIGRAPHIC LEGEND
- CLAY
- ORGANIC SILT
- SILT
- SAND
BLOWS PER 6 inch - 140lb. hammer falling 30 inchesPEN - Penetration length of sampler or core barrelREC - Recovery length of sampleU - 3 inch Shelby tube sampleQD - Pocket penetrometerSv - Shear strength from torvaneS - 2 inch O.D Split spoon sampleTSF - Tons per square footS' - 3 inch O.D Split spoon sample
- SILTY SAND
- GRAVEL
S1
S2
S3
S5
S6
S4
S1: Top 2"; POORLY GRADED SAND WITH SILT (SP-SM); Very finesand, ~10% non plastic fines, Gray.
S1: Bot. 12" POORLY GRADED SAND WITH SILT (SP-SM); Fine tomedium sand, ~10% non plastic fines, Gray.
S2: LEAN CLAY (CL); Low to medium plasticity, trace fine sand, OliveGray.
S3: LEAN CLAY (CL); Low to medium plasticity, occasional layer of finesand, ~1/8" max size, Gray, with layers of black.
S4: LEAN CLAY (CL); Simialr to S3.
S5: LEAN CLAY (CL); Simialr to S3.
S6: LEAN CLAY (CL); Low to medium plasticity, occasional layers andlamina of fine sand, ~1/16" max size, Dark Gray to Black.
0.60 0.60
0.20 0.20
0.25 0.20 0.25
0.15 0.15
14
24
24
24
24
24
24
24
24
24
24
24
9655
3345
WOR/12"
12
11/12"
1
WOR/24"
WOR/24"
FD-15
FD-15
Camp Ellis Beach
04376-0
Saco, maine
-3.4
New Hampshire Boring
Steve Sarandis
62.0'
FD-1510/20/05
10/20/05
MLLW
B. Thompson
NAD 83 (m)4813910.24 388278.32
H-146

REMARKS(tsf)IN.IN.6 IN.NO.
35
40
45
50
55
60
65
SOIL / BEDROCK DESCRIPTION
STR
ATADEPTH
FT.
BORING LOG
2 of 2
PAGE
SAMPLE INFORMATION
SvRECPENPERBLOWS
andTYPE
PROJECT NAME:
CITY/STATE:
GEI PROJECT NUMBER:
STRATIGRAPHIC LEGEND
- CLAY
- ORGANIC SILT
- SILT
- SAND
GEI Consultants, Inc.
Winchester, MA 018901021 Main Street
BLOWS PER 6 inch - 140lb. hammer falling 30 inchesPEN - Penetration length of sampler or core barrelREC - Recovery length of sampleU - 3 inch Shelby tube sampleQD - Pocket penetrometerSv - Shear strength from torvaneS - 2 inch O.D Split spoon sampleTSF - Tons per square footS' - 3 inch O.D Split spoon sample
- SILTY SAND
- GRAVEL
S7
S8
S9
S10
S11
S12
S13
S7: LEAN CLAY (CL-CH); Medium plasticity, Dark Gray.
S8: LEAN CLAY (CL); Low to medium plasticity, trace fine sand, DarkGray.
S9: LEAN CLAY (CL); Similar to S8.
S10: LEAN CLAY (CL); Low to medium plasticity, Dark Gray.
S11: LEAN CLAY (CL); Low to medium plasticity, frequent layers andlamina of fine sand, Gray.
S12: LEAN CLAY (CL); Low plasticity, ~20% fine sand, layers of finesand ~1/2" thick, Gray.
Top of CLAYEY SAND at about 58.5'
S13: CLAYEY SAND (SC); Fine sand, ~20% low plasticity fines, Gray.
Bottom of Boring at 62.0'1. Boring advanced from 0-15' using drive and wash techniques with 4"(HW) casing.2. Boring advanced open hole below 15'.3. Advanced an adjacent hole to 15' to take an undisturbed sample.Shelby tube sample was taken from 15' to 17'. Coordinates for theundisturbed sample are 4813907.55 N , 388279.65 E. Boring designatedFD-15A.
0.30 0.30
0.45 0.50 0.55
0.35 0.35 0.35
0.40 0.40
24
24
24
12
24
24
18
24
24
24
24
24
24
24
WOR/12"33
WOR445
WOR/12"
34
3456
WOR123
WOR
14141418
FD-15
Camp Ellis Beach
Saco, maine
04376-0
H-147

NORTHING: HOR. DATUM:
VERT. DATUM:
EASTING:DATE
BORING LOCATION:
0
5
10
15
20
25
30
1 of 2
BORING LOG
(tsf)NO. STR
ATA
SOIL / BEDROCK DESCRIPTIONSvIN.
RECIN.
PEN6 IN.PER
BLOWSSAMPLE INFORMATION
andTYPEDEPTH
FT.
PROJECT NAME:
GEI PROJECT NUMBER:
CITY/STATE: PAGE
SURFACE ELEVATION (FT):
DRILLED BY:
LOGGED BY:
TOTAL DEPTH (FT):
HOLECASINGWATER
DEPTH (FT)TIME
GROUNDWATER INFORMATION
DATE START:
REMARKS
DATE END:
GEI Consultants, Inc.1021 Main StreetWinchester, MA 01890
STRATIGRAPHIC LEGEND
- CLAY
- ORGANIC SILT
- SILT
- SAND
BLOWS PER 6 inch - 140lb. hammer falling 30 inchesPEN - Penetration length of sampler or core barrelREC - Recovery length of sampleU - 3 inch Shelby tube sampleQD - Pocket penetrometerSv - Shear strength from torvaneS - 2 inch O.D Split spoon sampleTSF - Tons per square footS' - 3 inch O.D Split spoon sample
- SILTY SAND
- GRAVEL
Rig Bouncing@ ~9-10'
S1
S2
S3
S4
S5
U1
S1: SILTY SAND (SM); Fine to very fine sand, ~15% non-plastic fines,gray
S2: POORLY GRADED SAND WITH SILT (SP-SM); Mostly fine tomedium sand, ~10% non-plastic fines, trace of coarse sand and finegravel, brown
S3: WELL-GRADED SAND WITH SILT AND GRAVEL (SW-SM); Mostlyfine to medium sand, ~15% subrounded and subangular fine gravel, onepiece of coarse subangular gravel at top of sample, ~10% non-plasticfines, gray
Top of SANDY SILT at 13.5'
S4: SANDY SILT (ML-OL); Low plasticity, ~40% fine sand, occasionalpeat fiber, organic odor, olive gray
S5: SANDY SILT (ML-OL); Medium plasticity, ~25-30% fine sand,occasional piece of subrounded fine gravel, peat fiber, shell fragment;organic odor, dark olive gray
U1: Similar to S5; except low plasticity (ML-OL)0.65 0.55
7
7
12
12
15
27
24
24
24
24
24
27
8 4 4 6
8 11 12 14
29 17 14 20
2 2 2 11
1 2 1 2
P U S H
Offshore
FD-14
Camp Ellis Beach
04376-0
Saco, ME
-2.5
New Hampshire Boring
Steve Sarandis
37'
4/26/05
MLLW
D. Thompson
NAD 83 (m)4813267.53 388500.66
H-148

REMARKS(tsf)IN.IN.6 IN.NO.
35
40
45
50
55
60
SOIL / BEDROCK DESCRIPTION
STR
ATADEPTH
FT.
BORING LOG
2 of 2
PAGE
SAMPLE INFORMATION
SvRECPENPERBLOWS
andTYPE
PROJECT NAME:
CITY/STATE:
GEI PROJECT NUMBER:
STRATIGRAPHIC LEGEND
- CLAY
- ORGANIC SILT
- SILT
- SAND
GEI Consultants, Inc.
Winchester, MA 018901021 Main Street
BLOWS PER 6 inch - 140lb. hammer falling 30 inchesPEN - Penetration length of sampler or core barrelREC - Recovery length of sampleU - 3 inch Shelby tube sampleQD - Pocket penetrometerSv - Shear strength from torvaneS - 2 inch O.D Split spoon sampleTSF - Tons per square footS' - 3 inch O.D Split spoon sample
- SILTY SAND
- GRAVEL
S6
S7
S6: SANDY SILT (ML-OL); Low plasticity, ~35% fine sand, peat fiber,shell fragments, organic odor, dark olive gray
S7: Similar to S6; lower 12" of sample has several layers of fine tomedium sand up to 1" thick
Bottom of boring at 37'
Boring terminated prematuraly due to unanticipated marine conditions
24
24
24
24
4 4 3 6
2 1 4 5
FD-14
Camp Ellis Beach
Saco, ME
04376-0
H-149

NORTHING: HOR. DATUM:
VERT. DATUM:
EASTING:DATE
BORING LOCATION:
0
5
10
15
20
25
1 of 2
BORING LOG
(tsf)NO. STR
ATA
SOIL / BEDROCK DESCRIPTIONSvIN.
RECIN.
PEN6 IN.PER
BLOWSSAMPLE INFORMATION
andTYPEDEPTH
FT.
PROJECT NAME:
GEI PROJECT NUMBER:
CITY/STATE: PAGE
SURFACE ELEVATION (FT):
DRILLED BY:
LOGGED BY:
TOTAL DEPTH (FT):
HOLECASINGWATER
DEPTH (FT)TIME
GROUNDWATER INFORMATION
DATE START:
REMARKS
DATE END:
GEI Consultants, Inc.1021 Main StreetWinchester, MA 01890
STRATIGRAPHIC LEGEND
- CLAY
- ORGANIC SILT
- SILT
- SAND
BLOWS PER 6 inch - 140lb. hammer falling 30 inchesPEN - Penetration length of sampler or core barrelREC - Recovery length of sampleU - 3 inch Shelby tube sampleQD - Pocket penetrometerSv - Shear strength from torvaneS - 2 inch O.D Split spoon sampleTSF - Tons per square footS' - 3 inch O.D Split spoon sample
- SILTY SAND
- GRAVEL
Rig Jumping@ 8-9'
S1
S2
S3
S4
S5
S6
S1: POORLY GRADED SAND WITH SILT (SP-SM); Mostly fine sand,trace of medium sand, ~10% non-plastic fines, gray
Top of CLAY at about 3'
S2: LEAN CLAY (CL); Low to medium plasticity, gray
Top of SAND at about 8'
S3: WELL-GRADED SAND WITH GRAVEL (SW); Fine to coarse sand,~40% subrounded fine to coarse gravel, ~5% fines, brown
S4: WELL-GRADED SAND WITH GRAVEL (SW); Similar to S3
S5: WELL-GRADED SAND WITH GRAVEL (SW); Similar to S3
S6: WELL-GRADED SAND WITH SILT AND GRAVEL (SW-SM); Fine to coarse sand, ~20% subrounded fine gravel, ~10% non-plastic fines, gray
15
18
18
2
2
7
24
24
24
24
24
22
1 1 2 3
WOH/ 18" 2
18 27 25 20
15 17 17 19
11 12 9 8
10 8 5-5/4" 23/0"
Offshore
FD-13
Camp Ellis Beach
04376-0
Saco, ME
-6.6
New Hampshire Boring
Steve Sarandis
44.9'
4/22/05
4/25/05
MLLW
D. Thompson
NAD 83 (m)4813702.65 388507.88
H-150

REMARKS(tsf)IN.IN.6 IN.NO.
30
35
40
45
50
55
60
SOIL / BEDROCK DESCRIPTION
STR
ATADEPTH
FT.
BORING LOG
2 of 2
PAGE
SAMPLE INFORMATION
SvRECPENPERBLOWS
andTYPE
PROJECT NAME:
CITY/STATE:
GEI PROJECT NUMBER:
STRATIGRAPHIC LEGEND
- CLAY
- ORGANIC SILT
- SILT
- SAND
GEI Consultants, Inc.
Winchester, MA 018901021 Main Street
BLOWS PER 6 inch - 140lb. hammer falling 30 inchesPEN - Penetration length of sampler or core barrelREC - Recovery length of sampleU - 3 inch Shelby tube sampleQD - Pocket penetrometerSv - Shear strength from torvaneS - 2 inch O.D Split spoon sampleTSF - Tons per square footS' - 3 inch O.D Split spoon sample
- SILTY SAND
- GRAVEL
Casingdriving hard@ 42'
S7
S8
S9
S10
S7: POORLY GRADED SAND WITH SILT (SP-SM); Mostly fine sand,~10% non-plastic fines, several pieces of fractured gravel at top ofsample, gray
S8: WELL-GRADED SAND WITH SILT AND GRAVEL (SW-SM); Fine to coarse sand, ~20% subangular fine gravel (some pieces fractured bysampler), ~10% non-plastic fines, gray
S9: Piece of coarse gravel wedged in tip of sampler
S10: SILTY SAND (SM); Mostly fine to medium sand, ~15% slightlyplastic fines, ~10% subangular fine gravel, one piece of coarse gravel intip of spoon, gray
Bottom of borehole at 44.9'
1. Boring was advanced using drive and wash technique with 4" (HW)casing and a 3-7/8" roller bit.
8
5
1
2
24
24
24
10
25 14 11 16
15 16 16 16
32 24 17 29
27100/4"
FD-13
Camp Ellis Beach
Saco, ME
04376-0
H-151

NORTHING: HOR. DATUM:
VERT. DATUM:
EASTING:DATE
BORING LOCATION:
0
5
10
15
20
25
1 of 3
BORING LOG
(tsf)NO. STR
ATA
SOIL / BEDROCK DESCRIPTIONSvIN.
RECIN.
PEN6 IN.PER
BLOWSSAMPLE INFORMATION
andTYPEDEPTH
FT.
PROJECT NAME:
GEI PROJECT NUMBER:
CITY/STATE: PAGE
SURFACE ELEVATION (FT):
DRILLED BY:
LOGGED BY:
TOTAL DEPTH (FT):
HOLECASINGWATER
DEPTH (FT)TIME
GROUNDWATER INFORMATION
DATE START:
REMARKS
DATE END:
GEI Consultants, Inc.1021 Main StreetWinchester, MA 01890
STRATIGRAPHIC LEGEND
- CLAY
- ORGANIC SILT
- SILT
- SAND
BLOWS PER 6 inch - 140lb. hammer falling 30 inchesPEN - Penetration length of sampler or core barrelREC - Recovery length of sampleU - 3 inch Shelby tube sampleQD - Pocket penetrometerSv - Shear strength from torvaneS - 2 inch O.D Split spoon sampleTSF - Tons per square footS' - 3 inch O.D Split spoon sample
- SILTY SAND
- GRAVEL
2nd Attempt= 10"
Cobble @ 8'
1st attemptcoarsepiece ofgravelwedgedin tip of spoon
wash waterchanged togray @ 27'
S1
S2
S3
S4
S5
S6
S1: POORLY GRADED SAND WITH SILT (SP-SM); Fine to mediumsand, ~10% low plastic fines, brown
S2: SANDY CLAY (CL); Low to medium plasticity, ~15-20% fine tomedium sand, gray
S3: WELL-GRADED SAND WITH SILT AND GRAVEL (SW-SM); Fine to coarse sand, ~10% non-plastic fines, ~10-15% subangular fine gravel,brown
S4: Similar to S3
S5: POORLY GRADED SAND WITH SILT (SP-SM); Mostly fine sand;trace of medium to coarse sand, ~10% non-plastic fines, brown
S6: No recovery
15
0(10)
1(7)
12
12
0
24
24
24
24
24
24
4 5 4 6
10 4 2 3
11 19 10 19
5 25 15 17
12 17 16 13
17 13 11 11
Offshore
FD-12
Camp Ellis Beach
04376-0
Saco, ME
-1.8
New Hampshire Boring
Steve Sarandis/Justin deWolfe
76'
4/22/05
4/20/05
MLLW
D. Thompson
NAD 83 (m)4813520.59 388371.83
H-152

REMARKS(tsf)IN.IN.6 IN.NO.
30
35
40
45
50
55
60
SOIL / BEDROCK DESCRIPTION
STR
ATADEPTH
FT.
BORING LOG
2 of 3
PAGE
SAMPLE INFORMATION
SvRECPENPERBLOWS
andTYPE
PROJECT NAME:
CITY/STATE:
GEI PROJECT NUMBER:
STRATIGRAPHIC LEGEND
- CLAY
- ORGANIC SILT
- SILT
- SAND
GEI Consultants, Inc.
Winchester, MA 018901021 Main Street
BLOWS PER 6 inch - 140lb. hammer falling 30 inchesPEN - Penetration length of sampler or core barrelREC - Recovery length of sampleU - 3 inch Shelby tube sampleQD - Pocket penetrometerSv - Shear strength from torvaneS - 2 inch O.D Split spoon sampleTSF - Tons per square footS' - 3 inch O.D Split spoon sample
- SILTY SAND
- GRAVEL
Blow countsinflatedcasinggoing downwith sampler last 4"
S7
S8
S9
U1
S10
S11
S12
S7: Top 10" SILTY SAND (SM); Mostly fine sand, ~15% slightly plasticfines, gray
Bottom 3" CLAYEY SAND (SC); Mostly fine sand, ~40% low plastic fines, gray
Top of CLAY at about 32.5'
S8: LEAN CLAY (CL); Low to medium plasticity, several layers of finesand up to ~3" thick, gray
S9: LEAN CLAY (CL); Low to medium plasticity, trace of fine sand, gray
U1: LEAN CLAY (CL); Similar to S9
Top of SAND at about 47.5'
S10: CLAYEY SAND (SC); Mostly fine sand, ~15-20% low plasticityfines, gray
S11: Top 3" SILTY SAND (SM); Fine to coarse angular sand, ~20% lowplastic fines, gray
Bottom 12" WELL-GRADED SAND WITH GRAVEL (SW); Fine to coarsesubrounded sand, ~15% subrounded fine gravel, gray
S12: WELL-GRADED SAND WITH SILT (SW-SM); Fine to coarse sand,~10% non-plastic fines, ~5-10% fine subrounded gravel, gray
.25
.30
.55
.50
.50
13
24
18
24
2
15
7
24
24
24
24
24
21
24
10 8 9 8
3 6 5 5
3 2 2 2
P U S H
7 13 14 18
22 28 5643/3"
12 9 5 6
FD-12
Camp Ellis Beach
Saco, ME
04376-0
H-153

REMARKS(tsf)IN.IN.6 IN.NO.
65
70
75
80
SOIL / BEDROCK DESCRIPTION
STR
ATADEPTH
FT.
BORING LOG
3 of 3
PAGE
SAMPLE INFORMATION
SvRECPENPERBLOWS
andTYPE
PROJECT NAME:
CITY/STATE:
GEI PROJECT NUMBER:
STRATIGRAPHIC LEGEND
- CLAY
- ORGANIC SILT
- SILT
- SAND
GEI Consultants, Inc.
Winchester, MA 018901021 Main Street
BLOWS PER 6 inch - 140lb. hammer falling 30 inchesPEN - Penetration length of sampler or core barrelREC - Recovery length of sampleU - 3 inch Shelby tube sampleQD - Pocket penetrometerSv - Shear strength from torvaneS - 2 inch O.D Split spoon sampleTSF - Tons per square footS' - 3 inch O.D Split spoon sample
- SILTY SAND
- GRAVEL
S13
S14
S15
S13: Similar to S12
S14: No recovery
S15: WELL-GRADED SAND WITH SILT (SW-SM); Similar to S12
Bottom of borehole @ 76'
1. Boring was advanced using drive and wash technique with 4" (HW)casing and a 3-7/8" roller bit.
6
0
8
24
24
24
16 10 8 15
20 15 13 16
10 7 8 10
FD-12
Camp Ellis Beach
Saco, ME
04376-0
H-154

NORTHING: HOR. DATUM:
VERT. DATUM:
EASTING:DATE
BORING LOCATION:
0
5
10
15
20
25
1 of 2
BORING LOG
(tsf)NO. STR
ATA
SOIL / BEDROCK DESCRIPTIONSvIN.
RECIN.
PEN6 IN.PER
BLOWSSAMPLE INFORMATION
andTYPEDEPTH
FT.
PROJECT NAME:
GEI PROJECT NUMBER:
CITY/STATE: PAGE
SURFACE ELEVATION (FT):
DRILLED BY:
LOGGED BY:
TOTAL DEPTH (FT):
HOLECASINGWATER
DEPTH (FT)TIME
GROUNDWATER INFORMATION
DATE START:
REMARKS
DATE END:
GEI Consultants, Inc.1021 Main StreetWinchester, MA 01890
STRATIGRAPHIC LEGEND
- CLAY
- ORGANIC SILT
- SILT
- SAND
BLOWS PER 6 inch - 140lb. hammer falling 30 inchesPEN - Penetration length of sampler or core barrelREC - Recovery length of sampleU - 3 inch Shelby tube sampleQD - Pocket penetrometerSv - Shear strength from torvaneS - 2 inch O.D Split spoon sampleTSF - Tons per square footS' - 3 inch O.D Split spoon sample
- SILTY SAND
- GRAVEL
S1
S2
S3
S4
S5
S6
S1: POORLY GRADED SAND WITH SILT AND GRAVEL (SP-SM);Predominantly fine sand, ~10% non-plastic fines, ~20% subangularcoarse gravel, gray
S2: WELL-GRADED SAND WITH SILT AND GRAVEL (SW-SM); Mostlyfine to medium sand, ~10% coarse sand; ~10% non-plastic fines; ~10%fine subangular gravel; brown
Top of CLAY at 9.0'
S3: Top 7" Similar to S2
Bottom 3" LEAN CLAY (CL); Low plasticity varved appearance, Brown
S4: LEAN CLAY (CL); Low to medium plasticity; two ~1" layers of fine tomedium sand, varved appearance, Brown
Top of SAND at about 17.0'
S5: WELL-GRADED SAND WITH SILT (SW-SM); Fine to coarse sand,~10-15% non-plastic fines; 5-10% subangular fine gravel, Brown
S6: Top 8" SILTY SAND (SM); Fine to coarse sand, ~15% low plasticfines, 5% fine subangular gravel, occasional pockets of clay, brown
Bottom 3" LEAN CLAY (CL); Low to medium plasticity, 5% fine sand,
.3
4
10
10
20
10
11
24
24
24
24
24
24
9 6 8 8
23 13 9 11
13 13 5 9
2 8 9 13
16 15 16 19
31 17 12 11
Offshore
FD-11
Camp Ellis Beach
04376-0
Saco, ME
-7.1
New Hampshire Boring
Steve Sarandis/Justin deWolfe
50.8'
4/20/05
4/19/05
MLLW
D. Thompson
NAD 83 (m)4813522.59 388578.71
H-155

REMARKS(tsf)IN.IN.6 IN.NO.
30
35
40
45
50
55
60
SOIL / BEDROCK DESCRIPTION
STR
ATADEPTH
FT.
BORING LOG
2 of 2
PAGE
SAMPLE INFORMATION
SvRECPENPERBLOWS
andTYPE
PROJECT NAME:
CITY/STATE:
GEI PROJECT NUMBER:
STRATIGRAPHIC LEGEND
- CLAY
- ORGANIC SILT
- SILT
- SAND
GEI Consultants, Inc.
Winchester, MA 018901021 Main Street
BLOWS PER 6 inch - 140lb. hammer falling 30 inchesPEN - Penetration length of sampler or core barrelREC - Recovery length of sampleU - 3 inch Shelby tube sampleQD - Pocket penetrometerSv - Shear strength from torvaneS - 2 inch O.D Split spoon sampleTSF - Tons per square footS' - 3 inch O.D Split spoon sample
- SILTY SAND
- GRAVEL
S7
S8
S9
S10
S11
Brown
S7: WELL-GRADED SAND WITH SILT (SW-SM); Fine to coarse sand,~10% low plastic fines, Brown
S8: POORLY GRADED SAND WITH SILT (SP-SM); Fine to mediumsand, ~10% low plastic fines, Brown
S9: WELL-GRADED SAND WITH SILT (SW-SM); Fine to coarse sand,~10% low plastic fines, Brown
S10: WELL-GRADED SAND WITH SILT (SW-SM); Fine to coarse sand,~10% low plastic fines, ~5% fine subrounded gravel, brown
S11: POORLY GRADED SAND WITH SILT (SP-SM); Fine to mediumsand, ~10% low plastic fines, ~3% fine subrounded gravel, Brown
Bottom of borehole @ 50.8'
1. Boring was advanced using drive and wash technique with 4" (HW)casing and a 3-7/8" roller bit.
12
12
10
14
4
24
24
24
24
20
10 8 8 12
11 13 10 11
7 8 15 10
12 16 20 37
33 18 53100/4"
FD-11
Camp Ellis Beach
Saco, ME
04376-0
H-156
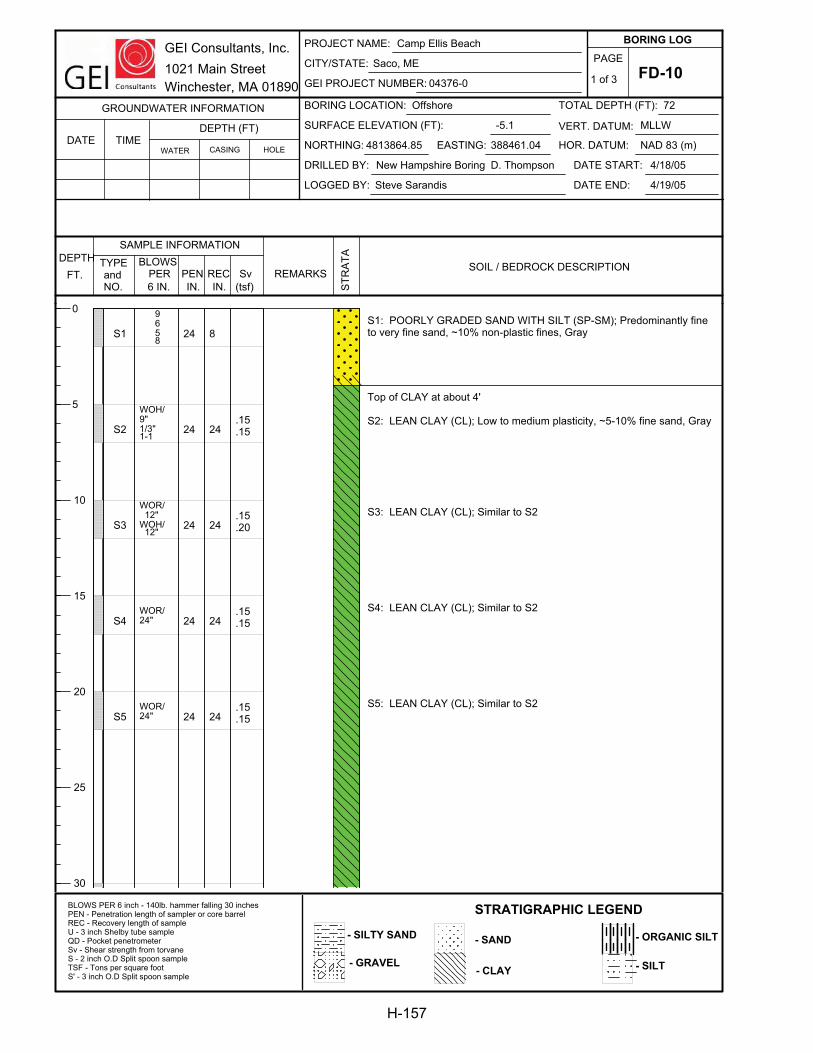
NORTHING: HOR. DATUM:
VERT. DATUM:
EASTING:DATE
BORING LOCATION:
0
5
10
15
20
25
30
1 of 3
BORING LOG
(tsf)NO. STR
ATA
SOIL / BEDROCK DESCRIPTIONSvIN.
RECIN.
PEN6 IN.PER
BLOWSSAMPLE INFORMATION
andTYPEDEPTH
FT.
PROJECT NAME:
GEI PROJECT NUMBER:
CITY/STATE: PAGE
SURFACE ELEVATION (FT):
DRILLED BY:
LOGGED BY:
TOTAL DEPTH (FT):
HOLECASINGWATER
DEPTH (FT)TIME
GROUNDWATER INFORMATION
DATE START:
REMARKS
DATE END:
GEI Consultants, Inc.1021 Main StreetWinchester, MA 01890
STRATIGRAPHIC LEGEND
- CLAY
- ORGANIC SILT
- SILT
- SAND
BLOWS PER 6 inch - 140lb. hammer falling 30 inchesPEN - Penetration length of sampler or core barrelREC - Recovery length of sampleU - 3 inch Shelby tube sampleQD - Pocket penetrometerSv - Shear strength from torvaneS - 2 inch O.D Split spoon sampleTSF - Tons per square footS' - 3 inch O.D Split spoon sample
- SILTY SAND
- GRAVEL
S1
S2
S3
S4
S5
S1: POORLY GRADED SAND WITH SILT (SP-SM); Predominantly fineto very fine sand, ~10% non-plastic fines, Gray
Top of CLAY at about 4'
S2: LEAN CLAY (CL); Low to medium plasticity, ~5-10% fine sand, Gray
S3: LEAN CLAY (CL); Similar to S2
S4: LEAN CLAY (CL); Similar to S2
S5: LEAN CLAY (CL); Similar to S2
.15
.15
.15
.20
.15
.15
.15
.15
8
24
24
24
24
24
24
24
24
24
9 6 5 8
WOH/9"1/3"1-1
WOR/ 12"WOH/ 12"
WOR/24"
WOR/24"
Offshore
FD-10
Camp Ellis Beach
04376-0
Saco, ME
-5.1
New Hampshire Boring
Steve Sarandis
72
4/19/05
4/18/05
MLLW
D. Thompson
NAD 83 (m)4813864.85 388461.04
H-157

REMARKS(tsf)IN.IN.6 IN.NO.
35
40
45
50
55
60
65
SOIL / BEDROCK DESCRIPTION
STR
ATADEPTH
FT.
BORING LOG
2 of 3
PAGE
SAMPLE INFORMATION
SvRECPENPERBLOWS
andTYPE
PROJECT NAME:
CITY/STATE:
GEI PROJECT NUMBER:
STRATIGRAPHIC LEGEND
- CLAY
- ORGANIC SILT
- SILT
- SAND
GEI Consultants, Inc.
Winchester, MA 018901021 Main Street
BLOWS PER 6 inch - 140lb. hammer falling 30 inchesPEN - Penetration length of sampler or core barrelREC - Recovery length of sampleU - 3 inch Shelby tube sampleQD - Pocket penetrometerSv - Shear strength from torvaneS - 2 inch O.D Split spoon sampleTSF - Tons per square footS' - 3 inch O.D Split spoon sample
- SILTY SAND
- GRAVEL
S6
S7
S8
S9
S10
S6: LEAN CLAY (CL); Low to medium plasticity, ~5% fine sand;occasional piece of medium to coarse sand, gray-blue
S7: LEAN CLAY (CL); Similar to S6
S8: LEAN CLAY (CL) Medium plasticity, ~5% fine sand, Gray
Top of SAND at about 59'
S9: POORLY GRADED SAND WITH SILT (SP-SM); Predominantly finesand, ~5% medium to coarse sand, ~10% non-plastic fines, gray
S10: POORLY GRADED SAND WITH SILT (SP-SM); Similar to S9 withseveral layers of sandy silt ~ 1/2" thick, gray
.10
.20
.20
.20
.15
.20
24
18
24
9
11
24
24
24
24
24
WOR/12"WOH/12"
WOR/6"WOH/18"
WOR/18"WOH/6"
14 18 43 28
3 4 3 12
FD-10
Camp Ellis Beach
Saco, ME
04376-0
H-158

REMARKS(tsf)IN.IN.6 IN.NO.
70
75
80
85
90
SOIL / BEDROCK DESCRIPTION
STR
ATADEPTH
FT.
BORING LOG
3 of 3
PAGE
SAMPLE INFORMATION
SvRECPENPERBLOWS
andTYPE
PROJECT NAME:
CITY/STATE:
GEI PROJECT NUMBER:
STRATIGRAPHIC LEGEND
- CLAY
- ORGANIC SILT
- SILT
- SAND
GEI Consultants, Inc.
Winchester, MA 018901021 Main Street
BLOWS PER 6 inch - 140lb. hammer falling 30 inchesPEN - Penetration length of sampler or core barrelREC - Recovery length of sampleU - 3 inch Shelby tube sampleQD - Pocket penetrometerSv - Shear strength from torvaneS - 2 inch O.D Split spoon sampleTSF - Tons per square footS' - 3 inch O.D Split spoon sample
- SILTY SAND
- GRAVEL
S11S11: POORLY GRADED SAND WITH SILT (SP-SM); Similar to S9 with~5-10% medium to coarse sand, gray
Bottom of Borehole @ 72'
1. Advanced borehole to 19' using drive and wash technique with 4"casing and a 3-7/8" roller bit2. Advanced boring open hole below 19'.
1024
4 5 9 17
FD-10
Camp Ellis Beach
Saco, ME
04376-0
H-159

NORTHING: HOR. DATUM:
VERT. DATUM:
EASTING:DATE
BORING LOCATION:
0
5
10
15
20
25
30
1 of 1
BORING LOG
(tsf)NO. STR
ATA
SOIL / BEDROCK DESCRIPTIONSvIN.
RECIN.
PEN6 IN.PER
BLOWSSAMPLE INFORMATION
andTYPEDEPTH
FT.
PROJECT NAME:
GEI PROJECT NUMBER:
CITY/STATE: PAGE
SURFACE ELEVATION (FT):
DRILLED BY:
LOGGED BY:
TOTAL DEPTH (FT):
HOLECASINGWATER
DEPTH (FT)TIME
GROUNDWATER INFORMATION
DATE START:
REMARKS
DATE END:
GEI Consultants, Inc.1021 Main StreetWinchester, MA 01890
STRATIGRAPHIC LEGEND
- CLAY
- ORGANIC SILT
- SILT
- SAND
BLOWS PER 6 inch - 140lb. hammer falling 30 inchesPEN - Penetration length of sampler or core barrelREC - Recovery length of sampleU - 3 inch Shelby tube sampleQD - Pocket penetrometerSv - Shear strength from torvaneS - 2 inch O.D Split spoon sampleTSF - Tons per square footS' - 3 inch O.D Split spoon sample
- SILTY SAND
- GRAVEL
encounteredresistancefrom~4-8 feetthis may havebeen causedby gravel,cobbles orboulders
S1
S2
S3
S4
S5
S6
S1: WELL-GRADED SAND (SW); Fine to coarse sand; tan-gray
S2: POORLY GRADED SAND WITH GRAVEL (SP); Mostly fine tomedium sand, ~20% subangular gravel, (1 piece, 1.5" diam.); tan withblack gravel
S3: WELL-GRADED SAND WITH GRAVEL (SW); Mostly fine to medium sand, ~15% subrounded - subangular gravel, max size 1";~5%nonplastic fines; gray with black gravel. Gravel possibly broken offadjacent cobble or boulder.
S4: WELL-GRADED SAND (SW); Mostly fine to medium sand, <5%nonplastic fines; gray. Wood fragments in tip of spoon
Top of Clay at about 18.5'
S5: SANDY LEAN CLAY (CL); Mostly low plastic fines, ~40% sand,mostly fine sand; trace wood fragments; moderate organic odor; darkgray
S6: LEAN CLAY (CL); Mostly low plastic fines, ~10% fine sand; traceshell fragments; moderate organic odor; dark gray
BOTTOM OF BOREHOLE AT 27.0'/EL.-24.7 FEETBoring terminated at 27' due to incoming tide. Boring advaced usingdrive and wash technique with 4-inch (HW) casing and N drill rods wtih a3-7/8-inch roller bit. Boring was advanced open hole beyond 20'
10
5
6
13
24
17
24
24
24
24
24
24
WOH/ 12" 1 2
WOR/ 12" 6 14
10 6 6 7
3 5 7 5
WOH/ 18" 2
3
Beach, North Ave. & Riverside
FD-09
Camp Ellis Beach
04376-0
Saco, ME
2.33
New Hampshire Boring
Mary Nodine
27'
2/17/05
2/17/05
MLLW
Steve Garside
NAD 83 (m)4813255.54 388360.67
H-160

NORTHING: HOR. DATUM:
VERT. DATUM:
EASTING:DATE
BORING LOCATION:
0
5
10
15
20
25
30
1 of 2
BORING LOG
(tsf)NO. STR
ATA
SOIL / BEDROCK DESCRIPTIONSvIN.
RECIN.
PEN6 IN.PER
BLOWSSAMPLE INFORMATION
andTYPEDEPTH
FT.
PROJECT NAME:
GEI PROJECT NUMBER:
CITY/STATE: PAGE
SURFACE ELEVATION (FT):
DRILLED BY:
LOGGED BY:
TOTAL DEPTH (FT):
HOLECASINGWATER
DEPTH (FT)TIME
GROUNDWATER INFORMATION
DATE START:
REMARKS
DATE END:
GEI Consultants, Inc.1021 Main StreetWinchester, MA 01890
STRATIGRAPHIC LEGEND
- CLAY
- ORGANIC SILT
- SILT
- SAND
BLOWS PER 6 inch - 140lb. hammer falling 30 inchesPEN - Penetration length of sampler or core barrelREC - Recovery length of sampleU - 3 inch Shelby tube sampleQD - Pocket penetrometerSv - Shear strength from torvaneS - 2 inch O.D Split spoon sampleTSF - Tons per square footS' - 3 inch O.D Split spoon sample
- SILTY SAND
- GRAVEL
InterbeddedCLAY andFine SAND
S1
S2
S3
S4
S5
S6
S1: POORLY GRADED SAND (SP); Mostly medium to coarse sand, tan
S2: POORLY GRADED SAND (SP); Mostly medium sand, tan-orange
S3: WELL-GRADED SAND (SW); Fine to coarse sand, tan
S4: WELL-GRADED SAND (SW); Mostly medium to coarse sand, ~20%fine sand, ~10% subrounded-subangular gravel, max 3/4", tan-orangewith black and white gravel
S5: POORLY GRADED SAND WITH SILT (SP-SM); Mostly fine tomedium sand, ~5-10% non plastic fines; gray; wood fragments in top 5"
Top of CLAY at about 23.5'
S6: SANDY LEAN CLAY (CL); Mostly low plastic fines, ~30% fine sand,trace wood fibers, trace shell fragments, mild organic odor, dark gray
10
10
12
12
16
9
24
24
24
24
24
24
1 1 1 2
2 2 3 3
2 3 5 7
4 4 5 12
9 13 13 12
1 1 1 1
Beach, North Ave. & Riverside
FD-08
Camp Ellis Beach
04376-0
Saco, ME
13.32
New Hampshire Boring
Mary Nodine
44'
2/16/05
2/16/05
MLLW
Steve Garside
NAD 83 (m)4813407.42 388265.70
H-161

REMARKS(tsf)IN.IN.6 IN.NO.
35
40
45
50
55
60
SOIL / BEDROCK DESCRIPTION
STR
ATADEPTH
FT.
BORING LOG
2 of 2
PAGE
SAMPLE INFORMATION
SvRECPENPERBLOWS
andTYPE
PROJECT NAME:
CITY/STATE:
GEI PROJECT NUMBER:
STRATIGRAPHIC LEGEND
- CLAY
- ORGANIC SILT
- SILT
- SAND
GEI Consultants, Inc.
Winchester, MA 018901021 Main Street
BLOWS PER 6 inch - 140lb. hammer falling 30 inchesPEN - Penetration length of sampler or core barrelREC - Recovery length of sampleU - 3 inch Shelby tube sampleQD - Pocket penetrometerSv - Shear strength from torvaneS - 2 inch O.D Split spoon sampleTSF - Tons per square footS' - 3 inch O.D Split spoon sample
- SILTY SAND
- GRAVEL
Fine Sand
InterbeddedCLAY andFine SAND
S7
S8
S9
S7: LEAN CLAY (CL); Mostly low plastic fines, ~10% fine sand; mildorganic odor, dark gray
S8(0"-5"): SANDY LEAN CLAY (CL); Mostly low plasticity fines, ~40%fine sand, ~10% angular-subangular gravel, max size 1", dark gray
S8(6"-17"): LEAN CLAY WITH SAND (CL); Mostly low plastic fines,~20% fine sand, dark gray
Top of SAND at about 38.5'
S9: POORLY GRADED SAND WITH SILT (SP-SM); Mostly fine-medium sand;~10% nonplastic fines, seams of brown organic material, mildorganic odor, gray
Driller indicated roller bit hit bedrock at 43'. Drilled 1' into rock with rollerbit. Fine black shards observed in wash water.
BOTTOM OF BOREHOLE AT 44.0'/EL.-30.7 FEET
Boring advaced using drive and wash technique with 4-inch (HW) casingand N drill rods wtih a 3-7/8-inch roller bit. Boring was advanced openhole from 20' to 40'. Driller drove casing to 40' before taking final sample.
8
17
16
24
24
24
2 1 2 2
3 7 7 9
6 8 12 13
FD-08
Camp Ellis Beach
Saco, ME
04376-0
H-162
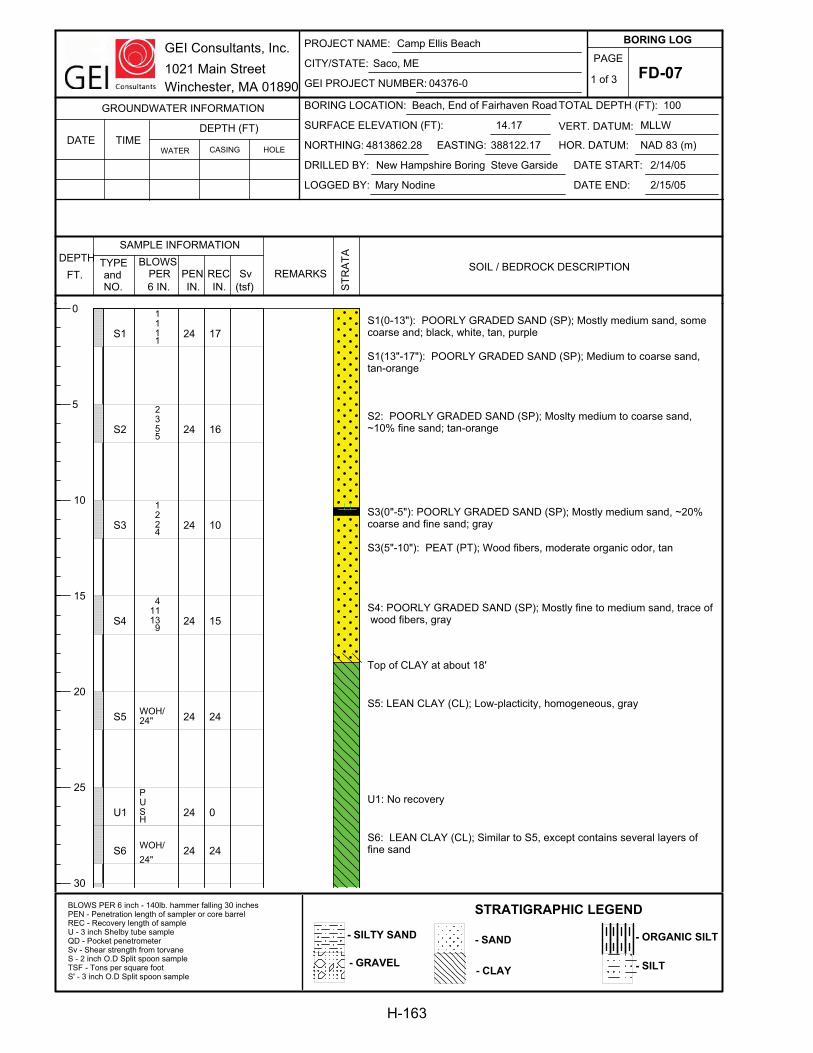
NORTHING: HOR. DATUM:
VERT. DATUM:
EASTING:DATE
BORING LOCATION:
0
5
10
15
20
25
30
1 of 3
BORING LOG
(tsf)NO. STR
ATA
SOIL / BEDROCK DESCRIPTIONSvIN.
RECIN.
PEN6 IN.PER
BLOWSSAMPLE INFORMATION
andTYPEDEPTH
FT.
PROJECT NAME:
GEI PROJECT NUMBER:
CITY/STATE: PAGE
SURFACE ELEVATION (FT):
DRILLED BY:
LOGGED BY:
TOTAL DEPTH (FT):
HOLECASINGWATER
DEPTH (FT)TIME
GROUNDWATER INFORMATION
DATE START:
REMARKS
DATE END:
GEI Consultants, Inc.1021 Main StreetWinchester, MA 01890
STRATIGRAPHIC LEGEND
- CLAY
- ORGANIC SILT
- SILT
- SAND
BLOWS PER 6 inch - 140lb. hammer falling 30 inchesPEN - Penetration length of sampler or core barrelREC - Recovery length of sampleU - 3 inch Shelby tube sampleQD - Pocket penetrometerSv - Shear strength from torvaneS - 2 inch O.D Split spoon sampleTSF - Tons per square footS' - 3 inch O.D Split spoon sample
- SILTY SAND
- GRAVEL
S1
S2
S3
S4
S5
U1
S6
S1(0-13"): POORLY GRADED SAND (SP); Mostly medium sand, somecoarse and; black, white, tan, purple
S1(13"-17"): POORLY GRADED SAND (SP); Medium to coarse sand,tan-orange
S2: POORLY GRADED SAND (SP); Moslty medium to coarse sand,~10% fine sand; tan-orange
S3(0"-5"): POORLY GRADED SAND (SP); Mostly medium sand, ~20%coarse and fine sand; gray
S3(5"-10"): PEAT (PT); Wood fibers, moderate organic odor, tan
S4: POORLY GRADED SAND (SP); Mostly fine to medium sand, trace of wood fibers, gray
Top of CLAY at about 18'
S5: LEAN CLAY (CL); Low-placticity, homogeneous, gray
U1: No recovery
S6: LEAN CLAY (CL); Similar to S5, except contains several layers offine sand
17
16
10
15
24
0
24
24
24
24
24
24
24
24
1 1 1 1
2 3 5 5
1 2 2 4
4 11 13 9
WOH/24"
PUSH
WOH/24"
Beach, End of Fairhaven Road
FD-07
Camp Ellis Beach
04376-0
Saco, ME
14.17
New Hampshire Boring
Mary Nodine
100
2/15/05
2/14/05
MLLW
Steve Garside
NAD 83 (m)4813862.28 388122.17
H-163

REMARKS(tsf)IN.IN.6 IN.NO.
35
40
45
50
55
60
65
SOIL / BEDROCK DESCRIPTION
STR
ATADEPTH
FT.
BORING LOG
2 of 3
PAGE
SAMPLE INFORMATION
SvRECPENPERBLOWS
andTYPE
PROJECT NAME:
CITY/STATE:
GEI PROJECT NUMBER:
STRATIGRAPHIC LEGEND
- CLAY
- ORGANIC SILT
- SILT
- SAND
GEI Consultants, Inc.
Winchester, MA 018901021 Main Street
BLOWS PER 6 inch - 140lb. hammer falling 30 inchesPEN - Penetration length of sampler or core barrelREC - Recovery length of sampleU - 3 inch Shelby tube sampleQD - Pocket penetrometerSv - Shear strength from torvaneS - 2 inch O.D Split spoon sampleTSF - Tons per square footS' - 3 inch O.D Split spoon sample
- SILTY SAND
- GRAVEL
U2
S7
S8
S9
S10
S11
S12
S13
U2: LEAN CLAY (CL); Medium-plasticity, seams of fine sand observed inbottom of sample, gray
S7: LEAN CLAY (CL); Low-plasticity, homogeneous, gray with streaks of black, mild organic odor, high dry strength
S8: LEAN CLAY (CL); Similar to S7
S9: LEAN CLAY (CL); Similar to S7, except dark gray, with streaks ofblack in top ~7". Clay appears stiffer toward bottom of sample
S10: LEAN CLAY (CL); Medium-plasticity, ~5% fine sand,homogeneous, trace shell fragments, dark gray
S11: LEAN CLAY (CL); Similar to S10, except no shell fragments
S12: LEAN CLAY (CL); Medium-plasticity, ~5% fine sand,homogeneous; gray
S13: Interbedded LEAN CLAY (CL~60%) and CLAYEY SAND (SC~40%); Clay portion is medium plasticity, Sand portion is fine to mediumsand with ~20% low plastic fines. Sand layers occur at 5-8", 10-13", and18-20".
0.2025
24
24
24
24
24
24
24
25
24
24
24
24
24
24
24
PUSH
WOH/24"
WOH/18" 2
WOH/18" 2
WOH/12" 3 4
WOH/12" 2 4
WOH/12" 2 2
1 7 7 4
FD-07
Camp Ellis Beach
Saco, ME
04376-0
H-164

REMARKS(tsf)IN.IN.6 IN.NO.
70
75
80
85
90
95
100
SOIL / BEDROCK DESCRIPTION
STR
ATADEPTH
FT.
BORING LOG
3 of 3
PAGE
SAMPLE INFORMATION
SvRECPENPERBLOWS
andTYPE
PROJECT NAME:
CITY/STATE:
GEI PROJECT NUMBER:
STRATIGRAPHIC LEGEND
- CLAY
- ORGANIC SILT
- SILT
- SAND
GEI Consultants, Inc.
Winchester, MA 018901021 Main Street
BLOWS PER 6 inch - 140lb. hammer falling 30 inchesPEN - Penetration length of sampler or core barrelREC - Recovery length of sampleU - 3 inch Shelby tube sampleQD - Pocket penetrometerSv - Shear strength from torvaneS - 2 inch O.D Split spoon sampleTSF - Tons per square footS' - 3 inch O.D Split spoon sample
- SILTY SAND
- GRAVEL
InterbeddedCLAY andFine SAND
InterbeddedCLAY andFine SAND
S14
S14(0"-8"); LEAN CLAY (CL); Similar to S12
S14(8"-14"); CLAYEY SAND (SC); Mostly fine sand, ~40% low plasticfines, dark gray
S14(14"-24"); LEAN CLAY (CL); Similar to S12
Advanced hole without sampling in an attempt to establish extent of clay(due to time constraints).
BOTTOM OF BOREHOLE 100' FEET/EL. -85.8 FEET
Boring terminated at 100'. Wash water and roller bit resistance indicatedthat soil was soft clay to 100'.
Boring advanced using drive and wash technique with 4-inch (HW)casing and N drill rods with a 3-7/8-inch roller bit. Boring wasadvancedopen hole from 20' to 40'. Driller drove casing to 40', thenadvanced the boring open hole to 100'.
2424
WOH/24"
FD-07
Camp Ellis Beach
Saco, ME
04376-0
H-165

NORTHING: HOR. DATUM:
VERT. DATUM:
EASTING:DATE
BORING LOCATION:
0
5
10
15
20
25
30
1 of 2
BORING LOG
(tsf)NO. STR
ATA
SOIL / BEDROCK DESCRIPTIONSvIN.
RECIN.
PEN6 IN.PER
BLOWSSAMPLE INFORMATION
andTYPEDEPTH
FT.
PROJECT NAME:
GEI PROJECT NUMBER:
CITY/STATE: PAGE
SURFACE ELEVATION (FT):
DRILLED BY:
LOGGED BY:
TOTAL DEPTH (FT):
HOLECASINGWATER
DEPTH (FT)TIME
GROUNDWATER INFORMATION
DATE START:
REMARKS
DATE END:
GEI Consultants, Inc.1021 Main StreetWinchester, MA 01890
STRATIGRAPHIC LEGEND
- CLAY
- ORGANIC SILT
- SILT
- SAND
BLOWS PER 6 inch - 140lb. hammer falling 30 inchesPEN - Penetration length of sampler or core barrelREC - Recovery length of sampleU - 3 inch Shelby tube sampleQD - Pocket penetrometerSv - Shear strength from torvaneS - 2 inch O.D Split spoon sampleTSF - Tons per square footS' - 3 inch O.D Split spoon sample
- SILTY SAND
- GRAVEL
S1
S2
S3
S4
S5
S1: SILTY SAND (SM); Fine sand, ~15% non-plastic fines, Gray.
Top of CLAY at about 3.5 feet.
S2: LEAN CLAY (CL); Low plasticity, <5% fine sand, Gray.
S3: LEAN CLAY (CL); Low plasticity, <5% fine sand, Gray.
S4: LEAN CLAY (CL); Low plasticity, <5% fine sand, Gray.
S5: LEAN CLAY (CL); Similar to S4.
0.20 0.22
15
12
17
15
18
24
24
24
24
24
19 8 13 14
WOR/ 24"
WOR/ 12" WOH/ 12"
WOR/ 6" WOH/ 18"
WOR/ 6" WOH/ 18"
Offshore
FD-06A
Camp Ellis Beach
04376-0
Saco, Maine
-8.4
New Hampshire Boring
Steve Sarandis
48.0
12/23/04
12/22/04
MLLW
Dave Thompson
NAD 83 (m)4813872.55 388671.67
H-166

REMARKS(tsf)IN.IN.6 IN.NO.
35
40
45
50
55
60
65
SOIL / BEDROCK DESCRIPTION
STR
ATADEPTH
FT.
BORING LOG
2 of 2
PAGE
SAMPLE INFORMATION
SvRECPENPERBLOWS
andTYPE
PROJECT NAME:
CITY/STATE:
GEI PROJECT NUMBER:
STRATIGRAPHIC LEGEND
- CLAY
- ORGANIC SILT
- SILT
- SAND
GEI Consultants, Inc.
Winchester, MA 018901021 Main Street
BLOWS PER 6 inch - 140lb. hammer falling 30 inchesPEN - Penetration length of sampler or core barrelREC - Recovery length of sampleU - 3 inch Shelby tube sampleQD - Pocket penetrometerSv - Shear strength from torvaneS - 2 inch O.D Split spoon sampleTSF - Tons per square footS' - 3 inch O.D Split spoon sample
- SILTY SAND
- GRAVEL
S6
S7
S6: LEAN CLAY (CL); Low to medium plasticity, <5% fine sand, DarkGray. Section of sample have a varved appearance with alternating dark and light layers.
Top of SAND at about 43.0 feet. (drill rig starting to chatter at 43 feet)
S7: POORLY GRADED SAND WITH SILT (SP-SM); Fine sand, ~10%non-plastic fines, Gray.
Bottom of borehole at 48.0 feet.
Drill rig bouncing at 47 feet. Advanced boring from 47 to 48 feet withroller bit. Drilling very hard and slow, possible top of bedrock.
1. Boring advanced from 0 to 48.0 feet using drive and wash techniqueswith 4-inch (HW) casing. Driller used N-rods with 3-7/8-inch roller bit toclean out the casing. Casing driven to a depth of 5 feet. Boringadvanced open hole below 5 feet.
0.19 0.17
22
8
24
24
WOR/ 24"
7 8 8 33
FD-06A
Camp Ellis Beach
Saco, Maine
04376-0
H-167

NORTHING: HOR. DATUM:
VERT. DATUM:
EASTING:DATE
BORING LOCATION:
0
5
10
15
20
25
30
1 of 2
BORING LOG
(tsf)NO. STR
ATA
SOIL / BEDROCK DESCRIPTIONSvIN.
RECIN.
PEN6 IN.PER
BLOWSSAMPLE INFORMATION
andTYPEDEPTH
FT.
PROJECT NAME:
GEI PROJECT NUMBER:
CITY/STATE: PAGE
SURFACE ELEVATION (FT):
DRILLED BY:
LOGGED BY:
TOTAL DEPTH (FT):
HOLECASINGWATER
DEPTH (FT)TIME
GROUNDWATER INFORMATION
DATE START:
REMARKS
DATE END:
GEI Consultants, Inc.1021 Main StreetWinchester, MA 01890
STRATIGRAPHIC LEGEND
- CLAY
- ORGANIC SILT
- SILT
- SAND
BLOWS PER 6 inch - 140lb. hammer falling 30 inchesPEN - Penetration length of sampler or core barrelREC - Recovery length of sampleU - 3 inch Shelby tube sampleQD - Pocket penetrometerSv - Shear strength from torvaneS - 2 inch O.D Split spoon sampleTSF - Tons per square footS' - 3 inch O.D Split spoon sample
- SILTY SAND
- GRAVEL
S1
S2
U1
S3
S4
S1: POORLY GRADED SAND WITH SILT (SP-SM); Fine sand, ~10%non-plastic fines, lt. and dk. banding, Gray.
Top of CLAY at about 3.0 feet.
S2: LEAN CLAY (CL); Low to medium plasticity, <5% fine sand, OliveGray.
U1: LEAN CLAY (CL); Similar to S2.
S3: LEAN CLAY (CL); Low to medium plasticity, occasional layer of finesand ~1/16-inch thick, Gray to Dark Gray.
Top of GRAVEL at about 23.0 feet.
S4: FRACTURE PIECES OF DARK GRAY ROCK.
Sampler bouncing hard at 25"-5". Advance boring from 25'-5" to 26'-6"with roller bit. Drilling very hard and slow. Possible bedrrock.
Bottom of borehole at 26.5 feet.
See Next Page
0.17 0.20
0.20 0.22
0.14 0.12
15
18
17
15
2
24
24
24
24
17
35 13 10 20
WOR/6" 2 1 1
WOR/ 12"PUSH/ 12"
WOR/ 24"
42 53 93/5"
Offshore
FD-05
Camp Ellis Beach
04376-0
Saco, Maine
-11.5
New Hampshire Boring
Steve Sarandis
26.5
12/22/04
12/22/04
MLLW
Dave Thompson
NAD83 (m)4813955.94 388938.67
H-168

REMARKS(tsf)IN.IN.6 IN.NO.
35
40
45
50
55
60
SOIL / BEDROCK DESCRIPTION
STR
ATADEPTH
FT.
BORING LOG
2 of 2
PAGE
SAMPLE INFORMATION
SvRECPENPERBLOWS
andTYPE
PROJECT NAME:
CITY/STATE:
GEI PROJECT NUMBER:
STRATIGRAPHIC LEGEND
- CLAY
- ORGANIC SILT
- SILT
- SAND
GEI Consultants, Inc.
Winchester, MA 018901021 Main Street
BLOWS PER 6 inch - 140lb. hammer falling 30 inchesPEN - Penetration length of sampler or core barrelREC - Recovery length of sampleU - 3 inch Shelby tube sampleQD - Pocket penetrometerSv - Shear strength from torvaneS - 2 inch O.D Split spoon sampleTSF - Tons per square footS' - 3 inch O.D Split spoon sample
- SILTY SAND
- GRAVEL
1. Boring advanced from 0 to 26.5 feet using drive and wash techniqueswith 4-inch (HW) casing. Driller used N-rods with 3-7/8-inch roller bit toclean out the casing. Casing driven to a depth of 5 feet. Boringadvanced open hole below 5 feet.
FD-05
Camp Ellis Beach
Saco, Maine
04376-0
H-169

NORTHING: HOR. DATUM:
VERT. DATUM:
EASTING:DATE
BORING LOCATION:
0
5
10
15
20
25
30
1 of 2
BORING LOG
(tsf)NO. STR
ATA
SOIL / BEDROCK DESCRIPTIONSvIN.
RECIN.
PEN6 IN.PER
BLOWSSAMPLE INFORMATION
andTYPEDEPTH
FT.
PROJECT NAME:
GEI PROJECT NUMBER:
CITY/STATE: PAGE
SURFACE ELEVATION (FT):
DRILLED BY:
LOGGED BY:
TOTAL DEPTH (FT):
HOLECASINGWATER
DEPTH (FT)TIME
GROUNDWATER INFORMATION
DATE START:
REMARKS
DATE END:
GEI Consultants, Inc.1021 Main StreetWinchester, MA 01890
STRATIGRAPHIC LEGEND
- CLAY
- ORGANIC SILT
- SILT
- SAND
BLOWS PER 6 inch - 140lb. hammer falling 30 inchesPEN - Penetration length of sampler or core barrelREC - Recovery length of sampleU - 3 inch Shelby tube sampleQD - Pocket penetrometerSv - Shear strength from torvaneS - 2 inch O.D Split spoon sampleTSF - Tons per square footS' - 3 inch O.D Split spoon sample
- SILTY SAND
- GRAVEL
S1
S2
S'3
S4
S5
S6
S1: WELL-GRADED SAND WITH SILT AND GRAVEL (SW-SM); Fine to coarse sand, ~10 % non-plastic fines, ~15% subangular fine gravel, shell fragments, Brown.
S2: POORLY GRADED SAND WITH SILT (SP-SM); Mostly fine sand,~10% non-plastic fines, samples has stratified appearance with several1/4-inch layers of widely graded sand, Gray. (First attempt no recovery,rock wedged in tip of sampler; second attempt with 3-inch OD sampler,recovery = 5")
Top of SAND and SILT at about 9.0 feet.
S3: SILTY SAND (SM); Fine sand, ~20% slightly plastic fines, shellfragments, marine-organic odor, Dark Gray.
S4: SILTY SAND (SM); Fine sand, ~20-25% slightly plastic fines,occasional layers of sandy silt(ml) 1/4to 3/4 -inch thick, peat fibers, shellfragments, marine-organic odor, Dark Gray.
Top of SANDY SILT/ ORGANIC SILT at about 18.5 feet.
S5: SANDY SILT/ ORGANIC SILT (ML/OL); Low plasticity, ~30% finesand, layers of silty fine sand with ~30% fines, up to 1-inch thick, pocketsof peat, occasional shells, marine-organic odor, Dark Gray.
S6: SANDY SILT/ORGANIC SILT (ML/OL); Similar to S5.
5
0(5)
12
24
24
24
24
24
24
24
24
24
11 3 5 7
33 16 5 6
2 1 1 2
WOH/ 18" 3
2WOH/ 12" 2
WOH/ 12" 4 4
Offshore
FD-04
Camp Ellis Beach
04376-0
Saco, Maine
-6.9
New Hampshire Boring
Steve Sarandis
52.5
12/17/04
12/17/04
MLLW
Greg Leavitt
NAD 83 (m)4813193.07 388817.03
H-170

REMARKS(tsf)IN.IN.6 IN.NO.
35
40
45
50
55
60
65
SOIL / BEDROCK DESCRIPTION
STR
ATADEPTH
FT.
BORING LOG
2 of 2
PAGE
SAMPLE INFORMATION
SvRECPENPERBLOWS
andTYPE
PROJECT NAME:
CITY/STATE:
GEI PROJECT NUMBER:
STRATIGRAPHIC LEGEND
- CLAY
- ORGANIC SILT
- SILT
- SAND
GEI Consultants, Inc.
Winchester, MA 018901021 Main Street
BLOWS PER 6 inch - 140lb. hammer falling 30 inchesPEN - Penetration length of sampler or core barrelREC - Recovery length of sampleU - 3 inch Shelby tube sampleQD - Pocket penetrometerSv - Shear strength from torvaneS - 2 inch O.D Split spoon sampleTSF - Tons per square footS' - 3 inch O.D Split spoon sample
- SILTY SAND
- GRAVEL
S7
S8
S9
S10
S7: SANDY SILT/ ORGANIC SILT (ML/OL); Low to medium plasticity,~15% fine sand, pockets of peat, occasional shells, marine-organic odor,Dark Gray.
S8: SANDY SILT/ ORGANIC SILT (ML/OL); Low plasticity, ~30% finesand, peat fibers, occasional shells, lower 12" of sample has numerouslayers of silty fine sand up to 1/2-inch thick, marine-organic odor, Gray.
Top of SAND at about 39.0 feet.
S9: POORLY GRADED SAND WITH SILT (SP-SM); Fine sand, ~10%non-plastic fines, Gray.
S10: POORLY GRADED SAND WITH SILT (SP-SM); Similar to S9 withone 2" layer of sandy silt.
Bottom of borehole at 52.5 feet.
1. Boring advanced from 0 to 52.5 feet using drive and wash techniqueswith 4-inch (HW) casing. Driller used N-rods with 3-7/8-inch roller bit toclean out the casing. Casing drivien to a depth of 30 feet. Boringadvanced open hole below 30 feet.
2. Driller did not have enough casing to advance hole below 40 feet.After sampling at 40 feet the driller ran the drill rods and roller bit down to50.5 feet to try and encounter rock. Driller did not encounter hard drillingadvancing boring to 50.5 feet. Driller attempted to sample at 50.5 feet.The hole collapsed and the sampler and rods would only go down toabout 45 feet. The driller was able to push the sampler down to thecorrect depth with the drill rig. Driller obtained sample from 50.5 feet to52.5 feet. Sample recovery was about 10-inches. The remainder of thesampler was completly filled with sand that had collapsed into theborehole. The blowcounts for sample S10 are inflated.
0.25 0.30
0.25 0.25
24
24
12
10
24
24
24
24
WOH/6" 2 - 3 4
1 1 5 7
12 18 21 23
46 73 78 86
FD-04
Camp Ellis Beach
Saco, Maine
04376-0
H-171

NORTHING: HOR. DATUM:
VERT. DATUM:
EASTING:DATE
BORING LOCATION:
0
5
10
15
20
25
30
1 of 1
BORING LOG
(tsf)NO. STR
ATA
SOIL / BEDROCK DESCRIPTIONSvIN.
RECIN.
PEN6 IN.PER
BLOWSSAMPLE INFORMATION
andTYPEDEPTH
FT.
PROJECT NAME:
GEI PROJECT NUMBER:
CITY/STATE: PAGE
SURFACE ELEVATION (FT):
DRILLED BY:
LOGGED BY:
TOTAL DEPTH (FT):
HOLECASINGWATER
DEPTH (FT)TIME
GROUNDWATER INFORMATION
DATE START:
REMARKS
DATE END:
GEI Consultants, Inc.1021 Main StreetWinchester, MA 01890
STRATIGRAPHIC LEGEND
- CLAY
- ORGANIC SILT
- SILT
- SAND
BLOWS PER 6 inch - 140lb. hammer falling 30 inchesPEN - Penetration length of sampler or core barrelREC - Recovery length of sampleU - 3 inch Shelby tube sampleQD - Pocket penetrometerSv - Shear strength from torvaneS - 2 inch O.D Split spoon sampleTSF - Tons per square footS' - 3 inch O.D Split spoon sample
- SILTY SAND
- GRAVEL
S1
S2
S4
S6
S5
S3
S1: Top 6" - POORLY GRADED SAND WITH SILT (SP-SM); Fine tovery fine sand, ~10% non-plastic fines, Gray.
S1: Bot. 6" - POORLY GRADED SAND WITH SILT (SP-SM); Fine tomedium sand, ~ 10% non-plastic fines, ~15% angular rock pieces, Gray.
S2: POORLY GRADED SAND WITH SILT AND GRAVEL (SP-SM); Finesand, ~10% non-plastic fines, ~10-15% subangular to subrounded finegravel, Brown.
S3: WELL-GRADED SAND WITH SILT AND GRAVEL (SW-SM); Fine to coarse sand, ~10% non-plastic fines, ~15% subangular to subroundedgravel, Brown.
S4: WELL-GRADED SAND WITH SILT AND GRAVEL (SW-SM); Similar to S3.
S5: SILTY SAND (SM); Fine to coarse sand, ~15% non-plastic fines,~25% subangular to subrounded fine to coarse gravel, pieces of fractured cobble wedged in tip of spoon.
S6: Recovered 6" of gravel wash. Driller advanced casing to 24 feetbefore we opened sampler.
Casing refusal at 24.0 feet, Roller bit very hard from 24.0 to 25.0 feet.Black rock chips in the wash. Possible bedrock.
Bottom of boring at 25.0 feet
1. Boring advanced using drive and wash technique with 4-inch (HW)casing and and N drill rods with a 3-7/8-inch roller bit.
2. The Driller drove the HW casing to 24 feet with the 300lb hammer.
12
9
7
24
8
7
24
16
24
24
24
24
22 10 15 20 14 19100/4"
13 25 21 19
32 27 18 18
17 66 30 32
12 27 17 19
Offshore
FD-03
Camp Ellis Beach
04376-0
Saco, Maine
-10.1
New Hampshire Boring
Steve Sarandis
25.0
12/16/04
12/16/04
MLLW
Greg Leavitt
NAD 83 (m)4813703.57 388863.95
H-172

NORTHING: HOR. DATUM:
VERT. DATUM:
EASTING:DATE
BORING LOCATION:
0
5
10
15
20
25
1 of 2
BORING LOG
(tsf)NO. STR
ATA
SOIL / BEDROCK DESCRIPTIONSvIN.
RECIN.
PEN6 IN.PER
BLOWSSAMPLE INFORMATION
andTYPEDEPTH
FT.
PROJECT NAME:
GEI PROJECT NUMBER:
CITY/STATE: PAGE
SURFACE ELEVATION (FT):
DRILLED BY:
LOGGED BY:
TOTAL DEPTH (FT):
HOLECASINGWATER
DEPTH (FT)TIME
GROUNDWATER INFORMATION
DATE START:
REMARKS
DATE END:
GEI Consultants, Inc.1021 Main StreetWinchester, MA 01890
STRATIGRAPHIC LEGEND
- CLAY
- ORGANIC SILT
- SILT
- SAND
BLOWS PER 6 inch - 140lb. hammer falling 30 inchesPEN - Penetration length of sampler or core barrelREC - Recovery length of sampleU - 3 inch Shelby tube sampleQD - Pocket penetrometerSv - Shear strength from torvaneS - 2 inch O.D Split spoon sampleTSF - Tons per square footS' - 3 inch O.D Split spoon sample
- SILTY SAND
- GRAVEL
S1
S2
U1
S3
S1: POORLY GRADED SAND WITH SILT (SP-SM); Fine sand, ~10%non-plastic fines, occasional piece of fine gravel. Gray.
Top of Clay at 2.0 feet
S2: LEAN CLAY (CL); Low plasticity, <5% fine sand, Gray.
U1: LEAN CLAY (CL); Low plasticity, Gray to Dark Gray.
S3: LEAN CLAY (CL); Low plasticity, Gray.
0.15
0.13
0.13 0.15
14
12
24
24
24
24
24
24
23 13 15 12
WOR/ 24"
WOR/ 24"
WOR/ 24"
Offshore
FD-02
Camp Ellis Beach
04376-0
Saco, Maine
-9.5
New Hampshire Boring
Steve Sarandis
30.75
12/15/04
12/15/04
MLLW
Greg Leavitt
NAD 83 (m)4813843.53 388820.69
H-173

REMARKS(tsf)IN.IN.6 IN.NO.
30
35
40
45
50
55
60
SOIL / BEDROCK DESCRIPTION
STR
ATADEPTH
FT.
BORING LOG
2 of 2
PAGE
SAMPLE INFORMATION
SvRECPENPERBLOWS
andTYPE
PROJECT NAME:
CITY/STATE:
GEI PROJECT NUMBER:
STRATIGRAPHIC LEGEND
- CLAY
- ORGANIC SILT
- SILT
- SAND
GEI Consultants, Inc.
Winchester, MA 018901021 Main Street
BLOWS PER 6 inch - 140lb. hammer falling 30 inchesPEN - Penetration length of sampler or core barrelREC - Recovery length of sampleU - 3 inch Shelby tube sampleQD - Pocket penetrometerSv - Shear strength from torvaneS - 2 inch O.D Split spoon sampleTSF - Tons per square footS' - 3 inch O.D Split spoon sample
- SILTY SAND
- GRAVEL
S4
(rig chattering at 29.0 feet)
Top of Sand at 29.0 feet
S4: SILTY SAND (SM); Fine sand,~15% slightly plastic fines, ~20%subrounded to subangular gravel, fractured gravel pieces in the tip of thespoon. Gray.
Bottom of Boring at 30.75 feet
1. Boring advanced using drive and wash technique with 4-inch (HW)casing and and N drill rods with a 3-7/8-inch roller bit. The Driller wasable to advance the casing to 10 feet by pushing the casing with the drive head of the drill rig. Boring was advanced open hole below 10 feet.
991017/3"50/0"
FD-02
Camp Ellis Beach
Saco, Maine
04376-0
H-174

NORTHING: HOR. DATUM:
VERT. DATUM:
EASTING:DATE
BORING LOCATION:
0
5
10
15
20
25
30
1 of 2
BORING LOG
(tsf)NO. STR
ATA
SOIL / BEDROCK DESCRIPTIONSvIN.
RECIN.
PEN6 IN.PER
BLOWSSAMPLE INFORMATION
andTYPEDEPTH
FT.
PROJECT NAME:
GEI PROJECT NUMBER:
CITY/STATE: PAGE
SURFACE ELEVATION (FT):
DRILLED BY:
LOGGED BY:
TOTAL DEPTH (FT):
HOLECASINGWATER
DEPTH (FT)TIME
GROUNDWATER INFORMATION
DATE START:
REMARKS
DATE END:
GEI Consultants, Inc.1021 Main StreetWinchester, MA 01890
STRATIGRAPHIC LEGEND
- CLAY
- ORGANIC SILT
- SILT
- SAND
BLOWS PER 6 inch - 140lb. hammer falling 30 inchesPEN - Penetration length of sampler or core barrelREC - Recovery length of sampleU - 3 inch Shelby tube sampleQD - Pocket penetrometerSv - Shear strength from torvaneS - 2 inch O.D Split spoon sampleTSF - Tons per square footS' - 3 inch O.D Split spoon sample
- SILTY SAND
- GRAVEL
S1
S2
S3
S4
S5
S6
S1: Top 8" - POORLY GRADED SAND WITH SILT (SP-SM); Fine tovery fine sand, ~10% non-plastic fines, Gray
S1: Bot. 6" - POORLY GRADED SAND WITH SILT (SP-SM); Fine tomedium sand, ~10% non-plastic fines, shell fragements, Gray.
Top of Clay at 4.5 feet
S2: LEAN CLAY (CL); Low to medium plasticity, occasional shellfragment, Lt. Gray.
S3: LEAN CLAY (CL); Low to medium plasticity, ~10% very fine sand,Gray.
S4: LEAN CLAY (CL); Similar to S3, with a layer of fine sand about 1/16-inch thick.
S5: LEAN CLAY (CL); Similar to S3
S6: LEAN CLAY (CL); Similar to S3
.15
.18
.17
.19
14
12
20
24
24
24
24
24
24
24
24
24
10 16 10 10
WOR/ 24"
WOR/ 12"WOH/ 12"
WOR/ 24"
WOR/ 24"
WOR/ 24"
Offshore
FD-01
Camp Ellis Beach
04376-0
Saco, maine
-10.1
New Hampshire Boring
Steve Sarandis
45.0
12/14/04
12/13/04
MLLW
Greg Leavitt
NAD 83 (m)4813973.06 388779.19
H-175

REMARKS(tsf)IN.IN.6 IN.NO.
35
40
45
50
55
60
SOIL / BEDROCK DESCRIPTION
STR
ATADEPTH
FT.
BORING LOG
2 of 2
PAGE
SAMPLE INFORMATION
SvRECPENPERBLOWS
andTYPE
PROJECT NAME:
CITY/STATE:
GEI PROJECT NUMBER:
STRATIGRAPHIC LEGEND
- CLAY
- ORGANIC SILT
- SILT
- SAND
GEI Consultants, Inc.
Winchester, MA 018901021 Main Street
BLOWS PER 6 inch - 140lb. hammer falling 30 inchesPEN - Penetration length of sampler or core barrelREC - Recovery length of sampleU - 3 inch Shelby tube sampleQD - Pocket penetrometerSv - Shear strength from torvaneS - 2 inch O.D Split spoon sampleTSF - Tons per square footS' - 3 inch O.D Split spoon sample
- SILTY SAND
- GRAVEL
S7
S8
S9
S10
S7: LEAN CLAY (CL); Similar to S3
S8: LEAN CLAY (CL); Similar to S3
S9: Top 2" - LEAN CLAY (CL); Similar to S3
Top of Sand at 41.25 feet
S9: Bot. 12" - POORLY GRADED SAND WITH SILT (SP-SM); Finesand, ~10 % non-plastic fines, Gray. (drill rig chattering at 43.5 feet)
Bottom of Boring at 45.0 feet
1. Boring advanced using drive and wash technique with 4-inch (HW)casing and N drill rods with a 3-7/8-inch roller bit. The casing was drivento 6 feet with a 300 lb hammer. The Driller was able to advance thecasing to 16 feet by pushing the casing with the drive head of the drill rig. Boring was advanced open hole below 16 feet.
.20
.20
.19
.20
24
24
14
0
24
24
24
0
WOR/ 24"
WOR 24"
27 19 18 22
25/0"
FD-01
Camp Ellis Beach
Saco, maine
04376-0
H-176

NORTHING: HOR. DATUM:
VERT. DATUM:
EASTING:DATE
BORING LOCATION:
0
5
10
15
20
25
30
1 of 3
BORING LOG
(tsf)NO. STR
ATA
SOIL / BEDROCK DESCRIPTIONSvIN.
RECIN.
PEN6 IN.PER
BLOWSSAMPLE INFORMATION
andTYPEDEPTH
FT.
PROJECT NAME:
GEI PROJECT NUMBER:
CITY/STATE: PAGE
SURFACE ELEVATION (FT):
DRILLED BY:
LOGGED BY:
TOTAL DEPTH (FT):
HOLECASINGWATER
DEPTH (FT)TIME
GROUNDWATER INFORMATION
DATE START:
REMARKS
DATE END:
GEI Consultants, Inc.1021 Main StreetWinchester, MA 01890
STRATIGRAPHIC LEGEND
- CLAY
- ORGANIC SILT
- SILT
- SAND
BLOWS PER 6 inch - 140lb. hammer falling 30 inchesPEN - Penetration length of sampler or core barrelREC - Recovery length of sampleU - 3 inch Shelby tube sampleQD - Pocket penetrometerSv - Shear strength from torvaneS - 2 inch O.D Split spoon sampleTSF - Tons per square footS' - 3 inch O.D Split spoon sample
- SILTY SAND
- GRAVEL
S1
S2
S3
S4
S5
S6
U1
S1: WELL-GRADED SAND WITH GRAVEL (SW); Fine to medium sand, ~10% coarse sand, ~15% subrounded fine gravel, ~5% fines, Gray.
S2: Top 6" - Similar to S1.
S2: Bot. 6" - SILTY SAND WITH GRAVEL (SM); Well-graded sand,~15% subrounded fine gravel, ~15% slightly plastic fines, Gray.
Rig chattering at 8'.
Top of SILT at 10'.
S3: Top 12" - SANDY SILT (ML-OL); Low plasticity, ~30% fine sand,shells, peat fibers, organic odor, Gray.
S3: Bot. 12" - SILTY SAND (SM); Fine sand, ~30% slightly plastic fines,Gray.
S4: SANDY ELASTIC SILT (MH-OH); High plasticity, ~35% fine sand,shells, pieces of wood, organic odor. Gray.
U1: SANDY ELASTIC SILT (MH-OH); High Plasticity, ~40% fine sand,Gray.
S5: SANDY ELASTIC SILT (MH-OH); High plasticity, ~35% fine sand,numerous zones of peat, Gray.
S6: SANDY ELASTIC SILT (MH-OH); High plasticity, ~20% fine sand,peat fibers, shells, occasional layer of fine sand.
0.150.20
0.350.40
12
16
24
24
24
24
24
24
24
24
24
24
5456
291914
11/12"
2
WOR11/12"
1253
WOH/12"
22
Offshore
FD-20
Camp Ellis Beach
04376-0
Saco, maine
-7.3
New Hampshire Boring
Steve Sarandis
77.0
11/11/05
11/11/05
MLLW
Greg Leavitt
NAD 83 (m)4813211.08 388719.56
H-177

REMARKS(tsf)IN.IN.6 IN.NO.
35
40
45
50
55
60
65
SOIL / BEDROCK DESCRIPTION
STR
ATADEPTH
FT.
BORING LOG
2 of 3
PAGE
SAMPLE INFORMATION
SvRECPENPERBLOWS
andTYPE
PROJECT NAME:
CITY/STATE:
GEI PROJECT NUMBER:
STRATIGRAPHIC LEGEND
- CLAY
- ORGANIC SILT
- SILT
- SAND
GEI Consultants, Inc.
Winchester, MA 018901021 Main Street
BLOWS PER 6 inch - 140lb. hammer falling 30 inchesPEN - Penetration length of sampler or core barrelREC - Recovery length of sampleU - 3 inch Shelby tube sampleQD - Pocket penetrometerSv - Shear strength from torvaneS - 2 inch O.D Split spoon sampleTSF - Tons per square footS' - 3 inch O.D Split spoon sample
- SILTY SAND
- GRAVEL
S7
S8
S9
S10
S11
S12
S13
S14
S7: SANDY ELASTIC SILT (MH-OH); Similar to S6.
S8: SANDY ELASTIC SILT (MH-OH); Similar to S6; with ~25% finesand, and frequent layers of fine sand up to 1" thick.
S9: SANDY ELASTIC SILT (MH-OH); Similar to S6; Bottom 12" ofsample appears drier and more stiff.
Drilled through something hard from 42.5-43.0'
Top of CLAY at about 43'.
S10: LEAN CLAY (CL); Low plasticity, ~5% fine sand, Gray.
Hard drilling at 48'
S11: LEAN CLAY (CL); Low plasticity, ~5% fine sand, Gray.
S12: LEAN CLAY (CL); Similar to S11.
S13: LEAN CLAY (CL); Low plasticity, ~5% fine sand, Gray.
S14: LEAN CLAY (CL); Similar to S13.
0.400.40
0.45
0.200.20
0.250.30
0.200.15
0.200.15
24
24
24
24
24
10
24
16
24
24
24
24
24
24
24
24
WOH122
2212
WOH/12"
48
WOR/24"
WOR/12"
12
WOR/12"
WOR/12"
12
WOR/12"
WOH/12"
FD-20
Camp Ellis Beach
Saco, maine
04376-0
H-178

REMARKS(tsf)IN.IN.6 IN.NO.
70
75
80
85
90
SOIL / BEDROCK DESCRIPTION
STR
ATADEPTH
FT.
BORING LOG
3 of 3
PAGE
SAMPLE INFORMATION
SvRECPENPERBLOWS
andTYPE
PROJECT NAME:
CITY/STATE:
GEI PROJECT NUMBER:
STRATIGRAPHIC LEGEND
- CLAY
- ORGANIC SILT
- SILT
- SAND
GEI Consultants, Inc.
Winchester, MA 018901021 Main Street
BLOWS PER 6 inch - 140lb. hammer falling 30 inchesPEN - Penetration length of sampler or core barrelREC - Recovery length of sampleU - 3 inch Shelby tube sampleQD - Pocket penetrometerSv - Shear strength from torvaneS - 2 inch O.D Split spoon sampleTSF - Tons per square footS' - 3 inch O.D Split spoon sample
- SILTY SAND
- GRAVEL
S15
S15: WELL-GRADED SAND WITH SILT AND GRAVEL (SW-SM); Fineto medium sand, ~10% coarse sand, ~10% non plastic fines, ~15%subrounded fine gravel. Gray.
Bottom of Boring @ 77'
1. Boring advanced to 15' using drive and wash technique with (HW)casing.
2. Boring advanced open hole below 15'.
824WOR/12"
1316
FD-20
Camp Ellis Beach
Saco, maine
04376-0
H-179

H-180