SA Trade Policy - Tulane Universitydnelson/PEBricsConf/Edwards SA Trade Policy.pdf · barriers were...
35
1 Trade Policy in South Africa Lawrence Edwards School of Economics, University of Cape Town Rashad Cassim Statistics South Africa, Pretoria, South Africa Dirk Van Seventer Trade and Industry Policy Strategies, Pretoria, South Africa Forthcoming (2009) in: “South African Economic Policy under Democracy”, Aron, J., Kahn, B. and Kingdon, G. OUP Oxford. 1. Introduction 1 The democratic election of the new government in 1994 coincided with an important shift in South Africa’s development strategy; from export promotion with import controls to greater openness through tariff liberalisation. Despite some fears to the contrary, the new government agreed to an ambitious programme of tariff liberalisation as part of its offer in the GATT (General Agreement on Tariffs and Trade) Uruguay round (Bell, 1997). The government also concluded free trade agreements (FTAs) with the European Union (EU) and the Southern Africa Development Community (SADC) and more modest trade agreements with MERCOSUR 2 and the European Free Trade Association (EFTA) states. These reforms led to a substantial simplification and rationalisation of the South African tariff structure 3 (Jenkins et al., 1997; Edwards, 2005). The number of tariff lines fell from over 12 000 at the 1 Acknowledgements: The authors are grateful for comments from Janine Aron and Brian Kahn. 2 Mercado Commun del Cono Sur (Southern Common Market). Argentina, Brazil, Paraguay, Uruguay and Venezuela are full members. 3 South Africa is part of the Southern African Customs Union which includes Botswana, Lesotho, Namibia and Swaziland. Industrial and trade policy has essentially been conducted by South Africa throughout the history of the Union. Reference is therefore generally made to South Africa rather than SACU when discussing trade and industrial policy.
-
Upload
dangnguyet -
Category
Documents
-
view
213 -
download
0
Transcript of SA Trade Policy - Tulane Universitydnelson/PEBricsConf/Edwards SA Trade Policy.pdf · barriers were...
1
Trade Policy in South Africa
Lawrence Edwards
School of Economics, University of Cape Town
Rashad Cassim
Statistics South Africa, Pretoria, South Africa
Dirk Van Seventer
Trade and Industry Policy Strategies, Pretoria, South Africa
Forthcoming (2009) in: “South African Economic Policy under Democracy”, Aron, J.,
Kahn, B. and Kingdon, G. OUP Oxford.
1. Introduction1
The democratic election of the new government in 1994 coincided with an important shift in
South Africa’s development strategy; from export promotion with import controls to greater openness
through tariff liberalisation. Despite some fears to the contrary, the new government agreed to an
ambitious programme of tariff liberalisation as part of its offer in the GATT (General Agreement on
Tariffs and Trade) Uruguay round (Bell, 1997). The government also concluded free trade agreements
(FTAs) with the European Union (EU) and the Southern Africa Development Community (SADC) and
more modest trade agreements with MERCOSUR2 and the European Free Trade Association (EFTA)
states.
These reforms led to a substantial simplification and rationalisation of the South African tariff
structure3 (Jenkins et al., 1997; Edwards, 2005). The number of tariff lines fell from over 12 000 at the
1 Acknowledgements: The authors are grateful for comments from Janine Aron and Brian Kahn.
2 Mercado Commun del Cono Sur (Southern Common Market). Argentina, Brazil, Paraguay, Uruguay and
Venezuela are full members.
3 South Africa is part of the Southern African Customs Union which includes Botswana, Lesotho, Namibia
and Swaziland. Industrial and trade policy has essentially been conducted by South Africa throughout the history of
the Union. Reference is therefore generally made to South Africa rather than SACU when discussing trade and
industrial policy.

2
beginning of the 1990s to 6 420 in 2006. Non-ad valorem tariff rates, which were used frequently in the
early 1990s, were replaced with ad valorem rates. Export subsidies, import surcharges and non-tariff
barriers were phased out.
While there is general agreement that these reforms reduced average nominal protection, whether
this translated into reduced effective protection at the sectoral level remains contentious. This paper
evaluates South Africa’s trade policy under democracy, and critically reviews the burgeoning empirical
studies on the effects of trade reform on trade flows, growth, employment, poverty, productivity and
inflation. Drawing on these reflections, the paper contributes to the policy debate on further reform of the
trade regime, again on the policy agenda given the recent launch of the Department of Trade and
Industry’s National Industrial Policy Framework (NIPF). Furthermore, South Africa presents a good case
study of the effects of trade liberalisation in a middle-income economy, and can therefore offer lessons to
other similar liberalising countries.
Several conclusions can be drawn from the paper. South Africa made considerable progress in
reducing “most favoured nation” (MFN) tariff rates which fell from 17.9 percent in 1994 to 9.6 percent in
2000. Effective protection and the anti-export bias also fell during this period, although some industries
still retain effective protection rates in excess of 40 percent. These trends place South Africa in line with
other middle-income economies in terms of the reduction in protection and the final level of protection.
Since 2000, there has been no further progress in reducing MFN tariff rates. Rather, tariff liberalisation
has been pursued, albeit modestly, through preferential trade agreements, primarily with the EU and
SADC.
The empirical evidence reviewed here suggests that trade reform has positively influenced trade
flows; has stimulated aggregate productivity growth; and has significantly reduced the mean wholesale
price inflation rate as well as the exchange rate pass-through into wholesale prices. The effect of trade
reform on employment has not been fully resolved. An important shortcoming in all this research is the
lack of firm-level analysis of the effects of trade liberalisation.
Despite past progress in reducing tariffs, scope remains for further tariff reform. The current tariff
structure remains complex relative to other middle-income economies as measured by the coefficient of
variation, the number of tariff bands and the number of domestic spikes (Edwards and Lawrence, 2007).
Nominal and effective protection rates remain high for many sectors, particularly those producing final
consumer goods. There are also opportunities for liberalisation of trade in services, which remain
relatively protected.

3
The political and economic will for further comprehensive trade reform by government, however,
is not strong. Comprehensive tariff reform is not emphasised in the government’s current growth and
trade initiatives. Rather, tariff determination is to be conducted on a case-by-case basis and guided by a
more active industrial policy that aims to facilitate industrial diversification.
We argue in this paper that such a piecemeal approach may well turn out to be counterproductive.
In addition to being an administratively burdensome process, there is a strong possibility that tariff reform
will be obstructed by industry lobby groups. A more comprehensive reform strategy needs to be
considered, whereby government commits itself to tariff simplification and a unilateral phase-down in
tariff rates.
The paper is made up of three main sections. Section 2 reviews the process of trade reform in
South Africa since the 1970s, with a particular focus on multilateral and preferential trade reform since
1994. Section 3 then evaluates the extent to which trade reform since 1994 has reduced nominal
protection, effective protection and the anti-export bias. This is followed in Section 4 by a review of the
empirical literature analysing the impact of trade liberalisation and openness on the South African
economy. The paper concludes with an assessment of the scope for further trade reform.
2. Trade reform in South Africa from the 1970s
2.1 From import substitution industrialisation to export promotion
Prior to the 1970s, South Africa’s trade and industrial policies were aimed primarily at
encouraging import substitution industrialisation. These policies are comprehensively described by
Jenkins et al. (1997) and Bell (1993). Trade policy began to change in the 1970s in response to a decline
in the contribution of import substitution policies towards growth (Fallon and Pereira de Silva, 1994), a
continued dependence on gold as a source of foreign exchange and diminished export pessimism brought
about by rapid export-led growth in some of the newly industrialised countries of South East Asia
(Jenkins et al., 1997). A chronology of the subsequent reforms is presented in Table 1.
[Table 1 around here]
Reforms began with the relaxation of quantitative restrictions (QRs) and the introduction of an
Export Development Assistance scheme in 1972, which was then reinforced in 1978 (Bell, 1993; 1997).
Although tariff increases compensated for the relaxation of QRs, these were not fully compensatory
4
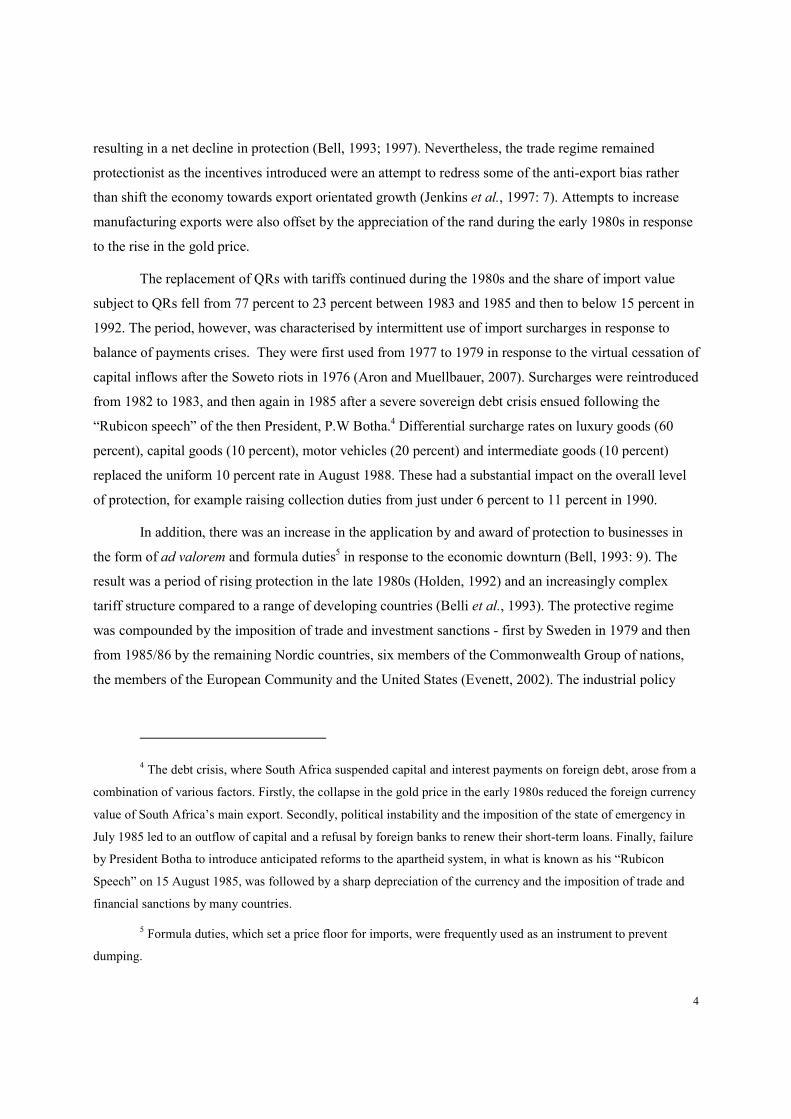
resulting in a net decline in protection (Bell, 1993; 1997). Nevertheless, the trade regime remained
protectionist as the incentives introduced were an attempt to redress some of the anti-export bias rather
than shift the economy towards export orientated growth (Jenkins et al., 1997: 7). Attempts to increase
manufacturing exports were also offset by the appreciation of the rand during the early 1980s in response
to the rise in the gold price.
The replacement of QRs with tariffs continued during the 1980s and the share of import value
subject to QRs fell from 77 percent to 23 percent between 1983 and 1985 and then to below 15 percent in
1992. The period, however, was characterised by intermittent use of import surcharges in response to
balance of payments crises. They were first used from 1977 to 1979 in response to the virtual cessation of
capital inflows after the Soweto riots in 1976 (Aron and Muellbauer, 2007). Surcharges were reintroduced
from 1982 to 1983, and then again in 1985 after a severe sovereign debt crisis ensued following the
“Rubicon speech” of the then President, P.W Botha.4 Differential surcharge rates on luxury goods (60
percent), capital goods (10 percent), motor vehicles (20 percent) and intermediate goods (10 percent)
replaced the uniform 10 percent rate in August 1988. These had a substantial impact on the overall level
of protection, for example raising collection duties from just under 6 percent to 11 percent in 1990.
In addition, there was an increase in the application by and award of protection to businesses in
the form of ad valorem and formula duties5 in response to the economic downturn (Bell, 1993: 9). The
result was a period of rising protection in the late 1980s (Holden, 1992) and an increasingly complex
tariff structure compared to a range of developing countries (Belli et al., 1993). The protective regime
was compounded by the imposition of trade and investment sanctions - first by Sweden in 1979 and then
from 1985/86 by the remaining Nordic countries, six members of the Commonwealth Group of nations,
the members of the European Community and the United States (Evenett, 2002). The industrial policy
4 The debt crisis, where South Africa suspended capital and interest payments on foreign debt, arose from a
combination of various factors. Firstly, the collapse in the gold price in the early 1980s reduced the foreign currency
value of South Africa’s main export. Secondly, political instability and the imposition of the state of emergency in
July 1985 led to an outflow of capital and a refusal by foreign banks to renew their short-term loans. Finally, failure
by President Botha to introduce anticipated reforms to the apartheid system, in what is known as his “Rubicon
Speech” on 15 August 1985, was followed by a sharp depreciation of the currency and the imposition of trade and
financial sanctions by many countries.
5 Formula duties, which set a price floor for imports, were frequently used as an instrument to prevent
dumping.

5
landscape was then increasingly shaped by strategic interventions to reduce the dependence of South
Africa on imports of products such as liquid fuels.6
The early 1990s were characterised by a much stronger export promotion drive. The
implementation of ‘structural adjustment programmes’ involving a system of duty free imports for
exported goods for the motor vehicle, clothing and textile industries in 1989 was shortly followed in 1990
by direct export subsidies for manufactured goods under the General Export Incentive Scheme (GEIS)
(Table 1). Import surcharges were also gradually reduced and finally eliminated by 1995, and further
efforts were made to reduce quantitative restrictions. While these measures reduced protection, an anti-
export bias still existed in a majority of the manufacturing sectors (Belli et al., 1993), and little emphasis
was placed on reducing the level and complexity of nominal tariff protection.
2. 2 Tariff liberalisation under the WTO agreement
The year 1994 signalled an important shift in South Africa’s development strategy, from export
promotion with import controls to greater openness through tariff liberalisation. This shift is most
strongly reflected in South Africa’s commitment in the GATT Uruguay Round to bind 98 percent of all
tariff lines, rationalise the over 12000 tariff lines and replace quantitative restrictions on agricultural
products with tariffs (Table 1). In addition, South Africa offered to reduce the number of tariff categories
to six at rates ranging from 0 to 30 percent with any discretionary changes to the system being disallowed.
Trade reform was accompanied by a number of domestic policies, including the new
macroeconomic policy, “Growth, Employment and Redistribution” (GEAR) that aimed, in part, to
transform South Africa into a ‘competitive, outward orientated economy’ (Republic of South Africa,
1996). Government also finally deregulated the agricultural marketing and control boards, including
import controls on agricultural products, established under the Agricultural Marketing Act of 1968.
These policies initiated a process of tariff reform unprecedented in South Africa’s history. As
shown in Table 2, the number of tariff lines fell from over 12 000 at the beginning of the 1990s to 6 420
by 2006. Progress was also made in improving the transparency of the tariff structure with the
replacement of specific, mixed, compound and formula duties7 with ad valorem duties. The share of ad
valorem rates in all tariff rates rose from 69 percent in 1994 to 97 percent in 2006. Finally, non-tariff
6 These initiatives included the commissioning of a gas-to-liquid plant (Mossgas) to exploit the natural gas
fields on the Southern Cape coast in 1987 and continued investments in synthetic fuel plants to produce liquefied
petroleum gas from coal by the South African Coal, Oil and Gas Corporation (Sasol).
7 Anti-dumping and countervailing duty legislation was adopted to replace the need for these types of
duties.

6
measures were phased out, particularly those relating to agricultural and processed food products. In all
cases, the bulk of South Africa’s tariff reform took place prior to 2000 and only limited reductions and
rationalisations took place subsequently.
[TABLE 2 HERE]
2.3. Preferential Trade Agreements
In addition to multilateral trade reform, the government has pursued a dual track of concluding
new regional and bilateral free trade agreements and re-negotiating the terms of the existing Southern
African Customs Union (SACU). The focus on preferential trade agreements has to a large extent defined
trade policy since 2000. In this section, we explore these agreements in more detail.
The Southern African Customs Union
SACU is one of the oldest customs unions in the world and was established in 1910. Historically,
South Africa unilaterally set the tariffs in accordance with its own industrial policies, but as compensation
the customs revenue was disproportionately allocated to the other SACU
members. The introduction of the 2002 SACU Agreement altered the modus operandi of the
customs area by creating new institutional structures to administer tariff policy. Other changes included a
dispute settlement mechanism; the requirement to have common policies on industrial development,
agriculture, competition, and unfair trade practices; and a new system regarding the common revenue
pool and sharing formula (WTO, 2003: viii). The agreement democratised the decision-making process
allowing the BLNS countries a greater say in the setting of tariffs.
These reforms have resulted in a number of unintended consequences that may inhibit cross-
border trade and tariff reform. Under the new revenue sharing formula the customs pool is allocated
according to each country’s share of total intra-SACU trade, excluding re-exports. SACU economies are
now required to monitor trade flows and have the undesirable incentive to inflate such data so as to
increase their revenue shares. Estimates of BLNS trade with South Africa, for example, are shown to vary
by up to 60 percent (Flatters and Stern, 2006).
The formula has also perpetuated a dependency on customs revenue as a source of government
revenue in many of the BLNS economies. Customs revenue currently accounts for over 50 percent of
total revenue for Lesotho and Swaziland, 41 percent for Namibia, 20 percent for Botswana and less than 4
percent for South Africa (Flatters and Stern, 2006). This dependence on revenue creates perverse

7
incentives for trade policy. BLNS countries may, for example, be less willing to tolerate reductions in
common external tariffs if this leads to large reductions in customs revenue. South Africa has the
incentive to make extensive use of rebates as the benefits are captured by domestic firms, but the costs in
terms of revenue reductions are disproportionately borne by the BLNS countries (Flatters and Stern,
2006). Finally, the formula inhibits new accessions as this may lead to revenue dilution for existing
members.
Reform of the revenue sharing formula may be a necessary step if the SACU members are to
pursue further tariff reform in a pro-active manner within the institutional framework set up by the 2002
SACU Agreement.
Recent preferential trade agreements
Preferential trade agreements have become the central thrust of South Africa’s current trade
policy (Table 1). South Africa concluded comprehensive free trade agreements with the EU and SADC.
These came into effect in 2000. The government has also signed a commitment to extend the SADC FTA
to a customs union by 2010, a common market by 2015 and a monetary union in 2016.
More recently, preferential trade agreements have been concluded with MERCOSUR (signed in
December 2004) and EFTA (mid-2006). Negotiations on a free trade agreement between SACU and the
USA commenced in 2003, but disagreement on the inclusion of ‘new generation items (services,
intellectual property, government procurement and investment) led to a collapse in the negotiations in
2006. In the future, the government aims to enter bilateral trade agreements with India and China.
Various factors govern South Africa’s interest in securing preferential trade agreements with
different regions and countries. These agreements are seen as a mechanism to complement multilateral
agreements through securing market access and reflect a strong mercantilist ethos amongst bureaucrats in
the ministry of trade and industry (Cassim, 2007; DTI, 2007: 42). This is most clearly reflected in the
DTI’s (1997: 42) stated objective of bilateral agreements, namely “to achieve substantial market access
for manufactured and agricultural goods and leverage export-oriented investment”. Interest in the FTA
with the EU was also driven by the desire to send out a positive signal to investors about South Africa’s
commitment to trade reform and to address broader development issues including aid and support for
industry. Hence the name: “Trade, Development and Cooperation Agreement” (TDCA).
A central feature of the free trade agreements with the EU and SADC is the asymmetrical
implementation of tariff reductions. The EU agreed to liberalise at a faster pace (3 years compared to 12
for South Africa), and with a broader coverage (95 percent of all imports as compared with 86 percent for
South Africa). Average South African tariffs are to be phased down from 8.8 percent in 1999 to 4.9

8
percent in 2012, although they are to remain relatively high (above 10 percent) on certain sectors
including clothing, vehicles, footwear and processed food. This nevertheless represents a significant
differential in protection for many sectors compared to current MFN rates (see later).
As far as the SADC FTA is concerned, South Africa is subject to more rapid liberalisation
reforms and a set of ‘general offers’, while other members are permitted to make ‘differential offers’.
From South Africa’s perspective, the phasing-in of this agreement is scheduled to occur over an 8 year
period, while other SADC countries are given a 12 year phase down period upon accession and it is
expected that by 2012, 98 percent of the SADC region’s trade will be subject to zero tariffs (Cassim and
Zarenda, 2004). The SADC FTA has already resulted in the elimination by SACU of almost all tariffs on
SADC imports four years after accession (Table 2), while SADC tariffs imposed on SACU exports have
started to decline from 2007. Despite the reduction in SACU tariffs, SADC imports still appear to be
restricted by stringent rules of origin (Flatters, 2002).
3. Has the level of protection fallen in the South African economy?
The question whether the simplification of the tariff structure shown in Table 2 is associated with
substantial reductions in the level of protection in South Africa has received considerable attention
(Fedderke and Vase, 2001; Rangasamy and Harmse, 2003; van Seventer, 2001; Cassim, 2003; Edwards,
2005). In this section we investigate the extent to which the shift in trade regime reduced nominal
protection, effective protection and the anti-export bias, using sectoral level data.
Nominal protection
Nominal protection is commonly measured using collection rates (the ratio of collection duty to
import value) and simple or weighted average scheduled tariff rates. A cursory review of the aggregate
collection rates for South Africa suggests only moderate tariff reductions, unless the elimination of import
surcharges is included. Total collection rates, inclusive of surcharges, fell sharply from 10.5 percent in
1990 to 4 percent in 2000, but 5 percentage points of this decline can be attributed to the elimination of
surcharges.
The collection rates, however, are an incomplete measure of tariff protection in South Africa.
They underestimate protection where tariffs are prohibitively high and do not adequately reflect the effect
of quota protection, although apart from some agricultural and food products, these had largely been
eliminated by 1994. Collection rates are also biased downwards by various duty drawbacks and rebates on
offer to exporters and some domestic industries. The bias is extensive, especially for motor vehicles

9
because of large rebates under the Motor Industry Development Programme and clothing and textiles
under the Duty Credit Certificate System (Kaplan, 2003)8.
An alternative measure of protection is the average tariff rate derived from the tariff schedules.
Edwards (2005) constructs the detailed tariff schedules for South Africa from 1988 to 2004 using data
published in the South African government gazettes. These data, updated to 2006 using data obtained
from the South African Revenue Services, are used to calculate the import weighted average tariff rates
by sector presented in Table 3.9
Looking at the level of tariffs over time, it is clear that a considerable reduction in nominal
protection was achieved during the 1990s. The import weighted average tariff for manufacturing dropped
from 19.9 percent in 1994 to 9.6 percent in 2000, with the elimination of surcharges accounting for 2
percentage points of this decline. The decline in protection during the 1990s was comprehensive and the
import weighted average tariff fell in all aggregate sectors presented in Table 3. Relatively large declines
in protection, equivalent to a 10 percent or more reduction in price, were experienced in clothing,
footwear, motor vehicle, coke products, other manufacturing and communication equipment between
1994 and 2000. Average protection rates nevertheless remained in excess of 20 percent for many of these
sectors (leather, textiles, motor vehicles, clothing, footwear and tobacco).
For many of these sectors, reductions in tariffs proceeded at a faster pace than was required under
South Africa’s offer to the WTO, reflecting significant unilateral trade liberalisation (Bell, 1997). In
addition, South Africa unilaterally reduced the GATT agreed 12-year adjustment period and maximum
tariff level of 45 percent for textiles and clothing to an 8-year phase-down period and a 40 percent
terminal tariff. Similarly, tariffs on motor vehicles and automotive components fell faster than the phase-
down specially negotiated in GATT.
Since 2000, little further progress has been made in reducing MFN rates and the import weighted
average tariff on manufacturing at around 9.8 percent in 2006 was roughly equivalent to that of 2000.
8 For example, tariff rates on clothing and vehicles were in excess of 100 percent in the early 1990s, yet the
collection rates in 1994 for motor vehicles and clothing were only 10 percent and 33 percent, respectively (Edwards,
2005). The collection rates for these sectors by 1998 were no lower, despite reductions in the scheduled tariff rates.
9 Scheduled tariff rates have their own problems. The average is sensitive to the choice of weights and to
the calculation of tariff equivalents for non-ad valorem rates. Unit values for 1994 and 2000 were found to be highly
erratic and the collection rate is used to calculate the tariff equivalent for these years, while import unit values were
used to calculate tariff equivalents for 2006.

10
MFN reform from 2000 has been limited to some rationalisation and simplification of tariffs lines for
clothing and textile products in 2004 and a decline in average tariffs on motor vehicles from 34.2 percent
in 2000 to 26 percent in 2006. More progress has been made in reducing average tariffs on EU and SADC
imports, which fell to 8 percent and 0.1 percent for manufactured goods in 2006, respectively (Table 3).
At the sectoral level, tariff protection on SADC imports fell to zero for almost all sectors except motor
vehicles where an average tariff of 5.3 percent is still applied. For the EU, average tariffs also fell in most
sectors, the main exception being motor vehicles where tariffs did not fall relative to MFN rates. Since
products from the motor vehicles sector account for a high proportion of imports from the EU, this has
resulted in only a moderate decline in aggregate protection on imports of EU goods.10
These trends place South Africa in line with the experience of other middle-income economies.
The current level of protection in South Africa measured as 7.3 percent is slightly lower than other
middle-income countries (8.3 percent), but is higher than the average for high-income OECD countries
(3.4 percent).11 The extent to which tariffs have fallen is also roughly equivalent to other middle-income
economies. Tariff protection in South Africa fell from 15.7 percent to 7.3 percent (7.3 percent decline)
between 1994 and 2006, which is similar to the decline from 15.3 percent to 8.3 percent (6 percent
decline) for the average lower-middle-income economies over the same period.12
10 The import weighted average protection for all products is actually higher for the EU (7.9 percent) than
MFN countries (7.4 percent) in 2006. This reflects the relatively low proportion of primary products with low tariffs
that are imported from the EU. The large volumes of vehicles imported free of duty from the EU under the Motor
Industry Development Programme will also bias import weighted average protection measures upwards.
11 Average tariff data for middle-income and OECD countries obtained from World Bank
(http://go.worldbank.org/LGOXFTV550). See also Edwards (2005) for a comparative analysis of tariff liberalisation
in South Africa.
12 Change in tariff is calculated as (T2006-T1994)/(1+T1994), where T represents tariff and the subscript refers
to the year.
11
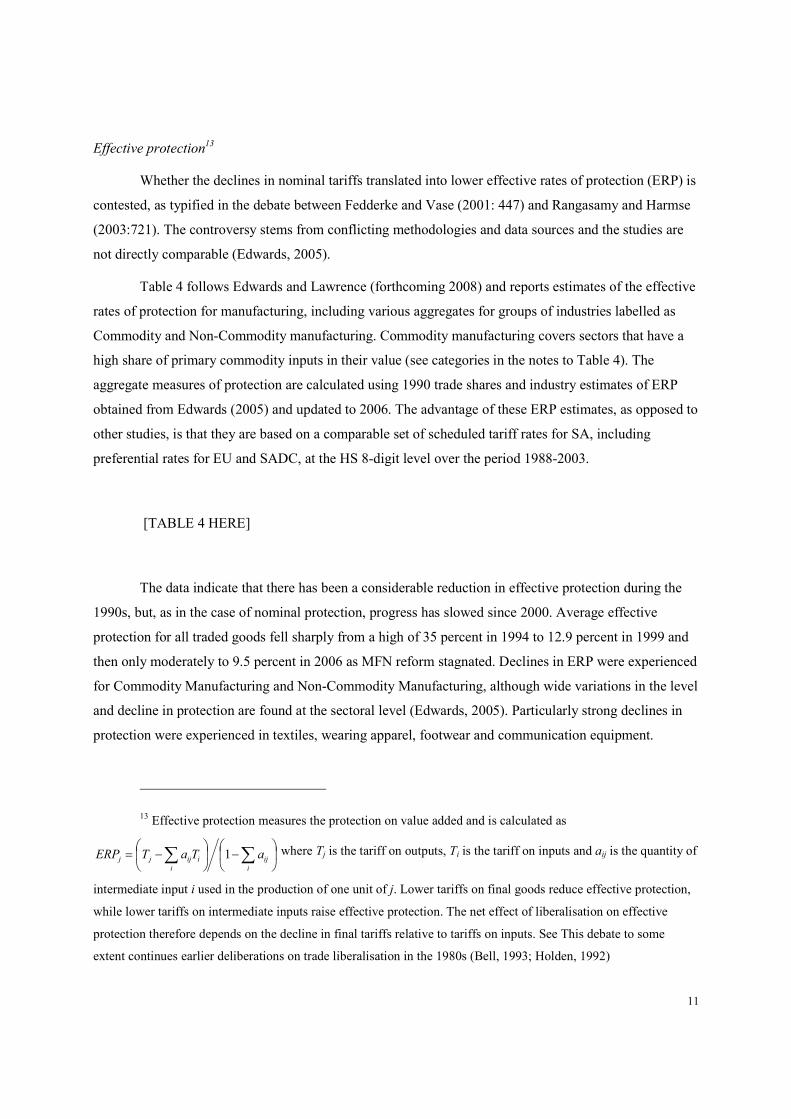
Effective protection13
Whether the declines in nominal tariffs translated into lower effective rates of protection (ERP) is
contested, as typified in the debate between Fedderke and Vase (2001: 447) and Rangasamy and Harmse
(2003:721). The controversy stems from conflicting methodologies and data sources and the studies are
not directly comparable (Edwards, 2005).
Table 4 follows Edwards and Lawrence (forthcoming 2008) and reports estimates of the effective
rates of protection for manufacturing, including various aggregates for groups of industries labelled as
Commodity and Non-Commodity manufacturing. Commodity manufacturing covers sectors that have a
high share of primary commodity inputs in their value (see categories in the notes to Table 4). The
aggregate measures of protection are calculated using 1990 trade shares and industry estimates of ERP
obtained from Edwards (2005) and updated to 2006. The advantage of these ERP estimates, as opposed to
other studies, is that they are based on a comparable set of scheduled tariff rates for SA, including
preferential rates for EU and SADC, at the HS 8-digit level over the period 1988-2003.
[TABLE 4 HERE]
The data indicate that there has been a considerable reduction in effective protection during the
1990s, but, as in the case of nominal protection, progress has slowed since 2000. Average effective
protection for all traded goods fell sharply from a high of 35 percent in 1994 to 12.9 percent in 1999 and
then only moderately to 9.5 percent in 2006 as MFN reform stagnated. Declines in ERP were experienced
for Commodity Manufacturing and Non-Commodity Manufacturing, although wide variations in the level
and decline in protection are found at the sectoral level (Edwards, 2005). Particularly strong declines in
protection were experienced in textiles, wearing apparel, footwear and communication equipment.
13 Effective protection measures the protection on value added and is calculated as
−
−= ∑∑
i
ij
i
iijjj aTaTERP 1 where Tj is the tariff on outputs, Ti is the tariff on inputs and aij is the quantity of
intermediate input i used in the production of one unit of j. Lower tariffs on final goods reduce effective protection,
while lower tariffs on intermediate inputs raise effective protection. The net effect of liberalisation on effective
protection therefore depends on the decline in final tariffs relative to tariffs on inputs. See This debate to some
extent continues earlier deliberations on trade liberalisation in the 1980s (Bell, 1993; Holden, 1992)

12
Despite this, textiles, wearing apparel and footwear still remain amongst the top 5 most protected sectors
with ERP exceeding 40 percent (Edwards, 2005).
Anti-export bias
Tariffs affect export performance in two ways. Firstly, tariffs raise the price of intermediate
inputs and therefore reduce the profitability of export production. Secondly, nominal tariffs raise the
relative return to production for the domestic market causing firms to shift production out of the export
market and into the domestic market. Anti-export bias measures aim to capture these impacts.
Edwards and Lawrence (forthcoming 2008) measure these effects using two indicators. The
extent to which tariffs on inputs are a tax on exports is calculated by dividing the input share weighted
average tariffs by value added in world prices.14 This is shown in Table 4 under the heading xtax. The
second effect, the increased profitability of production for the domestic market, is captured by the
effective rate of protection. The anti-export bias of production, which measures the profitability of
production for the domestic market relative to the export market, is then calculated as (1 + ERP) / (1 –
xtax). Values of the anti-export bias in excess of 1 indicate relatively high returns in the domestic market
compared to the export market.
Tariff liberalisation during the 1990s was effective in reducing the anti-export bias. In 1994
domestic production was roughly 60 percent more profitable than production for the export market (Table
4). By 2000 this had fallen to 20 percent, after which there were no further reductions. More interesting
are the reductions in the anti-export bias within manufacturing. During the early 1990s, the tariff structure
was particularly detrimental to exports of Non-Commodity Manufacturing (Edwards and Lawrence,
forthcoming 2008). This reflects a greater reliance by such firms on manufacturing inputs subject to input
tariffs. In 1994, estimated export taxes on Non-Commodity Manufacturing (48 percent) were more than
twice those on Commodity Manufacturing exports. Table 4 shows that this resulted in an anti export bias
of 2.8, which far exceeded the 1.7 for Commodity Manufacturing.
Over the next twelve years, trade liberalisation substantially reduced the anti-export bias, both by
lowering the tax on inputs and effective protection. What is striking, though, is that the impact of
liberalisation in reducing xtax for Non-Commodity Manufacturing has been significantly larger than the
14
−= ∑∑
i
ij
i
iijj aTaxtax 1 where Ti is the tariff on inputs and aij is the quantity of intermediate
input i used in the production of one unit of j. Improvements in export profitability are calculated as (xtaxt0 –
xtaxt1)/(1-xtaxt0 ) where t1 refers to the final period and t0 refers to the initial period.
13
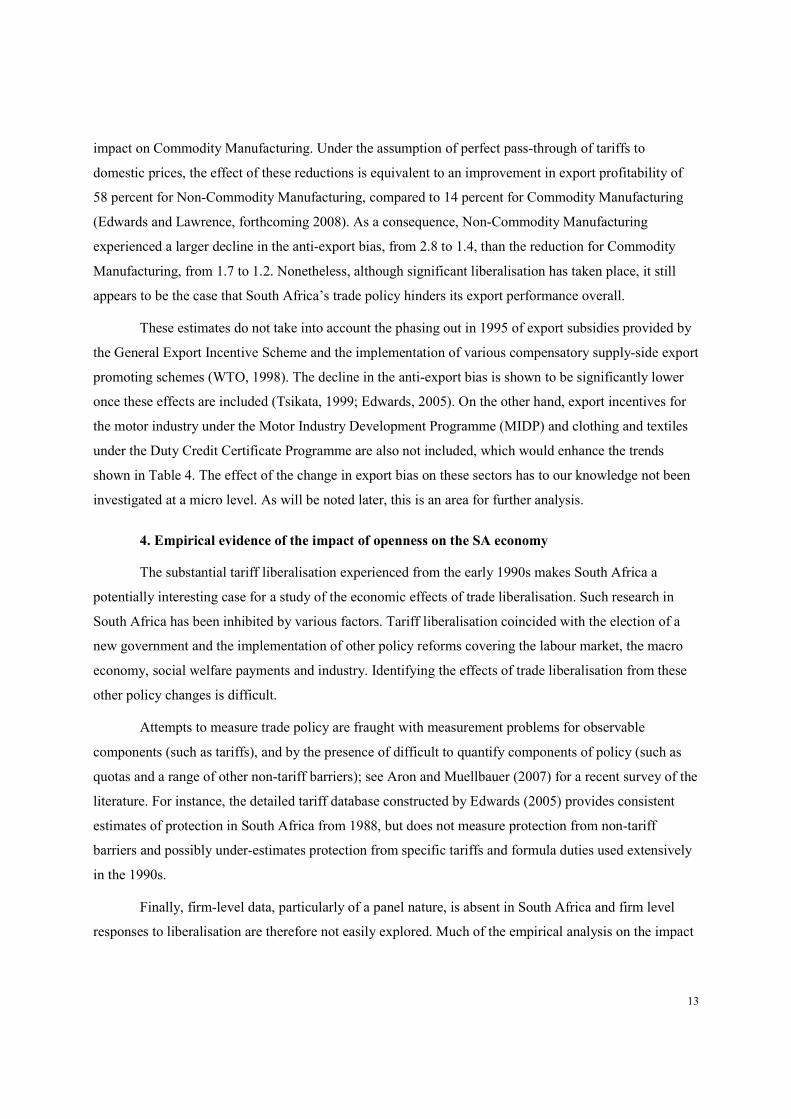
impact on Commodity Manufacturing. Under the assumption of perfect pass-through of tariffs to
domestic prices, the effect of these reductions is equivalent to an improvement in export profitability of
58 percent for Non-Commodity Manufacturing, compared to 14 percent for Commodity Manufacturing
(Edwards and Lawrence, forthcoming 2008). As a consequence, Non-Commodity Manufacturing
experienced a larger decline in the anti-export bias, from 2.8 to 1.4, than the reduction for Commodity
Manufacturing, from 1.7 to 1.2. Nonetheless, although significant liberalisation has taken place, it still
appears to be the case that South Africa’s trade policy hinders its export performance overall.
These estimates do not take into account the phasing out in 1995 of export subsidies provided by
the General Export Incentive Scheme and the implementation of various compensatory supply-side export
promoting schemes (WTO, 1998). The decline in the anti-export bias is shown to be significantly lower
once these effects are included (Tsikata, 1999; Edwards, 2005). On the other hand, export incentives for
the motor industry under the Motor Industry Development Programme (MIDP) and clothing and textiles
under the Duty Credit Certificate Programme are also not included, which would enhance the trends
shown in Table 4. The effect of the change in export bias on these sectors has to our knowledge not been
investigated at a micro level. As will be noted later, this is an area for further analysis.
4. Empirical evidence of the impact of openness on the SA economy
The substantial tariff liberalisation experienced from the early 1990s makes South Africa a
potentially interesting case for a study of the economic effects of trade liberalisation. Such research in
South Africa has been inhibited by various factors. Tariff liberalisation coincided with the election of a
new government and the implementation of other policy reforms covering the labour market, the macro
economy, social welfare payments and industry. Identifying the effects of trade liberalisation from these
other policy changes is difficult.
Attempts to measure trade policy are fraught with measurement problems for observable
components (such as tariffs), and by the presence of difficult to quantify components of policy (such as
quotas and a range of other non-tariff barriers); see Aron and Muellbauer (2007) for a recent survey of the
literature. For instance, the detailed tariff database constructed by Edwards (2005) provides consistent
estimates of protection in South Africa from 1988, but does not measure protection from non-tariff
barriers and possibly under-estimates protection from specific tariffs and formula duties used extensively
in the 1990s.
Finally, firm-level data, particularly of a panel nature, is absent in South Africa and firm level
responses to liberalisation are therefore not easily explored. Much of the empirical analysis on the impact

14
of openness on the South African economy has therefore utilised aggregate or industry level data
combined with various proxies for the liberalisation period.
Nevertheless, some insights into the effects of openness on the South African economy can be
drawn from the available empirical literature. This section reviews this literature, focusing on the effect of
trade liberalisation on trade volumes, employment, productivity growth, inflation and prices.
Trade volumes
Tariff liberalisation is expected to be closely correlated with changes in trade flows. To assess
this graphically, Figure 1 presents indices (2000 = 100) of the real volume of imports, non-gold exports
and the inverse of the collection rate. What is noticeable is that increased growth in the volume of imports
and exports in the early 1990s corresponded with tariff reductions, the elimination of surcharges and the
removal of trade sanctions. Also of interest is that import volumes stagnated during the 1970s and 1980s,
a period of declining investment and output growth, but also of increasing protection in the form of
surcharges. This casual examination (without controlling for other factors) suggests that import volumes
are reasonably responsive to changes in tariff protection.
[FIGURE 1 HERE]
More rigorous conditional relationships have been estimated. Although most empirical estimates
of the determinants of import volumes in South Africa do not include direct measures of tariff protection
(Bahmani-Oskooee and Niroomand, 1998; Senhadji, 1997; Gumede, 2000), the effect of protection is
indirectly captured through the import price which is inclusive of tariffs. Estimated aggregate import price
elasticities range from -0.53 (Bahmani-Oskooee and Niroomand, 1998) to -1.04 (Senhadji, 1997),
suggesting that aggregate import volumes respond positively to lower import prices brought about by
tariff liberalisation.15
15 Senhadji (1997) uses the Hanson Fully-Modified estimator with annual data over 1960 to 1993.
Bahmani-Oskooee and Niroomand (1998) also use annual data over a similar period (1962 to 1992), but use
Johansen’s cointegration technique. The pass-through of tariffs to import prices during the 1990s is estimated at 85
percent by Rangasamy (2003). Together with the import price elasticties, this implies an elasticity of import demand
with respect to tariffs of -0.55 to -0.88.

15
Edwards and Lawrence (forthcoming 2008) update these studies using cointegration analysis with
quarterly data from 1962 through 2004. They include a measure of tariff protection, using collection
duties, in the import demand function and control for the effect of domestic income and import prices
relative to domestic producer prices. They do not, however, control for the effect of trade sanctions
imposed between 1986 and 1992/3. Their estimates indicate a long-run import price elasticity of -0.98
when using the South African Reserve Bank import price index (RB5035L) and an elasticity of -0.32 for
the tariff variable. Using these elasticities, they then calculate that tariff liberalisation accounted for
approximately 50 percent of growth in import volumes during the 1990s, with the remainder largely due
to a recovery in gross domestic expenditure (elasticity of approximately 1.3).
Their results, however, are sensitive to the choice of import price index. A more elastic import
price elasticity (-1.72) is estimated in the working paper of Edwards and Lawrence (2006) when using the
imported producer price index (RB7049N), but in this case the coefficient on collection duties is
insignificant. Nevertheless, the results are consistent in that import volumes are found to respond
positively to lower import prices, in part brought about through tariff liberalisation. The evidence
therefore suggests that liberalisation has played an important role in boosting import volumes from the
early 1990s.
Looking at export volumes in Figure 1, it is evident that non-gold exports stagnated during the
early 1980s, increased in the mid-1980s and then accelerated from 1992. Edwards and Lawrence
(forthcoming 2008) argue that a significant portion of export growth from 1990 can be attributed to
reductions in the anti-export bias from trade liberalisation. Using a panel of 44 manufacturing sectors
over the period 1990-2002, they estimate with a static fixed effects estimator the relationship between
exports as a share of gross output and various indicators of tariff protection. Other control variables (time
dummies which capture time specific effects common to all sectors, the sectoral capital labour ratio, the
sectoral share of skilled labour in employment and a proxy for export profitability, namely the nominal
effective exchange rate divided by producer prices) are also included.
They find that increases in the nominal tariff, effective rate of protection and export tax have a
statistically significant negative impact on export orientation in manufacturing.16 The results, however,
are driven by Non-Commodity manufactures and the estimated function performs poorly when applied to
16 Tsikata (1999) finds consistent results using a standard export function (where growth in export volumes
is regressed on the change in the log values of the real effective exchange rate, capacity utilisation and foreign
income), for aggregate manufacturing over the period 1970-1996. A one percent reduction in collection rates is
estimated to improve aggregate manufacturing exports by 0.86 percent in the long run.

16
Commodity manufactures. Non-Commodity manufactures are found to be particularly responsive to
tariffs on inputs (xtax) with an estimated elasticity of -3.3. The estimated elasticities for nominal tariffs
and effective protection rates are -0.9 and -0.3, respectively. The ‘transparency’ of the tariff structure, as
measured by the share of tariff lines with ad valorem rates, is also an important determinant of export
performance of Non-Commodities (elasticity of 0.75), but comes in with the wrong sign for
Commodities. Liberalisation and simplification of the tariff structure from the 1990s therefore appears to
have stimulated manufacturing exports, but has not affected all sectors equally.
The improved export growth identified by Edwards and Lawrence (forthcoming 2008) could also
have arisen from improved foreign market access as foreign economies removed trade barriers and ended
trade sanctions from 1992, although some of these effects will have been captured by the time dummies
included in their analysis. A comprehensive analysis of the effect of sanctions is provided by Evenett
(2002), who uses a gravity model over the period 1978 to 1999 to estimate the effect of sanctions on
South African exports to Nordic countries (Denmark, Sweden and Norway), some European Community
members (Italy, France and Great Britain), Japan and the USA. He finds that sanctions by the European
Community and the US reduced South African exports by 27 percent and 34 percent, respectively. No
consistent negative effects were found for Japan and Nordic countries in the different estimations. More
interestingly, he finds that the removal of sanctions did not lead to a full recovery of exports, particularly
to the US, implying that the adverse consequences of sanctions are sustained long after their removal.
In conclusion, the empirical evidence suggests that the evolution of South African trade flows has
been strongly influenced by domestic as well as foreign barriers to trade.
Employment
A major consequence of insufficient employment growth in the post-apartheid period has been a
rise in unemployment. The contribution of the increased openness of the South Africa towards the
employment in this period has been explored in detail. The relationship, however, remains inconclusive.
Most studies analysing the sources of change in employment and production in South Africa do not use
direct measures of tariff protection in their analysis. The empirical applications also draw on different
empirical methodologies, some of which lack clear theoretical grounding (see Edwards (2006) for a
review).
Fedderke et al. (2003) is one of the few studies to estimate a theoretically consistent relationship
between openness and factor returns in South Africa. Their approach is based on the Stolper-Samuelson
theorem which states that a rise in the relative price of a sector, raises the real and relative return of the

17
factor used intensively in that sector. For example, a rise in the price of capital-intensive goods relative to
labour-intensive goods reduces wages relative to the return to capital.
The empirical application of this theorem is explained in detail in Leamer (1996) and Feenstra
and Hanson (1999). In essence this approach estimates the zero profit relationship:
it
M
j
jijt
est
it wp εθ +=∑=1
ˆˆ ,
where θijt denotes the cost share of factor j in industry i and
est
itp denotes an estimate of the percentage
change in output price due to trade liberalisation and technological change, amongst other variables. The
estimated variables jw denote factor returns that are consistent with or, in the terminology used in the
literature, are ‘mandated’ by output price changes under the assumption of zero profits across all sectors.
The estimated coefficients are therefore essentially predictions of wages that are consistent with the zero-
profit conditions of the Stolper-Samuelson theorem. They are not estimates of the effect of trade on actual
wages.
Fedderke et al. (2003) use dynamic heterogeneous panel estimation techniques to estimate returns
to labour and capital ‘mandated’ by openness (ratio of exports and imports to output), effective
protection, industry concentration and expenditure on Research and Development. The database consists
of 22 South African manufacturing sectors and covers the period 1970 to 1997. They find that trade
liberalisation and openness induced relative price changes that increased the returns to labour relative to
capital in South African manufacturing industries. In contrast technological progress is estimated to have
negatively affected the return to labour relative to capital.
Unfortunately, their results provide limited insight into the effect of trade liberalisation from 1994
on labour. Their estimate of the effect of openness on factor payments is based on the entire sample
period (1970-97). Trade flows (Figure 1) and measures of openness fluctuated considerably throughout
this period and their results do not necessarily reflect the effect of increased openness from the 1990s. The
estimated positive effect of liberalisation on wages for labour is based on changes in effective rates of
protection between 1988 and 1997, which covers some of the liberalisation period. However, the effective
protection rates are based on collection duties and under-estimate the decline in protection of important
labour-intensive sectors such as clothing, footwear and textiles where duty rebates are extensively used
(Edwards, 2005). The implication is that they under-estimate the negative effect of liberalisation on
labour.

18
Alternative estimates for the equivalent set of manufacturing sectors using scheduled rates over
the period 1994 to 2003 are provided by Edwards (2006). These results show that tariff protection fell
relatively sharply in sectors using semi-skilled and unskilled labour intensively. According to his
regressions, liberalisation ‘mandated’ a real wage decrease of 19 percent for labour, compared to a zero
change in return for capital. Unskilled labour was the most adversely affected with a ‘mandated’ decrease
in real wages of 37 percent.
The analysis of employment in South African manufacturing by Rodrik (2006) also yields results
contrary to those of Fedderke et al. (2003). Rodrik (2006) calculates that the relative price of
manufacturing (value added price index of manufacturing divided by the GDP deflator), adjusted for total
factor productivity growth, fell by 30 percent from the late 1970s to 2004. Using a panel of eight one-digit
sectors over the 1980-2004 period, he estimates that the decline in relative prices of manufacturing is the
predominant cause of the fall in manufacturing employment from 1994-2004. The results are directly
contrary to those of Fedderke et al. (2003) where relative price shifts raised the demand for labour.
Rodrik (2006) also presents additional fixed effect estimates (28 manufacturing sectors, 1970-
2004) and aggregate estimates using OLS (1980-2004) to show that import penetration is an important
source (up to a quarter) of the decline in the relative price of manufacturing. By implication, import
penetration through its effect on the relative price of manufacturing, has had a negative impact on
employment since 1994.
The main shortcoming of Rodrik’s (2006) analysis is that the ‘bulk’ (83.5 percent) of the decline
in the relative price of manufacturing, and therefore the associated decrease in employment, can be
attributed to an unexplained time trend. Further, the direct fixed effect estimates of the determinants of
employment in manufacturing suggest that rising export orientation from the 1990s will have partially
offset the negative effect of import penetration on employment. The results of these price studies
therefore remain inconclusive and are sensitive to the choice of tariff measure, the estimation technique
and the time period covered.
Alternative studies (Edwards, 2001a, 2001b, 2006; Dunne and Edwards, 2007; Jenkins, 2008)
analyse the factor content of trade flows and then infer the impact of trade on employment or wages. Key
limitations of these studies are that the methodology used lacks a clear theoretical grounding (Leamer,
2000) and that they do not estimate the direct link between changes in factor content and trade
liberalisation. The results are nevertheless informative. Drawing from Dunne and Edwards (2007), Figure

19
2 presents a decomposition of the sources of employment growth in manufacturing from 1970 into Final
Demand, Exports, Import Penetration and Technology.17
[FIGURE 2 HERE]
Changes in employment from trade flows broadly follow changes in the trade policy regime.
During the 1970s, import substitution was an important source of growth in manufacturing employment
(1.2 percent per annum) and exceeded the contribution of export expansion (0.1 percent per annum). Its
influence declined over the following two decades as industrial policy shifted away from import
substitution industrialisation, and import penetration increased. In contrast, exports became a more
important source of employment, although this failed to offset the fall in employment from rising import
penetration.
Manufacturing employment fell sharply from 1990 to 2002, but trade flows appear to play a
relatively minor role in this decline. Growth in exports raised employment, but this was completely offset
by rising import penetration. The net direct effect of trade flows on employment was therefore close to
zero. The aggregate results hide important sectoral changes in the composition of trade. Jobs were created
through export growth within the natural resource-based and chemical sectors, but these gains were offset
by increased import penetration within labour-intensive sectors such as clothing, footwear and leather
products (Edwards, 2006; Dunne and Edwards, 2007). The overall conclusion, however, is that trade
flows are not the dominant source of the decline in manufacturing employment from 1990 to 2002.
What appears to be the dominant source of change in demand for labour in all periods,
particularly the 1990s, is technological change. As shown in Figure 2, improvements in productivity
reduced employment by close to 3 percent per annum between 1990 and 2002. A problem is that
technological change could itself be related to liberalisation as firms adopt new technologies or
restructure production in response to increased international competition. Adrian Wood (1994) terms this
17 The method can be described as follows: Gross output (X) is expressed as X = dD + E, where d is the
ratio of domestically produced goods to total demand, D is total demand (inclusive of imports) and E is exports. This
relationship can be decomposed into changes in demand (∆D), export expansion (∆E) and import penetration (∆dD)
as follows: ∆X = d∆D+∆dD+∆E. The limitations of these decomposition approaches are widely documented
(Baldwin, 1995; Leamer, 2000). In particular, the various sources of employment growth are not independent of
each other.

20
‘defensive innovation’. There is some evidence of trade-induced technological change, and we interrogate
this relationship in more depth in the following section. Nevertheless, the net impact of trade on labour in
South Africa from the early 1990s remains uncertain.
Productivity
Openness to trade can stimulate productivity growth through enhanced competitive pressures, access to
new technology embodied in imported inputs, access to a wider range of complementary intermediate
inputs and scale economies as export firms expand. Various studies have evaluated the effect of trade
flows on productivity growth in South Africa (Belli et al. 1993; Jonsson and Subramanian, 2001; Arora
and Bhundia, 2003; Fedderke, 2006). Jonsson and Subramanian (2001), for example, estimate the long-
run relationship between openness (measured as the ratio of the sum of real imports and real exports to
real GDP) and total factor productivity growth, using cointegration analysis over the period 1971-97.
They estimate that a 10 percentage point increase in openness is associated with an increase in total factor
productivity (TFP) by about 5 percent in the long run.
Panel data estimates yield consistent results with the above. Fedderke (2006) employs the Pooled
Mean Group estimator to evaluate the determinants of TFP growth using 22 South African manufacturing
sectors over the period 1970 to 1997. He finds that a 10 percent improvement in the ratio of net exports
(exports minus imports) to GDP raises TFP growth by one percent in the long run. Jenkins (2008) also
uses a panel data set consisting of 28 manufacturing industries from 1980-2001, but, unlike the above
studies, estimates the separate effects of exports and imports on productivity using a labour demand
equation specified in first differences. Import penetration is found to be negatively associated with
productivity growth in most estimates with an elasticity ranging from -0.04 to -0.08. Export orientation is
more sensitive to the inclusion of industry and time fixed effects and is significant and negative in only
half the estimates with an elasticity of approximately -0.02. Using these results, Jenkins (2008) estimates
that increased trade indirectly reduced employment in manufacturing by 81 000 to 117 000 from 1990 to
2001.
A severe limitation of these studies is that openness is itself an outcome variable and is influenced
by numerous variables in addition to trade policy. Particularly problematic is that trade flows are
influenced by productivity growth leading to potentially severe endogeneity biase in the above estimates.
Several studies therefore have included direct measures of trade policy in their analysis. Jonsson
and Subramanian (2001) also use cross-section analysis to investigate how variations in TFP growth
across 24 different SA manufacturing sectors are related to tariff reductions during the period 1990-94
and 1994–98. A one percentage point decline in their tariff variable (1+tariff) is estimated to raise the

21
TFP growth rate by 0.43 to 0.74 percentage points, although the effect diminishes with larger declines in
tariff rates. Harding and Rattsø (2005) estimate a barrier model of productivity growth using a panel of 28
South African manufacturing industries over the period 1970-2003. Unfortunately, data availability meant
that aggregate collection rates and not sectoral level protection measures are used as their main barrier to
technological adoption. Their results suggest that 70 percent of aggregate productivity improvement in the
post sanction period (1993-2003) is explained by liberalisation. Lower tariffs also enhance the spillover of
foreign technology to the domestic market.
The empirical evidence points to a strong positive effect of increased openness and trade
liberalisation on productivity growth in South African manufacturing. However, the mechanism through
which this occurs requires further interrogation. There is very little analysis of the effect of liberalisation
on productivity at the firm level, largely as a result of the lack of firm-level panel data. The improvement
in productivity found in the aggregate analyses possibly reflects changes in the composition of production
as inefficient firms are driven out of the market and not necessarily enhanced productivity within existing
firms. Aggregate productivity improvements may also be driven by increases in the scale of production by
the remaining firms. Without firm level data over time, the firm level sources of aggregate productivity
growth will remain unknown.

22
Prices
A further area of research is the impact of trade and tariff liberalisation on inflation and pricing
power in the South African economy. Aron and Muellbauer (2007) develop an innovative openness
measure that aims to capture measurable trade policy and hard-to-measure non-tariff barriers. Using
quarterly models from 1979 to 2005, they find that increased openness has significantly reduced the mean
wholesale price inflation rate and find some evidence for a reduced exchange rate pass-through into
wholesale prices. Lower price inflation from liberalisation should be most beneficial to low income
consumers who spend a higher proportion of their income on traded products compared to high income
consumers who also consume services (Daniels and Edwards, 2007), although this depends on the extent
to which lower wholesale prices are passed through to final consumers. The reduced exchange rate pass-
through effect also insulates consumers from an exchange rate depreciation, but also means that they
benefit more slowly from lower prices when the exchange rate appreciates. The importance of accounting
for openness in inflation models is underlined by recent work by Aron and Muellbauer (forthcoming
2009) who demonstrate how the South African Reserve Bank’s own producer price inflation equation in
its published core model can be significantly improved by including either their above time-series
openness measure or more conventional measures.
Related studies evaluate the effect of trade and trade liberalisation on mark-up pricing. Fedderke
et al. (2007) and Edwards and van de Winkel (2005) estimate the mark-up pricing relationship using
industry panel data for South African manufacturing over the periods 1970-96 and 1970-2002,
respectively. They both find that import penetration reduces mark-up pricing in South African industries
in the long-run, but this relationship could arise because relatively efficient industries are more profitable
and thus better able to compete against potential imports. Additional fixed effect panel estimates by
Edwards and van de Winkel (2005) using direct tariff measures for 28 manufacturing industries over the
period 1988-2002 show a negative association between effective and nominal tariff protection and mark-
ups.
The results are therefore consistent with the view that liberalisation and increased openness from
the 1990s reduced inflation and mark-up pricing in South Africa. However, a number of caveats remain.
The relatively slow adjustment of output prices to increased openness found by Aron and Muellbauer
(2007) implies that in the short run mark-ups may actually rise before the longer-term effects of increased
competition feed through. The studies referred to here also only explore the relationships at the aggregate
or industry level and pricing behaviour at the firm level remains unexplored.

23
Other research
The partial equilibrium analyses discussed so far have been complemented by general equilibrium
analyses, which allow for a range of macroeconomic, industry and household feedback effects to be
modelled explicitly. Thurlow (2007) uses a recursive dynamic general equilibrium and microsimulation
model to assess the effects of trade liberalisation on growth, employment and poverty in South Africa
from 1993 to 2003. His model consists of 39 sectors/commodities, 3 geographic regions and 240
aggregate households. The effect of trade liberalisation via productivity growth is also modelled using the
aggregate tariff-productivity elasticity estimated by Jonsson and Subramanian (2001). The unique sectoral
productivity responses to liberalisation are therefore not captured.
He finds that trade liberalisation, measured as a decline in the sectoral collection rate, raised
expenditure for all individuals on average and hence reduced poverty. These gains were primarily through
productivity improvements: gains from tariff liberalisation alone were small, but positive. Important
sectoral effects from liberalisation are also shown. Employment in manufacturing declined, but was more
than offset by increases in the private services sector. Moreover, trade reforms contributed to the rising
capital and skill-intensity of production which increased income inequality.
5. Conclusion and assessment of scope for further trade reform
The empirical evidence reviewed suggests that trade liberalisation and increased openness has
had a beneficial effect on trade flows, on productivity and on prices in South African industries. The net
employment effects are mixed, although the results suggest that there has been some restructuring of
employment away from import competing sectors towards export oriented sectors.
What implications for future trade reform can be drawn from this review? Despite reductions in
protection from 1990, scope remains for further tariff reductions and tariff simplification. The SACU
tariff structure is relatively complex compared to other middle-income countries when measured by the
coefficient of variation, the number of tariff bands and the number of domestic spikes (Edwards and
Lawrence, 2007). As of 2006, there were still 38 different ad valorem rates and 62 different specific and
mixed duties applied to MFN countries. This far exceeds the six proposed in 1994. Finally, as shown in
this paper, nominal and effective protection remains high, both on consumer goods and key production
inputs.
South Africa is participating in the Doha round of the WTO and if an agreement is reached, this is
likely to lead to further reductions in MFN tariffs. However, unilateral liberalisation of MFN tariffs can
be pursued to speed up the process of reform. South Africa can also play a more active role in the
liberalising trade in services. Services trade currently accounts for approximately 17 percent of total

24
South African trade. South African service firms are particularly active in Africa in the banking, retail,
telecommunication, construction and restaurant sectors (Stern and Khumalo, 2007). Similarly, foreign
involvement in South Africa has increased, particularly in telecommunications, airlines and banking.
Although South Africa has made commitments of some form or another to about half of all the
services sectors under the General Agreement on Trade in Services (GATS) negotiations (Steuart, 2005),
protection on services trade remains high. Estimates of the ‘tariff’ equivalent of services restrictions by
Hoekman (1995) indicate that South African ‘tariffs’ approach the most restrictive benchmark countries
in the internationally more protected sectors including transport related services, life insurance, basic
telephony and education. South Africa appears more progressive in sectors where tariff equivalents are
low internationally (Stern and Khumalo, 2007). The empirical evidence, although scarce, suggests that
together with other regulatory policies, liberalisation forms a key policy instrument available to
government to enhance competition in South African services sectors (Hodge, 2001). Further research on
the liberalisation of services in South Africa is urgently required.
Comprehensive and unilateral trade reform is not currently on the government’s agenda. Tariff
reform is not prioritised in the government’s current growth initiative, the Accelerated and Shared Growth
Initiative of South Africa (ASGISA), which was launched in 2006 (Republic of South Africa, 2006). The
policy document expresses a desire to diversify out of primary product exports, but the role of trade
policy in achieving this outcome is not clearly outlined.
The National Industrial Policy Framework, which outlines the Department of Trade and
Industry’s (DTI) vision of a future industrial policy, touches on trade policy, but does not consider
comprehensive trade policy reform as central to their vision. A critical review of the tariff structure is to
be undertaken, focussing particularly on tariffs on intermediate inputs. Bilateral and regional trade
agreements are to be the central thrust of South Africa’s trade policy. These are to be used in a strategic
manner that does not necessarily require a free trade agreement and will focus strongly on enhancing
foreign market access.
In all cases “… tariff determinations will be conducted on a case-by-case basis, taking into
account the specific circumstances of the sector involved” (DTI, 2007). A key objective is that trade
reform is to be sequenced with industrial policy to facilitate industrial diversification (Mpalhwa, 2007).
This emphasis on the sequencing of trade policy with industrial policy on a case-by-case and country-by-
country basis, as opposed to comprehensive multilateral or unilateral liberalisation, arises from concerns
by policy makers that further unilateral and across-the-board liberalisation would foster specialisation in
resource-based sectors and weaken South Africa’s bargaining leverage in bilateral and multilateral trade
negotiation (DTI, 2007; Mpahlwa, 2007).
25
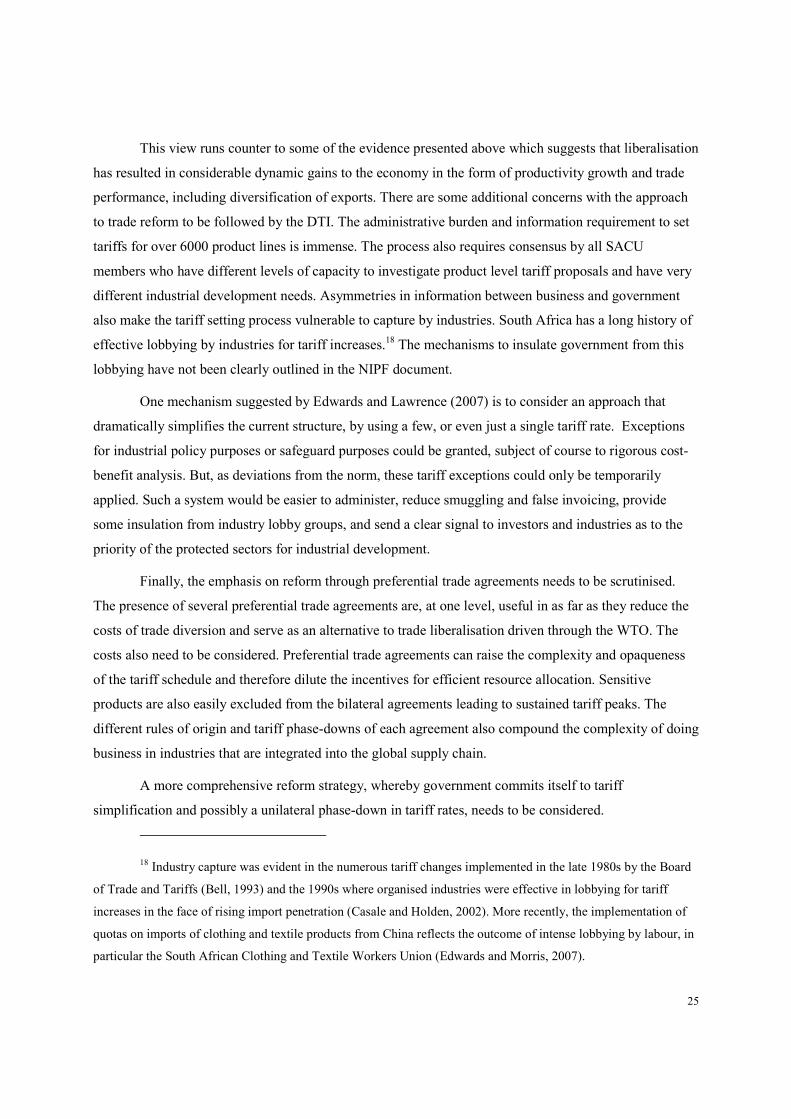
This view runs counter to some of the evidence presented above which suggests that liberalisation
has resulted in considerable dynamic gains to the economy in the form of productivity growth and trade
performance, including diversification of exports. There are some additional concerns with the approach
to trade reform to be followed by the DTI. The administrative burden and information requirement to set
tariffs for over 6000 product lines is immense. The process also requires consensus by all SACU
members who have different levels of capacity to investigate product level tariff proposals and have very
different industrial development needs. Asymmetries in information between business and government
also make the tariff setting process vulnerable to capture by industries. South Africa has a long history of
effective lobbying by industries for tariff increases.18 The mechanisms to insulate government from this
lobbying have not been clearly outlined in the NIPF document.
One mechanism suggested by Edwards and Lawrence (2007) is to consider an approach that
dramatically simplifies the current structure, by using a few, or even just a single tariff rate. Exceptions
for industrial policy purposes or safeguard purposes could be granted, subject of course to rigorous cost-
benefit analysis. But, as deviations from the norm, these tariff exceptions could only be temporarily
applied. Such a system would be easier to administer, reduce smuggling and false invoicing, provide
some insulation from industry lobby groups, and send a clear signal to investors and industries as to the
priority of the protected sectors for industrial development.
Finally, the emphasis on reform through preferential trade agreements needs to be scrutinised.
The presence of several preferential trade agreements are, at one level, useful in as far as they reduce the
costs of trade diversion and serve as an alternative to trade liberalisation driven through the WTO. The
costs also need to be considered. Preferential trade agreements can raise the complexity and opaqueness
of the tariff schedule and therefore dilute the incentives for efficient resource allocation. Sensitive
products are also easily excluded from the bilateral agreements leading to sustained tariff peaks. The
different rules of origin and tariff phase-downs of each agreement also compound the complexity of doing
business in industries that are integrated into the global supply chain.
A more comprehensive reform strategy, whereby government commits itself to tariff
simplification and possibly a unilateral phase-down in tariff rates, needs to be considered.
18 Industry capture was evident in the numerous tariff changes implemented in the late 1980s by the Board
of Trade and Tariffs (Bell, 1993) and the 1990s where organised industries were effective in lobbying for tariff
increases in the face of rising import penetration (Casale and Holden, 2002). More recently, the implementation of
quotas on imports of clothing and textile products from China reflects the outcome of intense lobbying by labour, in
particular the South African Clothing and Textile Workers Union (Edwards and Morris, 2007).

26
References
Arora, V. and Bhundia, A. (2003) “Potential Output and Total Factor Productivity Growth in Post-
Apartheid South Africa”, IMF Working Paper WP/03/178, International Monetary Fund,
Washington, D.C.
Aron, J. and J. Muellbauer. (2009) “Monetary Policy and Inflation Modeling in a More Open Economy in
South Africa.” Chapter in New Monetary Policy Frameworks for Emerging Markets: Coping with
the Challenges of Financial Globalization (G. Hammond, R. Kanbur and E. Prasad, eds.), Bank of
England/Edward Elgar (forthcoming book, 2009).
Aron, J. and Muellbauer, J. (2007) “Inflation dynamics and trade openness”, Centre for Economic Policy
Research, London, Working Paper Series no. 6346. (available from http://www.cepr.org).
Bahmani-Oskooee, M. and Niroomand, F. (1998) “Long-run Price Elasticities and the Marshall-Lerner
condition revisted”, Economic Letters, 61(1): 101-109.
Baldwin, R. E (1995) “The Effect of Trade and Foreign Direct Investment on Employment and Relative
Wages”, National Bureau of Economic Research Working paper no. 5037, Cambridge, MA.
Bell, T. (1993) “Should South Africa Further Liberalise its Foreign Trade?” in M. Lipton and C. Simkins
(eds.), State and Market in Post Apartheid South Africa, Witwatersrand University Press,
Johannesburg.
Bell T. (1997) “Trade Policy”, in Michie J and Padyachee (eds.), The Political Economy of South Africa’s
Transition, Dryden Press, London.
Belli, P., Finger, M. and Ballivian, A. (1993) “South Africa: A review of trade policies”, World Bank
Informal Discussion Papers on Aspects of the South African Economy no. 4, The Southern Africa
department, The World Bank.
Casale, D. and Holden, M. (2002) “Endogenous Protection in a Trade Liberalizing Economy: The Case
of South Africa”, Contemporary Economic Policy, 20(4): 479 – 489.
Cassim, R. (2003) “The Pace, Nature and Impact of Trade Policy in South Africa in the 1990s”, South
African Journal of Economic History, 18(1): 76-95.
Cassim, R. and Zarenda, H. (2004) “South Africa’s Trade Policy Paradigm –Evolution or Involution”, in
Sidiropoulos, E. (ed.), South Africa’s Foreign Policy -1994-2004, South African Institute of
International Affairs, Wits University.
Cassim, R. (2007) “Mainstreaming trade into South Africa’s national development strategy”, African
Trade Policy Research Centre Working Paper 51, United Nations Economic Commission for
Africa.
Daniels, R. and Edwards, L. (2007) “The Benefit-Incidence of Tariff Liberalisation in South Africa”,
Journal for Studies in Economics and Econometrics, 31(2): 69-88.
Dunne, P. and Edwards, L. (2007) “Trade, enterprise production and employment”, Journal for Studies in
Economics and Econometrics, 31(2): 49-68.
Department of Trade and Industry (DTI) (2007) National Industrial Policy Framework, Department of
Trade and Industry, Pretoria.
Edwards, L. (2001a) “Globalisation and the skill bias of occupational employment in South Africa”,
South African Journal of Economics, 69(1): 40-71.
Edwards, L. (2001b) “Trade and the structure of South African production, 1984-97”, Development
Southern Africa, 18(4): 471-491.

27
Edwards, L. (2005) “Has South Africa liberalised its trade?” South African Journal of Economics, 74(4):
754-775.
Edwards, L. (2006) “Trade Liberalisation and Labour Demand in South Africa during the 1990s”, in
Bhorat, H. and Kanbur, R. (eds.) Poverty and Policy in the Post-Apartheid South Africa, Human
Science Research Council Press, Pretoria.
Edwards, L. and van de Winkel, T. (2005) “The Market Disciplining Effects of Trade Liberalisation and
regional Import Penetration on Manufacturing in South Africa”, Trade and Industry Strategies
Working Paper, 1-2005.
Edwards, L. and Lawrence, R.Z. (2006) “South African Trade Policy Matters: Trade Performance and
Trade Policy”, National Bureau of Economic Research Working paper no. 12760, Cambridge, MA.
Edwards, L. and Lawrence, R.Z. (forthcoming 2008) “South African Trade Policy Matters: Trade
Performance and Trade Policy”, Forthcoming in Economics of Transition, 16(4).
Edwards, L. and Lawrence, R.Z. (2007) “SACU Tariff Policies: Where should they go from here?”
Report prepared for the South African National Treasury as part of the National Treasury/Harvard
Growth Project.
Edwards, L. and Morris, M. (2007) “Undressing the numbers: The effect of import quotas on clothing and
textile employment”, Journal of Development Perspectives, 2(2): 121-140.
Evenett, S. (2002) “The impact of economic sanctions in South African exports”, Scottish Journal of
Political Economy, 49(5): 557-573.
Fallon, P. and Pereira de Silva, L. (1994) “Economic Performance and Policies: Overview (vol. 1)”, The
World Bank, Informal Discussion Papers on Aspects of the Economy of South Africa.
Fedderke, J. (2006) “Technology, Human Capital and Growth: evidence from a middle income country
case study applying dynamic heterogeneous panel analysis”, in South African Reserve Bank, Banco
de Mexico and The People's Bank of China (eds.) Economic Growth, Proceedings of a G20 seminar
held in Pretoria, South Africa, on 4-5 August 2005.
Fedderke, J. and Vase, P. (2001) “The nature of South Africa’s trade patterns by economic sector, and the
extent of trade liberalisation during the course of the 1990’s”, South African Journal of Economics,
69(3): 436-473.
Fedderke, J.W., Shin, Y., and Vaze, P. (2003) “Trade and Labor Usage: An Examination of the South
African Manufacturing Industry”, Mimeo. (available from
http://www.commerce.uct.ac.za/Economics/staff/jfedderke/research.asp).
Fedderke, J., Kularatne, C. and Mariotti, M., (2007) “Mark-up Pricing in South African Industry”,
Journal of African Economies, 16(1): 28-69.
Feenstra, R. and Hanson, G. (1999) “The impact of outsourcing and high-technology capital on labor:
Estimates for the United States, 1979-90”, Quarterly Journal of Economics, August, 907-940.
Flatters, F. (2002) “SADC Rules of Origin: Undermining Regional Free Trade”, Paper presented at Trade
and Industry Policy Strategies Forum, 2002.
Flatters, F. and Stern, S. (2006) “SACU Revenue Sharing: Issues and Options”, Queens University,
http://qed.econ.queensu.ca/faculty/flatters/writings/ff&ms_sacursf_2006.pdf.
Harding, T. and Rattsø, J. (2005) “The barrier model of productivity growth: South Africa”, Trade and
Industry Policy Strategies Working Paper 5 – 2005.
Harmse C and Rangasamy, L. (2003) “The Extent of Trade Liberalisation in the 1990s: Revisited”, South
African Journal of Economics, 71(4): 705-728.

28
Hodge, J. (2001) “Examining the Costs of Services Protection in the Developing Economy: the Case of
South Africa”, in Robert Stern (ed.), Services in the International Economy, Ann Arbor, University
of Michigan Press.
Hoekman, B. (1995) Tentative First Steps - An assessment of the Uruguay Round Agreement on
Services. World Bank Policy Research Paper, No. 1455.
Holden, M. (1992) “The structure and incidence of protection in South Africa”, in P. Black and B.
Dollery (eds.), Leading Issues in South African Microeconomics, Johannesburg: Southern book
publishers.
Jenkins, R. (2008) “Trade, Technology and Employment in South Africa”, Journal of Development
Studies, 44(1): 60-79.
Jenkins, C., Bleaney, M., Holden, M. and Siwisa, N. (1997) “A review of South Africa’s trade policy”,
Paper presented at the Trade and Industrial Policy Annual Forum, Muldersdrift, September 1997.
Jonsson, G. and Subramanian, A. (2000) “Dynamic gains from trade: Evidence from South Africa”,
International Monetary Fund Working Paper no. 00/45.
Kaplan D. (2003) “Manufacturing Policy and Performance in South Africa”, Paper presented at the Trade
and Industry Policy Strategies Forum, 2003.
Leamer, E E. (1996) “In search of the Stolper Samuelson effects on U.S. wages,” National Bureau of
Economic Research Working Paper no. 5427, Cambridge, MA.
Leamer, E E. (2000) “What’s the use of factor contents?” Journal of International Economics, 51(1): 17-
49.
Mpalhwa, M. (2007) “Proposal to go it alone on trade misreads the evidence”, Business Day, 7 November
2007.
Rangasamy, J. (2003) “The impact of tariff liberalisation on the competitiveness of the South African
manufacturing sector during the 1990s”, Unpublished PhD thesis, University of Pretoria (available
from upetd.up.ac.za/thesis/available/etd-07072004-124524/unrestricted/00front.pdf).
Republic of South Africa (1996) Growth, Employment and Redistribution: A Macroeconomic Strategy,
South African government printers, Pretoria.
Republic of South Africa (2006) Accelerated and Shared Growth Initiative of South Africa, South African
government printers, Pretoria.
Rodrik, D. (2006) “Understanding South Africa’s Economic Puzzles”, National Bureau of Economic
Research Working Paper, no. 12565, Cambridge, MA.
Senhadji, A. (1997) “Time-Series Estimation of Structural Import Demand Equations: A Cross-Country
Analysis”, International Monetary Fund (IMF) Working Paper, WP/97/132.
Stern, M. and Khumalo, N. (2007) “From theory to practise: Getting the most out of a services agreement
with the USA”, in Draper, P. and N. Khumalo (eds.), One Size Doesn’t Fit All: Deal-breaker Issues
in the Failed US-SACU Free Trade Negotiations. South African Institute of International Affairs,
Johannesburg.
Steuart, I. (2005) “Liberalisation of trade in services in South Africa: The multilateral dimension”,
Human Science Research Centre Research paper.
Thurlow, J. (2007) “Trade Liberalisation and Pro-Poor Growth in South Africa”, Journal for Studies in
Economics and Econometrics, 31(2): 161-179.

29
Tsikata, Y. (1999) “Liberalisation and trade performance in South Africa”, World Bank Informal
Discussion Papers on Aspects of the South African Economy no. 13, The Southern Africa
department, The World Bank.
van Seventer, DEN. (2001) The level and variation of tariff rates: An analysis of tariff rates in South
Africa”, Trade and Industry Policy Monitor, 19.
Wood, A. (1994). North South Trade, Employment and Inequality, Oxford University Press, Oxford.
WTO (1998) Trade Policy Review: Republic of South Africa, World Trade Organisation Secretariat,
Geneva.
WTO (2003) Trade Policy Review: South African Customs Union, World Trade Organisation Secretariat,
Geneva.

30
TABLES
Table 1. Chronology of trade liberalisation from the early 1970s
1972-1976 The “Reynders Commission of Inquiry” in 1972 emphasised the need to diversify into non-gold exports
through export promotion methods
Export Development Assistance scheme introduced.
Substitution of tariffs for Quantitative Restrictions (QRs) resulting in net decline in protection (Bell, 1997).
1979-80 Rise in gold price resulting in the appreciation of rand.
1980 Reinforced system of export incentives.
1983-85 Proportion of value of imports subject to QRs falls from 77 percent to 23 percent over the period.
Relaxation of import permits by switching from a positive list to a negative list.
Real depreciation of rand .
1985-1992 Proportion of tariff items subject to QRs falls from 28 percent in 1985 to less than 15 percent in 1992.
September 1985 Introduction of 10 percent import surcharge on all imported goods not bound by GATT.
August 1988 Differential surcharge rates applied to Luxury goods (60 percent), Capital goods (10 percent), Motor
vehicles (20 percent) and Intermediate goods (10 percent).
Increased applications for ad valorem and formula duties by businesses (Bell, 1993)
1989 “Structural adjustment programmes” involving a system of duty free imports for exports implemented for
motor vehicles and textiles and clothing.
1990 General Export Incentive Scheme (GEIS) introduced. Provides a tax free financial export subsidy to
exporters based on the value of exports, degree of processing and local content of the exported product.
1990-91 Reduction of import surcharges to 40 percent, 5 percent, 15 percent and 5 percent for Luxury, Capital, Motor
vehicles and Intermediate goods, respectively.
23/6/1994 Import surcharges abolished for Capital and Intermediate goods.
1/10/1995 Remaining import surcharges abolished.
1994 SA’s GATT offer during Uruguay Round:
1. About 98 percent of all tariff lines are to be bound at the Harmonised System (HS) eight-digit level as
against 18 percent before the round
2. Reduction in the number of tariff rates to six: 0 percent, 5 percent, 10 percent, 15 percent, 20 percent
and 30 percent
3. Rationalisation of the over 12000 tariff lines
4. Tariffication of QRs on agricultural products
5. Special provisions (extensions of the adjustment period and raised maximum tariff rates) for textile,
clothing and motor vehicle industries granted.
Decision taken to phase out GEIS.
Adoption of anti-dumping and countervailing duties legislation
1995 Payments under GEIS becomes taxable, range of eligible products reduced.
From 1994-97 Deregulation of agricultural marketing and control boards established under the Agricultural Marketing Act
of 1968. Import control on agricultural products removed.
1996 New Tariff Rationalisation Process (TRP) formulated: Tariff lines and peaks to be reduced, Formula and
specific duties to be converted into ad valorem rates, Imports that have no “suitable substitutes” to be duty
free, ad valorem rates of 30 percent on final products, 20 percent on intermediate goods and 10 percent on
primary goods are generally not to be exceeded.
GEIS limited to fully manufacturing goods, although the local content requirement for the maximum subsidy
is reduced from 75 percent to 65 percent.
August 1996 Signing of the SADC Free Trade Protocol (implemented in September 2000)
1 July 1997 Termination of export subsidies provided under GEIS.
1 Jan 2000 Implementation of SA-EU Trade, Development and Cooperation Agreement (TDCA)
2000 Preferential access to US for some products under African Growth and Opportunity Act (AGOA)
21 October 2002 2002 SACU Agreement introduces a new institutional structure; a dispute settlement mechanism; the
requirement to have common policies on industrial development, agriculture, competition, and unfair trade
practices; and a new system regarding the common revenue pool and sharing formula (WTO, 2003: viii)
December 2004 Preferential Trade Agreement signed between SACU and MERCOSUR
2006 Preferential Trade Agreement signed between SACU and the European Free Trade Association (EFTA)
states.
January 2007 Imposition of quotas on imports of clothing and textiles from China
Source: Updated account based on Edwards (2005).

31
Table 2: Structure of MFN tariffs of SACU, 1990-06
1994
2000 MFN
2006
MFN
2006
EU
2006
SADC
1. Number of tariff lines 11231 7868 6420 6420 6420
2. Share ad valorem (percent) 69 75 97 97 99
3. Number of tariff bands 770 214 100 95 9
ad valorem 31 38 38 37 6
Other 739 176 62 58 3
4. Duty-free tariff lines (percent all lines) 26.1 44.4 53 66 99
5. Domestic tariff “spikes” (percent all lines)a 3.7 4.8 8.8 14 0.49
6. International tariff “spikes” (percent all lines)b 43.5 35.2 21.2 8.8 0.2
7. Coefficient of variation c
1.1 1.2 1.4 1.6 16
8. “Nuisance” applied rates (percent all lines)d
1.5 1.2 1.3 0.8 0
9. Simple average 17.9 12.8 8.2 4.8 0.1
10. Weighted average 15.7 8.1 7.4 7.9 0.0
11. Bound tariffs 96.4 96.6
Source: Edwards (2005), updated with the 2006 tariff schedule obtained from SA Revenue Services.
Notes: Calculations are based on tariff schedules including ad valorem equivalents. SACU refers to
Southern African Customs Union.
a. Domestic tariff spikes are defined as those exceeding three times the overall simple average applied rate.
For 2002 and 2006 these are presented separately for each trade agreement.
b. International tariff spikes are defined as those exceeding 15 percent.
c. Coefficient of variation is calculated as the standard deviation divided by the overall simple average.
d. Nuisance rates are those greater than zero, but less than or equal to 2 percent.

32
Table 3: Import weighted average protection by sector
1994 1994 2000 2006
Industry [SIC]
MFN +
surcharges MFN MFN MFN EU SADC Total
Total 17.6 15.7 8.1 7.4 7.9 0.0 7.3
Agriculture, forestry & fishing [1] 6.5 5.5 8.1 3.8 1.7 0.0 2.9
Coal mining [21] 0.0 0.0 0.0 0.0 0.0 0.0 0.0
Gold & uranium [23] 10 10.0 0.0 0.0 0.0 0.0 0.0
Other mining [22/24/25/29] 0.2 0.2 0.0 0.0 0.0 0.0 0.0
Manufacturing [3] 19.9 17.9 9.6 9.8 8.0 0.1 8.9
Food [301-304] 19.0 16.6 11.1 11.3 8.2 0.0 10.5
Beverages [305] 14.2 9.1 12.1 5.4 1.9 0.0 2.7
Tobacco [306] 44.4 40.4 25.7 33.7 16.9 0.0 19.0
Textiles [311-312] 32.6 30.0 23.7 19.8 8.6 0.0 16.8
Wearing apparel [313-315] 76.6 67.6 49.9 38.1 18.4 0.0 35.6
Leather & leather products [316] 18.6 14.5 14.7 21.2 12.4 0.0 19.9
Footwear [317] 56.1 43.0 31.0 29.8 22.4 0.0 29.2
Wood & wood products [321-322] 4.9 4.2 3.2 6.4 1.3 0.0 4.4
Paper & paper products [323] 9.0 8.7 8.2 8.8 1.9 0.0 4.5
Printing & publishing [324-326] 11.7 8.7 1.3 1.6 0.7 0.0 1.0
Coke & refined petroleum [331-333] 30.8 30.8 1.8 0.2 1.0 0.0 0.4
Basic chemicals [334] 6.3 6.3 1.8 2.4 0.8 0.0 1.8
Other chemicals [335-336] 9.0 7.2 2.6 2.7 1.8 0.0 2.2
Rubber products [337] 20.1 18.6 17.5 17.1 9.6 0.0 14.0
Plastic products [338] 22.0 19.5 12.6 14.1 9.5 0.0 12.1
Glass & glass products [341] 16.6 10.7 8.3 8.3 4.6 0.0 6.9
Non-metallic minerals [342] 13.8 11.2 5.3 8.4 3.4 0.0 6.2
Basic iron & steel [351] 7.7 7.1 3.5 3.1 0.0 0.0 1.8
Basic non-ferrous metals [352] 6.3 6.0 0.8 0.6 1.1 0.0 0.5
Metal products [353-355] 16.5 13.4 6.7 8.8 3.9 0.0 6.6
Machinery & equipment [356-359] 4.7 2.7 1.1 1.6 0.4 0.0 1.0
Electrical machinery [361-366] 11.0 8.7 5.9 6.6 3.6 0.0 5.1
Communication equipment [371-373] 16.0 11.5 2.7 3.0 0.2 0.0 1.9
Professional & scientific [374-376] 4.7 1.5 0.5 0.1 0.1 0.0 0.1
Motor vehicles [381-383] 67.0 66.6 34.2 25.9 26.5 5.3 26.2
Other transport equipment [384-387] 2.2 1.0 0.2 0.5 0.1 0.0 0.3
Furniture [391] 27.6 21.7 19.4 19.4 13.1 0.0 16.6
Other manufacturing [392-393] 18.3 11.9 4.9 4.7 1.9 0.0 3.5
Broad Economic Classification
Capital goods 14.8 1.6 2.6 1.3 0.3 2.0
Consumption goods 19.9 12.8 17.2 3.6 0.0 12.7
Intermediate goods 8.4 7.7 5.1 7.6 0.0 5.6
Passenger vehicles 99.9 46.0 30.3 31.9 15.0 31.2
Goods not elsewhere specified 3.4 0.0 0.0 0.0 0.0 0.0
Source: Own calculations using raw data from Edwards (2005).
Notes: For formula duties and mixed duties in 1994 and 2000, the collection rate was used where it
exceeded the ad valorem component. The collection rate was also used as the ad valorem equivalent of specific
duties in 1994 and 2000. In 2000 the upper bound ad valorem rate in the mixed duty was used for clothing and
textiles. If the mean value is used, the average tariff for clothing falls to 42.4 and for textiles to 19.2. In 2006, ad
valorem equivalents were based on import unit values calculated using value and volume data at the HS 8-digit
level.

33
Table 4: Effective protection rates, export taxes and the anti-export bias
1994 1996 1998 2000 2002 2006
Effective Rate of protection (ERP) (%)
All Goods 35.0 22.0 16.5 12.9 10.9 9.5
Manufacturing 41.6 26.2 19.6 15.3 13.0 11.4
Non-Commodity Manufacturing 43.9 28.3 21.9 16.1 13.6 11.8
Commodity Manufacturing 35.3 20.5 13.5 13.2 11.5 10.1
Implicit Export taxes (xtax) (%)
All Goods 14.3 10.3 8.0 8.0 6.9 5.6
Manufacturing 28.1 19.9 15.5 15.5 13.4 10.8
Non-Commodity Manufacturing 48.3 37.0 29.9 26.0 22.4 17.9
Commodity Manufacturing 18.4 11.6 8.5 10.5 9.1 7.3
Anti-Export Bias (AEB)
All Goods 1.6 1.4 1.3 1.2 1.2 1.2
Manufacturing 2.0 1.6 1.4 1.4 1.3 1.2
Non-Commodity Manufacturing 2.8 2.0 1.7 1.6 1.5 1.4
Commodity Manufacturing 1.7 1.4 1.2 1.3 1.2 1.2
Source: Adapted from Edwards and Lawrence (forthcoming 2008) and Edwards (2005) and updated to
2006 using tariff data obtained from the SA Revenue Services.
Notes: Commodity manufacturing includes coke and refined petroleum, food, tobacco, iron and steel, other
manufacturing, non-metallic minerals, wood and wood products, basic chemicals, and basic nonferrous metals.
Primary commodities constitute above 10 percent of the value of output for these industries, as calculated using the
2000 Supply Use table for South Africa. Surcharges are included in 1994 estimates. Xtax values are aggregated
using 1990 export values and ERP values are aggregated using 1990 import values.

34
FIGURES
Figure 1: South African trade flows and tariff protection (2000 = 100)
0
20
40
60
80
100
120
140
160
1970
1972
1974
1976
1978
1980
1982
1984
1986
1988
1990
1992
1994
1996
1998
2000
2002
2004
1/Collection rates (LHS) Non-gold exports (RHS) Imports (RHS)
Source: SARB Quarterly Bulletin.
Note: The measure of tariff protection is based on import duty collection rates and is calculated as the value
of import duties collected (including surcharges) divided by the value of imports (in nominal terms). All
trade flows are measured in real values.

35
Figure 2: Sources of employment growth in manufacturing, 1970-2002
-4%
-3%
-2%
-1%
0%
1%
2%
3%
4%
5%
Final Demand Exports Import
penetration
Net trade Technology Total
Average annual change
1970s 1980s 1990-2002
Source: Dunne and Edwards (2007).