SA Mine - PwC South Africa · 2 SA Mine : Review of trends in the South African mining industry In...
48
SA Mine Review of trends in the South African mining industry www.pwc.co.za November 2011
Transcript of SA Mine - PwC South Africa · 2 SA Mine : Review of trends in the South African mining industry In...

SA MineReview of trends in the South African mining industry
www.pwc.co.za
November 2011

The information contained in this publication is provided for general information purposes only, and does not constitute the provision of legal or professional advice in any way. Before making any decision or taking any action, a professional adviser should be consulted. No responsibility for loss to any person acting or refraining from action as a result of any material in this publication can be accepted by the author, copyright owner or publisher.
Cover and mining pictures courtesy of Royal Bafokeng Platinum Ltd.

PwC
Table of contents
1. Executive summary1
6. Value to the people27
2. Scope of this publication
3
7. Rehabilitation minefield – the tax costs
of not complying31
3. South African mining industry
5
8. Sustainable mining35
4. Financial performance
15
9. Other information37
5. Safety performance25

SA Mine : Review of trends in the South African mining industry

PwC 1
1. Executive summary

2 SA Mine : Review of trends in the South African mining industry
In 2011, the promise of higher prices and their impact on profitability largely came to fruition in the mining industry. Despite the improved results, limited growth in market capitalisation seems to suggest concerns around the sustainability of the global economic recovery and local cost pressures.
Welcome to the third in our series of publications that reviews trends in the South African mining industry.
During the period under review, the increase in USD commodity prices in a relatively stable South African rand environment translated into a 36% increase in revenue, a doubling in adjusted EBITDA and a tripling in net profit. Operating cash flows, however, lagged these improvements as working capital required investment for the future.
Generally, the balance sheet remained strong, with a definite improvement in liquidity, which provides flexibility for future opportunities.
With the improvement in results, the tax authorities are claiming their share of returns through income tax, indirect tax and mining royalties. A recent area of focus has been the rehabilitation trust funds and their tax benefits.
Safety statistics unfortunately did not share the same improvements as financial performance. This was disappointing not only because of the unfortunate injury and loss of life, but also because of the large focus it is getting from all stakeholders.
There appears to be a common view that the mineral wealth of the country should benefit its citizens. While the debate as to how best to achieve this continues, we believe it is important to provide a stable and efficient operating and regulatory environment for mining companies. This will attract greater foreign direct investment into local mining ventures, which will increase the value added to the country and its people.
Towards the end of 2011, increased global economic uncertainty negatively impacted commodity prices and is likely to continue to do so in 2012. For South African mines, this has largely been offset by the weakening in the rand. We expect 2012 to be a volatile year with improved revenues, but with cost pressures that could erode margins.
We trust you will find this document of value, look forward to sharing trends with you in the future and would appreciate any feedback you may have.
Hein Boegman African Mining Leader
Andries Rossouw Project Leader

PwC 3
2. Scope of this publication
4 SA Mine : Review of trends in the South African mining industry
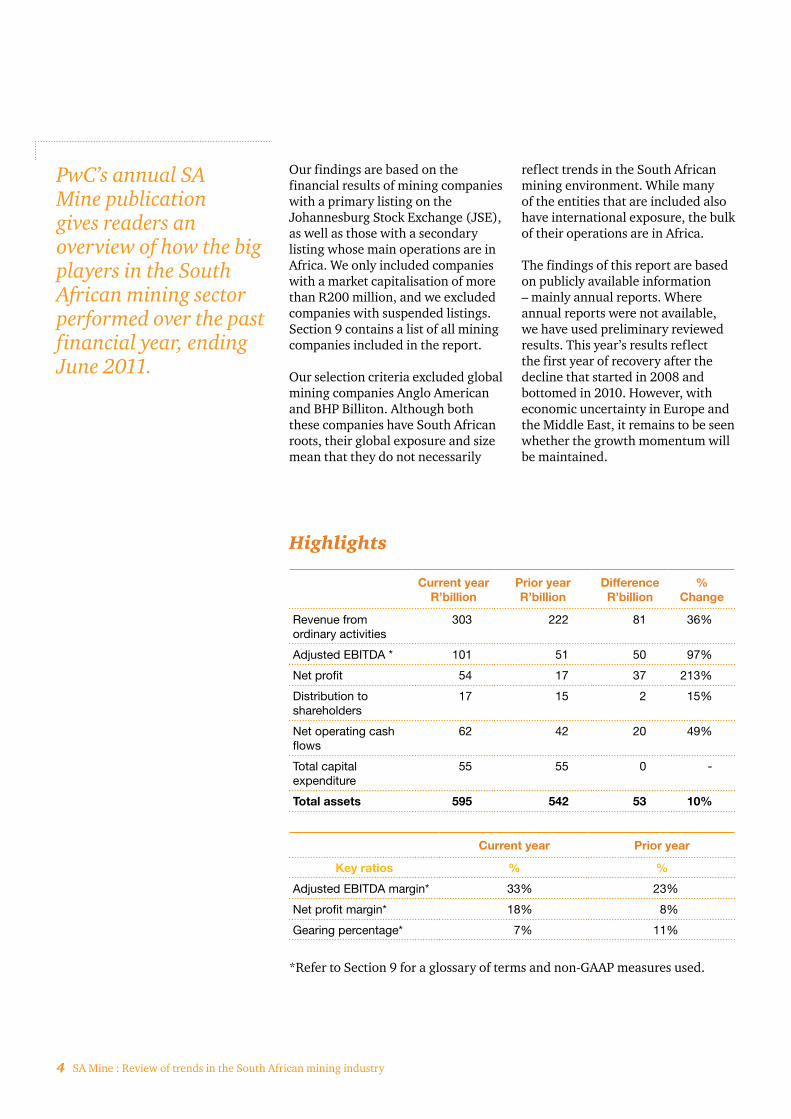
PwC’s annual SA Mine publication gives readers an overview of how the big players in the South African mining sector performed over the past financial year, ending June 2011.
Our findings are based on the financial results of mining companies with a primary listing on the Johannesburg Stock Exchange (JSE), as well as those with a secondary listing whose main operations are in Africa. We only included companies with a market capitalisation of more than R200 million, and we excluded companies with suspended listings. Section 9 contains a list of all mining companies included in the report.
Our selection criteria excluded global mining companies Anglo American and BHP Billiton. Although both these companies have South African roots, their global exposure and size mean that they do not necessarily
reflect trends in the South African mining environment. While many of the entities that are included also have international exposure, the bulk of their operations are in Africa.
The findings of this report are based on publicly available information – mainly annual reports. Where annual reports were not available, we have used preliminary reviewed results. This year’s results reflect the first year of recovery after the decline that started in 2008 and bottomed in 2010. However, with economic uncertainty in Europe and the Middle East, it remains to be seen whether the growth momentum will be maintained.
Highlights
Current year R’billion
Prior year R’billion
Difference R’billion
% Change
Revenue from ordinary activities
303 222 81 36%
Adjusted EBITDA * 101 51 50 97%
Net profit 54 17 37 213%
Distribution to shareholders
17 15 2 15%
Net operating cash flows
62 42 20 49%
Total capital expenditure
55 55 0 -
Total assets 595 542 53 10%
Current year Prior year
Key ratios % %
Adjusted EBITDA margin* 33% 23%
Net profit margin* 18% 8%
Gearing percentage* 7% 11%
*Refer to Section 9 for a glossary of terms and non-GAAP measures used.
PwC 5
3. South African mining industry
6 SA Mine : Review of trends in the South African mining industry
This year’s publication confirms the recovery of financial performance after the recent global recession. However, the subdued increase in market capitalisation, followed by some declines later in 2011, is indicative of uncertainty in the market and negative perceptions about the sustainability of growth.
Market capitalisation
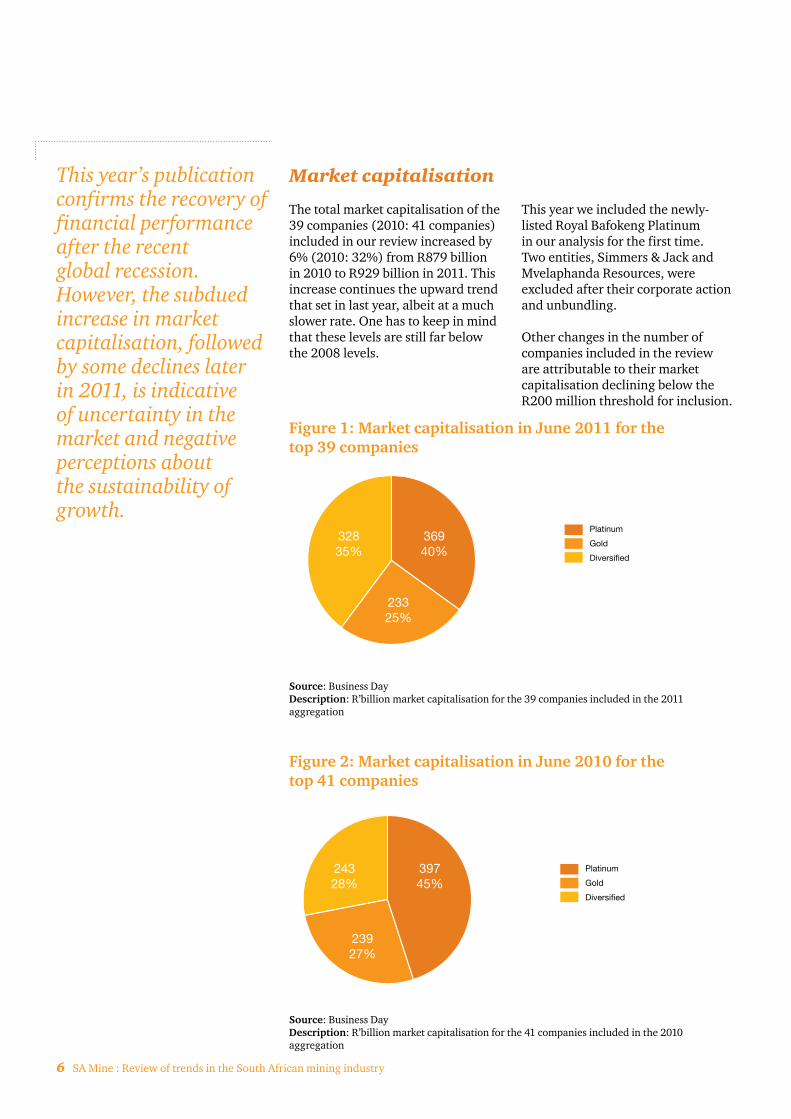
The total market capitalisation of the 39 companies (2010: 41 companies) included in our review increased by 6% (2010: 32%) from R879 billion in 2010 to R929 billion in 2011. This increase continues the upward trend that set in last year, albeit at a much slower rate. One has to keep in mind that these levels are still far below the 2008 levels.
This year we included the newly-listed Royal Bafokeng Platinum in our analysis for the first time. Two entities, Simmers & Jack and Mvelaphanda Resources, were excluded after their corporate action and unbundling.
Other changes in the number of companies included in the review are attributable to their market capitalisation declining below the R200 million threshold for inclusion.
Figure 1: Market capitalisation in June 2011 for the top 39 companies
Source: Business DayDescription: R’billion market capitalisation for the 39 companies included in the 2011 aggregation
Figure 2: Market capitalisation in June 2010 for the top 41 companies
Source: Business DayDescription: R’billion market capitalisation for the 41 companies included in the 2010 aggregation
36940%
23325%
32835%
Platinum
Gold
Diversified
39745%
23927%
24328%
Platinum
Gold
Diversified
PwC 7
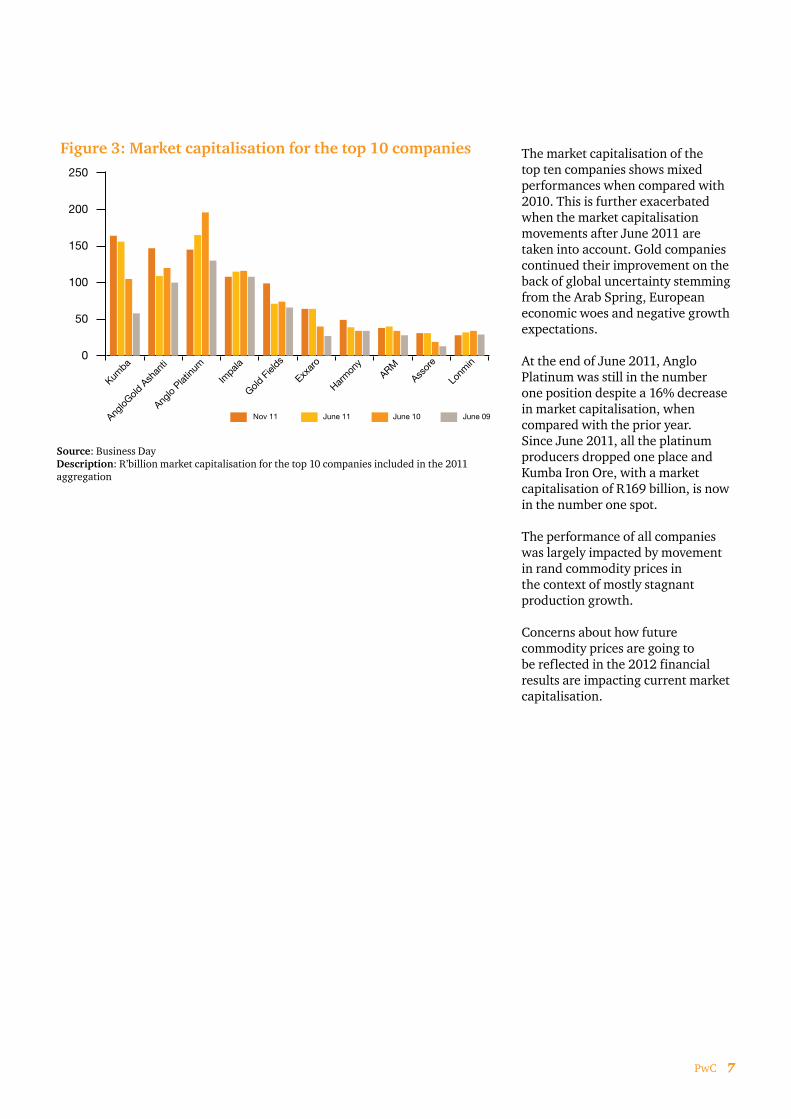
Figure 3: Market capitalisation for the top 10 companies
Source: Business DayDescription: R’billion market capitalisation for the top 10 companies included in the 2011 aggregation
Nov 11 June 11 June 10 June 09
0
50
100
150
200
250
Lonm
in
Assor
e
ARM
Harm
ony
Exxar
o
Gold F
ields
Impala
Anglo
Platinu
m
AngloG
old A
shan
ti
Kumba
The market capitalisation of the top ten companies shows mixed performances when compared with 2010. This is further exacerbated when the market capitalisation movements after June 2011 are taken into account. Gold companies continued their improvement on the back of global uncertainty stemming from the Arab Spring, European economic woes and negative growth expectations.
At the end of June 2011, Anglo Platinum was still in the number one position despite a 16% decrease in market capitalisation, when compared with the prior year. Since June 2011, all the platinum producers dropped one place and Kumba Iron Ore, with a market capitalisation of R169 billion, is now in the number one spot.
The performance of all companies was largely impacted by movement in rand commodity prices in the context of mostly stagnant production growth.
Concerns about how future commodity prices are going to be reflected in the 2012 financial results are impacting current market capitalisation.

8 SA Mine : Review of trends in the South African mining industry
In 2005, coal and platinum group metals (PGMs) overtook gold as the biggest revenue-generating commodities. In 2009 it looked as though coal would be able to dislodge PGMs as the biggest revenue generator. However, PGMs retained the top spot on the back of a stronger price recovery. With the decline in PGM prices since June 2011, coal could again be vying for the top spot in 2012. Progress in addressing infrastructural constraints is likely to determine whether coal can overtake PGMs as top revenue earner.
26%
25%19%
18%
12%PGMs
Coal
Gold
Iron ore
Other metals
For the 12 months to June 2011, the relative breakdown of mining revenues by commodity is depicted in Figure 5.
The increase in revenues was largely rand-price driven, although the higher revenues also indicate a stabilisation in production volumes after decreases in 2009 and 2010.
Contribution by commodity
Source: Statistics SADescription: Figure 4: Percentage mining revenue per commodity
Source: Statistics SADescription: Figure 6: Annual mining revenue to June R’billion
Source: Statistics SADescription: Figure 5: Annual mining revenue to June R’billion
Figure 5: Annual revenue per commodity
2009 2010 2011
010
20
30
40
50
60
70
80
90
Other metalsIron oreGoldCoalPGMs
Figure 4: Percentage mining revenue per commodity 2011
Figure 6: Annual mining revenue per commodity
Other metals Iron ore Gold Coal PGMs
0
50
100
150
200
250
300
350
2002 2003 2004 2005 2006 2007 2008 2009 2010 2011

PwC 9
Price-driven growth
South African mining revenue showed significant growth on the back of improved USD prices. The performance is even more impressive when considering that it happened in a period when the rand was relatively strong against the USD.
Figure 7 shows the real rand revenue per ounce of platinum and gold over the last ten years. Real prices were derived by adjusting rand prices for the impact of inflation, as measured against CPI movements. We replaced the last five years’ CPI with the average unit cost increases of the top five companies. Unit cost increases was significantly higher than CPI.
Gold and platinum maintained fairly consistent real rand price levels for the period of our analysis. However, after June 2011 gold showed a significant real increase on the back of high USD gold prices and a substantial weakening in the rand. As a result, gold overtook platinum. The sustainability of this increase is uncertain given the current global turmoil. Platinum suffered from pessimistic global views and improved production. We believe the significant decline in USD platinum prices might be a short-term overreaction.
The lack of any sustainable real price growth underlines the margin pressure experienced by a number of mines in South Africa. It demonstrates how cost pressures have eroded profitability in the industry. The real price increase for gold bodes well for the 2012 financial year.
Figure 7: Real rand price per oz
Platinum Gold
0
1 000
2 000
3 000
4 000
5 000
6 000
7 000
8 000
9 000
Nov-01
Nov-02
Nov-03
Nov-04
Nov-05
Nov-06
Nov-07
Nov-08
Nov-09
Nov-10
Nov-11
Source: World Gold Council, Johnson Matthey and PwC calculationDescription: Figure 7: Real rand price per oz

10 SA Mine : Review of trends in the South African mining industry
As can be seen in Figure 8, USD commodity prices have been steadily improving since the lows they experienced at the end of 2008. The exaggerated USD commodity price growth has been fuelled to a large extent by a weak USD. The USD price decline in the third quarter of 2011 reflects a recovery in the USD due to the Eurozone crisis and general uncertainty as to whether the global economy will be able to sustain the recovery experienced since 2008.
Figure 8: USD price movements
Coal Gold Platinum Iron ore
020
40
60
80
100
120
140
160
180
200
Nov-1
1
Sep-1
1
Jul-1
1
May
-11
Mar-
11
Jan-
11
Nov-1
0
Sep-1
0
Jul-1
0
May
-10
Mar-
10
Jan-
10
Nov-0
9
Sep-0
9
Jul-0
9
May
-09
Mar-
09
Jan-
09
Nov-0
8
Sep-0
8
Jul-0
8
Source: AME Outlook, AME Iron Ore Outlook, Johnson Matthey, World Gold CouncilDescription: Figure 8: USD commodity prices rebased to July 2008
Figure 9 reflects price movements in rand terms. The decline in USD prices in the third quarter of 2011 was largely offset by weakening in the rand.
There seems little doubt that the volatility in commodity prices is set to continue in 2012 as the world reassesses the impact of the Eurozone debt crises on global economic growth. China and the rest of the developing world’s ability to continue its recent high growth rates will largely impact demand. Forecasters generally expect modest global demand growth, which will be offset by equal global supply growth. Many believe that emotions are likely to drive short-term prices rather than long-term fundamentals.
Figure 9: ZAR Commodity price movements
Coal Gold Platinum Iron ore
020
40
60
80
100
120
140
160
180
200
Nov-1
1
Sep-1
1
Jul-1
1
May
-11
Mar-
11
Jan-
11
Nov-1
0
Sep-1
0
Jul-1
0
May
-10
Mar-
10
Jan-
10
Nov-0
9
Sep-0
9
Jul-0
9
May
-09
Mar-
09
Jan-
09
Nov-0
8
Sep-0
8
Jul-0
8
Source: AME Coal Outlook, AME Iron Ore Outlook, Johnson Matthey, World Gold CouncilDescription: Figure 9: Rand commodity prices rebased to July 2008
PwC 11
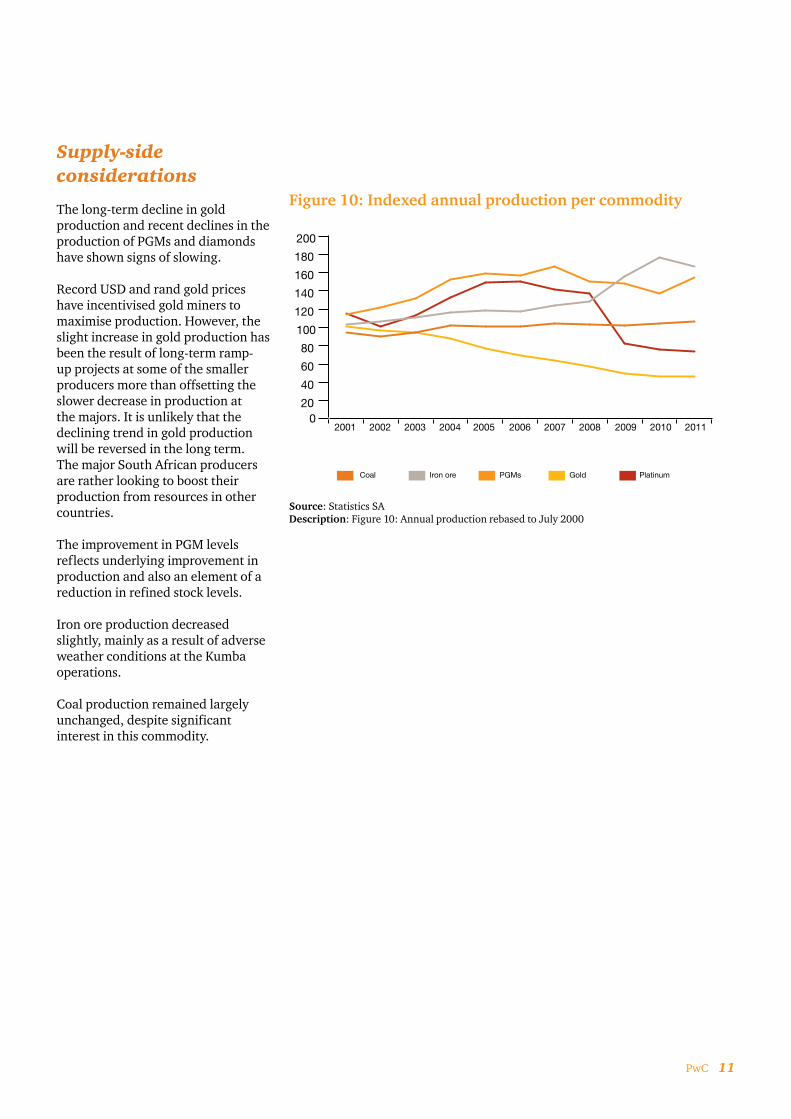
Supply-side considerations
The long-term decline in gold production and recent declines in the production of PGMs and diamonds have shown signs of slowing.
Record USD and rand gold prices have incentivised gold miners to maximise production. However, the slight increase in gold production has been the result of long-term ramp-up projects at some of the smaller producers more than offsetting the slower decrease in production at the majors. It is unlikely that the declining trend in gold production will be reversed in the long term. The major South African producers are rather looking to boost their production from resources in other countries.
The improvement in PGM levels reflects underlying improvement in production and also an element of a reduction in refined stock levels.
Iron ore production decreased slightly, mainly as a result of adverse weather conditions at the Kumba operations.
Coal production remained largely unchanged, despite significant interest in this commodity.
Figure 10: Indexed annual production per commodity
Coal Iron ore PGMs Gold Platinum
020
40
60
80
100
120
140
160
180
200
2001 2002 2003 2004 2005 2006 2007 2008 2009 2010 2011
Source: Statistics SADescription: Figure 10: Annual production rebased to July 2000
12 SA Mine : Review of trends in the South African mining industry
Future supply
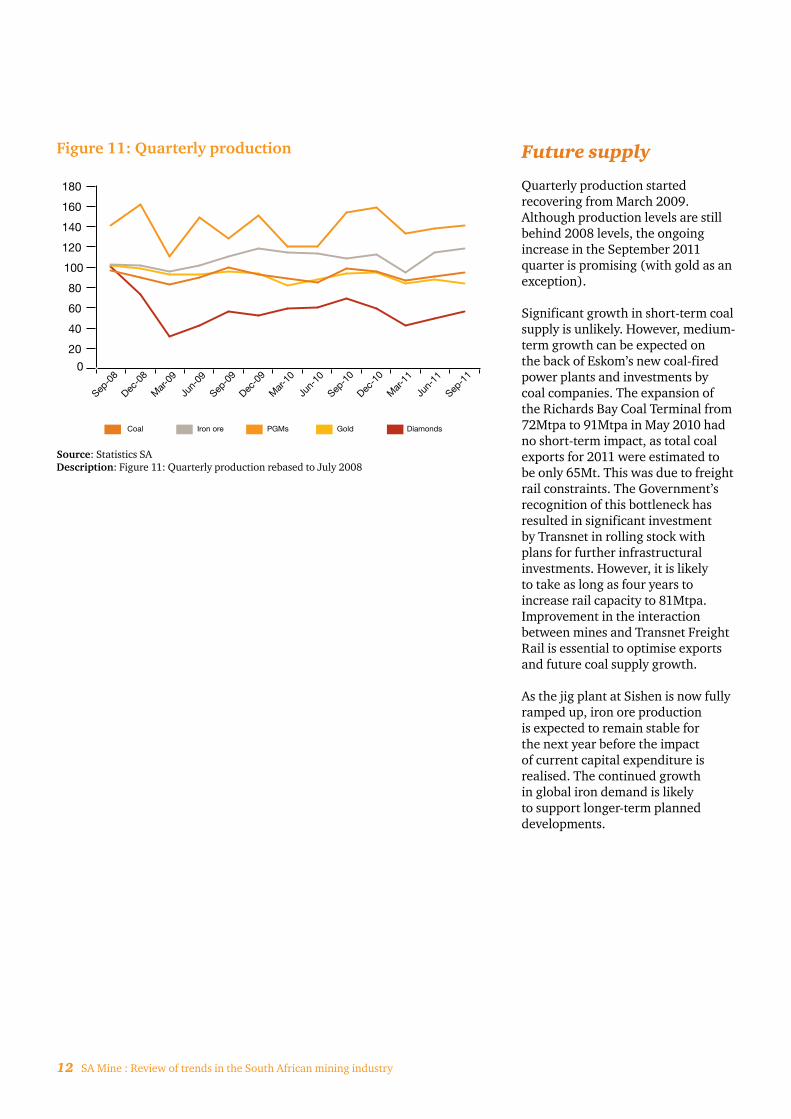
Quarterly production started recovering from March 2009. Although production levels are still behind 2008 levels, the ongoing increase in the September 2011 quarter is promising (with gold as an exception).
Significant growth in short-term coal supply is unlikely. However, medium-term growth can be expected on the back of Eskom’s new coal-fired power plants and investments by coal companies. The expansion of the Richards Bay Coal Terminal from 72Mtpa to 91Mtpa in May 2010 had no short-term impact, as total coal exports for 2011 were estimated to be only 65Mt. This was due to freight rail constraints. The Government’s recognition of this bottleneck has resulted in significant investment by Transnet in rolling stock with plans for further infrastructural investments. However, it is likely to take as long as four years to increase rail capacity to 81Mtpa. Improvement in the interaction between mines and Transnet Freight Rail is essential to optimise exports and future coal supply growth.
As the jig plant at Sishen is now fully ramped up, iron ore production is expected to remain stable for the next year before the impact of current capital expenditure is realised. The continued growth in global iron demand is likely to support longer-term planned developments.
Figure 11: Quarterly production
Coal Iron ore PGMs Gold Diamonds
0
20
40
60
80
100
120
140
160
180
Sep-1
1
Jun-
11
Mar-
11
Dec-1
0
Sep-1
0
Jun-
10
Mar-
10
Dec-0
9
Sep-0
9
Jun-
09
Mar-
09
Dec-0
8
Sep-0
8
Source: Statistics SADescription: Figure 11: Quarterly production rebased to July 2008

PwC 13
Future PGM supply is expected to remain stable in the short-term, with any potential increases met by similar increases in demand. The long-term nature of new deep-level developments will mean that any new projects will only directly impact on supply in the longer term.
A continuing improvement in operating and safety performance has stabilised the decline in production at gold mining operations. Renewed investment in the industry prompted by higher gold prices will hopefully maintain gold supply at current levels for the short term. In the long-term, however, we expect the decline to continue.
South African mining production can only grow with appropriate direct investment in related infrastructure to secure power supply, transport and the training of a skilled workforce.
Structural constraints will require mining companies to partner with the public sector to achieve growth.
By Eskom’s own admission electricity supply will remain extremely tight in 2012, with increased economic growth and the delay in commissioning of the new coal-fired power plants. Power cost pressure and supply security have meant that the industry has had to reduce per-production-unit usage. However, one of the concerns, if not constraints, for new projects remains electricity supply security.
The impact of transport constraints is currently most evident in lower coal exports and the detrimental impact on rural roads. The recognition of this constraint by Transnet and resulting investment in the area is commendable. However, it will take a number of years to increase capacity to a level at which the country can take full advantage of its resources.
Maintaining and acquiring the necessary skilled resources will require significant investment to ensure an efficient and effective workforce to support future growth. A number of large mining companies have in-house training centres and support studies through bursaries and loans. However, retaining skilled employees becomes increasingly difficult in times of economic upswing, with global competition for South Africa’s sought-after experienced labour becoming more fierce.

14 SA Mine : Review of trends in the South African mining industry

PwC 15
4. Financial performance

16 SA Mine : Review of trends in the South African mining industry
Income statement Current year Prior year Difference % Change
R’billion R’billion R’billion R’billion
Revenue from ordinary activities 303 222 81 36%
Operating expenses (202) (171) (31) 18%
Adjusted EBITDA 101 51 50 97%
Other income 12 7 5 74%
Impairment (charge)/reversal (5) 0 (5) -
Amortisation (27) (23) (4) 17%
PBIT 81 35 46 131%
Net interest (4) (4) 0 -6%
Tax expense (22) (13) (9) 68%
Net profit 55 18 37 213%
Adjusted EBITDA margin * 33% 23%
Net profit Margin * 18% 8%
Revenue
Revenue increased by 36% in the current year, as opposed to a decrease of 9% in 2010. Although increases in revenue were experienced across the board, there was a marked difference in the fortunes of different commodities.
AngloGold Ashanti enjoyed a 79% increase when taking into account the benefit of lower hedge-book closure costs for the current year (R5,1 billion vs R10,9 billion). It is now fully exposed to gold price movements. Kumba Iron Ore’s R15 billion or 65% increase was the highest individual increase. Excluding the impact of AngloGold Ashanti’s hedge book, gold revenues only increased by 21% on their higher base in 2010. Platinum companies increased by 27% and the remainder by 38%.
Increases were predominantly price driven, with volumes remaining limited.
Operating expenses
Operating expenses increased by 18% as opposed to the 10% of the prior year. This is well above CPI. Although this increase does include somewhat increased production, the fairly stable production levels indicate above-inflation increases in unit costs.
In the past two years, most companies implemented some cost-saving initiatives. These initiatives required an initial investment before the potential benefits could be realised. Although restructuring costs are often identified in the financial statements, their benefits are not always immediately evident. It remains to be seen whether these restructurings will deliver the desired returns. Management has to balance the challenge of investing sufficiently for future demand growth without unduly increasing the cost base.

PwC 17
A breakdown of the operating expenses of eight of the biggest companies (representing more than 70% of total operating expenses of the aggregated operating expenses) is depicted in Figure 12, with the year-on-year increase for these companies included in the table.
Cost component Year-on-year increase current
year
Year-on-year increase prior
year
Employee benefits and contractors 5.6% 13.7%
Consumables and mining supplies 4.2% 5.2%
Utilities 23.6% 8.7%
Exploration 21.5% -2.4%
Royalties 80.5% 16.7%
Transportation costs 6.3% 28.1%
Metal movements/purchases 84.5% 28.3%
Other 11.5% 34.5%
Total 13.5% 10.2%
Figure 12: Percentage of operating expenses
Source: PwC aggregationDescription: Figure 12: Percentage of operating expenses
39%
22%2%
2%
Employee benefits and contractors
Consumables and mining supplies
Utilities
Exploration
Royalties
Transportation costs
Metal movements/purchases
Other
9%
6%
9%
12%
Labour costsAlthough the share of labour costs decreased from 44% to 39%, when one compares this year with the last, it is still by far the biggest cost component of the South African mining industry. Labour cost percentages vary from above 60% for the deep-level conventional mines to below 30% for those companies that mine predominantly opencast.
It is therefore no surprise that there were substantial retrenchments during the downturn in the economy. This is particularly evident in contractor costs (5% reduction), the most flexible form of labour. Excluding the impact of contractors and volatile share-based payments settled in cash, labour costs increased by 9%. This increase reflects the above-inflation wage increases negotiated in the prior year. In light of numerous incidents of industrial action during the year, it is a trend that is likely to continue, with employers only being able to manage employee costs through reducing staff numbers.
ConsumablesThe increase in spend on consumables of only 4,2% is testimony to the cost-cutting initiatives implemented by the mines. It also reflects the impact of a stronger rand on imports and the cost base of foreign operations. With higher commodity prices and a weakening in the rand, we expect this component to again show an above-inflation increase next year.
UtilitiesThe 23,6% increase in utilities, including electricity and water, reflects the 25% Eskom power increase, which is set to continue for the next couple of years. As utilities already represent 9% of total operating costs, it is essential not only from a power-security point of view, but also from a cost-saving perspective, that companies focus on opportunities to decrease their power consumption.

18 SA Mine : Review of trends in the South African mining industry
Exploration costs
It is pleasing to note that mines have resumed their exploration spending after the cash preservation strategies follow in the previous few years. For the long-term sustainability of the industry, it is essential that companies maintain their exploration programmes.
Royalties
Royalty expenses reflect existing contractual royalty payments as well as the new national royalty expense from 1 March 2010. The 2011 year was the first year reflecting the full impact of the new national royalties, hence the significant increase. The 2% level of total operating costs is likely to be sustained in the future.
Transport costs
This cost component impacts the bulk commodity producers. Kumba Iron Ore, which represents the biggest portion of these costs, has negotiated a simplified pricing mechanism with Transnet based on a basket of indices including PPI, labour and electricity.
Metal movements/purchases
This cost component relates predominantly to the PGM refiners that buy concentrate from junior producers for refining. The increase reflects the significantly higher average prices experienced during the year.
Impairment
Despite the increases in commodity prices, R5 billion in impairments was recognised. The R5 billion was made up of a large number of small impairments, with only two impairments in excess of R1 billion.
Village Main Reef Mining Company impaired its investment in First Uranium by R1,4 billion, as its valuation basis changed from value in use to market value given the intention to sell the investment.
Aquarius Platinum impaired R1 billion of its 50% share in the Blue Ridge PGM mine with low rand prices impacting the project’s economic viability. As indicated in Section 3, rand basket prices did in fact increase marginally but these were not sufficient to offset the impact of significant cost increases. In the absence of a real recovery in PGM prices, other operators are likely to reassess the positions of their marginal projects.
Since above-inflation cost increases continue to keep margins under pressure, if there are any technical difficulties with operations, this could mean that the recoverability of assets may have to be reconsidered.
Amortisation
Despite stable production, depreciation increased due to the higher capital base of new developments. The increased capital base can be attributed to the increased depth of new developments and the high-cost environment in which recent developments have taken place. We expect that depreciation costs will continue to increase.
Net finance cost
The low level of finance costs reflects the traditionally low levels of gearing maintained by most South African mining companies. Not included in this cost is borrowing costs capitalised against the development cost of qualifying assets.
Taxation
The effective tax rate normalised in 2011 at 29% compared to the 44% of 2010. The higher rate in 2010 relates to specific issues: the first being derivative expenditure at AngloGold Ashanti, which was regarded as non-tax deductible. The second is amounts taxable at Lonmin, despite a net-loss position partially offset by capital gains, taxed at a lower rate at Anglo Platinum. In 2011, the non-tax deductible final settlement of the hedge book was offset by the lower capital gains tax at Anglo Platinum.
In future, the change from secondary tax on companies (STC) to a tax-withholding dividend will result in a further decrease in effective tax rate. This will only be evident from 2013.

PwC 19
Net profit
The impressive net profit improvement reflects the price recovery off a very low base for 2010.
It is pleasing to note that the increased profitability is supported by real improvements in EBITDA. It should, however, also be noted that 28 of the 39 entities achieved below-average margins. The following entities achieved EBITDA margins in excess of 35%:
Highest EBITDA margins Current year Prior year
Kumba Iron Ore 66.9% 57.3%
Petmin 61.3% 66.2%
Assore 45.0% 33.1%
ARM 39.1% 30.9%
Gold Fields 37.9% 34.2%
Metorex 37.7% 11.9%
Royal Bafokeng Platinum 37.4% 24.6%
Pan African Resources 36.0% 36.5%
Foreign exchange impact
The impact of the rand exchange rate on performance is quite substantial when compared to global mining performance. The reporting period reflects a fairly stable rand exchange rate environment compared to prior periods. Even so, when converting the income statements of the aggregated companies at the average rates applicable to their specific years, there is a difference in performance. In USD terms, revenue was higher by 45% compared to 36% in rand terms. Adjusted EBITDA was higher by 109% (rand 97%) and net profit higher by 223% (rand 213%).
The sudden weakening of the rand against the USD at the end of 2011 will have a much more pronounced impact on the difference in performance based on presentation currency. With lower USD commodity prices masked by a weaker rand, the performance in USD terms will be weaker than in rand terms.
USD income statement Current year Prior year Difference % Change
USD’billion USD’billion USD’billion USD’billion
Revenue from ordinary activities 42.7 29.4 13.3 45%
Operating expenses (28.5) (22.6) (5.9) 26%
Adjusted EBITDA 14.2 6.8 7.4 109%
Other income 1.7 0.9 0.8 82%
Impairment charge (0.7) 0.0 (0.7) -
Amortisation (3.9) (3.1) (0.8) 25%
PBIT 11.3 4.6 6.7 143%
Net interest (0.5) (0.5) (0.0) 3%
Tax expense (3.2) (1.8) (1.4) 79%
Net profit 7.6 2.3 5.3 221%

20 SA Mine : Review of trends in the South African mining industry
Cash flows Current year Prior year Difference % Change
R’billion R’billion R’billion
Cash flows related to operating activities
Cash generated from operations 96 59 37 64%
Other (17) (5) (12) 229%
Income taxes paid (17) (12) (5) 44%
Net operating cash flows 62 42 20 49%
Cash flows related to investing activities
Purchases of property, plant and equipment (55) (55) 0 -1%
Purchase of investments (9) (8) (1) 14%
Sale of investments 5 14 (9) -66%
Other (5) (2) (3) 124%
Net investing cash flows (64) (51) (13) 25%
Cash flows related to financing activities
Proceeds from ordinary share issues 29 14 15 104%
Proceeds from interest-bearing liabilities 40 58 (18) -31%
Repayment of interest-bearing liabilities and finance leases
(48) (47) (1) 2%
Distribution to shareholders (17) (15) (2) 15%
Net financing cash flows 4 10 (6) -64%
Net increase/(decrease) in cash and cash equivalents
1 0 1 105%
Cash and cash equivalents at beginning of period 38 38 (0) -1%
Cash and cash equivalents at end of period 39 38 1 2%

PwC 21
The ability to translate profits into cash is crucial for the success of any company. The increase in profitability for the year under review also resulted in a build-up in working capital, which meant that cash flow growth lagged profitability growth.
Cash from operating activities (R20 billion increase or 49%)
The R20 billion increase in cash flow from operations reflects the increase in operating profits adjusted for working capital movements. In the prior year there was a cash inflow from working capital as companies applied various cash-management strategies. As expected, additional investments in working capital resulted in a R5 billion cash outflow.
Other cash flows from operating activities include a R18 billion (2010: R6 billion) hedge close-out cost for AngloGold Ashanti.
Consistent with prior years, the ‘tax paid’ amount was less than the tax expense, as one would expect in light of the capital allowances received by the mining industry. The general lag in tax payments compared to the tax expense will mean an improvement in tax flows to the revenue authorities for 2012.
Cash flows from investing activities (net increase of R13 billion or 25%)
Capital expenditure on property, plant and equipment
After the credit crisis, little funding was available. Companies therefore had to preserve their available cash. This, together with the low-price environment, caused companies to suspend or delay capital expenditure resulting in a decrease of 16% in capital expenditure in 2010. This level of capital expenditure was merely maintained in the current year.
Sixty-two percent of the aggregated capital expenditure was incurred by only five companies: Gold Fields (R9 billion, 2009: R8,1 billion), Anglo Platinum (R8 billion, 2010: R11,3 billion), AngloGold Ashanti (R7,1 billion, 2010: R8,7 billion), Impala Platinum (R5,3 billion, 2010: R4,4 billion) and Kumba Iron Ore (R4,7 billion, 2010: R4 billion). As a result of the lag between the decision to develop and actual capital expenditure, capital expenditure is expected to increase again in 2012 although pre-2008 levels are unlikely to be reached in the short term.
Investments
It is pleasing to note that net investments were acquired during the year as opposed to the general disposals of non-core assets in the previous year. Net investment of R4 billion was made in the current year (2010 net proceeds of R6 billion).
Apart from the R7 billion used by Gold Fields to buy out non-controlling shareholders in La Chima and in its operations in Ghana, investments were generally made up of a large number of smaller acquisitions. Noteworthy proceeds from disposal of investments include proceeds realised by Anglo Platinum on the Bafokeng Rasimone joint venture and Western Bushveld joint venture, as well as the finalisation of the Tau Lekoa and B2Gold Corp transactions by AngloGold Ashanti.
There are encouraging signs for increased investment, although global economic jitters are likely to dampen prospects.
Cash flows from financing activities (net decrease of R3 billion or 64%)
Equity
Equity raisings continued on the back of the recovery. Anglo Platinum raised R12,5 billion in a rights issue, AngloGold Ashanti raised R5,6 billion, Eastern Platinum R2,4 billion and Platmin R2,4 billion.
Borrowings
Net borrowings settled of R8 billion reflect the improved cash flows and restructuring of more expensive short-term debt acquired during the crisis.
Distributions to shareholders
Distributions to shareholders improved marginally. It was evident though that companies preferred to reinvest cash, given the uncertainty. The only significant dividends paid were Kumba Iron Ore’s R8,2 billion and Impala Platinum’s R2,6 billion. Apart from Exxaro and Gold Fields, no other companies paid dividends that in aggregate exceeded R1 billion.
Companies will have to weigh up the benefits of reinvesting cash or paying out surplus cash as dividends. With the recovery in commodity prices, a return to dividends is expected in 2012.

22 SA Mine : Review of trends in the South African mining industry
Financial position Current year R’billion
Prior year R’billion
Difference R’billion
% Change R’billion
CURRENT ASSETS
Cash and cash equivalents 43 41 2 6%
Inventories 45 41 4 11%
Receivables and other current assets 39 31 8 25%
Derivative financial assets 0 2 (2) (100%)
Assets held for sale 1 3 (2) -68%
Total current assets 128 118 10 9%
NON-CURRENT ASSETS
Mining and production assets 380 352 28 8%
Goodwill 13 10 3 29%
Investments 41 34 7 22%
Derivative financial assets 2 2 0 -
Other non-current assets 31 26 5 19%
Total non-current assets 467 424 43 10%
Total assets 595 542 53 10%
SHARE CAPITAL & RESERVES
Share capital 228 193 35 18%
Reserves and non-controlling interest 150 121 29 24%
Total equity 378 314 64 20%
CURRENT LIABILITIES
Accounts payable and other liabilities 53 47 6 14%
Interest-bearing liabilities 11 21 (10) -48%
Derivative financial liabilities 0 20 (20) -100%
Total current liabilities 64 88 (24) -27%
NON-CURRENT LIABILITIES
Interest-bearing liabilities 59 57 2 4%
Deferred taxation liabilities 64 56 8 14%
Derivative financial liabilities 5 5 0 -
Other non-current liabilities 25 22 3 11%
Total non-current liabilities 153 140 13 9%
Total liabilities 217 228 (11) -5%
Total equity and liabilities 595 542 53 10%

PwC 23
Key ratios Current year Prior year Global mine ratios
Net borrowings (R’billion) 27 38
Gearing percentage (Percentage) 7% 11% 8%
Solvency ratio (Times) 2.7 2.4 2.4
Current ratio (Times) 2.0 1.3 1.9
Acid ratio (Times) 1.3 0.9 1.52
Sound financial position
The solvency and liquidity ratios improved markedly during the year. These provide the industry with flexibility to operate and, where necessary, invest for the future.
The South African ratios are now largely in line with global ratios. The weak prior-year ratios were negatively impacted by the R18 billion current derivative liability held by AngloGold Ashanti. If one were to exclude this derivative liability, then the proforma 1.8 current ratio and 1.2 acid ratio for the prior year was only marginally weaker than the current year.
These ratios are all derived from historical cost-carrying amounts and therefore do not necessarily reflect the true fair-value trends. Market capitalisation as a multiple of carrying amount weakened from 2.8 to 2.6. This multiple is in line with the very weak market experienced in 2009 and well below the global comparative of 2.9. This indicates investors’ scepticism about the sustainability of the recovery.
At an individual company level, there were 11 (2010: 11) companies with net book values exceeding the market capitalisation of the company. Ratios for only two of the entities included in the preceding year’s list improved to such an extent that they were excluded from the current year. The market capitalisation of five entities weakened to the extent that they are now included in this list.
Market capitalisation as a percentage of net asset value
Current year
Prior year
First Uranium 190% 127%
Sentula Mining 187% 218%
ZCI 163% 145%
Village Main Reef 159% -*
Jubilee 152% 115%
Platmin 148% 66%
Firestone 139% 71%
Eastern Platinum 134% 95%
Sephaku 120% 125%
Keaton Energy Holdings 113% 60%
Optimum 101% 86%
*Excluded due to corporate action
This table shows a disconnect between the market perception of value for these companies and management’s perception of the fair value of the underlying assets. The reason for the difference may be attributable to incomplete information available to the market, differing perceptions over development successes and different long-term price assumptions. These companies face a tough task convincing the market of their value.
24 SA Mine : Review of trends in the South African mining industry
Working capital
There were seven companies (2010: 7) with liquidity ratios of less than one, and 15 (2010: 7) companies with acid ratios of less than one. At the start of an upswing there is a need to build working capital. This can be seen in the inventory build-up giving rise to the difference. More evident was the debtors build up which was largely funded through trade-payable increases.
Of the companies included, 16 improved their current ratios and 17 their acid ratios.
Derivatives
The significant decrease in derivative instruments is as a result of AngloGold Ashanti’s close-out of its hedge book, which in the prior year amounted to a net liability of R18 billion (R20 billion liability and R2 billion in assets).
The outstanding derivative liability position for the current year consists mainly of Palabora Mining Company’s R1,7 billion (2010: R2,3 billion) forward copper sales contract exposure, First Uranium’s R2 billion (2010: R1 billion) gold stream transaction liability and AngloGold Ashanti’s R1,2 billion (2010: R1,3 billion) convertible debenture notes.
Financing for sustainability
South African mining companies and banks have traditionally been conservative when it comes to funding mining projects. The 7% gearing ratio is much lower than the prior year’s 11% and slightly more conservative than the global average of 8%. The equity issues, profitability for the period and settlement of debt with the additional cash flows resulted in lower gearing.
Net borrowings as a percentage of market capitalisation stood at just 3%, compared to the preceding year’s 4,3%. This improvement is largely due to a 27% reduction in net borrowings aided by the marginal improvement in market capitalisation.
Of the 39 companies aggregated, only 17 (2010: 18) were in a net borrowings position.
Although the overall gearing movement remained much the same, a number of individual companies had some significant gearing movements.
Of the top ten companies, 60% (2010: 80%) were in a net borrowing position, as opposed to 38% (2010: 34%) of the remainder of the 39 companies reviewed. The disparity in this ratio may indicate that financial institutions prefer to provide finance based on strong balance sheets, rather than project-specific finance as required by the mid-tier and junior mining companies.

PwC 25
5. Safety performance

26 SA Mine : Review of trends in the South African mining industry
Mining companies, the Government and unions realise how important employee safety is if the industry is to remain sustainable in the long term. This is evident in the emphasis placed on safety in company annual reports, safety stoppages and union commentary.
In 2011, fatalities did not reduce in line with the trend experienced in the recent past.
It is unfortunate that there are allegations that fatalities are linked to the high-price environment – that chasing profits in the higher-price environment causes fatalities. The reality is that improving safety has a profit incentive. The cost of lost production due to self-imposed and DMR imposed Section 54 closures is real. Judging from annual reports, mining companies realise this link and are investing in safety.
Figure 13: Lost-time injury frequency
Source: Company sustainability reportingDescription: Lost-time injury frequency rates per 1 million man hours
Of the top ten companies that disclosed lost-time injury frequency rates, Kumba Iron Ore reflected the best safety record with regard to lost-time injuries, although it did show a weakening in 2011. African Rainbow Minerals showed the best improvement on the previous year. Unfortunately, only four companies improved from the prior year, as opposed to the year before that, when seven companies showed an improvement.
Unions, the Government and companies are all committed to seeing a decline in mining fatalities.
2011 2010 2009
01
2
3
4
5
6
7
8
9
10
Harm
ony
AngloG
old
Ashan
tiLonm
inAng
lo
Platinu
mIm
pala
Gold F
ields
ARM
North
am
Exxar
o
Kumba

PwC 27
6. Value to the people

28 SA Mine : Review of trends in the South African mining industry
Much is made of South Africa having the richest mineral resources with $2,5 trillion worth of reserves, according to Citi Bank. There appears to be a unified view that the mineral wealth of the country should benefit its citizens.
The unfortunate reality is that South Africa still struggles with unemployment-driven poverty and inequality. It is therefore not surprising that there is mass support for any promise to rectify this. Against this background, the populist call for nationalisation of mines has been receiving support.
In a breakfast address on 2 August 2011, Susan Shabangu, Minister of Mineral Resources, made the important point that the question to nationalise or not is incorrect. It should rather be how best the country can address these concerns. She made the following statement: “Imagine analysing the South African ‘evil triplets of poverty, inequality and unemployment’ – and coming to the conclusion that the reason why these persist is because the mines are not nationalized; or that the only way these can be eliminated is through privatisation. Are these two ideological positions going to help South Africa address the material conditions of the people living under the spell of these evil triplets?”
The ANC’s economic transformation committee (ETC) has been investigating economic models applied in various countries, including Chile, Norway, Sweden, Finland, Zambia, Brazil, Venezuela, Namibia, Botswana, Malaysia, China and Australia. It seems that the Chilean model of co-existence between state-owned and private mining companies is receiving preference. The ETC’s report should be available in January 2012 and is likely to be debated throughout the ANC’s various structures before impacting national economic policy.
With significant income already generated from mining companies on a ‘risk-free’ basis, it is hard to understand why the state should assume ownership. If made
responsible for mining companies, the state would have to fund new developments with cash that could be used elsewhere and manage the industry with human resources currently not available. We believe it is much more important to provide a stable and efficient operating and regulatory environment for mining companies in order to attract more direct investment from mining companies, which would increase the value added to the country and its people.
There seems to be recognition for this preference in the National Development Plan released by the National Planning Commission in November 2011. The plan seeks to address major constraints impeding growth in the mining industry. “These (constraints) include uncertainties over ownership, tax treatment and allocation of mineral rights, availability of electricity and the availability, cost and efficiency of transport networks.”
Another strategy to improve employment is beneficiation. While this principle generally receives wide support, the means to implement it remain uncertain. Limiting ferrochrome exports, for example, would result in additional local processing. However, such local processing would compete for capital and electricity, which could be counterproductive. It goes without saying that the impact of any new policy should be assessed in terms of its impact on the greater economy.
Policy uncertainty creates additional risk for potential investors in the sector. Few companies will make multi-billion rand long-term investments if there is uncertainty about security of tenure. It would therefore be positive for the industry if these policy matters could be finalised as soon as possible to provide clarity to the industry.
PwC 29
Value already added
There is little doubt that the mining industry is adding significant value to the country and its people. The industry is already providing direct employment to more than 500 000 people, and many more indirectly.
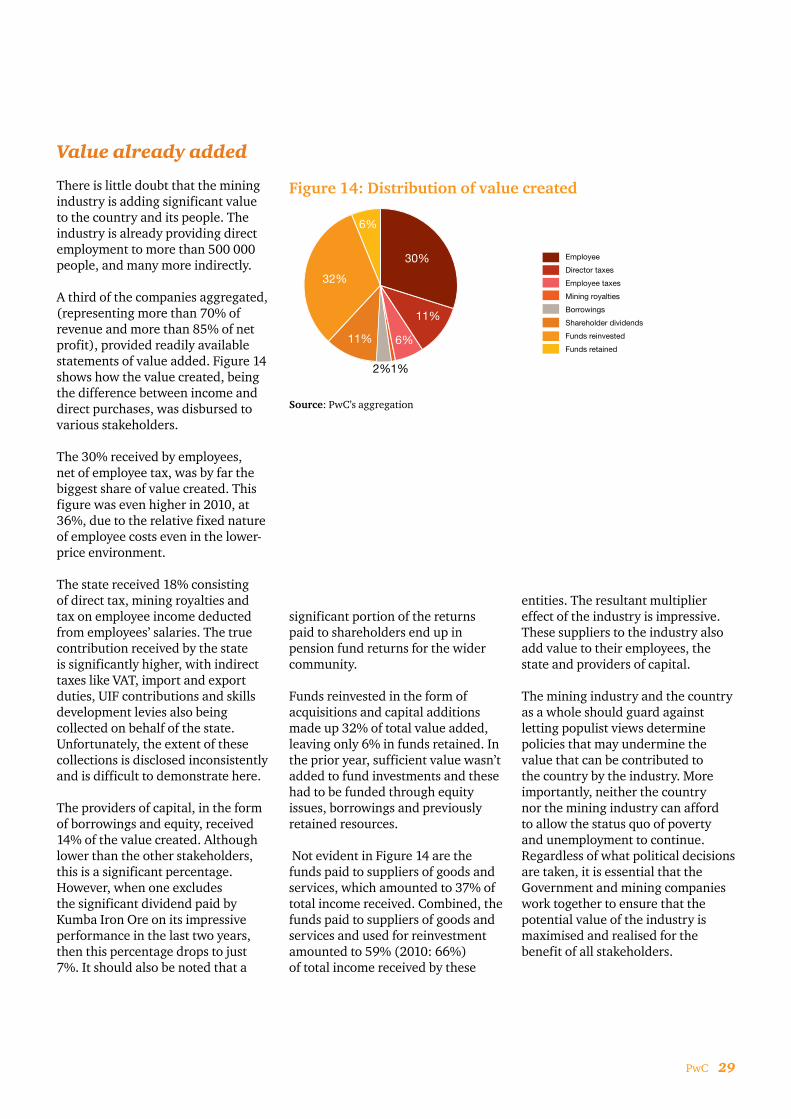
A third of the companies aggregated, (representing more than 70% of revenue and more than 85% of net profit), provided readily available statements of value added. Figure 14 shows how the value created, being the difference between income and direct purchases, was disbursed to various stakeholders.
The 30% received by employees, net of employee tax, was by far the biggest share of value created. This figure was even higher in 2010, at 36%, due to the relative fixed nature of employee costs even in the lower-price environment.
The state received 18% consisting of direct tax, mining royalties and tax on employee income deducted from employees’ salaries. The true contribution received by the state is significantly higher, with indirect taxes like VAT, import and export duties, UIF contributions and skills development levies also being collected on behalf of the state. Unfortunately, the extent of these collections is disclosed inconsistently and is difficult to demonstrate here.
The providers of capital, in the form of borrowings and equity, received 14% of the value created. Although lower than the other stakeholders, this is a significant percentage. However, when one excludes the significant dividend paid by Kumba Iron Ore on its impressive performance in the last two years, then this percentage drops to just 7%. It should also be noted that a
significant portion of the returns paid to shareholders end up in pension fund returns for the wider community.
Funds reinvested in the form of acquisitions and capital additions made up 32% of total value added, leaving only 6% in funds retained. In the prior year, sufficient value wasn’t added to fund investments and these had to be funded through equity issues, borrowings and previously retained resources.
Not evident in Figure 14 are the funds paid to suppliers of goods and services, which amounted to 37% of total income received. Combined, the funds paid to suppliers of goods and services and used for reinvestment amounted to 59% (2010: 66%) of total income received by these
entities. The resultant multiplier effect of the industry is impressive. These suppliers to the industry also add value to their employees, the state and providers of capital.
The mining industry and the country as a whole should guard against letting populist views determine policies that may undermine the value that can be contributed to the country by the industry. More importantly, neither the country nor the mining industry can afford to allow the status quo of poverty and unemployment to continue. Regardless of what political decisions are taken, it is essential that the Government and mining companies work together to ensure that the potential value of the industry is maximised and realised for the benefit of all stakeholders.
30%
11%
1%2%
Employee
Director taxes
Employee taxes
Mining royalties
Borrowings
Shareholder dividends
Funds reinvested
Funds retained11% 6%
32%
6%
Figure 14: Distribution of value created
Source: PwC’s aggregation

30 SA Mine : Review of trends in the South African mining industry

PwC 31
7. Rehabilitation minefield – the tax costs of not complying

32 SA Mine : Review of trends in the South African mining industry
The landscape with regards to the mining industry has seen rapid change over recent years. In particular a core focus of SARS appears to be closure rehabilitation companies and trusts.
The introduction of the Mineral and Petroleum Resources Royalty Regime in 2010 marked yet another regulatory milestone in an industry that has been hard hit by constant reform and change since the introduction of the Mineral and Petroleum Resources Development Act and the Mining Charter in 2004.
Changes to the taxation of South Africa’s mining industry have also not taken a back seat over recent years. In addition to legislative changes, the South African Revenue Service (SARS) has significantly raised the bar with regards to the vigour and technical competency that is being applied in assessing mining companies.
A core focus area of SARS, judging by recent queries, appears to be closure rehabilitation companies and trusts, with mining groups being asked to defend not only the exempt status of their rehabilitation vehicles, but also the deductibility of the contributions made to these vehicles.
On review of the tax legislation pertaining to these rehabilitation vehicles, the issue that is currently under scrutiny is the compliance of the underlying rehabilitation vehicle with the South African Income Tax Act. More specifically, SARS is looking at whether the rehabilitation vehicle holds only conforming investments, makes appropriate distributions and whether the Trust Deed or Company Constitution incorporates the specific provisions of Section 37A, which was introduced in 2006.
The issue of relevance is that if the rehabilitation vehicle is non-compliant with the rigorous requirements of the aforementioned section, it runs both the risk of
losing its exempt status and of having sanctions (penalties and additional tax) imposed on it and the mining company/mineral rights holder making the annual cash contributions to it.
The more stringent penalty that can be imposed under this legislation is the ‘general’ penal provision, which states that where the Commissioner for SARS is satisfied that the rehabilitation vehicle is in contravention of any provision of Section 37A, he may include, as taxable income, an amount equal to twice the value of the assets held in the rehabilitation vehicle on the date of contravention.
These tax implications are then specifically deemed to be ‘income’ in the hands of the mineral rights holder/mining entity that contributes into the rehabilitation vehicle. Recent queries by SARS indicate an intention to invoke this penal provision where the Trust Deed or Company Constitution is not updated to incorporate the specific provisions of requisite tax legislation.
Taking into account that most mining houses established their rehabilitation vehicles prior to the introduction of Section 37A in 2006, the incidence of non-compliant rehabilitation vehicles is possibly higher than one would initially expect, as administrative matters relating to these vehicles may not be a priority item on a mining company’s tax agenda.
Further to the ‘general’ penalty noted above, additional penalties can be levied where the rehabilitation vehicle holds non-conforming assets or where its distributions are not in line with what is envisaged under Section 37A. Both penalties for

PwC 33
these instances of non-compliance deem only the market value of the non-conforming assets or the inappropriate distributions to be ‘income’ in the hands of the mineral rights holder/mining entity that contributes into the rehabilitation vehicle or the rehabilitation vehicle.
On a final note, non-compliance by the rehabilitation vehicle with the provisions of the tax legislation may also result in the mining company forfeiting the tax deduction of its annual cash contribution. This is because the deduction is only permitted if made to a qualifying entity which, in turn, requires full compliance by the rehabilitation vehicle with the tax law.
Taking into account the material values of the assets normally held in rehabilitation vehicles, these penal provisions could have a material impact on any mining group.
Whilet rehabilitation vehicles may have taken a back seat to a mining group’s more material operations in the past, the time to reconsider the importance of these vehicles within the group as a whole is certainly upon us.
The potential underestimation of provisional tax, particularly the second provisional tax payment, is an added risk for the mining company/mineral rights holder, as the penalty is deemed to be income in their hands.

34 SA Mine : Review of trends in the South African mining industry
PwC 35
8. Sustainable mining

36 SA Mine : Review of trends in the South African mining industry
The mining industry has always been under intense scrutiny from a variety of stakeholders due to both the perceived positive and the negative impact of operations on people and the planet. The industry is consistently challenged over the value it creates from the extraction, and subsequent use, of non-renewable resources versus the costs of that extraction.
In today’s political and economic climate, the costs under scrutiny go well beyond the traditional financial investment and direct environmental impact on water, energy consumption, etc. The realities and conflicts of global over-consumption and over-production, of achieving more with less, of improved standards of living and health for all sectors of a country’s population, is at the top of every government’s agenda.
The initial threats – environmental degradation and health and safety of staff – were responded to as the concept of sustainability reporting evolved; sustainable development was understood, particularly in the mining industry, as not being so much about indefinite survival of the mine or shaft, but what is left behind once the ore body is depleted. Transparency of performance was the answer, but performance was only measured in terms of historical inputs and outputs.
The Mining Charter in South Africa began to address some of the social issues and the development of local communities and economies, but still the industry generally finds itself on the back foot as taxes, royalties and nationalisation are being implemented/considered by the Government to address the economic development and upliftment of the entire population.
What we have seen recently across a range of industries – a trend that will benefit the mining industry and allow it to be proactive in its engagement with a range of stakeholders – is that companies are moving from reporting historical inputs/outputs to truly understanding, measuring and monitoring the impact or value they are creating across the value chain. Investors are also using phrases such as ‘patient capital’ or ‘impact investing’ to drive their decision-making process by looking beyond quick financial returns to a more holistic return across a longer period of time.
Holistic returns require companies to monetise the environmental, social and economic value of their operations to make it comparable across traditional measures of value – financial profit and value added statement. This allows for complete assessment of past performance, along with future projections and strategies.
This approach to value generation, taking into account the socio-economic aspects of the entire mining value chain, can play a major role in assisting the sector to address some of the social and political issues being encountered. The sector creates significant value in social investment; creating and distributing profits; employment generation and the payment of wages; employee development practices and benefits; procurement/supply-chain practices; enterprise development practices; technology development and transfers; and investment in national infrastructure. All these aspects have direct impact/value and multiplier effects on the broader local and national economy. If measured and communicated effectively this could go a long way to responding to the Government’s challenges and concerns.
Environmental issues are still a major threat to the mining industry and need to be managed and improved, but the spectre of special taxes, royalties and nationalisation is a risk and opportunity for the mining industry to respond to.

PwC 37
9. Other information

38 SA Mine : Review of trends in the South African mining industry
Glossary
Acid ratio (Current assets less inventory)/Current liabilities
Adjusted EBITDA EBITDA adjusted for impairment charges
Adjusted EBITDA margin Adjusted EBITDA/Revenue
CPI Consumer price index as published by Statistics South Africa
Current ratio Current assets/Current liabilities
DMR Department of Mineral Resources
EBITDA Earnings before interest, tax, depreciation and amortisation
EBITDA margin EBITDA/Revenue
Gearing percentage Net Borrowings/(Net Borrowings plus equity)
LTIFR Lost-time injury frequency rate (calculated per 1 million man hours)
Market capitalisation The market value of the company calculated as the number of shares outstanding, multiplied by the share price
Net borrowings Interest-bearing debt, less cash
PBIT Profit before interest and tax
PGM Platinum group minerals
STC Secondary tax on companies
Top 39, 10, 5 The top companies by market capitalisation used in this aggregation
TTC Total tax contribution
VAT Value-added tax
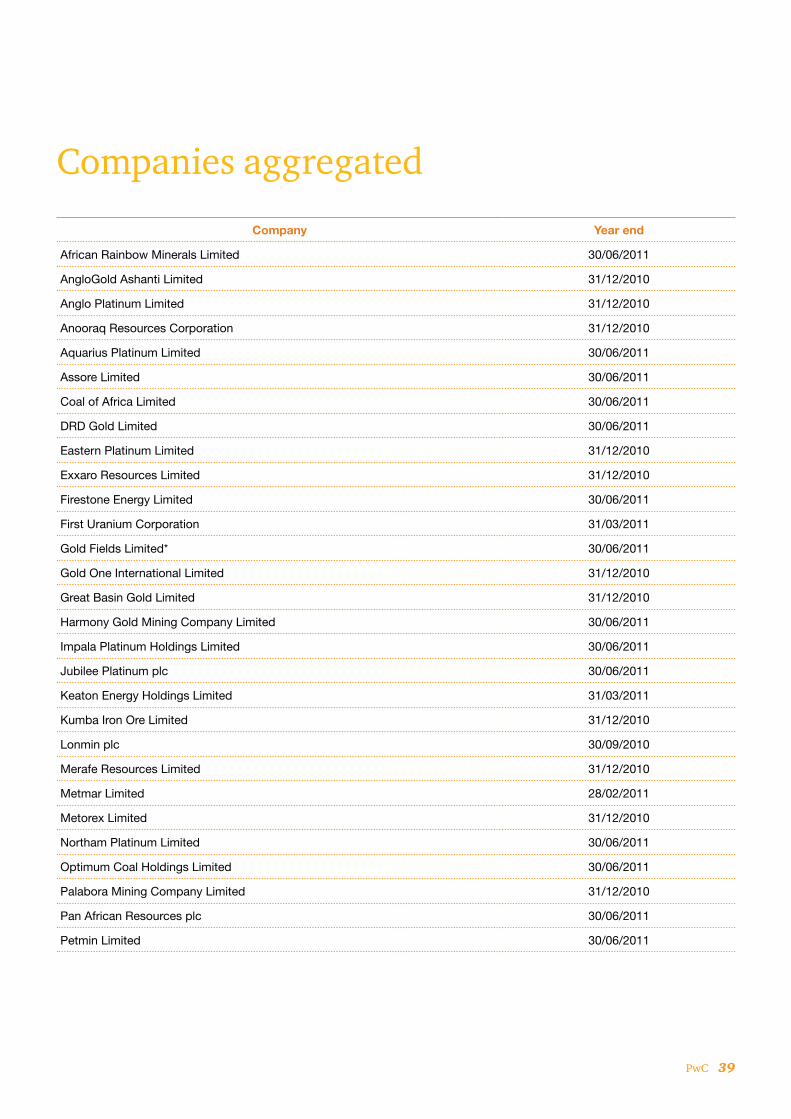
PwC 39
Companies aggregated
Company Year end
African Rainbow Minerals Limited 30/06/2011
AngloGold Ashanti Limited 31/12/2010
Anglo Platinum Limited 31/12/2010
Anooraq Resources Corporation 31/12/2010
Aquarius Platinum Limited 30/06/2011
Assore Limited 30/06/2011
Coal of Africa Limited 30/06/2011
DRD Gold Limited 30/06/2011
Eastern Platinum Limited 31/12/2010
Exxaro Resources Limited 31/12/2010
Firestone Energy Limited 30/06/2011
First Uranium Corporation 31/03/2011
Gold Fields Limited* 30/06/2011
Gold One International Limited 31/12/2010
Great Basin Gold Limited 31/12/2010
Harmony Gold Mining Company Limited 30/06/2011
Impala Platinum Holdings Limited 30/06/2011
Jubilee Platinum plc 30/06/2011
Keaton Energy Holdings Limited 31/03/2011
Kumba Iron Ore Limited 31/12/2010
Lonmin plc 30/09/2010
Merafe Resources Limited 31/12/2010
Metmar Limited 28/02/2011
Metorex Limited 31/12/2010
Northam Platinum Limited 30/06/2011
Optimum Coal Holdings Limited 30/06/2011
Palabora Mining Company Limited 31/12/2010
Pan African Resources plc 30/06/2011
Petmin Limited 30/06/2011

40 SA Mine : Review of trends in the South African mining industry
Company Year end
Platmin Limited 31/12/2010
Royal Bofokeng Platinum Limited 31/12/2010
Sentula Mining Limited 31/03/2011
Sephaku Holdings Limited 30/06/2011
Tawana Resources Limited 30/06/2011
Transhex Group Limited 31/03/2011
Village Main Reef Mining Company (1934) Limited 30/06/2011
Wesizwe Platinum Limited 31/12/2010
Witwatersrand Consolidated Gold Resources Limited 28/02/2011
Zambia Copper Investments Limited 31/03/2011
* Gold Fields changed its year end to 31 December. The results included were based on the audited financial statements to 31 December 2010 and unaudited results to 30 June 2011. No other adjustments were made for year-end changes.
PwC 41
Basis for compiling this report
We aggregated the financial results of mining companies with a primary listing on the Johannesburg Stock Exchange (JSE) and mining companies whose main operations are in Africa and that have a secondary listing on the JSE, for the financial year ends to June 2011. We used a cut-off market capitalisation of R200 million and excluded all companies with suspended listings.
Our selection criteria excluded global mining companies Anglo American and BHP Billiton. Although both these companies have South African roots, their global exposure and size means that they do not necessarily reflect trends in the South African mining environment. A large number of the entities included also have international exposure. However, the bulk of their operations are in Africa.
The results aggregated in this report have been sourced from information that is publicly available, primarily annual reports or reviewed results made available to shareholders. Companies have different year ends and report under different accounting regimes.
Information has been aggregated for the financial years of individual companies and no adjustments have been made to take into account different reporting requirements and year ends. As such, the financial information shown for 2011 covers reporting periods from 1 October 2009 to 30 June 2011, with each company’s results included for the 12-month financial reporting period that falls into this time frame.
Information for the previous year comprises information for the 39 companies selected in the current year, except where indicated otherwise.
All currency figures in this publication are reported in South African rands, except where specifically stated otherwise. The results of companies that report in currencies other than the rand have
been translated at the average rand exchange rate for the financial year, with balance sheet items translated at the closing rand exchange rate.
Some diversified companies undertake part of their activities outside the mining industry. No attempt has been made to exclude such non-mining activities from the aggregated financial information.

42 SA Mine : Review of trends in the South African mining industry
About PwCPwC firms provide industry-focused assurance, tax and advisory services to enhance value for their clients. More than 161 000 people in 154 countries in firms across the PwC network share their thinking, experience and solutions to develop fresh perspectives and practical advice.
We have 1500 dedicated mining professionals in various key minining territories across the world.
See www.pwc.com for more information.
PwC 43
PwC Mining Centre of Excellence
The PwC Mining Centre of Excellence is a major player in the South African mining sector and offers the industry expertise in audit, tax, risk management, environmental services and transaction support.
Our diverse client base covers the full spectrum of economic activities in the mining sector. We bring appropriate local knowledge and experience to bear and use the depth of our resources to bring clients a professional service specifically tailored to meet their requirements.
Having successfully stood up to the challenge to retain a racially and gender representative body of skills in South Africa, our teams have the capability and availability to service all our mining clients.

©2012 PricewaterhouseCoopers (“PwC”), the South African firm. All rights reserved. In this document, “PwC” refers to PricewaterhouseCoopers in South Africa, which is a member firm of PricewaterhouseCoopers International Limited (PwCIL), each member firm of which is a separate legal entity and does not act as an agent of PwCIL. (12-10419)
To learn more about the issues raised in this report and our services, please contact:
Hein Boegman African Mining Leader +27 (11) 797 4335 [email protected]
Andries Rossouw Mining Assurance Partner +27 (11) 797 4060 [email protected]
Faan Lombard Mining Assurance Partner +27 (11) 797 4407 [email protected]
Megan Naidoo Mining Assurance Partner +27 (11) 797 4013 megan.naidoo.za.pwc.com
Sizwe Masondo Mining Assurance Partner +27 (11) 797 5393 [email protected]
Chantal Marais Mining Assurance Partner +27 (11) 797 4171 [email protected]
Hendrik Odendaal Mining Assurance Partner +27 (11) 797 4010 [email protected]
Michal Kotze Mining Assurance Partner +27 (11) 797 4603 [email protected]
Dion Shango Mining Assurance Partner +27 (11) 797 4166 [email protected]
Jean-Pierre van Staden Mining Assurance Partner +27 (11) 797 5367 [email protected]
Pieter Hough Mining Assurance Partner +27 (11) 797 4158 [email protected]
Troopti Naik Tax Partner +27 (11) 797 4351 [email protected]
Simon Venables Transactions Leader +27 (11) 797 5660 [email protected]
Gert Meiring Tax Partner +27 (11) 797 5506 [email protected]
Anton van Wyk Advisory Mining Partner +27 (11) 797 5338 [email protected]
Alison Ramsden Sustainability Partner +27 (11) 797 4658 [email protected]
Duncan Adriaans Mining Assurance Partner +27 (21) 815 3099 [email protected]
Kevan Moodley Mining Assurance Partner +27 (53) 807 9202 [email protected]