SA CHEESE INDUSTRY LANDSCAPE REPORT - B2B Market … · What are the global Cheese industry trends,...
19
SA CHEESE INDUSTRY LANDSCAPE REPORT COMPILED: JANUARY 2017
Transcript of SA CHEESE INDUSTRY LANDSCAPE REPORT - B2B Market … · What are the global Cheese industry trends,...

SA CHEESE INDUSTRY
LANDSCAPE REPORT
COMPILED: JANUARY 2017

REPORT OVERVIEW
For the Global Cheese Industry Section:
What are the current market dynamics of the global Cheese industry?
What are the global Cheese industry trends, drivers, and restraints?
For the South African Cheese Industry Section:
What are the current market dynamics of the SA Cheese industry?
Who are the key manufacturing players in the SA Cheese industry?
Who are the key cheese importers in the SA Cheese industry?
For the South African Retail and Pricing Analysis Section:
Who are the key retail players in the SA Cheese industry?
What are the prices of popular Cheese brands across South African retail outlets?
In terms of South African Consumer Insights and Trends:
What are the volumes for Cheese consumption (2011-2015)?
What are the statistics regarding the most popular types of Cheese purchased in 2015?
SOME KEY QUESTIONS THE REPORT WILL HELP YOU TO ANSWER:
The South African Cheese Industry Landscape Report (110 pages) provides a dynamic synthesis of
industry research, examining the local and global Cheese industry from a uniquely holistic perspective, with
detailed insights into the entire value chain – from manufacturing to retail, pricing and consumption.
2

SCREENSHOTS FROM REPORT
110 page report filled with detailed charts, graphs, tables and insights
3

4Source: World Knowing ; Statista Image Source: Pixabay; Freepik
SAMPLE FROM REPORTKEY GLOBAL MARKETS
Approximately 20-22 million metric
tonnes of cheese is produced in total
around the world (annually). The United
States produces 5.2 million tonnes of
cheese annually with Germany second
at only 2 million tonnes.
1. USA
Due to the increase of health consciousness,
the US market is shifting in preference for
unprocessed cheese. Additionally, the growth
in the fast food market is impacting positively
on the growth of the cheese market.
The US currently produces about 26% of the
global cheese market.
2. Germany
In 2011, the production value of Germany’s
cheese market was Euro 4,4 billion which
increased to Euro 4,9 billion by 2014.
Cheese made up 24.4% of the German chilled
and fresh food sales as of 28 June 2015.
Germany is the largest producer of milk in
Europe and one of the highest exporting
countries.
3,329
3,405.2
3,526.4
3,875.7
4,268.93,896.4
4,270.94,448.9
4,459.3
4,837.6
4,973.5
0
1,000
2,000
3,000
4,000
5,000
6,000
2004 2005 2006 2007 2008 2009 2010 2011 2012 2013 2014
PRODUCTION VALUE OF CHEESE IN GERMANY 2004-2014 (Euro million)
5.2
2 1.91.1
0.7 0.7 0.6 0.6 0.6 0.4
0
1
2
3
4
5
6
TOP 10 LARGEST CHEESE PRODUCER COUNTRIES (Million metric tonnes)

SAMPLE FROM REPORT SOUTH AFRICAN CHEESE INDUSTRY TRENDS
5Source: Euromonitor; Bdlive; S-ge ; Danone Image Source: Pixabay: Freepik
Low fat dairy products in South Africa will
be classified as medium fat products in
line with international standards as of
March 2016.
Dairy products will now be categorised as high
fat, full fat, medium fat, low fat and fat free (or
skimmed).
Parmalat has confirmed that their low fat
products will be relabelled as medium fat
products in the future.
Consumers are also more drawn to
products which offer something extra.
This could include products offering extras like
indulgence, convenience or economical
advantages and eye-catching packaging.
Market research has shown that consumers
expect products that are ready-to-eat, safe,
high in nutritional value, natural, and good
value-for-money.
Product Differentiation
Due to the increase of private labels and
the competitive landscape, manufacturers
are having to distinguish their products and
services.
Differentiating products as healthy, natural
and organic are some of the most popular
strategies.

SAMPLE FROM REPORT SA CHEESE MANUFACTURERS: CLOVER
6
Founded in 1898, Clover Lichtenburg,
situated in Lichtenburg in the North West
Province, has a cheese processing and
packaging facility.
Clover delivers to approximately 14 913 delivery
points across South Africa.
The Group was converted from a co-operative
society into a public company in 2003.
In 2016, Clover reported that their headline
earnings per share increased by 8.9% to 188,9
cent.
During 2016, Clover’s revenue increased by 6%
to R9,8 billion and their operating profit was up
by 10,9% to R564.5 million.
Clover Feta cheese is the second largest brand
in the market and is competing for the number
one position.
CLOVER PRODUCT RANGE:
Berg processed cheese
Clover Feta
Clover Portions in Cheddar and Gouda
Clover Pre-packed Cheddar, Gouda,
Mature Cheddar and Tussers
Clover Slices in Cheddar and Gouda
Clover White Cheddar
Processed cheese slices in biltong,
Cheddar, Gouda and sweet milk
Elite pre-packed Cheddar, Gouda
and Mature Cheddar
Source: Clover; Clover Annual report 2016 Image Source: Clover
Product Categories
Clover’s Percentage
Market Share as at
30 June 2016
Feta Cheese 28.0%
Pre-packed cheese 23.8%
Processed cheese slices 15.4%

Source: Moneyweb, Pick n Pay Image Source: Pick n Pay
SAMPLE FROM REPORT SA RETAIL: PICK N PAY
Pick n Pay has delivered a turnover of
R37.4bn for the 26 weeks ending 28
August 2016 (a growth of 7.2% compared
to the same period last year).
Despite a challenging economic environment
in South Africa and great pressure on
consumers, the gross profit margin for the
Group is up by 0.2%.
700 new Private Label products were
launched in addition to the 900 already
available.
Super Animals (a Pick n Pay promotion)
registered 3.3 million active Smart Shopper
collectors. In addition, the app was one of the
Top 10 most downloaded apps in the Apple
and Android stores.
Smart Shopper was awarded SA’s favourite
loyalty programme for the 4th consecutive
year.
PnP online grew by 34%.
Boxer delivered an improved gross profit
margin.
Pick n Pay’s key strategic objectives 2017:
Focus on operating efficiency
Sales growth
Margin improvement
7
32.1
34.937.4
0
5
10
15
20
25
30
35
40
FY15 H1 FY16 H1 FY17 H1
GROUP TURNOVER (R Billion)

Year 1 Packet/tub 2 Packets/tubs 3+ Packets/tubs Total
2011 4,425,000 3,632,000 3,417,000 11,474,000
2012 4,796,000 3,412,000 3,004,000 11,211,000
2013 5,092,000 3,663,000 3,092,000 11,847,000
2014 5,152,000 3,548,000 2,672,000 11,372,000
2015 5,309,000 3,433,000 2,681,000 11,423,000
Between 2011 and 2015, the volume trends among consumers who had personally purchased cheese has decreased from
30% purchasing 3+ packets/tubs in the past 4 weeks in 2011 to 23% in 2015.
In 2015, 46% (5.3 million) of cheese consumers had personally bought 1 packet/tub in the past 4 weeks and 30% (3.4
million) bought 2 packets/tubs.
8
39% 43% 43% 45% 46%
32% 30% 31% 31% 30%
30% 27% 26% 23% 23%
0%10%20%30%40%50%60%70%80%90%
100%
2011 2012 2013 2014 2015
HOW MANY PACKETS/TUBS OF CHEESE HAVE YOU PERSONALLY BOUGHT DURING THE PAST 4 WEEKS (2011-2015)
1 Packet/tub 2 Packets/tubs 3+ Packets/tubs
Source: AMPS 2011B-2015B (Adult population 16+ years)
Sample Size: 34 038 (2011); 34 067 (2012); 36 449 (2013); 36 932 (2014); 37 452 (2015)
Based on weighted numbers
SAMPLE FROM REPORTCHEESE VOLUME TRENDS (PAST 4 WEEKS)

TABLE OF CONTENTS
1. Executive Summary (4 pages):
1.1 Global Industry Snapshot 2016
1.2 South African Industry Snapshot 2016
1.3 Industry Drivers and Restraints
1.4 SA Dashboard: Purchasing Stats
2. Global Cheese Industry Overview (7 pages):
2.1 Global Cheese Industry Overview: GLOBAL CHEESE MARKET VALUE IN 2015 AND 2021; REVENUE OF DAIRY PRODUCT AND CHEESE MANUFACTURING IN
INDIA FROM 2008 TO 2018 (Graphs)
2.2 Key Global Cheese Markets: USA, Germany, France, Italy: TOP 10 CHEESE PRODUCING COUNTRIES; PRODUCTION VALUE OF CHEESE IN
GERMANY 2004-2014; NUMBER OF PEOPLE USING CHEESE IN FRANCE IN 2015 (SEVERAL TIMES A WEEK); VOLUME OF FRESH CHEESE PRODUCED IN ITALY 2014,
BY CHEESE TYPE (Graphs)
2.3 Global Industry Trends
2.4 Global Industry Drivers
2.5 Global Industry Challenges
9

TABLE OF CONTENTS
3. South African Cheese Industry Overview (28 pages):
3.1 South African Cheese Industry Overview (14 pages)
3.1.1 South African Cheese Industry Overview: ANNUAL AND MONTHLY RAW MILK PURCHASES IN SA (2012-SEP 2015); TOTAL IMPORTS AND EXPORTS OF
CHEESE PER TARIFF CLASS (2014-2016*); COMPOSITION OF THE SA CONCENTRATED PRODUCTS MARKET ON A MASS BASIS FOR 2011 (Graphs)
3.1.2 Market Structure and Dynamics: MARKET BREAKDOWN ACCORDING TO CHEESE TYPE: 2013 (Graph)
3.1.3 SA Cheese Industry Production & Consumption: MARKET BREAKDOWN ACCORDING TO CONCENTRATED MILK PRODUCTS: 2013; MILK PRODUCTION
BY PROVINCE: 2013 (Graphs)
3.1.4 SA Cheese Industry Distribution: CHANNEL DISTRIBUTION IN SOUTH AFRICA: 2013; DISTRIBUTION BY PROVINCE: 2013 (Graphs)
3.1.5 Key Industry Trends
3.1.6 Key Industry Drivers
3.1.7 Key Industry Challenges
3.1.8 Promotion Strategies
10
3. South African Cheese Industry (43 pages):
3.1 South African Cheese Industry Overview (15 pages)
3.1.1 South African Cheese Industry Overview: TOTAL IMPORTS AND EXPORTS OF CHEESE PER TARIFF CLASS IN TONNES (2014-2016*); COMPOSITION OF
THE SA CONCENTRATED PRODUCTS MARKET ON A MASS BASIS (Graphs)
3.1.2 Market Structure and Dynamics: MARKET SHARE ACCORDING TO CHEESE TYPE (Graph)
3.1.3 South African Milk Industry Production: 2013-2016 Raw Milk Purchases: MONTHLY RAW MILK PURCHASE TREND (JANUARY 2013 TO
NOVEMBER 2016) (Graph)
3.1.4 International Price Trends: Dairy and Cheese: INTERNATIONAL DAIRY PRODUCT PRICES (JANUARY 2007 TO DECEMBER 2016) (Graph)
3.1.5 South African Cheese Industry Production & Consumption: MARKET BREAKDOWN ACCORDING TO CONCENTRATED MILK PRODUCTS; MILK
PRODUCTION BY PROVINCE (Graphs)
3.1.6 South African Cheese Industry Distribution: CHANNEL DISTRIBUTION IN SOUTH AFRICA; DISTRIBUTION BY PROVINCE (Graphs)
3.1.7 South African Cheese Industry Trends
3.1.8 South African Cheese Industry Drivers
3.1.9 South African Cheese Industry Challenges
3.1.10 Promotion Strategies

TABLE OF CONTENTS
3. South African Cheese Industry Overview (28 pages):
3.1 South African Cheese Industry Overview (14 pages)
3.1.1 South African Cheese Industry Overview: ANNUAL AND MONTHLY RAW MILK PURCHASES IN SA (2012-SEP 2015); TOTAL IMPORTS AND EXPORTS OF
CHEESE PER TARIFF CLASS (2014-2016*); COMPOSITION OF THE SA CONCENTRATED PRODUCTS MARKET ON A MASS BASIS FOR 2011 (Graphs)
3.1.2 Market Structure and Dynamics: MARKET BREAKDOWN ACCORDING TO CHEESE TYPE: 2013 (Graph)
3.1.3 SA Cheese Industry Production & Consumption: MARKET BREAKDOWN ACCORDING TO CONCENTRATED MILK PRODUCTS: 2013; MILK PRODUCTION
BY PROVINCE: 2013 (Graphs)
3.1.4 SA Cheese Industry Distribution: CHANNEL DISTRIBUTION IN SOUTH AFRICA: 2013; DISTRIBUTION BY PROVINCE: 2013 (Graphs)
3.1.5 Key Industry Trends
3.1.6 Key Industry Drivers
3.1.7 Key Industry Challenges
3.1.8 Promotion Strategies
11
3.2 South African Cheese Manufacturing Overview (17 pages):
3.2.1 SA Cheese Manufacturers: BM Food Manufacturers
3.2.2 SA Cheese Manufacturers: Cape Cheese Products
3.2.3 SA Cheese Manufacturers: Clover
3.2.4 SA Cheese Manufacturers: DairyBelle
3.2.5 SA Cheese Manufacturers: Fairview
3.2.6 SA Cheese Manufacturers: Healey’s
3.2.7 SA Cheese Manufacturers: Indezi
3.2.8 SA Cheese Manufacturers: Klein River
3.2.9 SA Cheese Manufacturers: Ladismith Cheese
3.2.10 SA Cheese Manufacturers: La Mont
3.2.11 SA Cheese Manufacturers: Lancewood
3.2.12 SA Cheese Manufacturers: La Petite France
3.2.13 SA Cheese Manufacturers: Morning Milk
3.2.14 SA Cheese Manufacturers: Parmalat
3.2.15 SA Cheese Manufacturers: Zandam
3.2.16 SA Cheese Manufacturers: Karoo & Langbaken
3.2.17 SA Cheese Manufacturers: La Montanara & Roulou

TABLE OF CONTENTS
3. South African Cheese Industry Overview (28 pages):
3.1 South African Cheese Industry Overview (14 pages)
3.1.1 South African Cheese Industry Overview: ANNUAL AND MONTHLY RAW MILK PURCHASES IN SA (2012-SEP 2015); TOTAL IMPORTS AND EXPORTS OF
CHEESE PER TARIFF CLASS (2014-2016*); COMPOSITION OF THE SA CONCENTRATED PRODUCTS MARKET ON A MASS BASIS FOR 2011 (Graphs)
3.1.2 Market Structure and Dynamics: MARKET BREAKDOWN ACCORDING TO CHEESE TYPE: 2013 (Graph)
3.1.3 SA Cheese Industry Production & Consumption: MARKET BREAKDOWN ACCORDING TO CONCENTRATED MILK PRODUCTS: 2013; MILK PRODUCTION
BY PROVINCE: 2013 (Graphs)
3.1.4 SA Cheese Industry Distribution: CHANNEL DISTRIBUTION IN SOUTH AFRICA: 2013; DISTRIBUTION BY PROVINCE: 2013 (Graphs)
3.1.5 Key Industry Trends
3.1.6 Key Industry Drivers
3.1.7 Key Industry Challenges
3.1.8 Promotion Strategies
12
3.3 South African Cheese Importing Overview (11 pages):
3.3.1 SA Cheese Importers: Alfalfa’s
3.3.2 SA Cheese Importers: Alpenhain
3.3.3 SA Cheese Importers: Arla Foods
3.3.4 SA Cheese Importers: Bel Group
3.3.5 SA Cheese Importers: Dutch Farms
3.3.6 SA Cheese Importers: Emborg
3.3.7 SA Cheese Importers: Fayrefield Foods
3.3.8 SA Cheese Importers: M&L Distributors
3.3.9 SA Cheese Importers: Savencia Fromage & Dairy
3.3.10 SA Cheese Importers: Kerrygold & Wyke
3.3.11 SA Cheese Importers: Westland & Woerle
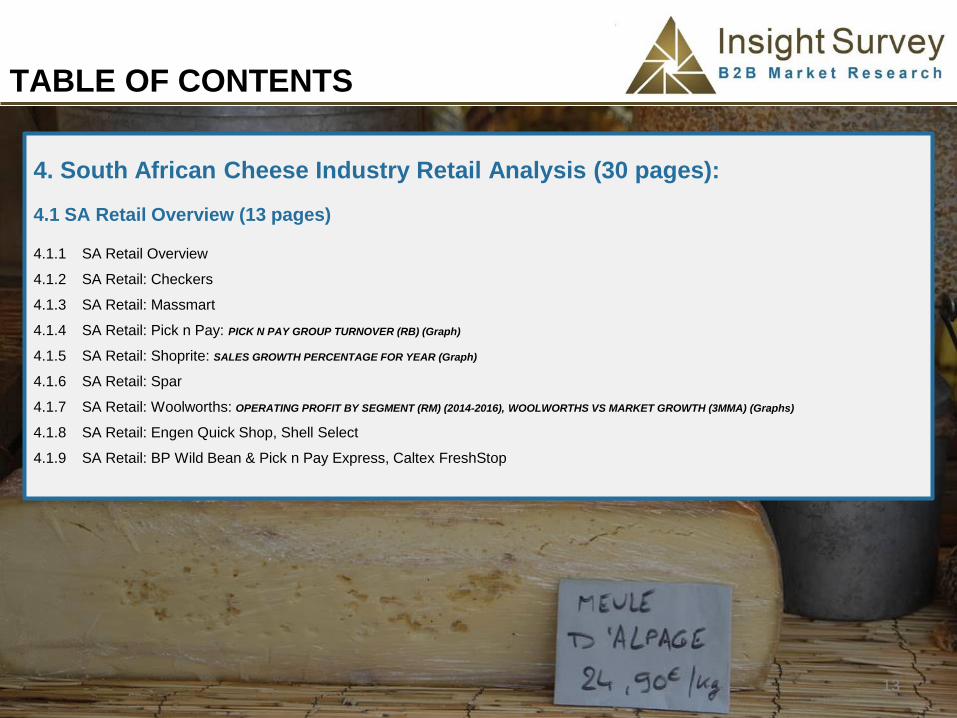
TABLE OF CONTENTS
3. South African Cheese Industry Overview (28 pages):
3.1 South African Cheese Industry Overview (14 pages)
3.1.1 South African Cheese Industry Overview: ANNUAL AND MONTHLY RAW MILK PURCHASES IN SA (2012-SEP 2015); TOTAL IMPORTS AND EXPORTS OF
CHEESE PER TARIFF CLASS (2014-2016*); COMPOSITION OF THE SA CONCENTRATED PRODUCTS MARKET ON A MASS BASIS FOR 2011 (Graphs)
3.1.2 Market Structure and Dynamics: MARKET BREAKDOWN ACCORDING TO CHEESE TYPE: 2013 (Graph)
3.1.3 SA Cheese Industry Production & Consumption: MARKET BREAKDOWN ACCORDING TO CONCENTRATED MILK PRODUCTS: 2013; MILK PRODUCTION
BY PROVINCE: 2013 (Graphs)
3.1.4 SA Cheese Industry Distribution: CHANNEL DISTRIBUTION IN SOUTH AFRICA: 2013; DISTRIBUTION BY PROVINCE: 2013 (Graphs)
3.1.5 Key Industry Trends
3.1.6 Key Industry Drivers
3.1.7 Key Industry Challenges
3.1.8 Promotion Strategies
13
4. South African Cheese Industry Retail Analysis (30 pages):
4.1 SA Retail Overview (13 pages)
4.1.1 SA Retail Overview
4.1.2 SA Retail: Checkers
4.1.3 SA Retail: Massmart
4.1.4 SA Retail: Pick n Pay: PICK N PAY GROUP TURNOVER (RB) (Graph)
4.1.5 SA Retail: Shoprite: SALES GROWTH PERCENTAGE FOR YEAR (Graph)
4.1.6 SA Retail: Spar
4.1.7 SA Retail: Woolworths: OPERATING PROFIT BY SEGMENT (RM) (2014-2016), WOOLWORTHS VS MARKET GROWTH (3MMA) (Graphs)
4.1.8 SA Retail: Engen Quick Shop, Shell Select
4.1.9 SA Retail: BP Wild Bean & Pick n Pay Express, Caltex FreshStop

TABLE OF CONTENTS
4.2 South African Cheese Independent Retailer Analysis (4 pages)
4.2.1 SA Independent Retailers: Dalewood Fromage
4.2.2 SA Independent Retailers: Culture Club Cheese
4.2.3 SA Independent Retailers: La Cotte Inn
4.2.4 SA Independent Retailers: Get Stuffed
4.3 Cheese Pricing Analysis (13 pages)
4.3.1 Cheddar and Gouda Cheese (Unprocessed): Bonnita, Clover, Chavignol, Colliers, Continental Collection, Crystal Valley,
Dairybelle, Elite, Emborg, Happy Cow, Healey’s, Karoo, Kerrygold, Ladismith, Lancewood, Old Amsterdam, Parmalat,
Simonsberg, Violife, Wyke.
4.3.2 Cheddar, Gouda and Sweet Milk Cheese (Processed): Clover, DairyBelle, Lancewood, Melrose, Parmalat.
4.3.3 Specialty Cheese : Babybell, Bonnita, Castello, Caprice des Dieux, Cheezly, Clover, Continental Collection, DairyBelle, Emborg,
Fairview, Ile de France, Karoo, Klein River, Indezi, La Montanara, La petite France, Lancewood, La Mont, Mediterranean, Meze,
Parmalat, President, Prestige, Saint Andre, Simonsberg, Zandam.
4.3.4 Cream and Cottage Cheese: Bel, Boursin, Clover, Crystal Valley, Dutch Farm, La Mont, Parmalat, President, Lancewood,
Simonsberg,
4.3.5 Feta Cheese: Crystal Valley, DairyBelle, Darling, Fairview, Karoo, La Mont, Mediterranean, Meze, President, Roulou,
Simonsberg.
Comparative Pricing at Retail Outlets: Checkers, Pick ‘n Pay, Shoprite, Spar, Woolworths Food
14

TABLE OF CONTENTS
5. South African Consumer Trends (6 pages):
5.1 AMPS Survey Methodology & Sample Design
5.2 AMPS Survey Questions Asked
5.3 Cheese Purchasing Trends (Past 4 weeks): 2011-2015 (Graph)
5.4 Cheese Purchasing Trends (Past 4 weeks): 2011-2015 (Table)
5.5 Cheese Volume Trends (Past 4 weeks): 2011-2015 (Graph & Table)
5.6 Most Popular Cheese Types: 2015 (Graph & Table)
15

ORDER FORM
ORDERING INSTRUCTIONS
COMPANY DETAILS
Company Name:
Physical Address:
Town/City: Postal Code:
Country:
Purchaser Name:
(name to appear on invoice)
Purchaser email address:
Telephone number: VAT number:
CONFIRMATION: I/we wish to order this publication (please tick)
Title of Publication Total Ex Vat Tick Box
South African Cheese Landscape Report 2017: Full Report R25,000
South African Cheese Landscape Report 2017: One Section R9,000
ACKNOWLEDGEMENT
I am authorised to order this publication on behalf of the company and agree to the payment
terms.
________________________________
Client (Print Name)
______________________
Signature
______________________________
Capacity
______________
Date
(1.) Complete the order form and email back to [email protected] (2.) An invoice will be
generated and e-mailed (3.) The report will be emailed upon receipt of payment or when proof of payment
has been provided (4.) All prices exclude 14 % VAT.
16

COMPANY OVERVIEW
Insight Survey is a South African B2B market research company with almost 10
years of heritage, focusing on business-to business (B2B) market research to ensure
smarter, more-profitable business decisions are made with reduced investment risk.
We offer B2B market research solutions to help you to successfully improve or
expand your business, enter new markets, launch new products or better understand
your internal or external environment.
17

Our bespoke Competitive Business Intelligence Research can help give you the edge in a global
marketplace, empowering your business to overcome industry challenges quickly and effectively, and enabling you to realise your potential and achieve your vision.
From strategic overviews of your business’s competitive environment through to specific
competitor profiles, our customised Competitive Intelligence Research is designed to meet your
unique needs.
COMPETITIVE INTELLIGENCE
OUR RESEARCH SOLUTIONS
Competitor pricing research
Store visits and store checks
Competitor interviews
Customer interviews
Company website analysis
Governmental held records
18

CONTACT DETAILS
Telephone: +27 (0) 21 045-0202
Physical Address: Unit 5
Building 12
The Estuaries
Century City
Cape Town
Contact: [email protected]
Website: www.insightsurvey.co.za 19