S.A. CAPITAL PARTNERS PRESENTS: Retro...
36
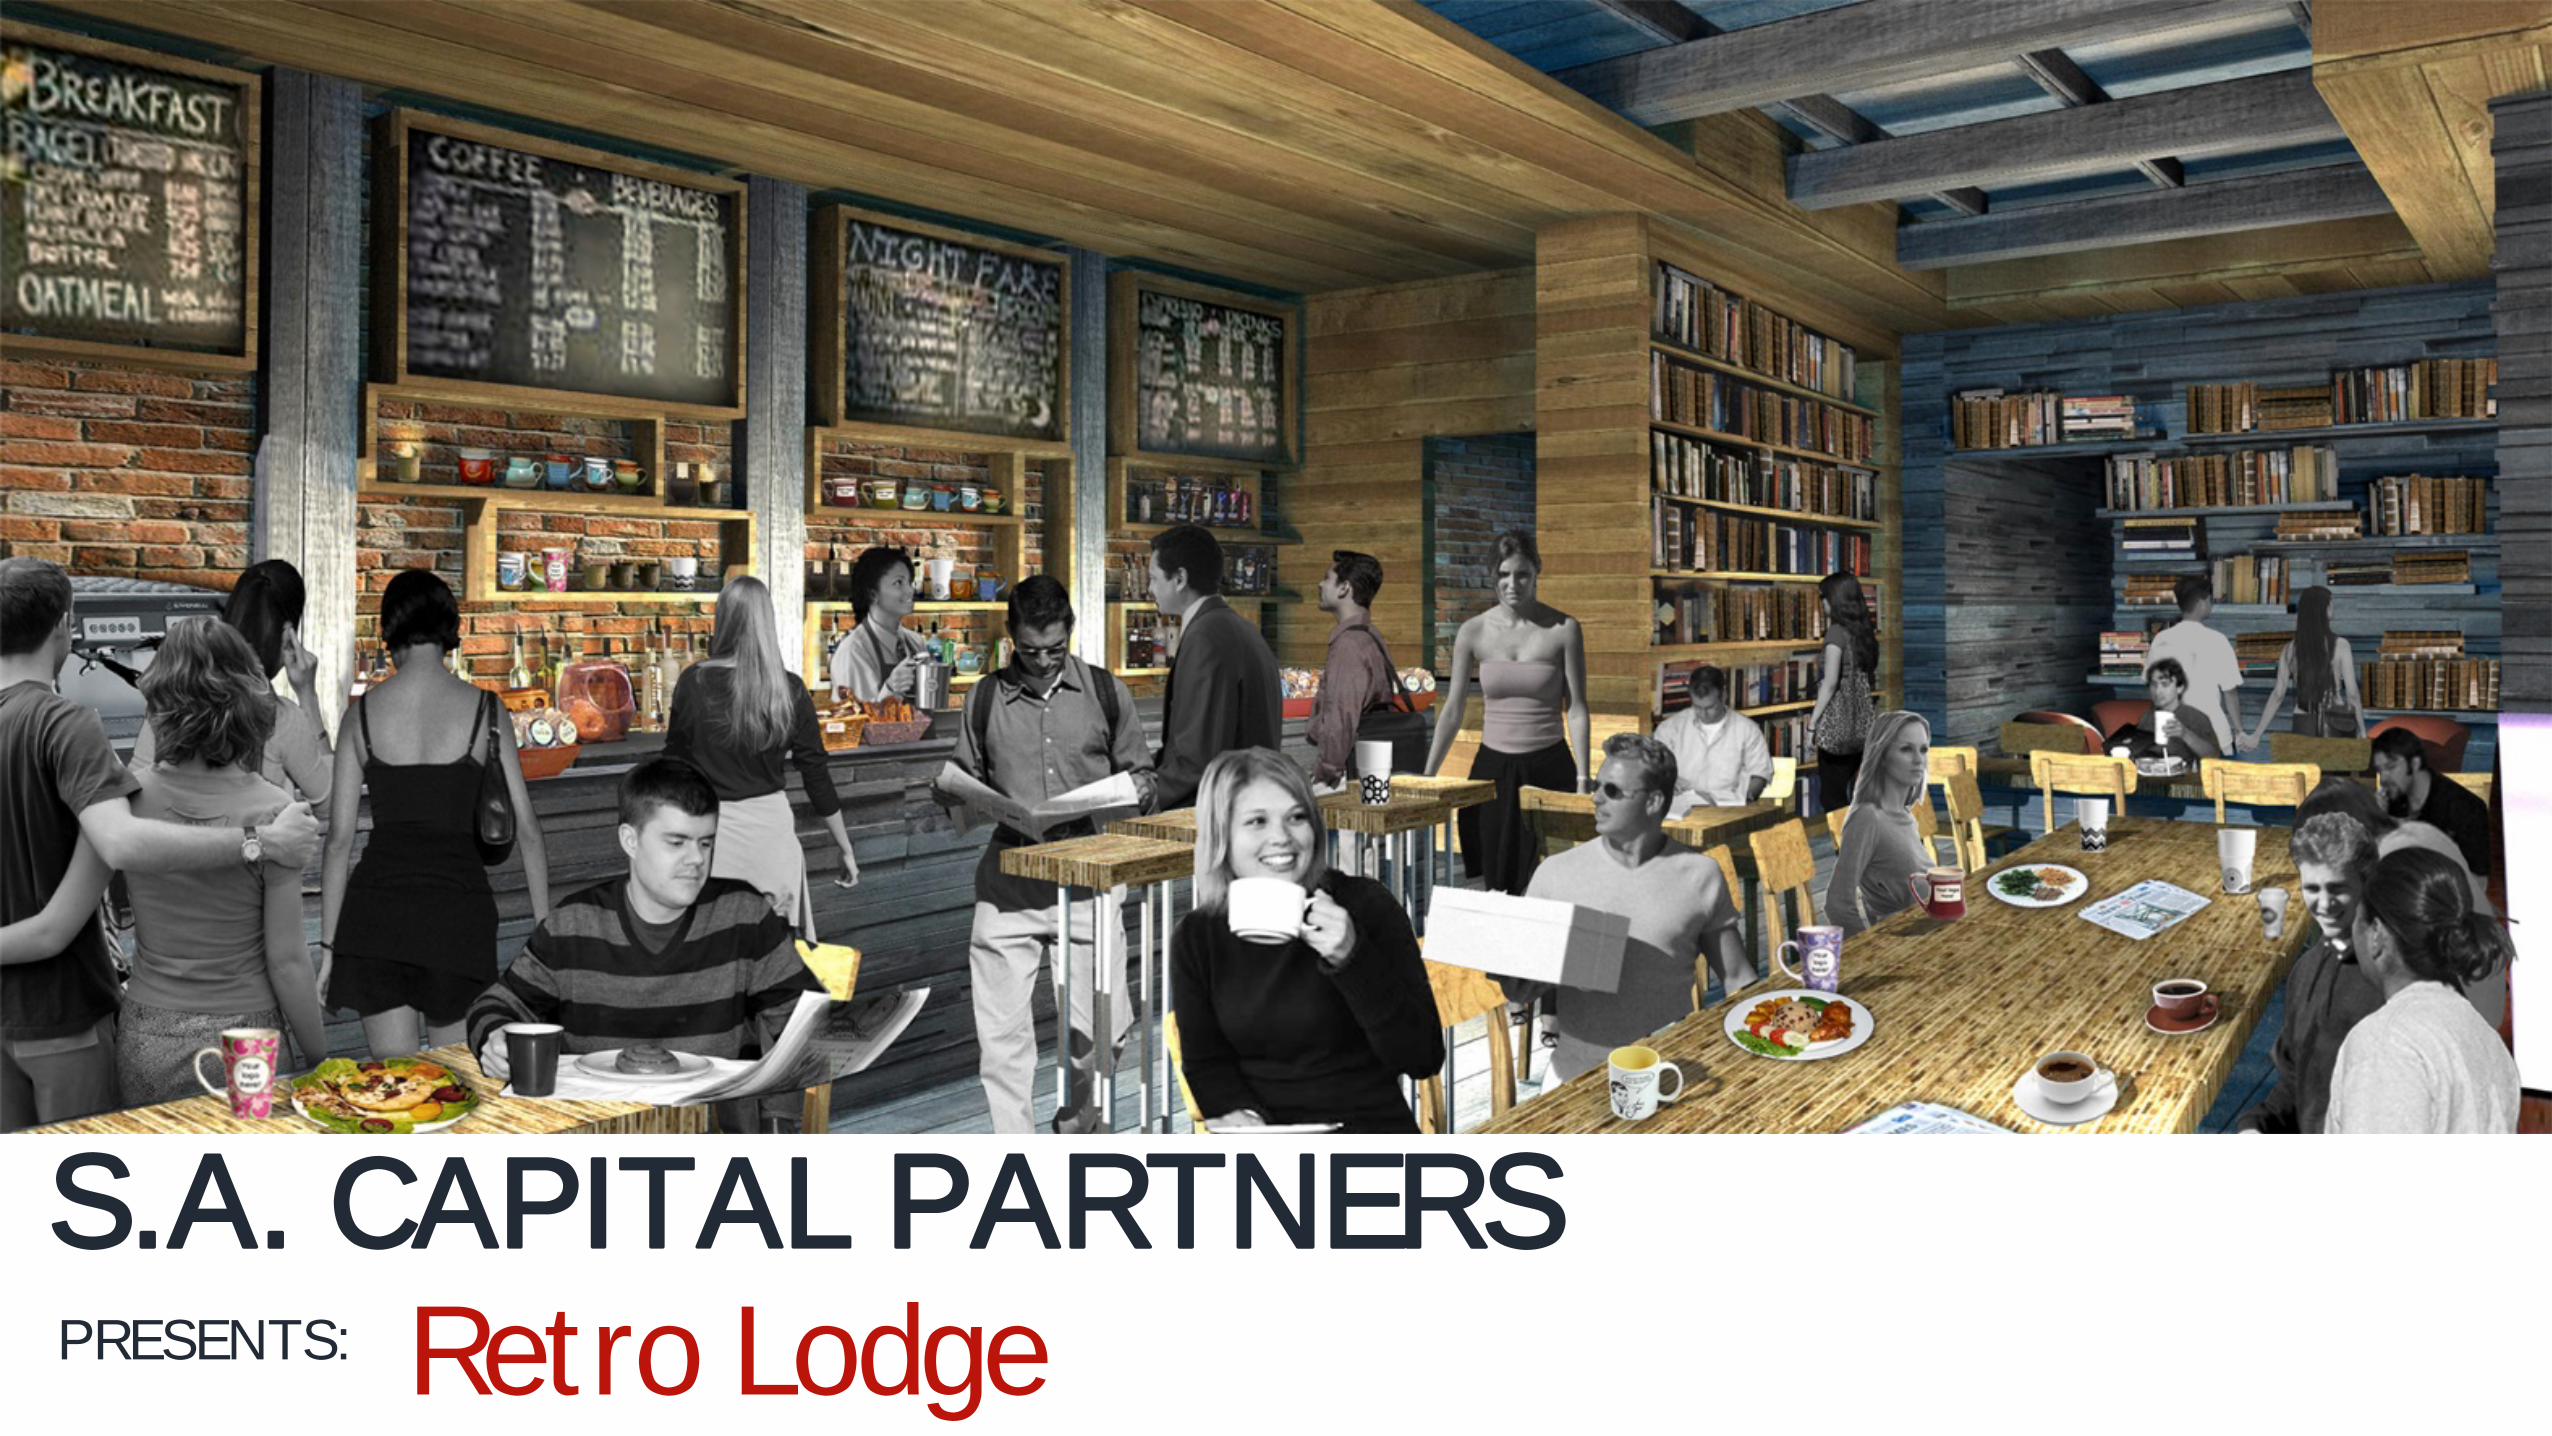
1 S.A. CAPITAL PARTNERS PRESENTS: Ret ro Lodge
Transcript of S.A. CAPITAL PARTNERS PRESENTS: Retro...
1
S.A. CAPITAL PARTNERS PRESENTS: Retro Lodge

2
Alexander Belden Investment Associate
Xenia Hotels
David Moore Summer Associate
Citigroup
Herbert McClary Assistant Vice President
Bank of America Merrill Lynch
Ben Harris Real Estate Manager
Verizon Wireless
MEET THE TEAM
Kyle Smith Acquisitions Officer
US Airforce
David Oppenheimer Vice President of Operations
Intercounty Judicial Sales Corp
3
AGENDA
Company Concept
Site Criteria
Terms
Hostel Market Dynamics
Pro Forma
4
COMPANY CONCEPT Concept: To build a ‘Poshtel’ that integrates modern design with local aesthetics, creating a vibrant atmosphere for social interaction and travel sharing experiences among youth travelers between the ages of 18 and 34. Poshtel: The term ‘poshtel’ is the blend of ‘posh’ and ‘hostel’ and is usually defined as an upscale or luxury hostel which combines the style and comfort of a boutique hotel with the price and sensibilities of a hostel. CHARACTERISTICS: - Prime Location - Large Social Areas - Frequent Events - Combination of private rooms and dorm rooms - En-suite private bathrooms and female-only dormitories - Modern design encompassing local area

5
HOSTEL MARKET DYNAMICS
6
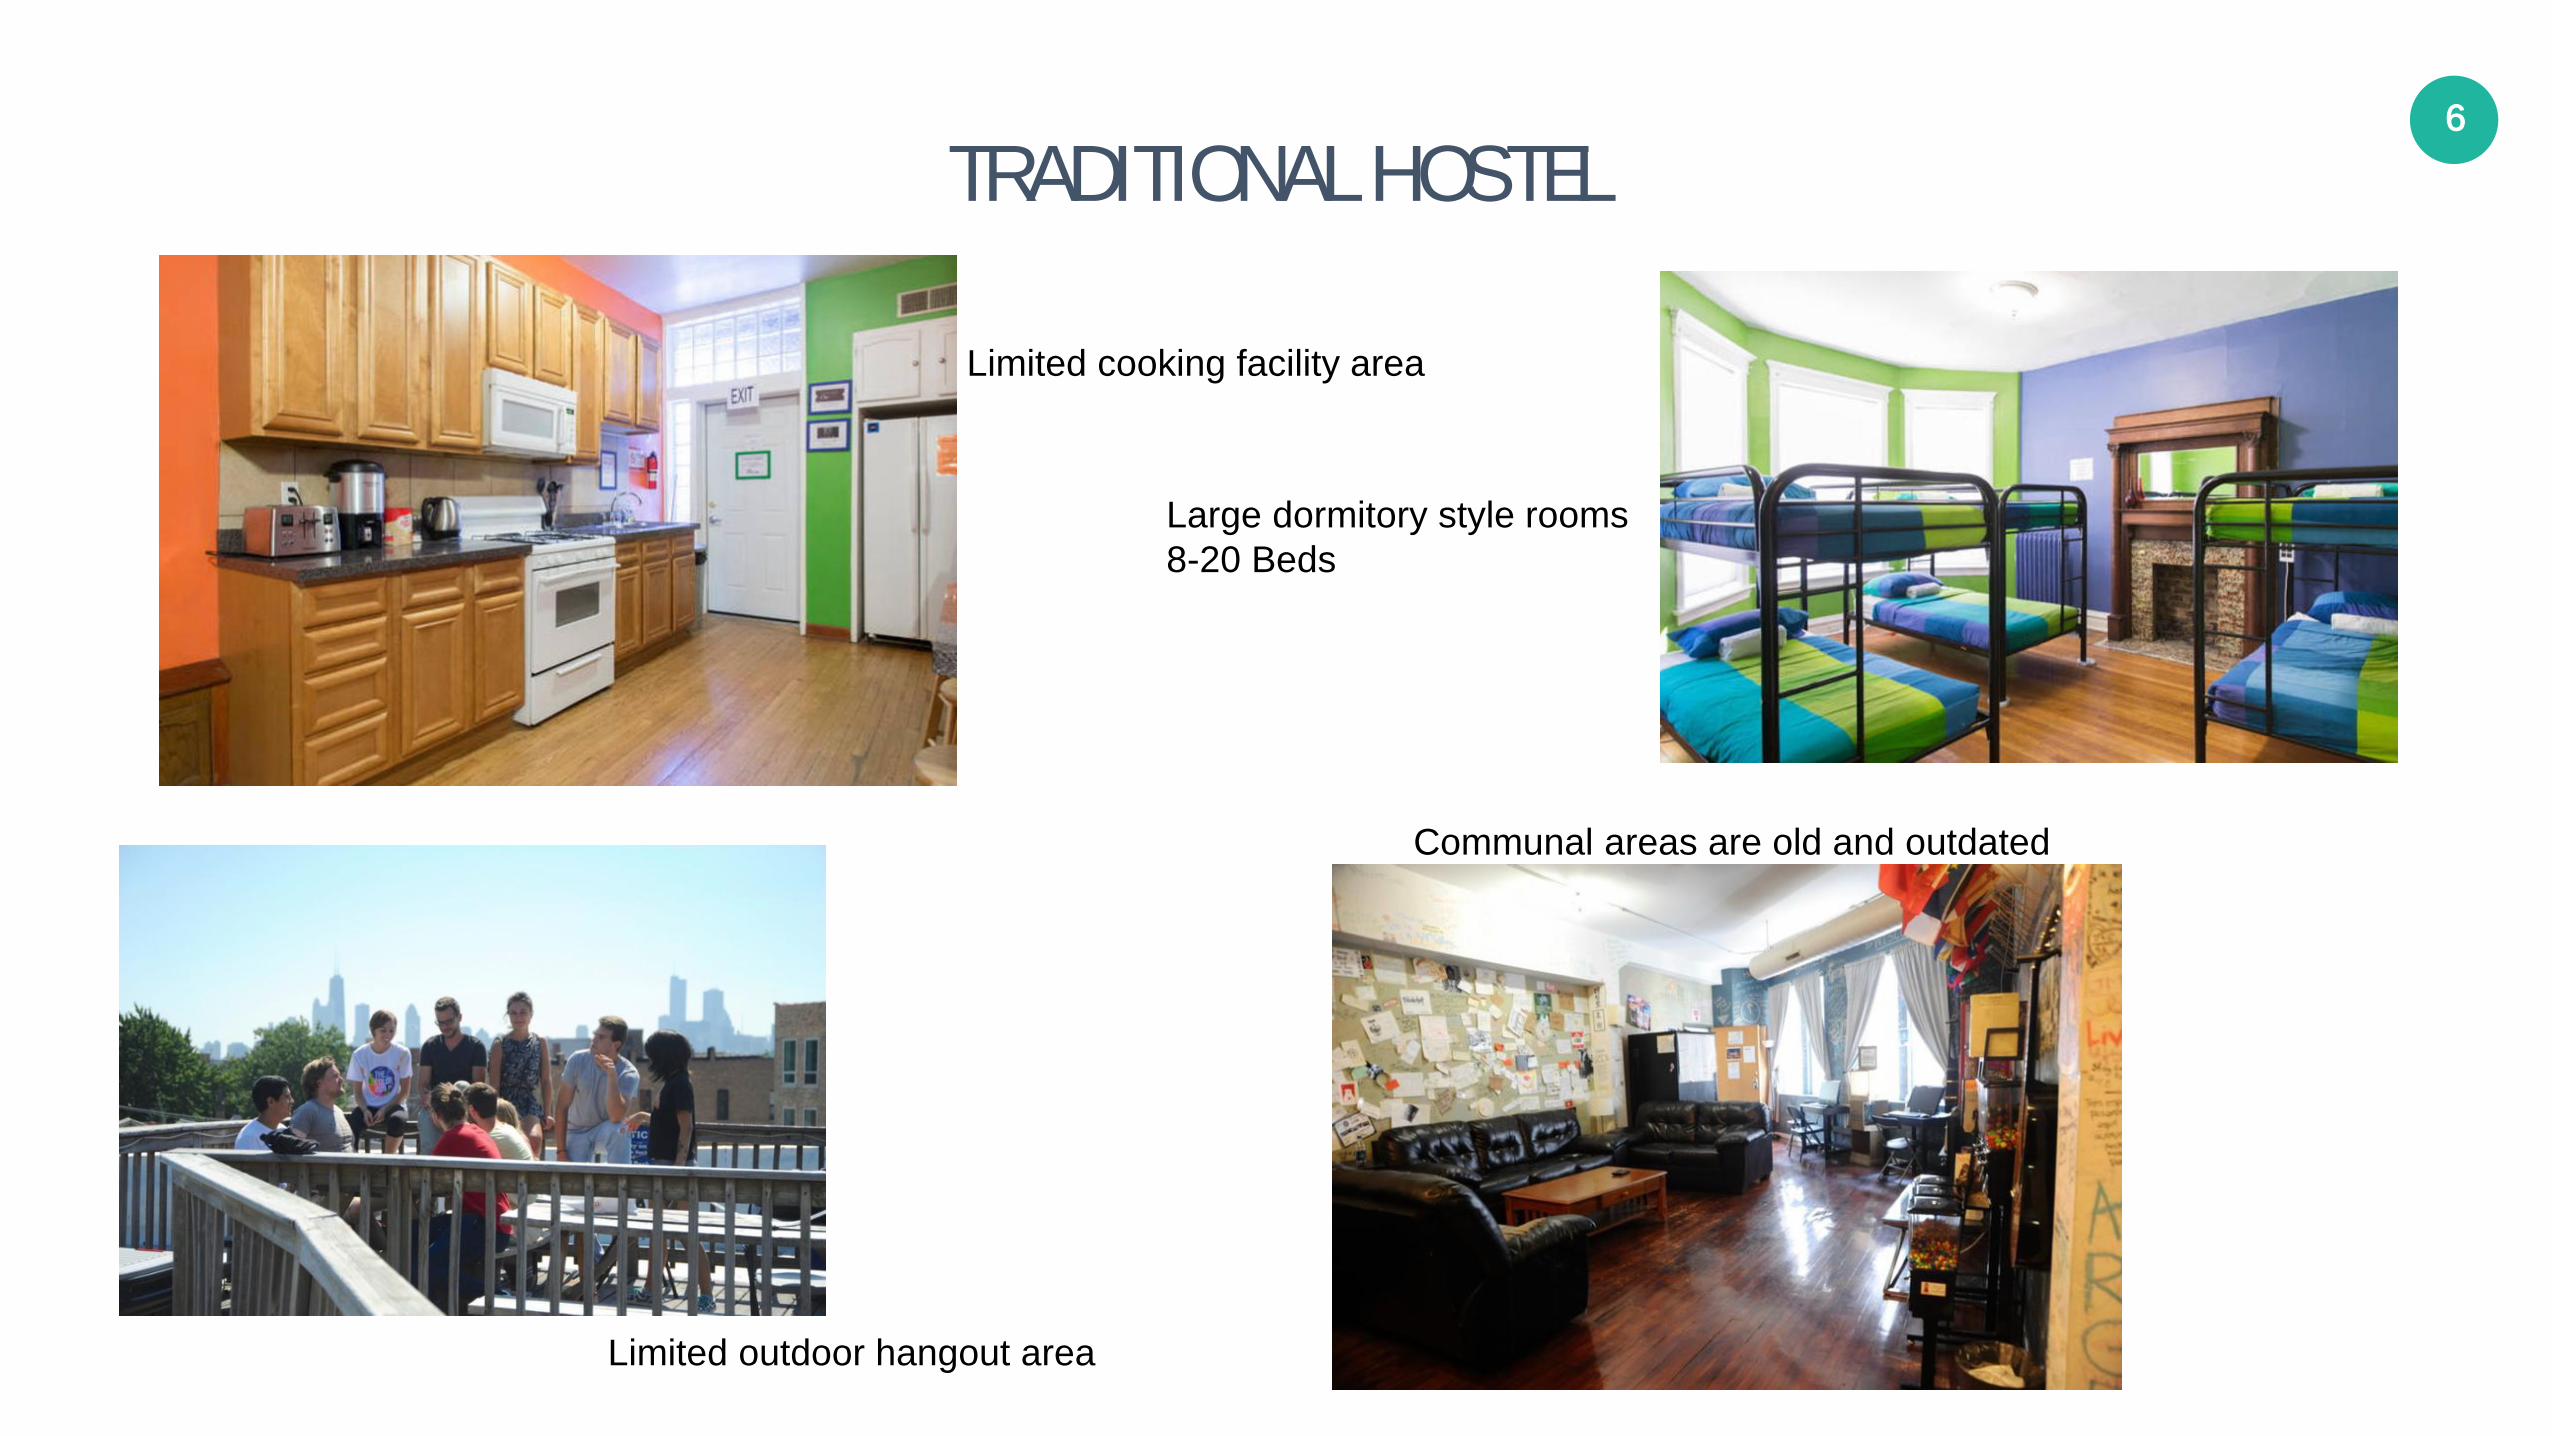
TRADITIONAL HOSTEL
Limited cooking facility area
Large dormitory style rooms 8-20 Beds
Communal areas are old and outdated
Limited outdoor hangout area

7
POSHTEL VISION Shared 4 Bed Dorm Freeman Chicago, IL
Large Gathering Area The Bivvi Breckenridge, CO
Shared Kitchen Wayfarer Santa Barbara, CA
Lounge Area Freeman Miami, FL
8
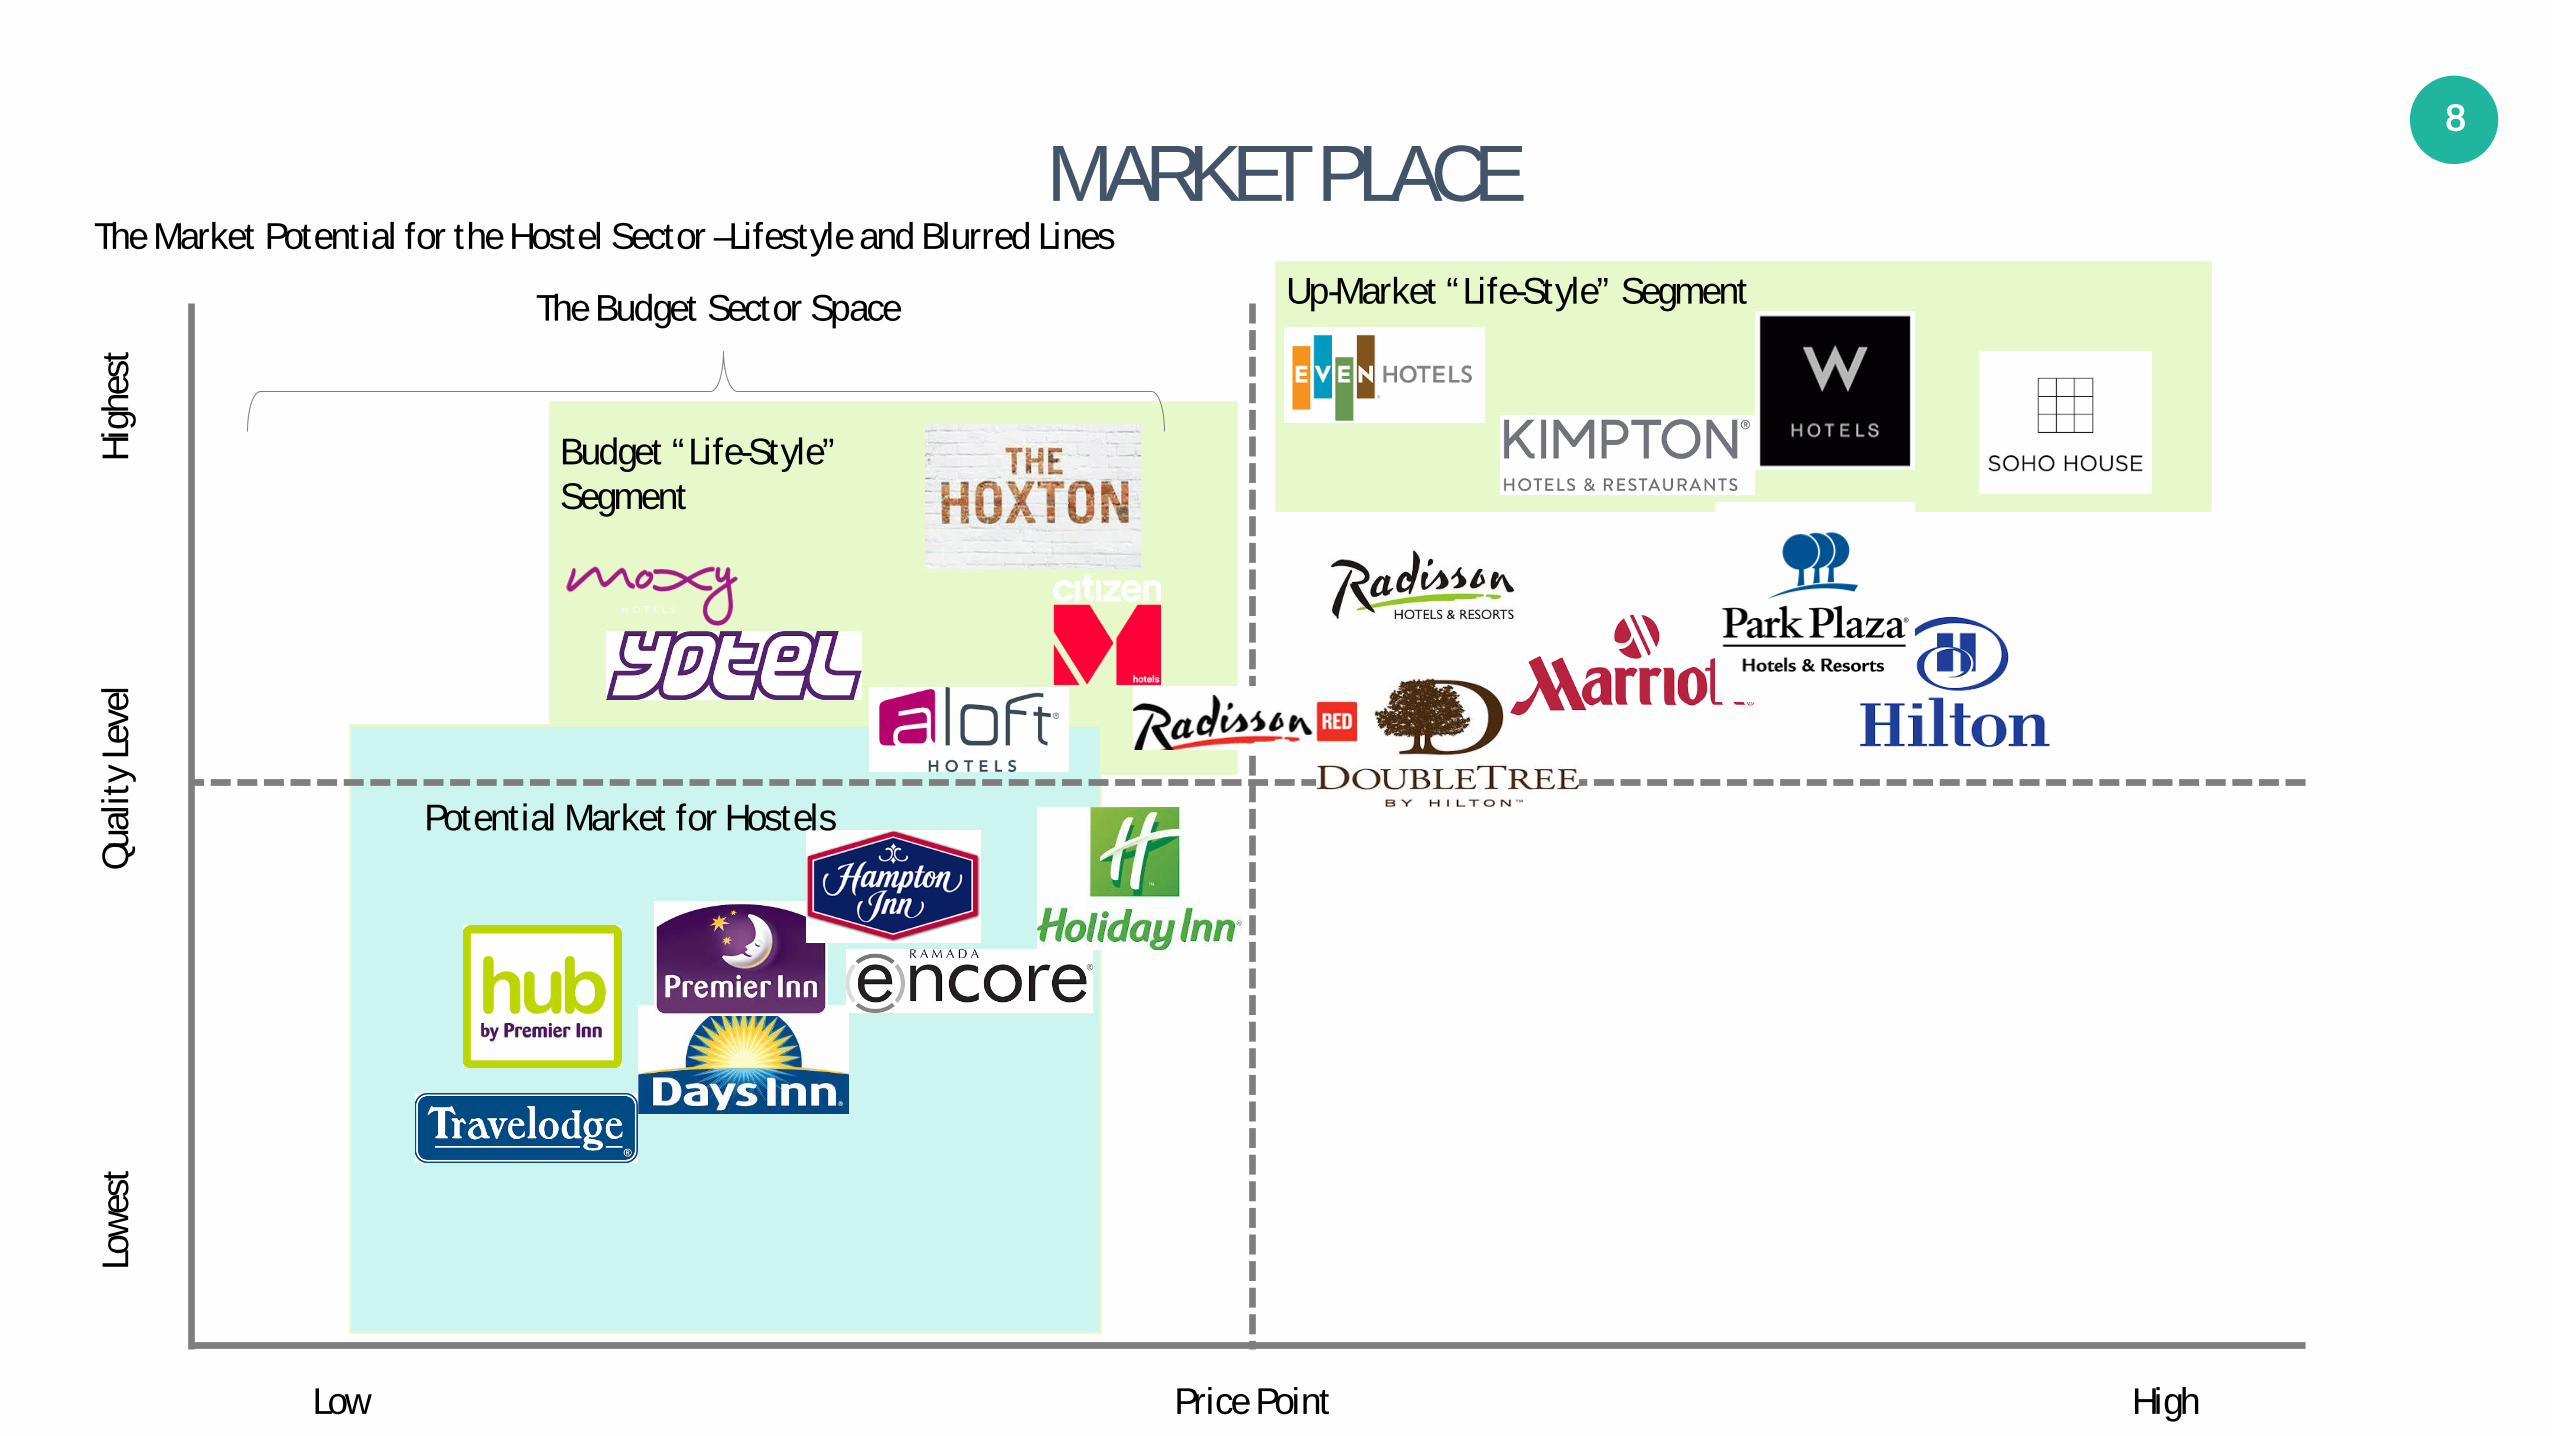
MARKET PLACE
Low Price Point High
Lowe
st
High
est
Qual
ity Le
vel
The Budget Sector Space
Budget “Life-Style” Segment
The Market Potential for the Hostel Sector – Lifestyle and Blurred Lines Up-Market “Life-Style” Segment
Potential Market for Hostels

9
HOSTEL SUPPLY
Global Service Accommodation
Supply Est. 500,000 Properties
Global Budget Sector Related
Service Accommodation
Supply Est. 150,000 Properties
Global Hostel Sector Supply
Est. 7,000 Properties
US Hostel Sector
Supply Est. 350
Properties
Hostels account for less than 5% of global budget sector-related accommodation supply.
Hostels account for less than 1.5% of global serviced accommodation supply.
Chicago Hostel Supply 11 properties
*Statistics provided by api.hotelbase.org (2013 data)
10
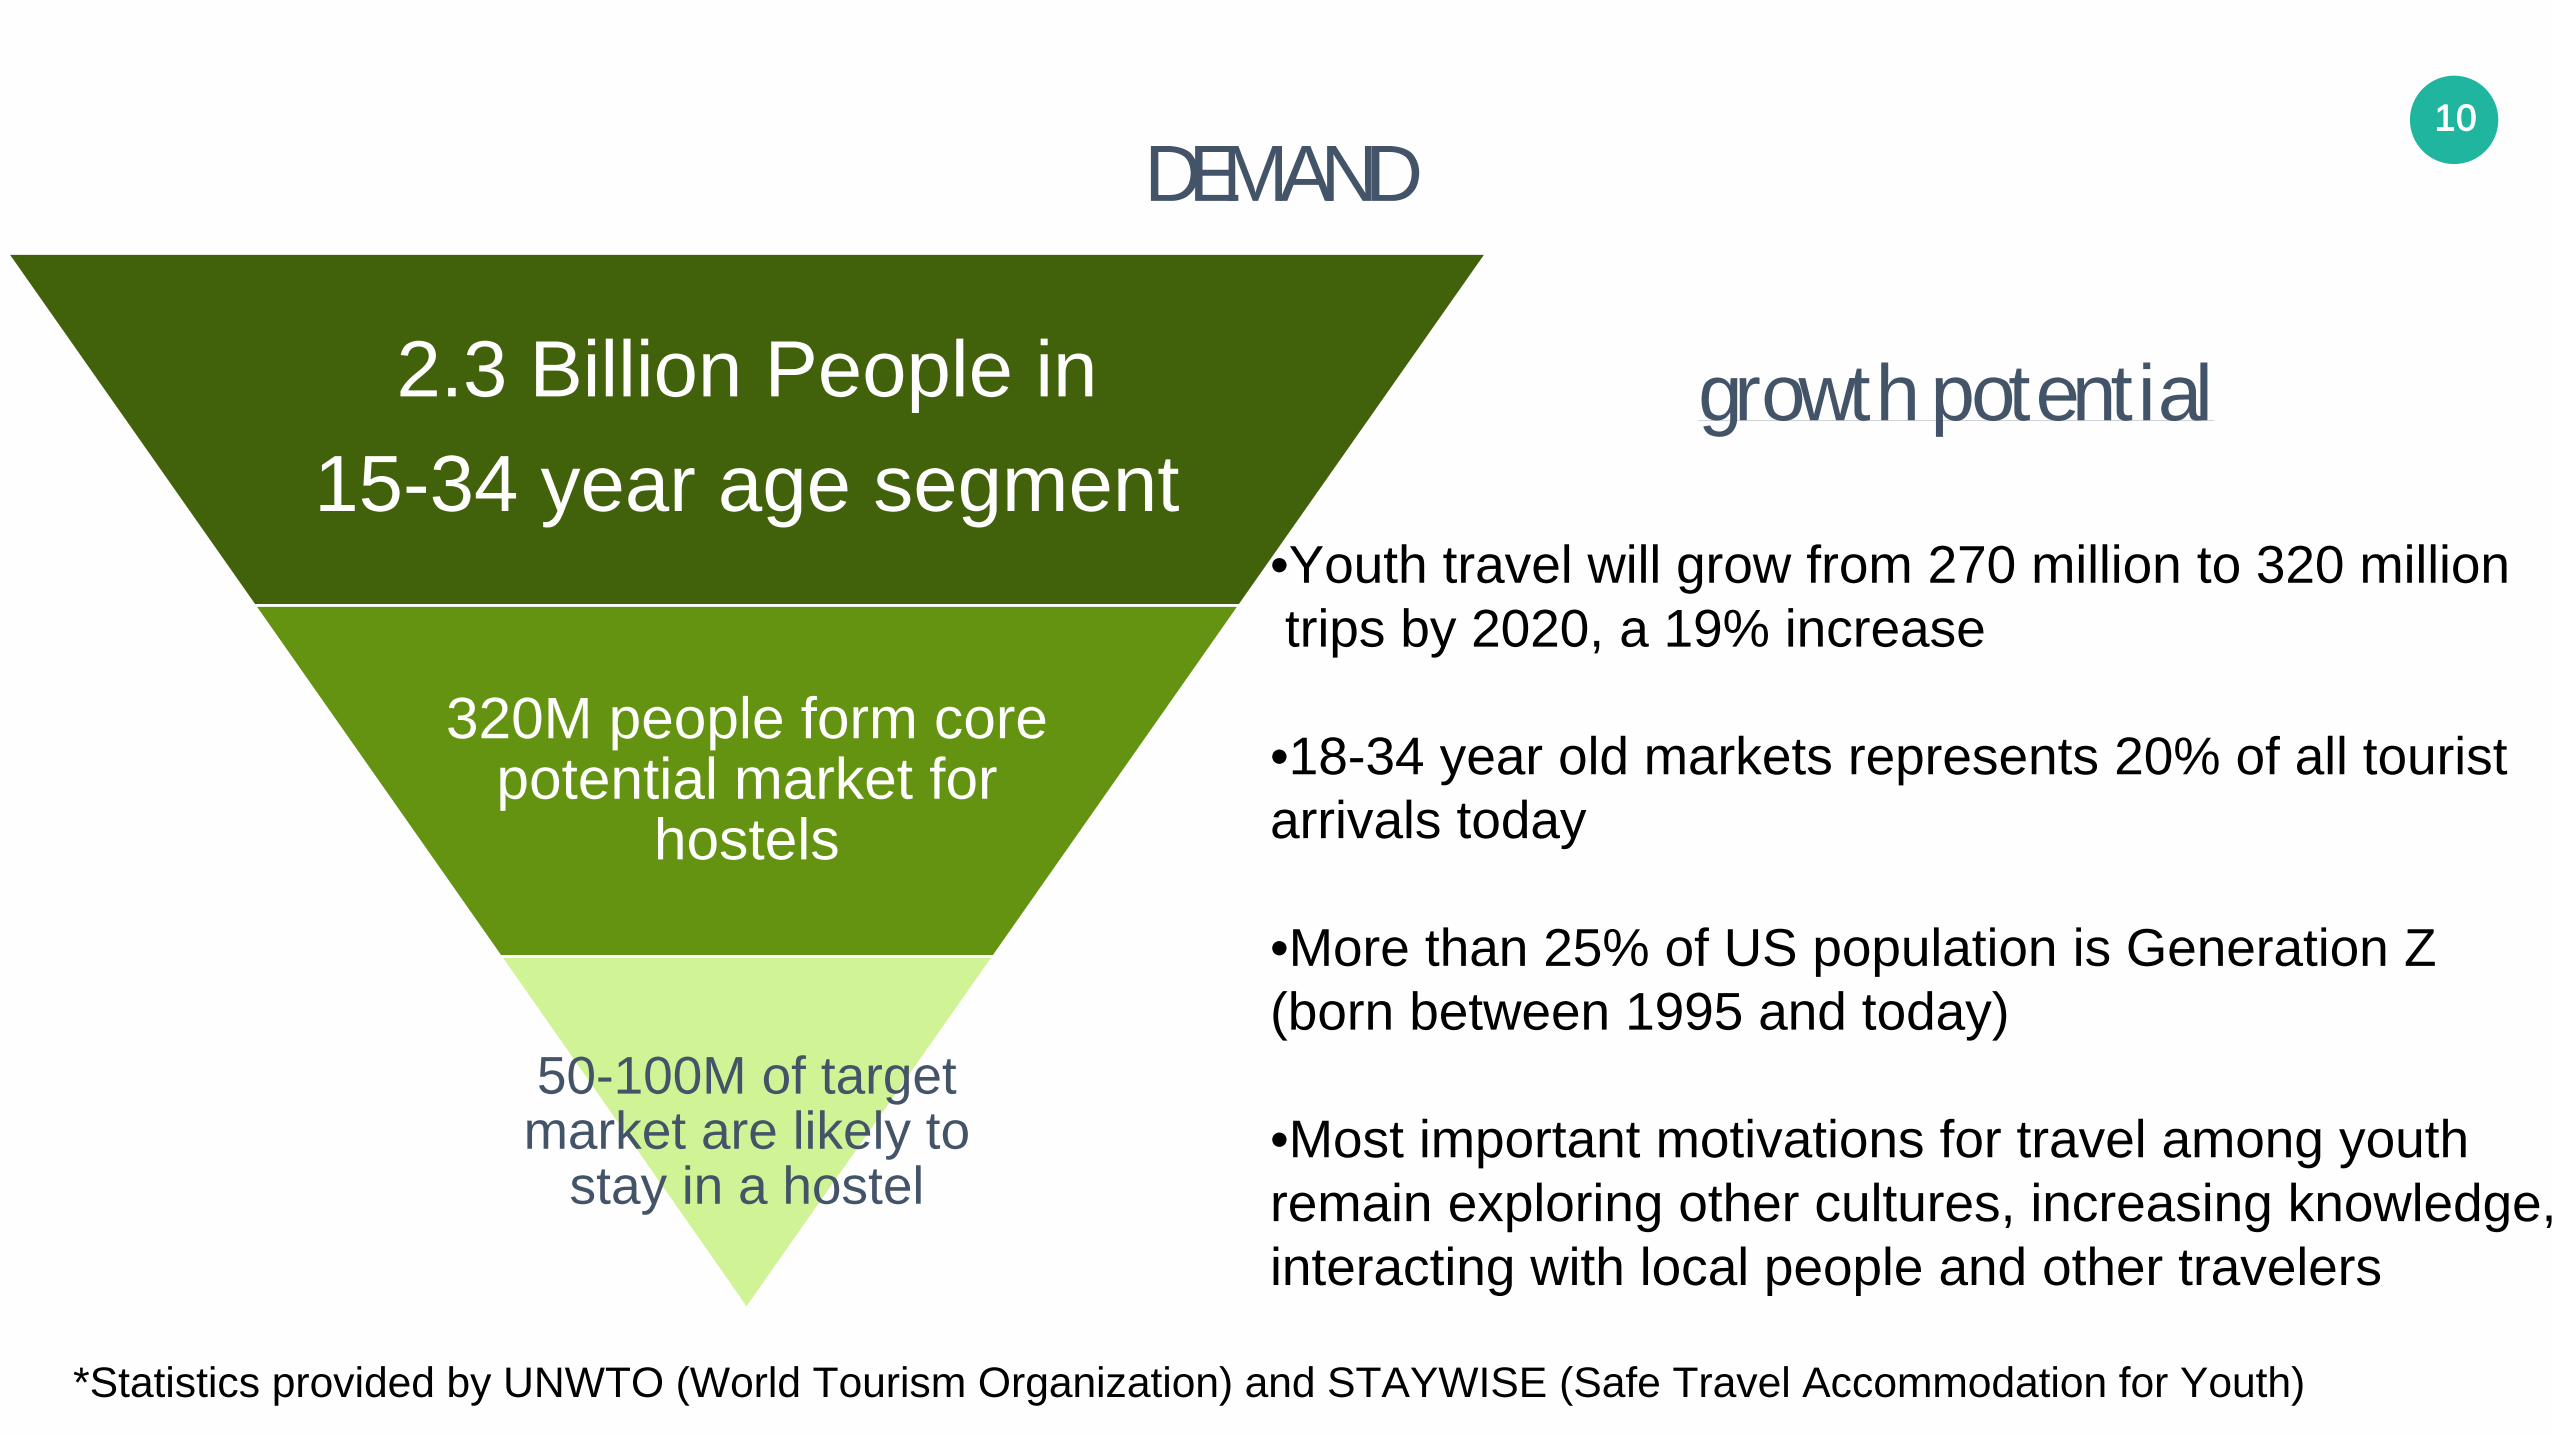
DEMAND
2.3 Billion People in 15-34 year age segment
320M people form core potential market for
hostels
50-100M of target market are likely to
stay in a hostel
*Statistics provided by UNWTO (World Tourism Organization) and STAYWISE (Safe Travel Accommodation for Youth)
growth potential
•Youth travel will grow from 270 million to 320 million trips by 2020, a 19% increase
•18-34 year old markets represents 20% of all tourist arrivals today •More than 25% of US population is Generation Z (born between 1995 and today) •Most important motivations for travel among youth remain exploring other cultures, increasing knowledge, interacting with local people and other travelers
11
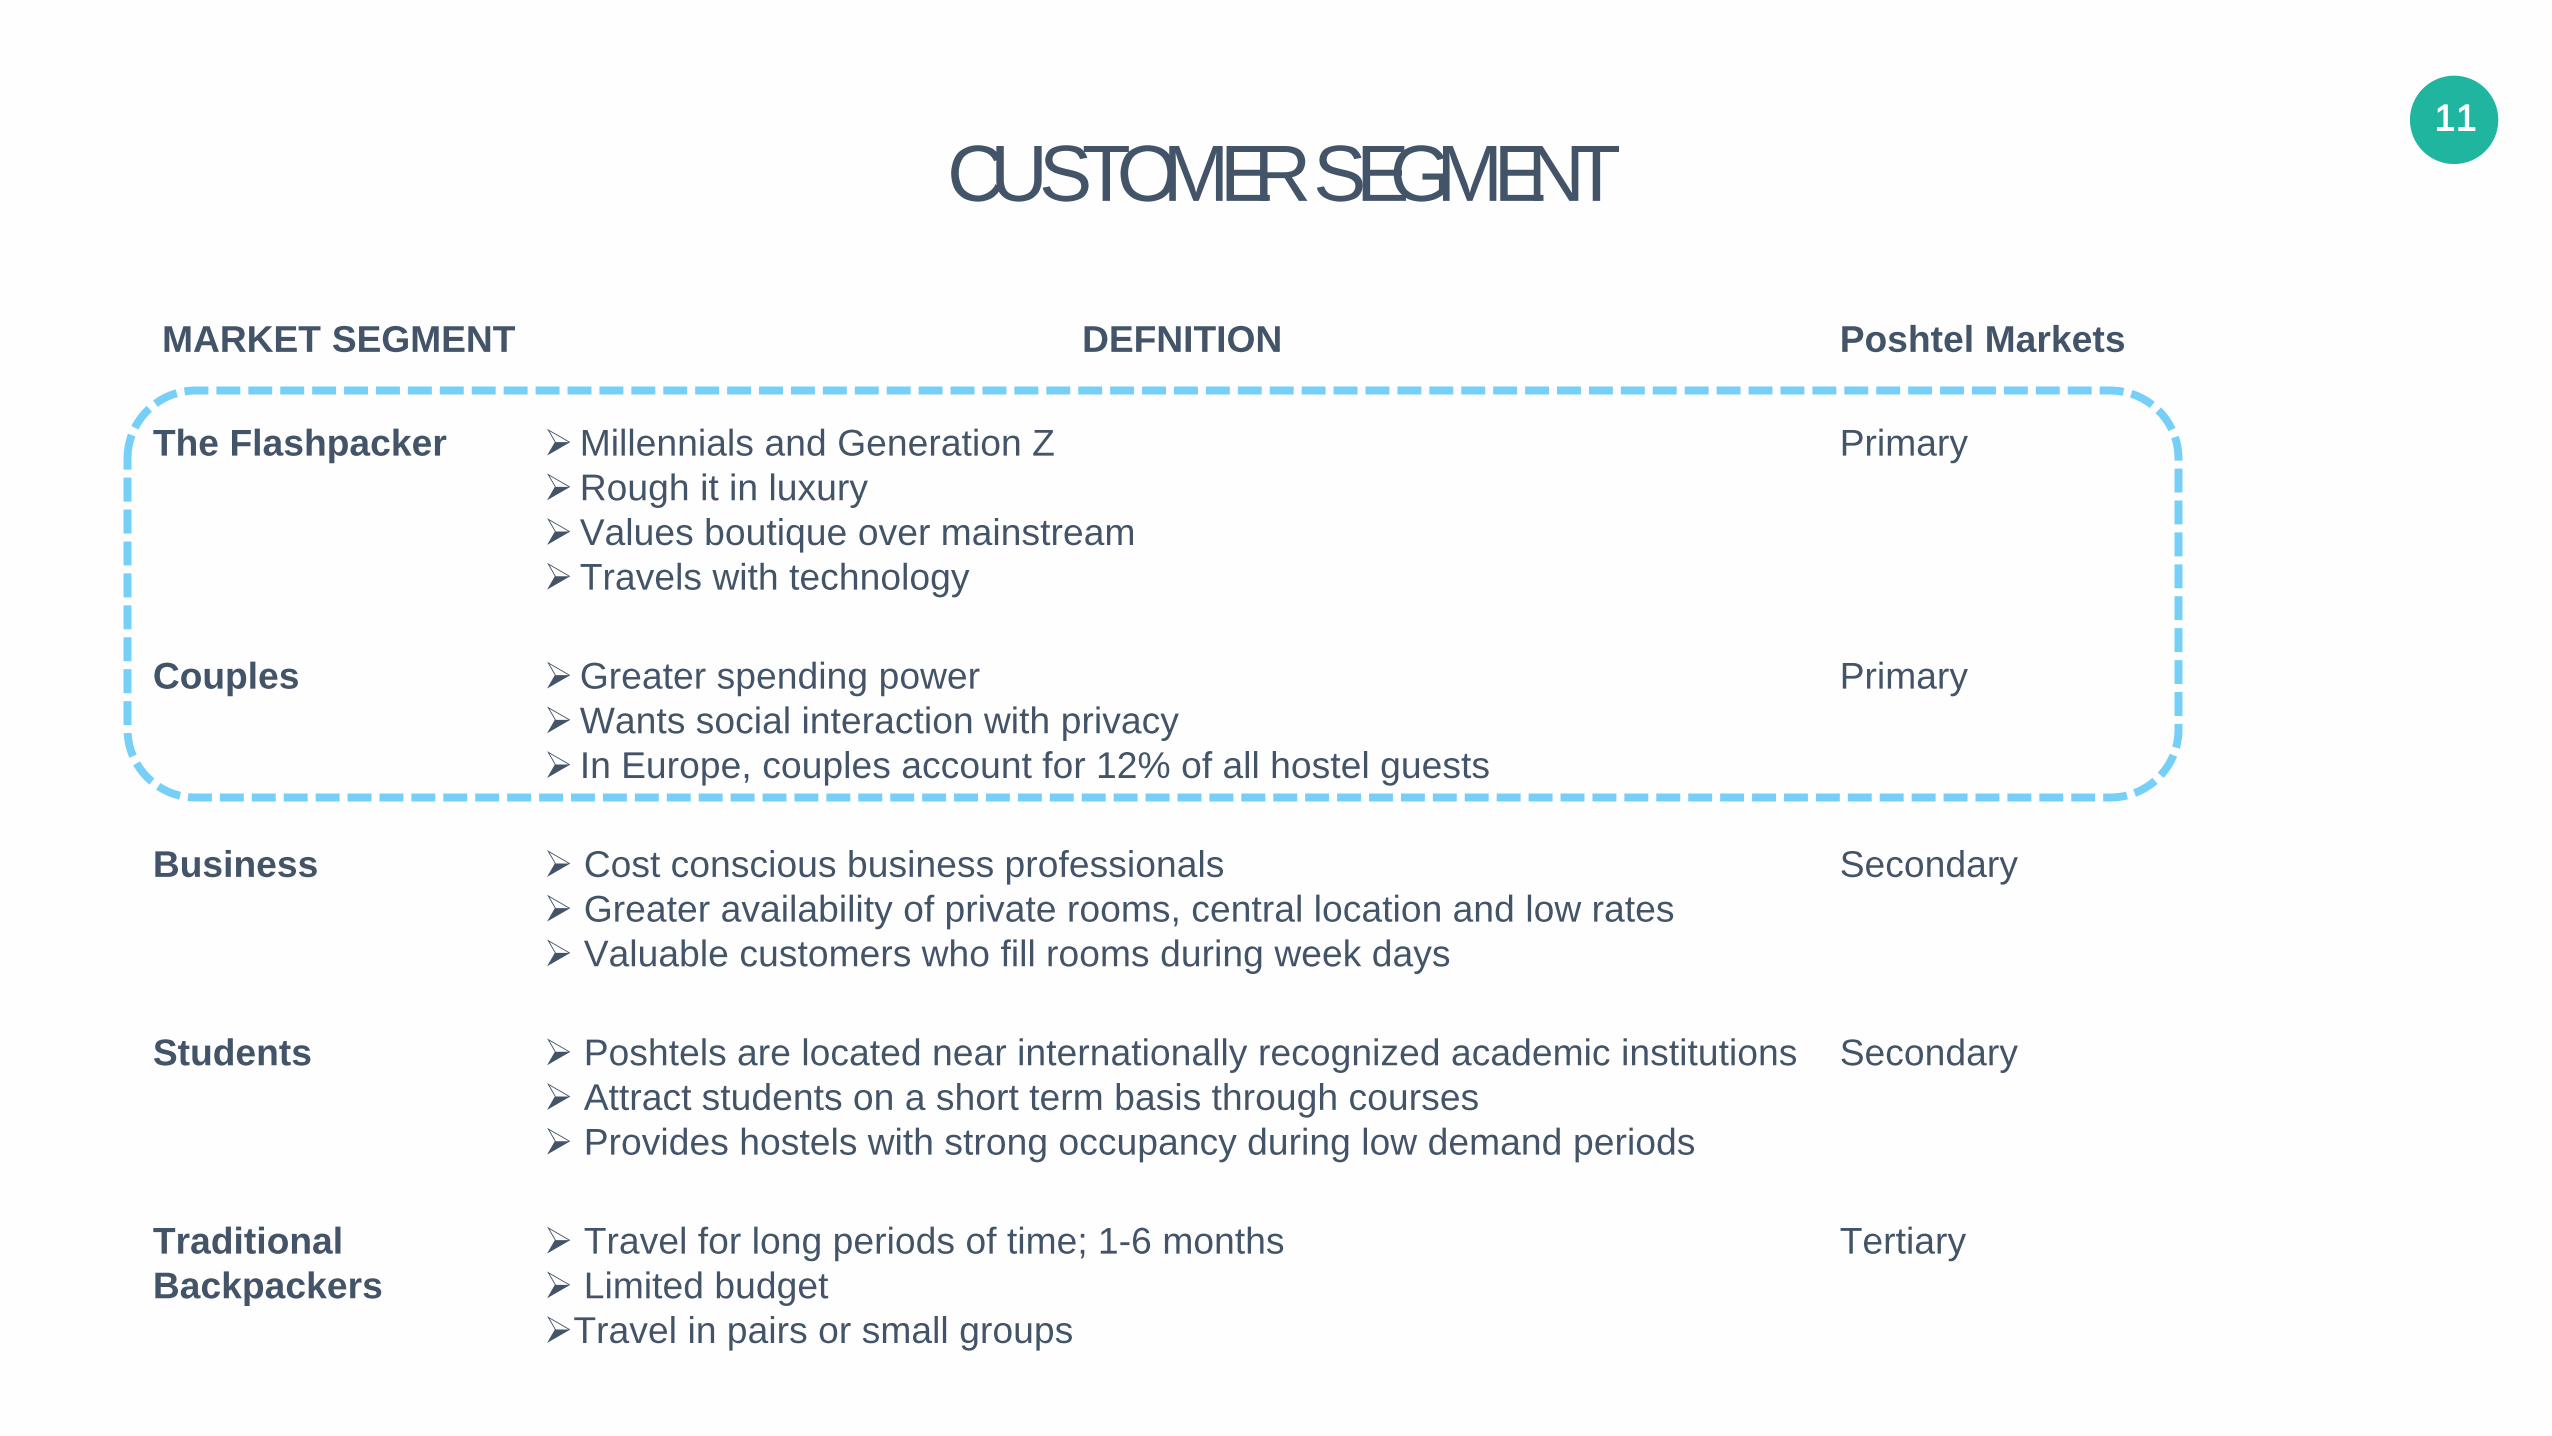
CUSTOMER SEGMENT
MARKET SEGMENT DEFNITION Poshtel Markets
The Flashpacker Millennials and Generation Z Rough it in luxury Values boutique over mainstream Travels with technology
Primary
Couples Greater spending power Wants social interaction with privacy In Europe, couples account for 12% of all hostel guests
Primary
Business Cost conscious business professionals Greater availability of private rooms, central location and low rates Valuable customers who fill rooms during week days
Secondary
Students Poshtels are located near internationally recognized academic institutions Attract students on a short term basis through courses Provides hostels with strong occupancy during low demand periods
Secondary
Traditional Backpackers
Travel for long periods of time; 1-6 months Limited budget Travel in pairs or small groups
Tertiary

12
CONSUMER SEGMENTATION
Changing Consumer Landscape in the Hostel
Environment
Different Spending Power - Rise of the Flashpacker
International Profile – Demand for Non-Traditional Locations
- US experienced a boost for travel destinations by choice
Travel Habits Differ -The growth of budget airlines
Consumers More Emotional & Redefining Loyalty
Technology Savvy, with Different Booking Habits -Social media, online booking agents,
mobile apps are channels used by 18-34 year olds to book rooms
--New ways to market hostel

13
COMPETITOR ANALYSIS # of Hostels Locations Description
4 San Diego, Downtown San Diego, Oceanside San Francisco Hollywood
3
55
4
3
Focuses on organized activities. In 2013, USAHostels was awarded best hostel chain in the world by Hostelworld. Selling point is guest engaging activities.
Miami Chicago New York City Los Angeles
Part of Sydell Group. Focused on high-end luxury hostels.
In 20 States across The US
Focused on the conventional style hostel. Budget conscious and focused on providing guest activities.
New York City – 2 Miami
Modern hip hostels, but does not fall in the “luxury category.”
Chicago - 3 Has a mixture of high-end and luxury hostels in Chicago. Looking to open new locations in Wrigleyville, Nashville, and Atlanta
14
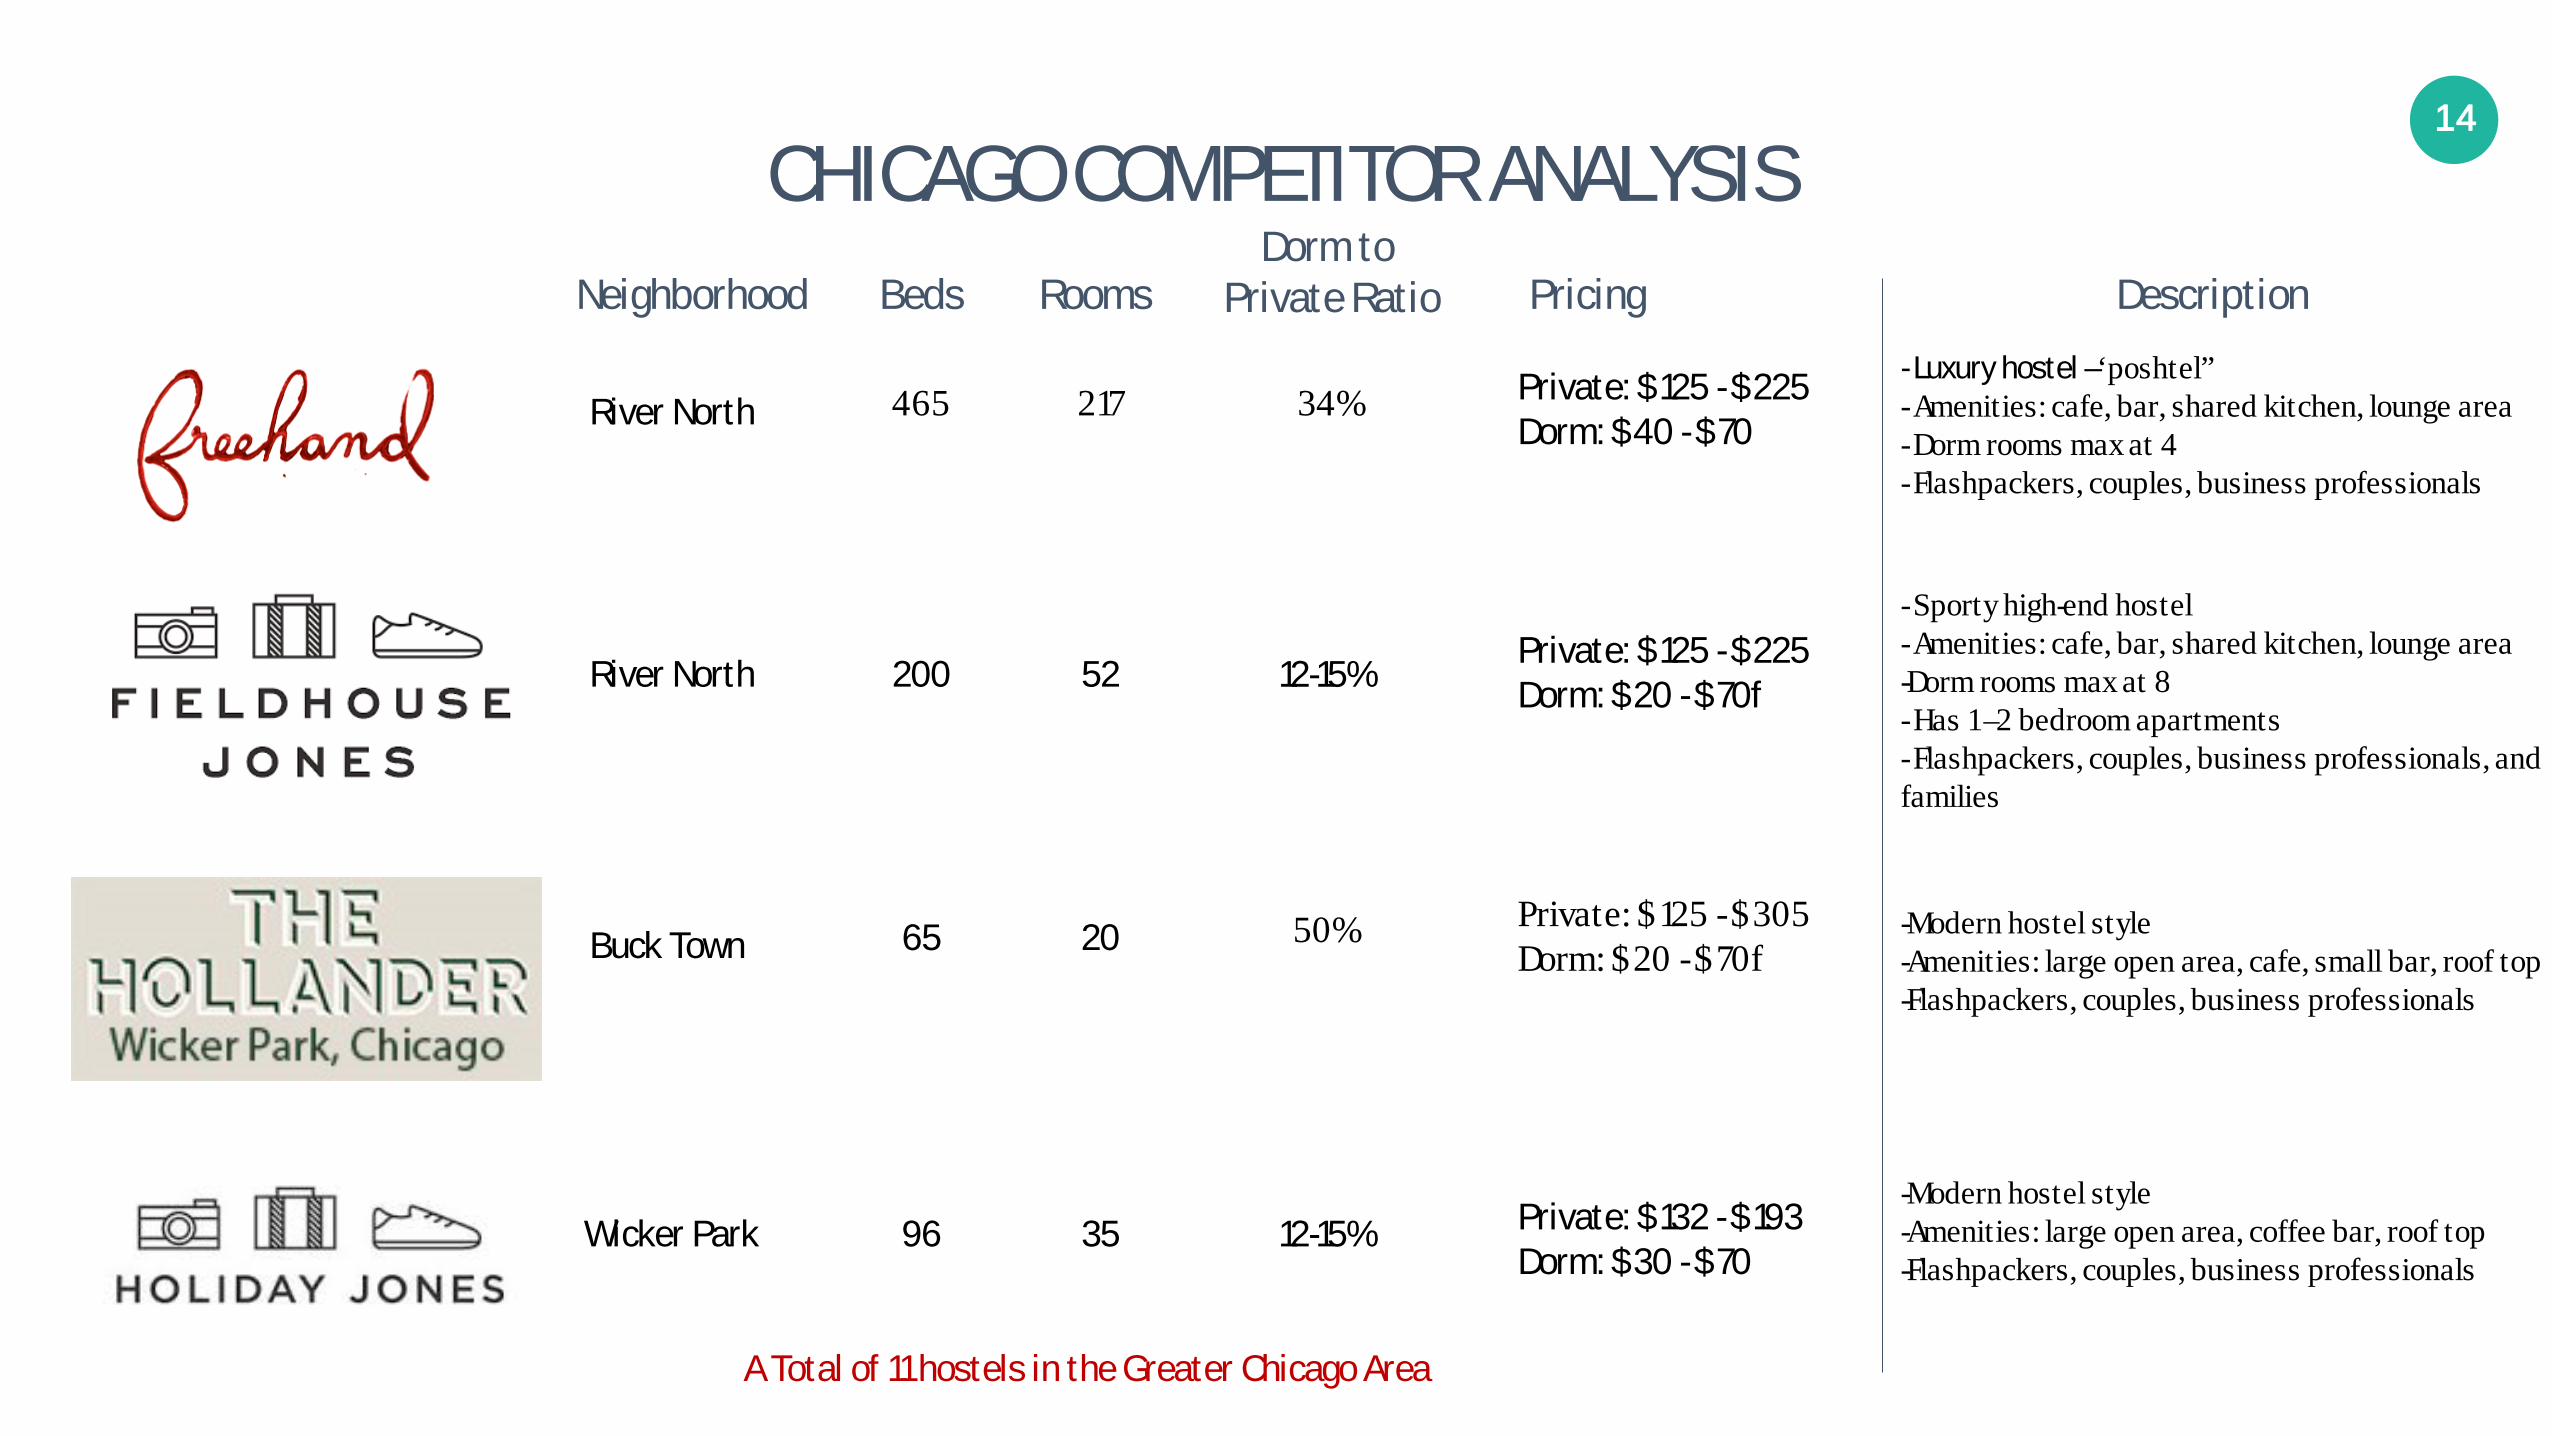
CHICAGO COMPETITOR ANALYSIS Neighborhood Beds Rooms
Dorm to Private Ratio
River North
River North
Buck Town
Wicker Park
52
65
35 96 12-15%
12-15%
Pricing
20
200
Private: $125 - $225 Dorm: $40 - $70
Private: $132 - $193 Dorm: $30 - $70
A Total of 11 hostels in the Greater Chicago Area
Description
Private: $125 - $225 Dorm: $20 - $70f
- Luxury hostel – ‘poshtel” - Amenities: cafe, bar, shared kitchen, lounge area - Dorm rooms max at 4 - Flashpackers, couples, business professionals
- Sporty high-end hostel - Amenities: cafe, bar, shared kitchen, lounge area -Dorm rooms max at 8 - Has 1 – 2 bedroom apartments - Flashpackers, couples, business professionals, and families
-Modern hostel style -Amenities: large open area, cafe, small bar, roof top -Flashpackers, couples, business professionals
-Modern hostel style -Amenities: large open area, coffee bar, roof top -Flashpackers, couples, business professionals
465 217 34%
50% Private: $125 - $305 Dorm: $20 - $70f
15
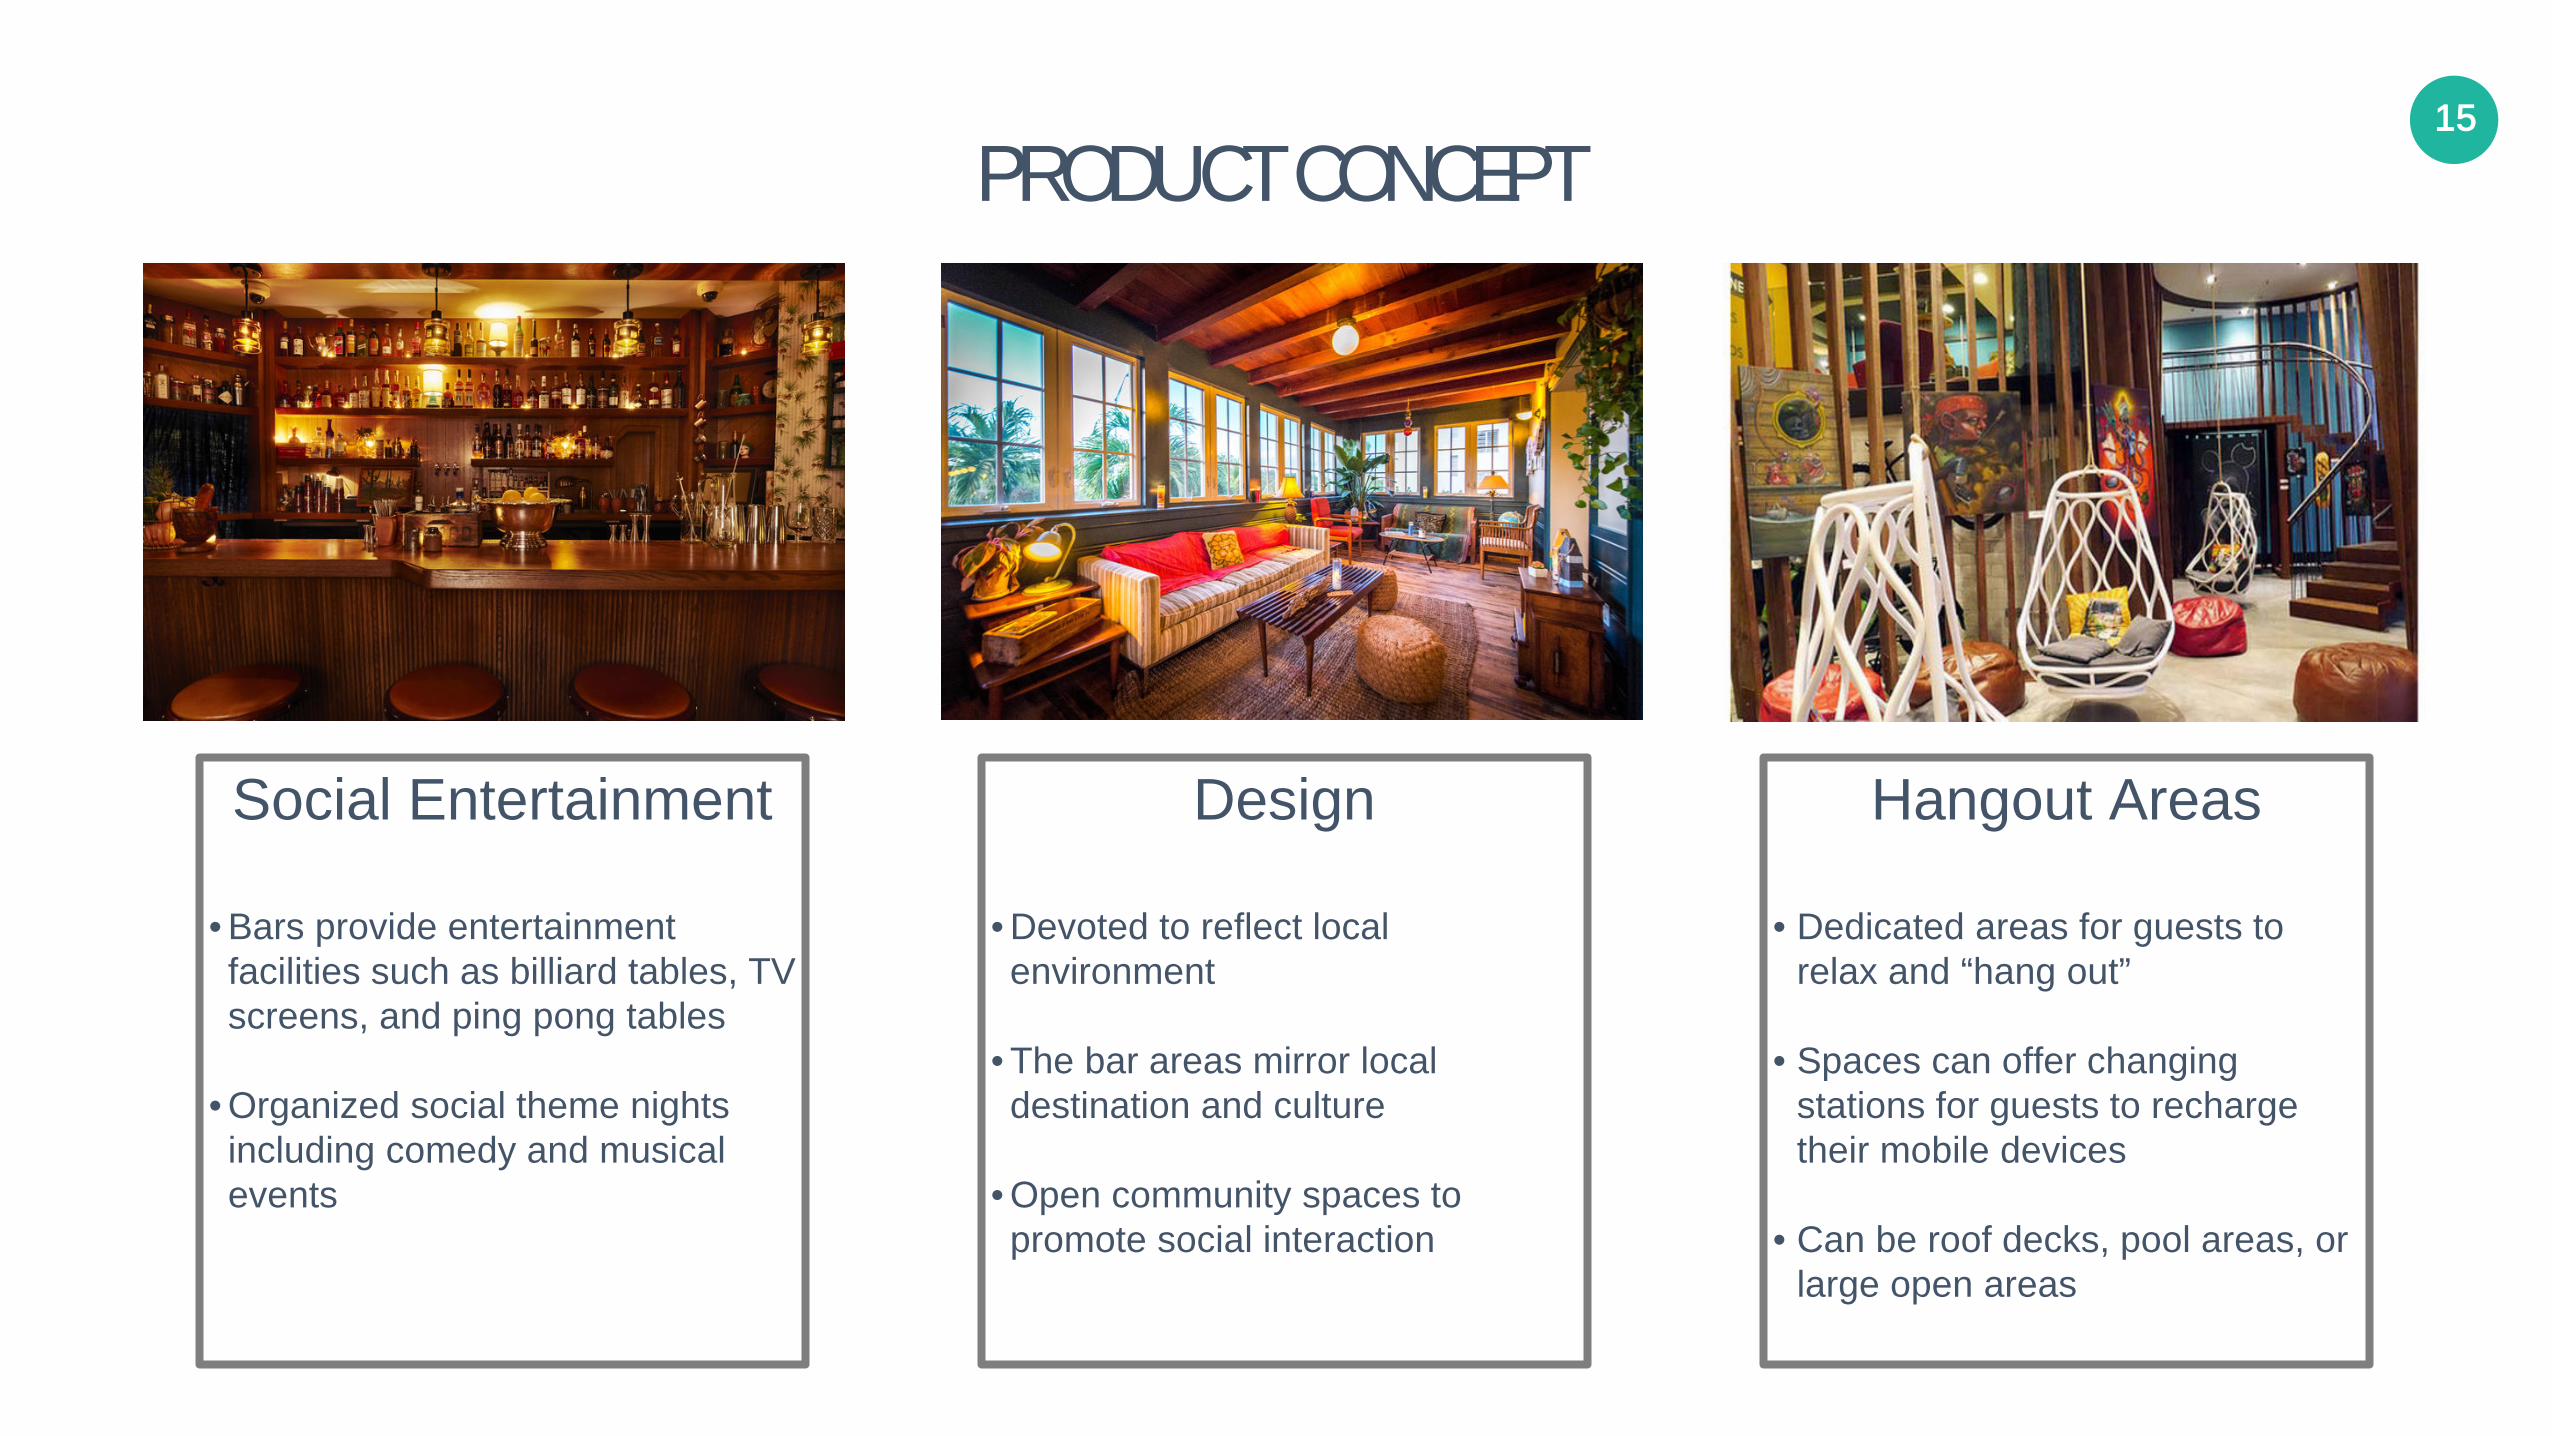
PRODUCT CONCEPT
Social Entertainment
• Bars provide entertainment facilities such as billiard tables, TV screens, and ping pong tables
• Organized social theme nights including comedy and musical events
Design
• Devoted to reflect local environment
• The bar areas mirror local destination and culture
• Open community spaces to promote social interaction
Hangout Areas
• Dedicated areas for guests to relax and “hang out”
• Spaces can offer changing stations for guests to recharge their mobile devices
• Can be roof decks, pool areas, or large open areas

16
PRODUCT CONCEPT

17
PRODUCT CONCEPT
Lower Requirement for FF&E in Rooms/Dorms
Per Bed Development Out Flexes Per Room Development
Larger Public Areas
Tailoring to Licensing and Accommodation Laws, and Planning
Requirements
Focus is on social engagement in the hostel, significantly reducing in-room entertainment costs such as expensive multimedia products
Hostel format is focused on “per bed” basis, allowing flexible format for development
Larger “public zones” to create social environment, providing flexibility in day time and night-time activities
Greater flexibility in hostel development and operational model can allow hostels to access sites more readily in locations that are not seen commercially viable for budget hotels
Tailoring Development to Maximize Opportunity
Flexible room design and layout fosters ability to build the correct mix of room and bed categories to maximize market and financial opportunity
Operational Efficiencies A greater amount of communal bathrooms shared by guests and limited in-room amenities reduce the amount of staff required to clean and operate the hostel

18
BUSINESS MODEL
Freehold Ownership
Qualified Management Team
Premium Locations
Product Quality
Social Media Leader
Local Market Sales Force
Retro Lodge
19
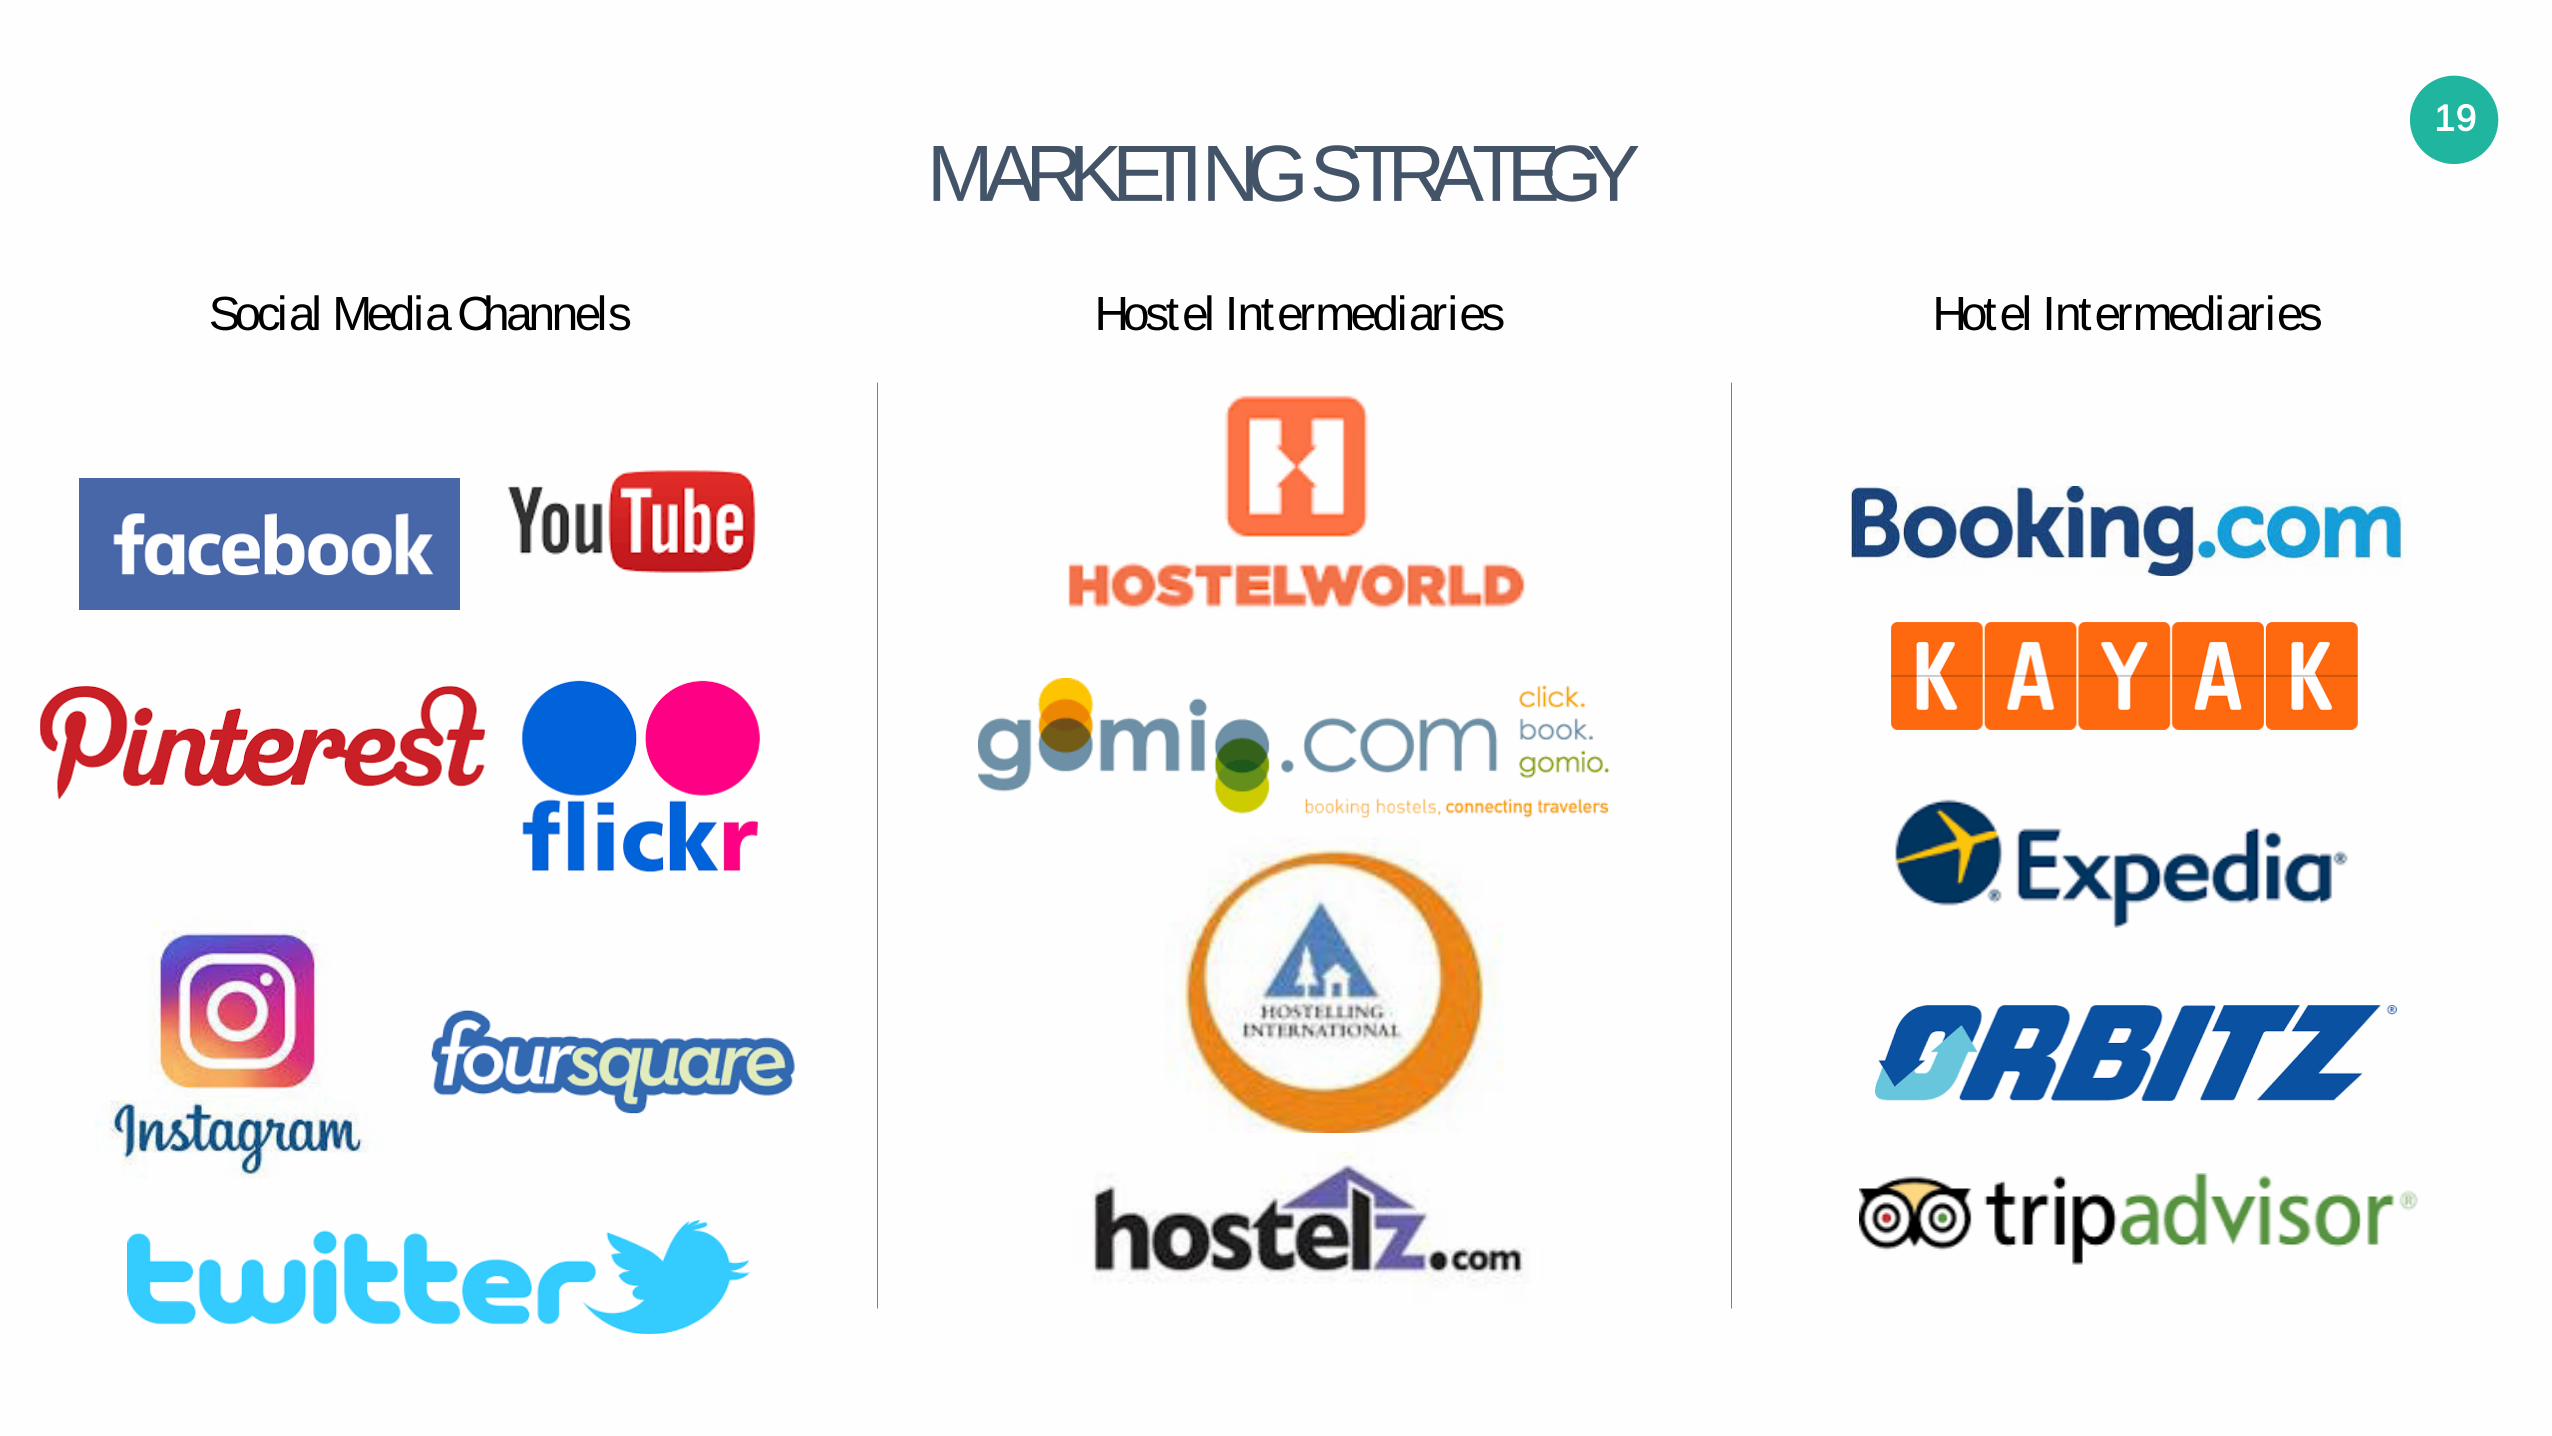
MARKETING STRATEGY Social Media Channels Hostel Intermediaries Hotel Intermediaries

20
OPERATIONAL PARTNER
Pivot Hotels & Resorts – The lifestyle division of Davidson Hotels & Resorts In homage to the truly unique differences that set lifestyle hotels apart from hard-branded assets, Pivot was purposefully incubated outside of Davidson. The Pivot team brings tremendous experience from Viceroy, Kimpton, sbe/SLS, Commune, The Irvine Company and Disney; all melding to allow them to operate with great diversity and dexterity. Though Pivot’s corporate team consists of highly capable professionals who have spent the bulk of their hospitality careers in the lifestyle space, they are aided and supported by all of Davidson’s shared services (accounting, IT, risk management, business development, investment management and legal). In addition to Davidson’s impressive and expansive portfolio, Pivot has already amassed an impressive list of partners, clients, and properties. Chicago, Illinois Properties: Hyatt Centric Chicago Magnificent Mile – Davidson Chicago Marriott Suites O’Hare - Davidson Marriott Chicago at the Medical Distric/UIC – Davidson Hotel Zachary (Under Construction) - Pivot Renaissance Chicago North Shore Hotel - Davidson

21
OPERATIONAL PARTNER (CONT.)
Client List: Pebblebrook KHP Capital Host Hotels & Resorts Rockbridge Capital Artemis GEM Realty Capital Regent Partners KSL Capital HSC Capital
Formerly launched in 2016, Pivot Hotels and resorts is Davidson’s lifestyle and operating division. Pivot’s clientele is true independent or “soft-branded” assets.
Hotel Zachary, Wrigleyville Hotel Zyphyr, San Francisco
Hotel Colonnade Gables, Miami

22
Risks & Mitigants
“Proof of Concept” in North America
Potentially Higher Development Costs
Seasonality
Low Brand Penetration
Demographic trends highlighted previously; future demand appears robust.
Renovation costs could be high; however ADR on a “quad” room with four beds is higher than a private room. Additionally, no “back of house” costs such as F&B.
Optionality to convert shared rooms to private rooms to combat periods of lower demand
The seven largest chains account for a total of 88 hostels comprising only 1.2% of total global supply. Opportunity to grab customer loyalty.
Complex Redevelopment Flexible room design and layout fosters ability to build the correct mix of room and bed categories to maximize market and financial opportunity
23
SITE CRITERIA
24
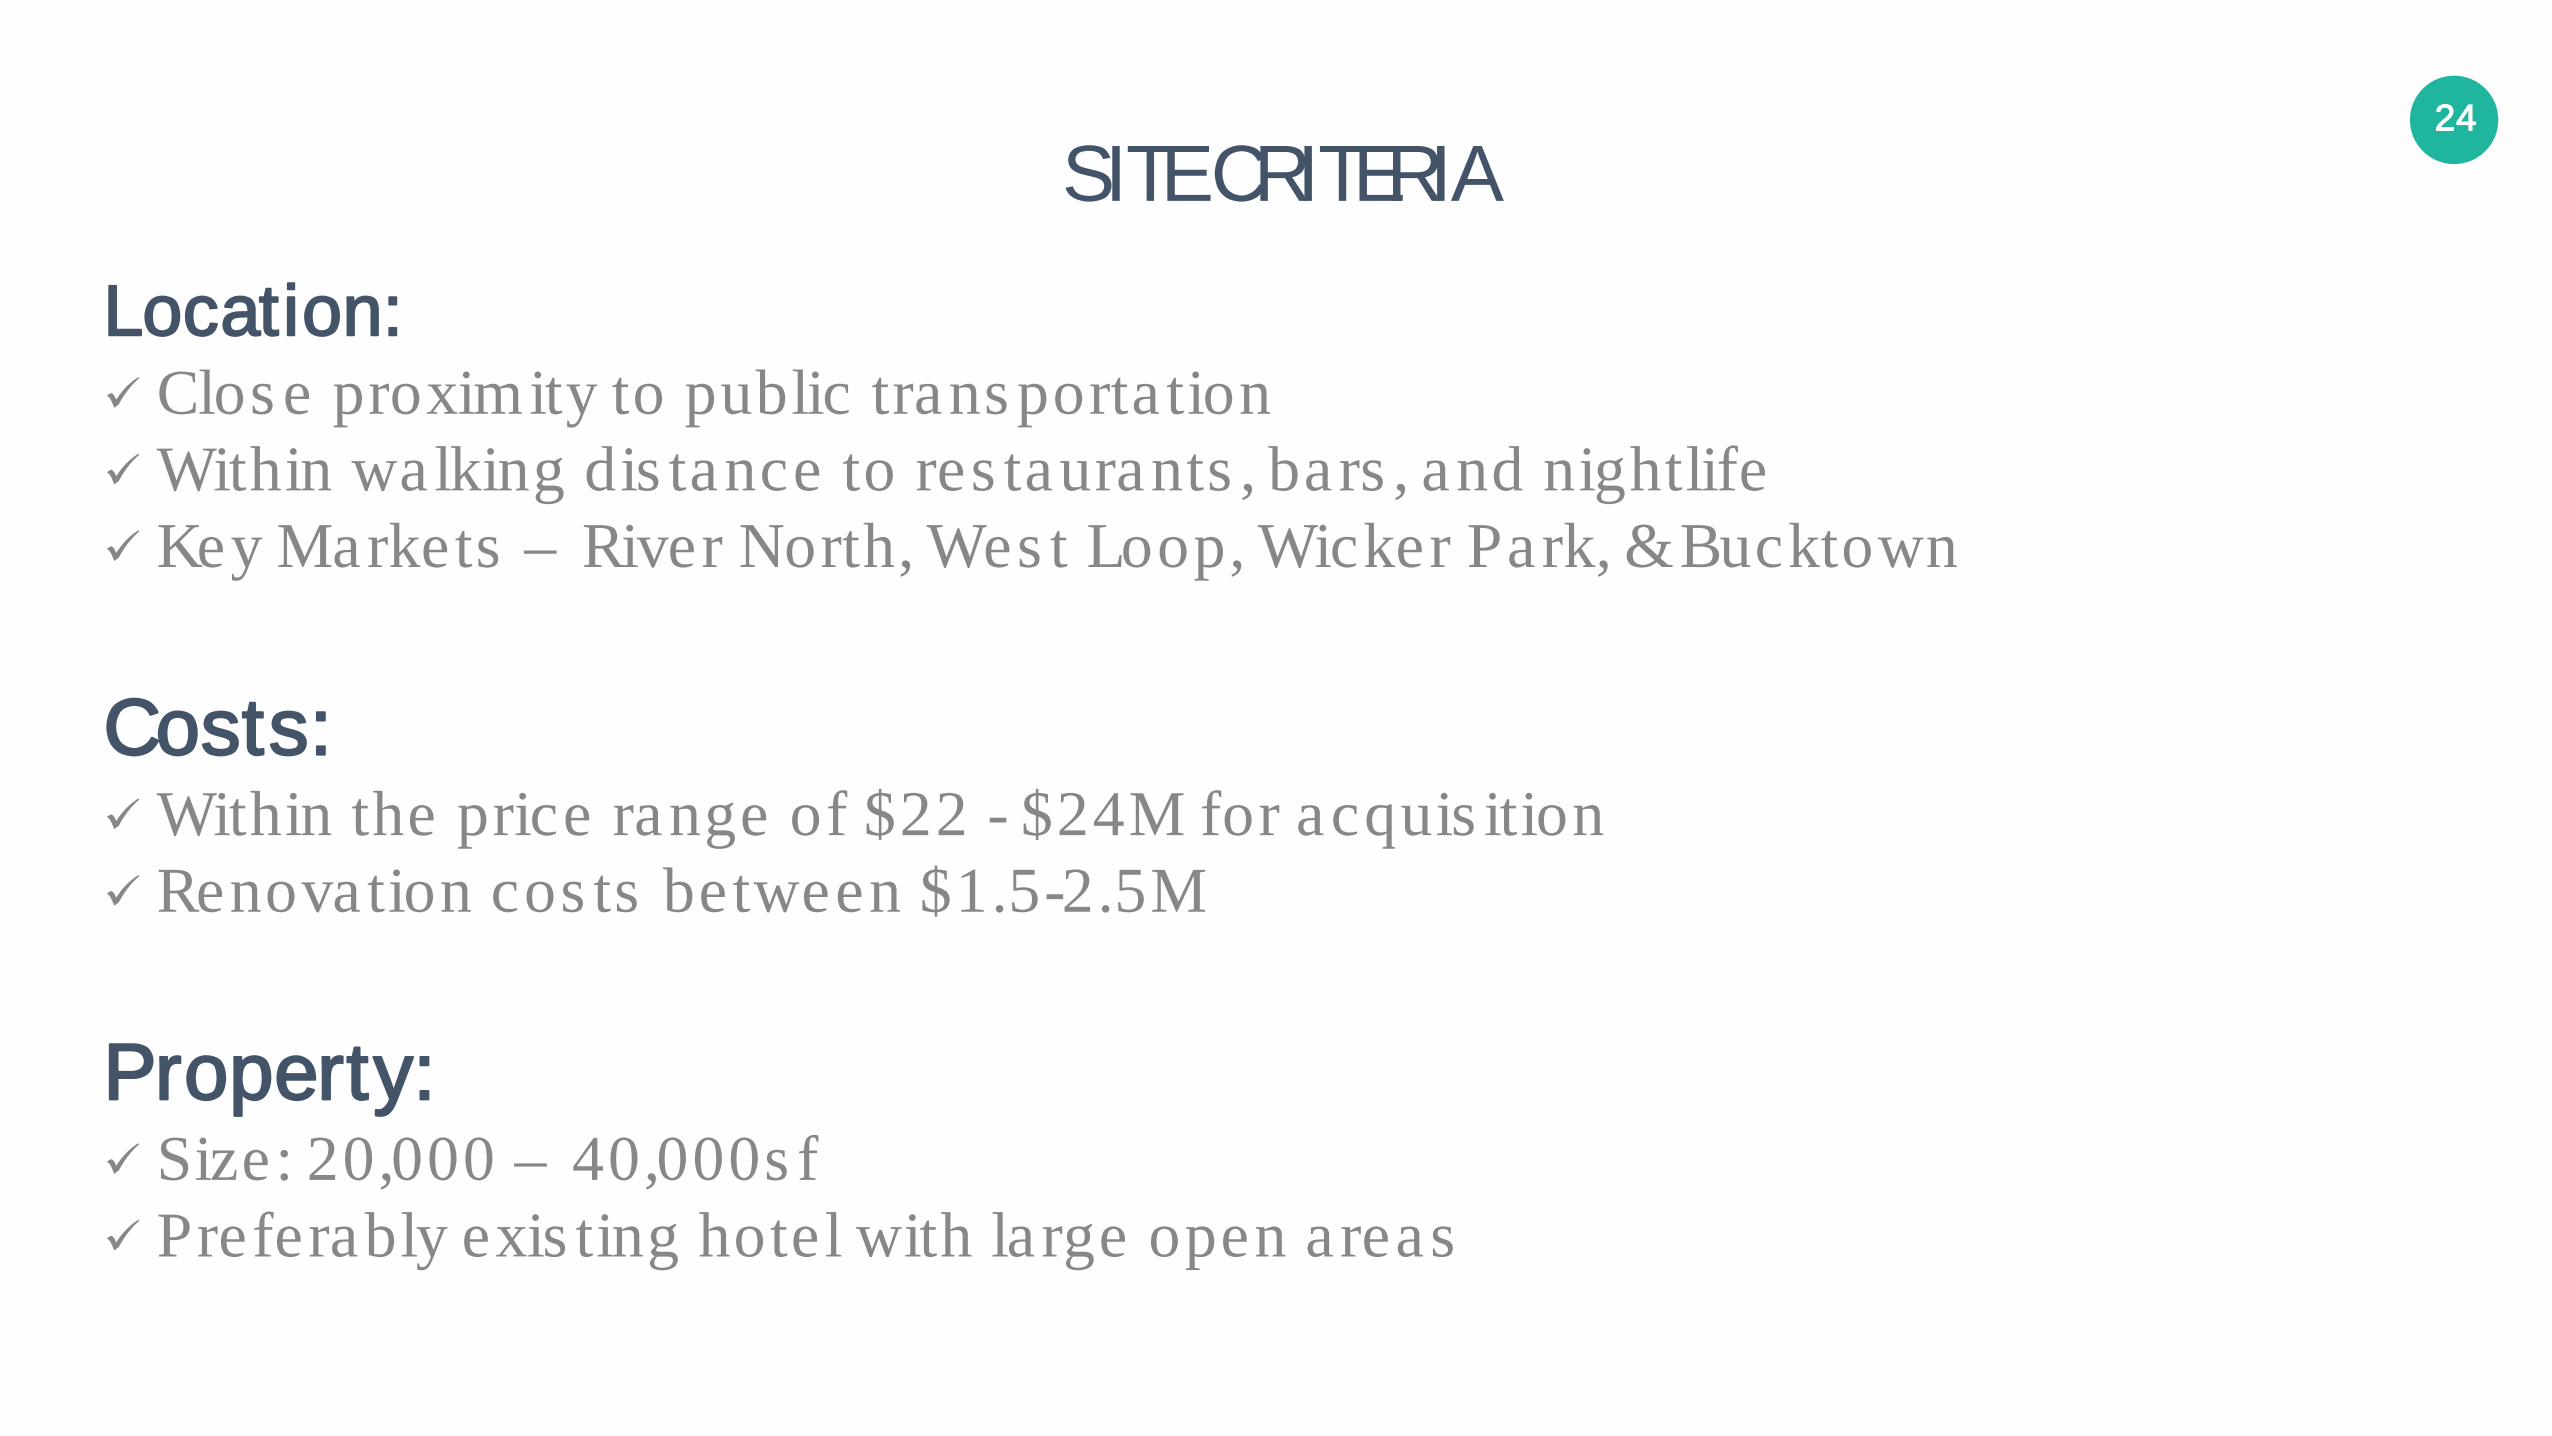
SITE CRITERIA
Location: Clos e proximity to public trans porta tion Within walking dis tance to res taurants , bars , and nightlife Key Markets – River North, Wes t Loop, Wicker Park, & Bucktown Costs: Within the price range of $22 - $24M for acquis ition Renovation cos ts between $1.5-2.5M Property: Size: 20,000 – 40,000s f Preferably exis ting hotel with large open areas
25
COMPETING SITES
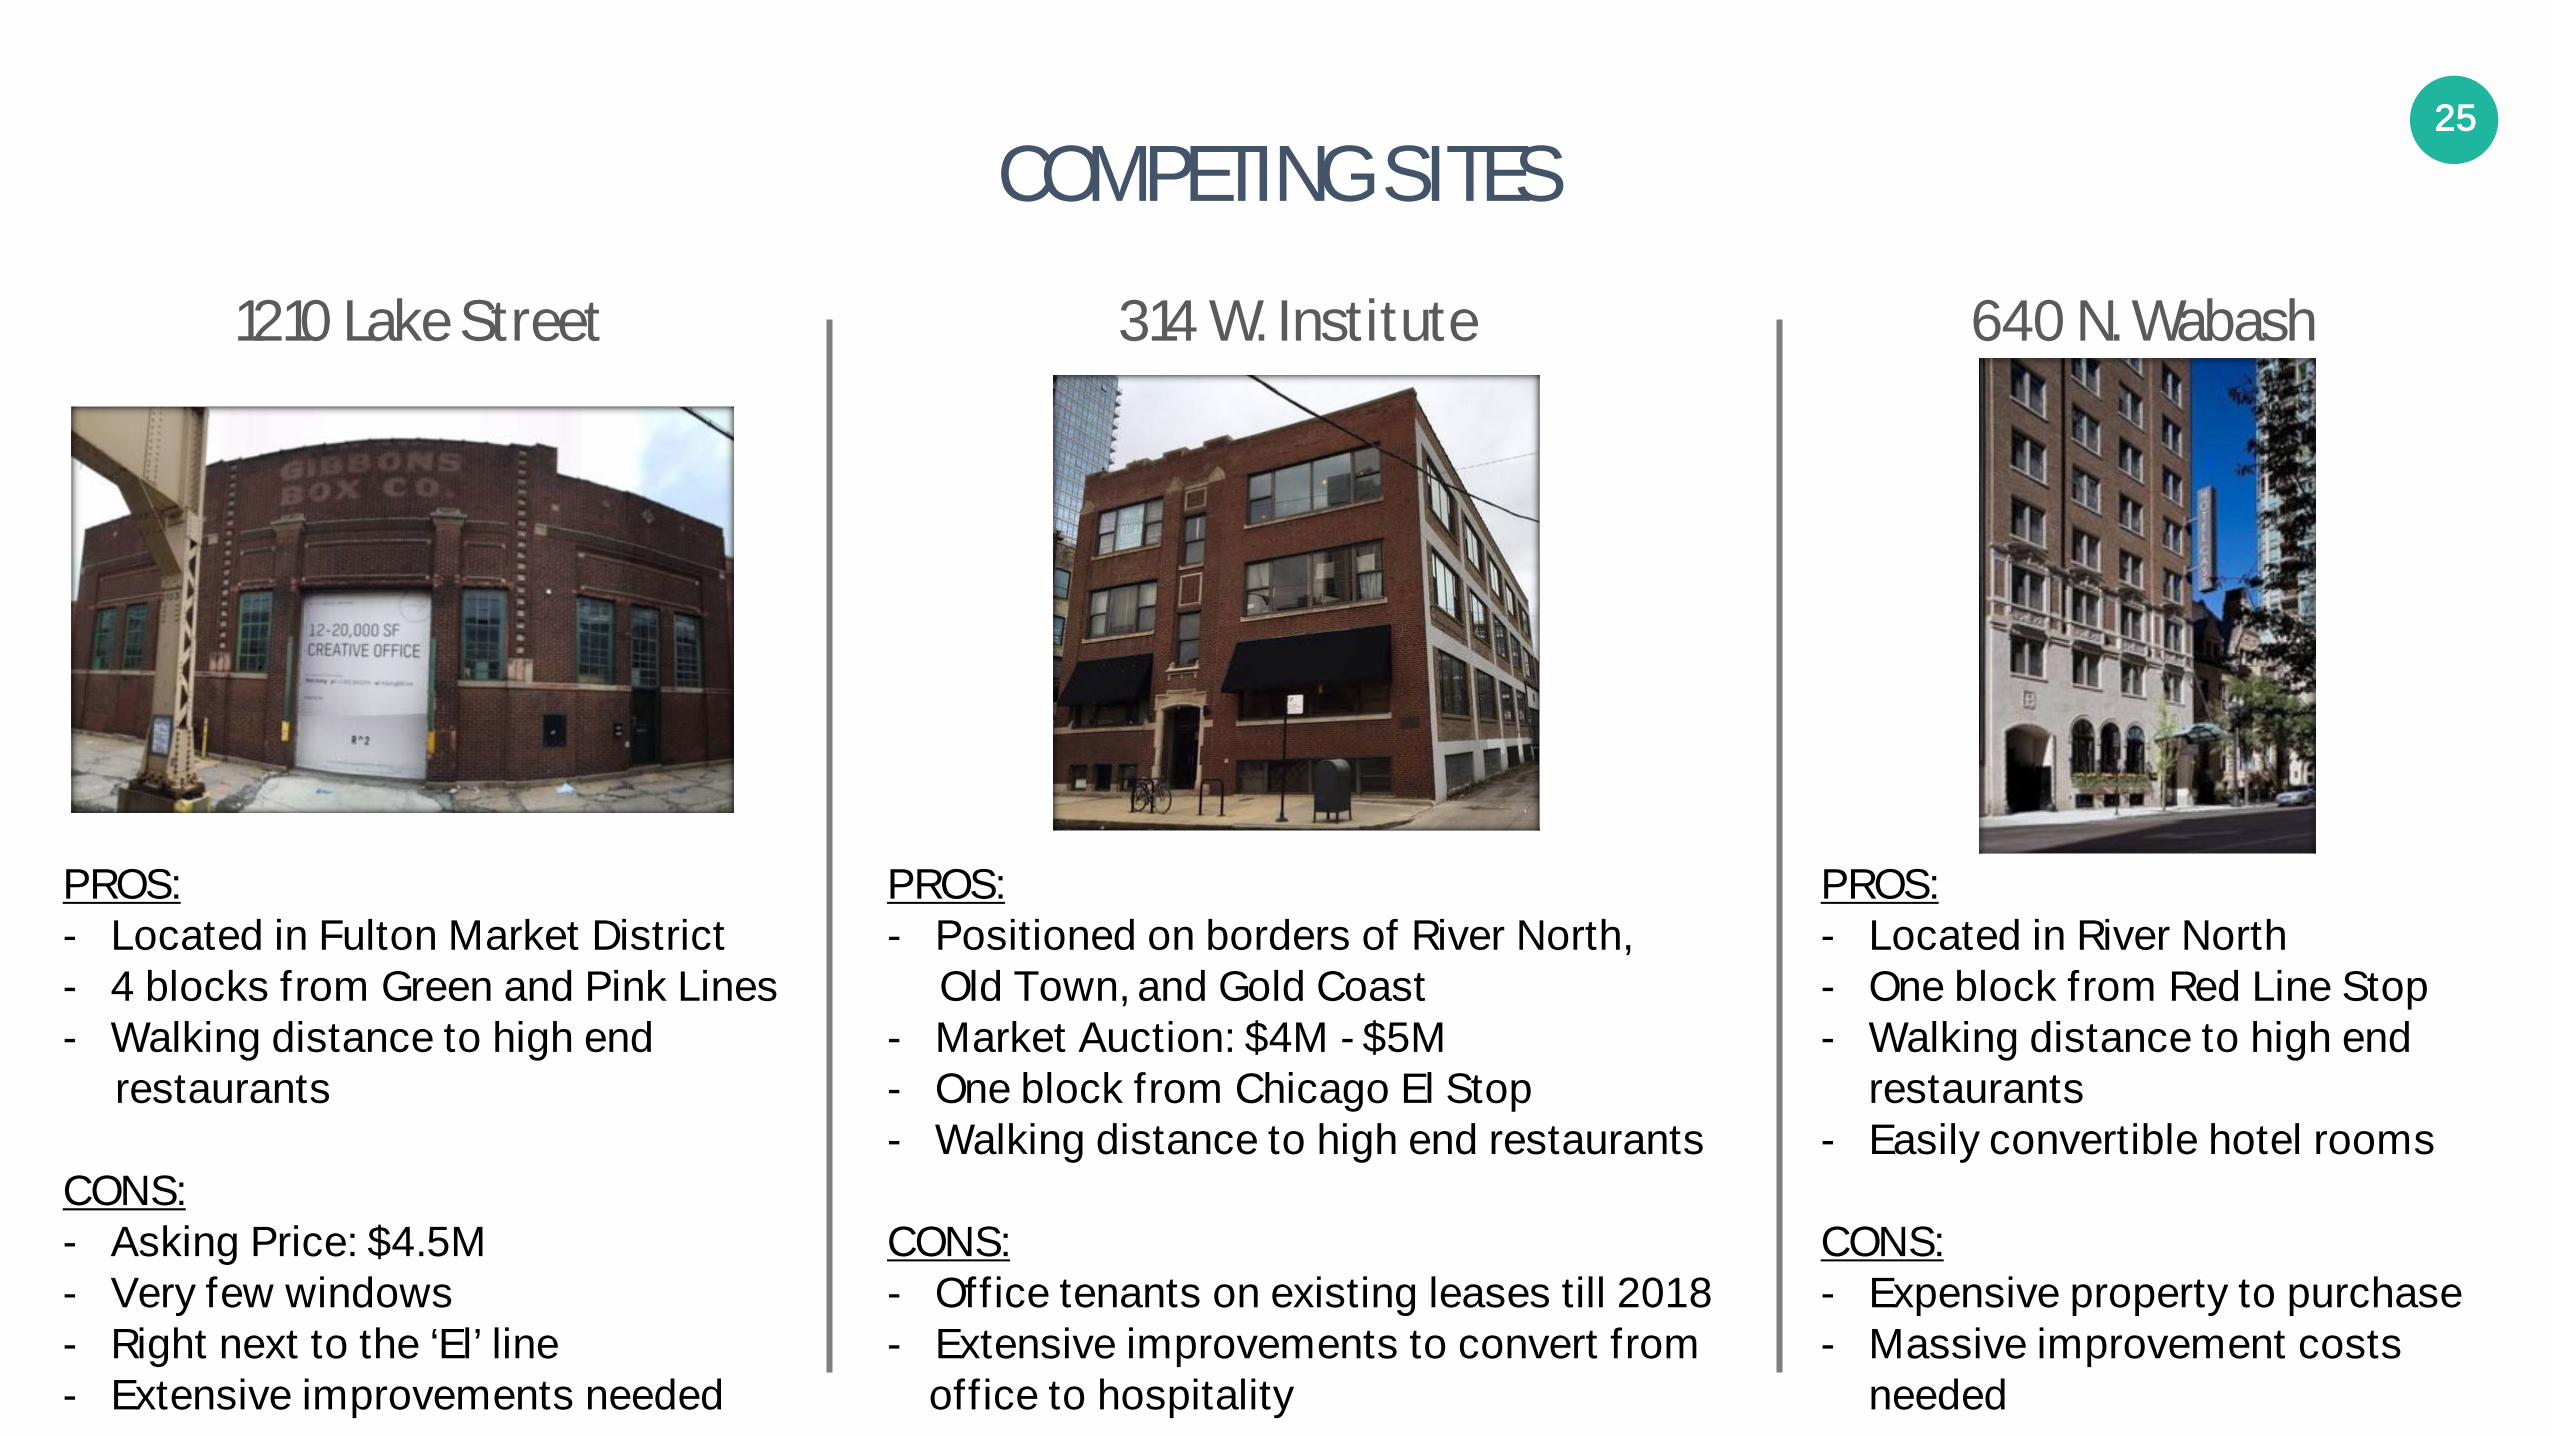
1210 Lake Street 314 W. Institute 640 N. Wabash
PROS: - Located in Fulton Market District - 4 blocks from Green and Pink Lines - Walking distance to high end restaurants
CONS: - Asking Price: $4.5M - Very few windows - Right next to the ‘El’ line - Extensive improvements needed
PROS: - Positioned on borders of River North, Old Town, and Gold Coast - Market Auction: $4M - $5M - One block from Chicago El Stop - Walking distance to high end restaurants
CONS: - Office tenants on existing leases till 2018 - Extensive improvements to convert from office to hospitality
PROS: - Located in River North - One block from Red Line Stop - Walking distance to high end restaurants - Easily convertible hotel rooms
CONS: - Expensive property to purchase - Massive improvement costs needed

26
PRO FORMA
27
SOURCES AND USES
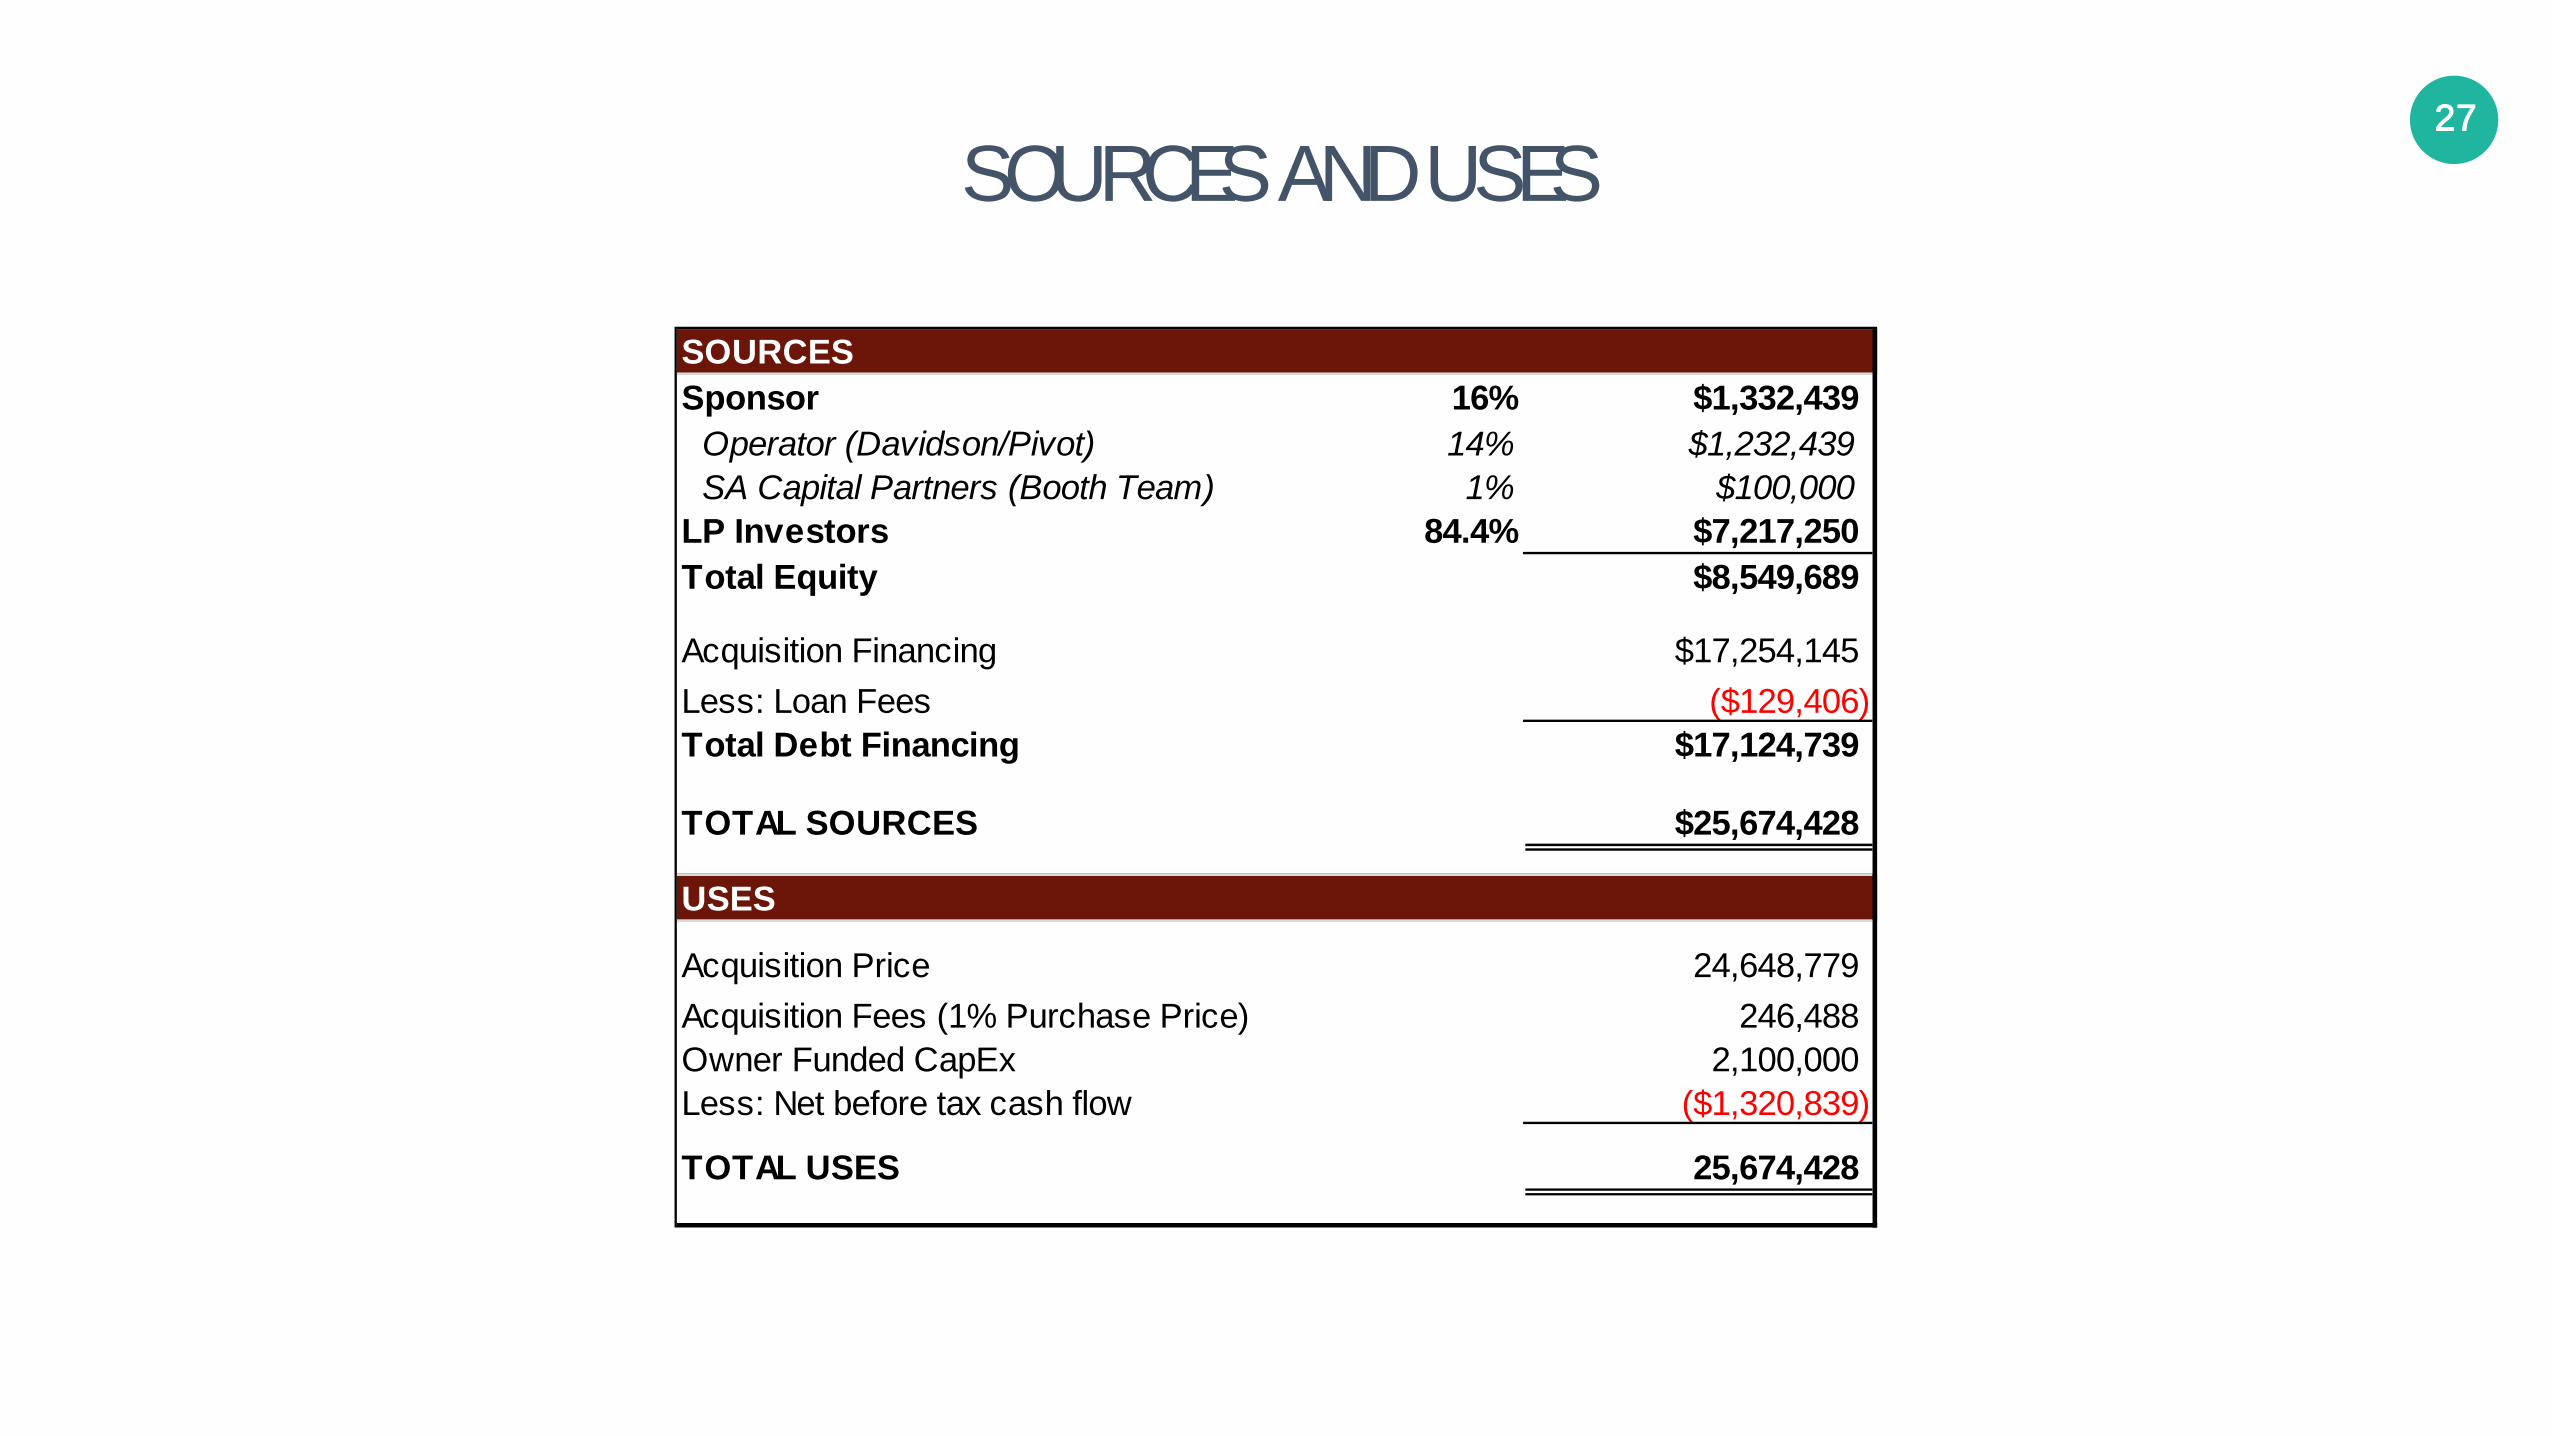
SOURCESSponsor 16% $1,332,439
Operator (Davidson/Pivot) 14% $1,232,439SA Capital Partners (Booth Team) 1% $100,000
LP Investors 84.4% $7,217,250Total Equity $8,549,689
Acquisition Financing $17,254,145Less: Loan Fees ($129,406)Total Debt Financing $17,124,739
TOTAL SOURCES $25,674,428
USES
Acquisition Price 24,648,779 Acquisition Fees (1% Purchase Price) 246,488 Owner Funded CapEx 2,100,000 Less: Net before tax cash flow ($1,320,839)
TOTAL USES 25,674,428
28
OTHER ACQUISITION/DISPOSITION DETAILS
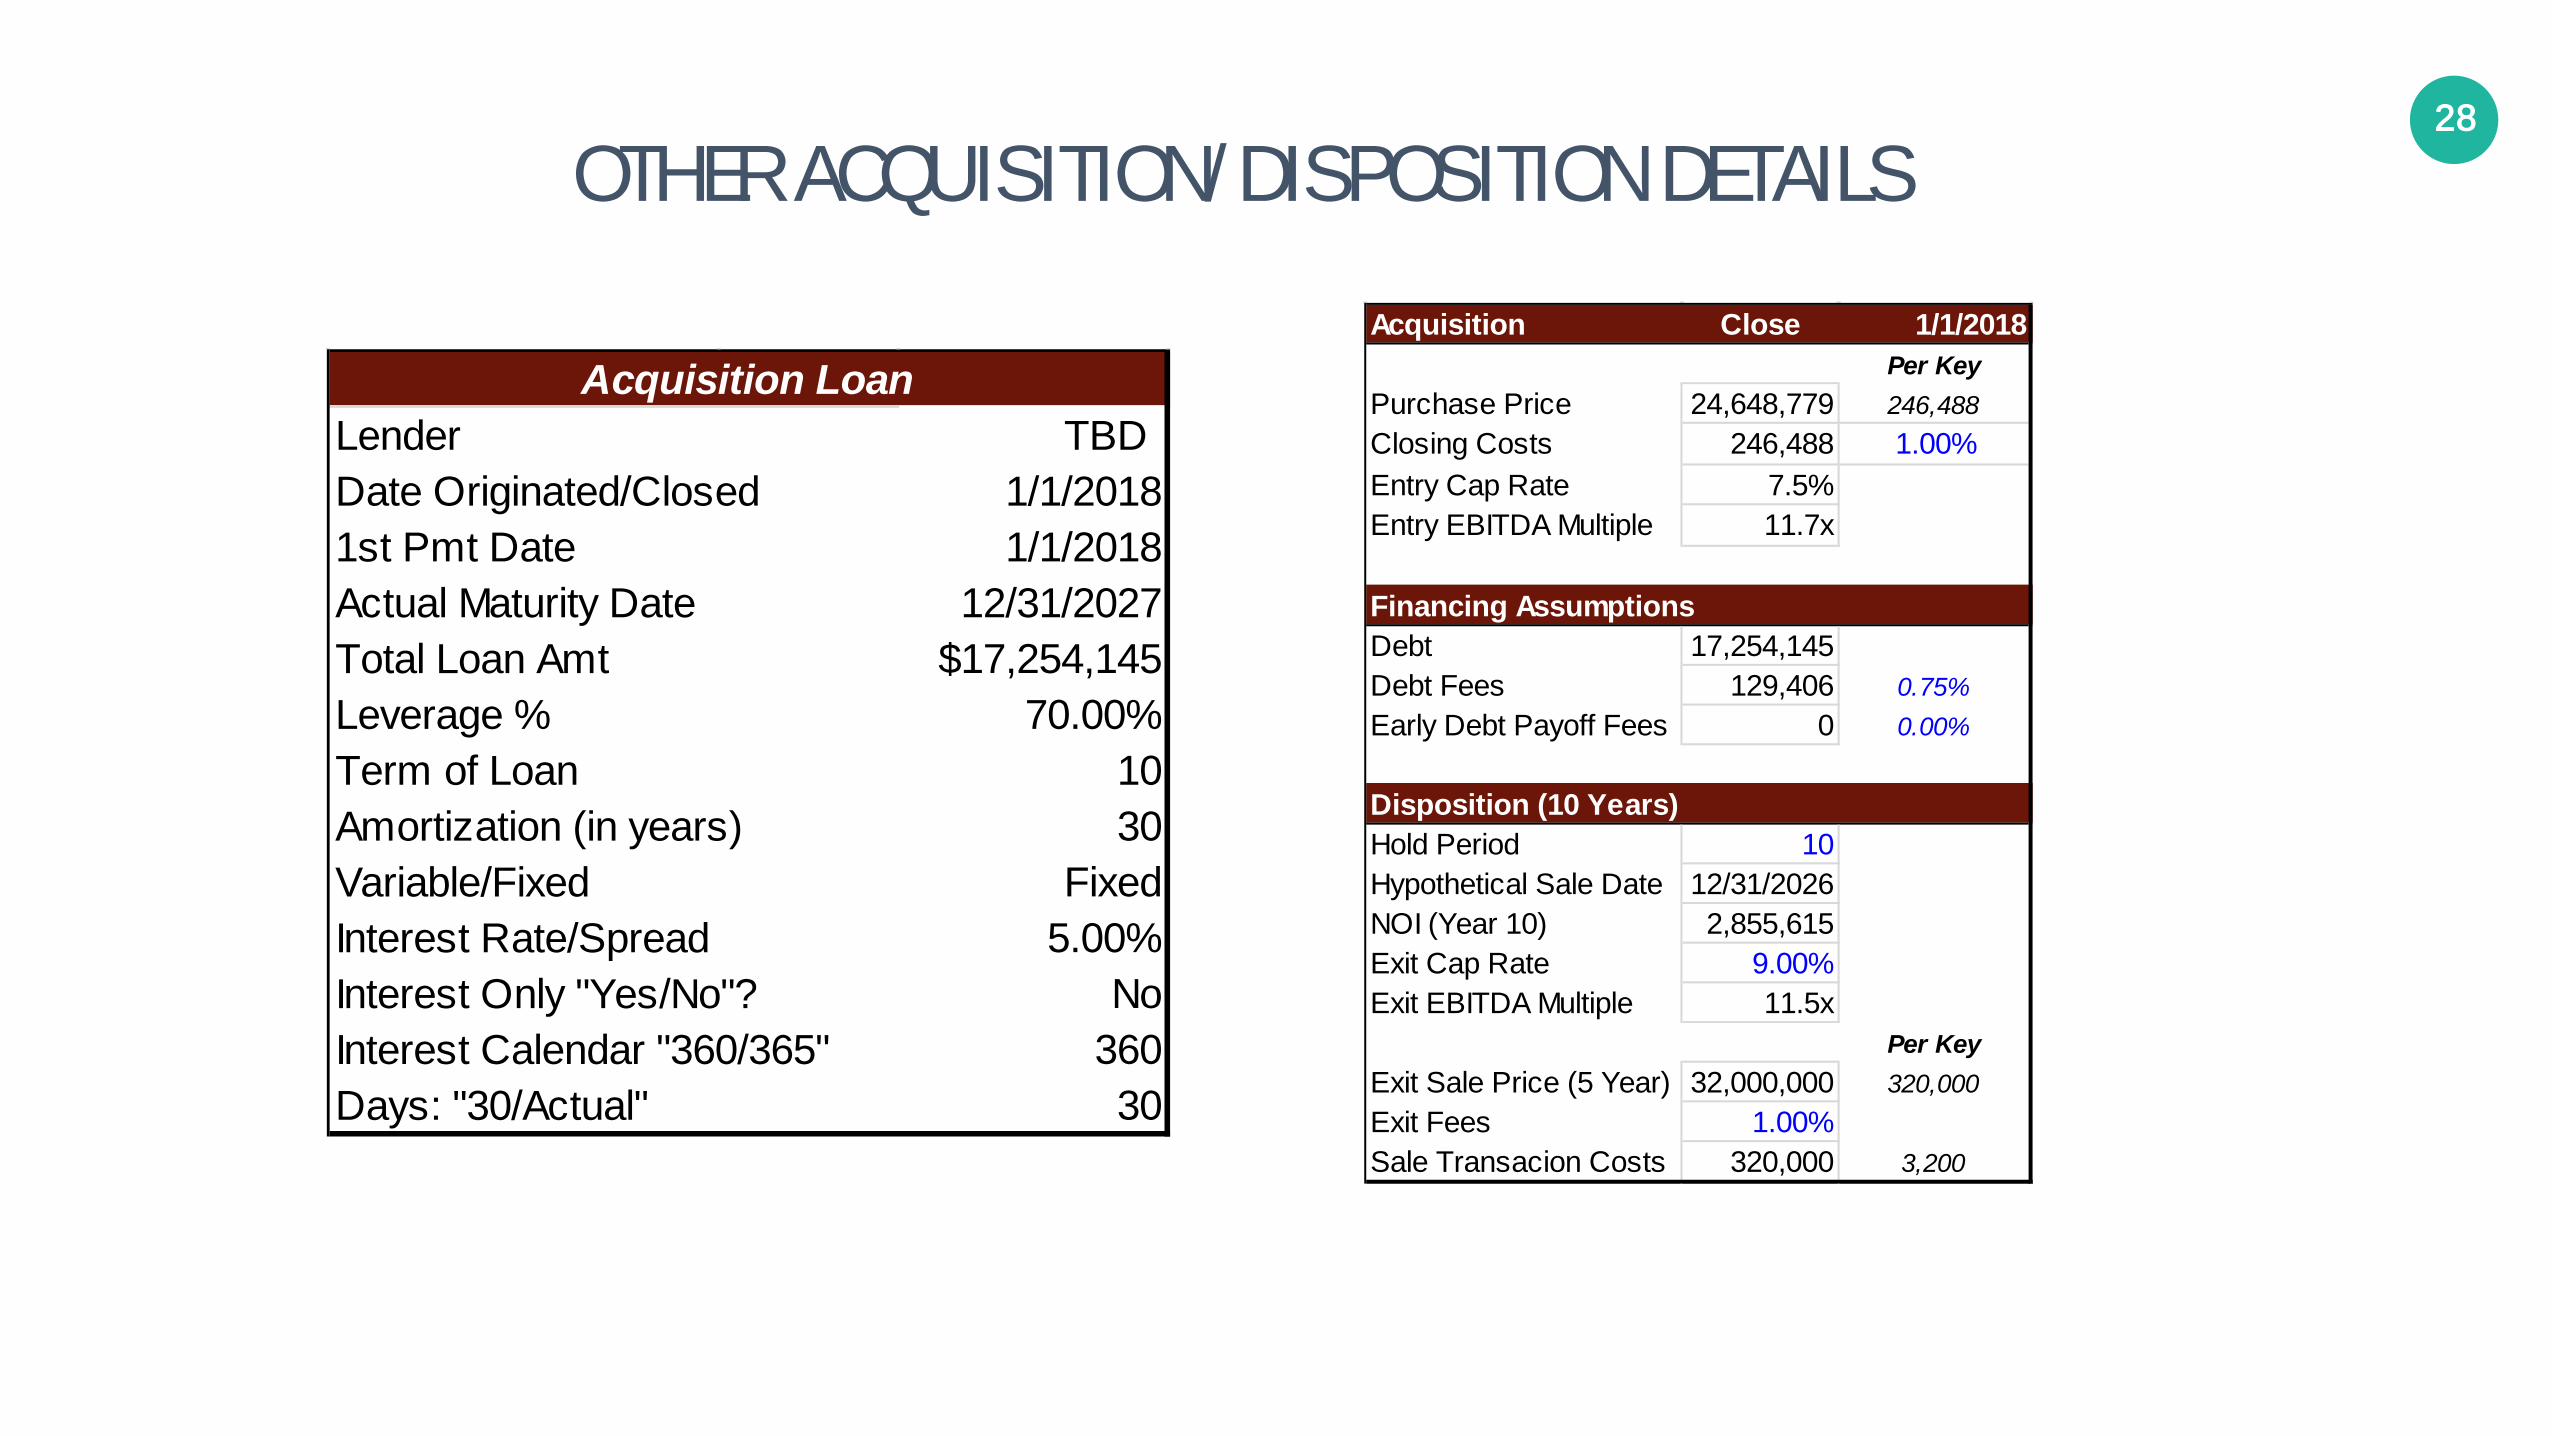
TBD1/1/20181/1/2018
Actual Maturity Date 12/31/2027$17,254,145
Leverage % 70.00%1030
Fixed5.00%
No36030
Interest Calendar "360/365"Days: "30/Actual"
Term of LoanAmortization (in years)Variable/FixedInterest Rate/SpreadInterest Only "Yes/No"?
Acquisition LoanLenderDate Originated/Closed1st Pmt Date
Total Loan Amt
Acquisition Close 1/1/2018Per Key
Purchase Price 24,648,779 246,488Closing Costs 246,488 1.00%Entry Cap Rate 7.5%Entry EBITDA Multiple 11.7x
Financing AssumptionsDebt 17,254,145Debt Fees 129,406 0.75%Early Debt Payoff Fees 0 0.00%
Disposition (10 Years)Hold Period 10Hypothetical Sale Date 12/31/2026NOI (Year 10) 2,855,615Exit Cap Rate 9.00%Exit EBITDA Multiple 11.5x
Per KeyExit Sale Price (5 Year) 32,000,000 320,000Exit Fees 1.00%Sale Transacion Costs 320,000 3,200

29
FINANCIAL SUMMARY Market: Chicago CBD Room Mix: 160 Standard Rooms; 40 Hostel Rooms w/4 beds Going-In Cap: 7.50% Loan: 17,254,145 Exit Cap: 9.00%Interest: Fee Simple Meeting Space:N/A Purchase Price: 24,648,779 LTV: 70.0% Total 5-Yr Cash Requirement: 9,741,121 Labor: Non-Union F&B Outlets: Bar 5-Year CapEx Requirement: 2,100,000 Interest Rate: 5.00% Disposition Price: 27,369,765 Mgmt: Pivot Hotels & Resorts (Outside of Reserves) Maturity Date: 12/31/2027 7-Year Levered IRR: 19.6%
SUMMARY INFORMATION:
Year 1 Year 2 Year 3 Year 4 Year 5 Year 6 Year 7 Year 8 Year 9 Year 10Proforma Proforma Proforma Proforma Proforma Proforma Proforma Proforma Proforma Proforma
2018 2019 2020 2021 2022 2023 2024 2025 2026 2027Keys 100 100 100 100 100 100 100 100 100 100
Available Room Nights 36,500 36,500 36,600 36,500 36,500 36,500 36,600 36,500 36,500 36,500 Occupied Room Nights 29,930 25,915 28,109 28,032 28,032 28,032 28,109 28,032 28,032 28,032 Room Revenue 4,938,450 4,568,778 5,273,564 5,522,113 5,687,776 5,858,409 6,050,694 6,215,186 6,401,642 6,593,691 Occupancy 82.0% 71.0% 76.8% 76.8% 76.8% 76.8% 76.8% 76.8% 76.8% 76.8%Average Daily Rate (ADR) $165.00 $176.30 $187.61 $196.99 $202.90 $208.99 $215.26 $221.72 $228.37 $235.22Revenue Per Available Room (RevPAR) $135.30 $125.17 $144.09 $151.29 $155.83 $160.50 $165.32 $170.28 $175.39 $180.65RevPAR Growth (7.5%) 15.1% 5.0% 3.0% 3.0% 3.0% 3.0% 3.0% 3.0%
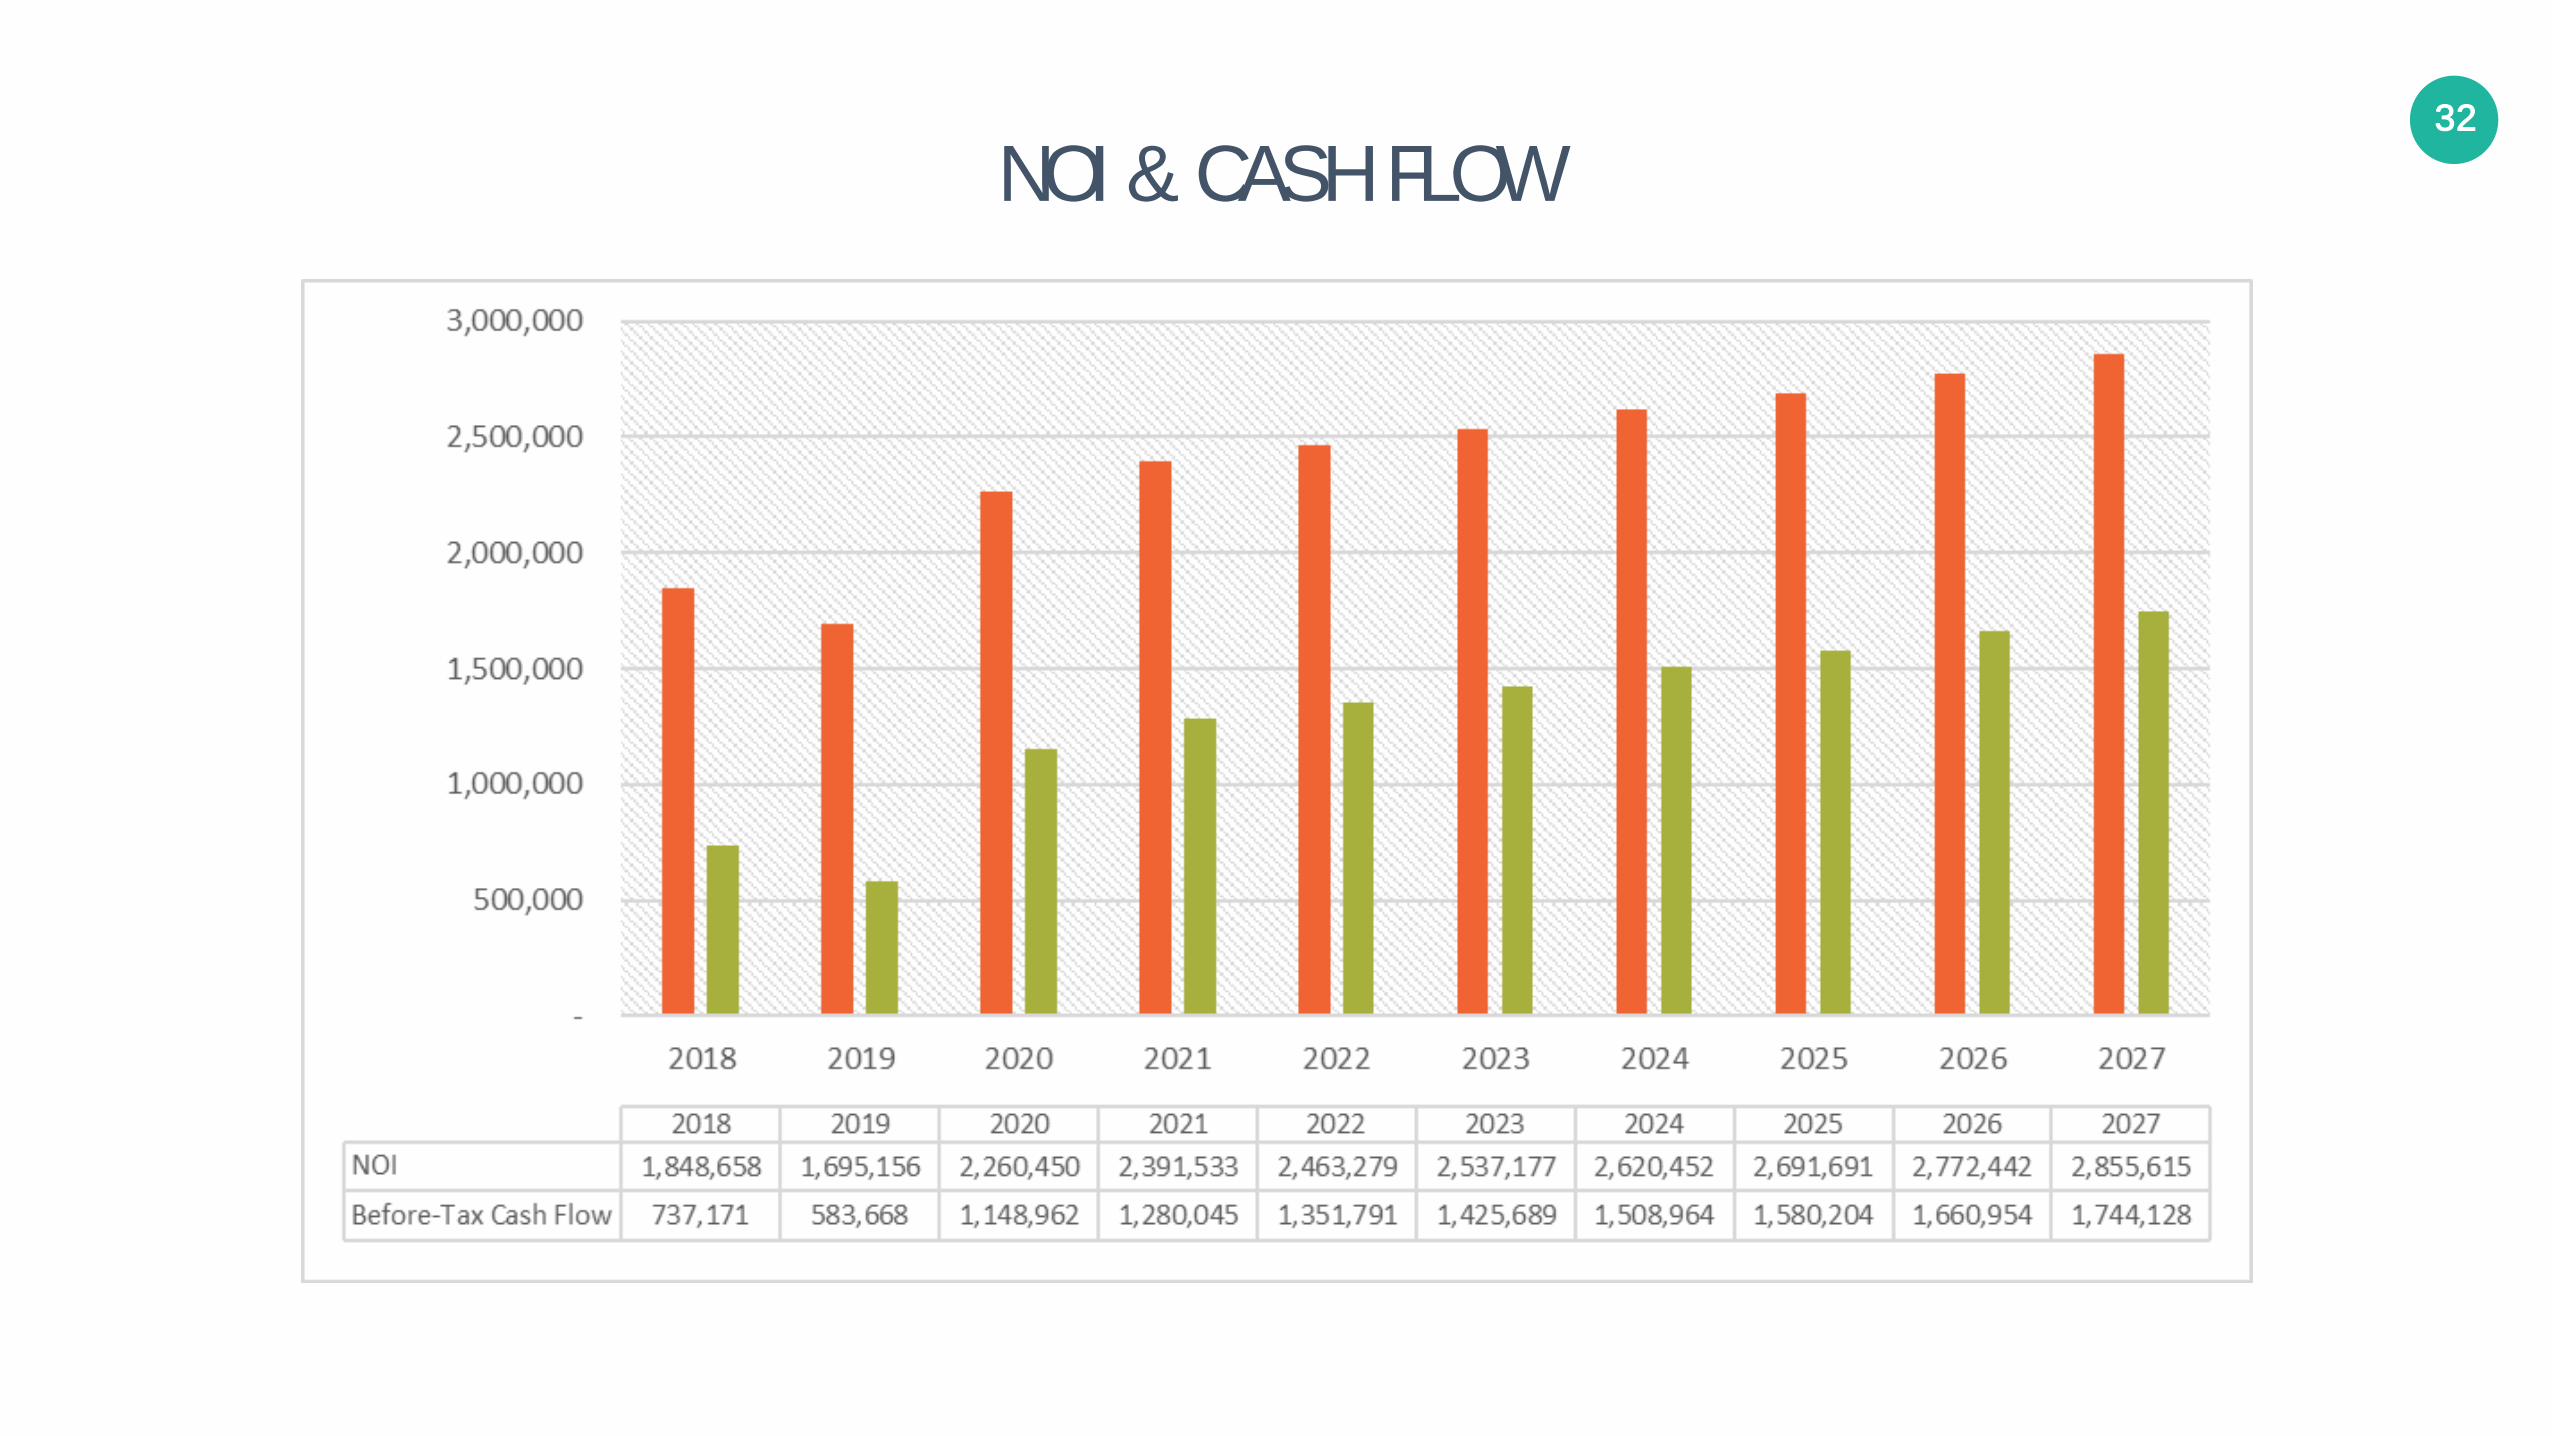
Gross Revenue 5,268,877 4,985,860 5,797,977 6,058,679 6,240,439 6,427,653 6,638,620 6,819,097 7,023,669 7,234,380 HOTEL EBITDA 2,112,102 1,944,449 2,550,348 2,694,467 2,775,301 2,858,560 2,952,383 3,032,646 3,123,626 3,217,334 EBITDA Margin 40.1% 39.0% 44.0% 44.5% 44.5% 44.5% 44.5% 44.5% 44.5% 44.5%EBITDA Growth (7.9%) 31.2% 5.7% 3.0% 3.0% 3.3% 2.7% 3.0% 3.0%FF&E Reserve 263,444 249,293 289,899 302,934 312,022 321,383 331,931 340,955 351,183 361,719 HOTEL NOI 1,848,658 1,695,156 2,260,450 2,391,533 2,463,279 2,537,177 2,620,452 2,691,691 2,772,442 2,855,615 NOI Margin 35.1% 34.0% 39.0% 39.5% 39.5% 39.5% 39.5% 39.5% 39.5% 39.5%Debt Service Payment (1,111,488) (1,111,488) (1,111,488) (1,111,488) (1,111,488) (1,111,488) (1,111,488) (1,111,488) (1,111,488) (1,111,488) NET CASH FLOW AFTER TAX & DEBT SERVICE 737,171 583,668 1,148,962 1,280,045 1,351,791 1,425,689 1,508,964 1,580,204 1,660,954 1,744,128

30
REVENUE MODEL
Subject Property Performance: 2018 2019 2020 2021 2022 2023 2024 2025 2026 2027Daily Room Supply 100 100 100 100 100 100 100 100 100 100
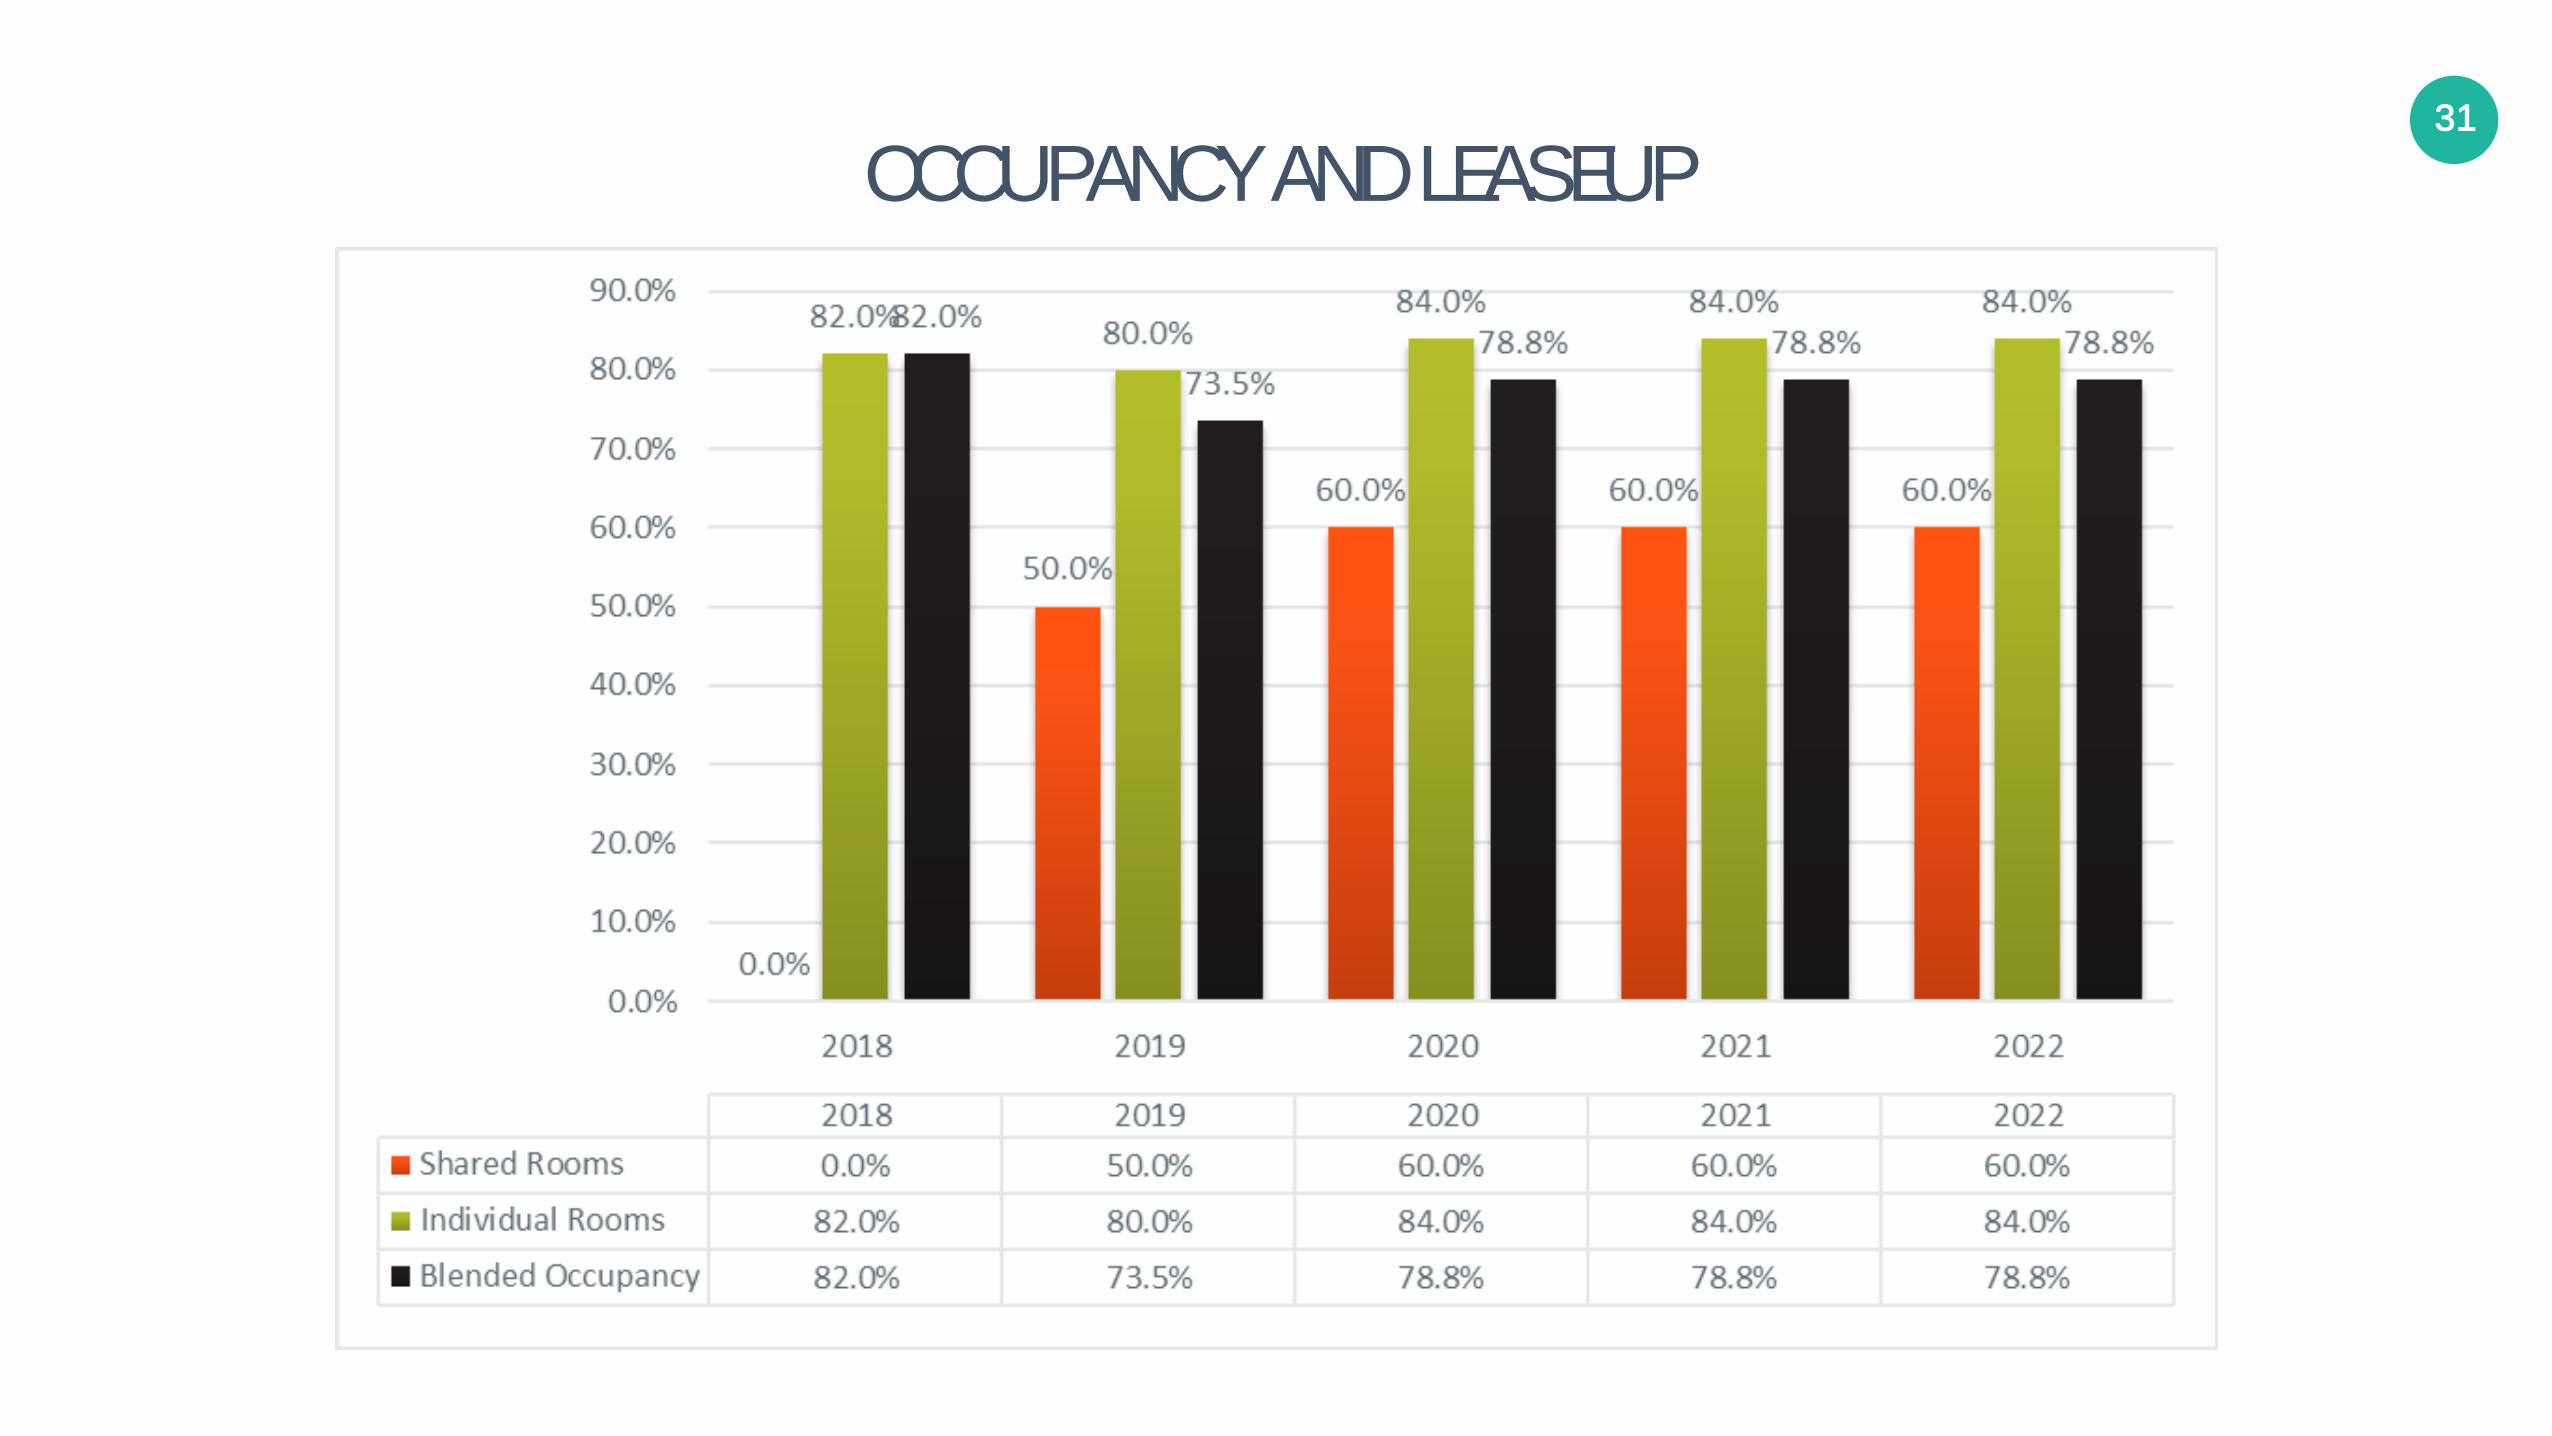
Occupancy Percentage: Shared Rooms 0.0% 50.0% 60.0% 60.0% 60.0% 60.0% 60.0% 60.0% 60.0% 60.0%Occupancy Percentage: Individual Rooms 82.0% 80.0% 84.0% 84.0% 84.0% 84.0% 84.0% 84.0% 84.0% 84.0%Total Annual Occupancy Percentage 82.0% 73.5% 78.8% 78.8% 78.8% 78.8% 78.8% 78.8% 78.8% 78.8%Occupancy Growth (2.4%) 5.0% - - - - - - - Average Daily Rate (ADR): Shared Rooms $0.00 $50.00 $53.00 $55.65 $57.32 $59.04 $60.81 $62.63 $64.51 $66.45Average Daily Rate (ADR): Individual Rooms $165.00 $169.95 $180.15 $189.15 $194.83 $200.67 $206.69 $212.89 $219.28 $225.86Total Annual Average Daily Rate (ADR) $165.00 $170.41 $182.94 $192.08 $197.84 $203.78 $209.89 $216.19 $222.68 $229.36Rate Growth 3.0% 6.0% 5.0% 3.0% 3.0% 3.0% 3.0% 3.0% 3.0% Annual RevPAR: Shared Rooms $0.00 $25.00 $31.80 $33.39 $34.39 $35.42 $36.49 $37.58 $38.71 $39.87Annual RevPAR: Individual Rooms $135.30 $135.96 $151.32 $158.89 $163.66 $168.57 $173.62 $178.83 $184.20 $189.72Total Annual Revenue Per Occupied Room (RevPAR) $135.30 $125.17 $144.09 $151.29 $155.83 $160.50 $165.32 $170.28 $175.39 $180.65RevPAR Growth 0.5% 11.3% 5.0% 3.0% 3.0% 3.0% 3.0% 3.0% 3.0%
31
OCCUPANCY AND LEASEUP
32
NOI & CASH FLOW

33
TERMS

34
PROMOTE STRUCTURE & FORECASTED INVESTOR RETURNS Promote Structure Sponsor % LP %Hurdle 1 15.6% 84.4%
Preferred Return Sponsor LPHurdle 2 8.0% 15.0% 85.0% 28.2% 71.8%Hurdle 3 10.0% 20.0% 80.0% 32.5% 67.5%
Promote
Summary of Investor Level Returns Year 1 Year 2 Year 3 Year 4 Year 5 Year 6 Year 7 Year 8 Year 9 Year 10Limited Partner (LP) Returns
Total LP Distributions 23,012,289 - - 969,900 1,080,555 1,141,119 1,203,501 1,273,798 1,333,934 1,402,100 14,607,382 Total LP Contributions 7,217,250 5,937,233 1,280,017 - - - - - - - - Total LP Profit 15,795,039 LP IRR 18.0% (5,937,233) (1,280,017) 969,900 1,080,555 1,141,119 1,203,501 1,273,798 1,333,934 1,402,100 14,607,382 LP Equity Multiple 3.2x
Sponsor ReturnsTotal Sponsor Distributions 7,583,259 - - 179,062 199,491 210,672 222,189 235,167 246,269 258,854 6,031,557 Total Sponsor Contributions 1,332,439 1,096,124 236,315 - - - - - - - - Total Sponsor Profit 6,250,820 Sponsor IRR 25.8% (1,096,124) (236,315) 179,062 199,491 210,672 222,189 235,167 246,269 258,854 6,031,557 Sponsor Equity Multiple 5.7x
Net Cash Flow For Distribution Year 1 Year 2 Year 3 Year 4 Year 5 Year 6 Year 7 Year 8 Year 9 Year 1031-Dec-18 31-Dec-19 31-Dec-20 31-Dec-21 31-Dec-22 31-Dec-23 31-Dec-24 31-Dec-25 31-Dec-26 31-Dec-27
Levered Before Tax Cash Flow (7,033,357) (1,516,332) 1,148,962 1,280,045 1,351,791 1,425,689 1,508,964 1,580,204 1,660,954 20,638,939 Levered IRR 19.6%Equity Multiple 3.6x
35
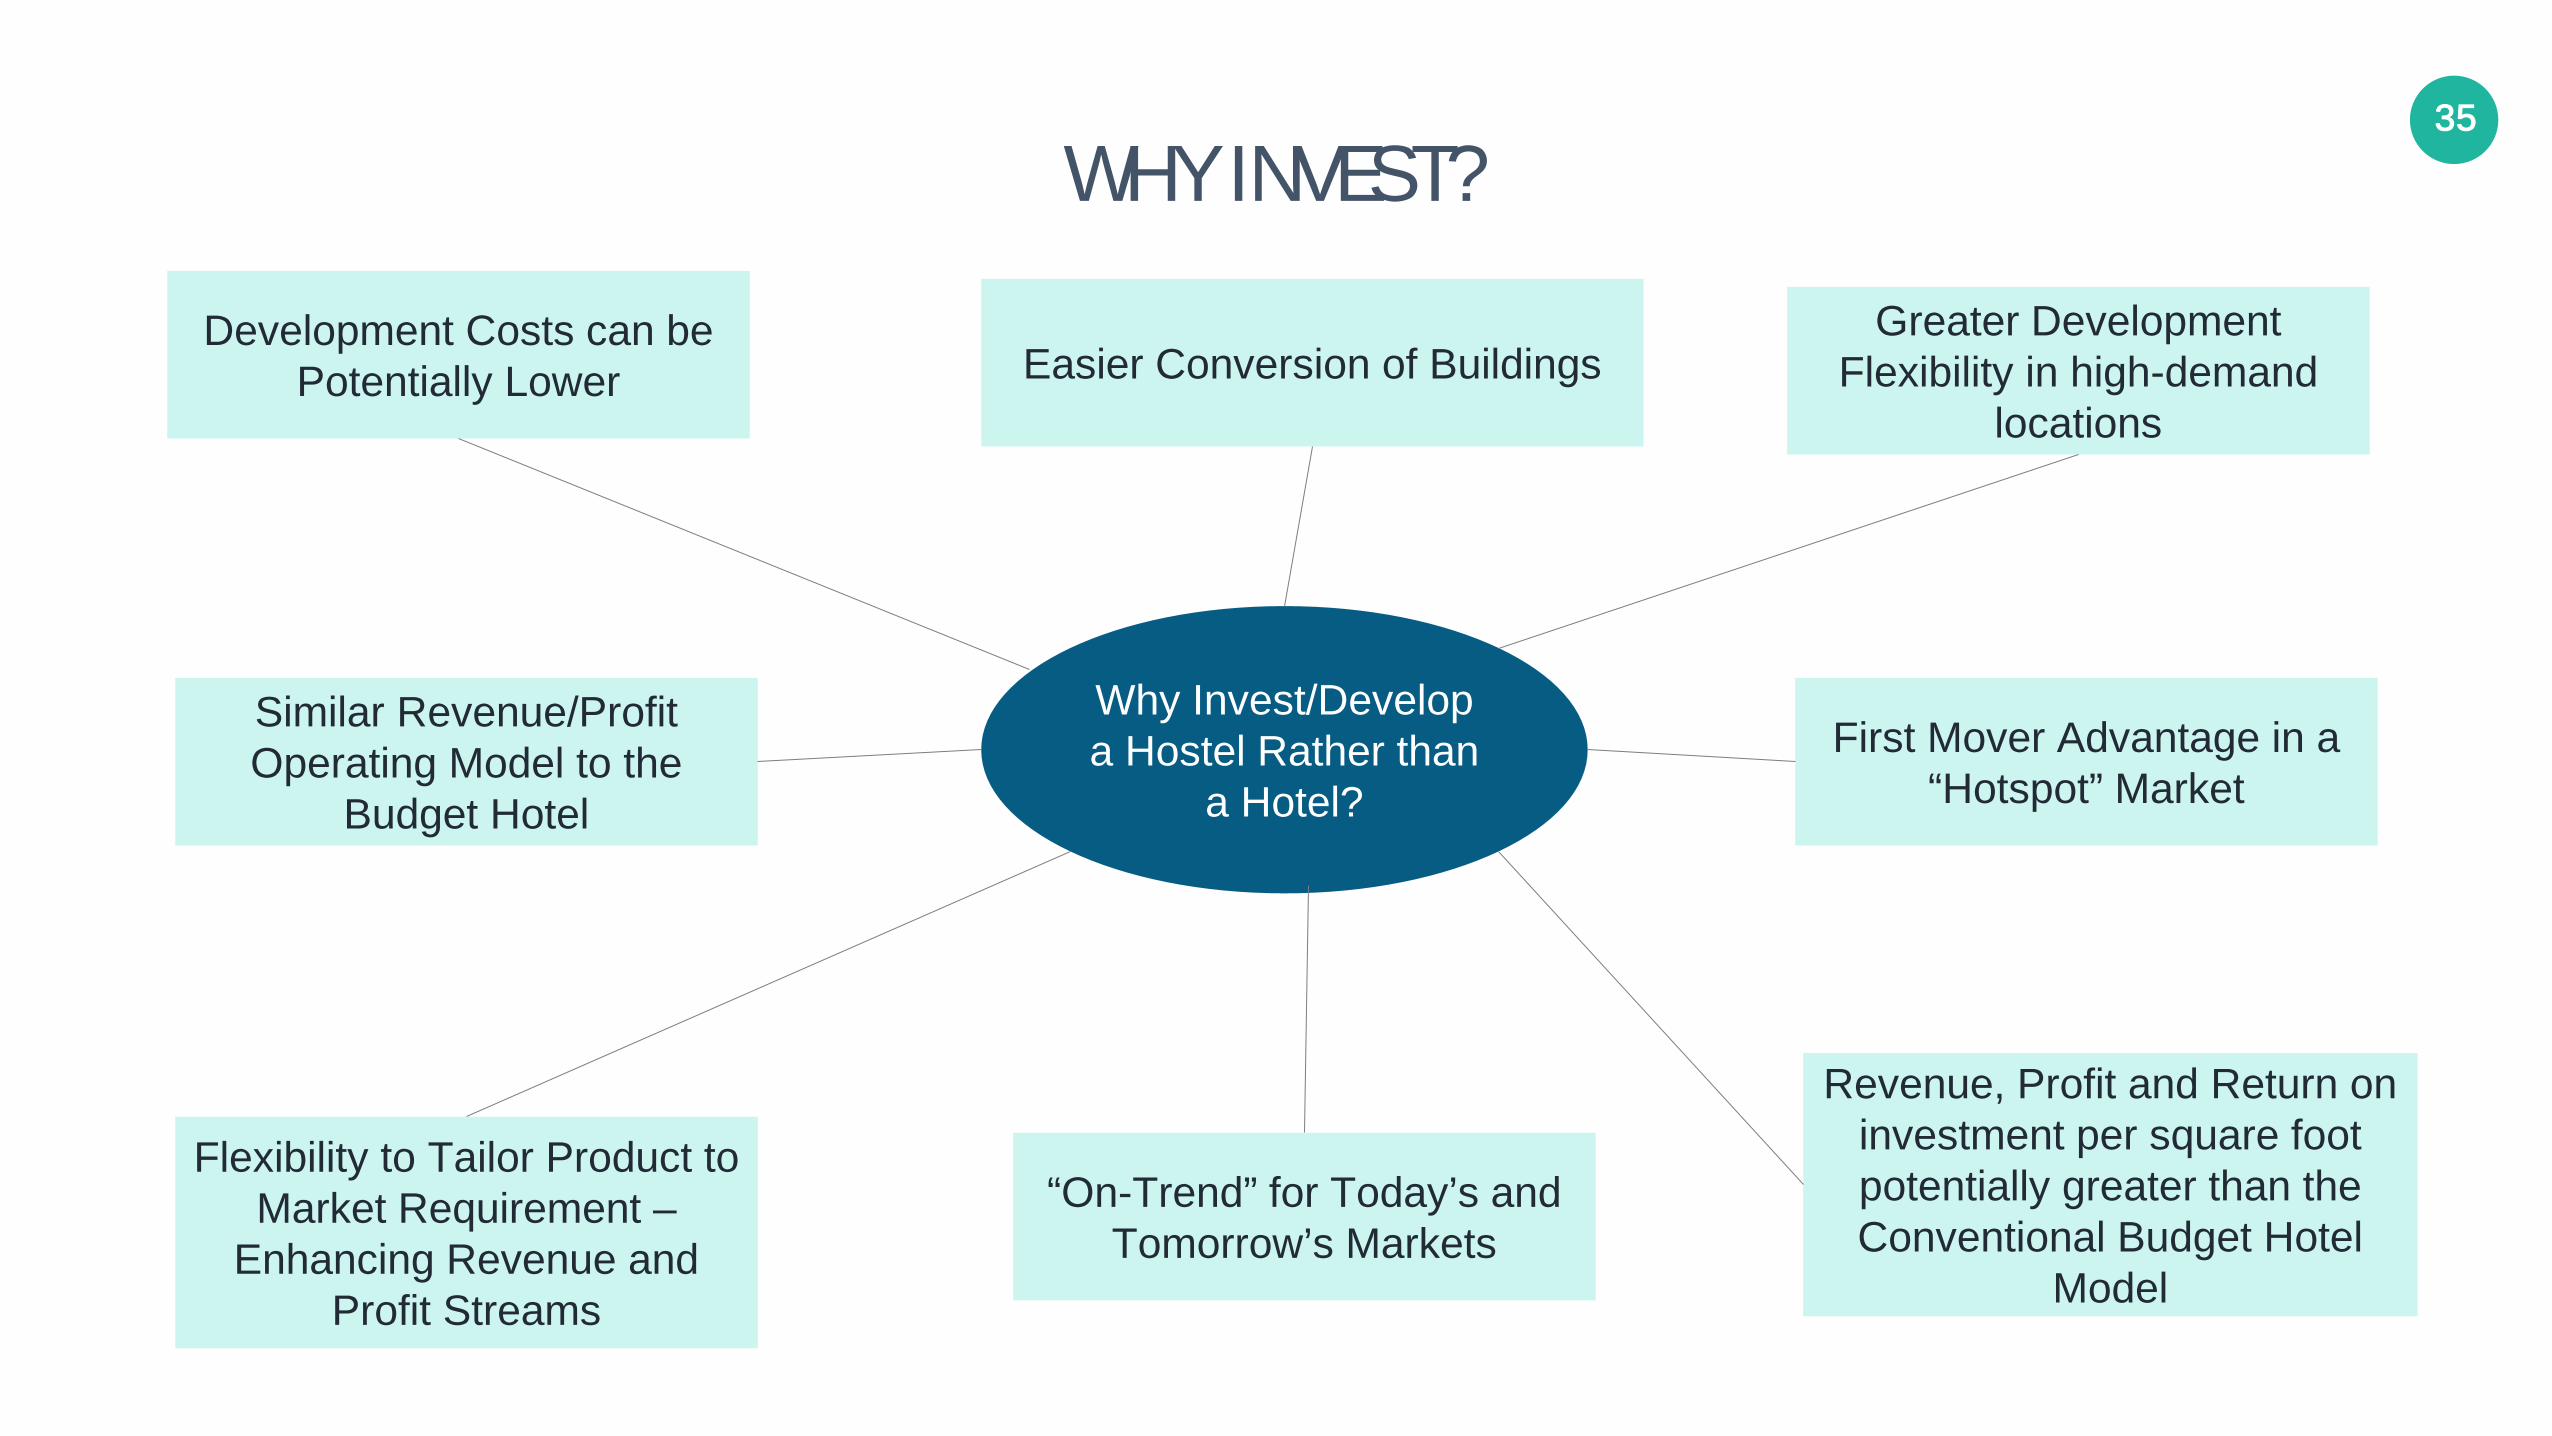
WHY INVEST?
Why Invest/Develop a Hostel Rather than
a Hotel?
Development Costs can be Potentially Lower Easier Conversion of Buildings
Greater Development Flexibility in high-demand
locations
First Mover Advantage in a “Hotspot” Market
Revenue, Profit and Return on investment per square foot potentially greater than the Conventional Budget Hotel
Model
“On-Trend” for Today’s and Tomorrow’s Markets
Flexibility to Tailor Product to Market Requirement –
Enhancing Revenue and Profit Streams
Similar Revenue/Profit Operating Model to the
Budget Hotel

36
WE ARE NOT SELLING YOU A BED, WE ARE SELLING YOU A SHARED EXPERIENCE
![SA Heritage Register...Hostel 7/6/1954, Cronulla Hostel 24/2/1954, Balgownie Hostel 16/9/1953, Berkeley Hostel no1 [undated], Bradfield Park site plan 12/4/1953, Bunnerong Hostel [undated],](https://static.fdocuments.in/doc/165x107/61342119dfd10f4dd73b8892/sa-heritage-register-hostel-761954-cronulla-hostel-2421954-balgownie-hostel.jpg)