S Ta R Chart Presentation
11
"The illiterate of the 21st century will not be those who cannot read and write, but those who cannot learn, unlearn, and relearn." -- Alvin Toffler
Transcript of S Ta R Chart Presentation

"The illiterate of the 21st century will not be those who cannot read and write, but
those who cannot learn, unlearn, and relearn."
-- Alvin Toffler

What is the Star Chart?
•The Teacher STaR Chart survey enables teachers to see what the expectations for Technology and Instruction are for all teachers, and to self-assess their progress toward meeting these expectations•Shows the technology expectations for all teachers.•Allows teachers to self assess their own progress.
What is the Star Chart? School Technology and Readiness Chart
1.Define the STaR Chart process.
2.Review Scores from 2006 to Present.
3.Identify Trends.4.Share reasons for StaR chart
Trends.5.Direct teachers to the TEA
website for more Star chart information.
Today’s Objectives

Teaching & Learning
2008-09:15
2007-08:14
2006-07:14
2008-09: Advanced Tech
2007-08: Developing Tech
2006-07: Developing Tech
Educator Preparation & Development
2008-09:17
2007-08:13
2006-07:11
2008-09: Advanced Tech
2007-08: Developing Tech
2006-07: Developing Tech
Leadership, Administration, & Instructional
2008-09:15
2007-08:18
2006-07:17
2008-09: Advanced Tech
2007-08: Advanced Tech
2006-07: Advanced Tech
Support Infrastructure for Technology
2008-09:16
2007-08:18
2006-07:18
2008-09: Advanced Tech
2007-08: Advanced Tech
2006-07: Advanced Tech
2006–2009 Results

• Discuss possible reasons this trend is positive.
• Refer to your handout for detailed information.
• List the factors for the trend.
trends
Teaching & Learning
2008-09:15
2007-08:14
2006-07:14
Positive Trend
Trends
• Discuss possible reasons this trend is positive.
• Refer to your handout for detailed information.
• List the factors for the trend.
trends
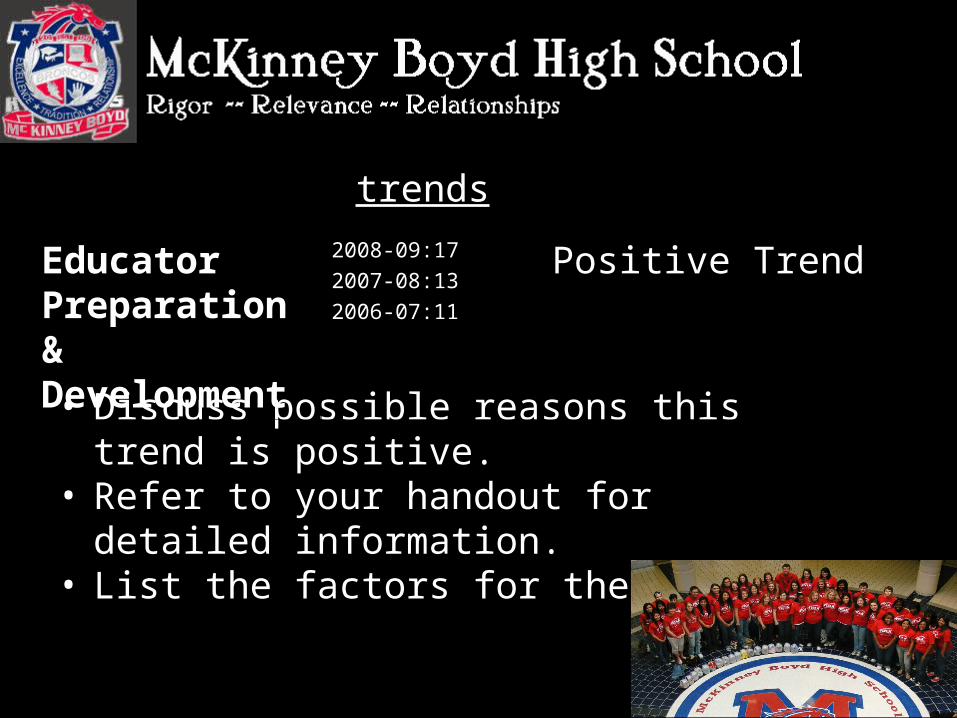
Educator Preparation & Development
2008-09:17
2007-08:13
2006-07:11
Positive Trend
Trends

• Discuss possible reasons the decline in this area.
• Refer to your handout for detailed information.
• List the factors for the trend.
trends
Leadership Administration & Instructional Support
2008-09:15
2007-08:18
2006-07:17
Declining
Trends

• Discuss possible reasons the decline in this area.
• Refer to your handout for detailed information.
• List the factors for the trend.
trends
Infrastructure for Technology
2008-09:16
2007-08:18
2006-07:18
Declining
Trends

Summary•The Long-Range Plan for Technology identifies four Key Areas:
•Teaching and Learning•Educator Preparation and Development•Leadership, Administration and Instructional Support•Infrastructure for Technology.
•Each Key Area is divided into Teacher STaR Chart Focus Areas.
•Each Focus Area has indicators that assess the teacher’s Level of Progress.
•Boyd HS has shown Advance progress in the areas of Teaching and Learning, and Educator
Preparation and Development.
•Boyd HS needs to reverse the decline in the areas of Leadership, Administration & Instructional
Support, and Infrastructure and Technology.
•In order to generate a summary report, complete the online Texas Teacher STaR Chart at:
www.tea.state.tx.us/starchart.
Helpful LinksTEXAS STAR CHART
TEXAS EDUCATION AGENCY
TEXAS COMPUTER EDUCATION ASSOCIATION