S. SERKAN KURBAL - Middle East Technical University · S. SERKAN KURBAL MAY 2011 S.S. ... Haziran...
144
AN INVESTIGATION OF MATHEMATICS ACHIEVEMENT OF EIGHTH GRADE STUDENTS WITH RESPECT TO THEIR LEARNING STYLES S. SERKAN KURBAL MAY 2011 S.S. KURBAL
Transcript of S. SERKAN KURBAL - Middle East Technical University · S. SERKAN KURBAL MAY 2011 S.S. ... Haziran...

AN INVESTIGATION OF MATHEMATICS ACHIEVEMENT OF EIGHTH
GRADE STUDENTS WITH RESPECT TO THEIR LEARNING STYLES
S. SERKAN KURBAL
MAY 2011
S.S
. KU
RB
AL

AN INVESTIGATION OF MATHEMATICS ACHIEVEMENT OF EIGHTH
GRADE STUDENTS WITH RESPECT TO THEIR LEARNING STYLES
A THESIS SUBMITTED TO
THE GRADUATE SCHOOL OF SOCIAL SCIENCES
OF
MIDDLE EAST TECHNICAL UNIVERSITY
BY
S. SERKAN KURBAL
IN PARTIAL FULFILLMENT OF THE REQUIREMENTS
FOR
THE DEGREE OF MASTER OF SCIENCE
IN
THE DEPARTMENT OF ELEMENTARY SCIENCE AND MATHEMATICS
EDUCATION
MAY 2011
Approval of the Graduate School of Social Sciences
Prof. Dr. Meliha ALTUNIŞIK
Director
I certify that this thesis satisfies all the requirements as a thesis for the degree of
Master of Science.
Prof. Dr. Hamide ERTANPINAR
Head of Department
This is to certify that we have read this thesis and that in our opinion it is fully
adequate, in scope and quality, as a thesis for the degree of Master of Science.
Assoc. Prof. Dr. Erdinç ÇAKIROĞLU
Supervisor
Assist. Prof. Dr. Şule Özkan KAŞKER (AEU,ELE) ______________
Assoc. Prof. Dr. Erdinç ÇAKIROĞLU (METU,ELE) ______________
Assoc. Prof. Dr. Jale ÇAKIROĞLU (METU,ELE) ______________
Assist. Prof. Dr. Mine IŞIKSAL (METU,ELE) ______________
Assist. Prof. Dr. Çiğdem HASER (METU,ELE) ______________

iii
I hereby declare that all information in this document has been obtained and
presented in accordance with academic rules and ethical conduct. I also declare
that, as required by these rules and conduct, I have fully cited and referenced
all material and results that are not original to this work.
Name, Last name: S. Serkan KURBAL
Signature:

iv
ABSTRACT
AN INVESTIGATION OF MATHEMATICS ACHIEVEMENT OF EIGHTH
GRADE STUDENTS WITH RESPECT TO THEIR LEARNING STYLES
Kurbal, S. Serkan
M.S., Department of Elementary Science and Mathematics Education
Supervisor : Assoc. Prof. Dr. Erdinç ÇAKIROĞLU
May 2011, 125 pages
This study aimed to investigate the differences in mathematics achievement
scores of the eighth grade students with respect to their learning styles. Mathematics
achievements of the eighth grade students were determined by the number of correct
answers given in the mathematics subtest of Level Determination Examination
(abbreviated in Turkish as SBS) which was administered in June 2009. Mathematics
achievements of the eighth grade students were also determined by teacher-assigned
mathematics grades which were given at the end of the school year of 2008-2009.
Learning styles of different students were determined by Learning Style
Questionnaire developed by Kolb.
This study was conducted with 283 eighth grade students who attended
schools located in different specified regions (city centre, suburban and villages) of
Mustafakemalpaşa town of Bursa during spring semester of 2008-2009.

v
The data were analyzed by using Kruskal-Wallis Test and Mann-Whitney U
Test. The results indicated that the most common learning style was found to be
assimilators. The results of the statistical analyzes showed that there was a
significant difference in mathematics achievement scores of students with respect to
learning styles. The mean of the SBS mathematics scores of convergers were found
to be higher than that of assimilators, divergers and accommodators. The mean of
both SBS mathematics achievement scores and teacher assigned mathematics scores
of female students were found to be higher than that of male students. The mean
SBS mathematics achievement scores of students who attended different schools
located in the city centre were found to be higher than that of students who attended
schools located in the suburbia and villages.
Keywords: Learning Styles, Mathematics Achievement
vi
ÖZ
SEKİZİNCİ SINIF ÖĞRENCİLERİNİN MATEMATİK BAŞARILARININ
ÖĞRENME BİÇİMLERİNE GÖRE İNCELENMESİ
Kurbal, S. Serkan
Yüksek Lisans, İlköğretim Fen ve Matematik Alanları Eğitimi Bölümü
Tez Yöneticisi : Doç. Dr. Erdinç ÇAKIROĞLU
Mayıs 2011, 125 sayfa
Bu çalışmanın amacı; sekizinci sınıf öğrencilerinin matematik başarılarındaki
farklılıkların öğrenme biçimlerine göre incelenmesidir. Sekizinci sınıf öğrencilerinin
matematik başarı puanları; Haziran 2009’da gerçekleştirilen Seviye Belirleme
Sınavı (SBS) matematik testindeki doğru yanıt sayısı ve matematik öğretmenlerince
2008–2009 dönem sonunda verilen karne notlarına göre belirlenmiştir. Öğrencilerin
öğrenme biçimleri, Kolb tarafından geliştirilen Öğrenme Biçimleri Ölçeği ile
belirlenmiştir.
Bu çalışma; 2008 – 2009 eğitim öğretim yılının 2. döneminde, Bursa ili
Mustafakemalpaşa ilçesinin farklı bölgelerindeki (şehir merkezi, belde ve köyler)
okullara devam eden 283 öğrenci ile gerçekleştirilmiştir.
Ölçme araçlarından elde edilen bulgular karşılaştırmalı olarak Kruskal –
Wallis Testi ve Mann – Whitney U Testi ile analiz edilmiştir. Çalışmaya katılan
öğrenciler arasında özümseyen öğrenme stilinin en yaygın olduğu tespit edilmiştir.
vii
İstatiksel sonuçlar, öğrencilerin öğrenme biçimleri ile matematik başarıları arasında
anlamlı bir farklılığın olduğunu göstermiştir. Ayrıştıran öğrenme biçimine sahip
öğrencilerin SBS matematik testi doğru ortalamalarının özümseyen, değiştiren ve
yerleştiren öğrenme biçimlerine sahip öğrencilerden daha yüksek olduğu
bulunmuştur. Kız öğrencilerin matematik başarı puanlarının erkek öğrencilerin
matematik başarı puanlarından daha yüksek olduğu bulunmuştur. Ayrıca şehir
merkezindeki okullara devam eden öğrencilerin SBS matematik doğru
ortalamasının, belde ve köy okullarına devam eden öğrencilerin matematik doğru
ortalamalarından yüksek olduğu görülmüştür.
Anahtar Kelimeler: Öğrenme Stilleri, Matematik Başarısı

viii
To
My Parents and Sister
Sevim, Selçuk and Seçil KURBAL
Who always stand by me...

ix
ACKNOWLEDGMENTS
First of all, I would like to thank my supervisor Erdinç ÇAKIROĞLU for his
support, encouragement and guidance. In the preparation of this thesis, he really
helped me to overcome the problems. He always criticized and compensated faults
in thoughtful manner.
I would like to also thank my proceeding supervisor Dr. Yusuf KOÇ for his
efforts and approach to pilot study of this master thesis. For his different and
disciplinary approach, I learned the methodologies of scientific studies.
I extend my thanks to committee members of jury who are Assoc. Prof .Dr.
Jale ÇAKIROĞLU, Assist. Prof. Dr. Şule Özkan KAŞKER, Assist. Prof. Dr. Mine
IŞIKSAL and Assist. Prof. Dr. Çiğdem HASER for giving me chance to complete
this master thesis by providing time extension.
I would like to express my sincere thanks to assistant principals and principals
of the schools while I had been working on during the completion of this master
thesis for their support and thoughtful behaviours showed to me.
I thank my colleagues and friends who directly supported me. I would like to
thank my colleagues Maximillan Ches MANN, Christine Elizabeth YOLDAŞ and
Sedef ERDOĞAN for editing my master thesis meticulously.
My deepest thanks go to my aunts especially Mehtap KURBAL and Semra
ALTAY. You both opened the doors of your houses to the end. You both always
invited me to stay your houses and always hosted me comfortably in your houses
during my master thesis. Thank you really.

x
I would like to express my grateful and heartfelt thanks to my devoted family
who are my mother Sevim KURBAL, my father Selçuk KURBAL and my sister
Seçil KURBAL for their great efforts trust and patience showed to me. At all the
difficult times in my life, you all were stood by me. Thank you for deepness
understanding and thoughtfulness. This master thesis is yours.
.

xi
TABLE OF CONTENTS
PLAGIARISM...........................................................................................................iii
ABSTRACT .............................................................................................................. iv
ÖZ .............................................................................................................................. vi
DEDICATION ........................................................................................................ viii
ACKNOWLEDGMENTS ................................................................................... …. ix
TABLE OF CONTENTS .......................................................................................... xi
LIST OF TABLES ................................................................................................. xiv
LIST OF FIGURES ............................................................................................... xvii
LIST OF SYMBOLS ............................................................................................ xviii
CHAPTERS
1. INTRODUCTION .................................................................................................. 1
1.1 Purpose of Study ....... ……………………………………………………………4
1.2 Research Questions...............................................................................................5
1.3 Hypothesis………………………………………………………..……………...5
1.4 Definition of Important Terms………………………..…………………………6
1.5 Significance of Study……………………………………………………….…...7
1.6 My Motivation to the Study……………………………………..……………....8
2. REVIEW OF LITERATURE……………………………………………..……..11
2.1 Definition of Learning from the Perspective of Experiential Learning Theory..11
2.2 Learning Styles………………..………………………………………………..13
2.3 Bases of Kolb’s Learning Styles Model………………..………………………15
2.4 Kolb’s Model for Learning Styles in the Experiential Learning Theory………19
2.4.1 Development of Learning Style in the Experiential Learning Theory…...19
2.4.2 Learning Modes………………………………..…………….………...…21
2.4.3 Types of Learning Styles..………………………..………………………25
2.5 Studies on Learning Styles….…………..….......................................................29
2.6 Summary..............................................................................................................39

xii
3. METHODOLOGY….………………..……..…………………………………. .41
3.1 Research Design...........................................................................................…...41
3.2 Population and Sample……………………………..………………..…………42
3.3 Variables.......................................................................................................…...45
3.3.1 Dependent Variables…………………………..…………………………45
3.3.2 Independent Variables……………………………..……………………..46
3.4 Data Collection Instruments……………………………………………………47
3.4.1 Learning Style Inventory…………………………..……………………..47
3.4.2 Mathematics Subtest of SBS…………..…………………………………52
3.5 Procedure……………………………………………..………..……………….53
3.6 Data Analysis................................................................................................…...55
3.7 Assumptions and Limitations of Study……………………..…………….........56
3.7.1 Assumptions of Study………………………………………………........56
3.7.2 Limitations of Study……………………………………………………...56
3.8 Internal Validity of the Study……………………………………………..……57
3.9 External Validity of Study………………………………………………...........58
4. RESULTS……………………………..………………………………………....59
4.1 Descriptive Statistics……………………………………………………...........59
4.1.1 Descriptive Statistics and Mathematics Subtest of SBS…………….........59
4.1.2 Descriptive Statistics and Teacher Assigned Mathematics Scores…........61
4.1.3 Descriptive Statistics of Learning Style Inventory…………………..…...63
4.2 Inferential Statistics…………………………..………………………………...69
4.2.1 Reason of Use and Assumptions of Mann-Whitney U Test………..…….70
4.2.2 Reason of Use and Assumptions of Kruskal – Wallis Test ……………...71
4.2.3 State of Normal Distribution for Study’s Variable…………….………....71
4.2.4 Analyses of Variance for Variables of Study…………….……………....73
4.2.4.1 Learning Style Types and SBS Mathematics Achievement
Scores…………………………………………………………………….73
4.2.4.2 Learning Styles and Teacher Assigned Mathematics
Scores ……………………………………………………………………79
4.2.5 Analysis of SBS Mathematics Achievement Scores and Teacher

xiii
Assigned Mathematics Scores According to Gender…………………….81
4.2.6 Analysis of Students’ Mathematics Achievement Scores According
to Their Schools’ Location in the Specified Regions of Town………… 83
4.3 Assessment of Hypothesizes of Study.................................................………....88
4.3.1 Null Hypothesis 1..........................................................................….........89
4.3.2 Null Hypothesis 2……….…………………………………………..........89
4.3.3 Null Hypothesis 3……………………….……………………………..…89
4.3.4 Null Hypothesis 4…………………………………………..….…………90
4.4 Summary of Descriptive and Inferential Statistics…………..…………………90
5. CONCLUSIONS, DISCUSSIONS AND IMPLICATIONS………………..…..93
5.1 Summary of Research Study…………………………………………...............93
5.2 Conclusions……………………………………………………..……………...94
5.3 Discussions of Results………………………………………………..………...95
5.4 Implications of Study…..……………………………………………………..103
5.5 Recommendations for Further Studies………………………………..……....104
REFERENCES………………………………………………….……………..….109
APPENDIECES
A. LEARNING STYLE INVENTORY (LSI)……………..……………….........123

xiv
LIST OF TABLES
TABLES
Table 3.1 Number of Schools, Selected Schools and the 8th Grade Students of
Selected Schools………….………………..………………………....44
Table 3.2 Distribution of Ages According to Genders ...................................... ..45
Table 3.3 Categorization of Research Variables ......................................... …....45
Table 3.4 Reliability Scores of Current Study, Kolb’s Study and Aşkar &
Akkoyunlu’s Study…………………………………………………...51
Table 3.5 Topics of Questions in Mathematics Sub – Test of 8th Grade
SBS in 2009……………………………………………......................49
Table 4.1 Descriptive Statistics Related to the Mathematics Achievement
Scores in Mathematics Sub – Test of SBS According to Gender…....60
Table 4.2 Students’ SBS Mathematics Achievement Scores According to Their
Schools’ Location in the Specified Regions of Mustafakemalpaşa….61
Table 4.3 Quality – Point Equivalents of the Grades of Teacher Assigned
Mathematics Scores administered by National Ministry of
Education ………………………………………………………….…62
Table 4.4 Students’ Teacher Assigned Mathematics Scores According to Their
Schools’ Locations in the Specified Regions of Mustafakemalpaşa ...63
Table 4.5 Distribution of Learning Style Types According to Gender ……...…65
Table 4.6 Percentages of the Four Learning Styles According to Gender……...60
Table 4.7 Mean of Mathematics Achievement Scores in the subtest of
SBS…………………………………………………………………...65
Table 4.8 Teacher Assigned Mathematics Mean Scores of Students Having
Different Learning Styles ………………………………….......…….68
Table 4.9 Test of Normality Scores for Mathematics Achievement Scores in
SBS and Teacher Assigned Mathematics Scores According to
Gender………………………………………………………………..72

xv
Table 4.10 Test of Normality Scores for SBS Mathematics Achievement Scores
and Teacher Assigned Mathematics Scores According to Learning
Styles…………………………….…………………………………...73
Table 4.11 Kruskal – Wallis Test Scores of SBS Mathematics Achievement
Scores among Learning Style Types ……………………. …..……...74
Table 4.12 Mean Ranks of SBS Mathematics Achievement Scores Regarding to
Learning Styles ………………………………………...…………….75
Table 4.13 SBS Mathematics Achievement Scores Regarding Learning
Styles of Accommodators and Divergers………….…………..……..76
Table 4.14 SBS Mathematics Achievement Scores Regarding Learning
Styles of Accommodators and Convergers…………………………. 76
Table 4.15 SBS Mathematics Achievement Regarding Learning
Styles of Accommodators and Assimilators……..………….…..........77
Table 4.16 SBS Mathematics Achievement Scores Regarding Learning
Styles of Divergers and Converger…....…………………...…………78
Table 4.17 SBS Mathematics Achievement Scores Regarding Learning
Styles of Divergers and Assimilators………………………………...78
Table 4.18 SBS Mathematics Achievement Scores Regarding Learning
Styles of Convergers and Assimilators……………………………….79
Table 4.19 Kruskal – Wallis Test Scores of Teacher Assigned Mathematics
Scores Regarding Learning Styles……………………………………80
Table 4.20 Mean Rank Scores for TAMS Score for Gender…………………….80
Table 4.21 Mann – Whitney U Test Significance Scores for the SBSMATH
According to Gender…………………………………………...…….82
Table 4.22 Mann – Whitney U Test Significance Scores for Teacher Assigned
Mathematics Scores According to Gender…………………………...83
Table 4.23 Kruskal – Wallis Test Scores of Students’ SBS Mathematics
Achievement Scores According to Their Schools Located in the
Specified Regions of Town ……………………………………...…..84
xvi
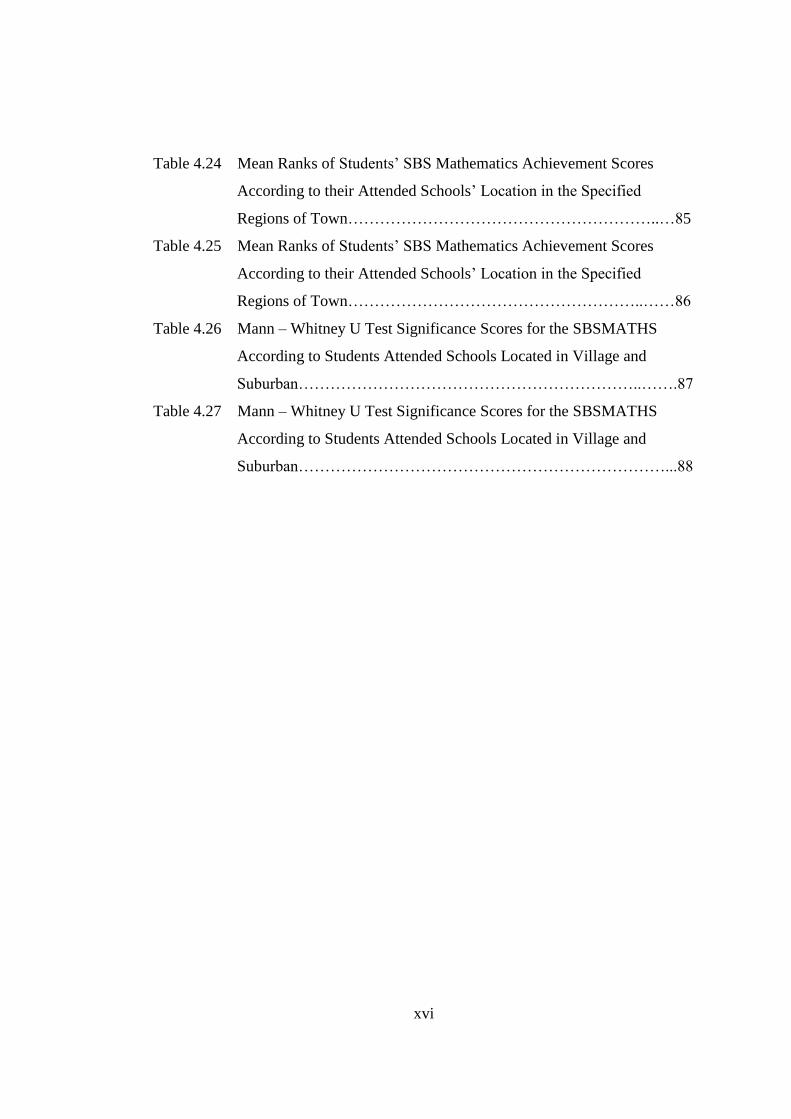
Table 4.24 Mean Ranks of Students’ SBS Mathematics Achievement Scores
According to their Attended Schools’ Location in the Specified
Regions of Town…………………………………………………..…85
Table 4.25 Mean Ranks of Students’ SBS Mathematics Achievement Scores
According to their Attended Schools’ Location in the Specified
Regions of Town………………………………………………..……86
Table 4.26 Mann – Whitney U Test Significance Scores for the SBSMATHS
According to Students Attended Schools Located in Village and
Suburban………………………………………………………..…….87
Table 4.27 Mann – Whitney U Test Significance Scores for the SBSMATHS
According to Students Attended Schools Located in Village and
Suburban……………………………………………………………...88

xvii
LIST OF FIGURES
FIGURES
Figure 2.1 The Experiential Learning Cycle and Regions of the Cerebral
Cortex………………………………………………………………...19
Figure 2.2 Four Learning Modes of Experiential Learning Theory……………...23
Figure 2.3 Learning Styles in the Learning Circle………………………….........28
Figure 2.4 Strengths of Learning Styles……………………………………….…29
Figure 3.1 Learning Modes Grid…………………………………………….…...49
Figure 3.2 Learning Styles Grid……...……………………………...…………...50
Figure 4.1 Box plot for SBS Mathematics Achievement Scores and Learning
Styles......……………………………………………………………..67
Figure 4.2 Box Plot for Teacher Assigned Mathematics Scores and Learning
Styles..............................................................................................…...69

xviii
LIST OF SYMBOLS
SYMBOLS
LSI : Learning Style Inventory
SBS : Seviye Belirleme Sınavı (Level Determination Exam)
SBSMATHS : Mathematics Achievement Scores in the Subtest of SBS
TAMS : Teacher Assigned Mathematics Scores

1
CHAPTER I
INTRODUCTION
Most educators recognize that understanding the ways in which individuals
learn is a key element for the improvement of education (Collinson, 2000). Turkish
students’ mathematics performances in examinations which assessed overall criteria
have been reported to be very low in internationally (Programme for International
Student Assessment, PISA, 2003 and 2006) and national assessment studies (Level
Determination Exam, Turkish abbreviation SBS, 2009 and 2010). There are
discussions for major overhauls in improvement (Ministry of National Education,
2003, 2006, 2009, 2010). It has been argued that many students do not know how to
use mathematical fundamentals and for this reason students have not developed
higher order thinking skills in mathematics (PISA Report, Ministry of National
Education, 2007). Besides, understanding the use of mathematics and its reasoning
is crucial to be a qualified individual in professions like engineering, software
technology and even more in the health sciences.
Mathematics is a compulsory qualification for understanding today’s world. It
is reasonable to argue that deficiencies in utilizing mathematics arose from
inadequate application in mathematics instruction which did not take into account
different learning styles.
Finding the answers to the questions: “How do students learn?”, “Do all
students learn in the same way?” and ‘Why do students choose specific ways to
2
learn?’ would be the first step in increasing mathematical achievement in
examinations. Finding the answers to those questions would also lead to innovations
in the instructional strategies of handling mathematics lessons.
Understanding the differences in learning requires understanding the process
of learning mechanisms in a student’s mind. Theory of cognitive learning is taken
into account the concept of learning in terms of process, not output of a behavior.
The basic question of this understanding is ‘How does a learner learn?’ rather than
‘What did a learner learn?’
The idea of learning styles is one of the derivations of cognitive learning. The
concept of learning style arose from the studies related with individual differences
(Kaya, 2007). Learning styles originate from characteristics which are inborn and
stable, but changes from person to person (Kaplan & Kies, 1997). Learning styles
delve into the ways in which each learner begins to concentrate on, process, and
retain new and difficult information (Dunn, 1991). Learning styles can also be
described as the combination of cognitive, affective, and physiological factors that
serve as relatively stable indicators of how a learner perceives, interacts with, and
responds to the learning environment. It is demonstrated in a pattern of behavior and
performance by which an individual approaches educational experiences (Keefe &
Ferrell, 1990). Individual thoughts on learning styles show that there should be
certain differences in every individuals learning.
The concept of learning styles was also suggested by David Kolb, a learning
style specialist, under the name of Experiential Learning Theory (ELT) which is the
core of current study to take into account the learning process (Kolb, 1984).
3
According to ELT, “Learning is defined as the process whereby knowledge is
created thorough the transformation of experience. Knowledge results from the
grasping and transforming experience” (Kolb, 1984. p.41). The applications of
learning style model which ELT is offered were analyzed in various studies (Kolb;
Boyatsiz & Mainemalis, 2001). Hichox (1991) examined an important amount of
quantitative and qualitative research related to the applications of learning styles of
the ELT model in the education field and found that 61.7 % of studies supported
the ELT model and, 16.1 % indicated mixed support (with the effect of other
variables) of ELT. Thus, the role of learning styles in the ELT model of
mathematics achievement is the topic that needs further research (Hichox, 1991).
According to researchers’ observation in the literature of learning styles,
number of studies about the role and effect of learning styles on mathematics
achievement of students was relatively low as compared to studies where the
investigated relation between learning styles and the other course achievements like
science, social sciences, web based instructions and language (Schroeder, 1993;
Raiszadeh, 1997; Bailey et al, 1999; Aruilommi & Ark, 2002; Chun – Shing &
Gamon, 2002; Kopsovich, 2003; Özkan, 2003). There are also studies that
concentrate more on learning styles and demographic variables such as gender, age
and origins of people (Severiens et al, 1994, Soylu & Akkoyunlu, 2002, Dunn et al.,
1989). In summation, topics of studies on learning styles showed diversity.
The mathematics achievement of students is assessed in a variety of
measuring instruments. In some of cases, students’ achievements in mathematics
were measured by teacher assigned mathematics examinations. Teacher assigned

4
mathematics examinations were used as a measuring tool in studies which were
about the learning styles and mathematics achievement (Owens, 1999, Kaya et al,
2009).
The more reliable assessments tools that are used, the more valid the scores
are obtained. For this reason, nationally and internationally accepted tests can be a
reasonable source of valid and reliable data. In literature, researcher of the study
could not identify any research study that investigated the relation between students’
mathematics achievements in a national examinations and learning styles. In Turkey
8th
grade students take the SBS which is the Turkish abbreviation for the Level
Determination Examination for the selection of different vocational high schools. It
contains one-hundred questions; twenty of which are mathematics questions. The
mathematics questions were covered by the studies of the 8th
grade mathematics
curriculum which is determined by the National Ministry of Education.
It is important for this study to investigate the mathematics achievement of
students in the national examination in relation with their learning styles. Besides
this, relationship between the teacher assigned grades of students and learning styles
of students are also taken into account together in this study.
1.1 Purpose of Study
The main purpose of this study was to investigate mathematics achievements
of eighth grade students with respect to their learning styles. The other purpose was
to investigate the mathematical achievement scores of the students with respect to
5
their gender and schools’ location in the specified regions of town which are city
center, suburban and village.
1.2 Research Questions
There are four research questions of this study stated as follows:
1. Is there a statistically significant difference in the SBS mathematics scores
of 8th grade students with different learning styles?
2. Is there a statistically significant difference in teacher assigned
mathematics scores of 8th grade students with different learning styles?
3. Is there a statistically significant difference between female and male 8th
grade students regarding their SBS mathematics scores?
4. Is there a statistically significant difference in SBS mathematics scores of
8th grade students according to their schools’ location in the specified
regions of town which are the city centre, suburban and village?
1.3 Hypotheses
The problems of this study stated above were tested with the following
hypotheses which are stated as null hypotheses.
Null Hypothesis 1: There is no statistically significant difference in the SBS
mathematics scores of 8th grade students with different learning styles.
Null Hypothesis 2: There is no statistically significant difference in teacher
assigned mathematics grades of 8th grade students with different learning styles.
6
Null Hypothesis 3: There is no statistically significant difference between
female and male 8th grade students regarding their SBS mathematics scores.
Null Hypothesis 4: There is no statistically significant difference in SBS
mathematics scores of 8th grade students according to their schools’ location in the
specified regions of town which are the city centre, suburban and village.
1.4 Definition of Important Terms
Learning Styles: Perception or assimilation of individuals to new information
and operates or accommodate new perceived information differently with
experiences. Compounds of assimilation and accommodation techniques define
learning styles of the individual. In this research, the learning style is a measure of
an individual’s relative emphasis on the four learning modes or orientations as
identified by Kolb in his Learning Style Inventory (Concrete Experience-CE,
Reflective Observation-RO, Abstract Conceptualization-AC, and Active
Experimentation-AE) and on two combinations scores that indicate the extent to
which the individual emphasizes abstractness over concreteness (AC-CE) and action
over reflection (AE-RO). (Kolb, 1985, p.61)
Level Determination Examination (SBS): It is an examination which
consists of one- hundred questions that are covered with subjects of the 8th
grade
course curriculum which include mathematics, Turkish, science, the social sciences
and English.

7
SBS Mathematics Achievement Scores: The number of correct answers on
an 8th
grade student’ test from mathematics section of the SBS.
Teacher Assigned Mathematics Grade: It is the cumulative grade score
which of an 8th
grade student obtained from the mathematics lesson in the school.
1.5 Significance of Study
Research studies related to learning styles in Turkish context are mostly
descriptive in nature that aims to identify students’ learning styles. (Aktaş &
Mirzeoğlu, 2008; Mutlu & Aydoğdu, 2003; Peker & Aydın, 2003; Şirin & Güzel,
2006;). Beside this, in the Turkish context, most of the studies about learning styles
were conducted in relation to the achievements in the subjects like science, biology,
physical education, language, or architecture (Demirbaş, 2006; Mutlu & Aydoğdu,
2003; Özkan, 2003; Tabanlıoğlu, 2003). Knowledge about the relationship between
students’ learning styles and in national examinations, such as Level Determination
Examination applied in Turkey, is limited. This study will be contributed to
information about the learning styles of students and mathematics achievement of
students in the nationally administered examination.
The successful achievement in Math has always been important for students,
instructors, schools, researchers and also national commissions of education. In the
literature, the reasons that lie beneath the failure and success in mathematics were
investigated from different aspects. Studies that investigated the relationship
between differences in students’ learning styles and the students’ scores in teacher-

8
made mathematics examinations applied at schools were conveyed in different
countries. Clearly, results of investigations on relation of mathematics achievements
of students showed differences as regarding to their learning styles (Raiszadeh,
1997; Kopsovich, 2003; Aruilommi et al., 2002). This study’s outcomes will
hopefully add new information in terms of learning styles differences of students
and their mathematics achievements.
Students’ achievement in mathematics partly depends on the effectiveness of
the instruction provided in the mathematics courses. Studies about the effect of
learning style based instruction to the achievements of students indicated positive
results (Shaughnessy, 1998; Burke & Dunn, 2000). Findings of this study will
inform educators about the learning styles of the study group. This may provide
insight into the efforts of improving instructional approaches used in the
mathematics courses.
Further, researchers still need to identify the importance of learning styles in
the achievement of students in different domains. This study which, is addressed to
identify the relationship between students’ learning styles and mathematics
achievements in nationally administered examination, will be contributed to fill the
gap in the literature.
1.6 My Motivation to the Study
There were important reform movements in Turkish educational system in
2003 and the curricula of almost all elementary school courses changed. Since then,

9
new curricula in any course favored student-based learning instead of teacher
centered instruction. Following that, activity-based instruction was taken into
account as a method teaching mathematics. When this reform winds below in
Turkish education system, I was a student of Elementary Mathematics Education
program in Middle East Technical University (METU). I had a doubt whether
activity-based learning is the only method or the best strategy for mathematics
instruction or not. Teachers should take into account that some students may not like
doing activity. If mathematics is the least favorite course at most of the times among
students in almost every school, then mathematics instruction could be personalized
for every single student. With these considerations, while I was an undergraduate
student, I took the course called “independent studies in mathematics education”
where I could pursue a project in mathematics education. I administered a survey
about learning styles to the students of a private school in Ankara in 2005. My
purpose was to determine upper elementary school students’ learning styles and to
investigate relationship between mathematics achievement, their career intentions
and their learning styles. Since that project, I started to believe that learning styles of
students are interesting dimension to explore. Beside this, in my master’s studies I
began to explore the theory of learning styles especially with personalized teaching.
During my master’s studies I conducted a study titled Generating Mathematics
Manipulative with Gifted Children who Have Different Learning Styles in 2008 at
the Center of Science and Art in Mustafakemalapaşa Town of Bursa. In this study, I
investigated the approach toward mathematics manipulative of gifted students who
have been classified in the same intelligence group, musical, logical – mathematical

10
and linguistic but have different learning styles. According to result of that study,
gifted students who had the same type of intelligence but had a different type of
learning style were taught mathematics in different ways. In light of these studies, I
decided to investigate the relationship of learning styles with mathematic
achievement in a larger sample, which was selected from different locations of the
same town. Moreover, I believe that result of this study will contribute to my
teaching profession in terms of personalized mathematics teaching.

11
CHAPTER II
REVIEW OF LITERATURE
The main purpose of this study was to investigate the relation between SBS
mathematics achievements scores of 8th grade students and learning styles of them.
Investigating the relation between teacher assigned mathematics scores and learning
styles of 8th grade students, difference in both mathematics achievements scores in
SBS and teacher assigned mathematics scores in respect of genders and difference
in mathematics achievements in SBS according to students attended schools located
in the different regions in the town where study was accomplished were the other
purposes of this study. In accordance with those purposes, this chapter is devoted to
the review of literature about learning styles. First, an overview of learning styles is
presented in regard to the birth, development and current shape of the theory. Then,
research studies related to learning styles were reviewed.
2.1 Definition of Learning from the Perspective of Experiential
Learning Theory
Learning is one of the most important individual processes that occur in every
part of human life, as in organizations, education and training programs (Martin,
1999). So, perception of learning shows diversity from which concept of learning
was overviewed. The theoretical core of this study is based on Experiential Learning
Theory (ELT). One of the significant followers and implementers of this theory is

12
David Kolb who was the creator of Learning Styles of ELT. To understand learning
styles in a meaningful manner, perception of learning from the view of ELT should
be identified. Kolb and Kolb (2005) revised the definition of learning in ELT in the
manner that follows:
“Learning is best conceived as a process, not in terms of outcomes. The
primary focus should be on engaging students in a process that best enhances their
learning – a process that includes feedback on the effectiveness of their learning
efforts.” (Kolb & Kolb, 2005, p. 3)
Kolb and Kolb (2005) also emphasized the importance of repetition with
different examples in the learning process with following words: “All learning is
relearning. Learning is best facilitated by a process that draws out the students’
beliefs and ideas about a topic so that they can be examined, tested and integrated
with new, more refined ideas” (Kolb & Kolb, 2005, p. 4).
Kolb and Kolb grounded the learning process as conflict resolution from the
perspective of Piaget’s approach with followings: “Learning requires the resolution
of conflicts between dialectically opposed modes of adaptation to the world.
Conflict, differences, and disagreement are what drive the learning process. In the
process of learning one is called upon to move back and forth between opposing
modes of reflection and action and feeling and thinking. Learning is a holistic
process of adaptation to the world. It is not just the result of cognition but involves
the integrated functioning of the total person—thinking, feeling, perceiving and
behaving. Learning results from synergetic transactions between the person and the
environment. In Piaget’s terms, learning occurs through equilibration of the dialectic

13
processes of assimilating new experiences into existing concepts and
accommodating existing concepts to new experience” (Kolb & Kolb, 2005, p. 5).
Learning is also meant that putting new things and generating ideas.
“Learning is the process of creating knowledge. ELT proposes a constructivist
theory of learning whereby social knowledge is created and recreated in the personal
knowledge of the learner. This stands in contrast to the “transmission” model on
which much current educational practice is based where pre-existing fixed ideas are
transmitted to the learner” (Kolb & Kolb, 2005, p. 6).
From the perspective of ELT, the concept of learning was defined with the
Kolb’s words. In a theoretical structure of study, definition of learning styles was
necessarily to be explained.
2.2 Learning Styles
Since style is a relative word, educators who specialized in learning styles
developed different ideas while investigating learning styles. Introducing different
definitions for learning styles will help to look at the concept from a broader
perspective.
The concept of learning style arose from the studies related with the individual
differences (Kaya, 2007). Learning styles were originally from characteristics which
are inborn and stable but they change thorough the life of person (Kaplan & Kies,
1997). It is generally assumed that learning styles refer to beliefs and behaviors
preferred by individuals to aid their learning in a given situation (Brown, 2000;
Dunn & Griggs, 1998; Hohn, 1995 as cited in Kaya 2007). The concept of learning

14
styles was also described as psychological, cognitive and affective behaviors which
how is an individual perceives, interacts and reacts with learning environments
(Keefe 1982). Learning styles were explained as a concept of emphasizing
perceived talents of an individual which is observable and with distinctive behaviors
(Gregorc, 1984). Last but not least, for a more simple approach, learning styles
defined as educational conditions under which a student is most likely to learn
(Stewart & Felicetti, 1992).
The way an individual learns is his/her learning style. The cognitive, sensory
and physiological structure of individual, which affects his/her perceptions,
behaviors in a learning environment, and interactions with people, defines learning
styles (Mutlu & Aydoğdu, 2004). According to Silver, Strong and Perini (1997),
learning style is a regular or steady way of reacting to new information and using
stimuli in the environment of learning. They argue that roots of learning styles were
based on psychoanalytic questioning of marketplace enterprises to emphasize how
people feel as they solve problems, create products and interact with other people
(Silver, Strong & Perini, 1997).
As seen, there are various definitions of learning styles. Beside the given ones,
there are also descriptions of learning styles from the view of ELT. McCarthy is one
of the crucial learning style specialists. To McCarthy, every individual differently
perceives or assimilates new information and operates or accommodates new
perceived information with experiences. Compounds of assimilation and
accommodation techniques define the learning styles of the individual which are

15
innovative, analytic, dynamic and common sense learners (Morris & McCarthy;
1990; McCarthy, 2000).
Kolb who is an educational researcher had been working on learning styles,
whose theory is the core of the present study. Kolb defined learning styles as a
continuum that one moves through over time, usually people come to prefer, and
rely on, one style over others (Henke, 2001). Observation of events that happened in
the environment of an individual, synthesizes these observations with concepts,
generating ideas (hypotheses) to test and choosing new experiences to apply the idea
which come from the observed concepts cause to come into existence of different
learning styles (Kolb, 1984). Therefore, learning styles are not really concerned with
"what" individuals learn, but rather "how" they prefer to learn. When taking into
account definitions of learning styles, model of learning styles which is the core of
this study is going to be determined.
2.3 Bases of Kolb’s Learning Styles Model
Actually, difference thoughts on learning can be associated with the question
of “Does everyone learn in a same way?” The idea of learning in different ways,
which is referred as learning styles, was born in the 1960s. Rita Dunn was the first
discoverers of learning styles put it in a literary agenda. Dunn (1996) stated the
definition of learning style as a different and authentic learning ways of learners as
one is getting ready for assimilating or remembering new or difficult information
(Dunn, 1996). After the 1960s, there was attention on educational researchers about
learning styles since there exist over twenty different learning style theories in
16
literature and these theories explain the learning styles concept from different points
of views.
There are many learning styles models in the education literature. These
models are based on different point of views, which are physiological,
psychological, cognitive, and affective. As far as the purpose of this study is
considered, psychological and cognitive types of learning style models are taken
into account to express the theoretical bases of ELT.
Carl Jung, a Swiss psychologist, was a contemporary of Sigmund Freud and a
leading exponent of Gestalt personality theory. Clark (2008) states that during the
early 1900s, Carl Jung established field identifying distinct personality patterns.
Many theorists have broken these patterns into categories attempting to make them
easier to understand. Jung developed a personality theory that introduced two
attitudes extroversion and introversion (Clark, 2008). To be clear, extroversion
means "the act, state, or habit of being predominantly concerned with and obtaining
gratification from what is outside the self.’’ Introversion is "the state of or tendency
toward being wholly or predominantly concerned with and interested in one's own
mental life". (Merriam Webster Dictionary, 1993)
Jung explained natural types of learning of students by Psychological Types
Theory (1971). According to Jung, human’s behaviors’ are realized by choosing one
of functions which are judging and perceiving. To Jung, information is perceived
either concretely through sensing or abstractly through intuition. Then, information
is judged either through the logic of thinking or the subjectivity of feeling. These are
the four Jungian functions – sensing, intuition, thinking, and feeling- that exist in

17
every individual. One of these functions is dominant, one is auxiliary and ranks as
the second most used function, and the third is the tertiary function that is not used
too often and demands more energy to use. The fourth function is a person’s inferior
or shadow function and is too weak to use (Silver et al, 2000, cited in Güneş, 2004).
As it can be understood from previous paragraph, cognitive learning styles
began with understanding what lies underneath behavior, which means “What was
in mind when that behavior was done?” To explain behavior from a different
perspective, Kurt Lewin, a social scientist, proposed a mathematical equation as a
function like B = f (P, E) which means that one’s behavior (B) is related to both
one's personal characteristics (P) and to the social situation in which one finds
oneself in environment (E) (Clark, 2008). Clearly, human behavior is the function of
personality and environment. Clark (2008) also stated that Lewin is best known for
his work in the field of organizational behavior and the study of group dynamics.
His research discovered that learning is best facilitated when there is a conflict
between immediate concrete experience and detached analysis within the individual.
His cycle of action, reflection, generalization, and testing is a characteristic of
experiential learning (Clark, 2008).
One of the more important concerns of this study is in the cognitive dimension
of the learning process. Dunn, Sklar, Beaudry and Bruno (2001) stated that bases of
cognitive dimension are extended along the functionality of brain. The
hemispherical shape of the brain is detected by the researchers’ attention and
functionality of this situation was questioned for dozens of centuries. Interest in the
functioning of left and right hemispheres and its implication for human cognition
18
can be traced back to ancient times when Hippocrates suggested that brain was the
organ of mind. Then, much clinical and experimental evidence (Zenhaursen, 1978;
Repetti, Gebhart, Nickel & Levi, 1979) demonstrated differential processing in the
left and right cerebral hemispheres of humans’ intact brain. Different processing of
hemispheres of brain naturally brings a result of different though ways, or styles,
like analytical / global, successive simultaneous or inductive / deductive etc. (Dunn
et al., 2001).
James Zull, a biologist, sees a link between ELT and neuroscience research,
suggesting that this process of experiential learning is related to the process of brain
functioning in his study of In the Art of Changing the Brain: Enriching Teaching by
Exploring the Biology of Learning (Kolb & Kolb, 2005). Put into words, the figure
1 illustrates that concrete experiences that come through the sensory cortex,
reflective observation involves the integrative cortex at the back, creating new
abstract concepts which occurs in the frontal integrative cortex, and active testing
involves the motor brain. In other words, the learning cycle arises from the structure
of the brain. (Zull, 2002, p. 18–19) In the Figure 2.1, the relation of the cerebral
cortex of the brain and learning preferences is indicated.

19
Figure 2.1: The Experiential Learning Cycle and Regions of the Cerebral Cortex
Note. Reprinted with permission from Zull, 2011
In sum, functionality of brain brings the learning process into consideration
and outputs of learning process come with the behaviors. Behaviors are the
cooperation of personality which is the reflection of psychology and environment.
And idea of learning styles according to Experiential Learning Theory is grounded
on those compounds.
2.4 Kolb’s Model for Learning Styles in the Experiential Learning Theory
2.4.1 Development of Learning Style in the Experiential Learning Theory
Kolb’s experiential learning theory is based on a model of the learning circle
which is introduced by Jung in 1923. By utilizing Jung’s model, Kolb introduced
experiential learning theory based on learning styles in the 1970s. According to
Kolb, individuals learn from their experiences and can evaluate results of this
knowledge in a safe way (Peker, 2003).

20
The approach of experiential learning theory toward learning process is
different from behaviorist approach. The reason is called as experiential learning
has two reasons: these are scientific bases of theory came from the studies of John
Dewey, Kurt Lewin, and Jean Piaget, and another reason is rooted from the reality
that experience placed crucial place in the learning process. Kolb (1984) stated in
his book that essence of his theory based on the studies of three scientists who were
Lewin, Piaget and Dewey (Kolb, 1984). Ergür (1998) explained the impression of
Kolb in evolution of Experiential Learning Theory. Kolb was impressed by three
views while composing experiential learning theory which is John Dewey’s views
of pragmatist philosophy, Kurt Lewin’s phenomenological views comes from
Gestalt psychology and rationalist views of Jean Piaget who is a developmental
psychologist. These specifications which experiential learning theory has
distinguished from behaviorist learning theory denies role of experience and
conscious, and is distinguished from cognitive approaches which place importance
on remember in abstract symbols, gaining and guiding of knowledge. Experiential
learning theory introduced the idea of combining the concepts of cognition,
experience, perception and behavior in the learning process (Ergür, 1998).
In this study, Kolb’s Experiential Learning Theory (ELT) is taken into
account as a core for understanding the learning preferences of individuals.
Therefore, Kolb’s definition of learning has become important. Kolb, in fact in ELT,
defined the learning concept as “The process whereby knowledge is created through
the transformation of experience. Knowledge results from the combination of
grasping and from which new implications for action can be drawn. These
21
implications can be transforming experience.” (Kolb, 1984, p. 41) So far, learning
has transformed from behavioral outcomes to cognitive progression. When the
learning concept is thought, then learning cannot be squeezed into just two concepts
like behavioral outcomes or cognitive progression. Like in the definition of ELT, a
combination of these two concepts, behaviors and cognition, would give the mind
insight to understand the nature of learning. As it can be understood by the Kolb’s
definition of learning, learning is cyclical process and is needed to be based on
observing or observing concrete experience and its transformation to information
and taking action with individual implication or contribution.
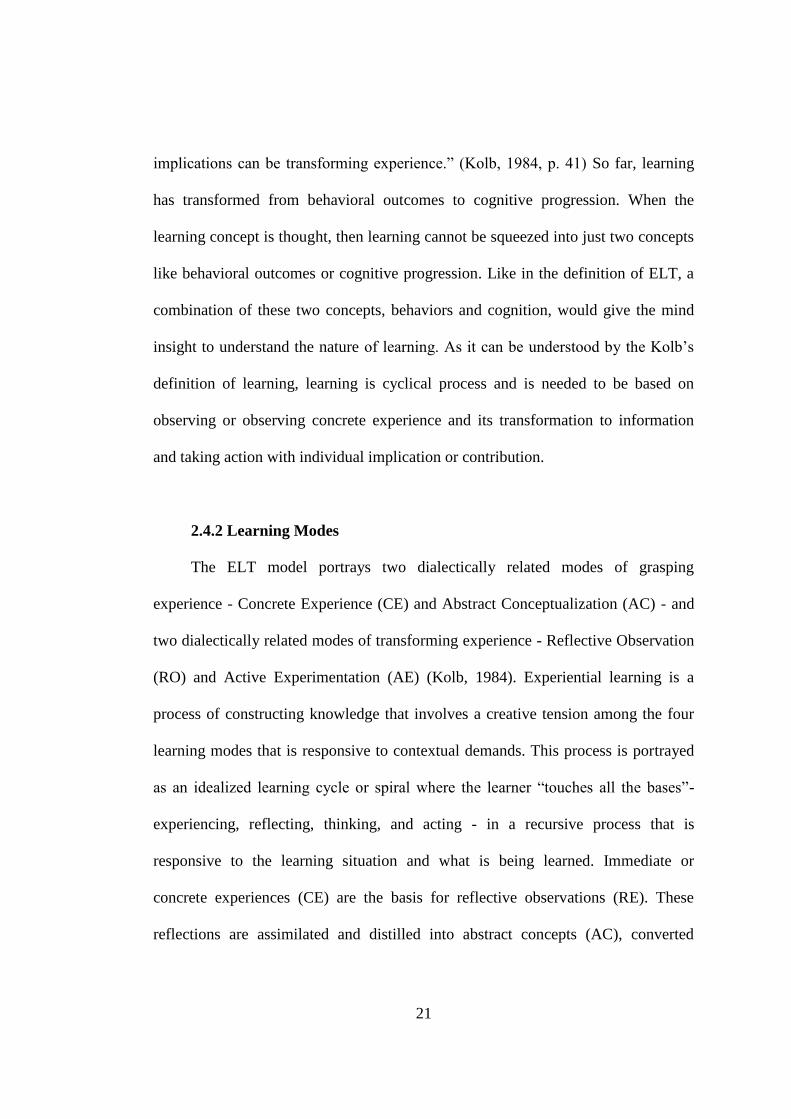
2.4.2 Learning Modes
The ELT model portrays two dialectically related modes of grasping
experience - Concrete Experience (CE) and Abstract Conceptualization (AC) - and
two dialectically related modes of transforming experience - Reflective Observation
(RO) and Active Experimentation (AE) (Kolb, 1984). Experiential learning is a
process of constructing knowledge that involves a creative tension among the four
learning modes that is responsive to contextual demands. This process is portrayed
as an idealized learning cycle or spiral where the learner “touches all the bases”-
experiencing, reflecting, thinking, and acting - in a recursive process that is
responsive to the learning situation and what is being learned. Immediate or
concrete experiences (CE) are the basis for reflective observations (RE). These
reflections are assimilated and distilled into abstract concepts (AC), converted

22
active experimentation (AE) and serve as guides in creating new experiences (Kolb,
1984).
The concept of learning style describes individual differences in learning
based on the learner’s preferences for employing different phases of the learning
cycle. Kolb explained this with following words: “Because of our hereditary
equipment, our particular life experiences, and the demands of our present
environment, we develop a preferred way of choosing among the four learning
modes. We resolve the conflict between being concrete or abstract and between
being active or reflective in a patterned, characteristic way (Kolb, 1984, p. 42). In
the Figure 2.2, learning modes of an individual is indicated.
23
Figure 2.2: Four Learning Modes of Experiential Learning Theory
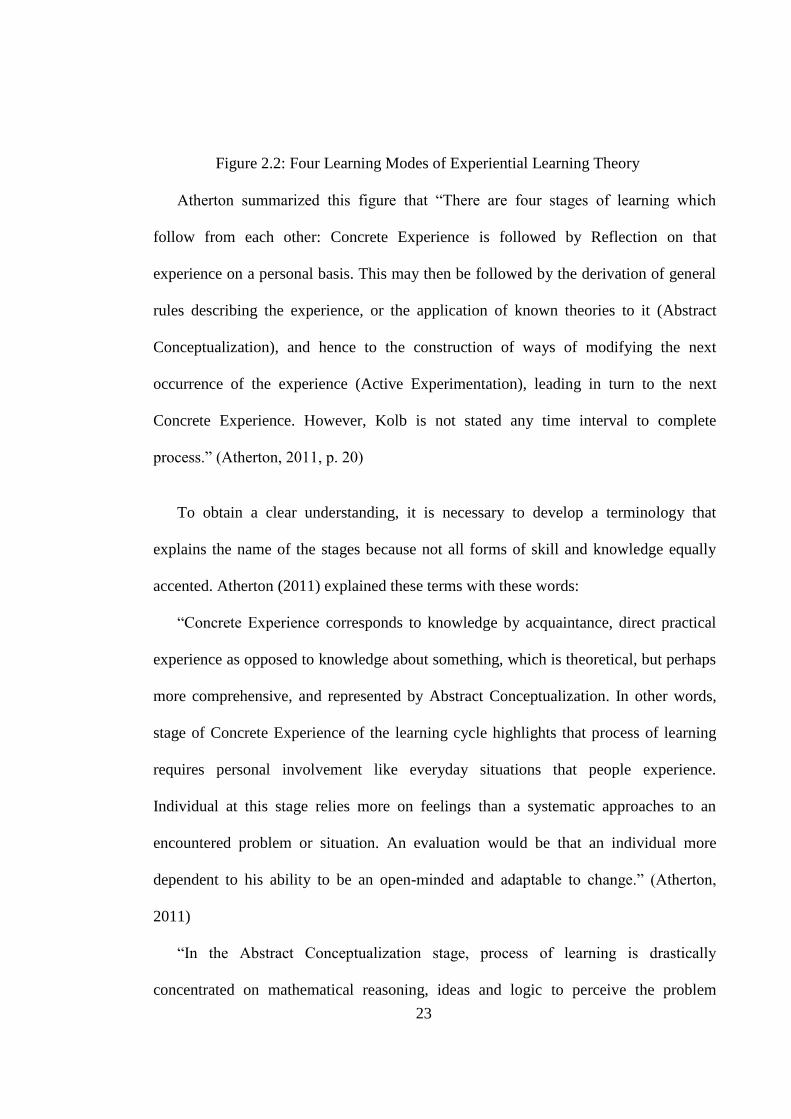
Atherton summarized this figure that “There are four stages of learning which
follow from each other: Concrete Experience is followed by Reflection on that
experience on a personal basis. This may then be followed by the derivation of general
rules describing the experience, or the application of known theories to it (Abstract
Conceptualization), and hence to the construction of ways of modifying the next
occurrence of the experience (Active Experimentation), leading in turn to the next
Concrete Experience. However, Kolb is not stated any time interval to complete
process.” (Atherton, 2011, p. 20)
To obtain a clear understanding, it is necessary to develop a terminology that
explains the name of the stages because not all forms of skill and knowledge equally
accented. Atherton (2011) explained these terms with these words:
“Concrete Experience corresponds to knowledge by acquaintance, direct practical
experience as opposed to knowledge about something, which is theoretical, but perhaps
more comprehensive, and represented by Abstract Conceptualization. In other words,
stage of Concrete Experience of the learning cycle highlights that process of learning
requires personal involvement like everyday situations that people experience.
Individual at this stage relies more on feelings than a systematic approaches to an
encountered problem or situation. An evaluation would be that an individual more
dependent to his ability to be an open-minded and adaptable to change.” (Atherton,
2011)
“In the Abstract Conceptualization stage, process of learning is drastically
concentrated on mathematical reasoning, ideas and logic to perceive the problem
24
instead of relying on feelings. In contrast to CE, individual at this stage uses his mind in
a way of systematic planning, developing theories and ideas and problem solving.”
(Atherton, 2011)
“Reflective Observation concentrates on what the experience means to the
experience, or its connotations, while Active Experimentation transforms the theory of
Abstract Conceptualization by testing it in practice and relates to its denotations. In
other words, individuals at the stage of Reflective Observation able to understand the
ideas and see encounter situations from different points of view. This stage can be
viewed as a calm approach to experienced event so that individuals at this stage depend
on more objectivity, patience to learn and careful judgment rather than take an action.
People would rely on their own thoughts and feelings.” (Atherton, 2011)
“Active experimentation can be seen as vivacious stage of learning cycle. Learning
has an active form which is in the variable situations and experimenting with
influencing. Individuals possess the active approaches and concentrated on what really
works. People want to see results and getting involved the process of learning.”
(Atherton, 2011)
2.4.3 Types of Learning Styles
Many of the research on ELT have focused on the concept of learning style
using the Learning Style Inventory (LSI) to assess individual learning styles (Kolb
1971, 1985, 1999). While individuals tested on the LSI show many different
patterns of scores, previous researches with the instrument have identified four
learning styles that are associated with different approaches to learning —

25
Diverging, Assimilating, Converging, and Accommodating. The following
summary of the four basic learning styles is based on both research and clinical
observation of these patterns of LSI scores (Kolb, 1984, 1999a).
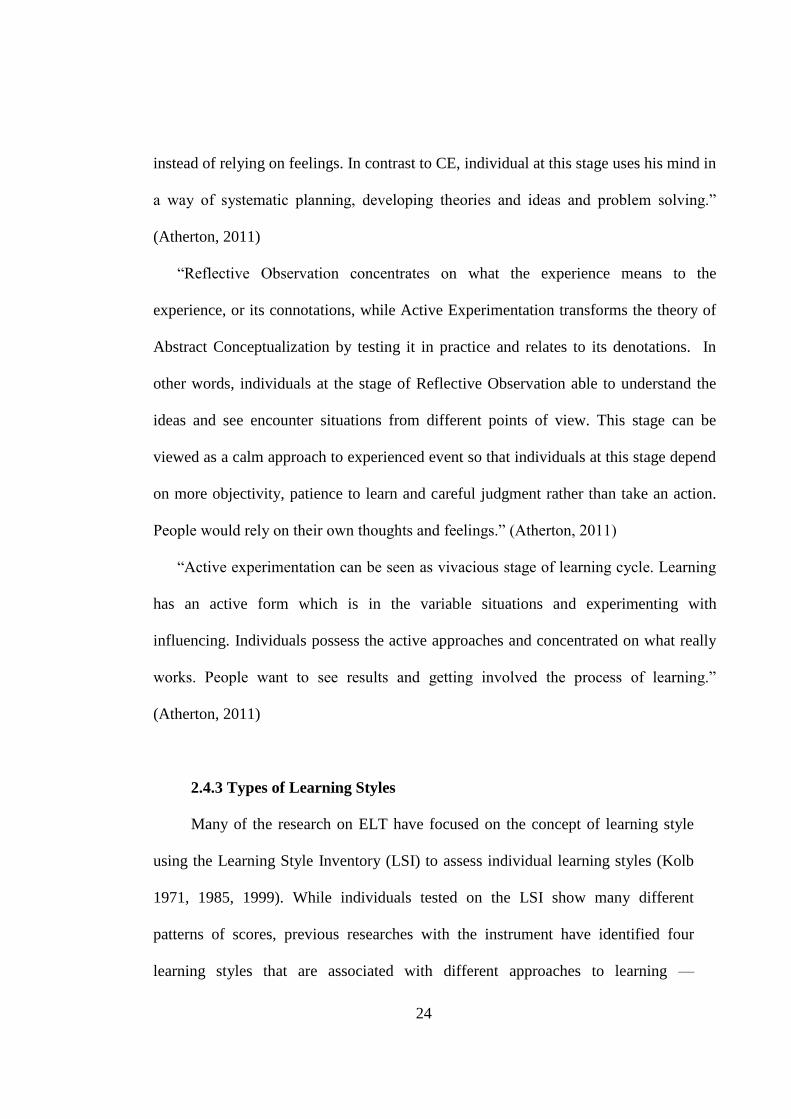
According to Kolb (1984) an individual with diverging style has CE and RO
as dominant learning abilities. He argued that people with this learning style are best
at viewing concrete situations from many different points of views. Kolb labeled it
as “diverging” because a person with it performs better in situations that call for
generation of ideas, such as a “brainstorming” session. People with a Diverging
learning style have broad cultural interests and like to gather information. They are
interested in people, tend to be imaginative and emotional, have broad cultural
interests, and tend to specialize in the arts. In formal learning situations, people with
the Diverging style prefer to work in groups, listening with an open mind and
receiving personalized feedback (Kolb, 1984).
An individual with an assimilating learning style has AC and RO as dominant
learning abilities (Kolb, 1984). People with this learning style are best at
understanding a wide range of information and putting into concise, logical form.
Individuals with an assimilating style are less focused on people and more interested
in ideas and abstract concepts. Generally, people with this style find it more
important that a theory have logical soundness than practical value. The
Assimilating learning style is important for effectiveness in information and science
careers. In formal learning situations, people with this style prefer readings, lectures,
exploring analytical models, and having time to think things through (Kolb, 1984).
26
Kolb (1984) stated that an individual with a converging learning style has
AC and AE as dominant learning abilities. People with this learning style are best at
finding practical uses for ideas and theories. They have the ability to solve problems
and make decisions based on finding solutions to questions or problems. Individuals
with a Converging learning style prefer to deal with technical tasks and problems
rather than with social issues and interpersonal issues. These learning skills are
important for effectiveness in specialist and technology careers. In formal learning
situations, people with this style prefer to experiment with new ideas, simulations,
laboratory assignments, and practical applications (Kolb, 1984).
An individual with an accommodating learning style has CE and AE as
dominant learning abilities (Kolb 1984). People with this learning style have the
ability to learn from primarily “hands-on” experience. They enjoy carrying out plans
and involving themselves in new and challenging experiences. Their tendency may
be to act on “gut” feelings rather than on logical analysis. In solving problems,
individuals with an Accommodating learning style rely more heavily on people for
information than on their own technical analysis. This learning style is important for
effectiveness in action-oriented careers such as marketing or sales. In formal
learning situations, people with the Accommodating learning style prefer to work
with others to get assignments done, to set goals, to do field work, and to test out
different approaches to completing a project (Kolb, 1984). In the Figure 2.3,
learning styles are indicated.

27
Figure 2.3: Learning Styles in the Learning Circle
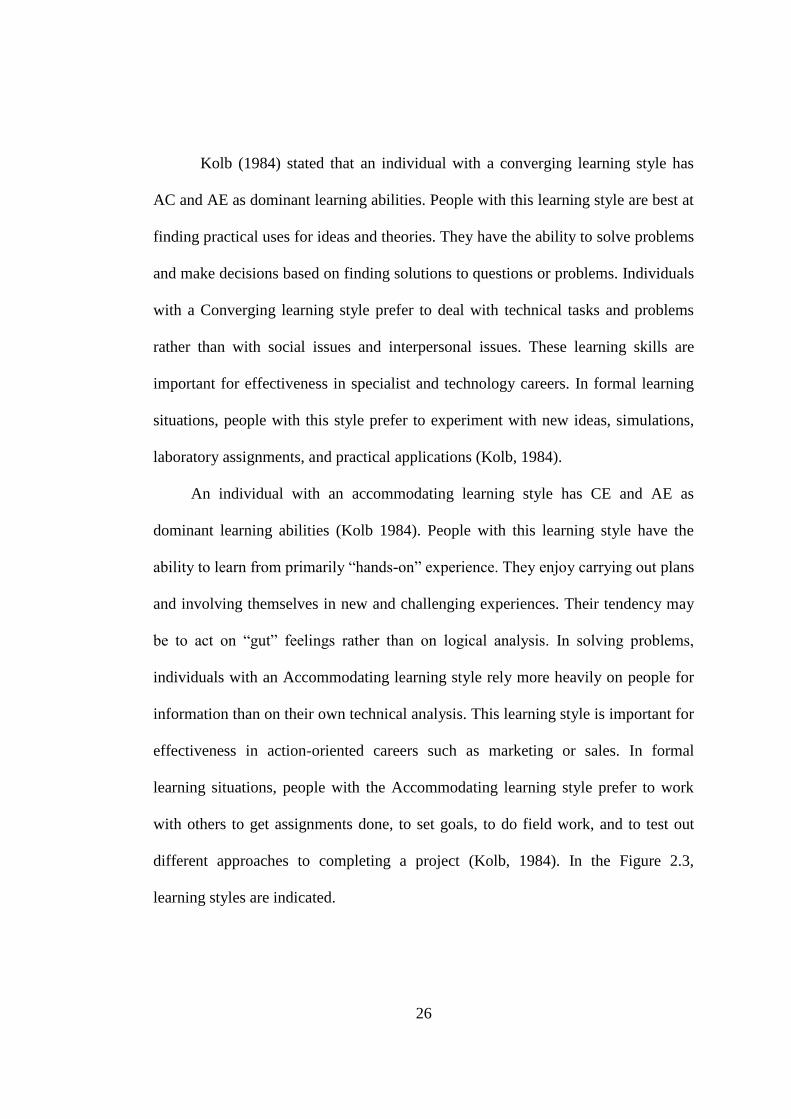
To summarize the specifications all learning styles, Peker and Mirasyesdioğlu
(2008) suggested a figure which states specifications of all four learning styles. In
Figure 2.4, strengths of learning styles are indicated.

28
Figure 2.4: Strengths of Learning Styles
(Adapted from, Peker & Mirasyedioğlu, 2008)
2.5 Studies on Learning Styles
There are still questions concerning the relation between learning styles and
variables such as gender, ethnicity, and choice of major and academic achievement.
Therefore, investigation of learning outcomes (what one learns) and the learning
process (how one learns) are continuous to be a central topic of educational research
(McKee, 1995). Some students perform better than others at acquiring knowledge
about a new topic, even when everyone was given the same instruction. Why do
learners have such differences? One possible reason is that successful learners start
with a good learning strategy and know how to find out ways for acquiring new
material (Vollmeyer & Rheinberg, 2000, cited in Özkan, 2003).

29
There are important studies in literature concerning the academic achievement
or performance of students having different learning styles. (Claxton & Murrell,
1987; Gregorc, 1979; Guild & Garger, 1984; Schroeder, 1993; Witkin, 1973) Many
others investigated the relationship between achievements in courses and learning
styles. Since the mathematical achievement and learning styles of students are main
concern of this study, research studies that focus on learning styles in relation with
mathematics achievement of students were taken into consideration at the beginning
of this review.
Studies presented here were done with the primary school students. Research
was carried out by Aruilommi, Nurmi and Aunola (2002) on the mathematical
achievement and reading abilities with 105 first grade students showed that learning
styles of students affect the mathematics achievement and reading abilities in a
positive direction. Burke and Dunn (2000) conducted a study on mathematics
achievement of 2nd
, 3rd
and 4th
grade primary school students under classical
instructional methods and learning style-based instruction. The mathematics
achievement of students under classic instructional method and learning style-based
instruction were considerably different. They found that achievement of students
from learning style-based instruction was higher than those in the classical
instructional method (Burke & Dunn, 2003).
Kopsovich (2003) conducted a large scale study on learning styles,
mathematics achievement, and gender differences with five hundred 5th
grade
primary school students. Dunn & Dunn’s learning style inventory was implemented.
Analysis of inventory showed that students who possessed different learning styles

30
scored differently in mathematics achievement test. Last but not least, providing
learning atmosphere and activities according to different learning styles of students
resulted in an increase in mathematics achievement (Kopsovich, 2003).
In a few of studies, the mathematical achievement of students and learning
styles show no correlation. Yazıcı and Sulak (2008) conducted a study about the
relationship between learning styles and mathematics achievements of 5th
grade
students, as well as the changes in the learning styles of these students in two
months of time interval. Results of the study showed that, in a two months period,
learning styles of considerable amount of students’ changed because of
inconsistency in the results of Kolb’s Learning Styles Inventory that participants of
study scored. The mathematics achievement of students showed no difference in a
favor of one specific learning style. In addition, students’ arithmetic scores also did
not show any significant difference in a favor of one specific learning style. Another
important result of this study is that Kolb’s learning style inventory showed
inconsistency in this grade (Yazıcı & Sulak, 2008). Although, there are many
studies about learning styles of primary students and their achievements in
mathematics, it was not witnessed any study in literature about relation of
elementary students’ learning styles of students and mathematics achievement.
There are very few studies done with mathematics achievement of high school
and university students’ learning styles as compared to achievement in different
courses (Aşkar & Akkoyunlu, 2002; Fer, 2003; Kaya, Özbacacı & Tezel, 2009;
Treacy, 1996) Nonetheless, the numbers of studies are limited, many of which show
a positive correlation in a majority of the cases.

31
For example, in her investigation, Treacy studied with 377 college students
in the subjects of learning styles, beliefs about technology and mathematical
achievement. The result of this study showed that learning styles, beliefs and
mathematics achievement were correlated (Treacy, 1996). In another study, Fer
studied relationship between 106 mathematics and science prospective teachers’
learning styles and their easy-to-learn learning activities. Easy-to-learn learning
activities and learning styles of students have significant relation. However, results
showed that gender of students and learning styles have no correlation (Fer, 2003).
Studies about learning styles in relation with the achievements in the courses of
science, social studies and other ones were taken into account also.
Kaya, Özabacı and Tezel (2009) conducted a study investigating the
relationship between demographic variables and learning strudels of 687 second
grade primary school students. According to their results, there is a significant
relationship between learning styles and achievements in science. Students who had
diverging learning styles received higher scores from school courses as compared to
students with other types of learning styles (Kaya et al., 2009). In a different study,
Akkoyunlu and Soylu (2002) conducted an experimental study with 39 students
about the effect of learning styles on students’ achievement in different learning
environments. Research was conducted in the framework of a single group with a
repeated measurement tools in experimental design model. Three different learning
environments: text-based, narration-based, and computer-mediated (narration +
music + text + static picture) were planned and participants studied in these
environments at different times. According to the results, it has been clarified that

32
the type of the learning style was not significantly effective on students’
achievement in different learning environments (Akkoyunlu & Soylu, 2002). In
another study, Demirbaş’s (2002) research on the experiential theory consisted of
application in a studio design courses with interior architecture students showed that
instruction which was done according to the learning styles of student addressing
the four modes learning cycle has successful results on students’ achievement. In a
different manner, Güven’s (2008) study on the relationship between primary
students’ learning styles, attitudes, and academic achievement showed that their
learning styles and attitude towards the course of social sciences were positively
correlated. In addition, academic achievement and learning style of students have a
weak correlation. Lastly, gender difference of students and learning styles had no
meaningful relation (Güven, 2008).
Blanch-Payne (1999) conducted a research about relation between students’
achievements and learning styles of them. In this study, Kolb’s 3rd
version of LSI
was used and for success marks, the final scores of students were taken into account.
Result of the research showed that learning styles and overall success are not
significantly related (Blanch-Payne, 1999). In parallel with previous study, Farkas
(2003) examined traditional versus learning style-based instructional methods with
105 seventh grade students in terms of their achievement, attitudes, emphatic
tendencies, and transfer skills in response to lessons. Analysis of data showed that
students indicated more positive attitudes when they were instructed in the manner
of multi-sensory approach, which includes instructional methodology developed by
Dunn and Dunn (1992), and performed higher as compared to traditional learning
33
method (Farkas, 2003). In a different example, Özkan’s (2003) study on
achievement in biology and learning styles with 980 tenth grade high school
students showed that biology achievement test’s mean scores of assimilators are
higher than other learning style types. This means that students’ learning styles had
a significant effect on biology achievement test scores (Özkan, 2003). The
achievements of students in almost every course and learning styles of students in
different school segments were investigated. Studies which have been reviewed so
far are related with the situation analyses, and those are as important as the studies
which investigated the effect of the learning style based instruction to the
achievement in school of students. Reason of this, results about relation between
learning styles and academic achievement give a light for the question: “Is
instruction planned according to learning styles of students has a positive effect to
the achievement of students?”
Mutlu (2000) investigated the relationship between learning styles and biology
achievement with 226 ninth grade students from different Anatolian High Schools
and Anatolian Teacher High Schools. According to this research, assimilators were
the highest achievers which were connected to the reason of traditional instructional
methods since assimilators were perceived information by abstract
conceptualization and processed information by reflective observation. Another
research topic of this study was the relationship between attitudes toward biology
and learning styles which shows that students have converger type of learning style
have a more positive attitude towards as compared to students who had other
learning styles. This results support the evidence of learning styles since converger

34
learning style is the composite of perceiving information as abstract
conceptualization and processing information with active experimentation. This
situation is suited with the traditional biology instruction (Mutlu, 2000).
Owens examined the learning preferences of students in terms of mathematics
achievement and attitude under different instructional methods. The study is
organized so as to compare the mathematics achievement of students under
problem-based instruction and non-problem-based instruction. The results of the
study showed that, at the beginning of the semester, there was no significant
difference among the students’ learning styles and mathematics achievement.
However, students in the experimental group which have problem based instruction,
showed difference in terms of increase in mathematics achievement at the end of the
semester. Owens concluded that if mathematics instruction is planned to learners’
ways of learning, then developing mathematics attitude and mathematics
achievement in positive manner is possible (Owens, 1999).
In another study, Matthews (1999) investigated the relationship between
learning preferences and achievement of students and found that learning style and
academic achievements of high school students had strong relationships. In
research, it was found that students with converger learning style were the highest
achievers as compared to other learning styles (Matthews, 1999). In parallel to
Matthews’s research, research about the relation of learning styles and academic
achievement show that students who have converger learning style are dominant in
achievement scores as compared to other learning styles (Witkin, Moore,
Goodenough & Cox, 1987).

35
In a different aspect, Garcia and Hughes (2000) investigated the predictability
of academic achievement according to preferred learning ways. They collected data
from 220 college students. Results of study showed that learning styles and
predictably of achievement in certain cases are dependent. Students, who study in
applied sciences and have concrete experience learning way, are higher achievers as
compared to other learning ways which are Abstract Conceptualization and
Reflective Observation (Garcia & Hughes, 2000). Parallel with this, Steele,
Palensky, Lynch, Lacy and Duff (1998) conducted a research study about scores in
the multiple choice assessment test of computer – assisted instructional program and
learning preferences of students. Study performed with 227 medical students.
Results indicated that convergers and assimilators performed better than
accommodators and divergers on multiple choice test measurement (Steele et al,
1998).
In different aspect of learning style, research about relationship between
learning styles and problem solving skills among college students, done by Şirin and
Güzel (2006) with 330 senior prospective teachers showed that there was no
significant relation between the problem solving skills and learning style types.
Another result of this study indicated that students graduated from science and
mathematics teacher education programs had converging type of learning styles in
dominance as compared to students graduated from social sciences. Accommodator
learning style has a majority at students from social sciences as compared to
students from science and mathematics programs. This result is crucial because it

36
shows that learning styles are shaped by subject matter courses (Şirin & Güzel,
2006)
Hancock (2000) investigated the effectiveness of the 4MAT applications in
lessons. 4MAT system is an instructional design according to learning styles of
learners. Hancock’s study investigated the effects of 4MAT instruction on the fifth,
sixth, and seventh grade students’ achievement. Results of the experiment denoted
that implications existed for the use of organized, structured lesson plans focused on
student engagement as a means to reduce teacher off – task behavior and positively
influence student achievement (Hancock, 2000).
There were also studies concerning the relationship between student learning
styles and course achievement showing different outcomes. Some of these studies
found no correlation between learning style type course achievement (Davis, 1998;
Harland-White 1993; Hinterthuer, 1984; Shelton 1994; Taylor 1986). However,
some of these investigations revealed that abstract conceptual learners outperformed
concrete experience learners. (Buchanan, 1992; Carthey 1998; Caskey, 1981;
Purkiss 1994;). Carthey (1998) was even more specific and described the highest
achieving learners as the converger learner. Caskey (1981) found that students’
socioeconomic backgrounds correlated with learning style characteristics. He found
lower socioeconomic groups performed with a more concrete experience style.
In another study, Demirel (2006) investigated whether correct matching of
learning styles between teachers and students provided increase in the achievement
of learning the English Language. Results of the study showed that if correct match
of teachers and learners in terms of learning styles was provided with a suitable

37
instructional plan according to students’ learning style, there was statistically
significant increase in learning the English Language of learners (Demirel, 2006).
One another concern of this study is investigating mathematics achievements
of students in terms of gender and areas in town where students live in. There are
studies in the literature which investigates relation achievements of students
regarding to their socioeconomic levels and geographical situations.
Işıksal and Çakıroğlu (2008) conducted a study to investigate the gender
differences of the eighth grade students regarding to mathematics achievements in
nation wide applied high school entrance examination. In this study, students were
selected from five different regions of Turkey according to their socio economic
backgrounds. The results of this study showed that there was no significant mean
difference in mathematics achievement scores regarding to gender. However, there
was a significant difference in mathematics achievements among five different
regions. The mean mathematics scores of socio economically developed regions
(İstanbul, Ankara and İzmir) were the highest, smaller cities had the lowest mean
scores. Despite that, results showed that regional differences of mean mathematics
achievement scores had no practical significant.
Bengiç (2009) conducted a study to investigate relation the achievement in
social studies course and learning styles of students who were in Denizli (the west
of Turkey) and Ağrı (the east of Turkey) provinces. Achievement scores in social
studies course were the teacher assigned scores and Dunn & Dunn learning style
inventory was used to determine the learning styles of the students. According to the
38
results, there was no significant difference reported between the achievement scores
in students in Denizli and students in Ağrı.
Cox (2000) implemented a study to investigate and to compare regional and
gender differences in mathematics achievements. A secondary education
qualification examination was used to assess the students’ mathematics
achievements and students were randomly selected from rural and urban areas
(country versus metropolitan). Findings of this study show that students, both males
and females, in urban areas outnumbered their urban counterparts in administered
examination in terms of mathematics achievements and females significantly
performed better than males in this examination.
2.6 Summary
So far, purposes, problems, hypothesize of study and related literature review
about topics of study was done. As it can be inference from this chapter, there were
limited number of studies which are related with relation of the mathematics
achievement scores of students and learning styles of them. Besides, there was no
study which investigates the mathematics achievement scores of elementary
students in multiple choice examinations which are administered nationally.
In sum, there is a gap in the studies related with the elementary school
students and mathematics achievement scores. Results of this study which, will be
hoped to assist to fill this gap and will also add new information about the topic of
learning styles of students and its relation with mathematics achievement. Lastly,

39
results of study may then be helpful for the teachers of mathematics in terms of
planning their instructional strategies.

40
CHAPTER III
METHODOLOGY
The main purpose of this study was to investigate the possible differences
among students’ SBS mathematics scores according to their learning styles.
Additional purposes were to investigate the mathematics achievement scores of
students according to gender differences and difference in location. In this chapter,
information about the design and population of study, sampling, data collection
instruments, the variables of the study will be explained. In addition, procedures and
methods used to analyze data will be stated, as well as a brief explanation of the
assumptions and limitations of the study.
3.1 Research Design
Casual comparative is the overall design of this study. Gay (1987) described
causal-comparative research method as follows: “Causal-comparative research
attempts to identify a cause-effect relationship between two or more groups. Causal
comparative research attempts to determine reasons, or causes, for the existing
condition. Causal-comparative studies typically involve two (or more) groups and
one independent variable. Causal-comparative studies involve comparison.” Gay
(1987) also stated about the sampling of the casual comparative studies that:
“Individuals are not randomly assigned to treatment groups because they already
were selected into groups before the research began.”

41
In this research, the researcher administered the Learning Styles Inventory
(LSI), developed by David Kolb to 283 eighth grade elementary students. Purpose
of this study was to investigate the difference in mathematics achievements of
eighth grade students with respect to their learning styles. In this study, learning
styles of students and gender are the independent variables. One of the other
independent variables is regions of the town were already determined by
geographically before. Students were selected from schools clustered in the regions,
city center, suburban (belde) and villages, of Mustafakemalpaşa town in Bursa.
Mathematics achievement scores in the SBS subtest and teacher assigned
mathematics scores were obtained from the official web site of Ministry of National
Education with the permission and assistance of authorized personnel. The main
advantage of administering such a questionnaire to such a group was the high rate of
return and the questionnaire’s low expense (Fraenkel & Wallen, 2003). SPSS for
Windows was used for data analysis in this study
3.2 Population and Sample
All the 8th grade students in Mustafakemalpaşa town of Bursa in Turkey were
identified as the target population for this study. The accessible population of this
study was determined as the 8th grade students who took the SBS in schools located
in regions which are in the city centre, suburban (belde) and villages of
Mustafakemalpaşa town. This is the population which the results of the study will
be generalized.
42
A purposive sampling strategy reflecting size of institution, public versus
non-public, region of the country, and institutional mission served as the basis for
selecting participants. In this case it was desirable to purposively choose the region
and the respondents because this provided information-rich cases for in-depth
analysis related the central issues being studied. Purposive sampling was an
effective tool when used with mixed method studies, and in this case it allowed
common sense decisions to be made to choose the right habitations and meeting the
right number of people from the conference pre-registration listings for the purpose
of the study (CEMCA 2004).
In total, there were 1311 eighth grade students in the schools of
Mustafakemalpaşa town. In order to obtain a representative data from this
population, purposive sampling was used since comparison of students’
mathematics achievements should be made regionally according to purpose of this
study. Sometimes, it is desirable to purposively choose the region and the
respondents for a specific purpose (CEMCA, 2004). One of the versions of
purposive sampling which is area sampling or geographical cluster sampling was
used because schools in which the investigation was administered in were located in
different regions of the Mustafakemalpaşa town of Bursa in Turkey. From another
perspective of purposive sampling, convenience of access was taken into account
not all of the schools in the defined geographical areas were suitable to administer
the inventory (LSI) of study or obtain students’ SBS mathematics achievement
scores were available or the schools were located in regions not easy to reach.
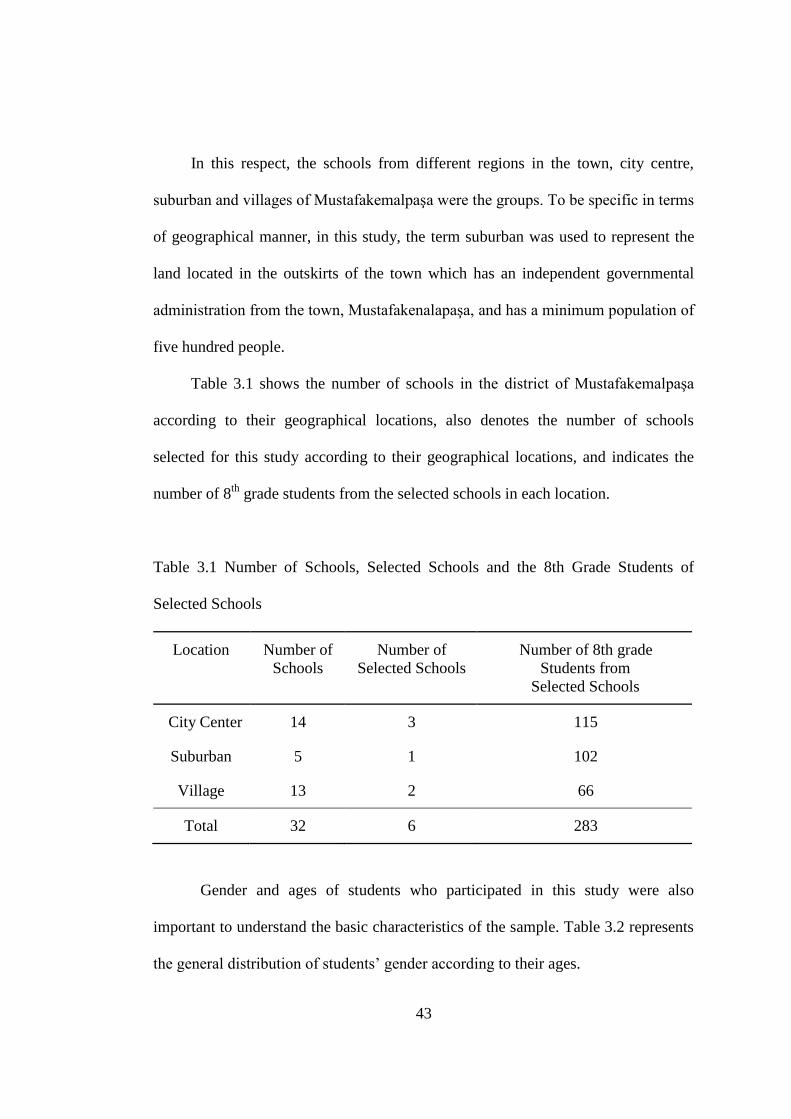
43
In this respect, the schools from different regions in the town, city centre,
suburban and villages of Mustafakemalpaşa were the groups. To be specific in terms
of geographical manner, in this study, the term suburban was used to represent the
land located in the outskirts of the town which has an independent governmental
administration from the town, Mustafakenalapaşa, and has a minimum population of
five hundred people.
Table 3.1 shows the number of schools in the district of Mustafakemalpaşa
according to their geographical locations, also denotes the number of schools
selected for this study according to their geographical locations, and indicates the
number of 8th
grade students from the selected schools in each location.
Table 3.1 Number of Schools, Selected Schools and the 8th Grade Students of
Selected Schools
Location Number of
Schools
Number of
Selected Schools
Number of 8th grade
Students from
Selected Schools
City Center 14 3 115
Suburban 5 1 102
Village 13 2 66
Total 32 6 283
Gender and ages of students who participated in this study were also
important to understand the basic characteristics of the sample. Table 3.2 represents
the general distribution of students’ gender according to their ages.

44
Table 3.2: Distribution of Ages According to Gender
Ages Female Male Total
13 2 1 3
14 149 120 269
15 5 6 11
Total 155 127 283
3.3 Variables
There are five variables in this study which were categorized as dependent
variables and independent variables. Dependent variables of this study were SBS
mathematics scores of students and teacher assigned mathematics grades of
students. Independent variables of this study were learning styles of students,
regions where selected schools were located, and gender of students.
Table 3.3 Categorization of Research Variables
Type of Variables Name of Variable
Mathematics Scores in SBS Dependent Variable
Teacher Assigned Mathematics Grades Dependent Variable
Learning Styles Independent Variable
Regions of Town Schools Selected Independent Variable
Gender Independent Variable
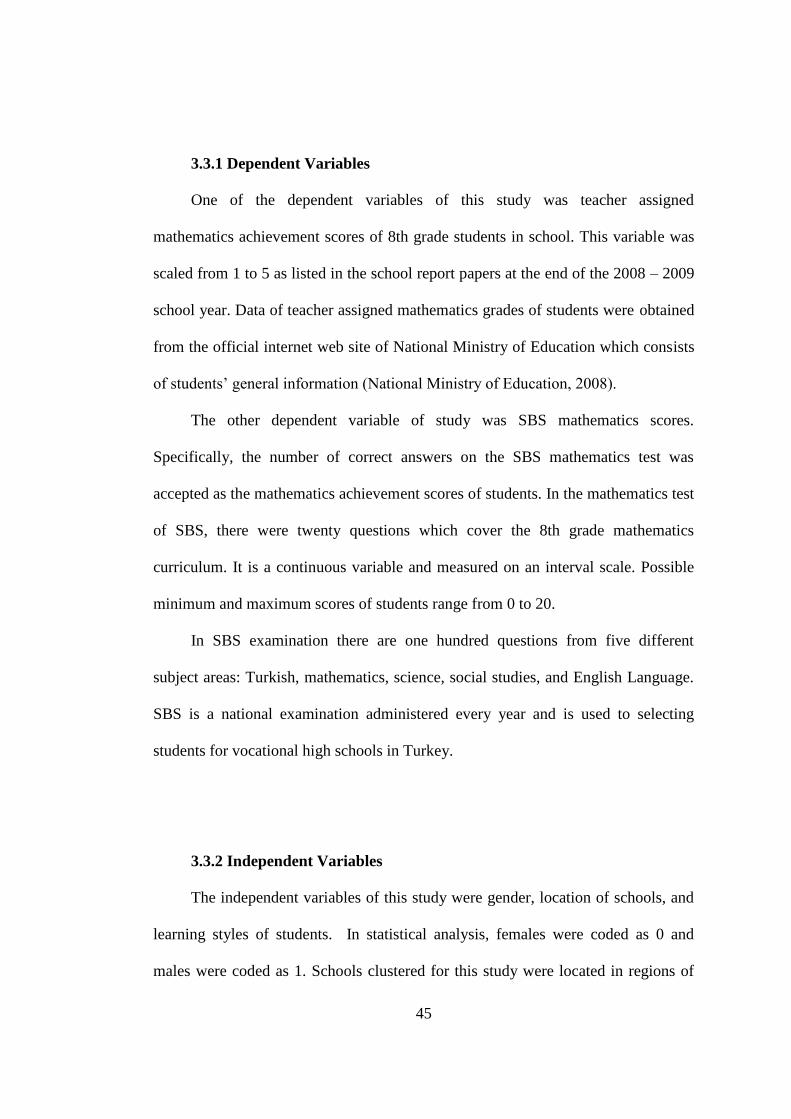
45
3.3.1 Dependent Variables
One of the dependent variables of this study was teacher assigned
mathematics achievement scores of 8th grade students in school. This variable was
scaled from 1 to 5 as listed in the school report papers at the end of the 2008 – 2009
school year. Data of teacher assigned mathematics grades of students were obtained
from the official internet web site of National Ministry of Education which consists
of students’ general information (National Ministry of Education, 2008).
The other dependent variable of study was SBS mathematics scores.
Specifically, the number of correct answers on the SBS mathematics test was
accepted as the mathematics achievement scores of students. In the mathematics test
of SBS, there were twenty questions which cover the 8th grade mathematics
curriculum. It is a continuous variable and measured on an interval scale. Possible
minimum and maximum scores of students range from 0 to 20.
In SBS examination there are one hundred questions from five different
subject areas: Turkish, mathematics, science, social studies, and English Language.
SBS is a national examination administered every year and is used to selecting
students for vocational high schools in Turkey.
3.3.2 Independent Variables
The independent variables of this study were gender, location of schools, and
learning styles of students. In statistical analysis, females were coded as 0 and
males were coded as 1. Schools clustered for this study were located in regions of

46
Mustafakemalpaşa which are the city centre, suburban and villages. In statistical
analysis, villages were coded as 1, the city center was coded as 2 and suburban was
coded as 3.
Another independent variable of the study was learning styles of students.
According to Kolb’s Experiential Learning Theory, there are four type of learning
styles which are Accommodator, Converger, Diverger and Assimilator which are
coded as 1, 2, 3 and 4 in statistical analysis of research respectively.
3.4 Data Collection Instruments
This study contains two data collection instruments used to obtain data from
students. The two instruments used were the Learning Style Inventory (LSI) and the
mathematic achievement test in SBS (Level Determination Examination).
3.4.1 Learning Style Inventory
All participants were administered the Turkish version of the revised Learning
Style Inventory (Kolb, 1985) translated into Turkish by Aşkar and Akkoyunlu in
1993 (Appendix A). The Learning Style Inventory (Kolb, 1985) includes twelve
conditional statements. Each statement has four options to be selected addressing
specific learning modes in the learning process. The participant of the inventory
was expected to rank these sentences from four to one according to his/her learning
modes in the learning process. Four means that the most favorable learning mode in
the learning process. Three means that the second most favorable learning mode in
the learning process. Two means the third favorable learning mode, and lastly, one
means the least favorable learning mode in the learning process.
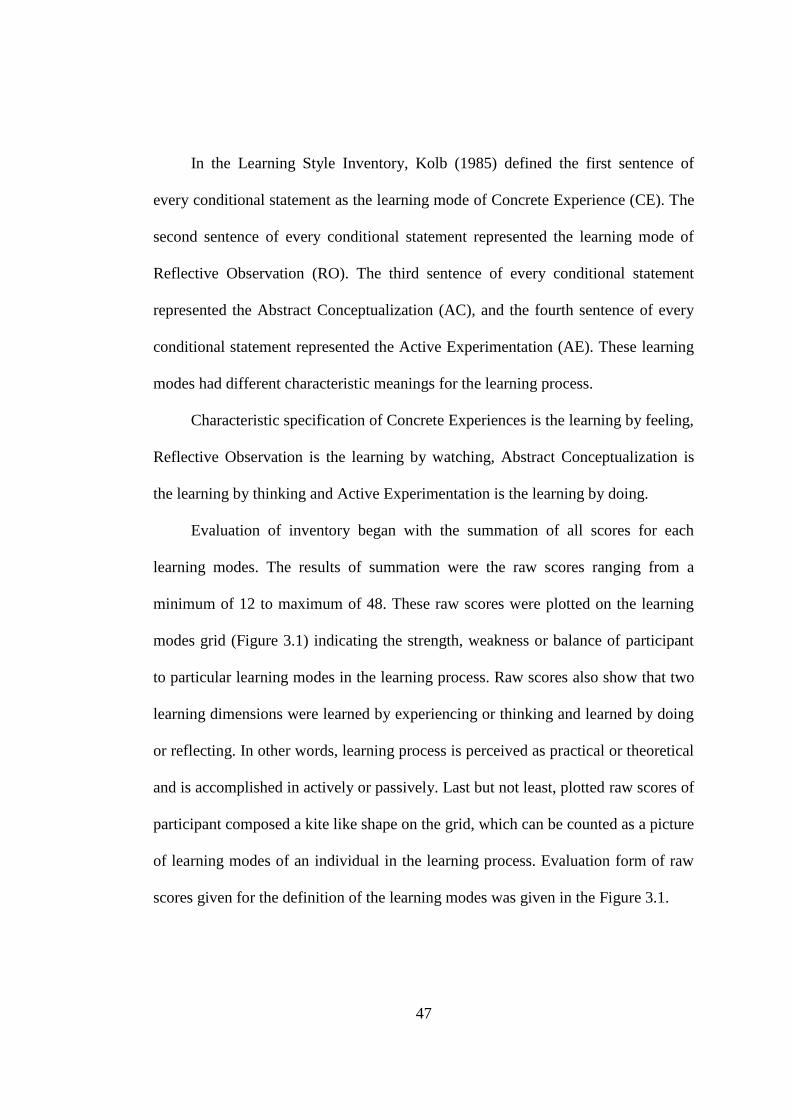
47
In the Learning Style Inventory, Kolb (1985) defined the first sentence of
every conditional statement as the learning mode of Concrete Experience (CE). The
second sentence of every conditional statement represented the learning mode of
Reflective Observation (RO). The third sentence of every conditional statement
represented the Abstract Conceptualization (AC), and the fourth sentence of every
conditional statement represented the Active Experimentation (AE). These learning
modes had different characteristic meanings for the learning process.
Characteristic specification of Concrete Experiences is the learning by feeling,
Reflective Observation is the learning by watching, Abstract Conceptualization is
the learning by thinking and Active Experimentation is the learning by doing.
Evaluation of inventory began with the summation of all scores for each
learning modes. The results of summation were the raw scores ranging from a
minimum of 12 to maximum of 48. These raw scores were plotted on the learning
modes grid (Figure 3.1) indicating the strength, weakness or balance of participant
to particular learning modes in the learning process. Raw scores also show that two
learning dimensions were learned by experiencing or thinking and learned by doing
or reflecting. In other words, learning process is perceived as practical or theoretical
and is accomplished in actively or passively. Last but not least, plotted raw scores of
participant composed a kite like shape on the grid, which can be counted as a picture
of learning modes of an individual in the learning process. Evaluation form of raw
scores given for the definition of the learning modes was given in the Figure 3.1.
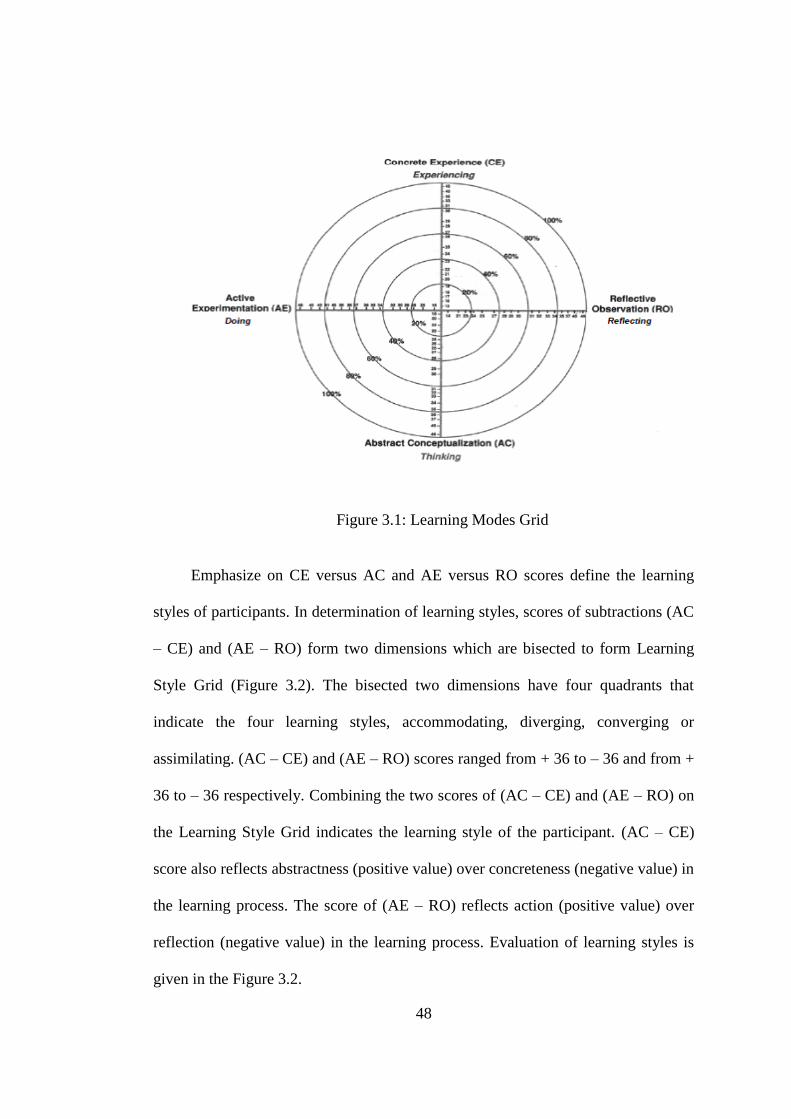
48
Figure 3.1: Learning Modes Grid
Emphasize on CE versus AC and AE versus RO scores define the learning
styles of participants. In determination of learning styles, scores of subtractions (AC
– CE) and (AE – RO) form two dimensions which are bisected to form Learning
Style Grid (Figure 3.2). The bisected two dimensions have four quadrants that
indicate the four learning styles, accommodating, diverging, converging or
assimilating. (AC – CE) and (AE – RO) scores ranged from + 36 to – 36 and from +
36 to – 36 respectively. Combining the two scores of (AC – CE) and (AE – RO) on
the Learning Style Grid indicates the learning style of the participant. (AC – CE)
score also reflects abstractness (positive value) over concreteness (negative value) in
the learning process. The score of (AE – RO) reflects action (positive value) over
reflection (negative value) in the learning process. Evaluation of learning styles is
given in the Figure 3.2.
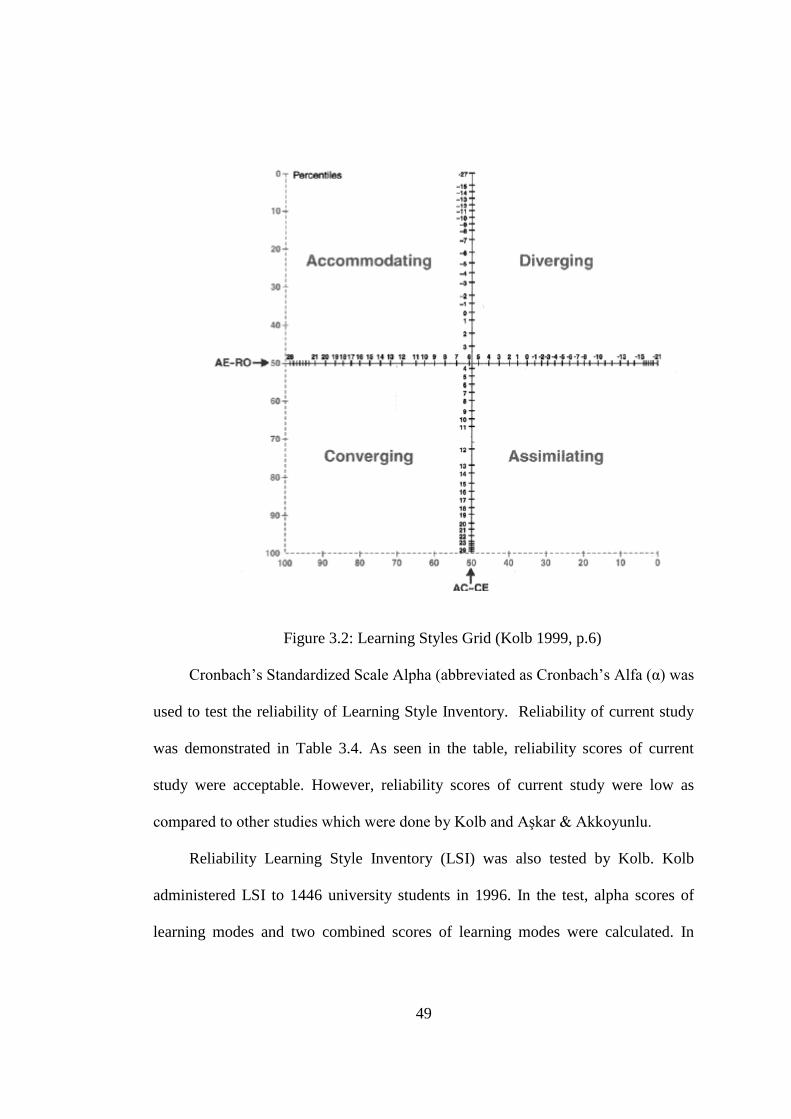
49
Figure 3.2: Learning Styles Grid (Kolb 1999, p.6)
Cronbach’s Standardized Scale Alpha (abbreviated as Cronbach’s Alfa (α) was
used to test the reliability of Learning Style Inventory. Reliability of current study
was demonstrated in Table 3.4. As seen in the table, reliability scores of current
study were acceptable. However, reliability scores of current study were low as
compared to other studies which were done by Kolb and Aşkar & Akkoyunlu.
Reliability Learning Style Inventory (LSI) was also tested by Kolb. Kolb
administered LSI to 1446 university students in 1996. In the test, alpha scores of
learning modes and two combined scores of learning modes were calculated. In

50
Table 3.4, alpha scores of the Kolb’s study were indicated. Values of alpha scores
were ranged from 0.88 to 0.73 which found as adequate for reliability.
Aşkar and Akkoyunlu (1993) translated and adapted Kolb’s LSI into Turkish.
Reliability and validity study of adapted and translated LSI was established with
103 participants who were students of Teacher Certificate Program of Hacettepe
University. Alpha scores of adapted and translated LSI were indicated in Table 3.y.
results of Alpha scores were ranged from 0.58 to 0.77 which were acceptable for
reliability.
Table 3.4 Reliability Scores of Current Study, Kolb’s Study and Aşkar &
Akkoyunlu’s Study
Cronbach’s Alfa
(α) of
Current Study
Cronbach’s Alfa
(α) of
Kolb’s Study
Cronbach’s Alfa
(α) of Aşkar &
Akkoyunlu Study
Concrete
Experience
0.55 0.82 0.58
Reflective
Observation
0.59 0.73 0.70
Abstract
Conceptualization
0.63 0.83 0.71
Active
Experimentation
0.54 0.78 0.65
AC – CE
0.65 0.88 0.77
AE – RO 0.64 0.81 0.76

51
3.4.2 Mathematics Subtest of SBS
Mathematics subtest of SBS (Appendix B) was used for assessing the
mathematics achievement of 8th grade students. The test was prepared by Ministry
of National Education and consisted of twenty questions covering contents of the
official mathematics curriculum for 8th grade. Table 3.4 shows the topics of
mathematics questions in the SBS in the year 2009.
Table 3.5 Topics of Questions in Mathematics Sub-Test of 8th grade SBS in 2009
Subjects in the 8th
Grade Mathematics Curriculum Number of Questions
Probability 1
Irrational Numbers and Reel Numbers 1
Exponential Numbers and Squared Root 3
Standard Deviation 1
Algebraic Equivalences 1
Equations with Two Unknowns 1
Triangle Inequality and Inequalities 2
Fractals 1
Transformations in Geometry 2
Histograms 1
Similarities and Congruence in Triangles 1
Surface Area of 3 Dimensional Geometric Figures 1
Volume of 3 Dimensional Geometric Figures 1
Perspective Drawing 1

52
Slope of Lines and Trigonometric Ratios 2
Total 20
Mathematics subtest score was the number of correct answers given by the
students. Each correct answer was valued as one point. It ranged from a minimum
of 0 points to a maximum of 20 points. Higher scores on the test meant higher
performances in the mathematics course. Beside this, SBS scores have important
consequences for students, because the results were used as data in evaluating the
qualification for vocational high schools. It is important for many students to obtain
higher scores in the SBS.
3.5 Procedure
Defining and setting the research problem was the first step of this study. The
next step was to determine the significance of the research problem for theory and for
the schools in Turkey. After being sure that data for the research requested was
obtainable, available and measurable, related literature review was done.
The second step of the study was the administration of the Learning Style
Inventory. Six schools were selected and the application process in the schools from
different regions was started with permission requested from administrative
principals of the selected schools. After the official permission was obtained from
the directorate of district national education and the schools administration, the
process of data collection was started.

53
The learning Style Inventory was administered in six different schools. Two
of the selected schools were located in the villages of Mustafakemalpaşa town. One
of the selected schools was located in the suburban region of Mustafakemalpaşa
town, and the remaining three selected schools were located in the city center of
Mustafakemalpaşa town. Selection criteria for the schools depended on the
representativeness of the general sample. In general, one of the selected schools was
private college and the other five were state schools. One of three selected schools
in the city center was private college which consisted of some scholar students
because of great success in the SBS. In general, students of this school were the
children of economically high – class or middle class families. The second school
located in the city center consisted of students who were children of middle – class
families. The third school selected in the city center consisted of students who were
children of economically middle – class or low – middle class families. Population
of selected state schools was relatively high as compared to other state schools.
Mustafakemalpaşa town has five suburban regions and selected school was the
school located in one of suburban regions of Mustafakemalpaşa which has the
largest population as compared to the other regions. Students of selected school in
the suburban region are the children of economically low – middle class and low
class families. Besides this, the selected school in suburban region has the largest
population of students as compared to school in the suburban region. In the village
region, schools were selected from villages with a relatively higher population than
other villages in the region. Students of selected schools in village regions were the
children of economically low class and the poorest class families.
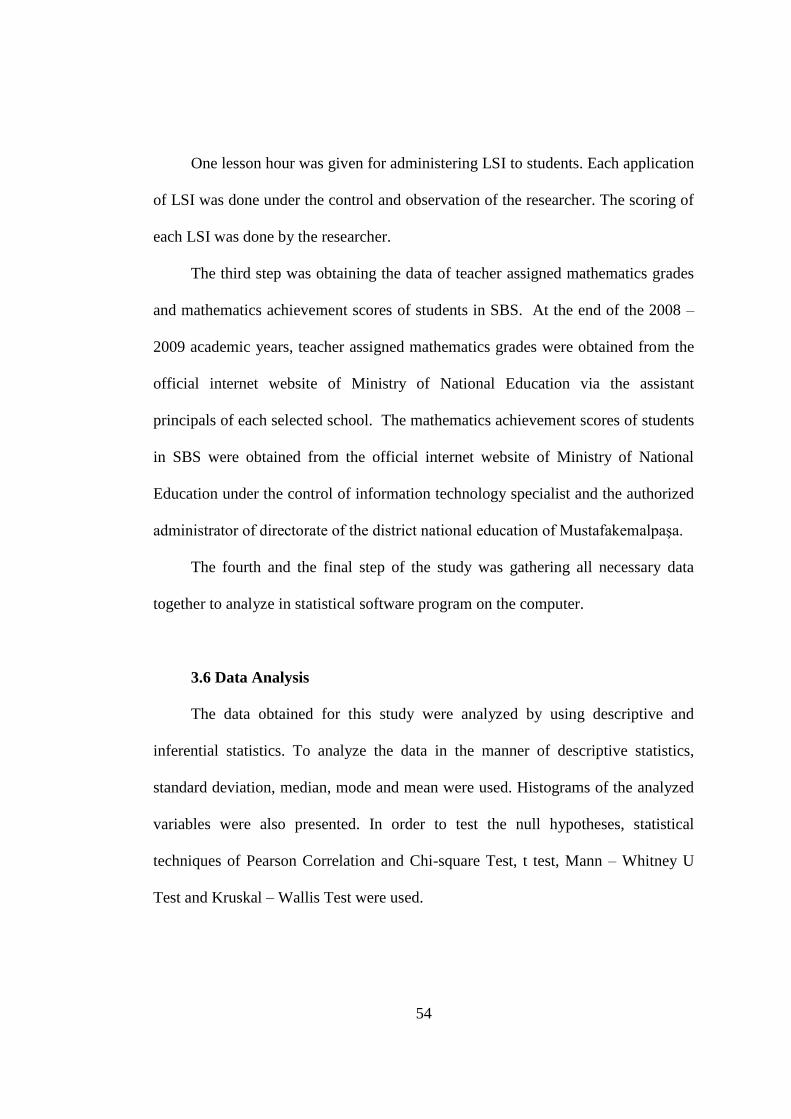
54
One lesson hour was given for administering LSI to students. Each application
of LSI was done under the control and observation of the researcher. The scoring of
each LSI was done by the researcher.
The third step was obtaining the data of teacher assigned mathematics grades
and mathematics achievement scores of students in SBS. At the end of the 2008 –
2009 academic years, teacher assigned mathematics grades were obtained from the
official internet website of Ministry of National Education via the assistant
principals of each selected school. The mathematics achievement scores of students
in SBS were obtained from the official internet website of Ministry of National
Education under the control of information technology specialist and the authorized
administrator of directorate of the district national education of Mustafakemalpaşa.
The fourth and the final step of the study was gathering all necessary data
together to analyze in statistical software program on the computer.
3.6 Data Analysis
The data obtained for this study were analyzed by using descriptive and
inferential statistics. To analyze the data in the manner of descriptive statistics,
standard deviation, median, mode and mean were used. Histograms of the analyzed
variables were also presented. In order to test the null hypotheses, statistical
techniques of Pearson Correlation and Chi-square Test, t test, Mann – Whitney U
Test and Kruskal – Wallis Test were used.

55
3.7 Assumptions and Limitations of Study
To understand the results of study in a more meaningful way, stating
assumptions and limitations would be useful.
3.7.1 Assumptions of the Study
Assumptions made by the researcher of the study are presented as follows.
1. Administration of the LSI was done under standard conditions meaning that
there was no warning or request from the researcher to the student to do something
in a desired way.
2. Students sincerely and correctly responded to the items of the LSI.
3. The mathematics teachers of participated students scored the students for
their mathematics achievement in the school fairly and independently.
4. The students obtained mathematics grades in the school and the SBS
mathematics achievement scores fairly with only their personal efforts.
5. It was not reported by the participants of the study that there was no
distraction happened in the administration of SBS.
6. The assistant principals and the principals of the selected schools served
necessary data sincerely and honestly.
7. Assessment of the SBS’s results examination was done correctly.
3.7.2 Limitations
The following limitations of the study should be taken into account while
evaluating the results.

56
1. The study was conducted in the selected schools of Mustafakemalpaşa
town of Bursa province in Turkey. The results of the study were generalized from
these selected schools.
2. Learner characteristics were not taken into account beyond the
determination of learning styles.
3. Achievement of students was assessed by their own mathematics teachers.
3.8 Internal Validity of the Study
Variables of this study are mathematics achievement scores in SBS; teacher
assigned mathematics scores, learning styles, gender and selected schools from
different regions of town. These are possible threats for internal validity.
Instrumentation could not be a threat to study since the learning style
inventory was administered to all groups in a classroom environment by researcher.
SBS was a strictly administered nationwide examination. Mathematics achievement
scores in SBS and teacher assigned mathematics scores were obtained from the
official web site of Ministry of National Education with official permission.
Besides, location could not be threat for this study because learning style inventory,
mathematics achievements scores in SBS and teacher assigned mathematics scores
were obtained in similar conditions where classrooms are.
Data collector characteristics and data collector bias were assumed to be
controlled by implementing inventories with another teacher to ensure that standard
procedure where data were collected.

57
Since the schools which were participated in this study were accepted as
groups, random assignment of the subjects was not possible. Important concern for
this study was the assigned groups not the individuals.
Confidentiality was not a threat for this study since the names of students were
not used in data analyses. Instead of names, a single number assigned for every
single participant and names of the students were not used.
3.9 External Validity of the Study
Participants of this study were selected in groups (schools) from the accessible
population and 283 eighth grade students participated to this study. Results of this
study can easily be generalized to accessible population since generalization of this
study’s results does not have any limitations.
All the inventory administrations carried out in standardized classrooms
during regular one class hour. In administrations, it was not reported any noteworthy
differences in classroom environments. Hence, it was thought that external threats
were sufficiently controlled.

58
CHAPTER IV
RESULTS
In the previous chapters, the purpose, literature review of the study and
methods were explained. This chapter is devoted to explaining the results of the
study. Initially, the results of the study were presented as descriptive statistics.
4.1 Descriptive Statistics
4.1.1 Descriptive Statistics of SBS Mathematics Subtest
Descriptive statistics related to the students’ mathematics achievement scores
in subtest of SBS (SBSMATHS) were categorized according to the gender of
students and presented in the Table 4.1. Scores could range from 0 to 20, where
higher scores mean greater mathematics achievement. As Table 4.1 shows, female
students had a mean of 6.7 from achievement scores while male students had a
mean of 5.5 which means that female students had slightly higher achievement
scores than male students. Table 4.1 also indicates the other basic descriptive
statistics of sample such as standard deviation and standard error of mean.

59
Table 4.1 Descriptive Statistics Related to the Mathematics Achievement Scores in
SBS Mathematics Subtest According to Gender
SBSMATHS Female Male Total
N 156 127 283
Mean 6.7 5.5 6.2
S. Deviation 4.5 4.0 4.2
S. Error of Mean 0.36 0.36 -
Minimum 0 0 0
Maximum 20 18 20
Table 4.2 presents the descriptive statistics related to the mathematics
achievement scores in the SBS mathematics subtest of students according to the
location of their school in the three specified regions of Mustafakemalpaşa. As
Table 4.2 indicates, students attending schools located in the city center had a mean
of 8.82, which were the highest mean scores of the three regions. Table 4.2 also
indicated that students attending schools located in suburban and village regions had
approximately close mean value scores; however, scores were slightly higher for
students in the village regions more than students in the suburban. Students in
villages had a mean of 4.71 and students in the suburban had a mean of 4.17 which
means that that students attended schools in villages had a slightly higher mean
value than students attended to the school in suburban. The median, standard
deviation, standard error mean of the sample were also presented in Table 4.2.

60
Table 4.2 Students’ SBS Mathematics Achievement Scores According to Their
Schools’ Location in the Specified Regions of Mustafakemalpaşa
SBSMATHS Village City Center Suburban Total
N 66 115 102 283
Mean 4.71 8.82 4.17 6.1
Median 4 8 3 5
S. Deviation 2.94 4.40 3.27 4.20
S. Error of Mean 0.36 0.41 0.32 0.25
Minimum 0 1 0 0
Maximum 16 20 17 20
4.1.2 Descriptive Statistics of Teacher Assigned Mathematics Scores
The official grading system of National Ministry of Education was used for
teacher assigned mathematics scores. The current grading system, for the
categorization of the achievement scores (out of 5), was used to identify the
achievement level of each student. According to the grading system, the highest
grade is 5, which identify the achievement level of very well while the lowest grade
is 1, which identifies the achievement level of poor. Passing grades are ranged from
2 to 5 with 1 as a failing grade. In Table 4.3, teacher assigned scores which are
officially determined by National Ministry of Education, are presented.

61
Table 4.3 Quality – Point Equivalents of the Grades of Teacher Assigned
Mathematics Scores administered by National Ministry of Education
Range of Teacher Assigned Mathematics Scores Grades Level
100 – 85 5 Very Well
84 – 70 4 Well
69 – 55 3 Average
54 – 45 2 Sufficient
44 – 0 1 Poor
Table 4.4 presents descriptive statistics of students’ teacher assigned
mathematics scores (abbreviated as TAMS) according to their schools’ locations in
the specified regions of the Mustafakemalpaşa where research was conducted. As
seen in Table 4.4, students attending schools located in the city center region had a
mean of 3.24, which was the highest mean value of the three regions. The
achievement level of students attending schools in the city center region were
slightly above general average. Students attending schools in the village region had
a mean of 2.55 which was higher than the mean of students attending school located
in suburban region which was 1.96. In addition, the achievement level of students
attending schools in the village region was below average and the students attending
school in the suburban region was almost sufficient. Table 4.4 also presents the
other basic descriptive statistics about teacher assigned mathematics scores.

62
Table 4.4 Students’ Teacher Assigned Mathematics Scores According to Their
Schools’ Locations in the Specified Regions of Mustafakemalpaşa
TAMS Village City Center Suburban Total
N 66 115 102 283
Mean 2.55 3.24 1.96 2.61
Median 3 3 1 3
S. Deviation 1.30 1.24 1.31 1.40
S. Error of Mean 0.16 0.12 0.13 0.08
Minimum 1 1 1 1
Maximum 5 5 5 5
4.1.3 Descriptive Statistics of Learning Style Inventory
Descriptive statistics related to the types of learning styles (accommodator,
diverger, converger and assimilator) were categorized according to gender and
given in Table 4.5. As it indicates in Table 4.5, most of the female students (N= 59)
and male students (N = 42) were assimilators. The diverger learning style was the
next common learning style, with a make up (N=49) female students and (N=36)
male students. The distribution of learning styles which are accommodator,
diverger, converger and assimilator according to gender are given in Table 4.5.

63
Table 4.5 Distribution of Learning Style Types According to Gender
Learning Styles Female Male Total
Accommodator 22 19 41
Diverger 49 36 85
Converger 26 30 56
Assimilator 59 42 101
Total 156 127 283
In terms of frequency, as seen in Table 4.5, assimilators had the highest
frequency (101) when compared to other learning styles. Divergers were the second
highest category with a frequency of 85. The lowest frequency (40) belonged to
accommodators in the whole sample.
Distribution of the four learning styles according to gender in terms of
percentages was presented in Table 4.6. As shown in the table, the highest
percentage belonged to assimilators with 35.8 % as compared to other learning
styles. Diverges with 30.2 percent was the next common learning style while the
accommodators had the lowest percentage 14.1 of the four learning styles. In table
4.6 percentages of four learning style types was shown.
64
Table 4.6 Percentages of the Four Learning Styles According to Gender
Learning Styles Female Male Total
Accommodator 7.4 6.7 14.1
Diverger 17.4 12.8 30.2
Converger 9.3 10.6 19.9
Assimilator 20.9 14.9 35.8
Total 55.0 45.0 100
In Table 4.7, the mathematics achievement mean scores on the SBS subtest of
students who have different learning styles are presented. According to the findings
of the study, students who have a converger learning style had the highest mean
value (M = 7.04). This result may be interpreted as convergers’ mathematics
achievement scores on the SBS subtest were higher than the others.
Table 4.7 Mean of Mathematics Achievement Scores in the subtest of SBS
According to Learning Styles
Learning Styles Mean of SBMATH
Accommodator 5.15
Diverger 5.22
Converger 7.26
Assimilator 6.79
65
Box plots are useful when the distribution of scores is compared. Box plots
can be used to explore the distribution of continuous variables or, alternatively, box
plots can be used to break down scores in to different groups (Pallant, 2005, p.70).
Referring to the box plot, Dally and Bourke (2000) stated that “A rectangular box
shows where most of the data lie (between the quartiles), a line in the box marks the
center of the data and the ‘whiskers’ which encompass nearly all of the remaining
data extend from either end of the box” (Dally & Bourke, 2000). Pallant (2005)
emphasized the importance of the line in the box as follows: “The line across the
inside of the box represents the median value” (Pallant, 2005, p.70).
The distribution of achievement scores in the mathematics SBS subtest
according to learning styles of students was indicated in Figure 4.1. From this
figure, the whiskers show that the range of achievement scores for convergers is
larger than achievement scores for the other learning styles of students. Besides,
spread in the students have converger learning style is larger than other learning
styles, pointing to students having converger learning styles show larger diversity on
mathematics achievement than other ones. When the boxes of four learning styles
are considered, according to edges of rectangles, achievement of most of the
converger students are higher than students having other learning styles since the
values of lower quartile and upper quartile are higher than other learning styles.
According to box and its edges, achievement of most of the students have
accommodator learning styles are lower than the other learning styles.
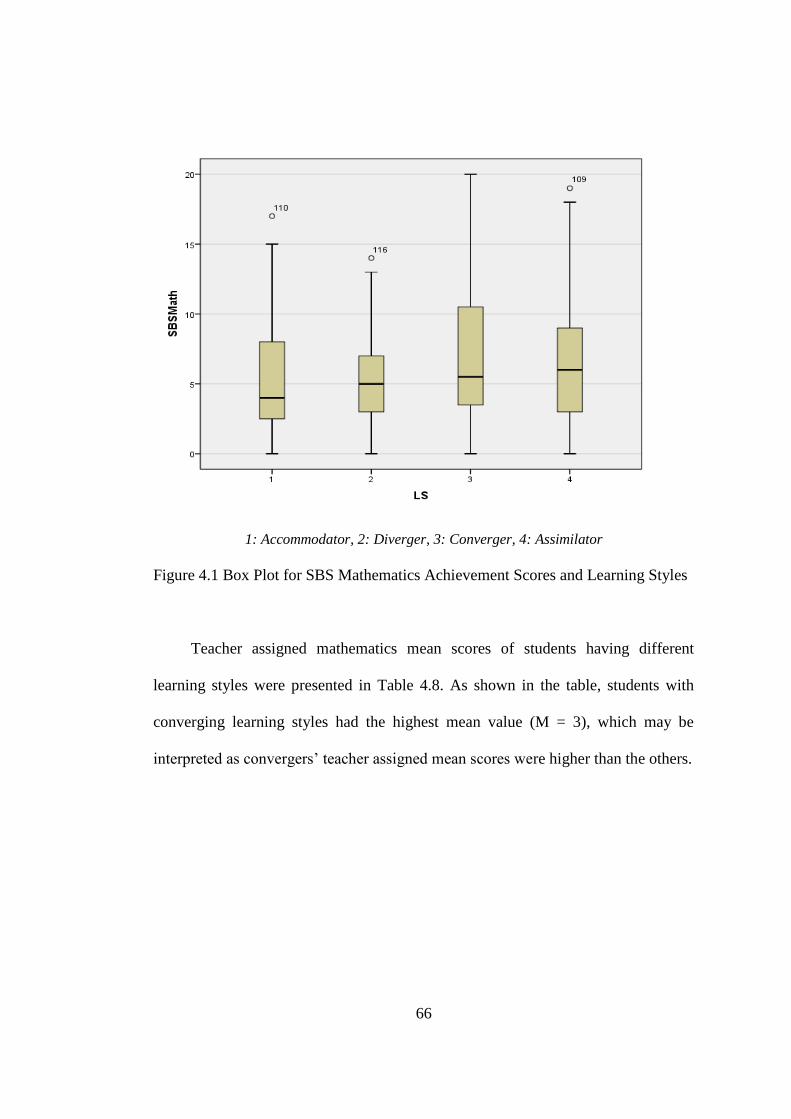
66
1: Accommodator, 2: Diverger, 3: Converger, 4: Assimilator
Figure 4.1 Box Plot for SBS Mathematics Achievement Scores and Learning Styles
Teacher assigned mathematics mean scores of students having different
learning styles were presented in Table 4.8. As shown in the table, students with
converging learning styles had the highest mean value (M = 3), which may be
interpreted as convergers’ teacher assigned mean scores were higher than the others.
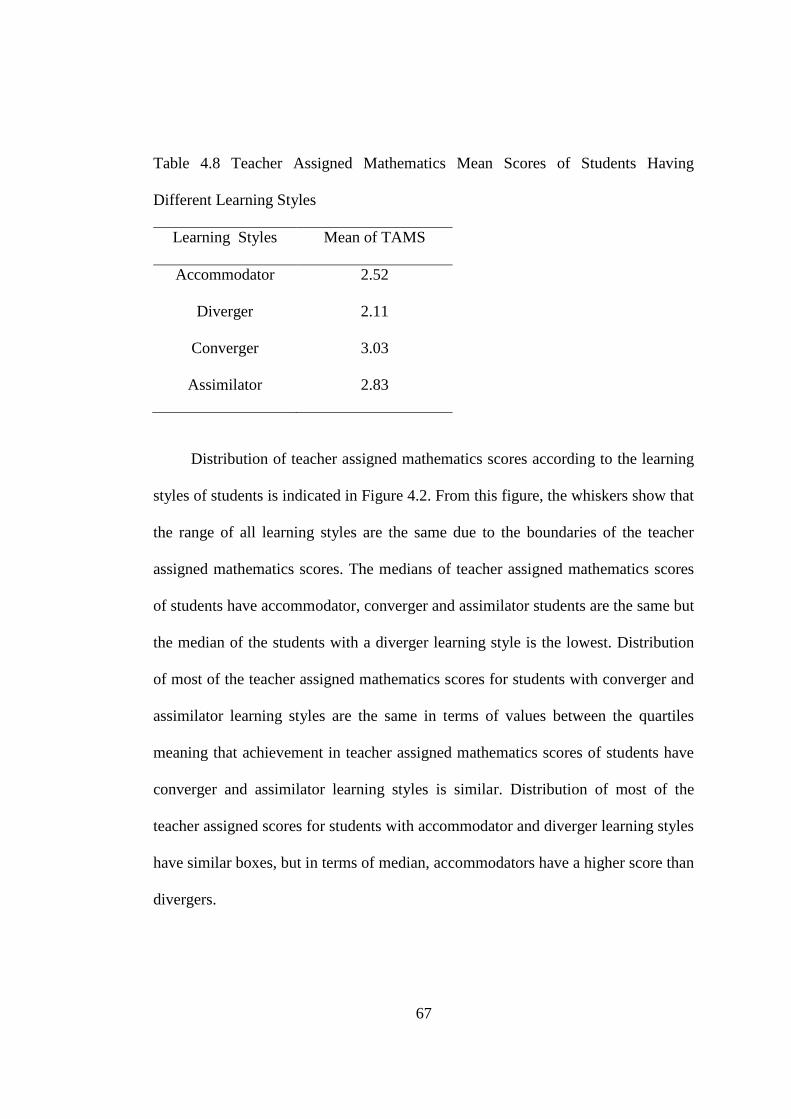
67
Table 4.8 Teacher Assigned Mathematics Mean Scores of Students Having
Different Learning Styles
Learning Styles Mean of TAMS
Accommodator 2.52
Diverger 2.11
Converger 3.03
Assimilator 2.83
Distribution of teacher assigned mathematics scores according to the learning
styles of students is indicated in Figure 4.2. From this figure, the whiskers show that
the range of all learning styles are the same due to the boundaries of the teacher
assigned mathematics scores. The medians of teacher assigned mathematics scores
of students have accommodator, converger and assimilator students are the same but
the median of the students with a diverger learning style is the lowest. Distribution
of most of the teacher assigned mathematics scores for students with converger and
assimilator learning styles are the same in terms of values between the quartiles
meaning that achievement in teacher assigned mathematics scores of students have
converger and assimilator learning styles is similar. Distribution of most of the
teacher assigned scores for students with accommodator and diverger learning styles
have similar boxes, but in terms of median, accommodators have a higher score than
divergers.

68
1: Accommodator, 2: Diverger, 3: Converger, 4: Assimilator
Figure 4.2: Box Plot for Teacher Assigned Mathematics Scores and Learning Styles
4.2 Inferential Statistics
In the statistical analysis of research, the distribution of variables was
analyzed according to convenience of normal distribution by the Kolmogorov–
Smirnov test and the Shapiro–Wilk test. Since the normal distribution was not
provided for variables, the Kruskal–Wallis one-way analysis of variance test was
used and the Mann–Whitney U test was used for analysis among the groups. The
relationship between variables was analyzed by Pearson correlation coefficient and
the level of significance was accepted as .05 in this study.
69
4.2.1 Reason of Use and Assumptions of Mann-Whitney U Test
Pallant (2005) stated that Mann-Whitney U Test is a non-parametric statistical
technique to test differences between two independent groups on a continuous
measure. This test is the non parametric alternative to the t-test for independent
samples. The t-test has five assumptions: level of measurement, random sampling,
and independence of observations, normal distribution and homogeneity of variance
(Pallant, 2005, p.197). According to results presented in Table 4.9, mathematics
achievement scores on the SBS subtest of (Kolmogorov-Simirnov (155) = .000;
p<.05, Kolmogorov-Simirnov (127) = .000; p<.05) and teacher assigned
mathematics scores (Kolmogorov-Simirnov (155) = .000; p <.05, Kolmogorov-
Simirnov (127) = .000; p<.05) did not have normal distribution. As a result of this
situation, the Mann-Whitney U test was used.
The Mann-Whitney U test has two assumptions: random sampling and
independent observations which were held for the variables and methods of this
study. Because of this reason, the Mann-Whitney U test was used to analyze the
differences between the SBS mathematics achievement scores and the teacher
assigned mathematics scores according to gender.
To provide independent observation, Learning Style Inventory was
administered in together with the teachers of course and researcher in the schools.
Data of teacher assigned mathematics scores and SBS mathematics achievement
scores were collected under the observation and permission of authorized personnel
of national directorate and assistant principals of the schools.
70
4.2.2 Reason of Use and Assumptions of Kruskal – Wallis Test
The Kruskal – Wallis test is the non parametric alternative to one-way
between groups analysis of variance (ANOVA) (Pallant, 2005, p.294). ANOVA has
the same assumptions as the t-test. As presented in Table 4.9, mathematics
achievement scores in the subtest of SBS and teacher assigned mathematics scores
did not provide the normal distribution. As a consequence of this status, the
Kruskal-Wallis Test was used.
The Kruskal-Wallis test has the same assumptions as the Mann-Whitney U
Test. As stated in the previous section, the assumptions of non parametric
techniques were held. In this study, the Kruskal-Wallis test was used to analyze
scores which define significance of difference among the groups which are
difference in mathematics achievement scores according to learning styles, gender
of students and students’ schools in the specified regions of town.
4.2.3 State of Normal Distribution for Study’s Variables
For the analysis of two variables to be inferred, the state of normal distribution
for variables is important. Kolmogorov – Smirnov test assesses the normality of
distribution of scores. A non-significant result (significance value of more than .05)
indicates normality. (Pallant, 2005, p.57) Tests of normality results for SBS
mathematics achievement scores (abbreviated as SBSMATHS) and teacher assigned
mathematics scores (abbreviated as TAMS) according to gender were presented in
Table 4.9. According to the findings, mathematics achievements scores of the SBS
subtest according to gender had a significance value (p < .05) which did not violate

71
the assumption of normality. In addition, teacher assigned mathematics scores
according to gender also had a significance value (p < .05) which did not violate the
assumption of normality. In other words, the SBS mathematics achievement scores
and teacher assigned mathematics scores regarding to gender did not have normal
distribution.
Table 4.9 Test of Normality Scores for SBS Mathematics Achievement Scores and
Teacher Assigned Mathematics Scores According to Gender
Gender
Kolmogorov -
Smirnov
Shapiro – Wilk
Statistic df Sig. Statistic df Sig.
SBSMATHS
Female
Male
.162
.169
155
127
.000
.000
.919
.886
155
127
.000
.000
TAMS
Female
Male
.178
.210
155
127
.000
.000
.869
.860
155
127
.000
.000
Tests of normality results based on the learning styles related to mathematics
the SBS achievement scores and teacher assigned mathematics scores are presented
in Table 4.10. According to findings in Table 4.10, the values of normality test of
SBS mathematics achievements scores and teacher assigned mathematics scores
regarding all the learning styles were lower than the value of significance (p= .05)
meaning that the SBS mathematics achievement scores and teacher assigned
mathematics scores regarding learning style did not violate the assumption of
normality.
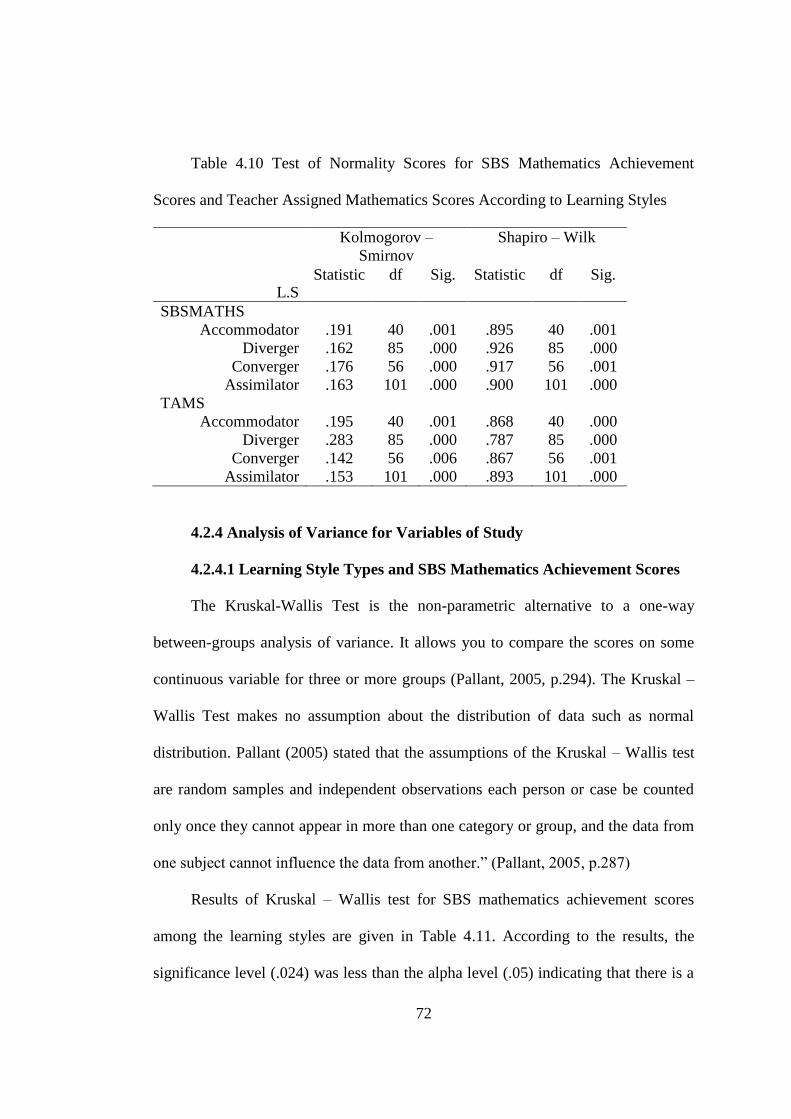
72
Table 4.10 Test of Normality Scores for SBS Mathematics Achievement
Scores and Teacher Assigned Mathematics Scores According to Learning Styles
L.S
Kolmogorov –
Smirnov
Shapiro – Wilk
Statistic df Sig. Statistic df Sig.
SBSMATHS
Accommodator
Diverger
Converger
Assimilator
.191
.162
.176
.163
40
85
56
101
.001
.000
.000
.000
.895
.926
.917
.900
40
85
56
101
.001
.000
.001
.000
TAMS
Accommodator
Diverger
Converger
Assimilator
.195
.283
.142
.153
40
85
56
101
.001
.000
.006
.000
.868
.787
.867
.893
40
85
56
101
.000
.000
.001
.000
4.2.4 Analysis of Variance for Variables of Study
4.2.4.1 Learning Style Types and SBS Mathematics Achievement Scores
The Kruskal-Wallis Test is the non-parametric alternative to a one-way
between-groups analysis of variance. It allows you to compare the scores on some
continuous variable for three or more groups (Pallant, 2005, p.294). The Kruskal –
Wallis Test makes no assumption about the distribution of data such as normal
distribution. Pallant (2005) stated that the assumptions of the Kruskal – Wallis test
are random samples and independent observations each person or case be counted
only once they cannot appear in more than one category or group, and the data from
one subject cannot influence the data from another.” (Pallant, 2005, p.287)
Results of Kruskal – Wallis test for SBS mathematics achievement scores
among the learning styles are given in Table 4.11. According to the results, the
significance level (.024) was less than the alpha level (.05) indicating that there is a

73
statistically significant difference in SBS mathematics achievement scores across
the learning styles. [2(3) =9.436; p = .024; p<.05]
Table 4.11: Kruskal – Wallis Test Scores of SBS Mathematics Achievement Scores
among Learning Style Types
Test Statistics a, b
Learning Styles
Chi – square 9.436
Df 3
Asym.Sig .024
a. Kruskal Wallis Test
b. Grouping Variable : LS
Pallant (2005) stated that the value of significance level is as follows: “If this
significance level is a value less than .05 then you can conclude that there is a
statistically significant difference in your continuous variable across groups. You
can then inspect the Mean Rank for the groups. This will tell you which of the
groups had the highest overall ranking that corresponds to the highest score on your
continuous variable.”(Pallant, 2005, p.295)
The mean ranks of learning styles are presented in Table 4.12. Since the
significance value (.024) is less than the alpha level (.05), comparisons on SBS
mathematics achievement scores can be made among the learning styles. In Table
4.12, convergers had the highest mean rank (158.32) suggesting that students with a
converger learning style had the highest SBS mathematics achievements scores. In
addition, the assimilators’ SBS mathematics achievement scores were higher than
SBS mathematics achievement scores of divergers and accommodators.
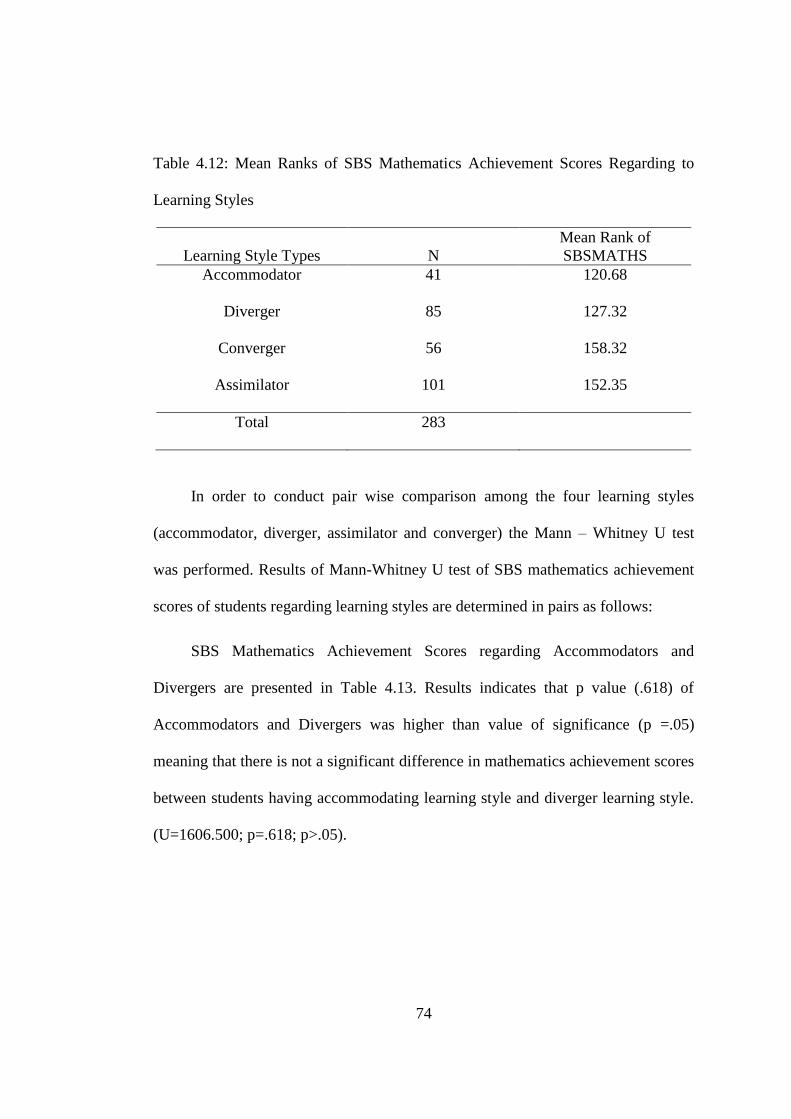
74
Table 4.12: Mean Ranks of SBS Mathematics Achievement Scores Regarding to
Learning Styles
Learning Style Types
N
Mean Rank of
SBSMATHS
Accommodator 41 120.68
Diverger 85 127.32
Converger 56 158.32
Assimilator 101 152.35
Total 283
In order to conduct pair wise comparison among the four learning styles
(accommodator, diverger, assimilator and converger) the Mann – Whitney U test
was performed. Results of Mann-Whitney U test of SBS mathematics achievement
scores of students regarding learning styles are determined in pairs as follows:
SBS Mathematics Achievement Scores regarding Accommodators and
Divergers are presented in Table 4.13. Results indicates that p value (.618) of
Accommodators and Divergers was higher than value of significance (p =.05)
meaning that there is not a significant difference in mathematics achievement scores
between students having accommodating learning style and diverger learning style.
(U=1606.500; p=.618; p>.05).
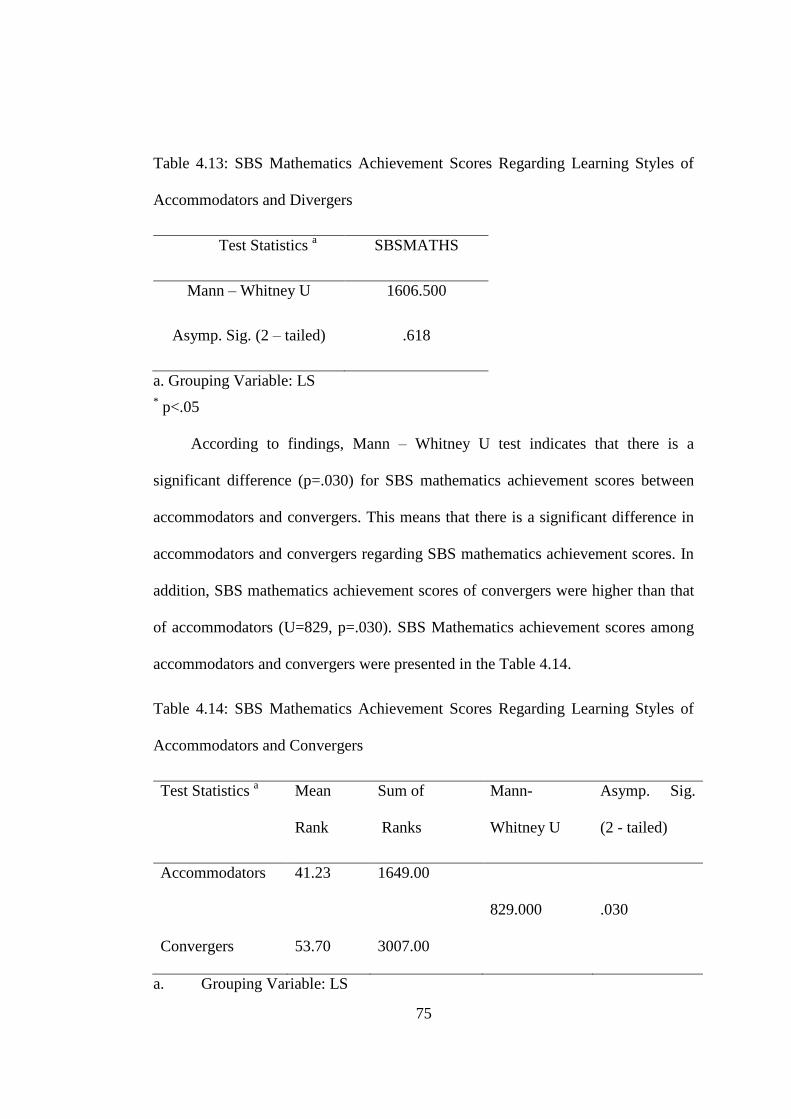
75
Table 4.13: SBS Mathematics Achievement Scores Regarding Learning Styles of
Accommodators and Divergers
Test Statistics a SBSMATHS
Mann – Whitney U 1606.500
Asymp. Sig. (2 – tailed) .618
a. Grouping Variable: LS
* p<.05
According to findings, Mann – Whitney U test indicates that there is a
significant difference (p=.030) for SBS mathematics achievement scores between
accommodators and convergers. This means that there is a significant difference in
accommodators and convergers regarding SBS mathematics achievement scores. In
addition, SBS mathematics achievement scores of convergers were higher than that
of accommodators (U=829, p=.030). SBS Mathematics achievement scores among
accommodators and convergers were presented in the Table 4.14.
Table 4.14: SBS Mathematics Achievement Scores Regarding Learning Styles of
Accommodators and Convergers
Test Statistics a
Mean
Rank
Sum of
Ranks
Mann-
Whitney U
Asymp. Sig.
(2 - tailed)
Accommodators 41.23 1649.00
829.000 .030
Convergers 53.70 3007.00
a. Grouping Variable: LS

76
The Mann – Whitney U test is significant (p=.039) between accommodators
and assimilators that is to say that there is a statistically significant difference
between accommodators and assimilators regarding SBS mathematics achievement
scores. In addition, students having diverger learning styles had higher mathematics
scores than that of accommodators (U= 1571.5; p=.039). Results are given in Table
4.15.
Table 4.15: SBS Mathematics Achievement Regarding Learning Styles of
Accommodators and Assimilators
Test Statistics a
Mean
Rank
Sum of
Ranks
Mann-
Whitney U
Asymp. Sig.
(2 - tailed)
Accommodators 59.79 2391.50
1571. 500 .039
Assimilators 75.44 7619.50
a. Grouping Variable: LS
* p<.05
Similarly, the Mann – Whitney U test is produced significant results (p = .025)
between the scores of divergers and convergers which mean that there is a
statistically significant difference in SBS mathematics achievement scores of
divergers and convergers (U=1851; p=.025). Those findings are shown in Table
4.16.

77
Table 4.16: SBS Mathematics Achievement Scores Regarding Learning Styles of
Divergers and Convergers
Test Statistics a
Mean
Rank
Sum of
Ranks
Mann-
Whitney U
Asymp. Sig.
(2 - tailed)
Divergers 64.78 5506.00
1851.00 .025
Convergers 80.45 4505.00
a. Grouping Variable: LS
* p<.05
Divergers and assimilators had a statistically significant difference in their
SBS mathematics achievement scores with a significance level of p=.034. In
addition, SBS mathematics achievement scores of divergers are higher than that of
assimilators which presented in Table 4.17 (U= 3523; p=.034).
Table 4.17: SBS Mathematics Achievement Scores Regarding Learning Styles of
Divergers and Assimilators
Test Statistics a
Mean
Rank
Sum of
Ranks
Mann-
Whitney U
Asymp. Sig.
(2 - tailed)
Divergers 84.45 7178.00
3523.00 .034
Assimilators 101.12 10213.00
b.Grouping Variable: LS
* p<.05

78
The significance level (p=.654) of the SBS mathematics achievement scores
among assimilators and convergers which is not significant according to the Mann –
Whitney U test. It means that there is no statistically significant difference in SBS
mathematics achievement scores of assimilators and convergers (U=2706.5;
p=.654). Those findings are shown in Table 4.18.
Table 4.18: SBS Mathematics Achievement Scores Regarding Learning Styles of
Convergers and Assimilators
Test Statistics a
SBSMATHS
Mann – Whitney U 2706.000
Asymp. Sig. (2 - tailed) .654
a. Grouping Variable: LS
* p<.05
4.2.4.2. Learning Styles and Teacher Assigned Mathematics Scores
The Kruskal – Wallis Test Scores for the teacher assigned mathematics scores
regarding the learning styles are presented in Table 4.19. According to the results,
the significance level was less than the alpha level (p=.05) meaning that there is a
statistically significant difference in teacher assigned mathematics scores across the
learning styles. [2(3) =19.229; p<.05]
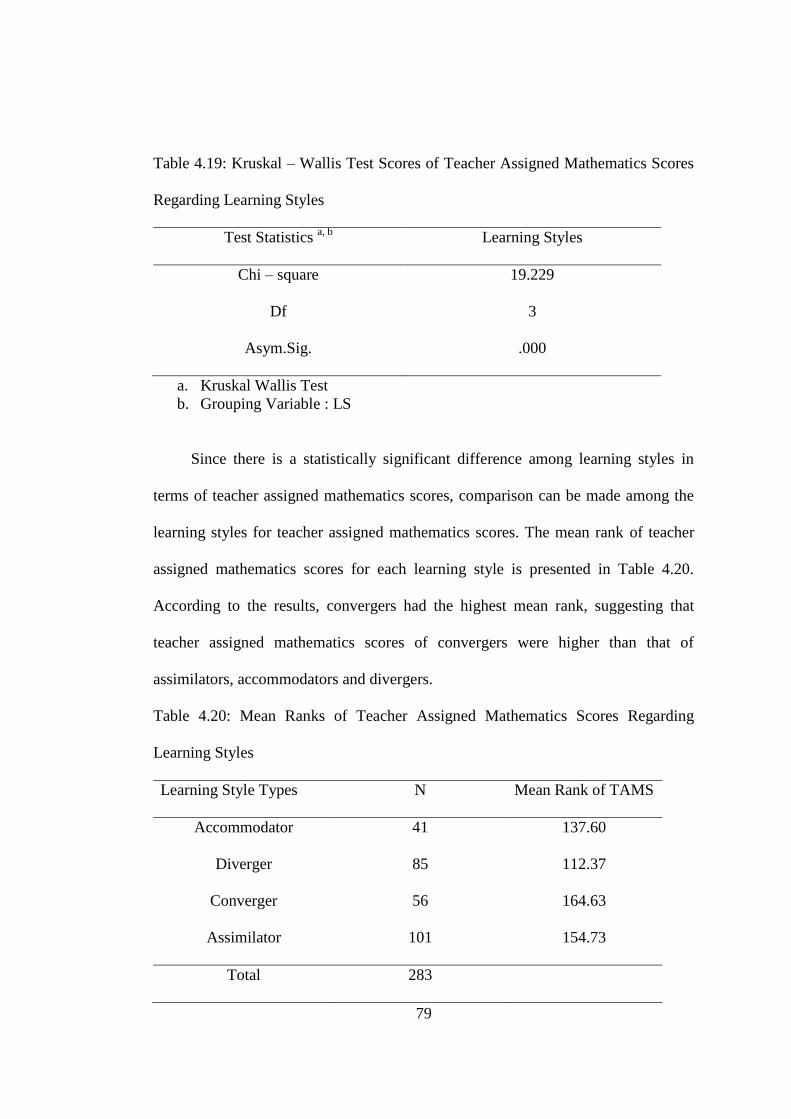
79
Table 4.19: Kruskal – Wallis Test Scores of Teacher Assigned Mathematics Scores
Regarding Learning Styles
Test Statistics a, b
Learning Styles
Chi – square 19.229
Df 3
Asym.Sig. .000
a. Kruskal Wallis Test
b. Grouping Variable : LS
Since there is a statistically significant difference among learning styles in
terms of teacher assigned mathematics scores, comparison can be made among the
learning styles for teacher assigned mathematics scores. The mean rank of teacher
assigned mathematics scores for each learning style is presented in Table 4.20.
According to the results, convergers had the highest mean rank, suggesting that
teacher assigned mathematics scores of convergers were higher than that of
assimilators, accommodators and divergers.
Table 4.20: Mean Ranks of Teacher Assigned Mathematics Scores Regarding
Learning Styles
Learning Style Types N Mean Rank of TAMS
Accommodator 41 137.60
Diverger 85 112.37
Converger 56 164.63
Assimilator 101 154.73
Total 283

80
4.2.5 Analysis of SBS Mathematics Achievement Scores and Teacher
Assigned Mathematics Scores According to Gender
Pallant (2005) explained the analysis for the difference between two
independent non parametric variables as follows: “This technique is used to test for
differences between two independent groups on a continuous measure. This test is
the non-parametric alternative to the t-test for independent samples. Instead of
comparing means of the two groups, as in the case of the t-test, the Mann-Whitney
U Test actually compares medians. It converts the scores on the continuous variable
to ranks, across the two groups. It then evaluates whether the ranks for the two
groups differ significantly. As the scores are converted to ranks, the actual
distribution of the scores does not matter.” (Pallant, 2005, p. 291)
The Mann – Whitney U Test scores for the SBS mathematics achievement
scores according to gender are presented in Table 4.21. According to the results, the
significance level for SBSMATHS (p=.015) is less than the alpha level (p=.05)
which shows that there is statistically significant difference between SBS
mathematics achievement scores of males and females (U=8246; p=.015). Since
there is statistically difference for both SBS mathematics achievement scores of
males and females, comparisons can be made for mathematics achievement scores
in SBS mathematics achievement scores between males and females. The mean rank
of SBS mathematics achievement scores for females and males is also presented in
Table 4.21. According to the findings of SBS mathematics achievement scores,
females’ mean rank score (152.64) is higher than males’ rank score (128.93)
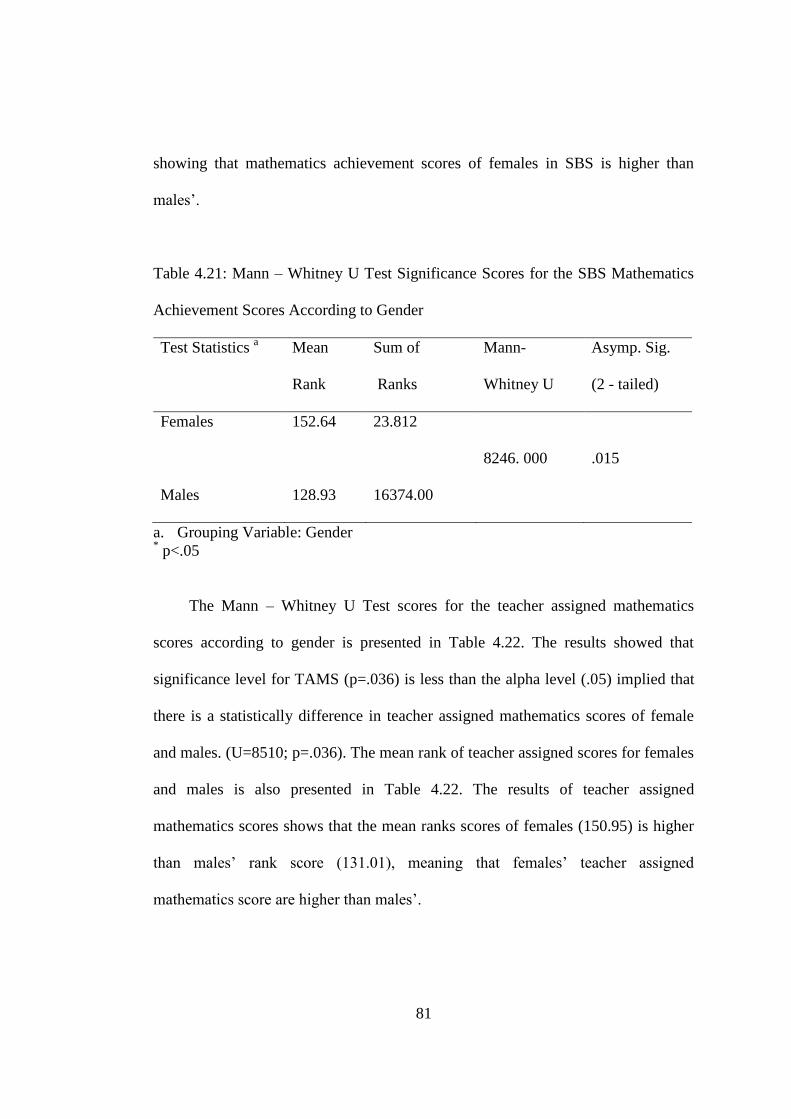
81
showing that mathematics achievement scores of females in SBS is higher than
males’.
Table 4.21: Mann – Whitney U Test Significance Scores for the SBS Mathematics
Achievement Scores According to Gender
Test Statistics a
Mean
Rank
Sum of
Ranks
Mann-
Whitney U
Asymp. Sig.
(2 - tailed)
Females 152.64 23.812
8246. 000 .015
Males 128.93 16374.00
a. Grouping Variable: Gender * p<.05
The Mann – Whitney U Test scores for the teacher assigned mathematics
scores according to gender is presented in Table 4.22. The results showed that
significance level for TAMS (p=.036) is less than the alpha level (.05) implied that
there is a statistically difference in teacher assigned mathematics scores of female
and males. (U=8510; p=.036). The mean rank of teacher assigned scores for females
and males is also presented in Table 4.22. The results of teacher assigned
mathematics scores shows that the mean ranks scores of females (150.95) is higher
than males’ rank score (131.01), meaning that females’ teacher assigned
mathematics score are higher than males’.
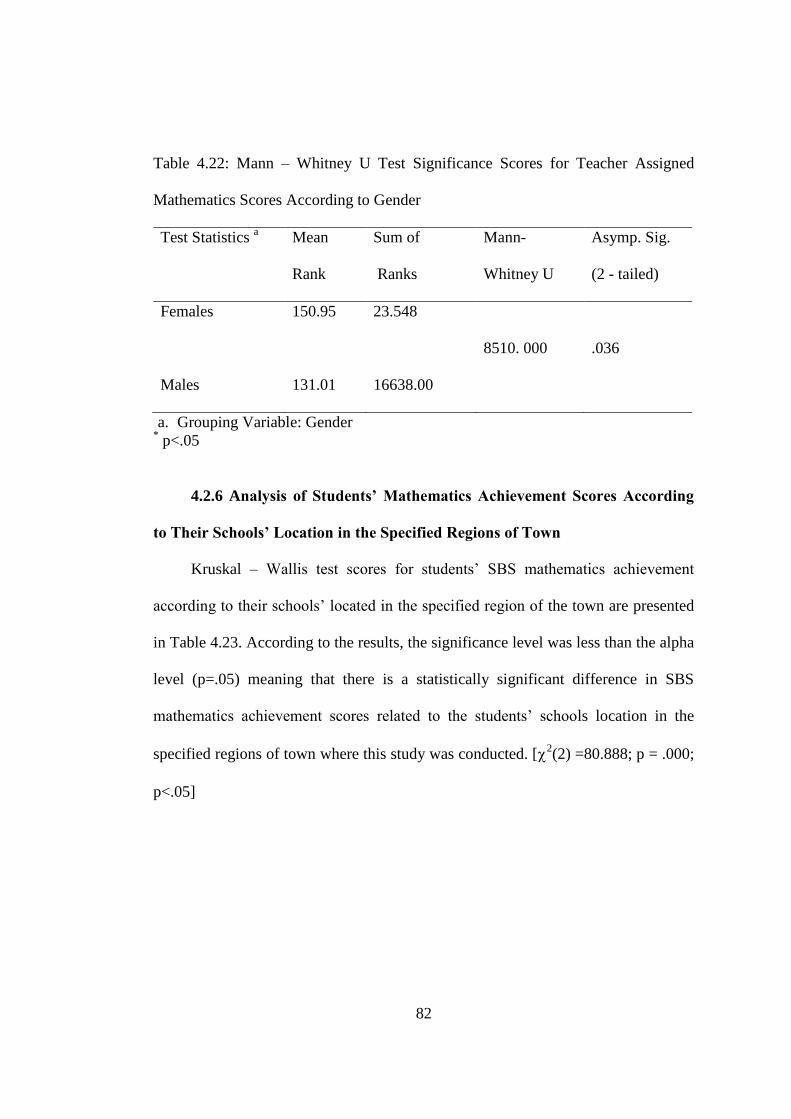
82
Table 4.22: Mann – Whitney U Test Significance Scores for Teacher Assigned
Mathematics Scores According to Gender
Test Statistics a
Mean
Rank
Sum of
Ranks
Mann-
Whitney U
Asymp. Sig.
(2 - tailed)
Females 150.95 23.548
8510. 000 .036
Males 131.01 16638.00
a. Grouping Variable: Gender * p<.05
4.2.6 Analysis of Students’ Mathematics Achievement Scores According
to Their Schools’ Location in the Specified Regions of Town
Kruskal – Wallis test scores for students’ SBS mathematics achievement
according to their schools’ located in the specified region of the town are presented
in Table 4.23. According to the results, the significance level was less than the alpha
level (p=.05) meaning that there is a statistically significant difference in SBS
mathematics achievement scores related to the students’ schools location in the
specified regions of town where this study was conducted. [2(2) =80.888; p = .000;
p<.05]
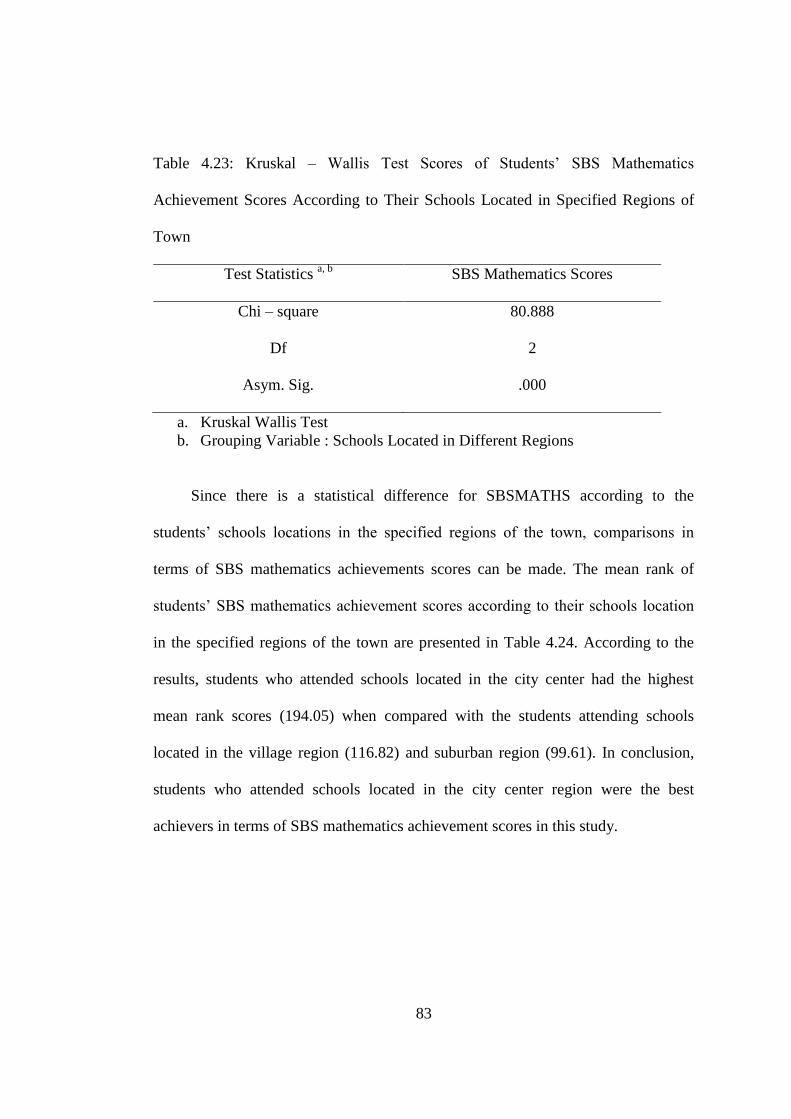
83
Table 4.23: Kruskal – Wallis Test Scores of Students’ SBS Mathematics
Achievement Scores According to Their Schools Located in Specified Regions of
Town
Test Statistics a, b
SBS Mathematics Scores
Chi – square 80.888
Df 2
Asym. Sig. .000
a. Kruskal Wallis Test
b. Grouping Variable : Schools Located in Different Regions
Since there is a statistical difference for SBSMATHS according to the
students’ schools locations in the specified regions of the town, comparisons in
terms of SBS mathematics achievements scores can be made. The mean rank of
students’ SBS mathematics achievement scores according to their schools location
in the specified regions of the town are presented in Table 4.24. According to the
results, students who attended schools located in the city center had the highest
mean rank scores (194.05) when compared with the students attending schools
located in the village region (116.82) and suburban region (99.61). In conclusion,
students who attended schools located in the city center region were the best
achievers in terms of SBS mathematics achievement scores in this study.

84
Table 4.24: Mean Ranks of Students’ SBS Mathematics Achievement Scores
According to their Attended Schools’ Location in the Specified Regions of Town
Schools Located in the
Specified Regions
N
Mean Rank of
SBSMATHS
Village 66 116.82
City Center 115 194.05
Suburban 102 99.61
Total 283
SBS mathematics achievement scores in SBS are also determined regarding to
the students’ schools in pair wise. Firstly, the SBS mathematics achievement scores
students who attended schools located in village and the city center regions were
considered. The Mann – Whitney U Test Scores for the mathematics achievement
scores in SBS between the students who attended schools located in village and the
city center regions were presented in Table 4.25. According to the results, the
significance level for SBSMATHS is (p=.000) between the students who attended
schools located in the village and the city center regions was lower than the alpha
level (p=.05) which shows that there is a statistically significant difference in SBS
mathematics achievement scores between students who attended schools located in
the village and city center regions. (U=1583; p< .05)

85
Table 4.25: Mann – Whitney U Test Significance Scores for the SBSMATHS
According to Students Attendance in Schools Located in the Village and the City
Center Regions
Test Statistics a
Mean
Rank
Sum of
Ranks
Mann-
Whitney U
Asymp. Sig.
(2 - tailed)
Village 57.48 3794.00
1583.000 .000
City Center 110.23 12677.00
a. Grouping Variable: Students who Attended Schools Located in the Village and
the City Center Regions
Since there is a statistical difference in SBS mathematics achievement scores
between the students who attended schools located in the village and the city center
regions, comparisons in terms of SBS mathematics achievement scores can be
made. According to the results, the mean rank scores of students who attended
schools in the city center region (110.23) is higher than the mean rank score (57.48)
of students who attended schools located in the village regions which shows that
students who attended schools located in the city center region had higher
mathematics achievement scores than students who attended schools located in the
village regions.
Secondly, SBS mathematics achievement scores of students who attended
schools located in the village and the suburban regions were considered. The Mann
– Whitney U Test Scores for the SBS mathematics achievement scores between the
students who attended schools located in village and suburban regions is presented
in Table 4.26. According to the results, the significance level for SBSMATHS

86
(p=.071) between the students who attended schools located in village and the
suburban regions was higher than the alpha level (p=.05). This demonstrated that
there is no statistically significant difference in SBS mathematics achievement
scores between students who attended schools located in village and suburban
regions.
Table 4.26: Mann – Whitney U Test Significance Scores for the SBSMATHS
According to Students Attended Schools Located in Village and Suburban
Test Statistics a SBSMATHS
Mann – Whitney U 2816.000
Asymp. Sig. (2 tailed) .071
a. Grouping Variable: Students who Attended Schools Located in the Village and
Suburban Regions of the Town
Lastly, SBS mathematics achievement scores of students who attended
schools located in the city center and the suburban regions were considered. The
Mann – Whitney U Test Scores for the SBS mathematics achievement scores
between the students who attended schools located in city center and suburban
regions are presented in Table 4.27. As the results show, the significance level for
SBSMATHS (p< .05) between the students who attended schools located the in city
center and the suburban was lower than the alpha level (p=.05). This result indicates
that there is a statistically significant difference in SBS mathematics achievement
scores between students who attended schools located in the city center and the
suburban regions. (U=2091; p< .05)

87
Table 4.27: Mann – Whitney U Test Significance Scores for the SBSMATHS
According to Students Attended Schools Located in City Center and Suburban
Test Statistics a
Mean
Rank
Sum of
Ranks
Mann-
Whitney U
Asymp. Sig.
(2 - tailed)
City Center 141. 82 16309.00
2091.000 .000
Suburban 72.00 7344.00
a. Grouping Variable: Students who Attended Schools Located in the City Center
and the Suburban Regions of the Town
Since there is a statistically significant difference in SBS mathematics
achievement scores between the students who attended schools located in the city
center and the suburban regions, comparisons in terms of SBS mathematics
achievement scores can be made. The Mann – Whitney U Test mean ranks of
students who attended schools located in the suburban and the city center regions
was presented in Table 4.27. According to results, mean rank of students who
attended schools in the city center region (141.82) is higher than the mean rank
score of students who attended schools located in suburban region (72.00). This
shows that students attended schools located in city center had higher mathematics
achievement scores than students attended schools located in the suburban.
4.3Assessment of Hypotheses of Study
In this part of the chapter, the study’s hypotheses will be assessed.

88
4.3.1 Null Hypothesis 1
As a reminder, the null hypothesis 1 was stated as follows: There is no
statistically significant difference in the SBS mathematics scores of 8th grade
students with different learning styles. The Kruskal – Wallis Test was conducted to
determine differences among the 8th grade students with different learning styles
regarding their SBS mathematics scores. As seen in Table 4.11, Kruskal – Wallis
was significant (2 (3) = 9.436, p=.024) and the null hypothesis 1 was rejected. In
other words, there is a statistically significant difference in the SBS mathematics
scores of 8th grade students with different learning styles.
4.3.2 Null Hypothesis 2
It is also important here to state again the second null hypothesis as follows:
There is no statistically significant difference in teacher assigned mathematics
grades of 8th grade students with different learning styles. The Kruskal – Wallis test
was performed to determine difference among the 8th grade students with different
learning styles regarding their teacher-assigned mathematics grades. As seen in
Table 4.19, Kruskal – Wallis was significant [2(3) =19.229; p<.05] and the second
null hypothesis was rejected. In other words, there is a statistically significant
difference in teacher assigned mathematics grades of 8th grade students with
different learning styles.
4.3.3 Null Hypothesis 3
The third hypothesis of study was stated as follows: There is no statistically
significant difference between female and male 8th grade students regarding their
SBS mathematics scores. The Mann – Whitney U test was performed to determine
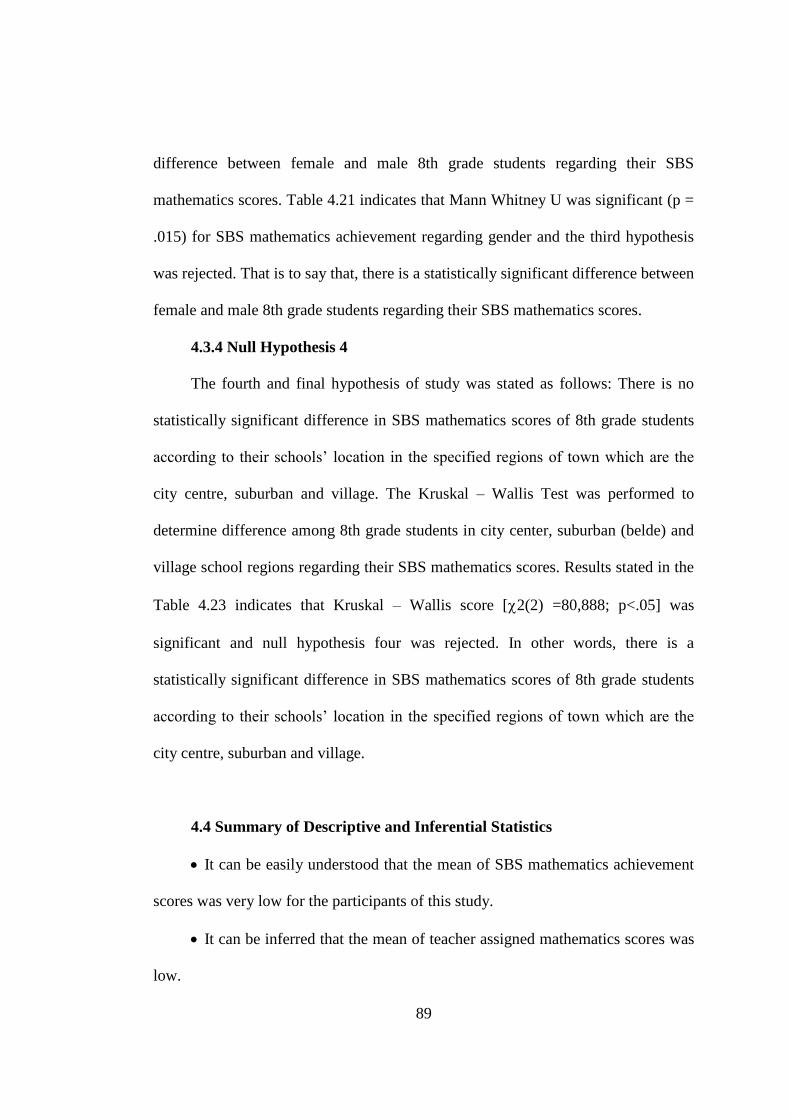
89
difference between female and male 8th grade students regarding their SBS
mathematics scores. Table 4.21 indicates that Mann Whitney U was significant (p =
.015) for SBS mathematics achievement regarding gender and the third hypothesis
was rejected. That is to say that, there is a statistically significant difference between
female and male 8th grade students regarding their SBS mathematics scores.
4.3.4 Null Hypothesis 4
The fourth and final hypothesis of study was stated as follows: There is no
statistically significant difference in SBS mathematics scores of 8th grade students
according to their schools’ location in the specified regions of town which are the
city centre, suburban and village. The Kruskal – Wallis Test was performed to
determine difference among 8th grade students in city center, suburban (belde) and
village school regions regarding their SBS mathematics scores. Results stated in the
Table 4.23 indicates that Kruskal – Wallis score [2(2) =80,888; p<.05] was
significant and null hypothesis four was rejected. In other words, there is a
statistically significant difference in SBS mathematics scores of 8th grade students
according to their schools’ location in the specified regions of town which are the
city centre, suburban and village.
4.4 Summary of Descriptive and Inferential Statistics
It can be easily understood that the mean of SBS mathematics achievement
scores was very low for the participants of this study.
It can be inferred that the mean of teacher assigned mathematics scores was
low.
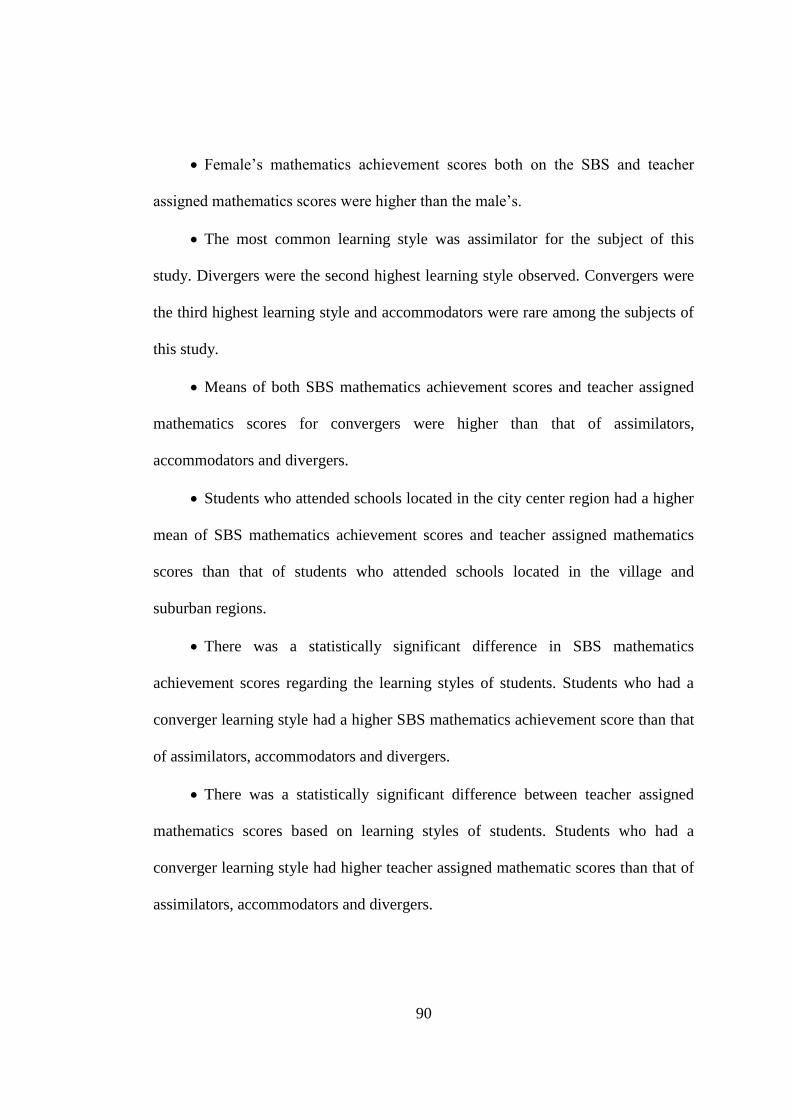
90
Female’s mathematics achievement scores both on the SBS and teacher
assigned mathematics scores were higher than the male’s.
The most common learning style was assimilator for the subject of this
study. Divergers were the second highest learning style observed. Convergers were
the third highest learning style and accommodators were rare among the subjects of
this study.
Means of both SBS mathematics achievement scores and teacher assigned
mathematics scores for convergers were higher than that of assimilators,
accommodators and divergers.
Students who attended schools located in the city center region had a higher
mean of SBS mathematics achievement scores and teacher assigned mathematics
scores than that of students who attended schools located in the village and
suburban regions.
There was a statistically significant difference in SBS mathematics
achievement scores regarding the learning styles of students. Students who had a
converger learning style had a higher SBS mathematics achievement score than that
of assimilators, accommodators and divergers.
There was a statistically significant difference between teacher assigned
mathematics scores based on learning styles of students. Students who had a
converger learning style had higher teacher assigned mathematic scores than that of
assimilators, accommodators and divergers.
91
There was a statistically significant difference in SBS mathematics
achievement scores regarding the gender of students. Female students had higher
mathematics achievement scores than males.
There was a significant difference in SBS mathematics achievement scores
among the students who attend schools located in specified regions (the city center,
suburban and village) of town. Students who attended schools located in the city
center region had higher SBS mathematics achievement scores than that of students
in suburban and the village regions.
In pair wise comparisons, there was a statistically difference in SBS
mathematics achievement scores between students who attended schools located in
the city center region and students who attended schools located in the village
regions.
There is not a statistically difference in SBS mathematics achievement
scores between students who attended schools located in the village regions and
students attended schools located in suburban region.
There was a statistically difference in SBS mathematics achievement scores
between students who attended schools located in the city center region and students
who attended schools located in suburban region.
92
CHAPTER V
CONCLUSIONS, DISCUSSIONS AND IMPLICATIONS
In this chapter, summary of research study, conclusions and discussions of the
results, internal and external validity, implications of study and recommendations
for further studies were presented.
5.1 Summary of Research Study
Learning Style Inventory (LSI) was administered to 283 eighth grade students
who were chosen from an accessible population. They were students at different
schools located in different regions of Mustafakemalpaşa Town of Bursa during the
spring semester of 2009 – 2010. The regions which the schools were located were
taken into consideration as geographical places in Mustafakemalpaşa town which
are city center, suburban (belde in Turkish) and villages. Mathematics achievement
scores in the subtest of SBS and teacher assigned scores of the students were
obtained from authorized personnel of district national education directorate.
Representative sample was chosen by purposive sampling method which was used
together with a convenience of access to schools. Research methodologies used
during the study were descriptive and comparative.

93
5.2 Conclusions
Results of the study showed that there was a significant difference in
mathematics achievement scores in SBS with respect to learning styles of the
students. During the study, most common types of learning styles among the
students of this study were assimilator and converger types, former were being the
highest. Although assimilators were in the majority of this study; students who have
converger learning style found to be more successful than the ones who are
assimilators, accommodators and divergers when mathematics achievement scores
in the subtest of SBS was considered.
The results of study also showed that there was a significant difference in
teacher assigned mathematics scores regarding to the learning styles of students.
Like in the mathematics achievement scores in SBS, students having converger type
of learning styles, were found to be more successful than assimilators,
accommodators and divergers in terms of teacher assigned mathematics scores.
There was also significant difference between male and female students in
terms of mathematics achievement scores in SBS and teacher assigned mathematics
scores. In both mathematics achievement scores in SBS and teacher assigned
mathematics scores, female students were found to be more successful than male
students.
The results of the study also pointed out that there was significant difference
in mathematics achievement scores in SBS regarding to the schools located in
different regions, such as city centre, suburban and village of the town where
research study was conducted. Students attending to the schools located in the city

94
center were found to be more successful than the ones in the village and suburban in
terms of mathematics achievement scores in SBS. Besides, students in schools
located in the villages were found to be more successful than students in school
located in suburban in terms of mathematics achievement scores in SBS.
Results of this study indicated that the learning mode of abstract
conceptualization (AC) and mathematics achievement scores in SBS were positively
correlated. Besides, abstract conceptualization scores (AC) and combined scores of
the abstract conceptualization and concrete experience (AC – CE) was positively
correlated. Moreover, a significant difference was found between the male and
female students in terms of learning mode of reflective observation (RO) in favor of
female students.
5.3 Discussion of the Results
The difference in the mathematics achievement scores in SBS regarding to
learning styles of the 8th
grade students was a major concern of this study.
Difference in the achievement in both SBS and teacher assigned mathematics scores
regarding to gender has been emphasized and is going to be discussed respectively.
Difference in the SBS mathematics achievement scores regarding to students in the
schools located in the different regions which was also important finding for this
study and is going to be discussed in details.
The discussion of this study was organized so as to compare results of the
current study with previous researches or studies. It is observed that the results of

95
current study have similarities with some previous researches. On the other hand, it
is seen that it contradicts with some previous researches.
In the research studies conducted with Turkish participants, assimilating type
of learning style, generally, was the most common learning style among the
students. As reported in the studies of Aşkar and Akkoyunlu (2002), Mutlu (2006)
and Özkan (2003) assimilators were the most common learning style. Beside, in the
study of Koçakoğlu (2010), it was decelerated that assimilating type of learning
style was the most common type of learning style among the pre-service teachers.
And also Peker and Mirasyedioğlu (2007) detected that assimilators were most
common seen type of learning style among the elementary school (from first grade
to eighth grade) teachers. At this point, it is important to remember the
specifications of an assimilator learner. Kolb (1984) stated that an individual with
an assimilating learning style has AC and RO as dominant learning abilities.
Assimilating learners give more importance to ideas and abstract concepts rather
than its practical sounds (Kolb, 1984). That is why lecturing can be enough to
understand the logical exploring of ideas or making analytical judgments among the
concepts for assimilators. At this point, Collinson’s determination on forming
learning styles in individual’s mind is important so that stated that students indicate
that significant changes in how they select to learn in a classroom environment
(Collinson, 2000). In the investigated studies during research of this study, it was
witnessed that in some of the research convergers and diverges were second most
common learning styles in the selected samples (Aktaş & Mirzeoğlu, 2009; Kaya
2007; Peker & Aydın, 2003).

96
Finding high rate of assimilators in the selected samples of investigated
researches can be seen as a coincidence but, according to researcher, this situation
should be interrogated. Learning modes of assimilator type of learning style has
abstract conceptualization and reflective observation in dominance. Abstract
conceptualization means establishing analytic thinking abilities and make
connections between ideas. Reflective observation means seeing events from
different perspectives or seeing facts to get an inference. Actually, this situation
indirectly suggested the passivity in classroom setting because neither thinking nor
observation requires activeness in the learning environment. Researcher believes
that learning styles of students are shaped by the often repeated instructional
methods because students feel instinctually ready to change his/her way of learning
according to instructional model of the teachers to understand what is narrated by
teachers in the class. The high percentage of assimilators found in this study might
be a reflection of teacher – centered instruction model. In this model, teacher is the
source of knowledge, that is active, and students are perceiver, that is passive. As
stated in the beginning of the introduction chapter, reform movements in
curriculums of courses were made to change lecturing based and teacher – centered
instructional model which is still unfortunately widely preferred instead of activity
based and student centered instructional model.
Another distinctive support of this situation can be seen in the results of
investigated research. The current study and other mentioned studies in this chapter
(Akkoyunlu, 2002; Aktaş & Mirzeoğlu, 2009; Delialioğlu, 2003; Kaya 2007;
Koçakoğlu, 2010; Mutlu 2006; Özkan 2003; Peker & Aydın, 2003) reported that
97
accommodators were the least common learning style type. Besides that, Orhun
(2007) conducted a study with senior university students of mathematics department
and found that there were no students who had accommodator learning style. Since
learning modes of accommodator type of learning style has concrete experience and
active experimentation in dominance, an accommodator individual is good at
practical applications in learning environment. When the dominance of lecture
based and teacher centered instructional model is taught in Turkey, situation of
minority in accommodators among students is an expected result since the most of
the time learning styles of students are affected by repeated instructional model.
Mathematics achievement in the subtest of SBS and teacher assigned
mathematics scores were accepted as mathematics achievements of students in this
study. Moreover, difference in mathematics achievements of students regarding to
different learning styles was the main concern of this study. Previously conducted
studies give a light to discuss the results of the current study. Interestingly and
unfortunately, no study was found in the investigated literature related with the
relation between the learning styles of students and mathematics achievement scores
in a nation wide applied examination. It is observed that mathematics achievement
scores were obtained from either standardized tests or teacher assigned scores.
In general, in the related literature (Arslan & Babadoğan, 2005; Delialioğlu,
2003; Hall, 1993; Kopsovich; 2001; Ok, 2009; Orhun; 2007; Özkan, 2003;
Raiszadeh, 1997; Treacy, 1996; Yazıcı, 2004; Yenilmez and Çakır, 2005)
achievement scores of students and learning styles were sought. Results of some
studies showed parallelism with the results of studies. For example, in Yazıcı’s

98
(2004) study, there is an obvious parallelism with the current study’s results because
there was a statistically significant difference among the mathematics achievement
scores and convergers who had the highest mean mathematics achievement scores
in the subtest of SBS. In addition to this, like in the Yazıcı’s study, assimilator type
of learning style had the second rank in terms of mean mathematics achievement
scores like in the results of current study. As also in the Kopsovich (2001) and Hall
(1993) studies, even the learning styles of students were determined from different
instruments, it can be seen that mathematics achievements scores could be shown
difference regarding to learning styles of students. However, in some studies,
Delialioğlu (2003) and Raiszadeh (1987), mathematics achievements and learning
styles of learners showed no significant relation.
In current study, there was significant difference in mathematics achievements
of genders and females’ mathematics achievement scores were higher than male
ones. However, Ma (2005) determined a study to investigate gender differences in
mathematics achievements regarding to scores of internationally applied
standardized tests. According to the findings of this study, there was significantly
difference in mathematics achievement scores in the test of PISA 2003 regarding to
gender. The results showed that boys were outperformed girls. However, there was
no significant difference in mathematics achievement scores regarding to gender in
the test of TIMMS (1999). Moreover, Over the review of 100 studies of meta –
analysis which was done by Hyde, Fennema, and Lamon (1990) male students had
better mathematics achievement score than females. However, in the some sated
studies (as in Özkan’s study) achievement scores of females were better than males.
99
Inconsistency in the results of studies could be related to types of assessment tools
and inequality in opportunity between genders, cultural differences and so on.
Difference in the mathematics achievements according to students at schools
which is located in different regions of town where study conducted was another
concern of this study. In literature, there are some studies (Bengiç, 2009; Cox, 2000;
Işıksal & Çakıroğlu, 2008) reported which investigate the regional differences in
mathematics achievement of the students which measured by standardized tests.
Results of some studies (Cox, 2000; Işıksal & Çakıroğlu, 2008) showed that
students live in the socio economically developed areas were statistically more
successful in the examinations than students live in socio economically
underdeveloped or developing areas. However, in Bengiç’s study, there is no
significant difference was found among the students who live in socio economically
developed areas and the students live in underdeveloped areas. Whether there was a
significant difference among the students who live in developed or undeveloped
areas was found or not, there was no study reported students who live in
underdeveloped areas were successful than the ones who live in developed areas.
Reason of this situation could be originated from the inequality in opportunity
between the areas because, in general, infrastructure of schools in developed areas is
better than the schools in undeveloped areas. Although it is just a thought of me, one
another reason of this situation could be associated with the priorities of people live
in different economical segments since in cities, educated parents give more
importance to their children. Actually, main reason could be economical difficulties
of people who live in socioeconomically underdeveloped areas.

100
As a general approach to the variables of gender and location of students, the
result of the current study had parallelism with some studies. In the present study,
there was statistically difference in mathematics achievement scores in regard to
gender and females had higher mean mathematics achievement scores than males.
Although some studies in the literature did not support the current study’s results, it
can be thought that male and female students have different tendency in
approaching learning from different point of views. It is observed; both in studies
related with mathematics or other courses that regional differences in the
achievements of students can be vary according to location they live in, and the
schools they attend. In some studies, it was reported that mathematics achievements
of the students had significant differences in regard to location of the student. It has
observed that students who live in socio economically developed locations
outperformed better than the ones who live in lower socio economically developed
locations in terms of mathematics achievements. PISA 2003 results (National
Ministry of Education, 2005) also showed that students in economically developed
countries had higher mean mathematics achievement scores as compared to students
in lower economically developed countries. Those findings support the results of the
current study which was students attend schools in city centre had the highest mean
scores.
So far, investigations related with the problems of the current study were
determined. As stated earlier of discussion, researcher thinks that learning styles of
the students can be shaped by teachers of them. Researcher observed in the
applications of classroom that mathematics achiever students or students who like to

101
do mathematics in the class, who has learning styles which are close to teachers’
teaching or learning styles. Peker, Mirasyedioğlu and Yalın (2003) administered a
study whose concern was learning style based mathematics instruction. They
administered their study with 500 tenth grade students and used Kolb’s learning
style inventory to define learning styles of students. In their study, whether
mathematics teachers’ instructional strategies used in the classroom is suitable for
learning styles of students was questioned. The results showed that mathematics
teacher gave little attention to students’ learning styles. It is shown that instructional
methods which was not fit to students’ thinking of mathematical concepts. Only in
the majority of students who have Converger type of learning styles found that
mathematics teachers’ instructional model was often fulfilled basic learning ways of
mathematics. Students who have assimilator type of learning style found that their
ways of learning mathematics was rarely the concern of mathematics teacher.
Students who have accommodator type of learning style implied that mathematics
teachers were never pay attention to their ways of learning by stating teacher had no
plan to handling lessons with activities have concrete materials or manipulative.
Half of divergers in this study stated that mathematics teachers were never trying to
provide opportunities for students to see mathematical concepts from different point
of views.
From broader perspectives, to increase the achievement of students, learning
styles of students can be associated with the learning strategies of students. Çelenk
& Karakış (2007) accomplished a study to investigate the relation between level of
usage in general learning strategies and different learning styles with first year

102
university students and Kolb’s learning style inventory was used. Findings of this
study showed that accommodators, divergers, convergers and assimilators very
often preferred to use Attention, Elaboration, Cognitive, Memory and Meta-
cognitive Strategies. Although Affective learning strategy was sometimes preferred
by Accommodators, Divergers and Convergers, it was frequently used preferred by
Assimilators.
Both studies of Çelenk & Karakış and Peker, Mirasyedioğlu & Yalın
indirectly implied that if learning styles of the students taken into account by
teachers and knowing learning strategies of students in together with their learning
styles, then students’ approach toward mathematical concepts would develop in
positive direction.
5.4 Implications of the Study
The results of the current study and previously determined researches give a
light for making suggestions which may be practically sounds is going to be stated
in this section. Important measurement tool of this study was the Kolb’s learning
style inventory (LSI) which defines the learning style of students can be used by
teachers.
In the current study, it was detached that assimilators were the most common
type of learning style. Divergers were the second common learning style type,
convergers were the third and accommodators were the least common learning style
type in this study. Hence, the number of students in the classroom which have the
same learning style can be showed difference. In this manner, teachers can

103
administer learning style inventory to detach spread of the frequency in learning
style types in classroom settling.
In this study, the mean of mathematics achievement scores of students in SBS
and the mean of teacher assigned mathematics scores of students were low. One of
the reasons of this situation can be originated from the instructional methodologies
implemented in the classroom. Teachers can implement instructional methods which
are taken into account learning styles of students.
In the sample of this study, assimilators were the most common type of the
learning styles. Besides, the mean of mathematics achievement scores in SBS of
students who have assimilator type of learning style were the second best score.
Such a situation can be seen in the classroom as well. In such case, teachers can give
more importance to instructional methods which fits with the learning styles of the
assimilators. Those strategies can be lecturing, problem solving, reading and
investigating on articles, laboratory experiments and simulations.
Divergers were the second common learning style type. However, students
who have diverger learning style type were in the third rank among the other
learning styles when the means of mathematics achievement scores in SBS are
considered. In case of such a situation, teachers can implement the brainstorming,
creative – drama, generating discussion groups, open ended questions, giving
prompt feedback methods for the improvement of mathematics achievements of
assimilators.
Although convergers were the third common learning style type, they had the
highest mean mathematics scores in SBS in this study. Teachers can use generating
104
and solving mathematics puzzles, model buildings, project and performance based
works as instructional models for the sustainability of success of convergers.
Accommodators were the least common learning style type and they had the
lowest mean mathematics achievement scores in SBS. In this case, it is seen that
accommodators need a special interest in classroom environment because the
learning styles of accommodators could not be matched with the instructional
strategies which implemented by teachers in the classroom environment. For the
improvement of students who have accommodator type of learning style, teachers
could be more sensitive to use instructional strategies which are suitable for
accommodators. Manipulative, hands – on activities, group project or individual
performance works, solving real life based mathematics are the methods which are
best fit with the learning ways of accommodators.
The mean of teacher assigned mathematics scores were ranked as convergers,
assimilators, accommodators and divergers. In this case, it can be stated that there
may be a parallelism between the mean mathematics achievement scores in SBS and
teacher assigned mathematics scores.
Abstract conceptualization scores had a low correlation with mathematics
achievement scores in SBS. Besides, there was a low correlation between abstract
conceptualization scores and teacher assigned mathematics scores. Hence, it is seen
that instructional methods used by teachers were emphasized the abstract thinking.
However, the instructional methods implemented by teachers should be addressed to
the other learning modes (concrete experience, reflective observation and active
105
experimentation) of learning circle which are suggested in Experiential Learning
Theory (ELT).
In general, as the results of current study indicated, teachers should remember
that every student has learning preferences which shape their learning styles.
Mathematics teachers should keep in mind that there might be a difference in the
mathematics achievements of students regarding to their learning styles that is why
teachers should organize their instructional methods according to students’ learning
styles. Besides, to address every learning style of students, teacher should organize
the classroom infrastructure by providing posters, manipulative, projection machine
or mathematical puzzles.
In mathematics achievements of the students, the current study found that
female students have higher mathematics achievement scores in SBS and teacher
assigned mathematics scores than male students. Mathematics teachers should know
that there might be a difference in approaching to learning activities because of
gender difference.
As stated previously, mathematics achievement scores of the students in
current study were low. However, it was seen that there was a dramatic difference
in mathematics achievement scores according to regions where students attend the
schools. Mathematics achievement scores of the students in schools located in city
center doubled the mathematics achievement scores of students attend schools
located in suburban and villages.
In this manner, authorized personnel in National Ministry of Education,
teacher educators and teachers should identify the reasons and find solutions for

106
underachievement in mathematics scores in nationwide standardized mathematics
tests and internationally applied examinations. Moreover, authorized personnel in
National Ministry of Education should identify the reasons and find solutions for
underachievement scores in under developed regions of Turkey.
5.5 Recommendations for Further Studies
The problems of this study have suggested new ideas to investigate in further
studies. To give an illustration, topics of current study can be used as a research
problem for other studies to investigate in different grade levels.
For a different perspective, topics of the current can be inspired for other
courses and achievements of students in different courses regarding to learning
styles of students can be studied in the eighth grade or in other level of grades.
This study was concerned the differences in mathematics achievement of
eighth grade students regarding to learning style of students. Since this study was
dealt with the details of big picture but it does not interest with the reasons of topic.
Because of this reason, qualitative studies are needed to find cause of differences in
mathematics achievements of eighth grade students regarding to learning styles.
In addition with previous ideas, more detailed researches can be carried out
for finding relation between learning preferences in regard to gender differences.
Moreover, relation between learning modes of students and course achievement of
students can be researchable. From a broader perspective, the effect of the learning
style based instruction to the mathematics achievements of students can be needed
to be studied.
107
Learning styles cannot be an only reason in explaining the achievements of
students. That is why effect of learning styles can be associated with other
determinants like motivation or attitudes to investigate reasons of achievements in
future studies.

108
REFERENCES
Aktaş, İ. P., & Mirzeoğlu, D. E. (2009). İlköğretim II. Kademe Öğrencilerinin
Öğrenme Stillerinin Okul Başarılarına ve Beden Eğitimi Dersine Yönelik
Tutumlarına Etkisi. Spormetre Beden Eğitimi ve Spor Bilimleri Dergisi, 7
(1), 1 – 8.
Aruilommi, T.O., Nurmi, J.E., & Aunola, K. (2002). The development of
achievement strategies and academic skills during the first year of primary
school. Learning and Instruction, 12, 509–527.
Arslan, B., & Babadoğan, C. (2005). İlköğretim 7. ve 8. Sınıf Öğrencilerinin
Öğrenme Stillerinin Akademik Başarı Düzeyi, Cinsiyet ve Yaş ile İlişkisi.
Eurasian Journal of Educational Research, 21, 35 – 48.
Aşkar, P., & Akkoyunlu, B., (1993). Kolb Öğrenme Stili Envanteri. Eğitim ve Bilim,
87, 37 – 47.
Atkinson, G. (1991). Kolb’s learning style inventory: A practitioner’s perspective.
Measurement & Evaluation in Counseling & Development, 23 (4): 149 –
162.
Atherton, J. S., (1999). Resistance to Learning: a discussion based on participants in
in-service professional training program. Journal of Vocational Education
Training, 51 (1), 77 – 90.
Babadoğan, C. (2000). Öğretim Stili Odaklı Ders Tasarımı Geliştirme. Milli Eğitim
Dergisi, 147, 61 – 63.
Bacanlı, H. (2001). Gelişim ve Öğrenme, (4th Ed.), p. 11 – 22. Ankara: Nobel
Yayıncılık.
Bailey, P., Onwuegbuzie, A.J., & Daley, C.E. (2000). Using Learning Style to
Predict Foreign Language Achievement at College Level. System, 28, 115-
133.
109
Bengiç, G. (July, 2008). İlköğretim 6. ve 7. sınıf öğrencilerinin öğrenme stilleri ile
sosyal bilgiler dersindeki başarıları arasındaki ilişki. Unpublished Master’s
Thesis, Pamukkale University, Denizli, Turkey.
Blanch-Payne, E. (2000). Teaching styles of faculty and learning styles of their
students: Congruent versus incongruent teaching styles with regards to
academic disciplines and gender. Unpublished Ph.D. Dissertation, Kent
State University, Ohio, USA.
Boydak, A. (2001). Öğrenme Stilleri, p. 95. İstanbul: Beyaz Yayınları.
Buchanan, R. (1992). Wicked problems in design thinking. Design Issues, 8 (2), 5-
21.
Burke, K., & Dunn, R. 2002. Learning style-based teaching to raise minority student
test scores. There's no debate!. The Clearing House 76 (2), 103-106.
Butler, K.A, (1987). Learning and Teaching Style: In Theory and Practice, p. 318.
Colombia CT, The Learners Dimensions.
Carthey, J. H. (1993). Relationships between learning styles and academic
achievement and brain hemispheric dominance and academic performance
in business and accounting courses. Unpublished Master’s Thesis, Winona
State University, Minnesota. USA
Cano-Garcia, F., & Hewitt Hughes, E. (2000). Learning and Thinking Styles: an
analysis of their interrelationship and influence on academic achievement.
Educational Psychology, 20 (4): 413 – 431.
Caskey, L.C. (1981). A Study Of Cognitive Style And Selected Attribute Variables
of Community College Students. Unpublished Ph.D. Dissertation, Texas
Tech University, Texas, USA.
CEMCA. Sampling. Retrieved April 20, 2011 from:
http://www.cemca.org/books/chap13.htm
110
Chin, C., & Brown, D. (2000). Learning in Science: A Comparison of Deep and
Surface Approaches. Journal Research in Science Teaching, 37 (2), 109 –
138.
Clark, D. R. (2008). Kolb’s Learning Styles and Experimental Learning Model.
Retrieved January 25, 2010 from:
http://nwlink.com/~donclark/hrd/styles/kolb.html
Claxton, C.S., & Murrell, P.M. (1987). Learning styles: Implications for improving
educational practices. ASHE-ERIC/Higher Education Report No. 4.,
Washington, DC, George Washington University.
Collinson, E. (2000). A Survey of Elementary Students' Learning Style Preferences
and Academic Success. Contemporary Education, 71 (4), 42 - 49.
Cox, P. (2000). Regional and Gender Differences in Mathematics Achievement.
Journal of Research in Rural Education, 16 (1), 22 – 29.
Çaycı, B., & Ünal, E., (2007). Sınıf Öğretmeni Adaylarının Sahip Oldukları
Öğrenme Stillerinin Çeşitli Değikenlere Göre İncelenmesi. Bilim Eğitim ve
Düşünce Dergisi, 7 (3): 22 – 28.
Çelenk, S., & Karakış, Ö., (2007). Farklı Öğrenme Stillerine Sahip Öğrencilerin
Genel Öğrenme Stratejilerini Kullanma Düzeyleri A.İ.B.Ü. Örneği. A.İ.B.Ü.
Eğitim Fakültesi Dergisi, 7 (2), 34 – 52.
Delialioğlu, F. A. (2003). The Roles of Gender And Learnıng Styles On Tenth Grade
Students’ Kinematics Graphing Skills. Unpublished Master’s Thesis, Middle
East Technical University, Ankara, Turkey.
Demirbaş., Ö.O. (2001). The Relation of Learning Styles and Performance Scores of
the Students in Interior Architecture Education. Unpublished Ph.D.
Dissertation, Bilkent University, Ankara, Turkey.
Deniz, R. (2003). Öğrenme Modelleri ve Öğretme Biçimleri, İTÜ Jeodezi ve
Fotogremetri Bölümü Eğitim Geliştirme Komisyonu Yayınları, 1, 1–6

111
Dunn, R., & Dunn, K. (1983). Teaching Secondary Students Through Their
Individual Learning Styles Practical Approaches for Grades 7 – 12. Boston:
Allyn and Bacon.
Dunn, R., & Dunn, K. (1992). Teaching elementary students through their
individual learning styles: Practical approaches for grades 3-6. Boston:
Allyn & Bacon.
Dunn, R., & Dunn, K. (1993). Teaching secondary students through their individual
learning styles: Practical approaches for grades 7-12. Boston: Allyn &
Bacon.
Dunn, R., & Griggs, S. (1995). Multiculturalism and learning styles: Teaching and
counseling adolescents. Westport, CT: Greenwood Publishing.
Dunn, R., Sklar, R., I., Beaudry J.S., & Bruno J., (2001). Effects of Matching and
MisMatching Minority Developmental Collage Students’ Hemispheric
Preferences on Mathematics Scores. Journal of Educational Research, 83
(5), 283 – 288
Dunn. R., Beaudry, J.S., & Klavas, A., (2002). Survey of Research on Learning
Styles. California Journal of Science Education, 2 (2), 75 – 85.
Ehrman, M., & Oxford, R. (1990). Adult language learning styles an strategies in an
intensive training setting. The Modern Language Journal, 74 (3), 311 – 327.
Ekici, G. (2003). Öğrenme Stiline Dayalı Öğretim ve Biyoloji Dersi Öğretimine
Yönelik Ders Planı Örnekleri, (1st Ed.). Ankara: Gazi Yayınları.
Eren, A. (2002). Fen Sosyal ve Eğitim Bilimi Alanlarında Öğretim Gören Üniversite
Öğrencilerinin Öğrenme Biçimleri Arasındaki Farklılığın İncelenmesi.
Unpublished Master’s Thesis, Abant İzzet Baysal Üniversitesi, Bolu,
Turkey.
Ergür, D.O. (1998). Hacettepe Üniversitesi dört yıllık lisans programlarındaki
öğrenci ve öğretim üyelerinin öğrenme stillerinin karşılaştırılması.

112
Unpublished Ph.D. Dissertation, H.Ü. Sosyal Bilimler Enstitüsü, Ankara.
Turkey.
Farkas, R.D. (2003). Effects of Traditional Versus Learning-Styles Instructional
Methods on Middle School Students. Journal of Educational Research, 97
(1), 43 – 81.
Fer, S. (2003). The Learning Activities among Learning Styles of Math, Phycics,
Chemistry. Çağdaş Eğitim Dergisi, 28 (304), 33 – 43.
Felder, R., & Soloman, B.A. (1998). Learning Styles and Strategies. Retrieved June
29, 2009, from: http://www.ncsu.edu/felder-public/ILSdir/styles.html
Fraenkel, J. R., & Wallen, N. E. (2003). How to Design and Evaluate Research in
Education (5th Ed.). New York: The McGraw-Hill Companies.
Gay, L. R. (1987). Educational research: Competencies for analysis and
application (3rd Ed.). New York: Merrill.
Gammon, R.B., Shin M.S., & Groves R.H. Jr. (1995). Clinical risk factors for
pulmonary barotrauma: a multivariate analysis. Am J Respir Crit Care Med,
152, 1235–1240.
Gregorc, A. F. (1982b). Gregorc style delineator: Development, technical and
administration manual. Columbia, CT: Gregorc Associates.
Guild, P. (1994). Making Sense of Learning Styles. School Administrator, 51 (1), 8-
13.
Güneş, C. (September, 2004). Learning Style Preferences of Preparatory School
Students. Unpublished Master’s Thesis, Gazi University, Ankara.
Güven, B. (2008). İlköğretim Öğrencilerinin Öğrenme Stilleri, Tutumları Ve
Akademik Başarıları Arasındaki İlişkinin İncelenmesi. TSA, 12 (1), 36 – 54.

113
Hall, L.A. (1993). Critical Exploration of Learning Style Preferences and the
Mathematical Achievement of Chapter 1 Middle School Students:
Administrative and Instructional Implications. Unpublished Ph.D.
Dissertation, Oklahoma State University, Oklahoma.
Harland, L. K. (2002). Forced-choice personality tests in management development
contexts: An experimental study of test taker reactions. Paper presented at
Midwest Academy of Management Meetings, HR and Careers Division.
Hancock, C.W. (2000). Impact of the 4MAT Lesson Planning System on Number of
Times Off – task in a Fifth, Sixth and Seventh Grade Classroom.
Unpublished Ph.D. Dissertation, Baylor University, Texas.
Henke, H. (2001). Learning theory: applying Kolb’s learning style inventory with
computer based training. Retrieved October 15, 2007, from:
http://www.chartula.com/learningtheory.pdf.
Hickcox, L. K. (1991). An historical review of Kolb’s formulation of experiential
learning theory. Unpublished Ph.D. Dissertation, University of Oregon,
Corvallis.
Hinson, K.E. (2002). Black and White Adolescents’ Aspirations and Achievement in
Mathematics: A Regional Comparison. Unpublished Ph.D. Dissertation,
Virginia Polytechnic Institute and State University, Virginia.
Hinterthuer, R. J. (1995). The Relationship of Developmental College Students
Learning Styles to Computer Assisted and Programmed Instruction,.
Dissertation Abstracts International, 45 (8), 22 – 40.
Hyde, J.S., Fennema, E., & Lamon, J.S. (1990). Gender Differences in Mathematics
Performance: A Meta-Analysis. Psychological Bulletin, 107 (2): 139 – 155.
Işıksal, M., & Çakıroğlu, E. (2008). Gender Differences Regarding Mathematics
Achievement: The Case of Turkish Middle School Students. School Science
and Mathematics, 108 (39), 113 – 120.
John, R. L. (1995). Classroom learning & teaching, White Plains. New York:
Longman Publishers.

114
Kaplan, E. J., & Kies, D. (1994). Strategies to increase critical thinking in the
undergraduate college classroom. College Student Journal, 28, 24-31.
Kaya, F. (2007). İlköğretim Öğrencilerinin Öğrenme Stillerine Dayalı Fen ve
Teknoloji Dersi Öğretim Düzeylerinin İncelenmesi. Unpublished Master’s
Thesis, Osmangazi Üniversitesi, Eskişehir, Turkey.
Kaya, F., Özbacacı, N., & Tezel, Ö. (2009). Investigating Primary School Second
Grade Students’ Learning Styles According to the Kolb Learning Style
Model in terms of Demographic Variables, Türk Fen Eğitimi Dergisi, 6 (1),
11 – 25.
Koçakoğlu, M. (2002). Determining the Learning Styles of Elementary School,
(1st-8th Grade) Teachers. International Online Journal of Educational
Sciences, 2 (1), 54 – 64.
Kolb, D.A. (1973). On management and the learning process. Massachusetts
Institute of Technology Journal of Alfred P. Sloan School of Management,
652 – 673.
Kolb, D.A. (1984). Experiential Learning: experience as the source of learning and
development. New Jersey: Prentice-Hall.
Kolb, D.A. (1985). Learning-style inventory: Self-scoring inventory and
interpretation booklet (2nd ed.). Boston: McBer & Co.
Kolb, D. A. (1999a). Learning Style Inventory, Version 3. Boston: Hay / McBer,
Training Resources Group.
Kolb, D. A. (1999b). Learning Style Inventory-version 3, Technical specifications.
Boston: Hay / McBer, Training Resources Group.
Kolb, D.A. Boyatsiz., R. E., & Mainemelis. C., (1999). Experiential Learning
Theory: Previous Research and New Directions. Department of
Organizational Behavior, Weatherhead School of Management, Case
Western Reserve University, Cleveland, OH.
115
Kolb, A., & Kolb, D. A. (1999). Bibliography of research on experiential learning
theory and the Learning Style Inventory. Department of Organizational
Behavior, Weatherhead School of Management, Case Western Reserve
University, Cleveland, OH.
Kolb, D., & Kolb A.Y. (2005). Learning Styles and Learning Spaces: Enhancing
Experiential Learning in Higher Education Experience-Based Learning
Systems. Academy of Management Learning & Education, 4, (2) 193 – 212.
Kopsovich, R. D. (2001). A Study of Correlations between Learning Styles of
Students and Their Mathematics Scores on the Texas Assessment of
Academic Skills Test. Unpublished Ph.D. Dissertation, University of North
Texas. Texas.
Lynch, T.G., Woelfl, N.N., Steele, D.J., & Hanssen, C.S. (1998). Learning style
influences student examination performance. The American Journal of
Surgery, 176, 62 – 66.
Ma. X. (2005). Gender Differences in Mathematics Achievement: Evidence from
Latest Regional and International Student Assessments. Paper presented at
the 11th International Congress on Mathematical Education, Mexico.
Matthews, D.B., (1996). An investigation of learning styles and perceived academic
achievement for high school students. Clearing House, 69 (4), 249 – 255.
Matthews, D. B. (1991). The effects of learning style on grades of first-year college
students. Research in Higher Education, 32 (3), 253-267.
McCarthy, B. (1990). Using the 4MAT system to bring learning styles to schools.
Educational Leadership, 48 (2), 31-37.
McCarthy, B. (1987). The 4MAT system: Teaching to learning styles with right/left
mode techniques. Barrington: Excel, Inc.

116
Merriam-Webster’s collegiate dictionary, (10th ed.), 1993. Springfield, MA:
Merriam-Webster.
Ministry of National Education [MNE], (2005). OECD PISA – 2003 Araştırmasının
Türkiye ile İlgili Sonuçları, PISA 2003 Projesi Ulusal Nihai Rapor. Ankara,
Tukey: MNE.
Ministry of National Education [MNE], (2005). İlkögretim matematik dersi ögretim
programı 1-5. sınıflar: Ögretim programı ve kılavuzu. Ankara, Turkey:
MNE.
Ministry of National Education [MNE], (2006). İlkögretim matematik dersi öğretim
programı 6-8. sınıflar: Ögretim programı ve kılavuzu. Ankara, Turkey:
MNE.
Ministry of National Education [MNE], (2010). OECD PISA – 2006 Araştırmasının
Türkiye ile İlgili Sonuçları, PISA 2006 Projesi Ulusal Nihai Rapor. Ankara,
Tukey: MNE.
Morris, S., & McCarthy, B. (1990). 4MAT in action II: Sample lesson plans for use
with the 4MAT system. Barrington: Excel Inc.
Mutlu M., & Aydoğdu M. (2003). Fen Bilgisi Eğitiminde Yaşantısal Öğrenme
Yaklaşımı. Pamukkale Üniversitesi Eğitim Fakültesi Dergisi, 13: 1 – 28.
Mutlu. M, & Aydoğdu, M., (2003). Fen Bilgisi Eğitiminde Kolb’un Yaşantısal
Öğrenme Yaklaşımı. Pamukkale Üniversitesi Eğitim Fakültesi Dergisi, 1, 13
–15.
Mutlu, M. (2006). The Relation between the Learning Styles of the Students in
Anatolian High Schools, Anatolian Teachers’ High Schools Science High
Schools and Their Attitudes towards Biology Course. International Journal
Of Environmental and Science Education, 1 (2), 148 – 162.
Ok, G.E. (2009). İlköğretim Öğrencilerinin Öğrenme Biçimlerinin Sınıf Düzeyi,
Cinsiyet ve Akademik Başarı ile İlişkisi. Unpublished Master’s Thesis,
Uludağ Üniversitesi, Bursa, Turkey.

117
O’Keefe, D. J. (1982). The concepts of argument and arguing: Advances in
argumentation theory and research. Carbondale: Southern Illinois
University Press.
O’Keefe, D. J., & Shepherd, G. J. (1982). Interpersonal construct differentiation,
attitudinal confidence, and the attitude-behavior relationship. Central States
Speech Journal, 33, 416-423.
Ong, W. (1981). Fighting for life. Ithaca: Cornell University Press.
Orhun, N., (2007). An investigation into the mathematics achievement and attitude
towards mathematics with respect to learning style according to gender.
International Journal of Mathematical Education in Science and
Technology, 38 (3), 321 — 333
Owens, M. E., (1999). The Relationship of Cognitive Learning Styles: Mathematics
Attitude and Achievement in a Problem Posing Classroom. Unpublished
Ph.D. Thesis. University of Tennessee. U.S.A.
Özkan, Ş. (July, 2003). The Roles of Motivational Beliefs and Learning Styles on
Tenth Grade Students’ Biology Achievements. Unpublished Master’s Thesis.
Middle East Technical University, Ankara, Turkey.
Pallant, J. (2005). SPSS Survival Manual A Step By Step Guide To Data Analysis
Using SPSS for Windows (12th
Ed.). Sydney: Allen & Unwin Press,
Australia.
Peker, M., (2003). Öğrenme Stilleri ve 4 MAT Yönteminin Öğrencilerin Matematik
Tutum ve Başarılarına Etkisi. Unpublished Ph.D. Dissertation, Gazi
Üniversitesi, Ankara, Turkey.
Peker, M. & Yalın, H.İ, (2002). Matematik Öğretmenlerinin Öğrencilerin Öğrenme
Stillerine Uygun Öğretim Yapan Düzeyleriyle İlgili Öğrenci Görüşleri.
Paper presented at the V. Ulusal Fen Bilimleri ve Matematik Eğitimi
Kongresine Sunulmuş Bildiri. Ankara.
118
Peker, M., & Aydın, B., (2003). Anadolu ve Fen Liselerindeki Öğrencilerin
Öğrenme Stilleri. Pamukkale Üniversitesi Eğitim Fakültesi Dergisi, 2, 14 –
24.
Peker, M., Mirasyedioğlu, Ş., & Yalın, H.İ. (2005). Öğrenme Stillerine Dayalı
Matematik Öğretimi. Pamukkale Üniversitesi Eğitim Fakültesi Dergisi, 1, 13
– 20.
Peker, M., & Mirasyedioğlu Ş. (2007). Pre-Service Elementary School Teachers’
Learning Styles and Attitudes towards Mathematics. Eurasia Journal of
Mathematics, Science & Technology Education, 4 (1), 21-26.
Purkiss, W. (1994). Learning Styles and the Changing Face of Community Collage
Retrieved in The Importance Of Learning Styles Understanding Implications
For Learning, Course Design And Education, 5, 79 – 99.
Raiszadeh, A.D. (1997). Relationship between personality type, learning style
preference, and mathematics achievement in college developmental
mathematics. Unpublished Ph.D. Dissertation, University of Tennessee,
Tennessee, USA.
Reed, P.A. (2000). The Relationship between Learning Style and Conventional or
Modular Laboratory Preference among Technology Education Teachers in
Virginia. Unpublished Ph.D. Dissertation, Virginia Polytechnic Institute and
State University, Virginia. USA.
Schroeder, C.C., (1993). New Students – New Learning Styles. Change, 25 (5), 21 –
31
Sever, E., (2008). Öğrenme Stilleri: İlköğretim 6–8. sınıf Öğrencilerine Yönelik Bir
Ölçek Geliştirme Çalışması, Unpublished Ms Thesis, Adnan Menderes
Üniversitesi, Aydın, Turkey.
Severiens, S.E., & Geert, T.M., (1994). Gender differences in Learning Styles: A
Narrative Review and Quantitative Meta Analysis. Higher Education, 27,
487 – 501.

119
Severiens, S.E., Dam, T. G., & Wolters, B., V., H., (1994). Stability of processing
and regulation strategies: Two longitudinal studies on student learning
Higher Education, 42 (4), 437-453.
Shaughnessy, M. F. (1998). An interview with Rita Dunn about learning styles. The
Clearing House, 71 (3), 41-45.
Schwartz, W. & Hanson, K., (1992). Equal Mathematics Education for Female
Students. ERIC/CUE Digest, No. 78.
Silver, H., Strong, R., & Perini, M. (1997). Integrating learning styles and multiple
intelligences. Educational Leadership, 55 (1), 22-27.
Soylu, M. Y., Akkoyunlu, B. (2002). The Effect of Learning Styles on Achievement
in Different Learning Environments. The Turkish Online Journal of
Educational Technology, 43, 1 – 10.
Stewart, K., & Felicetti, L. (1992). Learning styles of marketing majors.
Educational Research Quarterly, 15, 15-23.
Stockdale, S. E. (1995). Gender Differences in High School Mathematics
Achievement: An Empirical Application of the Propensity Score Adjustment.
Unpublished Master Thesis, University of California Los Angles, Los
Angles, USA.
Şirin, A., & Güzel, A., (2006). The Relationship Between Learning Styles And
Problem Solving Skills Among College Students. Educational Sciences,
Theory and Practice, 6 (1), 255 – 264.
Tabanlıoğlu, S. (2003). The Relationship between Learning Styles and Language
Learning Strategies of Pre-Intermediate Eap Students. Unpublished
Master’s Thesis. Middle East Technical University, Ankara, Turkey.
Tatar, E. (2006). İkili işlem Kavramı ile İlgili Öğrenme Güçlüklerinin Belirlenmesi
ve 4mat Yönteminin Başarıya Etkisi. Unpublished Ph.D. Dissertation,
Atatürk Üniveristesi, Erzurum, Turkey.
120
Teixeira, K. (2001). An experimental study comparing critical thinking growth and
learning styles in a traditional and workshop based introductory
mathematics course. Unpublished Ph.D. Dissertation, New York University,
New York, USA.
Treacy, A.L., (1996). Learning Styles, Feelings and Beliefs about Tecnology and
Mathematics Achievement. Unpublished PhD Dissertation, The Claremont
Graduate University, Claremont, USA.
Umay, A., (1996). Matematik Eğitimi ve Ölçülmesi. Hacettepe Üniversitesi Eğitim
Fakültesi Dergisi, 12, 145 – 149.
Ülgen, G. (1994). Eğitim Psikolojisi. Ankara: Lazer Ofset Matbaa Tesisleri.
Vollmeyer, R., & Rheinberg, F. (2000). Does motivation affect performance via
persistence? Learning and Instruction, 10, 293-309.
Witkin, H.A., Moore, C.A., Goodenough, D.R., & Cox, P.W. (1977). Field-
dependent and field-independent cognitive styles and their educational
implications. Review of Educational Research, 47, 1-64.
Woodard, H.S. (2001). Description and comparison of the methods of cluster
sampling and lot quality assurance sampling to assess immunization
coverage. Paper Presented at the World Health Organization Conference,
Geneva.
Yenilmez, K., & Çakır, A. (2005). İlköğretim İkinci Kademe Öğrencilerinin
Matematik Öğrenme Stilleri. Kuram ve Uygulamada Eğitim Yönetimi, 44,
569 – 585.
Yazıcı, E., & Sulak H., (2008). Öğrenme Stilleri ile İlköğretim Beşinci Sınıf
Matematik Dersindeki Başarı Arasındaki İlişkisi. Selçuk Üniversitesi Ahmet
Keleşoğlu Eğitim Fakültesi Dergisi, 25, 217 – 236.
Zenhausern, R. (1978). Imagery, cerebral dominance, and style of thinking: A
unified field model. Bulletin of the Psychonomic Society, 12, 381 – 384.

121
Zenhausern, R., & Nickel L. (1979). Hemispheric dominance and maze learning.
Bulletin of the Psychonomic Society, 14, 435 – 436.
Zenhausern, R., & Repetti, J. (1979). A comparison of two measures of cerebral
dominance. Paper presented at the Eastern Psychological Convention,
Philadelphia, PA.
Zull, J. E., (2002). The art of changing the brain: Enriching teaching by exploring
the biology of learning. Sterling, VA: Stylus.

122
APPENDIX A
LEARNING STYLE INVENTORY (LSI)
Ankete Katılanın:
Adı Soyadı: Cinsiyetiniz:
Doğum Yılınız: Son Dönem Matematik Notu:
ÖĞRENME BİÇİMLERİ ANKETİ
Öğrenme Biçimleri Anketi, öğrenme yolunuzu, problem çözme sırasında izlediğiniz
teknikleri, öğrenme sürecinde düşüncelerle nasıl baş ettiğinizi ya da değişen
matematik müferadatı ile birlikte yeni matematik konularını nasıl
anlamlandırdığınızı anlamaya yönelik bir ankettir.
Anketi nasıl dolduracaksınız?
Bir sonraki sayfada size her birinde 4’er cümle bulunan 12 tane durum verilecektir
ve her birinin başında notlandırmanız için boşluk bırakılmıştır. Bu cümleleri,
herhangi bir konu öğrenirken yaşadığınız öğrenme sürecinde size en uygun olandan
olmayana doğru sıralayınız. Bu anketi doldururken, son günlerde okulda öğrenmek
zorunda kaldığınız yeni bir konu sırasında yaşadıklarınızı hatırlamaya çalışınız. Her
durum için size EN uygun olan cümleyi 4, ikinci en uygun olan için 3, üçüncü EN
uygun olan için 2 ve size EN az uygun olan cümle için 1 notunu veriniz. Aşağıda
daha iyi anlayabilmeniz için örnek bir durum verilmiştir. Ankete katıldığınız için
teşekkür ederim. Ankete katılım gönüllü olarak yapılmaktadır. İstemediğiniz
takdirde anketi yarım bırakabilirsiniz. Bu durum size herhangi bir şekilde olumsuz
dönüt getirmeyecektir. Ankette vermiş olduğunuz tüm bilgiler araştırmacı tarafından
KESİNLİKLE gizli tutulacaktır.
Örnek Durum: Hatırlamanız için:
Öğrenirken : ___4___ mutluyum 4 – En uygun olan.
___1___ hızlıyım. 3 – ikinci uygun
olan.
___2__ mantıklıyım. 2 – üçüncü uygun
olan.
___3__ dikkatliyim. 1 – en az uygun
olan.
Araştırmacı: S. Serkan KURBAL, MEB Yalıntaş İ.Ö.O.
İletişim: [email protected] Telefon: 0 505 394 34 86
Araştırmaya katılmayı kabul ediyorum: …………………………………… (imza)
Araştırmaya katılmayı kabul etmiyorum:

123
1.Öğrenirken
___ duygularımı göz önüne almaktan
hoşlanırım.
___ izlemekten ve dinlemekten hoşlanırım.
___ fikirler üzerinde düşünmekten
hoşlanırım.
___ bir şeyler yapmaktan hoşlanırım.
7. En iyi
____ kişisel ilişkilerden öğrenirim.
____ gözlemlerden öğrenirim.
____ akılcı fikirlerden.
____ uygulama ve denemelerden öğrenirim.
2. En iyi
____duygularıma ve önsezilerime
güvendiğimde öğrenirim.
____ dikkatlice dinlediğimde ve izlediğimde
öğrenirim.
____ mantıksal düşünmeyi temel aldığımda
öğrenirim.
____ bir şeyler elde etmek için çalıştığımda
öğrenirim.
8. Öğrenirken
____ kişisel olarak o işin parçası olurum.
____ işleri yapmak için acele ederim.
____ teori ve fikirlerden hoşlanırım.
____ çalışmamdaki sonuçları görmekten
hoşlanırım.
3. Öğrenirken
____ güçlü duygulara sahibimdir ve güçlü
tepkiler veririm.
____ sessiz ve çekingen olurum.
____ sonuçları bulmaya yönelirim.
____ yapılanlardan sorumlu olurum.
9. En iyi
____ duygularıma dayandığım zaman
öğrenirim.
____ gözlemlerime dayandığım zaman
öğrenirim.
____ fikirlerime dayandığım zaman
öğrenirim.
____ öğrendiklerimi uyguladığım zaman
öğrenirim.
4.Öğrenirken
____ duygularımla öğrenirim.
____ izleyerek öğrenirim.
____ düşünerek öğrenirim.
____ yaparak öğrenirim.
10. Öğrenirken
____ kabul eden biriyim.
____ çekingen biriyim.
____ akılcı biriyim.
____ sorumlu biriyim.
5. Öğrenirken
____ yeni deneyimlere açık olurum.
____ konunun her yönüne bakarım.
____ analiz yapmaktan ve konuyu parçalara
ayırmaktan hoşlanırım.
____ denemekten hoşlanırım.
11. Öğrenirken
____ katılırım.
____ gözlemekten hoşlanırım.
____ değerlendiririm.
____ aktif olmaktan hoşlanırım.
6. Öğrenirken
____ sezgisel biriyim.
____ gözleyen biriyim
____ mantıklı biriyim.
____ hareketli biriyim.
12. En iyi
____ akılcı ve açık fikirli olduğum zaman
öğrenirim.
____ dikkatli olduğum zaman öğrenirim.
____ fikirlerimi analiz ettiğim zaman
öğrenirim.
____ pratik olduğum zaman öğrenirim.

124

125