S-SENCE Signal processing for chemical sensors Martin Holmberg S-SENCE Applied Physics, Department...
27
S-SENCE Signal processing for chemical sensors Martin Holmberg S-SENCE Applied Physics, Department of Physics and Measurement Technology (IFM) Linköping University
-
Upload
mercy-owen -
Category
Documents
-
view
221 -
download
2
Transcript of S-SENCE Signal processing for chemical sensors Martin Holmberg S-SENCE Applied Physics, Department...

S-SENCE
Signal processing for chemical sensors
Martin Holmberg
S-SENCE
Applied Physics, Department of Physics and Measurement Technology (IFM)
Linköping University
S-SENCE
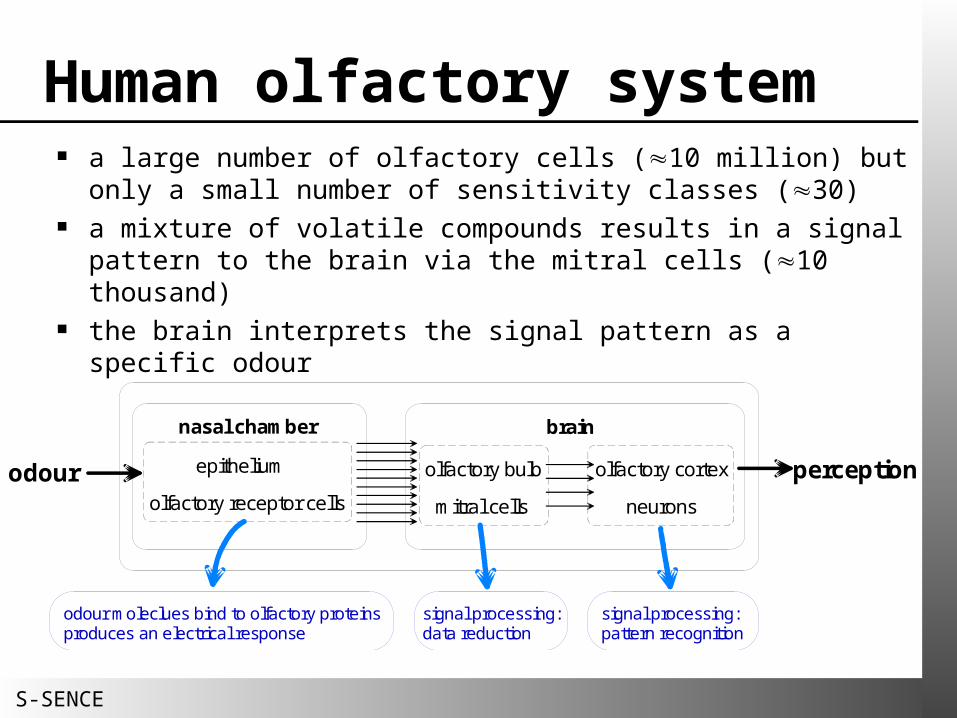
Human olfactory system a large number of olfactory cells (10 million) but only a small number of
sensitivity classes (30) a mixture of volatile compounds results in a signal pattern to the brain via the
mitral cells (10 thousand) the brain interprets the signal pattern as a specific odour
odour
nasal chamber
olfactory receptor cells
epithelium
mitral cells
olfactory bulb
brain
perception
odour moleclues bind to olfactory proteinsproduces an electrical response
neurons
olfactory cortex
signal processing:data reduction
signal processing:pattern recognition

S-SENCE
Electronic nose concept sensitivity to many compounds using a limited number of chemical
sensors with different and partly overlapping selectivity profiles analyse the sensor signal pattern rather than the individual signals gives a description of the total measurement state, i.e. the sum of all
components, which can be more important than a detailed knowledge of each of the individual components
odour
sensor chamber(s)
chemical sensorspre-processing
computer
informationpatternrecognition

S-SENCE
adsorption/desorption or chemical reactions
on surfaces or in (thin) films
causePHYSICAL CHANGES
massconductivity
polarisation
temperature optical properties
which depend onMOLECULAR PROPERTIES
sizereactivity
affinity
polarity polarisability
which can be used in several types ofDEVICES
calorimetricfibre optic
acoustic
resistive field effect
Solid-state gas sensor principles

S-SENCE
Electronic nose gas flow diagram
Air
Sample
ValveField-effect sensors
Metal oxide sensorsFigaro
Metal oxide sensorsFiS
IR CO2 sensor
Massflow controller
Drain
Pump

S-SENCE
Signal processing: feature extraction
0 100 200 300 4000
100
200
300
400
500
baseline
off integralon integral
on derivative
off derivative
response
offsample on
MOSFET 3 MOSFET 7 Figaro 3
sens
or s
igna
l
time [s]

S-SENCE
Background; The Tongue
Based on voltammetry Currents are measured as a
function of applied potential on electrode surfaces
The currents are caused by: Redox reactions at the surface Ionic movement in the sample

S-SENCE
0 1 2 3 4 5 6
x 104
-0.2
-0.1
0
0.1
0.2
0.3
Cu
rre
nt
[mA
]
Time [ms]
0 1 2 3 4 5 6
x 104
-1
-0.5
0
0.5
1
Po
ten
tial [
V]
Au Ir Rh Pt
The currents are sampled once every [ms] 56.000 variables
Background; Voltammetry

S-SENCE
Information overflow An electronic nose or tongue generates large data series
(one measurement can consist of up to 56.000 variabler Linköping’s telephone book)
Impossible to get a good grip of these numbers We need to decrease the information content A lot of redundant information means that compression
is possible

S-SENCE
Other possible problems Noise Drift Low sensitivity Sampling problems Measurements system …

S-SENCE
What is drift?
Definition:
“a gradual change in any quantitative characteristic that is supposed to remain constant”
(Webster’s Seventh New Collegiate Dictionary)
For chemical sensors:Measurements made under identical chemical conditions give different sensor responses at different times.

S-SENCE
Causes of drift
Reactions on the sensor surface (poisoning) changes in the physical properties of the
sensing material (e.g. the size of the metal islands on a MOSFET)
adsorption of species on the sensor surface layer formation of reaction products
Variations in the gas (composition, pressure, temperature,…) Remaining gas in the measurement system

S-SENCE
Example of drift
Measurements made during 60 days on nine different mixtures of four gases
Gradual change + jumps Drift + noise Drift in different directions
for the different sensors
Below are shown the responses of three sensors as a function of time
0 10 20 30 40 50 60 70
150
200
250
300
350
400
450
500
resp
onse
(mV)
time (days)

S-SENCE
Comparison noise and drift
Drift low frequency caused by changes in
the measurement system similar for similar
sensors
Noise high frequency caused by randomness
in the measurements individual for each
sensor

S-SENCE
What do we do? Pre-processing to compensate for some of the
problems mentioned previously Pattern recognition models to give the desired
information If possible, give feedback regarding the
measurements
odour
sensor chamber(s)
chemical sensorspre-processing
computer
informationpatternrecognition

S-SENCE
Geometrical interpretation
?56.000 variables1,2,3-variables
Easy to visualise Abstract
Reduce the number of dimensionsOften made by choosing directions with a lot of variation

S-SENCE
Principal Component Analysis
Can be used for data compression, feature extraction, or visualisation

S-SENCE
Examples of pre-processing
1st example uses PCA to find a direction where irrelevant information is dominant. This direction is then removed from the data set.
2nd example shows how wavelets are used to compress data, and how the choice of wavelets depends on the application.

S-SENCE
Component correction
Uses a reference gas Calculates the direction of drift by PCA for the reference
gas Removes this direction(s) from all other measurements
Example: Artursson et al. J. of Chemometr. 14, 5/6 (2000) 711-724

S-SENCE
Component correction
1st (or several) component in a PCA analysis of the reference gas will describe the drift direction, p
Project the samples, X, on the first loading, p from the PCA on the reference gas,
t=Xp Subtract the bilinear expression, tpT, from X
Xcorrected=X- tpT

S-SENCE
Component correction
Also used for quantification
before
-500 -400 -300 -200 -100 0 100 200 300 400 500-500
-400
-300
-200
-100
0
100
200
300
400
PC
2 (2
4%)
PC 1 (63%)
component correction
-500 -400 -300 -200 -100 0 100 200 300 400 500
-300
-200
-100
0
100
200
300
PC
2 (2
4%)
PC 1 (71%)

S-SENCE
Wavelets
Data is described using wavelet base functions with different scales
The number of wavelets = the number of original variables
A 2 D 2
L P F H P F
D 1A 1
L P F H P F
A 2 D 2
w a v e l e t c o e f f i c i e n t s
S c a l e 1
S c a l e 2
D 1. . . . . . . A 2 D 2
L P FL P F H P F
D 1A 1 D 1A 1
L P F H P FL P FL P F H P FH P F
A 2 D 2A 2 D 2
w a v e l e t c o e f f i c i e n t s
S c a l e 1
S c a l e 2
D 1. . . . . . .

S-SENCE
Wavelet selection By selecting only the most relevant wavelets, a data
reduction is obtained Different criteria for selection in different applications
(e.g. variance or discrimination) Here approximately 100 wavelets are chosen from the
original ca. 1800-14000 variables
0 100 200 300 400 500
0.00E+000
1.00E-011
2.00E-011
3.00E-011
4.00E-011
5.00E-011
vari
an
s
variables
0 2000 4000 6000 8000 10000 12000 14000
0
2
4
6
8
10
12
Dis
crim
ina
tion
Variables

S-SENCE
Reconstruction
The original signal can be reconstructed from the compressed data
Different results from different wavelet selection criteria
Variance selected Discrimination selected
0 200 400 600 800 1000 1200 1400 1600 1800 2000-0.000004
-0.000002
0.000000
0.000002
0.000004
0.000006
0.000008
0.000010
0.000012
0.000014
0.000016
0.000018
resp
on
se
variables
0 2000 4000 6000 8000 10000 12000
-0.00002
-0.00001
0.00000
0.00001
0.00002
0.00003
0.00004
0.00005
0.00006
0.00007
0.00008
0.00009
0.00010
0.00011
0.00012
RhodiumPlatina
resp
on
se
variables

S-SENCE
Pattern recognition After reducing initial obstacles with different pre-
processing techniques, a model that gives the user something he/she can understand must be made
odour
sensor chamber(s)
chemical sensorspre-processing
computer
informationpatternrecognition

S-SENCE
Data models Classification or quantification? Statistical tools for class membership
5 10 15 20 25 30-10
-8
-6
-4
-2
0
2
4
6
1
2
3
4
5
1
2
3
4
5
1
2
3
4
5
1
2
3
4
5
1
2
3
4
5
1
2
3
4
5
1
2
3
4
5
1
2
3
4
5
1
2
3
4
5
1
2
3
4
5
1
2
3
4
5
1
2
3
4
5
1
2
3
4
5
1
2
3
4
5
1
2
3
4
5
1
2
3
4
5
Scores vs. scores
Scores for PC# 1 95.6 %
Sco
res
for
PC
# 2
4.1
%

S-SENCE
Data models Quantification of gases or liquids:
Regression models (e.g. PLS) for linear relationships
Artificial neural networks (ANN) for non-linear black-box modeling
Important always to validate data, especially when many parameters are used in the models!!!