S. Massoud Amin - California Institute of Technologyusers.cms.caltech.edu/~utopcu/ACC11-talks/IEEE...
62
Copyright © 2011 No part of this presentation may be reproduced in any form without prior authorization. S. Massoud Amin, D.Sc. Director, Technological Leadership Institute Honeywell/H.W. Sweatt Chair in Technological Leadership Professor, Electrical & Computer Engineering University Distinguished Teaching Professor Enabling Sustainable, Smarter, and more Secure Energy Infrastructures … from global emissions planning and transportation to efficient devices: Controls and Dynamical Systems Challenges & Opportunities Material from the Electric Power Research Institute (EPRI), and support from EPRI, NSF, SNL and ORNL for my graduate students’ doctoral research is gratefully acknowledged Controls for Societal Challenges: Energy IEEE ACC 2011, San Francisco Session ThB18, Thursday, June 30, 2011, 13:10‐15:10, Golden Gate 8
Transcript of S. Massoud Amin - California Institute of Technologyusers.cms.caltech.edu/~utopcu/ACC11-talks/IEEE...

Copyright © 2011 No part of this presentation may be reproduced in any form without prior authorization.
S. Massoud Amin, D.Sc.Director, Technological Leadership Institute
Honeywell/H.W. Sweatt Chair in Technological LeadershipProfessor, Electrical & Computer Engineering University Distinguished Teaching Professor
Enabling Sustainable, Smarter, and more Secure Energy Infrastructures … from global emissions planning and transportation to efficient devices:
Controls and Dynamical Systems Challenges & Opportunities
Material from the Electric Power Research Institute (EPRI), and support from EPRI, NSF, SNL and ORNL for my graduate students’ doctoral research is gratefully acknowledged
Controls for Societal Challenges: Energy IEEE ACC 2011, San FranciscoSession ThB18, Thursday, June 30, 2011, 13:10‐15:10, Golden Gate 8

© 2011 No part of this presentation may be reproduced in any form without prior authorization.
Context and the Global Macro‐Environment:Cities with 10 million people
By 2020, more than 30 mega cities* in the now less‐developed world. By 2050, nearly 60 such cities.
Note: * Mega city 10 million population or greater
• World's electricity supply will need to triple by 2050 to keep up with demand, necessitating nearly 10,000 GW of new generating capacity.

© 2011 No part of this presentation may be reproduced in any form without prior authorization.
MacroMacroEnvironmentEnvironment

© 2011 No part of this presentation may be reproduced in any form without prior authorization.
Macroeconomic Rationale
1. Endogenous growth models ‐ theoretical support for domestic technology creation
2. Y = f(R, K, H), where:
Y = GDPR = R&DK = physical capitalH = human capital
3. GDP growth: a) Velocity and proportion of R, K, H, and b) available and affordable energy: determinants of success

© 2011 No part of this presentation may be reproduced in any form without prior authorization.

© 2011 No part of this presentation may be reproduced in any form without prior authorization.
Energy Demand Source: http://earthtrends.wri.org/updates/node/274
China’s Energy Growth
57%25%
10% 5% 3% Coal
Hydel
Gas
Renew able
Nuclear
India’s installed Capacity122 GW; 5th largest generation capacity in worldT & D network of 5.7 million circuit km – 3rd largest in the world
Low per capita consumption at 606 units -- less than half of China

© 2011 No part of this presentation may be reproduced in any form without prior authorization.
Annual GNP/capita
Annual kWh/capita
International CollaborationGlobal R&D, global investment,
global peace, global technologies
International CollaborationGlobal R&D, global investment,
global peace, global technologies
AmenitiesEducation, recreation, the environment,
intergenerational investment
AmenitiesEducation, recreation, the environment,
intergenerational investment
Basic Quality of LifeLiteracy, life expectancy, sanitation, infantmortality, physical security, social security
Basic Quality of LifeLiteracy, life expectancy, sanitation, infantmortality, physical security, social security
SurvivalFood, water, shelter, minimal
health services
SurvivalFood, water, shelter, minimal
health servicesSource: Chauncey Starr
105 104
104 103
103 102
Social Conditions and Access to ElectricitySocial Conditions and Access to Electricity

© 2011 No part of this presentation may be reproduced in any form without prior authorization.
The Energy Crises Taught Us Interdependency
EconomicEconomicSecuritySecurity
EnvironmentalEnvironmentalSecuritySecurity
EnergyEnergySecuritySecurity
NationalNationalSecuritySecurity

© 2011 No part of this presentation may be reproduced in any form without prior authorization.
The world faces enormous problems– here is one person’s list of the top 10
1. ENERGY (carbon‐free)2. WATER3. FOOD4. ENVIRONMENT 5. POVERTY6. TERRORISM & WAR7. DISEASE8. EDUCATION9. DEMOCRACY10. POPULATION
2003 6.5 Billion People
2050 8-10 Billion People
Rick Smalley, Rice U.Rick Smalley, Rice U.
(1943(1943--2005)2005)
Nobel Prize 1996Nobel Prize 1996
““CIVIC SCIENTISTCIVIC SCIENTIST””
What Lies Ahead?What Lies Ahead?

© 2011 No part of this presentation may be reproduced in any form without prior authorization.

© 2011 No part of this presentation may be reproduced in any form without prior authorization.

© 2011 No part of this presentation may be reproduced in any form without prior authorization.
Context: Global Emissions

© 2011 No part of this presentation may be reproduced in any form without prior authorization.
S&T for Sustainable DevelopmentSource: RFF

© 2011 No part of this presentation may be reproduced in any form without prior authorization.
0%
10%
20%
30%
40%
50%
60%
70%
80%
90%
100%
1850 1880 1910 1940 1970 2000
RenewablesNuclearGasOilHydroCoalWood
Context: US Energy Supply Since 1850
Author: Koonin Source: EIA

© 2011 No part of this presentation may be reproduced in any form without prior authorization.
Context: Transforming Society
The vast networks of electrification are the greatest engineering achievement of the 20th century
– U.S. National Academy of Engineering

© 2011 No part of this presentation may be reproduced in any form without prior authorization.
End-to-End Energy Inefficiency

© 2011 No part of this presentation may be reproduced in any form without prior authorization.
Holistic Modeling: The world as a $54 trillion system of systems (Korsten & Seider 2010)

© 2011 No part of this presentation may be reproduced in any form without prior authorization.
Economists estimate, that all systems carry inefficiencies of up to $15 Tn, of which $4 Tn could be eliminated
System inefficiency as % of total economic value
Improvem
ent p
oten
tial as
% of system inefficiency
Education1,360
Building & Transport Infrastructure
12,540
Healthcare4,270
Government & Safety5,210
Electricity2,940
Financial4,580
Food & Water4,890
Transportation (Goods & Passenger)
6,950
Leisure / Recreation / Clothing7,800
Communication3,960
Global economic value of
$4 Trillion7% of WW 2008 GDP
Improvement potential
$15 Trillion28% of WW 2008 GDP
Inefficiencies
$54 Trillion100% of WW 2008 GDP
System‐of‐systems
Analysis of inefficiencies in the planet‘s system‐of‐systems
How to read the chart:For example, the Healthcare system‘s value is $4,270B. It carries an estimated inefficiency of 42%. From that level of 42% inefficiency, economists estimate that ~34% can be eliminated (= 34% x 42%).
Note: Size of the bubble indicate absolute value of the system in USD Billions
42%
34%
Holistic Modeling: Korsten & Seider 2010This chart shows ‘systems‘ (not ‘industries‘)Source: IBM economists survey 2009; n= 480
15%
20%
25%
30%
35%
40%
15% 20% 25% 30% 35% 40% 45%

© 2011 No part of this presentation may be reproduced in any form without prior authorization.
Quality of Life Systems:Quality of Life = f(Quality of Service from systems + Quality of Opportunities in systems)
• Systems for life‐support needs– 1. Transportation & supply chain– 2. Water & waste recycling– 3. Food & products manufacturing– 4. Energy & electricity grid– 5. Information and Communication Technologies (ICT)/Cloud
• Systems for life‐style planning– 6. Buildings & construction (Smarter Buildings)– 7. Retail & hospitality/Media & entertainment– 8. Banking & finance (wealthy)– 9. Healthcare & family (healthy)– 10. Education & professions (wise)
• Systems for life‐safety governance– 11. Cities & security improvements– 12. States/regions & development improvements– 13. Nations/NGOs & rules/incentives/policies/laws improvements
Source: IBM Institute for Business Value: The World’s $4 Trillion ChallengeUsing a system-of-systems approach to build a Smarter Planet
http://www.ibm.com/services/us/gbs/bus/html/ibv-smarter-planet-system-of-systems.html

© 2011 No part of this presentation may be reproduced in any form without prior authorization.
Global Transition Global Transition DynamicsDynamics

© 2011 No part of this presentation may be reproduced in any form without prior authorization.
Globally Interlocked Dynamics: Understanding the Full Impacts of Decision Pathways
•To unfold the full potential of social progress requires an integrated understanding of the many dimensions of social development, their underpinnings, and the role of science and technology.•Goal: To target our constrained development resources to maximize benefit and minimize unintended consequences

© 2011 No part of this presentation may be reproduced in any form without prior authorization.
Decision Real Life Picture

© 2011 No part of this presentation may be reproduced in any form without prior authorization.
Technologies are diverse value creation mechanisms
Source: IBM, please also see Paul Romer’s Charter Cities Video: http://www.ted.com/talks/paul_romer.html

© 2011 No part of this presentation may be reproduced in any form without prior authorization.
• Smarter transportationStockholm, Dublin, Singapore and Brisbane are working with IBM to develop smart systems ranging from predictive tools to smart cards to congestion charging in order to reduce traffic and pollution.
• Smarter policing and emergency responseNew York, Syracuse, Santa Barbara and St. Louis are using data analytics, wireless and video surveillance capabilities to strengthen crime fighting and the coordination of emergency response units.
• Smarter power and water managementLocal government agencies, farmers and ranchers in the Paraguay‐Paraná River basin to understand the factors that can help to safeguard the quality and availability of the water system. Malta is building a smart grid that links the power and water systems, and will detect leakages, allow for variable pricing and provide more control to consumers. Ultimately, it will enable this island country to replace fossil fuels with sustainable energy sources.
• Smarter governanceAlbuquerque is using a business intelligence solution to automate data sharing among its 7,000 employees in more than 20 departments, so every employee gets a single version of the truth. It has realized cost savings of almost 2,000%.
Source: IBM and Economist
Smarter about education, safety, energy, water, food, transp., e‐gov, … Innovative Cities:

© 2011 No part of this presentation may be reproduced in any form without prior authorization.
“Trilemma” of Interlocking Sustainability Issues: Economic Aspirations of Rapidly Expanding Populations, Environmental Quality, and Natural
Resource Consumption… Population, Poverty and Pollution
Trilemma of SustainabilityPopulation, Poverty and Pollution:
Science and technology hold the key to managing this trilemma ‐‐ allowing
prosperity to grow most efficiently, while reducing humankind’s environmental footprint and resource demands.
Source: RFF

© 2011 No part of this presentation may be reproduced in any form without prior authorization.
EndEnd‐‐toto‐‐endendSystem IntegrationSystem Integration

© 2011 No part of this presentation may be reproduced in any form without prior authorization.
Enabling the FutureInfrastructure integration of microgrids, diverse generation and
storage resources into a secure system of a smart self-healing grid
Source: Interview with Massoud Amin, “Upgrading the grid,” Nature, vol. 454, pp. 570–573, 30 July 2008

© 2011 No part of this presentation may be reproduced in any form without prior authorization.
FunctionalityCommon themes:
EfficiencyDemand responseConsumer savingsReduced emissions
TechnologyTwo-way communicationAdvanced sensorsDistributed computing
ReliabilityInterconnectivityRenewable integrationDistributed generation
IEEE: “The term ‘Smart Grid’ represents a vision for a digital upgrade of distribution and transmission grids both to optimize current operations and to open up new markets for alternative energy production.”
Wikipedia: “A Smart Grid delivers electricity from suppliers to consumers using digital technology to save energy, reduce cost, and increase reliability.”
FERC: “Grid advancements will apply digital technologies to the grid and enable real‐time coordination of information from both generating plants and demand‐side resources.”
DOE: “A smarter grid applies technologies, tools, and techniques available now to bring knowledge to power –knowledge capable of making the grid work far more efficiently…”
GE: “The Smart Grid is in essence the marriage of information technology and process‐automation technology with our existing electrical networks.”
Smart Grid Definitions

© 2011 No part of this presentation may be reproduced in any form without prior authorization.
Highly Instrumented with Advanced Sensors and
Computing
Interconnected by a Communication Fabric that
Reaches Every Device
• Engaging Consumers• Enhancing Efficiency• Ensuring Reliability• Enabling Renewables & Electric Transportation
Visualizing the Smart GridMany Definitions – But One VISION

© 2011 No part of this presentation may be reproduced in any form without prior authorization.
Sample “Smart Grid” Components & Devices
Google Power Meter
Smart Meters
Source: IBM Smart Grid
Secure Smart Grids are architected with standards (source: Gridnet)
Control4’s EMS‐100
© 2011 No part of this presentation may be reproduced in any form without prior authorization.
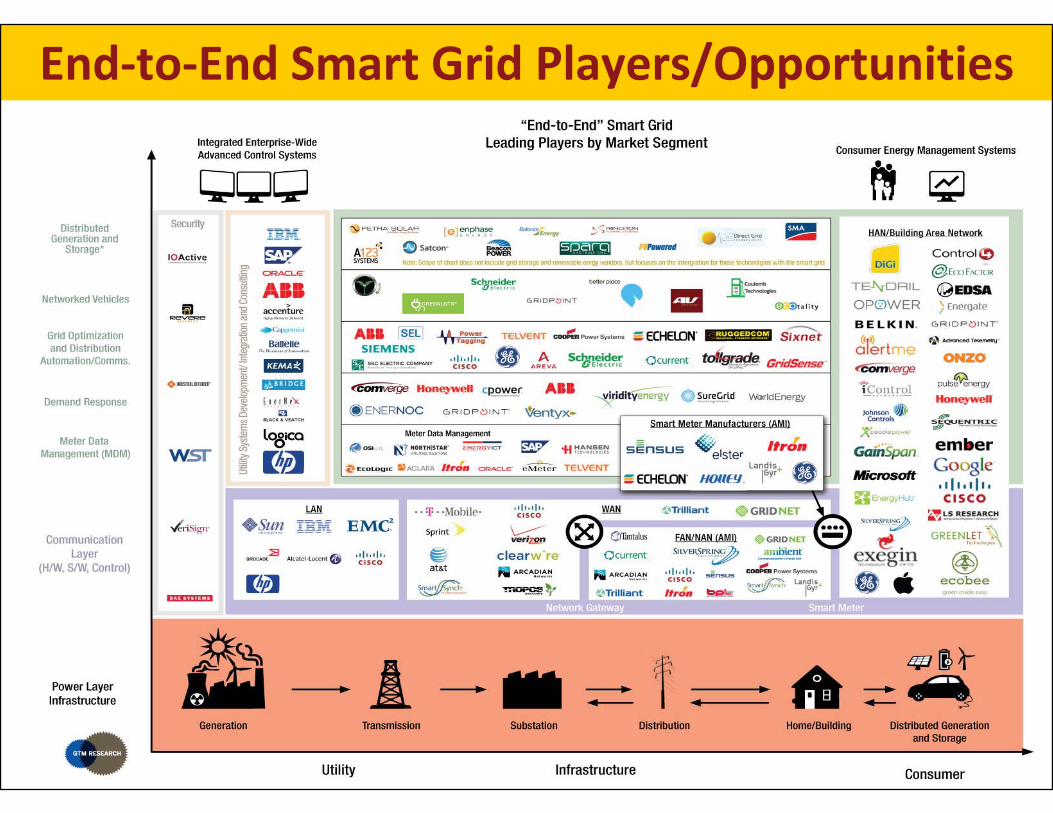
End‐to‐End Smart Grid Players/Opportunities

© 2011 No part of this presentation may be reproduced in any form without prior authorization.
Example: Continental Grid, a Multi‐Scale, Multi‐Level Hybrid System
Electricity infrastructure underlies every aspect of our economy and society. Possibly the largest machine in the world:
Transmission level (a meshed network, combining extra high voltage, above 300 kV, & high voltage, 100‐300 kV, connected to large generation units and very large customers; tie‐lines to transmission networks, and to the sub‐transmission level).
Sub‐transmission level (a radial or weakly coupled network including some high voltage, 100‐300 kV, but typically only 5‐15 kV, connected to large customers and medium sized generators), and
Distribution level (typically a tree network including low voltage, 110‐115 or 220‐240 volts, and medium voltage, 1‐100 kV, connected to small generators, medium‐ sized customers, and to local low‐voltage networks for small customers).

© 2011 No part of this presentation may be reproduced in any form without prior authorization.
Multi‐Scale Time Hierarchy of Power Systems
ACTION / OPERATION TIME FRAMEWave effects (fast dynamics, lightning caused overvoltages) Microseconds to millisecondsSwitching overvoltages MillisecondsFault protection 100 milliseconds or a few cyclesElectromagnetic effects in machine windings Milliseconds to secondsStability 60 cycles or 1 secondStability Augmentation SecondsElectromechanical effects of oscillations in motors & generators Milliseconds to minutesTie line load frequency control 1 to 10 seconds; ongoingEconomic load dispatch 10 seconds to 1 hour; ongoingThermodynamic changes from boiler control action (slow dynamics) Seconds to hoursSystem structure monitoring (what is energized & what is not) Steady state; on-goingSystem state measurement and estimation Steady state; on-goingSystem security monitoring Steady state; on-goingLoad Management, load forecasting, generation scheduling 1 hour to 1 day or longer; ongoing.Maintenance scheduling Months to 1 year; ongoing.Expansion planning Years; ongoingPower plant site selection, design, construction, environmental impact, etc. 10 years or longer

© 2011 No part of this presentation may be reproduced in any form without prior authorization.
End-uses & DR
Distribution SystemTransmission System
Energy Storage
Fuel Supply System
Fuel Source/Storage
Power Plants
Renewable Plants
Data CommunicationData Communication
Wide Area ControlWide Area Control
SensorsControllers
ZIP
M
Dynamic Load ModelsDynamic Power Plant Models
End‐to‐End Power Delivery Operation & Planning
Monitoring, Modeling, Analysis, Coordination & ControlMonitoring, Modeling, Analysis, Coordination & Control

© 2011 No part of this presentation may be reproduced in any form without prior authorization.
What are we doing about it?Enabling Technologies
• Monitoring: WAMS, OASIS, SCADA, EMS:
• Analysis: DSA/VSA, PSA, ATC, CIM, TRACE, OTS, ROPES, TRELSS, market/risk assessment…
• Control: FACTS; Fault Current Limiters (FCL)• Power Electronics to enable integration of intermittent sources, connection to smart grid, and increased controllability.
• Materials science: High‐temperature superconducting cables, advanced silicon devices and wide‐bandgap semiconductors for power electronics.
• Distributed resources

© 2011 No part of this presentation may be reproduced in any form without prior authorization.
Key Technology AreasTechnologyArea Description
Integrated Communications
High‐speed, fully integrated, two‐way communication technologies will make the modern grid a dynamic, interactive “mega‐infrastructure” for real‐time information and power exchange. Open architecture will create a plug‐and‐play environment that securely networks grid components to talk,listen and interact.
Sensing and Measurement
These technologies will enhance power system measurements and enable the transformation of data into information. They evaluate the health of equipment and the integrity of the grid and support advanced protective relaying; they eliminate meter estimations and prevent energy theft. They enable consumer choice and demand response, and help relieve congestion.
Advanced Control Methods
New methods will be applied to monitor essential components, enabling rapid diagnosis and timely, appropriate response to any event. They will also support market pricing and enhance asset management and efficient operations.
Improved Interfaces and Decision Support
In many situations, the time available for operators to make decisions has shortened to seconds. Thus, the modern grid will require wide, seamless, real‐time use of applications and tools that enable grid operators and managers to make decisions quickly. Decision support with improved interfaces will amplify human decision making at all levels of the grid.

© 2011 No part of this presentation may be reproduced in any form without prior authorization.
Smart Grid Protection Schemes & Communication Requirements
Type of relay Data Volume (kb/s) Latency
Present Future Primary (ms)
Secondary (s)
Over current protection 160 2500 4‐8 0.3‐1
Differential protection 70 1100 4‐8 0.3‐1
Distance protection 140 2200 4‐8 0.3‐1
Load shedding 370 4400 0.06‐0.1 (s)
Adaptive multi terminal 200 3300 4‐8 0.3‐1
Adaptive out of step 1100 13000 Depends on the disturbance
© 2011 No part of this presentation may be reproduced in any form without prior authorization.
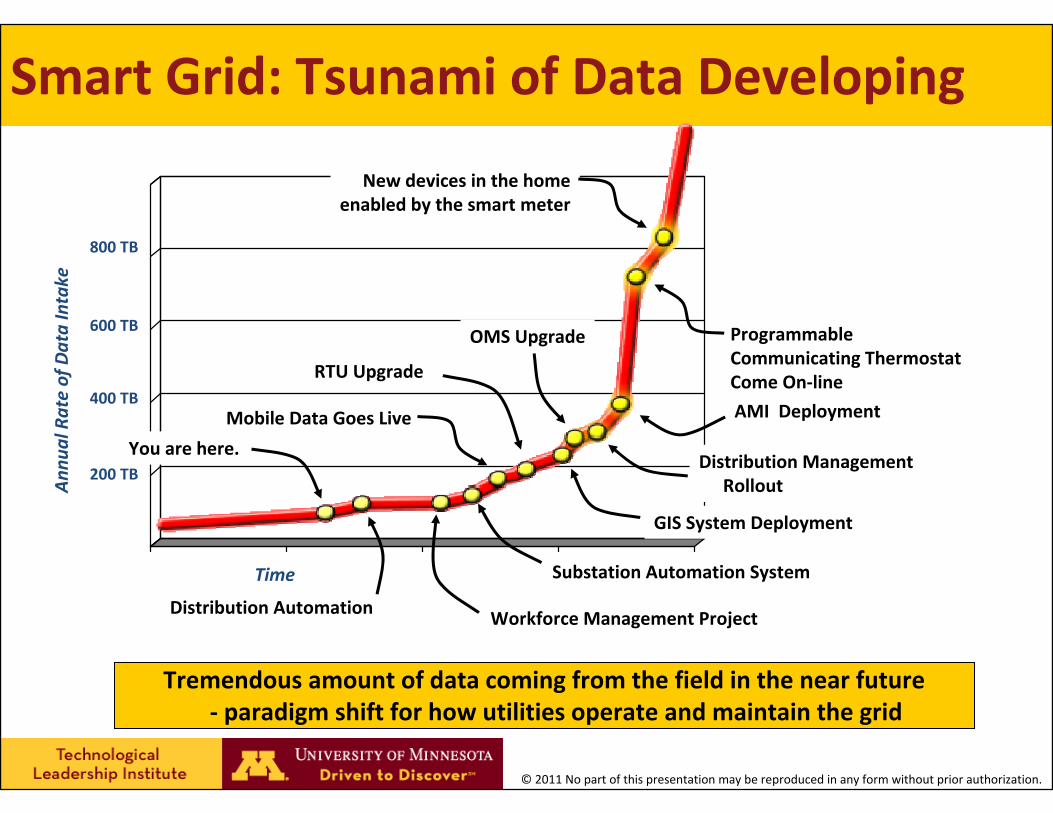
Smart Grid: Tsunami of Data Developing
New devices in the homeenabled by the smart meter
You are here.
AMI Deployment
ProgrammableCommunicating ThermostatCome On‐line
Distribution Management Rollout
Mobile Data Goes Live
RTU Upgrade
GIS System Deployment
OMS Upgrade
Distribution Automation
Substation Automation System
Workforce Management Project
Time
Annu
al Rate of Data Intake
200 TB
400 TB
600 TB
800 TB
Tremendous amount of data coming from the field in the near future‐ paradigm shift for how utilities operate and maintain the grid

© 2011 No part of this presentation may be reproduced in any form without prior authorization.
Example: Three‐phase WAMS application in China

© 2011 No part of this presentation may be reproduced in any form without prior authorization.

© 2011 No part of this presentation may be reproduced in any form without prior authorization.
Smart Grid InterdependenciesSecurity, Efficiency, and Resilience

© 2011 No part of this presentation may be reproduced in any form without prior authorization.
Our team’s Smart Grid Research

© 2011 No part of this presentation may be reproduced in any form without prior authorization.
Smart meter control
• Simulating the actions of a smart meter as real time prices vary (Anthony Giacomoni)

© 2011 No part of this presentation may be reproduced in any form without prior authorization.
Energy Infrastructure, Economics, Efficiency, Environment, Secure Communications and Adaptive Dynamic Systems
Adaptive Systems (self-healing)
EconomicsEfficiencyIncentives
Private Good
Electric PowerReliability
Public Good
Complex, highly nonlinear infrastructure Evolving markets, rules and designs
“if you measure it you manage it � if you price it you manage it even better”… Technologies, Designs, Policies,
Options, Risks/Valuation
“Prices to Devices”
Society (including Policy & Environment)

© 2011 No part of this presentation may be reproduced in any form without prior authorization.

© 2011 No part of this presentation may be reproduced in any form without prior authorization.
Vision for the Smart Grid U™• Goal: transform the University of Minnesota’s Twin Cities’campus into a SmartGridU.– Develop system models, algorithms and tools for successfully integrating the components (generation, storage and loads) within a microgrid on the University of Minnesota campus.
– Conduct “wind‐tunnel” data‐driven simulation testing of smart grid designs, alternative architectures, and technology assessments, utilizing the University as a living laboratory.
– Roadmap to achieve a “net zero smart grid” at the large‐scale community level – i.e., a self contained, intelligent electricity infrastructure able to match renewable energy supply to the electricity demand.

© 2011 No part of this presentation may be reproduced in any form without prior authorization.
Smart Grid U™• Control algorithms and interfaces
for turning individual energy components (storage, generation and loads) into an integrated, optimized energy system.
– E.g., demand surface plots of raw data for demands, emissions, & efficiency
01 Jun 03June2003
06 Jun 03
11 Jun 03
16 Jun 03
21 Jun 03
26 Jun 03
0.0
2.0
4.0
6.0
8.0
10.0
12.0
14.0
16.0
M W
D at e
T ime o f D ay
14.0-16.012.0-14.010.0-12.08.0-10.06.0-8.04.0-6.02.0-4.00.0-2.0
Next steps: demonstrate ability to integrate renewables/storage, cogeneration and achieve NZE status.

© 2011 No part of this presentation may be reproduced in any form without prior authorization.
Local System Communication Overlay

© 2011 No part of this presentation may be reproduced in any form without prior authorization.

© 2011 No part of this presentation may be reproduced in any form without prior authorization.
Going carbon negative…UM Morris Net Energy Balance
(20,000)
(10,000)
-
10,000
20,000
30,000
40,000
50,000
2004 2005 2006 2007 2008 2009 2010 2011 2012
Year
Ener
gy B
alan
ce, M
Wh
(4,000)
(2,000)
-
2,000
4,000
6,000
8,000
10,000
12,000
14,000
16,000
Net C
O2
(Eq)
Foo
tprin
t, M
etric
Ton
s
Net Campus Energy Balance, MWh Campus Purchased Fossil Fuel + Elec use, MWhNet Campus CO2 Footprint, Metric Tons

© 2011 No part of this presentation may be reproduced in any form without prior authorization.
Smart Grid U™• Lessons learned and key messages:
– Consider all parts together (Holistic Systems approach)– Focus on Benefits to Cost Payback– Remove deficiencies in foundations– The University as a Living laboratory– Education and Research Implement new solutions
• Consumer engagement critical to successful policy implementationto enable end‐to‐end system modernization
• If the transformation to smart grid is to produce real strategic value for our nation and all its citizens, our goals must include:– Enable every building and every node to become an efficient and
smart energy node.

© 2011 No part of this presentation may be reproduced in any form without prior authorization.p.52
GenerationTransmission
Distribution Customers
Enabling a Stronger and Smarter Grid
Real-time Simulation and Contingency AnalysisReal-time Simulation and Contingency Analysis
Integration of Distributed Generation, Massive Storage and Alternate Energy SourcesElectrifying Transportation: Plug-In Hybrid Electric Vehicles and Integration
Integration of Distributed Generation, Massive Storage and Alternate Energy SourcesElectrifying Transportation: Plug-In Hybrid Electric Vehicles and Integration
Self-Healing Wide-Area Protection and IslandingSelf-Healing Wide-Area Protection and Islanding
Asset Management and On-Line Equipment MonitoringAsset Management and On-Line Equipment Monitoring
Demand Response and Dynamic PricingDemand Response and Dynamic Pricing
“Dollars and Watts” Participation in Energy Markets“Dollars and Watts” Participation in Energy Markets

© 2011 No part of this presentation may be reproduced in any form without prior authorization.
One of my research areas: S&T Assessment, Scan & Map (April 2005‐Feb 2006; Galvin Electricity Initiative)Examples of Technology strengths of the industry today
Information Science
Physical Science
leading
strongcapable
14
Industry Application
Status
Industry’sTechnology
PowerZone™™
Examples of Technology strengths of the industry today include:1.Power Electronics2.Adv. Electric motors3.Wind generation4.Nuclear Power5.Solar power6.Systems integration7.Real-time systems control8.Personal storage devices9.Power conditioning10.Efficient illumination11.Emission control12.Turbine generation13.Adv. Materials technology14.Security technology 3
2
1
6
4
7
5
9
812
10
13
11
Bio- and Life Sciences

© 2011 No part of this presentation may be reproduced in any form without prior authorization.
One of my research areas: S&T Assessment, Scan & Map(April 2005-Feb 2006; Galvin Electricity Initiative)
© 2011 No part of this presentation may be reproduced in any form without prior authorization.
R&D Challenges• Sensing and Communication
• Early Fault Detection and System V&V
• Systems Integration and Interoperability
• Security (from embedded… to end‐to‐end)

© 2011 No part of this presentation may be reproduced in any form without prior authorization.
Enabling a Stronger and Smarter Grid•Smart Grid Challenges/Opportunities:
– Infrastructure for Generation/Transmission/Distribution Systems– Infrastructure for Smart Customer Interface– Distribution Automation – Smart metering improves load models and profiles– Distributed Sensing and Control– Device monitoring and self‐healing diagnostics– Communication infrastructure provides opportunities for monitoring and
diagnostics– Fault detection, sensor networks, etc. for smart grid– Alternative Smart Grid Architectures– Infrastructure Security: Controls, Communications and Cyber Security– Markets and Policy– Distributed generation and storage adds complexity

© 2011 No part of this presentation may be reproduced in any form without prior authorization.
Conclusion on R&D challenges• Develop a theoretical framework, modeling and
simulation tools for interdependencies and their fundamental characteristics, to provide:– An understanding of true dynamics and impact on coupled infrastructure
robustness and reliability.– An understanding of emergent behaviors, and analysis of multi-scale and
complexity issues and trends in the future growth and operations.– Real-time state estimation and visualization of infrastructures-- flexible and rapidly
adaptable modeling and estimation
• Integrated assessment, monitoring, and early warning:– Vulnerability assessment, risk analysis and management– Underlying causes, distributions, and dynamics of and necessary/sufficient
conditions for cascading breakdowns (metrics).– Data mining and early signature detection– Infrastructure databases.

© 2011 No part of this presentation may be reproduced in any form without prior authorization.
Selected Areas in Applied Mathematics Dynamical Systems and Controls
• Modeling: Idealized models, consisting of static graph‐theoretic models, and interactive dynamic models, such as interconnected differential‐algebraic systems; Hybrid Models.
• Robust Control: Design of self‐healing systems requires the extension of the theory of robust control in several ways beyond its present focus on the relatively narrow problem of feedback control.
• Complex Systems: Theoretical underpinnings of complex interactive systems.
• Dynamic Interaction in Interdependent Layered Networks: Characterization of uncertainty in large distributed networks: Multi‐resolutional techniques where various levels of aggregation can co‐exist.
• Disturbance Propagation in Networks: Prediction and detection of the onset of failures both in local and global network levels.
• Forecasting, Handling Uncertainty and Risk: Characterizing Uncertainties and Managing Risk; Hierarchical and multi‐resolutional modeling and identification; Stochastic analysis of network performance; Handling Rare Events.

© 2011 No part of this presentation may be reproduced in any form without prior authorization.
Selected References Downloadable at: http://umn.edu/~amin
• “A Control and Communications Model for a Secure and Reconfigurable Distribution System,” (Giacomoni, Amin, & Wollenberg), IEEE American Control Conf., June 2011
• “Securing the Electricity Grid,” (Amin), The Bridge, the quarterly publication of the National Academy of Engineering, Volume 40, Number 1, Spring 2010
• “Preventing Blackouts," (Amin and Schewe), Scientific American, pp. 60‐67, May 2007"New Directions in Understanding Systemic Risk", with NAS and FRBNY Committee, National Academy of Sciences and Federal Reserve Bank of NY, Mar. 2007
• “Powering the 21st Century: We can ‐and must‐modernize the grid," IEEE Power & Energy Magazine, pp. 93‐95, March/April 2005
• Special Issue of Proceedings of the IEEE on Energy Infrastructure Defense Systems, Vol. 93, Number 5, pp. 855‐1059, May 2005
• “Complex Interactive Networks/Systems Initiative (CIN/SI): Final Summary Report”, Overview and Summary Final Report for Joint EPRI and U.S. Department of Defense University Research Initiative, EPRI, 155 pp., Mar. 2004
• "North American Electricity Infrastructure: Are We Ready for More Perfect Storms? ," IEEE Security and Privacy, Vol. 1, no. 5, pp. 19‐25, Sept./Oct. 2003
• "Toward Self‐Healing Energy Infrastructure Systems,“ cover feature in IEEE Computer Applications in Power, pp. 20‐28, Vol. 14, No. 1, January 2001
© 2011 No part of this presentation may be reproduced in any form without prior authorization.
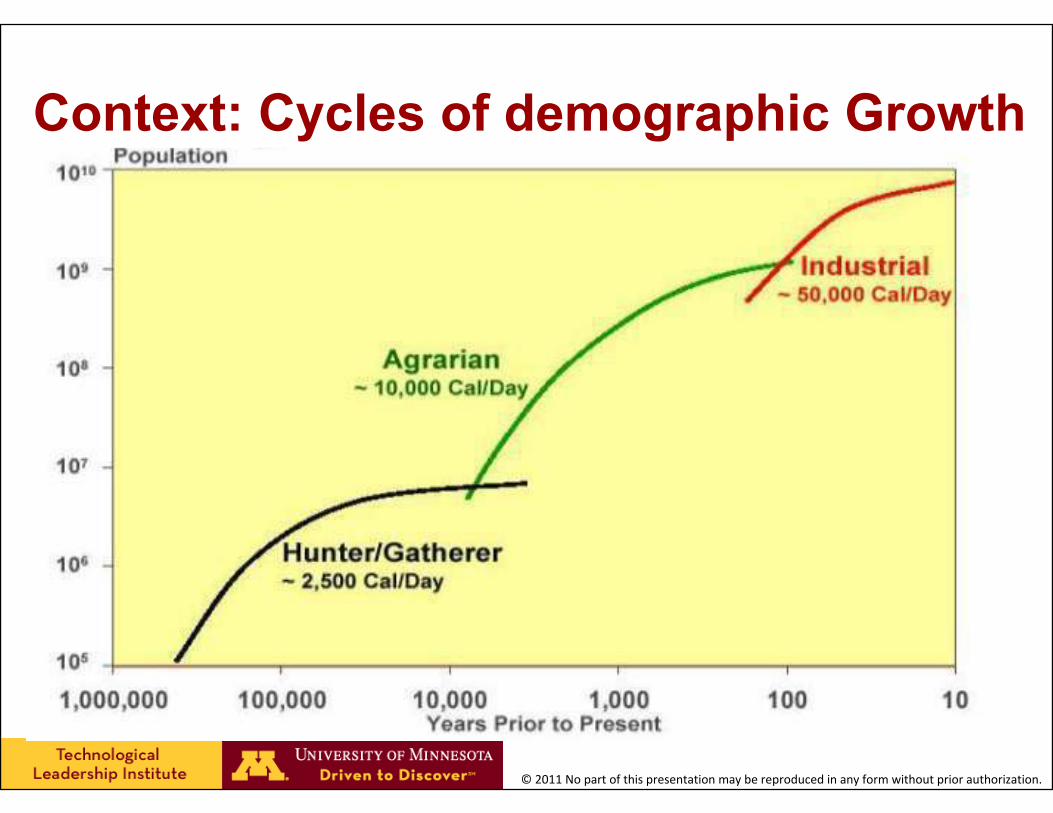
Context: Cycles of demographic Growth

© 2011 No part of this presentation may be reproduced in any form without prior authorization.

© 2011 No part of this presentation may be reproduced in any form without prior authorization.