S I “S A
33
S UPPORTING INNOVATIVE ENTREPRENEURSHIP : AN EVALUATION OF THE I TALIAN “S TART- UP A CT ” Francesco Manaresi Carlo Menon Pietro Santoleri Working paper no. 163 July 2020
Transcript of S I “S A

SUPPORTING INNOVATIVE
ENTREPRENEURSHIP: AN EVALUATION OF
THE ITALIAN “START-UP ACT”
Francesco Manaresi Carlo MenonPietro Santoleri
Working paper no. 163
July 2020

Supporting innovative entrepreneurship:
an evaluation of the Italian “Start-up Act”
Francesco Manaresi1, Carlo Menon2, and Pietro Santoleri3?
1 Directorate General for Economics, Statistics and Research, Bank of Italy2 Laterite
3 Institute of Economics and EMbeDS, Sant’Anna School of Advanced Studies
29th June, 2020
Abstract. The role of innovative start-ups in contributing to aggregate economic dynamism has
attracted increased attention in recent years. While this has translated into several public poli-
cies explicitly targeting them, there is little evidence on their effectiveness. This paper provides a
comprehensive evaluation of the “Start-up Act”, a policy intervention aimed at supporting innova-
tive start-ups in Italy. We construct a unique database encompassing detailed information on firm
balance-sheets, employment, firm demographics, patents and bank-firm relationships for all Italian
start-ups. We use conditional difference-in-differences and instrumental variable strategies to eval-
uate the impact of the “Start-up Act” on firm performance. Results show that the policy induces a
significant increase in several firm outcomes whereas no effect is detected in patenting propensity
and survival chances. We also document that the policy alleviates financial frictions characterizing
innovative start-ups through the provision of tax credits for equity and a public guarantee scheme
which, respectively, trigger an increase in the probability of receiving VC and accessing bank credit.
Keywords Start-ups · Entrepreneurship policy · Policy Evaluation · Firm performance
JEL M13 · L25 · L53 · D04
1 Introduction
Start-ups are key to economic growth: they contribute disproportionally to input accumulation (Audretsch
et al., 2006; Haltiwanger et al., 2013; Criscuolo et al., 2014), productivity growth (Haltiwanger et al.,
2016; Dumont et al., 2016; Alon et al., 2018). Moreover, they indirectly impose competitive pressure on
incumbent firms, thus forcing them to innovate in order to survive (Aghion et al., 2009).
Several frictions however may impair the contribution of start-ups to growth. Red tape and bu-
reaucratic costs may reduce birth rates of new firms and affect their selection at entry (Ciccone and
Papaioannou, 2007; Fernandez, 2014; Amici et al., 2016). Start-ups may have difficulties accessing credit
markets, because of a lack of past information on firm performance and modest endowments of collateral-
izable capital (Colombo and Grilli, 2007). They may also suffer from the underdevelopment of alternative
markets for external finance (Inderst and Muller, 2004).
?Corresponding author: [email protected]. Acknowledgments: Some extracts of this paper previously circulated
as an OECD Policy Paper (Menon et al., 2018). The authors wish to thank Timothy De Stefano and Giovanni Soggia for their
outstanding work, Koen de Backer, Alex Coad, Mattia Corbetta, Stefano Firpo, Francois Fontaine, Marco Grazzi, Nick Johnstone,
Francesca Lotti, Andrea Mina, Alessandro Nuvolari, Angelo Secchi, Federico Tamagni, and Roberto Volpe for helpful suggestions
and feedback. This paper has also benefited from the comments of the participants to seminars at OECD and Sant’Anna School
of Advanced Studies as well as to the “Quatrieme Conference de Evaluation des politiques publiques” at the French Ministry of
Economy, and to the “3rd Entrepreneurial Finance Conference” at Politecnico di Milano.

Governments can intervene to curb these frictions and boost new firms’ contributions to growth;
however, designing effective and efficient policy tools is particularly difficult. Indeed, the average per-
formance of start-ups masks a large heterogeneity among them: only a small share of firms are truly
“transformational”, i.e. their goal is to generate an increasing flow of profits and jobs in the future via
innovations in products, processes, and marketing (Schoar, 2010). These businesses are ultimately risky
and large experimentation is usually accompanied by high failure rates (Hyytinen et al., 2015; Fernandes
and Paunov, 2015). At the same time, the vast majority of start-ups are ultimately not innovative (Shane,
2009; Hurst and Pugsley, 2011; Nightingale and Coad, 2014; Colombelli et al., 2016): they are created
to run small, subsistence businesses.1 Policy-makers face a trade-off: on the one hand, one may want to
provide large horizontal support to as many start-ups as possible, to let “one hundred flowers bloom” to
foster experimentation; on the other hand, given the limited public resources available, one may like to
limit this support to innovative firms with high growth potential.
In 2012, the Italian government introduced a new policy framework, the “Start-up Act”, which tries to
strike a balance between these different objectives. The “Start-up Act” defined a set of eligibility criteria
based on observable firm characteristics such as age, R&D expenditure, employment skills, and intellectual
property, to identify firms that are ex-ante more likely to be innovative. All start-ups that meet these
criteria may freely register to the program and access a large set of benefits, ranging from reduced red
tape costs, tax incentives for equity investments, credit guarantee schemes, flexible labour laws and so on.
By the end of 2019, over 10,000 firms have been registered into the program. The Italian “Start-up Act”
has been considered a “best practice” in Europe, according to the Start-up Nation Scoreboard (European
Digital Forum, 2016). While the extremely diverse policy tools included in the Act were meant to foster
the build-up of an ecosystem for innovative startups in Italy, the policy stands out for supporting start-
ups’ post-entry performance by facilitating access to both equity and debt capital markets through tax
incentives and a credit guarantee scheme, respectively. This represents a unique feature of the policy with
the ultimate goal to tackle financial frictions, which are recognized as the single most important factor
in preventing the growth of innovative start-ups (Hall, 2010; Kerr and Nanda, 2015).
In this paper we evaluate the effects of this policy. For this purpose, we construct a unique database
that combines, for all start-ups born in Italy between 2005 and 2014, firm balance-sheets, demographic
data, wages and employees, patent applications and credit information from the Credit Register. Our em-
pirical strategy addresses the bias stemming from firms’ self-selection into the program. Firms registering
as innovative start-ups can be systematically different from those that do not. The decision to register
might be related to both observable and unobservable characteristics of the firms that are correlated
with their subsequent performance. First, we rely on matching techniques to identify untreated start-ups
with similar pre-treatment observable characteristics to those that join the policy. Then, to control for
unobservable characteristics that are fixed overtime, we use a difference-in-differences estimator (DID)
on the matched sample. Finally, there may be time-varying unobservable shocks that are correlated with
policy participation and with firm activities, such as a positive demand shock or a new business idea. To
address this issue, we develop an instrumental variable strategy that exploits the heterogeneous diffusion
of the policy at the geographical level in the aftermath of its introduction. This was due to a specific
1 A series of studies have documented that most new firms display a low propensity to introduce innovations andlittle or no growth during the first five years of their activity (Stam and Wennberg, 2009; Hurst and Pugsley,2011; Decker et al., 2014). Yet, a small share of new firms, often engaging in innovative activities, is able toexperience very fast expansion (Stam and Wennberg, 2009; Santoleri, 2019).
2

provision of the program that required local Chambers of Commerce (CC) to deliberate on whether the
start-up official mission statement was “innovation oriented”.
We find that the policy induces a substantial increase in firm assets, mainly driven by fixed capital. In
particular, we document a considerable rise in intangibles, though not driven by patenting, an essential
input for the innovative process of startups which is usually hampered by financial frictions. Higher
intangible capital is accompanied by larger value added and a positive (albeit statistically weaker) effect
on revenues and employment. Concerning the financial side, we do find a positive impact on firm equity
and a stronger effect on indebtedness, so that average leverage increases. Conversely, the “Start-up Act”
does not seem to affect the probability of survival of the firm.
We then move to study the effects of the policy in terms of accessing external financing. In particular,
we exploit confidential Credit Register data on credit applications and find that the “Start-up Act”
raises the probability that the application is accepted by banks and increase the amount of credit granted
conditional on being accepted. Furthermore, leveraging data from the universe of venture capital deals
in Italy, we find that the policy triggers an increase in the probability of receiving venture capital.
These results suggest that the policy has successfully alleviated the financial frictions characterizing
innovative start-ups. Moreover, our findings underscore the value of providing a full and comprehensive
set of measures that ease both debit and equity financing, in order to let start-ups choose the financing
instruments that are more appropriated for their expansion strategy.
Entrepreneurship policies have traditionally targeted firms based on their size, following the idea that
small businesses contribute to net job creation the most. However, recent evidence has highlighted that it
is actually young firms (Haltiwanger et al., 2013), and more prominently innovative young firms (Shane,
2009), that make a decisive contribution to aggregate economic dynamism, and that firm size per se is
much less relevant once one conditions on age. Against this backdrop, greater attention has been devoted
to (innovative) start-ups in both the academic and policy debate. This has resulted in governments imple-
menting national Startup Acts with the explicit aim of offering support to innovative start-ups in several
countries (Audretsch et al., 2019).2 Because of the lack of case-studies, so far scholars have only been
able to provide very few assessments of these new initiatives promoting innovative start-ups. Exceptions
include the work by Autio and Rannikko (2016) on the Finnish case, and two contemporaneous works
on the Italian policy by Finaldi Russo et al. (2016) and Giraudo et al. (2019). While the latter focuses
on the interrelationships between the instruments supporting the access to external finance provided by
the “Start-up Act”, the works by Autio and Rannikko (2016) and Finaldi Russo et al. (2016) are more
related to ours: they evaluate the impact of the policies on some firm outcomes. However, they solely
implement a propensity-score matching, which assumes that policy participation is random conditional
on observable characteristics. We show that such an assumption is unlikely to hold, improving on the
identification strategy by developing a PSM-DID with instrumental variable approach. We also improve
by exploiting a more comprehensive set of information, which allow us to provide a broader and clearer
picture of the effects of the policy.
The remainder of the paper is structured as follows. Section 2 describes the policy implemented by
the Italian government since 2012. Section 3 presents the data whereas Section 4 discusses the empirical
strategy to assess the effects of the “Start-up Act” on the performance of innovative start-ups. Section 5
2 In the EU, 12 countries have introduced regulatory frameworks or given special status to startups by 2016.Recent examples are the NIY program in Finland and the Start-up Plans of Belgium and France (i.e. “Jeunesentreprises innovantes”). For a review of recent policy initiatives focuses on innovative start-ups see EuropeanDigital Forum (2016). An updated compendium of international public policies is the Startup Nations Atlas ofPolicies, available at https://www.genglobal.org/startup-nations/snap.
3
presents the main results of our estimation exercise, and Section 6 provides a series of robustness checks.
Section 7 presents some policy implications of our findings and concludes.
2 Institutional framework
Italy has experienced sluggish productivity growth since the mid 1990s (Bugamelli et al., 2018). One of
the factors behind this modest performance is the lack of business dynamism characterizing the Italian
economy. Differently from other OECD countries, young firms in Italy grow less, for a shorter period of
time while exit rates are generally flat over the age distribution (Criscuolo et al., 2014; Manaresi, 2015).
As a result, the “up-or-out” dynamics that models of firm dynamics identify as a crucial ingredient for
productivity growth is particularly subdued in Italy. Against this backdrop, the Italian government in-
troduced a policy framework for innovative entrepreneurship - nicknamed “Start-up Act” - in October
2012, which continues to this day. The extensive regulatory framework aims to create a more favourable
environment for small innovative start-ups for the first five years of activity through a number of comple-
mentary instruments. This policy stands out in the international comparison for the comprehensiveness
of the bundle of activated policy instruments: these include measures that cut red tape and facilitate
entry and exit to the market; tax incentives; tailor made labour laws; support to flexible remuneration
schemes; incentives for equity crowdfunding; etc.3
One of the unique features of the “Start-up Act” framework is the simultaneous provision of policy
instruments addressing the access to external finance. Financial frictions in both credit and equity capital
markets have been identified as the single most severe constraint to small and young innovative firms’
performance by a vast literature (Hall, 2010; Hall and Lerner, 2010; Kerr and Nanda, 2015; Revest and
Sapio, 2012). To this end, the policy encompasses two measures to support innovative start-ups’ demand
for capital: i) an incentive for venture capitalists and external investors who invest in the equity of
innovative start-ups; ii) fast and free of charge access to a public guarantee scheme for debt financing.4
The incentives to equity financing are of paramount importance for two reasons. The first is that prior
literature has documented the beneficial effects of venture capital financing on firm performance (Kortum
and Lerner, 2000; Hellmann and Puri, 2000; Bertoni et al., 2011; Puri and Zarutskie, 2012). The second
is related to the severe underdevelopment of the Italian venture capital industry in comparison to other
OECD countries (Revest and Sapio, 2012; Bertoni et al., 2015; Menon et al., 2018; Bronzini et al., 2019).
Yet, exclusively providing incentives to equity financing might miss out on those start-ups with innovative
and growth potential that do not choose to seek equity or simply cannot obtain it.5 The simultaneous
3 A complete list of policy tools are reported on the website of the Italian Ministry of Economic Development,www.mise.gov.it.
4 Note that these measures aimed at facilitating access to debt and equity financing are the most popular andused policy instruments of the “Start-up Act” as documented by a survey conducted on beneficiary firms(MISE-Istat, 2018).
5 A large literature has documented that venture capitalists finance a very small amount of firms (Mulcahy, 2013;Gornall and Strebulaev, 2015) and that venture capital deals are heavily concentrated at the geographical level(Sorenson and Stuart, 2001; Cumming and Dai, 2010). This represents a substantial barrier since entrepreneurstend to locate their businesses in their home regions (Michelacci and Silva, 2007). Catalini et al. (2019) showthat, controlling for start-ups early growth potential, firms that do not obtain venture capital are actually verysimilar to those that do. Furthermore, start-ups might also opt for debt financing to, inter alia, retain equityownership (Cumming and Groh, 2018).
4

provision of both debt and equity incentives is precisely aimed at encompassing different financing needs
and choices of innovative start-ups.6
The “Start-up Act” defines a set of eligibility criteria to identify start-ups that are expected to be (or
become) innovative firms and who may benefit from policy support: the company should be operational for
less than five years, be headquartered in Italy, have an annual turnover lower than five million euros, not
be the result of a branch split or merger from a previous company, have a mission statement explicitly
related to innovation, be a limited company and not publicly listed, and should not have distributed
profits. Furthermore, firms need to fulfil at least one of the following three criteria: at least 15 per cent of
R&D expenditure ratio; 1/3 of employees are PhD students or graduates or researchers and/or 2/3 hold a
Master’s degree; be the holder, depository or licensee of a patent, or owner/author of registered software.
By posing stringent limits on company size and age, the policy maker narrows eligibility to firms that are
also expected to be in need of support, i.e., to be confronted with a number of possible market failures.
At the time of the analysis (April 2017), there were 7,044 active firms registered into the program.
The average firm has three employees, an output of 123,131 euro, share capital worth of 52,528 euro and
are 112 days old at the time of entry into the policy.7
Since the start of the policy, there has been a constant and steep increase in the number of entrants
participating in the Italian “Start-up Act”. Participation started off relatively slowly and picked up
considerably from 2014. Gradual uptake at the beginning can be partially explained by the lack of
awareness of the policy amongst eligible firms throughout the country. For example, according the results
of a survey conducted by the Ministry of Economic Development and the National Statistical Institute, one
of the main sources of information about the policy was the firm’s accountant (MISE-Istat, 2018). Another
factor that contributed to the slow uptake in the first years is the heterogeneous interpretation of the
requirement that the mission statement should be innovation-oriented, which we exploit for identification,
as described in Section 3.
One of the commendable aspects of the policy is the large variety of data collected on firm participants.
In fact, an essential prerequisite to access the policy incentives and benefits is to register into the special
section of the business register, maintained by the Italian Chambers of Commerce, on behalf of the
Ministry of Economic Development.
Given the number and variety of different policy instruments, there is no clear method to calculate
precisely the total cost of the policy. However, it is possible to obtain an approximate estimation based
on the costs of the main instruments, most of which take the form of foregone tax revenues (more details
are available in MISE (2017) and Menon et al. (2018)). A back-of-envelope calculation gives an aggregate
cost of around 30 million euro for the period 2012-17 for the approximately 9,000 start-ups that have
ever been registered into the policy, which corresponds to around 3,300 euro for each start-up.8
3 DataIn order to analyse the impact of the Italian “Start-up Act”, the paper uses a unique and rich dataset
that combines different sources of information. Some are maintained or collected by MISE to comply with
6 Vacca (2013) shows that Italian young innovative firms receiving private equity and venture capital are usuallyalso financed by banks. Instead Giraudo et al. (2019), who examine firms registered to the “Start-up Act”, findthat start-ups invested by VC tend to be remarkably different from those that recur to debt financing.
7 These calculations are based on a snapshot of the Start-up Business Registry in May 2017, which covers theperiod from October 2012 to April 2017.
8 This excludes the resources of the public guarantee scheme. Also, Smart&Start Italia and Invitalia Venturesmatching fund which where not included in the original 2012 “Start-up Act”.
5

their policy monitoring duties; we match them with micro-level data coming from both administrative
and commercial sources, as well as the Bank of Italy and the European Patent Office (EPO). Overall,
the resulting database allows us to assess the impact of the policy on many potential outcome variables,
covering a multitude of different dimensions of start-up operations and growth patterns.
Despite the richness of the dataset, several factors of complexity arise. The first one is the definition
and the measurement of start-up success within such a short time-span. While available evidence suggests
that most unsuccessful start-ups tend to fail within the third year of activity (Calvino et al., 2016), a
successful start-up may require more time to thrive and create value. Furthermore, this value may take
many different forms, which are not equal and easy to measure. Some start-ups may grow in employment
and value added, or become very productive: these phenomena can be captured by balance-sheet data,
observed for instance with data on acquisitions. However, other start-ups may create value under the
form of social mobility opportunities and inclusiveness, of increased competition and consumers’ welfare
in the market, of disruptive innovations in fields that are important for the society as a whole, like health
or climate change mitigation. While these forms of value may have some repercussions on balance-sheet
data, the full effect may be hard to measure accurately.
A further limitation is the time-span of firm-level data (especially balance sheets) after the imple-
mentation of the policy: the Italian “Start-up Act” was fully implemented in the first half of 2013 and
since typically new firms do not publish a balance-sheet for their first year of activity, only the first three
balance-sheets can be observed for the oldest participants, with the last observation being the fiscal year
2016. This leaves one with a three-year window that, while should be sufficient to detect some important
indicators of success, is inevitably noisier and less precise than a longer time horizon.
The data source that allows us to identify participant firms is the special section of the Business Reg-
istry dedicated to innovative start-ups (henceforth “start-up registry”). The registry is updated weekly,
allowing an on-time monitoring of the policy; this is one of the best practices of the policy that should be
commended. Among the 7,044 active firms registered in the program on April 2017, 42 per cent of them
were operating in information and communication services, 25 per cent in professional and scientific activ-
ities and 18 per cent in manufacturing. The variables of interest provided by the start-up registry include
the eligibility criteria that qualified firms to enter into the policy and their age at entry, in addition to a
number of other firm characteristics. Financial and current account statements for the universe of Italian
limited liability companies are available from the Cerved database, administered by Cervedgroup ltd. It
contains detailed accounting data for around 700 thousands firms per year over the period 2005-2016.
To assess the impact of the “Start-up Act” on firms’ access to external finance, we use data from the
Italian Venture Capital and Private Equity Association (AIFI) and the Bank of Italy. The former is used
to examine the effects on venture capital financing whereas the latter is employed to study access to bank
credit. Data from AIFI encompass the universe of VC deals in Italy during the time span 2004-2018.9
The Central Credit Register is an information system operated by the Bank of Italy that collects the data
supplied by banks and financial companies on the credit they grant to their customers. The database has
information about quantities, prices and loan applications pertaining bank-firm relationships. This data
reports the quantity of all credits granted by banks operating in Italy to borrowers for which the overall
exposure to the banking system is above 30,000 euros (this amount includes both credit granted and
the value of guarantees provided to the borrower). Finally, data on loan applications are used to analyse
the probability that a firm registered in the program receives new credit from a bank. For supervisory
9 In more detail, these data include all seed and early stage VC investments. Data are available through VentureCapital Monitor by AIFI at http://www.privateequitymonitor.it/rapporti_vem.php.
6

purposes, every time a new client submits a loan application to a bank, the latter requests information on
this borrower and the query is recorded in the Credit register. By checking whether the bank eventually
granted any credit to the applicant in the same or in the following quarter, one is able to classify a loan
application as accepted or rejected.10
Finally, we access micro-level data collected by the Italian Chambers of Commerce to obtain detailed
and reliable information on firm demographics for all businesses operating in Italy, e.g. information on
when and where firms are established, whether they are truly de-novo firms or they are created out of a
firm divestment, whether they effectively exit the market or they are acquired by other firms. We use this
information to identify all start-ups born during the period 2005-2015 and check their survival over this
time period. We exploit data from the National Social Insurance Institute (INPS) to obtain the number
of employees and average wages for all Italian firms on a yearly basis over the period of analysis. Finally,
we use PATSTAT to complement the above sources of information with patent applications filed to the
EPO by Italian firms up to 2017.11
3.1 Sample selection and descriptive statistics
Our empirical strategy, outlined in the next section, requires treated firms to have at least one pre-
treatment period in order to perform the matching procedure and at least two post-treatment periods
in order to estimate treatment effects. Hence, we select only those firms observed for three consecutive
years and that benefit from the policy for a minimum of two years. Since our balance-sheet data cover the
period up until 2016, this implies that the final sample is restricted to those cohorts of firm born during
the period 2009-2014 and that could have joined the policy since late 2012 up to 2015.12 The number of
registered start-ups up to 2015 is 3,560 whereas, by applying the above-mentioned criteria, the sample is
restricted to 571 firms13. After dropping firms with missing variables in key balance-sheet covariates (i.e.
revenues, total assets, fixed assets, and equity), the sample reduces to 328 treated firms.
Concerning those firms that could be considered as potential controls (354,694 firms), we make sure
that they could meet the eligibility criteria of the policy in terms of both size and age: we discard those
firms featuring minimum revenues higher than 5 million euros and keep only firms born during the period
2009-2014 as for our treated sample. By considering only those with three consecutive observations and
discarding firms missing variables, we end up with a sample of 67,897 firms.
In order to verify the representativeness of our smaller sample of the initial universe of registered
innovative start-ups firms, we compare a series of firm-level characteristics. Table A1 provides a compar-
ison of our sample of treated start-ups with the set of firms that joined the policy until the end of 2015.
Data on sales and equity, as well as the eligibility criteria and workforce composition, are collected by
the Ministry of Economic Development and typically refer to the year in which the firms registered to
the policy. The main difference that can be appreciated between the sample used in this paper and the
full population of treated firms relate to the cohort of birth. In fact, since we need one pre-treatment
year, our sample is mainly composed by firms that register in the early phase of the policy (i.e. during
10 See Jimenez et al. (2012) for a seminal application of this methodology to Spanish Credit Register data.11 In line with the innovation literature, we resort to patent applications, instead of patents granted. This is
motivated by the time needed to complete the patent granting procedure which would likely exceed our shortpost-treatment period.
12 However, note that firms usually deposit their first balance-sheet after their first year of activity (i.e. firms bornin 2013 deposit their first balance sheet in 2014). Hence there are very few firms observed for the cohort 2014.
13 This is mainly due to the fact that, starting from 2014, most firms join the policy few months after theirincorporation.
7

2013), therefore they belong to older cohorts with respect to the remaining registered start-ups. This also
explains why the start-ups in our sample tend to have larger revenues and equity.
Table 1 reports summary statistics of observable firm characteristics for both treated and untreated
firms. Treated firms are significantly smaller in terms of revenues, assets, and employees than untreated
ones. These differences are consistent with past evidence showing that innovative firms pursue relatively
more risky projects which take time before reaching the commercialisation phase (Gilbert et al., 2006).14
The higher propensity to innovate amongst the start-ups registered in the policy can be appreciated
by their larger amount of intangible assets, reflecting higher expenditure on R&D and ownership of
intellectual property such as patents.15 Notably, around 10 per cent of treated firms are found to have
filed at least one patent at the European Patent Office, while this share is practically zero among untreated
firms. Additionally, a small share of treated firms (2 per cent) have received venture capital injections
while, again, this share is almost zero for firms in the control group.
Finally, registered start-ups tend to be more concentrated in northern regions, whereas they are more
likely to operate in manufacturing, ICT services, professional, scientific and technical services and, in
particular, high-tech sectors.
4 Empirical strategy
We carry out a counterfactual evaluation exercise that compares the outcomes of targeted firms with the
outcomes of a properly defined control group, in order to identify the average treatment effect on the
treated (ATT) (Imbens and Rubin, 2015). The ATT corresponds to the difference in the outcome of the
average treated firm with and without the policy, respectively. However, the identification of the ATT
is challenging, as the counterfactual outcome - i.e. what would happen to the treated firms if they were
never treated - is never observed, and firms that registered into the policy are likely to be systematically
different from firms that did not, as the previous set of descriptive results has shown.
Part of these differences between treated and untreated firms are observable, e.g. from balance sheet
variables. Assuming that their effect can be captured by a parametric formulation, these differences can
be partialled-out by including the appropriate set of control variables in the model. It is nevertheless
more likely that most of these differences are unobservable: for instance, data on R&D expenditures are
not available for most firms, thus the eligibility criterion based on this measure cannot be discerned.
Furthermore, treated firms may plausibly have a management that is better informed, have a more ambi-
tious strategy, etc. In the econometric literature, these identification challenges are preferably addressed
exploiting some discontinuities or quasi-experiments that introduce a degree of randomness in the prob-
ability of firms being treated. However, in the setting under scrutiny these are not readily available since
the policy is relatively young and the number of treated firms is not very large, especially in the first
years (2013 and 2014). A suitable empirical strategy should therefore control for selection bias as well
as unobservable heterogeneity across treated and untreated firms. To this end, we adopt a conditional
difference-in-differences (DID) approach (Heckman et al., 1998). This strategy combines matching meth-
ods with DID thus tackling selection on observables and unobservables at the same time. In particular,
14 Hellmann and Puri (2000) show that early-stage innovative firms receiving venture capital do not have a sizablestream of revenues.
15 Bronzini and Iachini (2014), who use the same balance-sheet data, show that intangible assets are correlatedwith firms’ innovative capabilities. Indeed, intangible assets are mainly composed by R&D, patents, softwareand other intellectual property rights, licenses, trademarks whereas goodwill and start-up costs represents onlya small share.
8

Table 1: Descriptive statistics of observable firm characteristics
Untreated Treated Number of firms
Mean SD Mean SD Diff. Untreated Treated
Firm characteristicsRevenues (1,000 euro) 806.41 1814.67 240.26 425.72 566.15* 67897 328Value Added (1,000 euro) 200.48 901.01 60.54 220.26 139.94* 67533 325Employees 6.14 17.53 3.28 4.00 2.87* 49576 170Assets (1,000 euro) 873.26 6881.57 437.33 979.76 435.93* 67897 328Fixed K (1,000 euro) 347.16 4759.97 192.73 807.22 154.43* 67897 328Intangibles (1,000 euro) 67.11 531.36 101.88 207.76 -34.77* 67897 328Patent (d) 0.00 0.05 0.10 0.31 -0.10* 67897 328Leverage (%) 0.79 0.21 0.67 0.24 0.11* 67897 328Equity (1,000 euro) 158.09 2075.43 150.46 539.51 7.63 67897 328VC (d) 0.00 0.01 0.02 0.13 -0.02* 67897 328Birth cohortCohort 2009 0.19 0.39 0.14 0.35 0.05* 67897 328Cohort 2010 0.23 0.42 0.23 0.42 -0.00 67897 328Cohort 2011 0.25 0.43 0.35 0.48 -0.10* 67897 328Cohort 2012 0.20 0.40 0.17 0.38 0.03 67897 328Cohort 2013 0.13 0.33 0.10 0.30 0.03 67897 328Cohort 2014 0.01 0.08 0.01 0.08 0.00 67897 328Geographic areaNorth West 0.29 0.45 0.35 0.48 -0.06* 67897 328North East 0.20 0.40 0.33 0.47 -0.13* 67897 328Center 0.24 0.43 0.21 0.41 0.03 67897 328South 0.20 0.40 0.07 0.25 0.13* 67897 328Islands 0.07 0.26 0.05 0.21 0.03* 67897 328SectorAgriculture & Mining 0.00 0.00 0.00 0.00 0.00 67881 328Manufacturing 0.22 0.41 0.27 0.44 -0.05 67881 328Construction & Retail 0.49 0.50 0.08 0.28 0.41* 67881 328Info & Communication Act. 0.06 0.24 0.30 0.46 -0.24* 67881 328Professional & Scientific Act. 0.11 0.31 0.32 0.47 -0.22* 67881 328Other services 0.12 0.33 0.03 0.17 0.09* 67881 328High-tech 0.06 0.24 0.52 0.50 -0.46* 67897 328Access to CreditCredit Application 0.38 0.02 0.55 0.04 -0.16* 233 61Application Accepted 0.44 0.03 0.58 0.05 -0.14* 87 32Credit Granted 12.13 0.09 12.19 0.19 -0.06 87 32
Notes: statistics computed using treated and control firms in our estimation sample. One observation perfirm. The column “Diff” reports the difference between the means of treated and controls as well as thep-value of the t-test of equality of the two means. * p < 0.05.
propensity score matching (PSM) is used to create a control group among non-treated firms which are
as similar as possible to treated firms with respect to observable characteristics in the year preceding
the treatment (Caliendo and Kopeinig, 2008). Then we run DID regressions on the matched sample
to test whether firms benefiting from the policy perform differently with respect to outcome variables,
such as revenues, employment, and innovative capacity compared to other firms that did not registered
as innovative start-ups. In the estimation we control for a broad set of fixed effects, including age and
firm-level fixed effects, addressing potential omitted variable problems. While this procedure addresses
differences in observables and unobservables that are time-invariant, a potential concern might stem from
time-varying unobservables simultaneously influencing firms selection into treatment and outcomes. To
this end, we make use of an instrumental variable strategy that exploits regional variation in treatment
probabilities.
This section outlines the details behind our empirical approach. First, we describe the method to
construct the counterfactual control sample by the PSM method. We then turn to the DID methodology
to control for the potential confounding variables. Finally, we provide a description of the IV strategy.
4.1 Propensity score matching
The goal of the PSM is to pair beneficiary firms (treated group) with otherwise observationally identical
firms that were not benefiting from the policy (control group). This requires to restrict the sample. First,
9
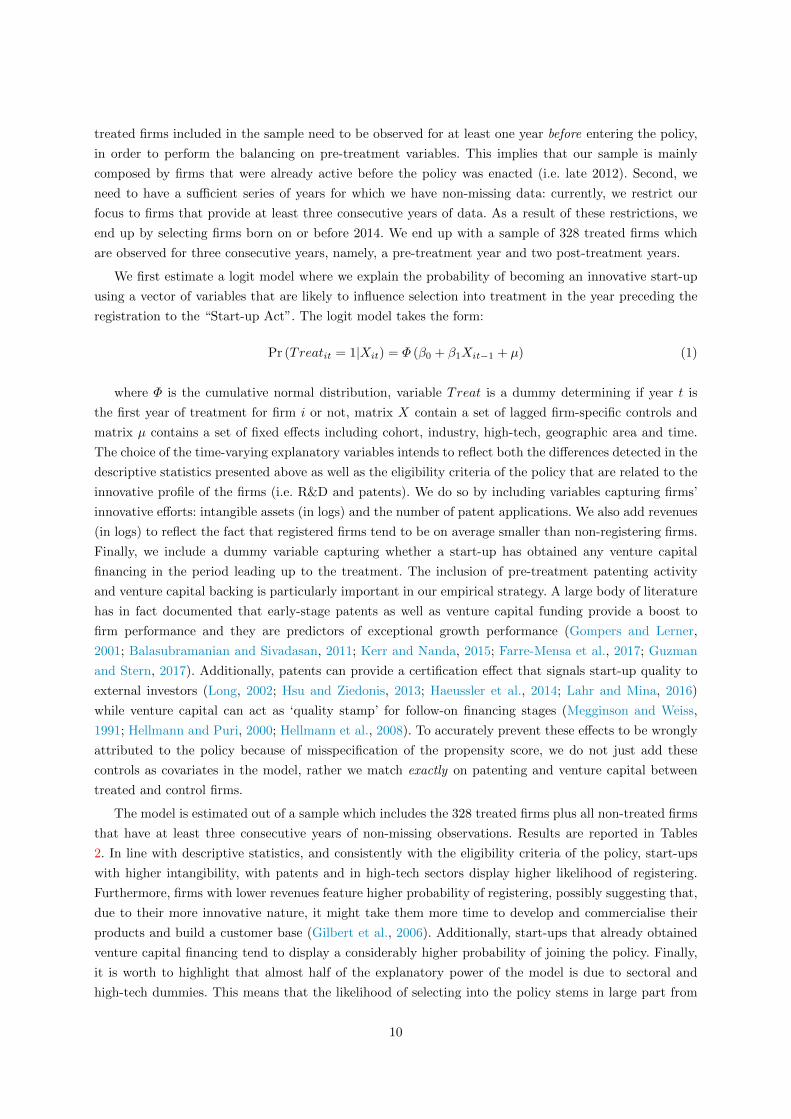
treated firms included in the sample need to be observed for at least one year before entering the policy,
in order to perform the balancing on pre-treatment variables. This implies that our sample is mainly
composed by firms that were already active before the policy was enacted (i.e. late 2012). Second, we
need to have a sufficient series of years for which we have non-missing data: currently, we restrict our
focus to firms that provide at least three consecutive years of data. As a result of these restrictions, we
end up by selecting firms born on or before 2014. We end up with a sample of 328 treated firms which
are observed for three consecutive years, namely, a pre-treatment year and two post-treatment years.
We first estimate a logit model where we explain the probability of becoming an innovative start-up
using a vector of variables that are likely to influence selection into treatment in the year preceding the
registration to the “Start-up Act”. The logit model takes the form:
Pr (Treatit = 1|Xit) = Φ (β0 + β1Xit−1 + µ) (1)
where Φ is the cumulative normal distribution, variable Treat is a dummy determining if year t is
the first year of treatment for firm i or not, matrix X contain a set of lagged firm-specific controls and
matrix µ contains a set of fixed effects including cohort, industry, high-tech, geographic area and time.
The choice of the time-varying explanatory variables intends to reflect both the differences detected in the
descriptive statistics presented above as well as the eligibility criteria of the policy that are related to the
innovative profile of the firms (i.e. R&D and patents). We do so by including variables capturing firms’
innovative efforts: intangible assets (in logs) and the number of patent applications. We also add revenues
(in logs) to reflect the fact that registered firms tend to be on average smaller than non-registering firms.
Finally, we include a dummy variable capturing whether a start-up has obtained any venture capital
financing in the period leading up to the treatment. The inclusion of pre-treatment patenting activity
and venture capital backing is particularly important in our empirical strategy. A large body of literature
has in fact documented that early-stage patents as well as venture capital funding provide a boost to
firm performance and they are predictors of exceptional growth performance (Gompers and Lerner,
2001; Balasubramanian and Sivadasan, 2011; Kerr and Nanda, 2015; Farre-Mensa et al., 2017; Guzman
and Stern, 2017). Additionally, patents can provide a certification effect that signals start-up quality to
external investors (Long, 2002; Hsu and Ziedonis, 2013; Haeussler et al., 2014; Lahr and Mina, 2016)
while venture capital can act as ‘quality stamp’ for follow-on financing stages (Megginson and Weiss,
1991; Hellmann and Puri, 2000; Hellmann et al., 2008). To accurately prevent these effects to be wrongly
attributed to the policy because of misspecification of the propensity score, we do not just add these
controls as covariates in the model, rather we match exactly on patenting and venture capital between
treated and control firms.
The model is estimated out of a sample which includes the 328 treated firms plus all non-treated firms
that have at least three consecutive years of non-missing observations. Results are reported in Tables
2. In line with descriptive statistics, and consistently with the eligibility criteria of the policy, start-ups
with higher intangibility, with patents and in high-tech sectors display higher likelihood of registering.
Furthermore, firms with lower revenues feature higher probability of registering, possibly suggesting that,
due to their more innovative nature, it might take them more time to develop and commercialise their
products and build a customer base (Gilbert et al., 2006). Additionally, start-ups that already obtained
venture capital financing tend to display a considerably higher probability of joining the policy. Finally,
it is worth to highlight that almost half of the explanatory power of the model is due to sectoral and
high-tech dummies. This means that the likelihood of selecting into the policy stems in large part from
10
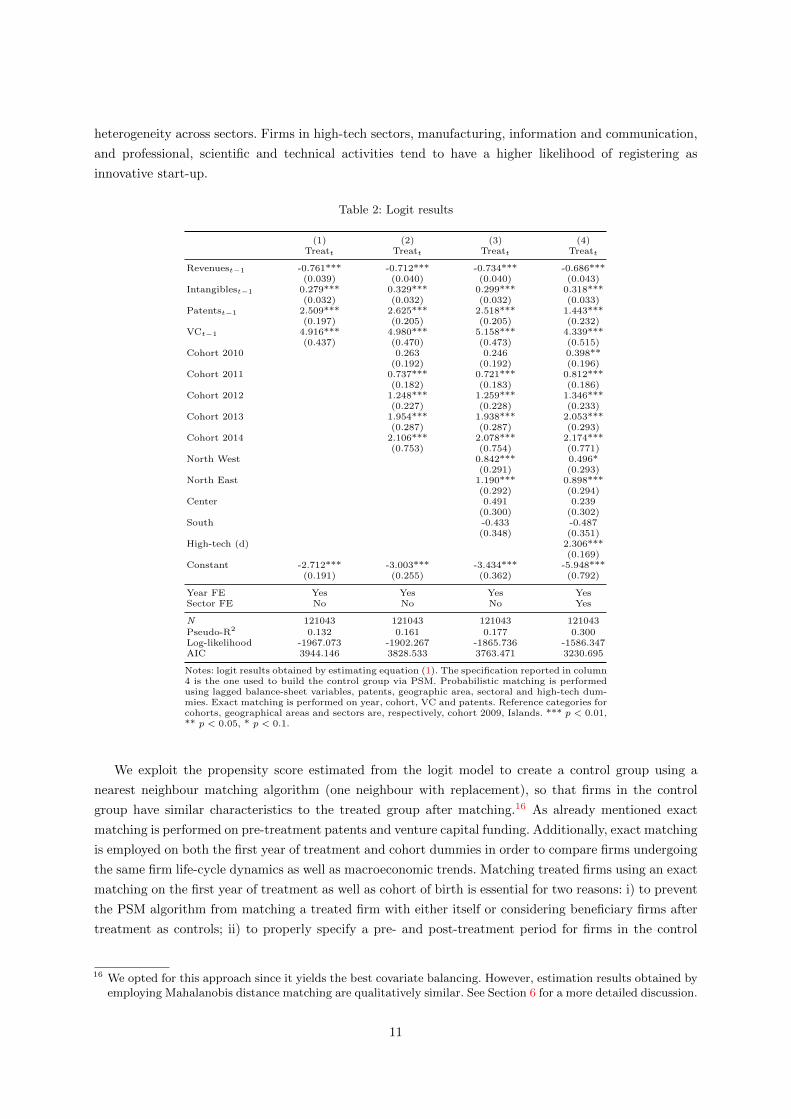
heterogeneity across sectors. Firms in high-tech sectors, manufacturing, information and communication,
and professional, scientific and technical activities tend to have a higher likelihood of registering as
innovative start-up.
Table 2: Logit results
(1) (2) (3) (4)Treatt Treatt Treatt Treatt
Revenuest−1 -0.761*** -0.712*** -0.734*** -0.686***(0.039) (0.040) (0.040) (0.043)
Intangiblest−1 0.279*** 0.329*** 0.299*** 0.318***(0.032) (0.032) (0.032) (0.033)
Patentst−1 2.509*** 2.625*** 2.518*** 1.443***(0.197) (0.205) (0.205) (0.232)
VCt−1 4.916*** 4.980*** 5.158*** 4.339***(0.437) (0.470) (0.473) (0.515)
Cohort 2010 0.263 0.246 0.398**(0.192) (0.192) (0.196)
Cohort 2011 0.737*** 0.721*** 0.812***(0.182) (0.183) (0.186)
Cohort 2012 1.248*** 1.259*** 1.346***(0.227) (0.228) (0.233)
Cohort 2013 1.954*** 1.938*** 2.053***(0.287) (0.287) (0.293)
Cohort 2014 2.106*** 2.078*** 2.174***(0.753) (0.754) (0.771)
North West 0.842*** 0.496*(0.291) (0.293)
North East 1.190*** 0.898***(0.292) (0.294)
Center 0.491 0.239(0.300) (0.302)
South -0.433 -0.487(0.348) (0.351)
High-tech (d) 2.306***(0.169)
Constant -2.712*** -3.003*** -3.434*** -5.948***(0.191) (0.255) (0.362) (0.792)
Year FE Yes Yes Yes YesSector FE No No No Yes
N 121043 121043 121043 121043Pseudo-R2 0.132 0.161 0.177 0.300Log-likelihood -1967.073 -1902.267 -1865.736 -1586.347AIC 3944.146 3828.533 3763.471 3230.695
Notes: logit results obtained by estimating equation (1). The specification reported in column4 is the one used to build the control group via PSM. Probabilistic matching is performedusing lagged balance-sheet variables, patents, geographic area, sectoral and high-tech dum-mies. Exact matching is performed on year, cohort, VC and patents. Reference categories forcohorts, geographical areas and sectors are, respectively, cohort 2009, Islands. *** p < 0.01,** p < 0.05, * p < 0.1.
We exploit the propensity score estimated from the logit model to create a control group using a
nearest neighbour matching algorithm (one neighbour with replacement), so that firms in the control
group have similar characteristics to the treated group after matching.16 As already mentioned exact
matching is performed on pre-treatment patents and venture capital funding. Additionally, exact matching
is employed on both the first year of treatment and cohort dummies in order to compare firms undergoing
the same firm life-cycle dynamics as well as macroeconomic trends. Matching treated firms using an exact
matching on the first year of treatment as well as cohort of birth is essential for two reasons: i) to prevent
the PSM algorithm from matching a treated firm with either itself or considering beneficiary firms after
treatment as controls; ii) to properly specify a pre- and post-treatment period for firms in the control
16 We opted for this approach since it yields the best covariate balancing. However, estimation results obtained byemploying Mahalanobis distance matching are qualitatively similar. See Section 6 for a more detailed discussion.
11

group since the timing of the potential treatment is not defined in their case. The latter condition is needed
in order to properly estimate the difference-in-differences models described in the following section.
Finally, we impose a common support condition to satisfy the overlap assumption, dropping firms in
the treatment group whose propensity score is higher than the maximum or lower than the minimum
score among firms in the control group.
After matching, the matched treated and control groups should display similar characteristics in terms
of observables during the pre-treatment period. In order to assess whether this is the case, we perform a
balancing test, based on the comparison of the standardised differences of means and variances between
treated and control firms. Prior research considers 0.20 as a reasonable threshold for acceptable mean
standardised biases (Rubin, 2001; Stuart, 2010). From the results of the standardised differences before
and after matching, displayed in Table 3, we can appreciate a considerable reduction in standardised
differences thanks to the matching algorithm. All variables feature standardised mean differences close to
0 with the only exception of the high-tech dummy which still lies well below the 0.20 threshold. Summing
up, the matching procedures successfully reduces imbalances between treated and untreated group.
Table 3: Standardised mean differences in raw and matched data
Raw Matched
Means Treated Untreated StdDif Treated Untreated StdDif
Revenuest−1 4.597 5.847 -0.936 4.611 4.527 0.063Intangiblest−1 3.054 2.439 0.332 2.974 2.883 0.049Patentst−1 0.086 0.002 0.434 0.071 0.071 0.000VC (d) 0.037 0.000 0.273 0.003 0.003 0.000North West 0.348 0.281 0.144 0.335 0.288 0.103North East 0.329 0.198 0.300 0.339 0.332 0.015Center 0.210 0.249 -0.091 0.214 0.240 -0.061South 0.067 0.199 -0.397 0.070 0.093 -0.067Islands 0.046 0.073 -0.115 0.042 0.048 -0.027Agriculture 0.000 0.018 -0.193 0.000 0.000 0.000Mining and quarrying 0.000 0.001 -0.039 0.000 0.000 0.000Manufacturing 0.259 0.159 0.248 0.262 0.256 0.016Electricity and gas 0.006 0.033 -0.195 0.006 0.003 0.023Water supply 0.003 0.006 -0.049 0.003 0.000 0.047Construction 0.006 0.118 -0.476 0.006 0.003 0.014Wholesale and retail 0.058 0.259 -0.573 0.058 0.070 -0.036Transportation 0.009 0.049 -0.238 0.010 0.003 0.038Accommodation and food 0.000 0.085 -0.432 0.000 0.000 0.000Information and communication 0.302 0.049 0.703 0.284 0.284 0.000Financial and insurance services 0.003 0.009 -0.081 0.003 0.000 0.041Real estate 0.000 0.013 -0.164 0.000 0.000 0.000Professional, scientific activities 0.311 0.079 0.610 0.323 0.339 -0.042Administrative services 0.021 0.045 -0.133 0.022 0.019 0.018Education 0.009 0.012 -0.026 0.010 0.016 -0.063Health and social services 0.006 0.023 -0.142 0.006 0.000 0.053Arts and entertainment 0.006 0.040 -0.228 0.006 0.006 0.000High-tech 0.521 0.055 1.200 0.508 0.460 0.123Cohort 2009 0.140 0.337 -0.475 0.141 0.141 0.000Cohort 2010 0.235 0.293 -0.132 0.236 0.236 0.000Cohort 2011 0.348 0.193 0.352 0.345 0.345 0.000Cohort 2012 0.171 0.119 0.146 0.166 0.166 0.000Cohort 2013 0.101 0.054 0.174 0.105 0.105 0.000Cohort 2014 0.006 0.003 0.050 0.006 0.006 0.0002010 0.000 0.005 -0.099 0.000 0.000 0.0002011 0.000 0.096 -0.462 0.000 0.000 0.0002012 0.000 0.179 -0.660 0.000 0.000 0.0002013 0.561 0.229 0.721 0.562 0.562 0.0002014 0.253 0.269 -0.036 0.243 0.243 0.0002015 0.186 0.222 -0.090 0.195 0.195 0.000
Notes: the table reports standardized mean differences for raw and matched samples. Thecontrol group is obtained via Propensity Score Nearest Neighbour Matching (1 neighbourwith replacement) based on the logit regression reported in Table 2 in column 4.
12

4.2 Difference-in-differences
Treated and non-treated firms might still differ with regard to unobservable confounders which (i) are
not perfectly correlated with observables, and (ii) are correlated with observables which are unbalanced
between the treated and non-treated firms. In order to control for any residual differences between financed
and rejected firms in unobservable firm characteristics that are fixed over time, we use the matched treated
and control groups and exploit the longitudinal nature of our data to run a difference-in-differences
estimation. By doing so, the effect of the “Start-up Act” is represented by the change in the difference in
firms’ outcome between recipient and non-recipient firms before and after the policy. Operationally, the
estimation is based on the following model:
Yit = α+ β1Postit + β2(Treati × Postit) +Xit + ηi + ψrt + τt + εit (2)
where Yit is a given outcome variable observed for firm i at time t, Postit is a dummy defining the
post-treatment period, Treati is a dummy equal to one if the firm is registered to the policy, ηi are firm
fixed-effects.17 The vector Xit includes firm age and age squared (in logs) along with a set of province-
level controls (GDP per capita, unemployment rate and population) in both levels and growth rates to
account for heterogeneity in local economic conditions.18 Furthermore, ψrt and τt indicate macro area-
time and time fixed effects which absorb any shock in a particular macro region during a given year and
macroeconomic factors, respectively. The coefficient of interest is β2 which represents the ATT. Standard
errors are clustered at firm level to account for the possibility of correlations across observations of the
same firm in different years.
These absorb any shock to demand or to technology, which happens in a particular sector, in a
particular geographic area during a given year.
We further assess the magnitude of the treatment impact for the two post-treatment years by esti-
mating the extended DID specification:
Yit = α+ γ1Posti,t=1 + γ2Posti,t=2 + γ3(Treati × Posti,t=1)+
γ4(Treati × Posti,t=2) +Xit + ηi + ψrt + τt + εit(3)
where γ3 and γ4 correspond to the ATT for years t = 1, and t = 2, respectively.19
4.3 Instrumental variable
The validity of the baseline empirical strategy combining PSM and DID rests on the conditional-independence
assumption which requires that, once we condition on observables and fixed effects, participation in the
policy is “as good as random”. In our setting, this assumption can be violated if idiosyncratic exogenous
shocks at the firm-level drive both the sudden increase in performance and the likelihood for a company
to register into the policy. While the direction of the shock is not clear a priori, it is plausibly positive:
differently from the start-ups in our control group, treated start-ups might enroll into the “Start-up Act”
17 The standalone time-invariant variable Treati is absorbed by the firm-specific fixed effects. Conversely, Postitis identified since firms register into the policy in different years.
18 Data are drawn from Eurostat (Regional Statistics) available at https://ec.europa.eu/eurostat/web/
regions/data/database.19 We perform a series of additional tests to ensure the robustness of our DID models into several directions. For
instance, we cluster standard errors at a more aggregated level (e.g. province-level), we augment the baselinespecification with a full set of sector-regions-year fixed effects to account for systematic differences across timewithin sectors and geographical areas. These are discussed in more detail in Section6.
13

due to an available investment project or idea, a change in growth orientation, or simply because they are
better informed about the policy. We therefore develop an IV strategy based on geographical variation
in the treatment probabilities (Brown and Earle, 2017; Caliendo and Tubbicke, 2019) to reach consistent
estimates.
The IV approach exploits the spotty diffusion of the policy across the 110 Italian provinces (equivalent
to the Eurostat “NUTS3” territorial classification). Figure 1 indeed shows that the share of firms that
obtained the “innovative start-ups” status over the total number of firms that appear to be eligible
based on age and size criteria is highly variables across the Italian territory, even within regions (the
administrative spatial unit above the province in Italy). For instance, while northern regions are generally
characterized by a higher share on average if compared with southern ones, there is also a notable within-
region heterogeneity that is detected in both northern (e.g. Lombardy and Tuscany) and southern regions
(e.g. Calabria and Sardinia). This is surprising, as provinces in Italy have limited political autonomy and
their borders typically have very little economic meaning. Also, the differences do not seem to reflect a
urban/rural divide, as provinces hosting the largest urban agglomerations (Rome, Milan, Turin, Naples)
show different values among them, and do not stand out compared to other provinces.
Fig. 1: Share of treated firms by province
Notes: the map depicts the share of treated firms across Italian provinces in 2013. This is computed asthe ratio of the number of treated firms over all firms below 5 years of age and 5 million revenues in eachprovince. Bold lines represent regional borders.
Discussions with practitioners and experts revealed that this variability is at least partially due to
a specific provision of the program, which requires local Chambers of Commerce (CC) to deliberate on
14

whether the start-up official mission statement, registered at incorporation, is “innovation oriented”. CC
territorial competence fully overlaps provinces’ areas. Given its discretionary nature, this requirement has
been interpreted rather differently by the boards of the CC during the first years of policy. Reflecting this,
on February 14th 2017, an official clarification document (“circolare”) of the Italian Ministry of Economic
Development asserts that the requirement related to the mission statement is the one that attracted
most requests for clarifications.20 The same document provides clarifications on the interpretation of that
provision aimed at ensuring more homogeneity in the judgement across the Italian territory. Therefore,
for the policy period under scrutiny in this paper (2013-16), the heterogeneous approach of local CC
boards in deciding whether a mission statement is innovation-oriented may be used to build a valid
instrumental variable, i.e., a variable that is correlated with the endogenous treatment, but which has no
independent effect on the dependent variables (conditional firm fixed effects that absorb all time-invariant
province characteristics and additional time-variant controls). While we do not observe the actual mission
statements and we cannot therefore assess the degree of selectivity of CC boards, we can use the share
of registered start-ups at the province (CC) level as a valid proxy. As discussed above, this variable does
indeed show a fair amount of variability across provinces.
We then compute the share of treated firms over all firms below 5 years of age and 5 million revenues in
each province in 2013 (Sharep), which is arguably the year when arbitrary choices by local Chamber of
Commerce were more common, and use it interacted with Postt as an instrument for Treati × Postit in
(2).
To test the validity of our instrument and to increase the efficiency of the IV, we exploit the approach
developed by Lewbel (2012), which generates additional instrumental variables from the error structure
of the first-stage. To get an intuition of this methodology, consider the initial first-stage equation:
(Treati × Postit) = α+ γ1Postit + γ2(Sharep × Postit) +Xit + ηi + ψrt + τt + ε2 (4)
Lewbel (2012) shows that, under the assumptions that the error term in the first stage is heteroskedastic
and that a subset Zit of controls Xit are uncorrelated with the product of the error terms in the first and
second stage, one can construct additional instruments of the form (Zit − Zit)ε2 to be included in the
first-stage equation. The first assumption is directly testable with a Breusch-Pagan test, and in our case
the null of homoskedasticity is largely rejected (p < 0.00001); the second assumption can be test with
a Hansen-type test, as the the model is over-identified: in our case it safely fails to reject the null that
overidentifying restrictions are valid.
The Lewbel estimator readily applies to the case when when the endogenous variable is binary (Lewbel,
2018) and it has been recently applied in similar settings by Heim et al. (2017), Comin et al. (2019), and
Czarnitzki et al. (2020). As stressed by Lewbel (2012, 2018), this approach is particularly appropriate
when other instruments with a weaker first stage statistics are available, as is the case here. Moreover,
and most importantly in our setting, the instruments created allow to perform an over-identification test
on the exclusion restriction imposed to the share of treated firms in 2013 (in particular, with an Hayashi
C test).
20 Ministero dello Sviluppo Economico, Circolare N. 3696/C, 14 February 2017, avail-able on-line (in Italian) at https://www.mise.gov.it/images/stories/normativa/
Circolare-startup-e-PMI-innovative-14-02-2017.pdf.
15

As for the DID estimation, we also investigate the effects of the policy separately for the first two
treatment periods, instrumenting (Treati×Posti,t=1) and (Treati×Posti,t=2) with (Sharei×Posti,t=1)
and (Sharei × Posti,t=2).
A potential flaw in the validity of the instrumental variable is that the decisions of the CC boards
may in part reflect local economic conditions. To take this into account, as in the DID specifications
we include the following time-variant controls at province-level: unemployment rate, total population,
and GDP per capita. These are inserted in the models in log terms and annual log differences to take
into account the heterogeneity in local economic conditions across provinces in both levels and trends.
In addition, the inclusion of firm fixed effects in all specifications implies that all time-invariant province
characteristics over the six-year period are controlled for (as the few firms that change province during
the period of analysis are excluded from the sample).
Aside from providing statistical evidence of its validity through Hansen-type tests, in Section 6 we also
test the robustness of our IV strategy in several additional directions: we provide a falsification test using
data from years preceding the introduction of the policy, we augment the empirical specification with
additional control variables to test for stability of our estimates, and we exploit alternative definitions of
the instrument.
5 Results
5.1 The effects of the policy on firm activity
This section displays the results obtained following the empirical strategy outlined in the previous section.
We start by reporting the baseline DID and subsequently move to the IV estimates.
Panel A of Table 4 shows the results of equations (2) and (3) for various dependent variables without
using the instrumental variables. The first two estimated effects are related to output: the policy induces
a statistically significant increase in employment (15 per cent) and value added (28 per cent). The impact
on fixed capital is large, positive, and significant, ultimately driving the positive impact on assets (39
and 20 per cent, respectively). The remaining rows present the treatment effects across the first two year
of the policy. They show that the overall impact is driven by the effects accrued during the second year
since registering to the start-up registry. This is especially the case for revenues, for which we observe a
non statistically significant effect during the first year while the effect is large and statistically different
from zero during the second year (20 per cent increase).
Panel B of Table 4 reports estimation results concerning the effects of the policy on firms’ financial
structure and innovative behaviour. Concerning the latter dimension, the rise in fixed capital mainly
stem from intangible assets (66 per cent increase), indicating that firms tend to allocate more resources
to innovative activities.
We also find that the policy improves the probability of applying for a patent to the EPO by 2
percentage points in the three years after joining the policy. With respect to the financial structure, we
find a positive effects on the bank debt over assets, and a positive effect on equity which is consistent with
the increase in total financial assets. Finally, we report the effects on firm failure on the subsequent three
years since joining the policy. We find that the “Start-up Act” does not have any statistically significant
effect on firm failure.
Results from the two-stage least square (2SLS) estimations using the IV strategy described in Section 4
broadly confirm the baseline findings. Yet, the IV estimates suggest an overall smaller effect of the “Start-
up Act” with coefficients that are generally of lower magnitude with respect to the baseline estimates.
16

Table 4: DID estimates
Panel A Revenues Employees Assets Fixed K Value Added
Treat x Post 0.077 0.152*** 0.198*** 0.385*** 0.275***(0.070) (0.054) (0.041) (0.066) (0.081)
Treat x Postt=1 -0.044 0.113** 0.120*** 0.282*** 0.161**(0.066) (0.053) (0.037) (0.061) (0.081)
Treat x Postt=2 0.200** 0.205*** 0.276*** 0.490*** 0.395***(0.085) (0.065) (0.051) (0.077) (0.094)
Post Yes Yes Yes Yes YesYear FE Yes Yes Yes Yes YesFirm FE Yes Yes Yes Yes YesN 1836 913 1836 1836 1569
Panel B Leverage Equity Intangibles Patent Failure
Treat x Post 0.020** 0.177*** 0.661*** 0.020** 0.004(0.010) (0.057) (0.085) (0.008) (0.013)
Treat x Postt=1 0.009 0.111** 0.489*** 0.020** 0.004(0.010) (0.053) (0.079) (0.008) (0.013)
Treat x Postt=2 0.031** 0.245*** 0.835***(0.013) (0.073) (0.102)
Post Yes Yes Yes Yes YesYear FE Yes Yes Yes Yes YesFirm FE Yes Yes Yes Yes YesN 1836 1836 1836 1224 1224
Notes: in each panel the first row reports average treatment effects obtained via equation (2). The secondand third rows report heterogeneous treatment effects across the first two years obtained via equation(3). Continuous dependent variables are in log form and are winsorized at 2% on both sides of thedistribution to mitigate the influence of outliers. Patent is a dummy variable indicating whether firmsapply for patents in the three years after treatment. Failure indicates whether a firm fails in the threeyears after treatment. Models include firm, geographic area-time and time fixed effects, (log) age and agesquared, province-level population, unemployment, GDP per capita, in both levels and annual growthrates. Standard errors clustered at the firm-level. *** p < 0.01, ** p < 0.05, * p < 0.1.
This indicates the presence of a positive shock, that is, start-ups registering the the “Start-up Act” tend
to have unobserved prospects that are relatively better than those of control start-ups. In more detail,
we observe that the coefficient on patenting preserves the positive sign but decreases by roughly one
half and loses statistically significance. A similar pattern emerges for employment and leverage, yet a
positive and statistically significant effect is still detectable after the first year of the registration into
the policy. Table 5 displays the results for our set of firm-level performance measures along with first
stage F -statistic and Hansen J test for over-identifying restrictions. The first stage F -statistic is always
considerably above the critical lower bound suggested by Stock et al. (2002) whereas the Hansen J does
not reject the over-identifying restrictions except for intangibles.
5.2 Does the policy alleviate financial frictions?
The positive effects of the “Start-up Act” reported in the previous section imply that some kind of
market friction is impeding innovative start-ups to exploit their growth opportunities, absent the policy.
An extensive literature has documented that financial frictions are particularly problematic for small and
young innovative firms (Hall and Lerner, 2010; Kerr and Nanda, 2015). This is one of the reasons why
governments support these type of firms, that is, to help financially vulnerable firms accessing external
resources to carry out their investment projects they otherwise would not be able to pursue. The “Start-
up Act” encompasses two instruments explicitly aimed at easing access to external finance: (i) a fiscal
incentive for venture capitalists and outside investors who invest in equity capital and (ii) privileged
access to a public scheme bank loan program. The former entails a tax incentive to private investors
who invest in start-ups amounting to 30 per cent, with maximum limit of 1.8 million euros. The latter
allows innovative newborn firms a fast-track, simplified and free-of-charge access to the Guarantee Fund
17
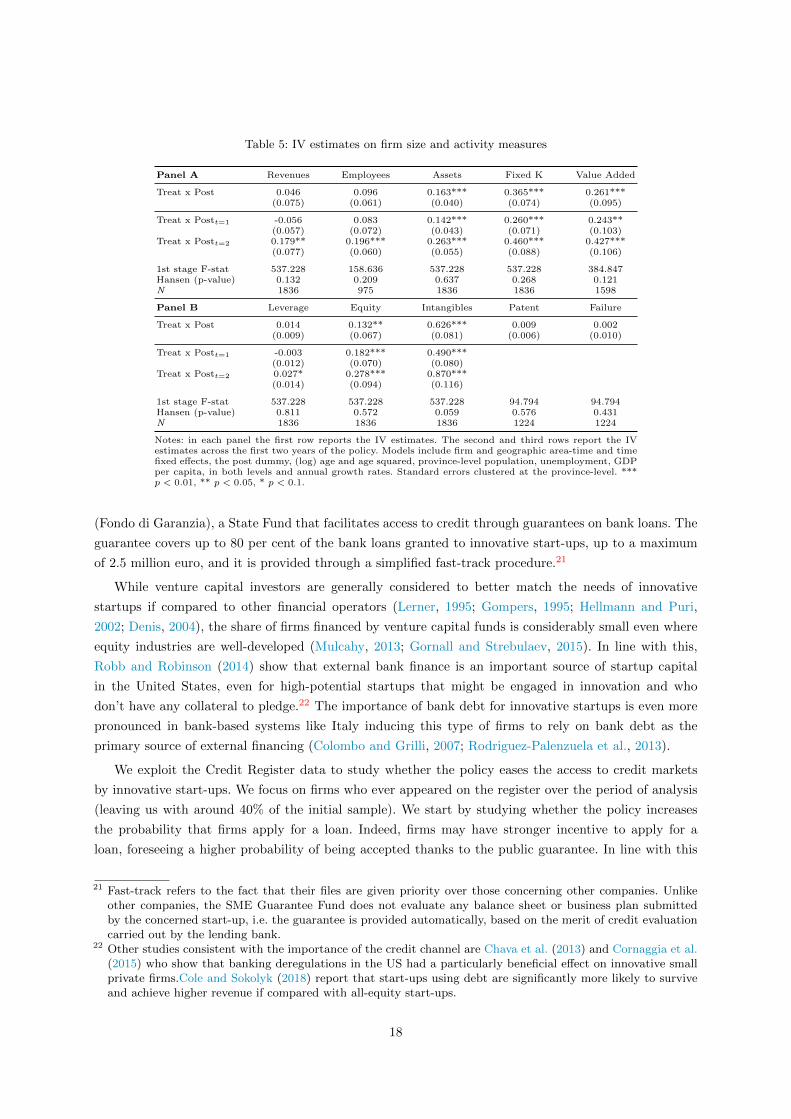
Table 5: IV estimates on firm size and activity measures
Panel A Revenues Employees Assets Fixed K Value Added
Treat x Post 0.046 0.096 0.163*** 0.365*** 0.261***(0.075) (0.061) (0.040) (0.074) (0.095)
Treat x Postt=1 -0.056 0.083 0.142*** 0.260*** 0.243**(0.057) (0.072) (0.043) (0.071) (0.103)
Treat x Postt=2 0.179** 0.196*** 0.263*** 0.460*** 0.427***(0.077) (0.060) (0.055) (0.088) (0.106)
1st stage F-stat 537.228 158.636 537.228 537.228 384.847Hansen (p-value) 0.132 0.209 0.637 0.268 0.121N 1836 975 1836 1836 1598
Panel B Leverage Equity Intangibles Patent Failure
Treat x Post 0.014 0.132** 0.626*** 0.009 0.002(0.009) (0.067) (0.081) (0.006) (0.010)
Treat x Postt=1 -0.003 0.182*** 0.490***(0.012) (0.070) (0.080)
Treat x Postt=2 0.027* 0.278*** 0.870***(0.014) (0.094) (0.116)
1st stage F-stat 537.228 537.228 537.228 94.794 94.794Hansen (p-value) 0.811 0.572 0.059 0.576 0.431N 1836 1836 1836 1224 1224
Notes: in each panel the first row reports the IV estimates. The second and third rows report the IVestimates across the first two years of the policy. Models include firm and geographic area-time and timefixed effects, the post dummy, (log) age and age squared, province-level population, unemployment, GDPper capita, in both levels and annual growth rates. Standard errors clustered at the province-level. ***p < 0.01, ** p < 0.05, * p < 0.1.
(Fondo di Garanzia), a State Fund that facilitates access to credit through guarantees on bank loans. The
guarantee covers up to 80 per cent of the bank loans granted to innovative start-ups, up to a maximum
of 2.5 million euro, and it is provided through a simplified fast-track procedure.21
While venture capital investors are generally considered to better match the needs of innovative
startups if compared to other financial operators (Lerner, 1995; Gompers, 1995; Hellmann and Puri,
2002; Denis, 2004), the share of firms financed by venture capital funds is considerably small even where
equity industries are well-developed (Mulcahy, 2013; Gornall and Strebulaev, 2015). In line with this,
Robb and Robinson (2014) show that external bank finance is an important source of startup capital
in the United States, even for high-potential startups that might be engaged in innovation and who
don’t have any collateral to pledge.22 The importance of bank debt for innovative startups is even more
pronounced in bank-based systems like Italy inducing this type of firms to rely on bank debt as the
primary source of external financing (Colombo and Grilli, 2007; Rodriguez-Palenzuela et al., 2013).
We exploit the Credit Register data to study whether the policy eases the access to credit markets
by innovative start-ups. We focus on firms who ever appeared on the register over the period of analysis
(leaving us with around 40% of the initial sample). We start by studying whether the policy increases
the probability that firms apply for a loan. Indeed, firms may have stronger incentive to apply for a
loan, foreseeing a higher probability of being accepted thanks to the public guarantee. In line with this
21 Fast-track refers to the fact that their files are given priority over those concerning other companies. Unlikeother companies, the SME Guarantee Fund does not evaluate any balance sheet or business plan submittedby the concerned start-up, i.e. the guarantee is provided automatically, based on the merit of credit evaluationcarried out by the lending bank.
22 Other studies consistent with the importance of the credit channel are Chava et al. (2013) and Cornaggia et al.(2015) who show that banking deregulations in the US had a particularly beneficial effect on innovative smallprivate firms.Cole and Sokolyk (2018) report that start-ups using debt are significantly more likely to surviveand achieve higher revenue if compared with all-equity start-ups.
18

conjecture, the IV result of Table 6 shows that the policy induces a 13 percent higher probability of
applying for credit.
Second, we study the probability that the first loan application made by the firm is accepted by
the bank. Focusing on the first application ever made by the startups during the period of analysis is
particularly relevant for at least two reasons. It represents the moment in which information frictions
between banks and firms are stronger, as the firm lacks any credit history. Moreover, according to the
regulation of the Credit Register, the result of a credit application remains common knowledge among
banks for up to six months: the result of the first application may have significant spillover effects
on subsequent applications by the firm to other banks (Albertazzi et al., 2014). These spillover effects
may also generate severe identification issues (due to endogenous selection of applicants) in studying
subsequent applications. Results show a significant effect on the probability of acceptance, which increases
by more than 36% as a result of the policy. Conversely the quantity of credit granted, conditional on
having an application accepted, does not increase: the positive effect identified by the simpler PSM-DID
model is found to be spurious once we implement the IV strategy.
Table 6: Effect of the policy on access to credit
Prob. of Applying Prob. of Acceptance (Log) Quantity of Credit
DID IV DID IV DID IV
Treat x Post 0.031 0.132** 0.310** 0.366*** 0.483*** -0.168(0.098) (0.062) (0.089) (0.151) (0.170) (0.209)
1st stage F-stat 161.233 35.732 74.001Hansen (p-value) 0.275 0.408 0.382N 731 731 215 215 215 215
Notes: Estimation results using DID and IV estimations. All regressions include firm, area-time fixedeffects, the post dummy, (log) age and age squared, province-level population, unemployment, GDP percapita, in both levels and annual growth rates. Standard errors clustered at the firm-level for the DIDmodels and at the province-level for the IV. *** p < 0.01, ** p < 0.05, * p < 0.1.
We next examine the impact of the second instrument aimed at favouring access to external finance,
namely, the fiscal incentives for venture capitalists who invest in the equity of innovative start-ups. A
large literature has in fact documented that venture capital is beneficial to the performance of early
stage innovative entrepreneurs (Kortum and Lerner, 2000; Hellmann and Puri, 2000; Bertoni et al., 2011;
Puri and Zarutskie, 2012; Bronzini et al., 2019). To this end, we estimate the effect of the “Start-up
Act” on venture capital financing using AIFI data on the universe of VC deals in Italy. In more detail,
the dependent variable employed is a (time-invariant) dummy indicating with 1 a start-up experiences
a VC injection by 2018, and 0 otherwise. Table 7 reports the results of the DID model (column 1)
and the IV model (column 2) and indicate that the policy increases the likelihood of obtaining VC by
3.1-3.5 percentage points. This represents a substantial effect in economic terms given that the average
probability of VC financing for treated firms before the policy was 2%.
To sum up, incentives to both debt and equity represent effective policy tools facilitating access to
bank and equity finance for a segment of the private sector usually characterized by difficulties in securing
external resources.
6 Robustness
This section presents an alternative identification strategy along with a series of sensitivity tests of our
baseline model. We first discuss a falsification test of our an IV approach and then the robustness tests
19

Table 7: Effect of the policy on VC financing
Prob. of VC financing
DID IV
Treat x Post 0.035*** 0.031**(0.010) (0.013)
1st stage F-stat 57.019Hansen (p-value) 0.287N 1244 1224
Notes: VC is a dummy variable indicating whether afirm receives venture capital financing by 2018. Stan-dard errors clustered at the firm-level for the DIDestimation and at the province-level for the IV. ***p < 0.01, ** p < 0.05, * p < 0.1.
for both the matching strategy as well as for alternative specifications of the baseline and IV models.
6.1 Falsification
We run a falsification test to corroborate the validity of the exclusion restrictions for the exogenous in-
strument based on province-level shares of treated companies. The falsification test consists in regressing
the full set of outcome variables on the instrumental variable using a sample that predates the implemen-
tation of the policy. The specification of these regressions are identical to those employed to obtain the
baseline estimates, and therefore mirrors the second-stage estimates of the 2SLS. The intuition underlying
this exercise is the following: if the instrumental variable is affecting the outcome only via the endoge-
nous treatment, then it should be uncorrelated with the outcomes before the treatment was designed.
The falsification regressions show that the coefficients on the instrumental variable are never significant,
supporting the assumption that is correctly excluded from the second stage of the 2SLS estimates.
The first step of the falsification test is the construction of the dataset. We use the same sources and
variables that we used for the main sample, but instead of extracting data for the time period 2009-
2016, we extract data for the period 2006-2011. We then restrict the sample to eligible firms, following
exactly the same procedure used for the main sample, and we randomly allocate treatment to 328 firms,
replicating the same timing of entry into treatment observed in the main sample, but with a five-year
shift: entry into treatment is takes place in 2013-2014-2015 in the main sample, and in 2008-2009-2010
in the falsification sample. The proportion of firms entering into treatment in the first, second, or third
year, respectively, is identical in the two samples.
The second step consists in replicating the PSM. This procedure is straightforward as it mirrors the
approach used for the main sample. Unsurprisingly, given that treatment is random, the matching delivers
on average fully balanced sub-samples and the ATT is equal to zero. The falsification sample is restricted
to treatment and control groups resulting from the matching.
The third step consists in regressing each outcome variables used in the baseline estimates on the
instrumental variable described in Section 4. These regressions contain the same set of control variables
and fixed effects of the baseline estimates, and apply the same econometric methods.
Steps one to three are repeated 100 times, and at each time the t-test on the significance of the
coefficient on the instrumental variable is stored. We therefore collect the full distribution of coefficients
under different random allocations of the treatment variable in step one. Applying a 5% confidence
interval, we consider the IV strategy validated by the falsification test if the null hypothesis is rejected
20

Table 8: Falsification test - summary of Monte-Carlo iterations
Dependent variable Share of p-value < 0.05 Mean p-value
Revenues 0.05 0.48Employment 0.03 0.52Assets 0.00 0.52Equity 0.04 0.53Value added 0.02 0.43Leverage 0.04 0.52Net worth 0.04 0.54Intangibles 0.04 0.52
Notes: For each dependent variable, the table reports the average value of thet-test and of the p-value across 100 iterations of the falsification tests.
with a 5% confidence interval at least 95% of times. The results, reported in Table 8, show that indeed
none of the coefficients is statistically significant more than 5 per cent of times.
6.2 Alternative matching and specifications
King and Nielsen (2019) argue that PSM can be subject to a series of shortcomings compared with other
matching techniques. We therefore employ Mahalanobis distance matching (MDM) to build an alternative
matched sample. Table A2 displays balancing tests while estimation results are reported in Table A3.
Balancing tests show good properties and results do not show particular variations if compared with the
models estimated using the control group built via PSM.
We also test the robustness of our results by augmenting our specifications with additional control
variables. In the baseline models we control for several covariates capturing local economic conditions in
both levels and growth rates. To further account for differences across provinces, we consider controls
addressing potential heterogeneity in business dynamics in innovative sectors. Indeed, it might well be
that provinces with similar economic conditions feature different industrial structures with a more or
less pervasive presence of innovative start-ups. To this end, we employ province-level data from Eurostat
which refer to the three sectors whit the highest shares of registered start-ups, namely, manufacturing,
ICT, and professional and scientific activities.23 In more detail, the variables are: the number of new
enterprises, the number of active firms, the share of 3 years’ old firms over the business population,
the average size of new enterprises, and the number of high-growth firms. Results of these augmented
specifications are reported in Table A5. While estimates tend to display similar patterns, we observe that
the positive effect on employment and leverage gains statistical significance at the 10% in the IV models.
Overall, these results provide an assessment that is largely consistent with the one stemming from our
baseline models.
The instrument used in the main specification is the share of registered innovative start-ups over
the number of active firms younger than 5 years old and 5 million revenues at the province-level. One
potential shortcoming of such shares is that the denominator captures firms that are indeed young and
small but operating in sectors with a low innovation propensity and, hence, lower chances to feature
start-ups with the required eligibility criteria. We test the robustness of the IV estimates by employing
an alternative definition of such shares. We calculate the shares by using a different denominator: the
number of active firms in those sectors featuring the highest shares of registered start-ups. These are
manufacturing, ICT, and professional and scientific activities and together they account for roughly 90%
23 Province-level (NUTS3) data are drawn from Eurostat (Business Demography Statistics), and areaccessible at https://ec.europa.eu/eurostat/web/structural-business-statistics/entrepreneurship/
business-demography.
21

of all registered start-ups (see Table 1). Opting for this alternative definition of the shares does not imply
any meaningful change in estimation results (see Table A7).
7 Conclusion
The paper provides a comprehensive evaluation on the effects of the Italian “Start-up Act”. The extensive
regulatory framework, implemented at the end of 2012, aims to create a more favourable environment for
small innovative start-ups. The examination of the “Start-up Act” is a useful exercise to inform policies
for innovative entrepreneurship across the globe, particularly since the support to innovative start-ups
is a policy priority in many countries. In fact, during the last decades, a number of countries have been
adopting national Start-up frameworks though evidence on these initiatives remains scarce (Audretsch
et al., 2019).
The analysis shows that the policy triggers an overall positive effect on firm performance, especially
concerning the input side. Indeed, we find that treated start-ups exhibit a substantial increase in terms of
total assets, driven by fixed assets, and in particular intangible assets which are an essential input of the
innovative process and are usually suffer from financial frictions. Furthermore, the results indicate positive
effects in terms of value added and employment and (albeit statistically weaker) effect on employment
and revenues. Conversely, we do not find any effect on patenting propensity nor survival chances.
The paper also documents that the policy has been effective in curbing the financial frictions charac-
terizing innovative start-ups. On one hand, thanks to the provision of a public guarantee scheme, their
access to bank debt improves, as measured by the higher probability of loan application acceptance and
by the larger quantity of credit received upon acceptance. These firms also obtain a lower interest rate on
credit. On the other, the presence of equity incentives, triggers an increase in the probability of receiving
venture capital injections.
These results show the importance of providing complementary measures to support the access to
external finance for innovative start-ups, in order to let them select themselves into the financing instru-
ments that are more appropriated for their expansion strategy.
While the empirical analysis finds positive effects from the use of guaranteed loans, it is nevertheless
important to strike the right balance between equity and debt financing. While start-ups appear to benefit
from the public guarantee fund for bank loans, the economic literature suggests that equity financing is
more suited to high-growth and high-risk innovative start-ups. The provision of debt guarantees should
therefore be closely monitored and evaluated, not only because it employs a substantial amount of public
capital, but also in order to avoid the risk that easier access to credit, relative to equity, might induce
high potential start-ups to opt for a slower growth path, based on debt financing rather than on equity
injections.
The incentives for equity financing also deserves further discussion. While their provision seems effec-
tive in stimulating venture capital injections, it is nonetheless insufficient to kick-start a thriving venture
capital ecosystem in Italy where this industry is still lagging behind those of other OECD countries.
Therefore, it could be useful to assess the need for further public investments in VC by exploring a bolder
commitment and sponsorship of existing and newly-established government-backed matching funds and
funds-of-funds. Recent policy developments appear to go in such direction.24
Finally, it is worth highlighting a series of interesting aspects that are not addressed in the present
analysis and that future research could focus on. The first is the long-term effects of the “Start-up Act”
24 https://www.mise.gov.it/index.php/en/202-news-english/2039363-the-national-innovation-fund-unveiled.
22

on the economic performance of beneficiary firms. The second one is the potential impact that the policy
has on lowering barriers to entry thus stimulating the establishment of innovative start-ups that would
have not been born without the policy. Assessing the presence of the latter effects would be of great
importance although empirically challenging.
23

Bibliography
Aghion, P., Blundell, R., Griffith, R., Howitt, P., and Prantl, S. (2009). The effects of entry on incumbent
innovation and productivity. The Review of Economics and Statistics, 91(1):20–32.
Albertazzi, U., Bottero, M., and Sene, G. (2014). Sharing information on lending decisions: an empirical assess-
ment. Technical Report 980, Banca d’Italia.
Alon, T., Berger, D., Dent, R., and Pugsley, B. (2018). Older and slower: The startup deficit’s lasting effects on
aggregate productivity growth. Journal of Monetary Economics, 93:68 – 85.
Amici, M., Giacomelli, S., Manaresi, F., and Tonello, M. (2016). Red tape reduction and firm entry: New evidence
from an Italian reform. Economics Letters, 146:24–27.
Audretsch, D., Colombelli, A., Grilli, L., and Minola Tommaso, R. E. (2019). Innovative start- ups and policy
initiatives: heterogeneity, impact and implications. Research Policy.
Audretsch, D. B., Keilbach, M. C., and Lehmann, E. E. (2006). Entrepreneurship and economic growth. Oxford
University Press.
Autio, E. and Rannikko, H. (2016). Retaining winners: Can policy boost high-growth entrepreneurship? Research
policy, 45(1):42–55.
Balasubramanian, N. and Sivadasan, J. (2011). What happens when firms patent? new evidence from us economic
census data. The Review of Economics and Statistics, 93(1):126–146.
Bertoni, F., Colombo, M. G., and Grilli, L. (2011). Venture capital financing and the growth of high-tech start-ups:
Disentangling treatment from selection effects. Research policy, 40(7):1028–1043.
Bertoni, F., Colombo, M. G., and Quas, A. (2015). The patterns of venture capital investment in europe. Small
business economics, 45(3):543–560.
Bronzini, R., Caramellino, G., and Magri, S. (2019). Venture capitalists at work: A diff-in-diff approach at
late-stages of the screening process. Journal of Business Venturing, page 105968.
Bronzini, R. and Iachini, E. (2014). Are incentives for r&d effective? evidence from a regression discontinuity
approach. American Economic Journal: Economic Policy, 6(4):100–134.
Brown, J. D. and Earle, J. S. (2017). Finance and growth at the firm level: Evidence from sba loans. The Journal
of Finance, 72(3):1039–1080.
Bugamelli, M., Lotti, F., Amici, M., Ciapanna, E., Colonna, F., D’Amuri, F., Giacomelli, S., Linarello, A., Man-
aresi, F., Palumbo, G., et al. (2018). Productivity growth in italy: a tale of a slow-motion change. Bank of
Italy Occasional Paper, (422).
Caliendo, M. and Kopeinig, S. (2008). Some practical guidance for the implementation of propensity score
matching. Journal of economic surveys, 22(1):31–72.
Caliendo, M. and Tubbicke, S. (2019). New evidence on long-term effects of start-up subsidies: matching estimates
and their robustness. Empirical Economics, pages 1–27.
Calvino, F., Criscuolo, C., and Menon, C. (2016). No country for young firms? Start-up dynamics and national
policies. OECD Science, Technology and Industry Policy Papers.
Catalini, C., Guzman, J., and Stern, S. (2019). Hidden in plain sight: venture growth with or without venture
capital. Technical report, National Bureau of Economic Research.
Chava, S., Oettl, A., Subramanian, A., and Subramanian, K. V. (2013). Banking deregulation and innovation.
Journal of Financial economics, 109(3):759–774.
Ciccone, A. and Papaioannou, E. (2007). Red tape and delayed entry. Journal of the European Economic
Association, 5(2-3):444–458.
Cole, R. A. and Sokolyk, T. (2018). Debt financing, survival, and growth of start-up firms. Journal of Corporate
Finance, 50:609–625.
Colombelli, A., Krafft, J., and Vivarelli, M. (2016). To be born is not enough: the key role of innovative start-ups.
Small Business Economics, 47(2):277–291.
Colombo, M. G. and Grilli, L. (2007). Funding gaps? access to bank loans by high-tech start-ups. Small Business
Economics, 29(1-2):25–46.
Comin, D., Licht, G., Pellens, M., and Schubert, T. (2019). Do companies benefit from public research organi-
zations? the impact of the fraunhofer society in germany. The Impact of the Fraunhofer Society in Germany,
pages 19–006.
Cornaggia, J., Mao, Y., Tian, X., and Wolfe, B. (2015). Does banking competition affect innovation? Journal of
financial economics, 115(1):189–209.
Criscuolo, C., Gal, P. N., and Menon, C. (2014). The dynamics of employment growth. Technical Report 14,
OECD.
Cumming, D. and Dai, N. (2010). Local bias in venture capital investments. Journal of Empirical Finance,
17(3):362–380.
Cumming, D. and Groh, A. P. (2018). Entrepreneurial finance: Unifying themes and future directions. Journal
of Corporate Finance, 50:538–555.
Czarnitzki, D., Hunermund, P., and Moshgbar, N. (2020). Public procurement of innovation: Evidence from a
german legislative reform. International Journal of Industrial Organization, page 102620.
Decker, R., Haltiwanger, J., Jarmin, R., and Miranda, J. (2014). The role of entrepreneurship in us job creation
and economic dynamism. Journal of Economic Perspectives, 28(3):3–24.
Denis, D. J. (2004). Entrepreneurial finance: an overview of the issues and evidence. Journal of corporate finance,
10(2):301–326.
Dumont, M., Rayp, G., Verschelde, M., and Merlevede, B. (2016). The contribution of start-ups and young firms
to industry-level efficiency growth. Applied Economics, 48(59):5786–5801.
European Digital Forum (2016). The 2016 Startup Nation Scoreboard: How European Union countries are
improving policy frameworks and developing powerful ecosystems for entrepreneurs. Lisbon: The Lisbon Council
and Neats.
Farre-Mensa, J., Hegde, D., and Ljungqvist, A. (2017). What is a patent worth? evidence from the us patent
“lottery”. The Journal of Finance.
Fernandes, A. M. and Paunov, C. (2015). The risks of innovation: Are innovating firms less likely to die? Review
of Economics and Statistics, 97(3):638–653.
Fernandez, G. G.-T. (2014). Aggregate effects of bureaucratic startup costs. Technical report, Stanford University.
Finaldi Russo, P., Magri, S., and Rampazzi, C. (2016). Innovative start-ups in Italy: Their special features and
the effects of the 2102 Law. Politica economica, 32(2):297–330.
Gilbert, B. A., McDougall, P. P., and Audretsch, D. B. (2006). New venture growth: A review and extension.
Journal of management, 32(6):926–950.
Giraudo, E., Giudici, G., and Grilli, L. (2019). Entrepreneurship policy and the financing of young innovative
companies: Evidence from the italian startup act. Research Policy, 48(9):103801.
Gompers, P. and Lerner, J. (2001). The venture capital revolution. Journal of economic perspectives, 15(2):145–
168.
Gompers, P. A. (1995). Optimal investment, monitoring, and the staging of venture capital. The journal of
finance, 50(5):1461–1489.
Gornall, W. and Strebulaev, I. A. (2015). The economic impact of venture capital: Evidence from public companies.
Guzman, J. and Stern, S. (2017). Nowcasting and placecasting entrepreneurial quality and performance. Measuring
Entrepreneurial Businesses: Current Knowledge and Challenges, 75:63.
Haeussler, C., Harhoff, D., and Mueller, E. (2014). How patenting informs vc investors–the case of biotechnology.
Research Policy, 43(8):1286–1298.
Hall, B. H. (2010). The financing of innovative firms. Review of Economics and Institutions, 1(1).
Hall, B. H. and Lerner, J. (2010). The financing of r&d and innovation. In Handbook of the Economics of
Innovation, volume 1, pages 609–639. Elsevier.
Haltiwanger, J., Jarmin, R. S., Kulick, R., Miranda, J., et al. (2016). High growth young firms: Contribution to
job, output, and productivity growth. NBER Chapters, pages 11–62.
25

Haltiwanger, J., Jarmin, R. S., and Miranda, J. (2013). Who creates jobs? Small versus large versus young. Review
of Economics and Statistics, 95(2):347–361.
Heckman, J. J., Ichimura, H., and Todd, P. (1998). Matching as an econometric evaluation estimator. The review
of economic studies, 65(2):261–294.
Heim, S., Huschelrath, K., Schmidt-Dengler, P., and Strazzeri, M. (2017). The impact of state aid on the survival
and financial viability of aided firms. European Economic Review, 100:193–214.
Hellmann, T., Lindsey, L., and Puri, M. (2008). Building relationships early: Banks in venture capital. The Review
of Financial Studies, 21(2):513–541.
Hellmann, T. and Puri, M. (2000). The interaction between product market and financing strategy: The role of
venture capital. The review of financial studies, 13(4):959–984.
Hellmann, T. and Puri, M. (2002). Venture capital and the professionalization of start-up firms: Empirical
evidence. The journal of finance, 57(1):169–197.
Hsu, D. H. and Ziedonis, R. H. (2013). Resources as dual sources of advantage: Implications for valuing
entrepreneurial-firm patents. Strategic Management Journal, 34(7):761–781.
Hurst, E. and Pugsley, B. W. (2011). What do small businesses do? Brookings Papers on Economic Activity,
2011(2):73–118.
Hyytinen, A., Pajarinen, M., and Rouvinen, P. (2015). Does innovativeness reduce startup survival rates? Journal
of Business Venturing, 30(4):564–581.
Imbens, G. W. and Rubin, D. B. (2015). Causal inference in statistics, social, and biomedical sciences. Cambridge
University Press.
Inderst, R. and Muller, H. M. (2004). The effect of capital market characteristics on the value of start-up firms.
Journal of Financial Economics, 72(2):319–356.
Jimenez, G., Ongena, S., Peydro, J.-L., and Saurina, J. (2012). Credit supply and monetary policy: Identifying
the bank balance-sheet channel with loan applications. American Economic Review, 102(5):2301–26.
Kerr, W. R. and Nanda, R. (2015). Financing innovation. Annual Review of Financial Economics, 7:445–462.
King, G. and Nielsen, R. (2019). Why propensity scores should not be used for matching. Political Analysis,
27(4):435–454.
Kortum, S. and Lerner, J. (2000). Assessing the contribution of venture capital to innovation. RAND journal of
Economics, pages 674–692.
Lahr, H. and Mina, A. (2016). Venture capital investments and the technological performance of portfolio firms.
Research Policy, 45(1):303–318.
Lerner, J. (1995). Venture capitalists and the oversight of private firms. the Journal of Finance, 50(1):301–318.
Lewbel, A. (2012). Using heteroscedasticity to identify and estimate mismeasured and endogenous regressor
models. Journal of Business & Economic Statistics, 30(1):67–80.
Lewbel, A. (2018). Identification and estimation using heteroscedasticity without instruments: The binary en-
dogenous regressor case. Economics Letters, 165:10–12.
Long, C. (2002). Patent signals. The University of Chicago Law Review, pages 625–679.
Manaresi, F. (2015). Net employment growth by firm size and age in italy. Bank of Italy Occasional Paper, (298).
Megginson, W. L. and Weiss, K. A. (1991). Venture capitalist certification in initial public offerings. The Journal
of Finance, 46(3):879–903.
Menon, C., DeStefano, T., Manaresi, F., Soggia, G., and Santoleri, P. (2018). The evaluation of the Italian
“Start-up Act”. OECD Science, Technology and Industry Policy Papers, N. 54.
Michelacci, C. and Silva, O. (2007). Why so many local entrepreneurs? The Review of Economics and Statistics,
89(4):615–633.
MISE (2017). Annual report to parliament on the implementation of legislation in support of innovative start-ups
and SMEs. Technical report, Ministero dello Sviluppo Economico.
MISE-Istat (2018). Startup survey 2016: la prima indagine sulle neoimprese innovative in italia. Technical report,
Istituto nazionale di statistica.
26

Mulcahy, D. (2013). 6 myths about venture capitalists. Harvard Business Review, 91(5):80–83.
Nightingale, P. and Coad, A. (2014). Muppets and gazelles: political and methodological biases in entrepreneurship
research. Industrial and Corporate Change, 23(1):113–143.
Puri, M. and Zarutskie, R. (2012). On the life cycle dynamics of venture-capital-and non-venture-capital-financed
firms. The Journal of Finance, 67(6):2247–2293.
Revest, V. and Sapio, A. (2012). Financing technology-based small firms in europe: what do we know? Small
Business Economics, 39(1):179–205.
Robb, A. M. and Robinson, D. T. (2014). The capital structure decisions of new firms. The Review of Financial
Studies, 27(1):153–179.
Rodriguez-Palenzuela, D., Darracq Paries, M., Carboni, G., Ferrando, A., Kohler Ulbrich, P., Zachary, M.-D.,
Geiger, F., Rupprecht, M., Raudsaar, T., McCann, F., et al. (2013). Corporate finance and economic activity
in the euro area: Structural issues report 2013.
Rubin, D. B. (2001). Using propensity scores to help design observational studies: application to the tobacco
litigation. Health Services and Outcomes Research Methodology, 2(3-4):169–188.
Santoleri, P. (2019). Innovation and job creation in (high-growth) new firms. Industrial and Corporate Change.
Schoar, A. (2010). The divide between subsistence and transformational entrepreneurship. Innovation policy and
the economy, 10(1):57–81.
Shane, S. (2009). Why encouraging more people to become entrepreneurs is bad public policy. Small business
economics, 33(2):141–149.
Sorenson, O. and Stuart, T. E. (2001). Syndication networks and the spatial distribution of venture capital
investments. American journal of sociology, 106(6):1546–1588.
Stam, E. and Wennberg, K. (2009). The roles of r&d in new firm growth. Small Business Economics, 33(1):77–89.
Stock, J. H., Wright, J. H., and Yogo, M. (2002). A survey of weak instruments and weak identification in
generalized method of moments. Journal of Business & Economic Statistics, 20(4):518–529.
Stuart, E. A. (2010). Matching methods for causal inference: A review and a look forward. Statistical science: a
review journal of the Institute of Mathematical Statistics, 25(1):1.
Vacca, V. P. (2013). Financing innovation in italy: an analysis of venture capital and private equity investments.
Bank of Italy occasional paper, (209).
27

8 Online Appendix
Table A1: Registered start-ups vs registered start-ups in the sample
(1) (2)All start-ups Matched start-ups
Sales classes0-100,000 0.42 0.25100,001-250,000 0.27 0.30250,001-500,000 0.15 0.19500,001+ 0.16 0.27Equity classes0-100,000 0.89 0.83100,001-250,000 0.06 0.09250,001-500,000 0.03 0.04500,001+ 0.02 0.04Birth cohortCohort 2009 0.05 0.14Cohort 2010 0.08 0.23Cohort 2011 0.13 0.34Cohort 2012 0.18 0.17Cohort 2013 0.27 0.10Cohort 2014 0.29 0.01RegistrationYear 2013 0.42 0.55Year 2014 0.39 0.26Year 2015 0.19 0.19IndustryAgriculture 0.00 0.00Retail 0.05 0.05Manufacturing 0.22 0.28Services 0.72 0.67Tourism 0.00 0.00Geographic areaNorth West 0.34 0.35North East 0.27 0.33Center 0.21 0.21South 0.13 0.07Islands 0.05 0.05Elegibility CriteriaR&D expenditures 0.64 0.63Human Capital 0.31 0.34Intellectual Property 0.24 0.24Labour force compositionWomen majority 0.14 0.13Youth majority 0.23 0.23Foreign majority 0.02 0.02
N 3560 328
Notes: Column 1 reports summary statistics for all start-ups registered on orbefore 2016 and born up to 2015. Column 2 refers to start-ups registered onor before 2016 and born up to 2015 contained in our final sample. The latterrefers to all start-ups with non-missing values for revenues in Cerved. Elegibilitycriteria do not add to 1 since firms can report to have more than one. Labourforce composition does not add to 1 since firms can report to have none.
28
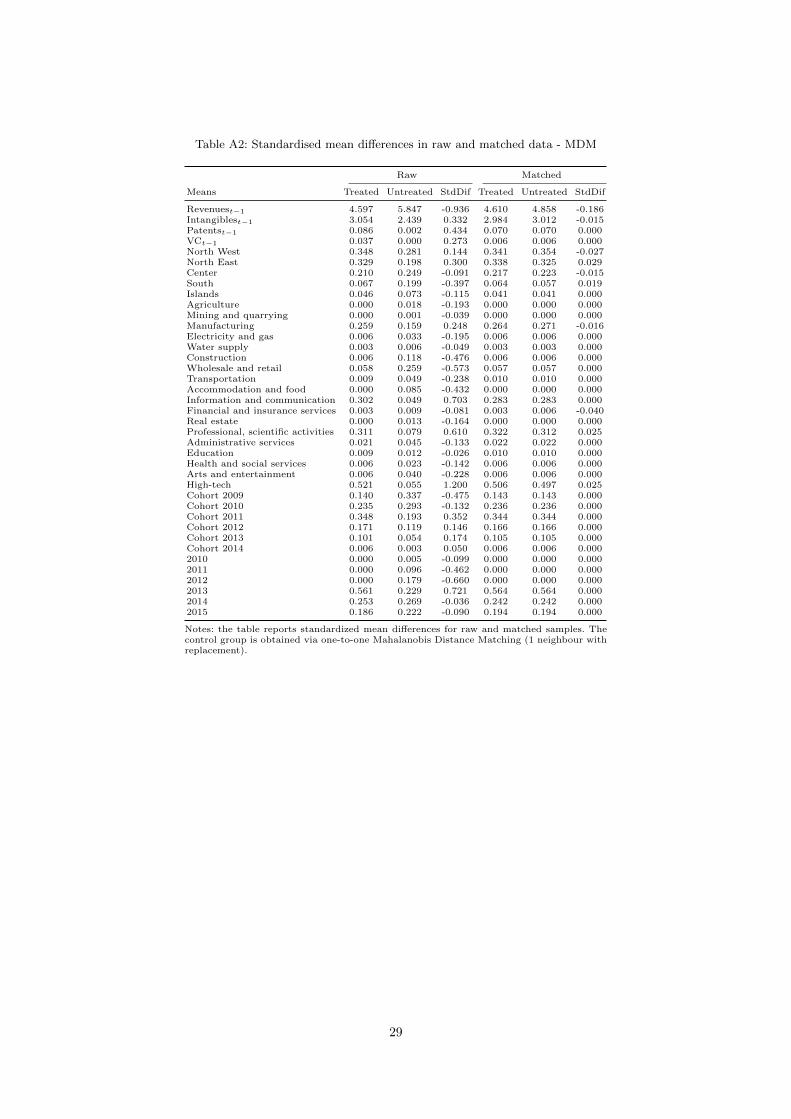
Table A2: Standardised mean differences in raw and matched data - MDM
Raw Matched
Means Treated Untreated StdDif Treated Untreated StdDif
Revenuest−1 4.597 5.847 -0.936 4.610 4.858 -0.186Intangiblest−1 3.054 2.439 0.332 2.984 3.012 -0.015Patentst−1 0.086 0.002 0.434 0.070 0.070 0.000VCt−1 0.037 0.000 0.273 0.006 0.006 0.000North West 0.348 0.281 0.144 0.341 0.354 -0.027North East 0.329 0.198 0.300 0.338 0.325 0.029Center 0.210 0.249 -0.091 0.217 0.223 -0.015South 0.067 0.199 -0.397 0.064 0.057 0.019Islands 0.046 0.073 -0.115 0.041 0.041 0.000Agriculture 0.000 0.018 -0.193 0.000 0.000 0.000Mining and quarrying 0.000 0.001 -0.039 0.000 0.000 0.000Manufacturing 0.259 0.159 0.248 0.264 0.271 -0.016Electricity and gas 0.006 0.033 -0.195 0.006 0.006 0.000Water supply 0.003 0.006 -0.049 0.003 0.003 0.000Construction 0.006 0.118 -0.476 0.006 0.006 0.000Wholesale and retail 0.058 0.259 -0.573 0.057 0.057 0.000Transportation 0.009 0.049 -0.238 0.010 0.010 0.000Accommodation and food 0.000 0.085 -0.432 0.000 0.000 0.000Information and communication 0.302 0.049 0.703 0.283 0.283 0.000Financial and insurance services 0.003 0.009 -0.081 0.003 0.006 -0.040Real estate 0.000 0.013 -0.164 0.000 0.000 0.000Professional, scientific activities 0.311 0.079 0.610 0.322 0.312 0.025Administrative services 0.021 0.045 -0.133 0.022 0.022 0.000Education 0.009 0.012 -0.026 0.010 0.010 0.000Health and social services 0.006 0.023 -0.142 0.006 0.006 0.000Arts and entertainment 0.006 0.040 -0.228 0.006 0.006 0.000High-tech 0.521 0.055 1.200 0.506 0.497 0.025Cohort 2009 0.140 0.337 -0.475 0.143 0.143 0.000Cohort 2010 0.235 0.293 -0.132 0.236 0.236 0.000Cohort 2011 0.348 0.193 0.352 0.344 0.344 0.000Cohort 2012 0.171 0.119 0.146 0.166 0.166 0.000Cohort 2013 0.101 0.054 0.174 0.105 0.105 0.000Cohort 2014 0.006 0.003 0.050 0.006 0.006 0.0002010 0.000 0.005 -0.099 0.000 0.000 0.0002011 0.000 0.096 -0.462 0.000 0.000 0.0002012 0.000 0.179 -0.660 0.000 0.000 0.0002013 0.561 0.229 0.721 0.564 0.564 0.0002014 0.253 0.269 -0.036 0.242 0.242 0.0002015 0.186 0.222 -0.090 0.194 0.194 0.000
Notes: the table reports standardized mean differences for raw and matched samples. Thecontrol group is obtained via one-to-one Mahalanobis Distance Matching (1 neighbour withreplacement).
29
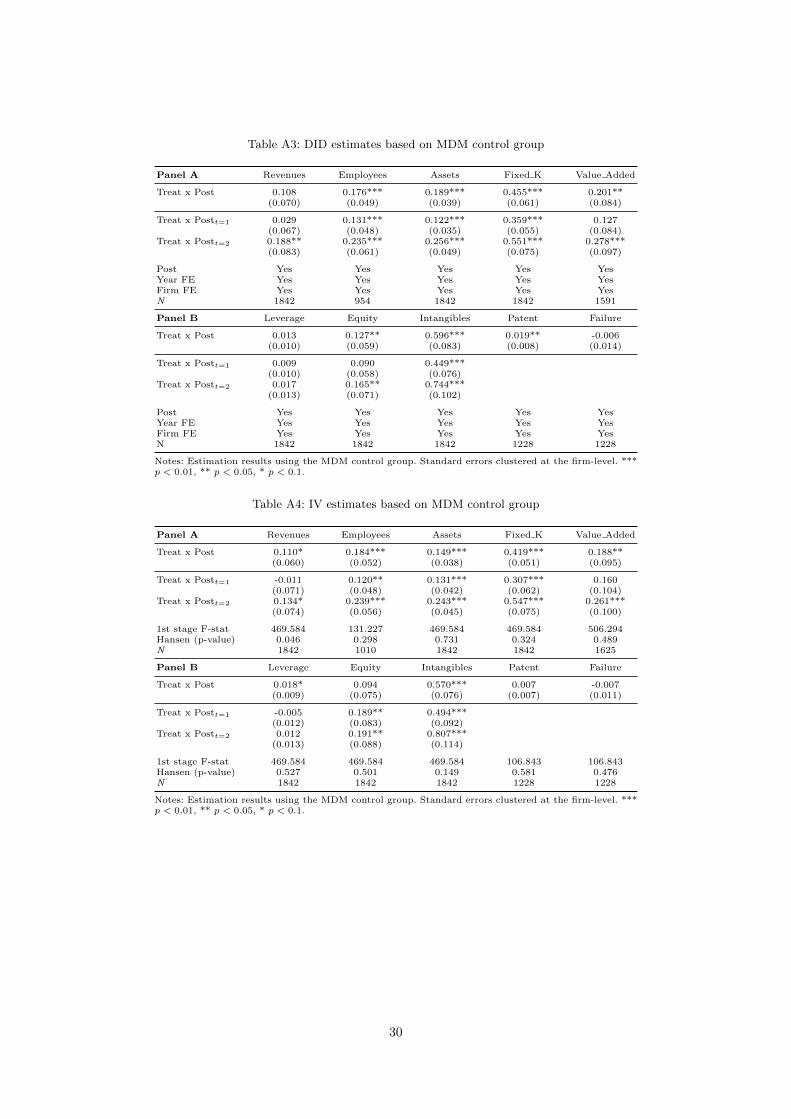
Table A3: DID estimates based on MDM control group
Panel A Revenues Employees Assets Fixed K Value Added
Treat x Post 0.108 0.176*** 0.189*** 0.455*** 0.201**(0.070) (0.049) (0.039) (0.061) (0.084)
Treat x Postt=1 0.029 0.131*** 0.122*** 0.359*** 0.127(0.067) (0.048) (0.035) (0.055) (0.084)
Treat x Postt=2 0.188** 0.235*** 0.256*** 0.551*** 0.278***(0.083) (0.061) (0.049) (0.075) (0.097)
Post Yes Yes Yes Yes YesYear FE Yes Yes Yes Yes YesFirm FE Yes Yes Yes Yes YesN 1842 954 1842 1842 1591
Panel B Leverage Equity Intangibles Patent Failure
Treat x Post 0.013 0.127** 0.596*** 0.019** -0.006(0.010) (0.059) (0.083) (0.008) (0.014)
Treat x Postt=1 0.009 0.090 0.449***(0.010) (0.058) (0.076)
Treat x Postt=2 0.017 0.165** 0.744***(0.013) (0.071) (0.102)
Post Yes Yes Yes Yes YesYear FE Yes Yes Yes Yes YesFirm FE Yes Yes Yes Yes YesN 1842 1842 1842 1228 1228
Notes: Estimation results using the MDM control group. Standard errors clustered at the firm-level. ***p < 0.01, ** p < 0.05, * p < 0.1.
Table A4: IV estimates based on MDM control group
Panel A Revenues Employees Assets Fixed K Value Added
Treat x Post 0.110* 0.184*** 0.149*** 0.419*** 0.188**(0.060) (0.052) (0.038) (0.051) (0.095)
Treat x Postt=1 -0.011 0.120** 0.131*** 0.307*** 0.160(0.071) (0.048) (0.042) (0.062) (0.104)
Treat x Postt=2 0.134* 0.239*** 0.243*** 0.547*** 0.261***(0.074) (0.056) (0.045) (0.075) (0.100)
1st stage F-stat 469.584 131.227 469.584 469.584 506.294Hansen (p-value) 0.046 0.298 0.731 0.324 0.489N 1842 1010 1842 1842 1625
Panel B Leverage Equity Intangibles Patent Failure
Treat x Post 0.018* 0.094 0.570*** 0.007 -0.007(0.009) (0.075) (0.076) (0.007) (0.011)
Treat x Postt=1 -0.005 0.189** 0.494***(0.012) (0.083) (0.092)
Treat x Postt=2 0.012 0.191** 0.807***(0.013) (0.088) (0.114)
1st stage F-stat 469.584 469.584 469.584 106.843 106.843Hansen (p-value) 0.527 0.501 0.149 0.581 0.476N 1842 1842 1842 1228 1228
Notes: Estimation results using the MDM control group. Standard errors clustered at the firm-level. ***p < 0.01, ** p < 0.05, * p < 0.1.
30

Table A5: DID estimates using augmented specification
Panel A Revenues Employees Assets Fixed K Value Added
Treat x Post 0.070 0.162*** 0.194*** 0.381*** 0.272***(0.069) (0.053) (0.041) (0.066) (0.081)
Treat x Postt=1 -0.053 0.121** 0.116*** 0.279*** 0.164**(0.065) (0.053) (0.037) (0.062) (0.081)
Treat x Postt=2 0.195** 0.220*** 0.272*** 0.484*** 0.387***(0.085) (0.064) (0.051) (0.077) (0.093)
Post Yes Yes Yes Yes YesYear FE Yes Yes Yes Yes YesFirm FE Yes Yes Yes Yes YesN 1836 913 1836 1836 1569
Panel B Leverage Equity Intangibles Patent Failure
Treat x Post 0.020** 0.176*** 0.655*** 0.019** 0.001(0.010) (0.057) (0.084) (0.008) (0.013)
Treat x Postt=1 0.010 0.108** 0.485***(0.010) (0.053) (0.079)
Treat x Postt=2 0.030** 0.245*** 0.827***(0.013) (0.072) (0.102)
Post Yes Yes Yes Yes YesYear FE Yes Yes Yes Yes YesFirm FE Yes Yes Yes Yes YesN 1836 1836 1836 1224 1224
Notes: Estimation results using additional province-level control variables. These additional covariatesrefer to firms in manufacturing, ICT, and professional and scientific services at the province-level. Theseare the number of new enterprises, the number of active firms, the share of 3 years’ old firms over thebusiness population, the average size of new enterprises, and the number of high-growth firms. Standarderrors clustered at the firm-level. *** p < 0.01, ** p < 0.05, * p < 0.1.
Table A6: IV estimates using augmented specification
Panel A Revenues Employees Assets Fixed K Value Added
Treat x Post 0.046 0.111* 0.178*** 0.381*** 0.268***(0.076) (0.059) (0.042) (0.076) (0.100)
Treat x Postt=1 -0.079 0.121 0.145*** 0.233*** 0.240**(0.060) (0.074) (0.044) (0.078) (0.118)
Treat x Postt=2 0.163** 0.220*** 0.243*** 0.446*** 0.385***(0.081) (0.062) (0.051) (0.085) (0.115)
1st stage F-stat 708.888 300.230 708.888 708.888 641.332Hansen (p-value) 0.217 0.389 0.588 0.120 0.087N 1836 975 1836 1836 1598
Panel B Leverage Equity Intangibles Patent Failure
Treat x Post 0.017* 0.153** 0.651*** 0.009* 0.001(0.009) (0.063) (0.081) (0.005) (0.010)
Treat x Postt=1 -0.002 0.203*** 0.485***(0.013) (0.072) (0.089)
Treat x Postt=2 0.028** 0.266*** 0.839***(0.014) (0.088) (0.111)
1st stage F-stat 708.888 708.888 708.888 56.829 56.829Hansen (p-value) 0.444 0.478 0.006 0.678 0.723N 1836 1836 1836 1224 1224
Notes: Estimation results using additional province-level control variables. These additional covariatesrefer to firms in manufacturing, ICT, and professional and scientific services at the province-level. Theseare the number of new enterprises, the number of active firms, the share of 3 years’ old firms over thebusiness population, the average size of new enterprises, and the number of high-growth firms. Standarderrors clustered at the firm-level. Standard errors clustered at the firm-level. *** p < 0.01, ** p < 0.05,* p < 0.1.
31

Table A7: IV estimates using alternative instrument
Panel A Revenues Employees Assets Fixed K Value Added
Treat x Post 0.052 0.088 0.172*** 0.373*** 0.262***(0.075) (0.062) (0.042) (0.073) (0.099)
Treat x Postt=1 -0.052 0.082 0.144*** 0.261*** 0.243**(0.057) (0.073) (0.043) (0.071) (0.104)
Treat x Postt=2 0.181** 0.193*** 0.267*** 0.464*** 0.426***(0.077) (0.061) (0.055) (0.088) (0.108)
1st stage F-stat 548.044 153.189 548.044 548.044 417.968Hansen (p-value) 0.118 0.285 0.564 0.213 0.106N 1836 975 1836 1836 1598
Panel B Leverage Equity Intangibles Patent Failure
Treat x Post 0.015* 0.141** 0.634*** 0.009 0.002(0.008) (0.066) (0.080) (0.006) (0.010)
Treat x Postt=1 -0.003 0.181*** 0.488***(0.012) (0.069) (0.079)
Treat x Postt=2 0.027* 0.280*** 0.872***(0.014) (0.094) (0.117)
1st stage F-stat 548.044 548.044 548.044 85.401 85.401Hansen (p-value) 0.779 0.582 0.058 0.577 0.403N 1836 1836 1836 1224 1224
Notes: Estimation results using an alternative instrument. This is computed by dividing the numberof registered start-ups over the number of firms in manufacturing, ICT, and professional and scientificactivities in each province in 2013. Standard errors clustered at the province-level. *** p < 0.01, **p < 0.05, * p < 0.1.
32