S. Easton Lecture 1 on Corrections Data These notes are to...
24
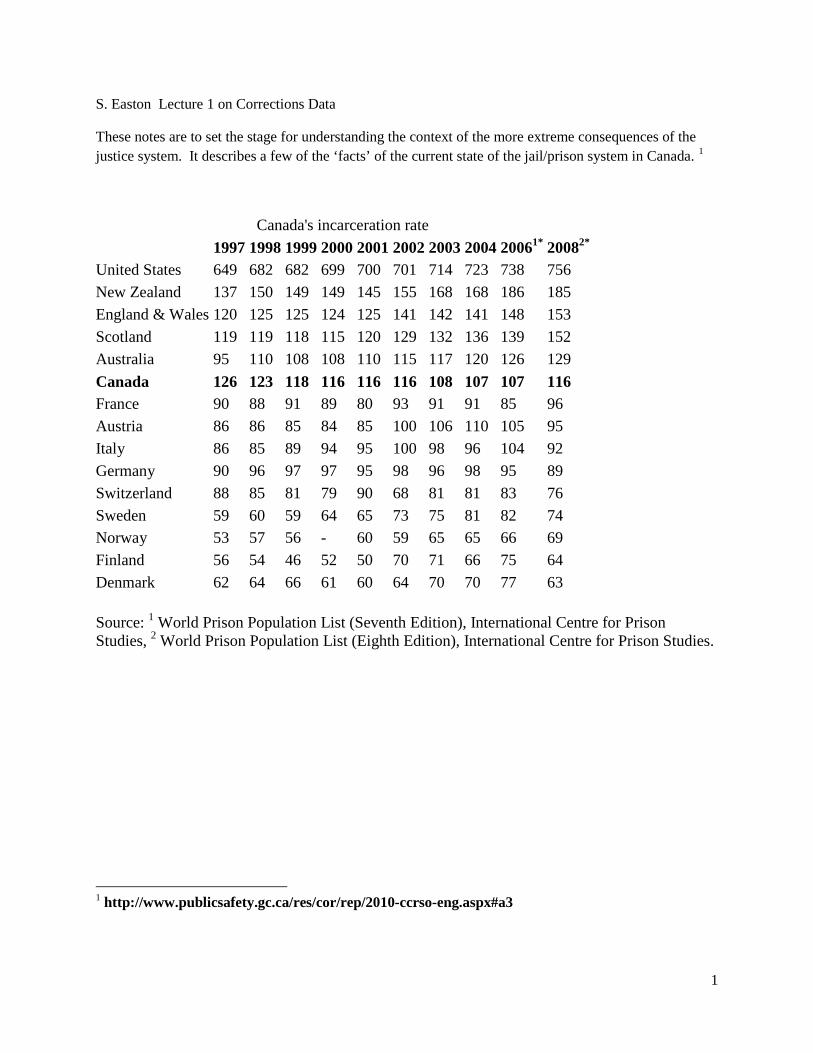
1 S. Easton Lecture 1 on Corrections Data These notes are to set the stage for understanding the context of the more extreme consequences of the justice system. It describes a few of the ‘facts’ of the current state of the jail/prison system in Canada. 1 Canada's incarceration rate 1997 1998 1999 2000 2001 2002 2003 2004 2006 1* 2008 2* United States 649 682 682 699 700 701 714 723 738 756 New Zealand 137 150 149 149 145 155 168 168 186 185 England & Wales 120 125 125 124 125 141 142 141 148 153 Scotland 119 119 118 115 120 129 132 136 139 152 Australia 95 110 108 108 110 115 117 120 126 129 Canada 126 123 118 116 116 116 108 107 107 116 France 90 88 91 89 80 93 91 91 85 96 Austria 86 86 85 84 85 100 106 110 105 95 Italy 86 85 89 94 95 100 98 96 104 92 Germany 90 96 97 97 95 98 96 98 95 89 Switzerland 88 85 81 79 90 68 81 81 83 76 Sweden 59 60 59 64 65 73 75 81 82 74 Norway 53 57 56 - 60 59 65 65 66 69 Finland 56 54 46 52 50 70 71 66 75 64 Denmark 62 64 66 61 60 64 70 70 77 63 Source: 1 World Prison Population List (Seventh Edition), International Centre for Prison Studies, 2 World Prison Population List (Eighth Edition), International Centre for Prison Studies. 1 http://www.publicsafety.gc.ca/res/cor/rep/2010-ccrso-eng.aspx#a3
Transcript of S. Easton Lecture 1 on Corrections Data These notes are to...
1
S. Easton Lecture 1 on Corrections Data
These notes are to set the stage for understanding the context of the more extreme consequences of the justice system. It describes a few of the ‘facts’ of the current state of the jail/prison system in Canada. 1
Canada's incarceration rate 1997 1998 1999 2000 2001 2002 2003 2004 20061* 20082*
United States 649 682 682 699 700 701 714 723 738 756 New Zealand 137 150 149 149 145 155 168 168 186 185 England & Wales 120 125 125 124 125 141 142 141 148 153 Scotland 119 119 118 115 120 129 132 136 139 152 Australia 95 110 108 108 110 115 117 120 126 129 Canada 126 123 118 116 116 116 108 107 107 116 France 90 88 91 89 80 93 91 91 85 96 Austria 86 86 85 84 85 100 106 110 105 95 Italy 86 85 89 94 95 100 98 96 104 92 Germany 90 96 97 97 95 98 96 98 95 89 Switzerland 88 85 81 79 90 68 81 81 83 76 Sweden 59 60 59 64 65 73 75 81 82 74 Norway 53 57 56 - 60 59 65 65 66 69 Finland 56 54 46 52 50 70 71 66 75 64 Denmark 62 64 66 61 60 64 70 70 77 63
Source: 1 World Prison Population List (Seventh Edition), International Centre for Prison Studies, 2 World Prison Population List (Eighth Edition), International Centre for Prison Studies.
1 http://www.publicsafety.gc.ca/res/cor/rep/2010-ccrso-eng.aspx#a3

2
The total rate of adults charged has declined since 2001, but violent?
Year Type of offence
Violent** Property** Traffic Other CCC** Drugs Other Fed.
Statutes Total
Charged* 1998 568 677 372 425 168 24 2,234 1999 587 632 371 399 185 30 2,203 2000 611 591 346 414 198 26 2,187 2001 638 584 340 454 202 28 2,247 2002 613 569 328 464 199 29 2,202 2003 595 573 318 478 172 23 2,160 2004 581 573 307 493 187 30 2,172 2005 587 550 294 481 185 29 2,125 2006 593 533 293 499 198 27 2,142 2007 578 498 298 518 208 28 2,127 2008 575 485 306 537 207 31 2,141 2009 573 479 304 520 194 33 2,103
Source: Uniform Crime Reporting Survey, Canadian Centre for Justice Statistics, Statistics Canada.
Note:
*Unlike Statistics Canada, the Total Crime Rate in the Corrections and Conditional Release Statistical Overview includes traffic offences and offences against federal statutes to provide a measure of all criminal offences. As a result, the Total Crime Rate reported here is higher than that reported by Statistics Canada.
**The definitions for Violent, Property and Other Criminal Code offences have been revised by Statistics Canada to better reflect definitions used by the policing community. As a result of these changes, comparable data are only available starting in 1998 and the data presented in this year's report are not comparable to the data reported in previous versions of the Corrections and Conditional Release Statistical Overview.
Rates are based on 100,000 population, 18 years of age and older.

3
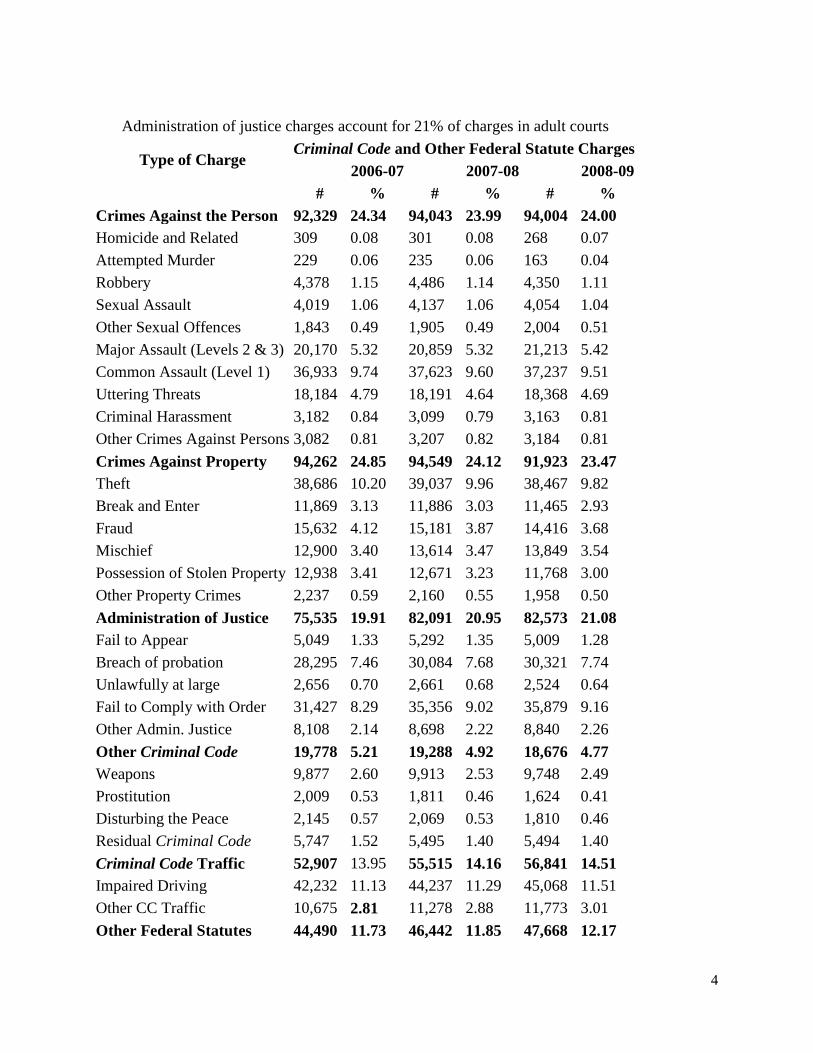
Administration of Justice charges account for 21% of charges in adult courts
• Administration of justice cases (offences related to case proceedings such as failure to appear in court, failure to comply with a court order, breach of probation, and unlawfully at large) account for more than one fifth of cases before the courts.
4
Administration of justice charges account for 21% of charges in adult courts
Type of Charge Criminal Code and Other Federal Statute Charges
2006-07 2007-08 2008-09 # % # % # %
Crimes Against the Person 92,329 24.34 94,043 23.99 94,004 24.00 Homicide and Related 309 0.08 301 0.08 268 0.07 Attempted Murder 229 0.06 235 0.06 163 0.04 Robbery 4,378 1.15 4,486 1.14 4,350 1.11 Sexual Assault 4,019 1.06 4,137 1.06 4,054 1.04 Other Sexual Offences 1,843 0.49 1,905 0.49 2,004 0.51 Major Assault (Levels 2 & 3) 20,170 5.32 20,859 5.32 21,213 5.42 Common Assault (Level 1) 36,933 9.74 37,623 9.60 37,237 9.51 Uttering Threats 18,184 4.79 18,191 4.64 18,368 4.69 Criminal Harassment 3,182 0.84 3,099 0.79 3,163 0.81 Other Crimes Against Persons 3,082 0.81 3,207 0.82 3,184 0.81 Crimes Against Property 94,262 24.85 94,549 24.12 91,923 23.47 Theft 38,686 10.20 39,037 9.96 38,467 9.82 Break and Enter 11,869 3.13 11,886 3.03 11,465 2.93 Fraud 15,632 4.12 15,181 3.87 14,416 3.68 Mischief 12,900 3.40 13,614 3.47 13,849 3.54 Possession of Stolen Property 12,938 3.41 12,671 3.23 11,768 3.00 Other Property Crimes 2,237 0.59 2,160 0.55 1,958 0.50 Administration of Justice 75,535 19.91 82,091 20.95 82,573 21.08 Fail to Appear 5,049 1.33 5,292 1.35 5,009 1.28 Breach of probation 28,295 7.46 30,084 7.68 30,321 7.74 Unlawfully at large 2,656 0.70 2,661 0.68 2,524 0.64 Fail to Comply with Order 31,427 8.29 35,356 9.02 35,879 9.16 Other Admin. Justice 8,108 2.14 8,698 2.22 8,840 2.26 Other Criminal Code 19,778 5.21 19,288 4.92 18,676 4.77 Weapons 9,877 2.60 9,913 2.53 9,748 2.49 Prostitution 2,009 0.53 1,811 0.46 1,624 0.41 Disturbing the Peace 2,145 0.57 2,069 0.53 1,810 0.46 Residual Criminal Code 5,747 1.52 5,495 1.40 5,494 1.40 Criminal Code Traffic 52,907 13.95 55,515 14.16 56,841 14.51 Impaired Driving 42,232 11.13 44,237 11.29 45,068 11.51 Other CC Traffic 10,675 2.81 11,278 2.88 11,773 3.01 Other Federal Statutes 44,490 11.73 46,442 11.85 47,668 12.17

5
Administration of justice charges account for 21% of charges in adult courts
Type of Charge Criminal Code and Other Federal Statute Charges
2006-07 2007-08 2008-09 # % # % # %
Drug Possession 14,038 3.70 15,340 3.91 15,574 3.98 Drug Trafficking 11,570 3.05 12,242 3.12 12,587 3.21 Residual Federal Statutes 18,882 4.98 18,860 4.81 19,507 4.98 Total Offences 379,301 100.00 391,928 100.00 391,685 100.00
• Source: Adult Criminal Court Survey, Canadian Centre for Justice Statistics, Statistics Canada.
• Note: The table excludes Youth Criminal Justice Act / Young Offenders Act offences.

6
Most custodial sentences are short
• Over half (55.6%) of all custodial sentences imposed by adult courts are one month or less. • Of all convictions that result in custody, only 3.7% result in federal jurisdiction (i.e., a sentence of
two years or more).

7
The Funnel of Crime 2010

8
convicted cases/crime=10.7% custody/conviction=34.1% federal custody = 2% of those convicted
Relatively few crimes result in sentences to federal penitentiaries 2005-06 2006-07 2007-08 2008-09 2009-10
Total Number of Offences Reported to Police1 2,608,741 2,606,887 2,534,730 2,485,207 2,437,299
Convicted cases in Adult Court1* 249,126 247,484 255,422 260,649 Not available
Sentenced Admissions to Provincial/Territorial Custody1** 78,850 79,862 79,724 80,387 Not
available Warrant of Committal Admissions to Federal Facilities2 4,783 5,110 5,007 4,831 5,243
Source: 1 Uniform Crime Reporting Survey, Adult Criminal Court Survey and Adult Corrections Survey, Canadian Centre for Justice Statistics, Statistics Canada; 2 Correctional Service Canada.
Note:
*This figure only includes cases convicted in provincial court and partial data from Superior Court.

9
The rate of youth charged has declined since 2001

10
• In 2003, there was a notable decrease in all major crime categories, in part attributable to the implementation of the Youth Criminal Justice Act (YCJA) in April 2003, which places greater emphasis on diversion.
• Over the same seven year period, the rate of male youth charged with violent crime decreased by 3.9% to 1,308 per 100,000 in 2009. Similarly, the rate of male youth charged with property crime declined by 30.0%, to 1,710 per 100,000 in 2009.
The rate of youth charged has declined since 2001
Year Type of offence
Violent* Property* Traffic Other CCC* Drugs Other Fed. Statutes Total Charged* 1998 998 2,500 19 867 226 184 4,794 1999 1,034 2,237 1 754 266 209 4,501 2000 1,109 2,176 30 788 317 198 4,618 2001 1,143 2,119 82 855 343 195 4,737 2002 1,075 2,009 82 820 337 235 4,557 2003 937 1,570 78 743 208 204 3,740 2004 907 1,395 76 702 230 222 3,533 2005 913 1,276 54 671 214 212 3,341 2006 914 1,216 69 683 240 216 3,339 2007 944 1,214 75 734 261 239 3,467 2008 917 1,137 75 731 269 260 3,388 2009 889 1,145 68 699 238 260 3,300
• Source: Uniform Crime Reporting Survey, Canadian Centre for Justice Statistics, Statistics Canada.
The most common youth court case is theft
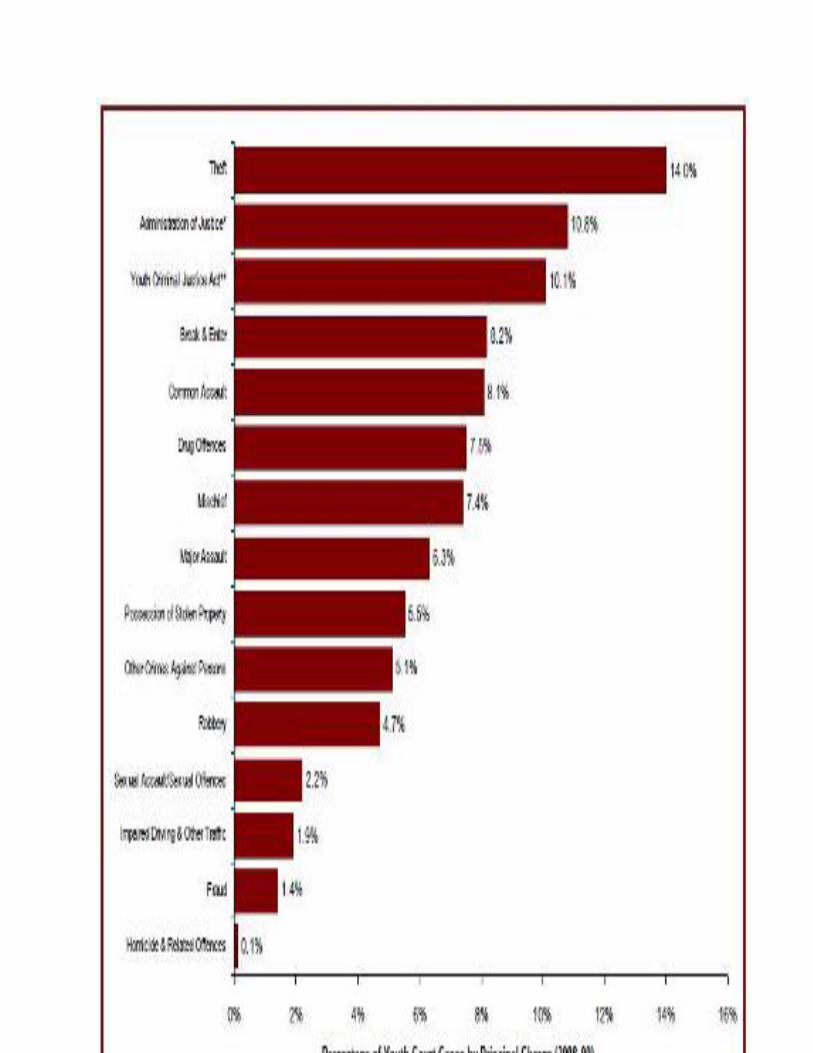
11
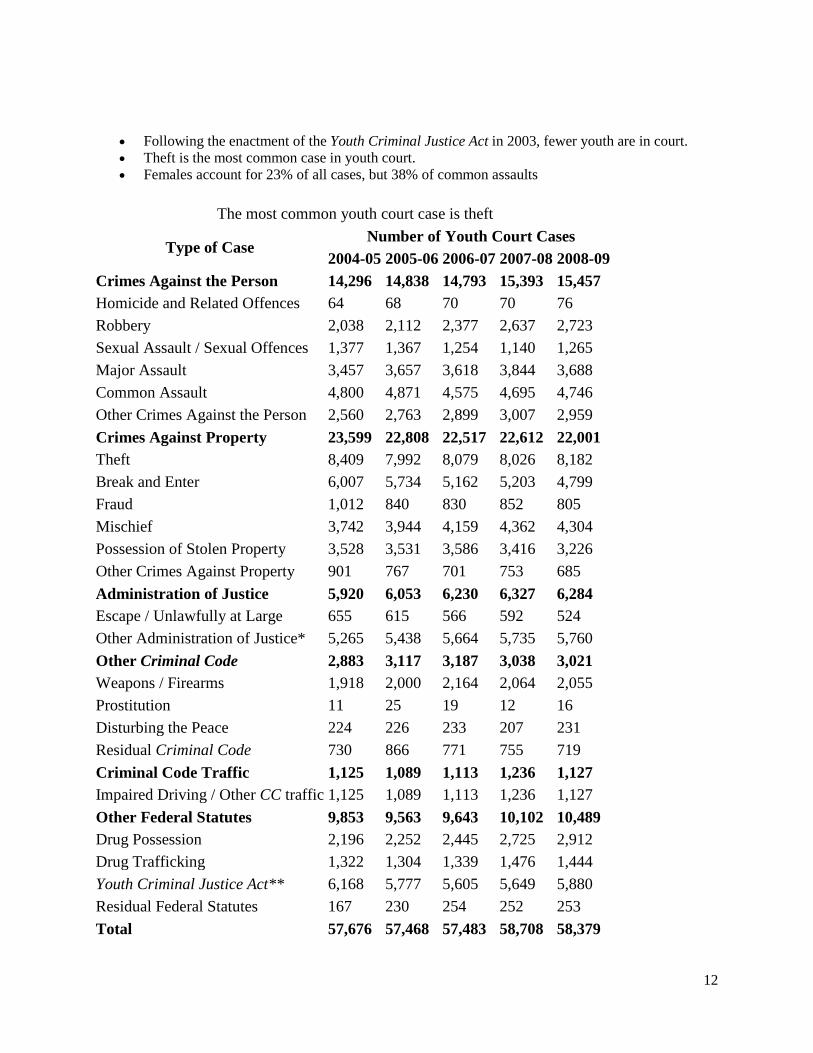
12
• Following the enactment of the Youth Criminal Justice Act in 2003, fewer youth are in court. • Theft is the most common case in youth court. • Females account for 23% of all cases, but 38% of common assaults
The most common youth court case is theft
Type of Case Number of Youth Court Cases
2004-05 2005-06 2006-07 2007-08 2008-09 Crimes Against the Person 14,296 14,838 14,793 15,393 15,457 Homicide and Related Offences 64 68 70 70 76 Robbery 2,038 2,112 2,377 2,637 2,723 Sexual Assault / Sexual Offences 1,377 1,367 1,254 1,140 1,265 Major Assault 3,457 3,657 3,618 3,844 3,688 Common Assault 4,800 4,871 4,575 4,695 4,746 Other Crimes Against the Person 2,560 2,763 2,899 3,007 2,959 Crimes Against Property 23,599 22,808 22,517 22,612 22,001 Theft 8,409 7,992 8,079 8,026 8,182 Break and Enter 6,007 5,734 5,162 5,203 4,799 Fraud 1,012 840 830 852 805 Mischief 3,742 3,944 4,159 4,362 4,304 Possession of Stolen Property 3,528 3,531 3,586 3,416 3,226 Other Crimes Against Property 901 767 701 753 685 Administration of Justice 5,920 6,053 6,230 6,327 6,284 Escape / Unlawfully at Large 655 615 566 592 524 Other Administration of Justice* 5,265 5,438 5,664 5,735 5,760 Other Criminal Code 2,883 3,117 3,187 3,038 3,021 Weapons / Firearms 1,918 2,000 2,164 2,064 2,055 Prostitution 11 25 19 12 16 Disturbing the Peace 224 226 233 207 231 Residual Criminal Code 730 866 771 755 719 Criminal Code Traffic 1,125 1,089 1,113 1,236 1,127 Impaired Driving / Other CC traffic 1,125 1,089 1,113 1,236 1,127 Other Federal Statutes 9,853 9,563 9,643 10,102 10,489 Drug Possession 2,196 2,252 2,445 2,725 2,912 Drug Trafficking 1,322 1,304 1,339 1,476 1,444 Youth Criminal Justice Act** 6,168 5,777 5,605 5,649 5,880 Residual Federal Statutes 167 230 254 252 253 Total 57,676 57,468 57,483 58,708 58,379

13
• Source: Youth Court Survey, Canadian Centre for Justice Statistics, Statistics Canada.
The most common disposition for youth is probation
Type of Disposition Gender Year
2004-05 2005-06 2006-07 2007-08 2008-09 % % % % %
Probation Total 62.4 60.9 59.2 60.8 60.3 Custody Female 16.1 15.1 13.4 13.0 12.4 Male 22.4 20.0 18.1 17.5 17.0 Total 21.1 18.4 16.6 15.9 15.4 Community Service Order Total 26.6 24.6 23.8 24.0 24.1 Fine Female 4.9 4.1 4.1 4.3 3.8 Male 6.0 5.8 5.8 5.8 6.2 Total 5.8 5.5 5.4 5.4 5.6 Deferred Custody and Supervision Total 3.0 3.5 3.2 3.6 3.8 Other** Female 39.3 36.4 36.2 38.1 38.7 Male 41.5 40.2 39.9 41.3 43.4 Total 41.1 37.8 37.5 39.0 40.4
• Source: Youth Court Survey, Canadian Centre for Justice Statistics, Statistics Canada. • Note: **"Other" includes absolute discharge, restitution, prohibition, seizure, forfeiture,
compensation, pay purchaser, essays, apologies, counselling programs and conditional discharge, conditional sentence, intensive support and supervision, attendance at non-residential program and reprimand.
• Each case may receive more than one disposition. Therefore, sanctions are not mutually exclusive and will not add to 100%.

14
Federal Expenditures
The total expenditures on federal and provincial corrections in Canada for 2008-09 were $3.85 billion, for a per capita cost of $115.76.
• Expenditures on federal corrections in Canada were $2.28 billion dollars. Over the five year period from 2004-05 to 2008-09, there has been a 30.7% real increase.
• Expenditures for provincial/territorial corrections in Canada were $1.78 billion. Over the five year period from 2004-05 to 2008-09, there has been a 18.4% real increase.

15
Federal expenditures on corrections increased in 2008-09
Year Current Dollars Constant 2002 Dollars
Operating Capital Total Per capita Operating Capital Total Per capita $'000 $ $'000 $
2004-05 CSC 1,480,721 105,893 1,586,614 49.67 1,422,813 101,752 1,524,564 47.73 PBC 41,100 -- 41,100 1.29 39,493 -- 39,493 1.23 OCI 2,871 -- 2,871 0.09 2,759 -- 2,759 0.09 Total 1,524,692 105,893 1,630,585 51.05 1,465,064 101,752 1,566,816 49.05 2005-06 CSC 1,533,498 116,843 1,650,341 51.18 1,440,716 109,774 1,550,489 48.08 PBC 42,800 -- 42,800 1.33 40,210 -- 40,210 1.25 OCI 3,115 -- 3,115 0.10 2,927 -- 2,927 0.09 Total 1,579,413 116,843 1,696,256 52.60 1,483,853 109,774 1,593,626 49.42 2006-07 CSC 1,743,847 124,538 1,868,386 57.35 1,608,418 114,866 1,723,285 52.90 PBC 43,400 -- 43,400 1.33 40,030 -- 40,030 1.23 OCI 3,156 -- 3,156 0.10 2,911 -- 2,911 0.09 Total 1,790,403 124,538 1,914,942 58.78 1,651,359 114,866 1,766,226 54.21 2007-08 CSC 1,827,839 140,641 1,968,480 59.78 1,650,717 127,013 1,777,730 53.99 PBC 43,400 -- 43,400 1.32 39,194 -- 39,194 1.19 OCI 3,132 -- 3,132 0.10 2,829 -- 2,829 0.09 Total 1,874,371 140,641 2,015,012 61.20 1,692,740 127,013 1,819,753 55.27 2008-09 CSC 2,024,839 197,992 2,222,831 66.73 1,822,015 178,160 2,000,175 60.04 PBC 48,600 -- 48,600 1.46 43,732 -- 43,732 1.31 OCI 3,854 -- 3,854 0.12 3,468 -- 3,468 0.10 Total 2,077,293 197,992 2,275,285 68.30 1,869,215 178,160 2,047,375 61.46
• Source: Correctional Service Canada; Parole Board of Canada; Office of the Correctional Investigator; Statistics Canada Consumer Price Index.

16
The number of incarcerated federal offenders increased in 2009-10
Year Incarcerated Offenders
Federal1 Provincial/Territorial2
Total Sentenced Remand Other/ Total
2000-01 12,794 10,842 7,392 412 18,646 31,440 2001-02 12,663 10,850 7,933 316 19,099 31,762 2002-03 12,652 10,499 8,686 332 19,516 32,168 2003-04 12,413 9,750 9,118 336 19,204 31,617 2004-05 12,624 9,727 9,587 339 19,653 32,277 2005-06 12,671 9,560 10,875 301 20,736 33,407 2006-07 13,171 9,915 12,104 302 22,321 35,492 2007-08 13,581 9,665 12,914 340 22,919 36,500 2008-09 13,286 9,815 13,486 334 23,635 36,921 2009-10 13,531 -- -- -- -- --
Source: 1Correctional Service Canada.; 2Adult Correctional Survey - Corrections Key Indicator Report for Adults and Young Offenders, Canadian Centre for Justice Statistics, Statistics Canada
Federal offenders under the jurisdiction of the Correctional Service of Canada Status Federal Offenders
# % Incarcerated 13,531 60.8 Community Supervision 8,709 39.2 Actively Supervised 7,338 33.0 Day Parole 1,088 4.9 Full Parole 3,584 16.1 Statutory Release 2,429 10.9 Long Term Supervision Order 237 1.1 Temporarily Detained, while on: 1,011 4.5 Day Parole 133 0.6 Full Parole 139 0.6 Statutory Release 708 3.2 Long Term Supervision Order 31 0.1 Deported 360 1.6 Total 22,240* 100.0
Source: Correctional Service Canada.

17
Offender age at admission to federal jurisdiction is increasing
18
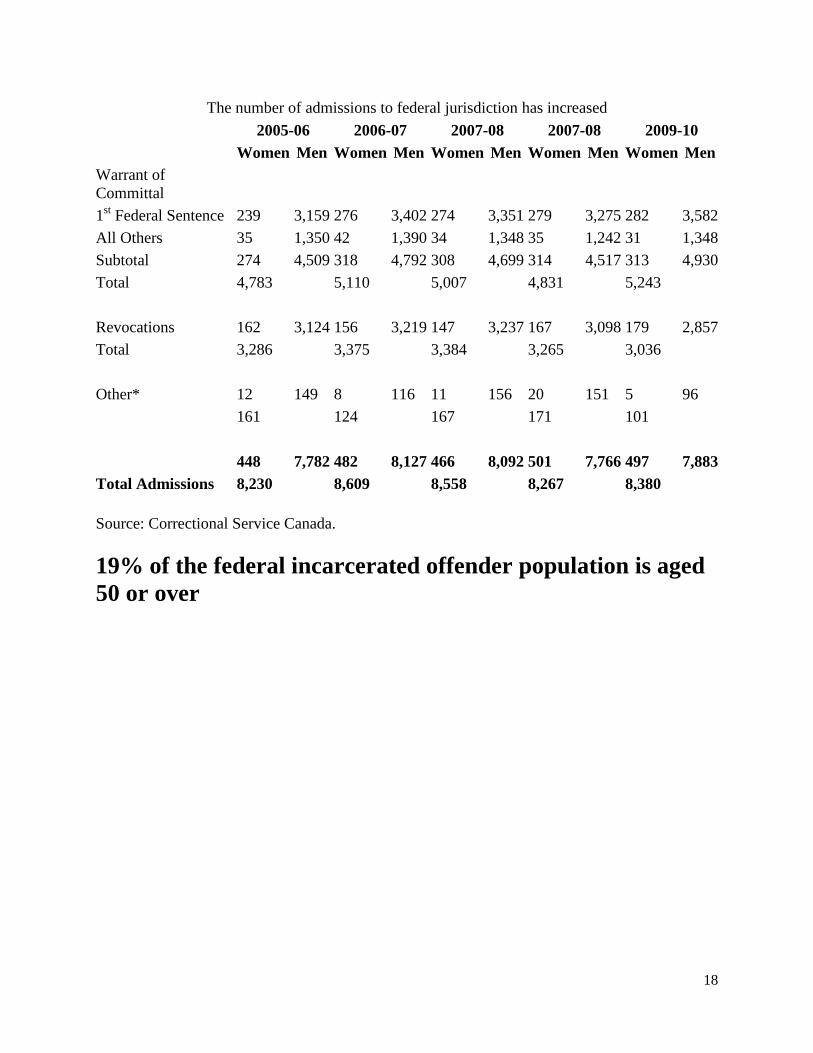
The number of admissions to federal jurisdiction has increased
2005-06 2006-07 2007-08 2007-08 2009-10
Women Men Women Men Women Men Women Men Women Men Warrant of Committal
1st Federal Sentence 239 3,159 276 3,402 274 3,351 279 3,275 282 3,582 All Others 35 1,350 42 1,390 34 1,348 35 1,242 31 1,348 Subtotal 274 4,509 318 4,792 308 4,699 314 4,517 313 4,930 Total 4,783 5,110 5,007 4,831 5,243 Revocations 162 3,124 156 3,219 147 3,237 167 3,098 179 2,857 Total 3,286 3,375 3,384 3,265 3,036 Other* 12 149 8 116 11 156 20 151 5 96 161 124 167 171 101 448 7,782 482 8,127 466 8,092 501 7,766 497 7,883 Total Admissions 8,230 8,609 8,558 8,267 8,380
Source: Correctional Service Canada.
19% of the federal incarcerated offender population is aged 50 or over

19

20
• In 2009-10, Aboriginal offenders represented 17.9% of the total federal offender population while Aboriginal adults represent 3.0% of the Canadian adult population. • Aboriginal offenders accounted for 20.6% of the incarcerated population and 13.7% of the community population in 2009-10.
he majority of incarcerated federal offenders are classified as medium security risk

21
70% of federal offenders are serving a sentence for a violent offence
• A greater proportion of Aboriginal offenders than non-Aboriginal offenders were serving a sentence for a Schedule I offence (62.5% versus 46.3%, respectively).
• 6.9% of Aboriginal offenders were serving a sentence for a Schedule II offence compared to 19.3% of non-Aboriginal offenders.
• 30.1% of women were serving a sentence for a Schedule II offence compared to 16.4% for men. • Schedule I is comprised of sexual offences and other violent crimes excluding first and second
degree murder (see the Corrections and Conditional Release Act). • Schedule II is comprised of serious drug offences or conspiracy to commit serious drug offences
(see the Corrections and Conditional Release Act).

22
Prisons and Jails are Dangerous Places
• In the ten-year period from 1999-00 to 2008-09, 533 federal offenders and 376 provincial offenders have died while in custody.
• The suicide rate was approximately 77 per 100,000 for incarcerated federal offenders, and approximately 71 provincial offenders. Canada: 2007 rate of 10.2 suicides per 100,000 people.
• Between 1999-00 and 2008-09, The homicide rate for incarcerated federal offenders was approximately 24 per 100,000 and 4 per 100,000 for incarcerated provincial offenders. Canada-wide: 1.6 per 100,000 people in 2007.

23
Other Provincial Offenders being Supervised in Community

24
Provincial parole has decreased over the past decade
• Over the past ten years, there has been a 60.4% decrease in the number of offenders on provincial parole, from 2,236 in 1999-00 to 886 in 2008-09.