Georgetown Public Policy Review Volume 17 1 Graduate Thesis Edition 2011-2012

DO SME CREDIT CONSTRAINTS INHIBIT JOB CREATION?
SPURRING EMPLOYMENT IN DEVELOPING COUNTRY FIRMS
A Thesis
submitted to the Faculty of the
Graduate School of Arts and Sciences
at Georgetown University
in partial fulfillment of the requirements for the
degree of
Master of Public Policy
in Public Policy
By
Michael Kurdyla, B.A.
Washington, DC
April 18, 2013

ii
Copyright 2013 by Michael Kurdyla
All Rights Reserved

iii
DO SME CREDIT CONSTRAINTS INHIBIT JOB CREATION?
SPURRING EMPLOYMENT IN DEVELOPING COUNTRY FIRMS
Michael Kurdyla, B.A.
Thesis Advisor: Robert Bednarzik, Ph.D.
ABSTRACT
This paper analyzes the relationship between access to finance and growth for
small and medium enterprises (SMEs) in emerging markets. This study tests the
hypothesis that in developing countries, small businesses hire more employees as the
formal banking sector expands its reach; that is, bank access and employment are
positively related among small businesses.
A business-friendly investment environment is seen by many politicians and
economists as the best way to help private enterprises create more jobs and expedite
economic growth. While there are many potential constraints to individual business
development and expansion – including lack of access to resources, burdensome
regulations, and low institutional quality – the responses of emerging market firms to the
World Bank’s Enterprise Surveys indicate that lack of access to finance, such as credit
lines, is one of the biggest constraints. Without easy, low-cost access to financing,
existing firms are unable to effectively allocate their capital and are unlikely to invest in
expansion projects.
This paper applies a new measure of credit-constrained status to Enterprise
Survey respondents. Previous literature has studied the effects of access to finance on
enterprise growth and examined the effects of liquidity squeezes on firm behavior, but
these studies have been based solely on firm perceptions of credit constraints. Using these
new categories, this assessment determines that actual limits on external financing have a

iv
negative relationship with SME employment. Policies to help expand the banking sector
to reach more small businesses will enable these firms to enhance their growth and job
creation potential.
v
TABLE OF CONTENTS
I. INTRODUCTION ........................................................................................................... 1
II. EXAMINING THE LITERATURE .............................................................................. 4
A. Financial Intermediation and Economic Development .............................................. 4
B. SME Growth and Job Creation .................................................................................. 5
C. Bank Access and Economic Growth .......................................................................... 8
D. Areas for Further Research ...................................................................................... 11
III. EMPIRICAL STRATEGY AND DATA DESCRIPTION ........................................ 12
A. Hypothesis ................................................................................................................ 12
B. Data .......................................................................................................................... 13
C. Descriptive Statistics ................................................................................................ 15
IV. ECONOMETRIC ANALYSIS ................................................................................... 18
A. Methodology ............................................................................................................ 18
B. Regression Results ................................................................................................... 24
C. Robustness of the Models ........................................................................................ 29
V. POLICY RELEVANCE .............................................................................................. 31
A. Relationship of Findings to Literature ..................................................................... 31
B. Policy Recommendations ......................................................................................... 35
VI. CONCLUSION........................................................................................................... 38
APPENDIX ....................................................................................................................... 41
REFERENCES ................................................................................................................. 48
vi
LIST OF FIGURES
Chart 1: Number and Percentage of Firms by Industry in Developing Countries, 2006-09
............................................................................................................................................. 2
Table 1: Credit Constraints by Firm Age and Size in Developing Countries, 2006-09 ... 13
Table 2: Net Change in Full-Time Employees for Firms in Developing Countries by Firm
Characteristics, 2006-09 ................................................................................................... 17
Exhibit 1: Definition of Variables and Calculations ......................................................... 19
Exhibit 2: Variable Matrix and Rationale ......................................................................... 20
Table 3: Access to Financing Perception among Firms in Developing Countries, 2006-09
........................................................................................................................................... 22
Exhibit 3: Decision Tree for Firm Credit Constraints ...................................................... 23
Table 4: Regression Results Using OLS for Full-Time Employees ................................. 26
Table 5: Regression Results Using OLS for Full-Time Employees by Firm Size ........... 28
Table 6: Reported Obstacles to Firm Operation and Growth ........................................... 33
Table 7: Number and Percentage of Firms by Developing Country, 2006-09 ................. 41
Table 8: Additional Regression Results Using OLS for Full-Time Employees by Firm
Size .................................................................................................................................... 42
Table 9: Pairwise Correlations for Regressors .................................................................. 44
Table 10: Variance Inflation Factors for Regressors ........................................................ 45
Chart 2: Plot of Fitted Values vs. Residuals ..................................................................... 46
Chart 3: Plot of Dependent Variable vs. Linear Prediction .............................................. 46
Table 11: Linktest: Regression Results Using Linear Predicted Values .......................... 47

1
I. INTRODUCTION
Over 200 million people are presently unemployed around the world. Across
Europe, the Middle East, and Africa, higher unemployment – particularly among youth –
has increased the potential for social unrest and inhibited politicians from implementing
much-needed reforms to set the stage for sustained economic growth. Governments in
countries as varied as Greece and Egypt and South Africa witness protests on a regular
basis; their citizens express anger over what they perceive as the failure of their
governments to look after their interests and enable them to secure a better life for
themselves and their children by bringing home a regular paycheck.
Policymakers are increasingly looking for effective ways to create jobs, reduce
unemployment, and spur economic recovery. Current development literature has come to
accept a correlation between job creation and economic growth. (IFC 2013; World Bank
2012; ILO 2012) Consequently, poor economic growth in the aftermath of the global
financial crisis and the Arab Spring has propelled job creation to the top of the political
agenda in many countries, including developed ones. During the recent U.S. presidential
election, President Barack Obama and Mitt Romney incorporated job growth into their
debates about health care reform, defense spending, and taxation, and surveys indicated
that almost half of American voters were most influenced by job creation. (Baily 2012)
The private sector is responsible for 90 percent of job creation in the global
economy. (World Bank 2012) Sustaining and increasing support to private enterprises is
seen by many politicians and economists as the best way to drive job creation and
economic growth. What is clear is that businesses need expansion opportunities to
support additional job creation. What is uncertain is the channels through which

2
Chart 1: Number and Percentage of Firms by Industry in Developing Countries,
2006-09
Source: World Bank Enterprise Surveys.
policymakers can spur business expansion for the purpose of boosting employment.
Therefore, it is crucial to understand the constraints that prevent the private sector from
growing and generating jobs.
Chart 1 shows that developing country economies are growing more diversified,
expanding from traditional agriculture into metals and machinery, chemicals and
pharmaceuticals, and electronics. As some countries move in this direction, there are
many others in which agriculture continues to play a critical role. Agricultural production
represents 25 percent of GDP in low-income countries as a group and upwards of half of
employment in countries such as Bhutan, Cambodia, Cameroon, India, and Uganda.
(World Bank 2013) However, in countries that are highly dependent on agriculture,
worker productivity is depressed. Industrialization and diversification into new sectors
21.9%
17.1%
10.9% 8.7%
8.5%
7.7%
2.0%
2.0%
1.1%
0.8%
19.3%
Industry subsector No. of
observations
Food 2,898
Garments 2,260
Chemicals and
pharmaceuticals 1,444
Metals and machinery 1,151
Textiles 1,117 Non-metallic and plastic
materials 1,019
Electronics 263
Wood and furniture 260
Services 150
Auto and auto
components 100
All other sectors 2,558
Total 13,220

3
enables more robust labor markets by creating high-skilled, high value-added jobs to help
employment keep pace with population growth.
One major constraint to the development of new industries is access to finance. In
order to grow, firms require credit and a business environment that is conducive to
additional investment. Without access to finance, existing firms are unable to more
efficiently allocate their capital to drive growth and will likely maintain the status quo.
Previous literature has focused on the detrimental effects of access to finance on
enterprise growth and examined the effects of liquidity squeezes on firm behavior. (Beck
2012; Beck and Demirguc-Kunt 2008; Acs 1999) This paper sets about looking at how
financing constraints influence private job creation in emerging markets using data
collected in World Bank surveys of small and medium enterprises, or SMEs.
In developed and developing countries alike, the majority of private sector jobs
are attributable to SMEs. Evidence shows that SMEs are a major source of non-
government jobs and economic output. (IFC 2010) These small firms are the main drivers
of innovation and economic growth, and the ability for SMEs to access financing is a key
condition for policy measures aimed at job creation to be successful. But private sector
firms, especially SMEs, in emerging markets face a dramatic financing gap. These
businesses are encountering more difficult business environments and seeing fewer
opportunities to attract investment. Improving access to finance for small businesses
could therefore increase the number of jobs created.
The remainder of the paper is organized as follows. Section II examines recent
literature on the contributions of SME growth to job creation. Section III presents the
hypothesis, data, and methodology used to conduct this analysis. Section IV discusses the
4
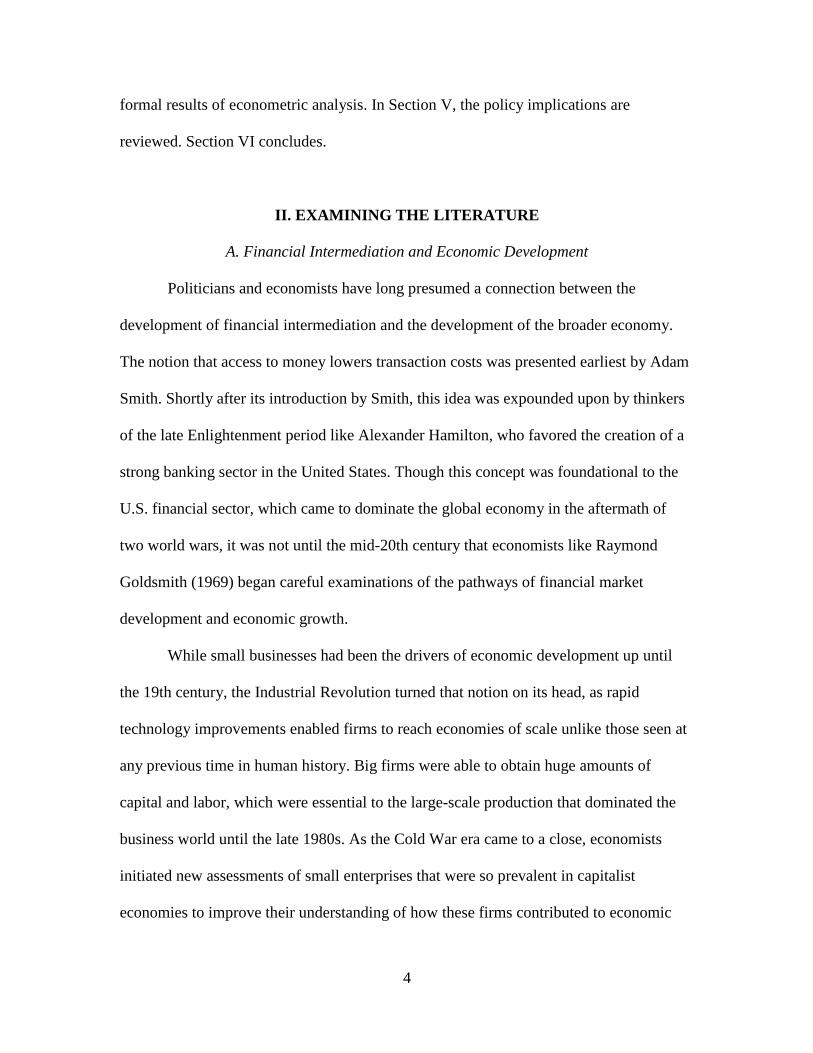
formal results of econometric analysis. In Section V, the policy implications are
reviewed. Section VI concludes.
II. EXAMINING THE LITERATURE
A. Financial Intermediation and Economic Development
Politicians and economists have long presumed a connection between the
development of financial intermediation and the development of the broader economy.
The notion that access to money lowers transaction costs was presented earliest by Adam
Smith. Shortly after its introduction by Smith, this idea was expounded upon by thinkers
of the late Enlightenment period like Alexander Hamilton, who favored the creation of a
strong banking sector in the United States. Though this concept was foundational to the
U.S. financial sector, which came to dominate the global economy in the aftermath of
two world wars, it was not until the mid-20th century that economists like Raymond
Goldsmith (1969) began careful examinations of the pathways of financial market
development and economic growth.
While small businesses had been the drivers of economic development up until
the 19th century, the Industrial Revolution turned that notion on its head, as rapid
technology improvements enabled firms to reach economies of scale unlike those seen at
any previous time in human history. Big firms were able to obtain huge amounts of
capital and labor, which were essential to the large-scale production that dominated the
business world until the late 1980s. As the Cold War era came to a close, economists
initiated new assessments of small enterprises that were so prevalent in capitalist
economies to improve their understanding of how these firms contributed to economic
5
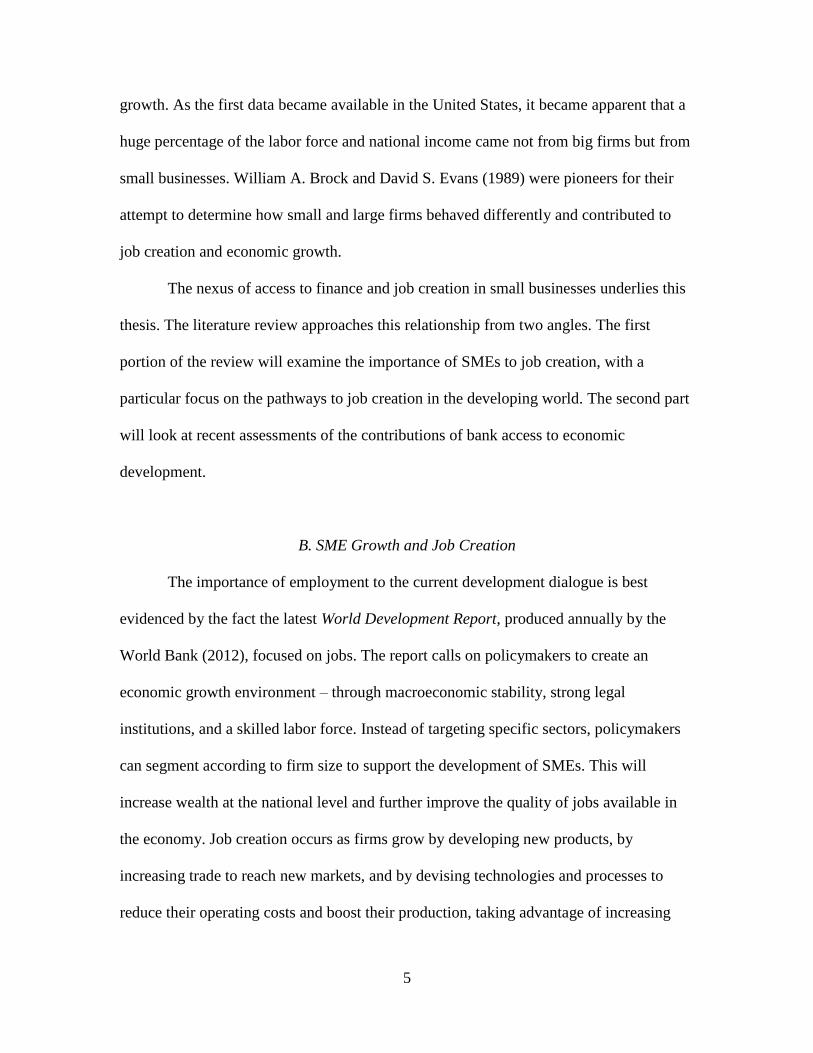
growth. As the first data became available in the United States, it became apparent that a
huge percentage of the labor force and national income came not from big firms but from
small businesses. William A. Brock and David S. Evans (1989) were pioneers for their
attempt to determine how small and large firms behaved differently and contributed to
job creation and economic growth.
The nexus of access to finance and job creation in small businesses underlies this
thesis. The literature review approaches this relationship from two angles. The first
portion of the review will examine the importance of SMEs to job creation, with a
particular focus on the pathways to job creation in the developing world. The second part
will look at recent assessments of the contributions of bank access to economic
development.
B. SME Growth and Job Creation
The importance of employment to the current development dialogue is best
evidenced by the fact the latest World Development Report, produced annually by the
World Bank (2012), focused on jobs. The report calls on policymakers to create an
economic growth environment – through macroeconomic stability, strong legal
institutions, and a skilled labor force. Instead of targeting specific sectors, policymakers
can segment according to firm size to support the development of SMEs. This will
increase wealth at the national level and further improve the quality of jobs available in
the economy. Job creation occurs as firms grow by developing new products, by
increasing trade to reach new markets, and by devising technologies and processes to
reduce their operating costs and boost their production, taking advantage of increasing

6
economies of scale. But without the requisite financing, businesses lack the capital to
make the most efficient investment decisions and take advantage of these potential
avenues for firm expansion.
The World Bank also calls attention to the perception of a market gap in financing
for small startup enterprises. A recent study by the International Finance Corporation
(IFC) and McKinsey (2010) estimated that the unmet need for credit by SMEs in
emerging markets was between $2.2 trillion and $2.7 trillion in 2011. The existence of a
“financing gap” for SMEs indicates that there are significant numbers of SMEs that could
productively use credit if it were available, but cannot obtain financing through the
formal financial system. This observation has been one of the driving forces behind
government programs to direct resources to entrepreneurs, through such agencies as the
Small Business Administration in the United States. An exhaustive report by the
Organization for Economic Cooperation and Development (OECD) (2006) examined the
theories and evidence surrounding the so-called financing gap. Using market surveys
comparing SME perceptions of access to finance in OECD countries and in emerging
markets, the study found the emerging market firms were two and a half times more
likely than their counterparts in the OECD countries to report that they were unable to
access loans. Small businesses self-reported that the inability to access needed capital
was due to such reasons as negative attitudes of banks toward SMEs, negative attitudes of
SMEs toward banks, a general lack of information on the availability of finance, and the
unreliable accounts and credit histories of SMEs.
Claessens (2005) focused on the importance of finance for economic well-being.
His data on the degree of usage of basic financial services across a sample of countries

7
provided some useful policy insights. For firms, access to credit is generally increasing in
some countries, but little of this is coming in the form of SME credit. More common is
consumer finance. Another of his assessments found that most firms express a high desire
for more universal access to financing, which dovetails with firm-level surveys that
access to finance is one of the more commonly reported reasons that businesses are
unable to grow. (Dinh et al. 2010; Correa and Seker 2010; Aterido et al. 2007; Ayyagari
et al. 2005) Not surprisingly, he found that universal access to financing is far from
prevalent in many countries, especially developing countries. But Claessans (2005) also
reminded his readers that bringing access to every SME has generally not been a public
policy objective and is unlikely to be achieved in most countries. Government
interventions to directly broaden the provision of access to finance face countless risks
and costs, including most prominently the risk of missing the targeted groups. In addition,
some SMEs may simply be unattractive customers to banks, which are unwilling to
extend credit.
One of the earliest studies of SME growth was Brock and Evans (1989), who
provided substantial documentation about the shifting role of SMEs, through the lens of
the U.S. economy. They made the first attempt at chronicling the evidence that described
how economic development shifted away from large enterprises and instead centered
around small, young firms. The key driver of this development, representing a discovery
that was quite groundbreaking, was that globalization was driving down transaction costs,
enabling the development of cheaper technology, improving firm knowledge of consumer
preferences, and making resource procurement less costly as supply chains grew from
local to regional to global. Prior to the 1980s, firms involved in large-scale production in
8
most economic sectors faced increasing transaction costs, necessitating a gradual increase
in firm size over time. A compilation of papers by Acs, Carlsson, and Karlsson (1999)
expanded Brock and Evans’ assessment using a larger pool of countries; they found that a
relationship between the growth of micro-, small- and medium-sized enterprises and
macroeconomic development level persists across countries of all income levels.
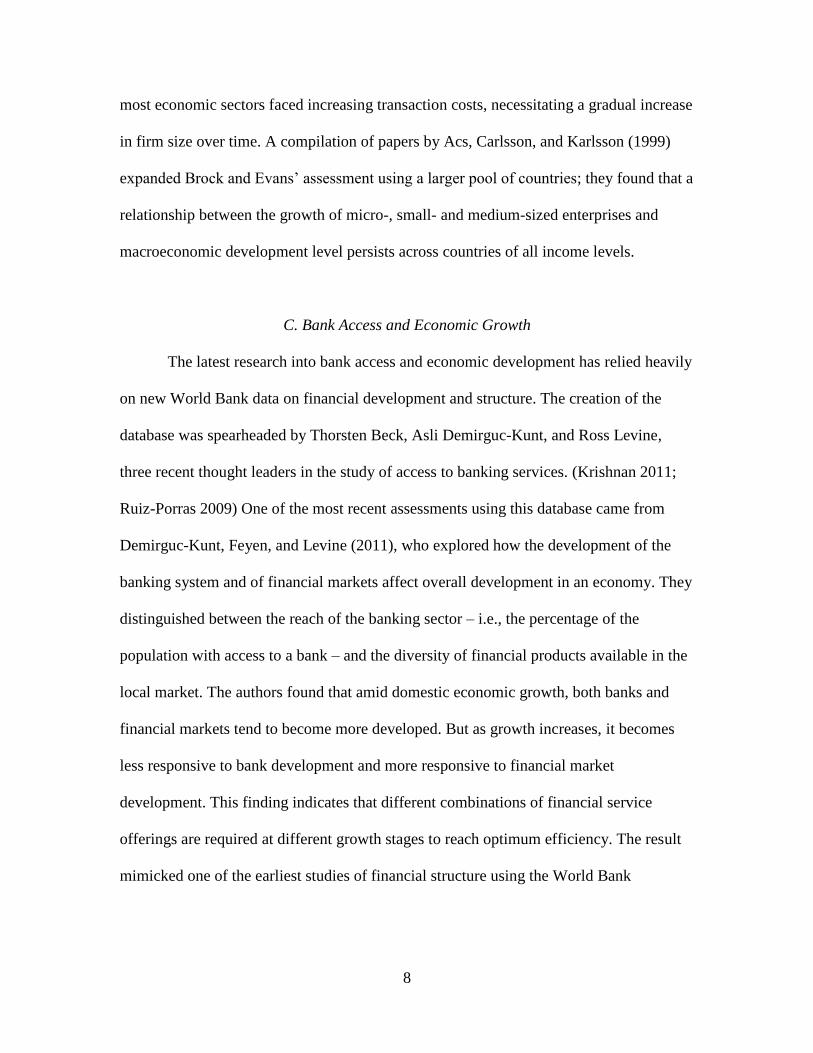
C. Bank Access and Economic Growth
The latest research into bank access and economic development has relied heavily
on new World Bank data on financial development and structure. The creation of the
database was spearheaded by Thorsten Beck, Asli Demirguc-Kunt, and Ross Levine,
three recent thought leaders in the study of access to banking services. (Krishnan 2011;
Ruiz-Porras 2009) One of the most recent assessments using this database came from
Demirguc-Kunt, Feyen, and Levine (2011), who explored how the development of the
banking system and of financial markets affect overall development in an economy. They
distinguished between the reach of the banking sector – i.e., the percentage of the
population with access to a bank – and the diversity of financial products available in the
local market. The authors found that amid domestic economic growth, both banks and
financial markets tend to become more developed. But as growth increases, it becomes
less responsive to bank development and more responsive to financial market
development. This finding indicates that different combinations of financial service
offerings are required at different growth stages to reach optimum efficiency. The result
mimicked one of the earliest studies of financial structure using the World Bank
9
database; Allen and Gale (2000) found that the optimal financial structure tends to
become more market-oriented as economies develop.
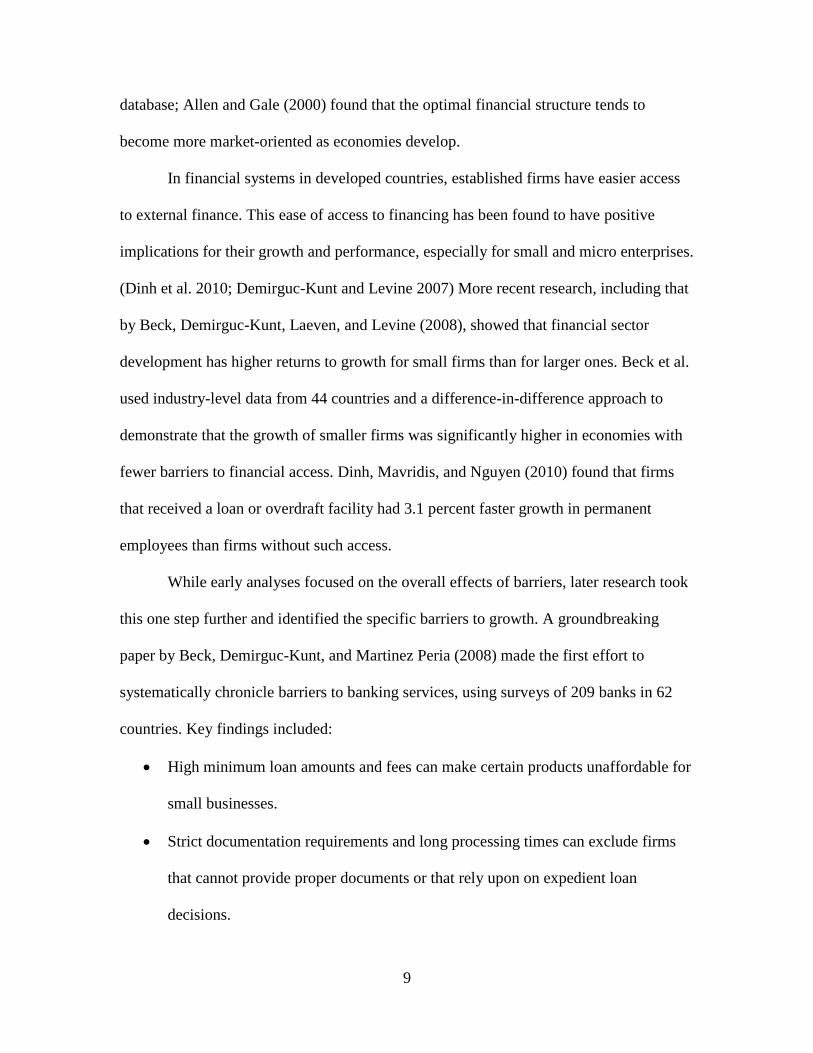
In financial systems in developed countries, established firms have easier access
to external finance. This ease of access to financing has been found to have positive
implications for their growth and performance, especially for small and micro enterprises.
(Dinh et al. 2010; Demirguc-Kunt and Levine 2007) More recent research, including that
by Beck, Demirguc-Kunt, Laeven, and Levine (2008), showed that financial sector
development has higher returns to growth for small firms than for larger ones. Beck et al.
used industry-level data from 44 countries and a difference-in-difference approach to
demonstrate that the growth of smaller firms was significantly higher in economies with
fewer barriers to financial access. Dinh, Mavridis, and Nguyen (2010) found that firms
that received a loan or overdraft facility had 3.1 percent faster growth in permanent
employees than firms without such access.
While early analyses focused on the overall effects of barriers, later research took
this one step further and identified the specific barriers to growth. A groundbreaking
paper by Beck, Demirguc-Kunt, and Martinez Peria (2008) made the first effort to
systematically chronicle barriers to banking services, using surveys of 209 banks in 62
countries. Key findings included:
High minimum loan amounts and fees can make certain products unaffordable for
small businesses.
Strict documentation requirements and long processing times can exclude firms
that cannot provide proper documents or that rely upon on expedient loan
decisions.

10
Variables representing each of these barriers were found to be negatively
associated with lower banking sector outreach and lower percentage of the adult
population with access to financial sector accounts.
On the other hand, access was positively correlated with financial outreach, such as credit
registry enhancements, infrastructure improvements, and freedom of the press.
Goldsmith (1969) brought the first econometric analyses to an area of the
burgeoning field of development economics that had previously been rooted only in age-
old theory. His aim was to assess how financial markets change – in terms of their size,
their makeup, and their availability of financial instruments – as economies expand. He
chronicled the development of national financial systems, demonstrating that financial
intermediaries tend to become larger in comparison to national output as states develop,
and that nonbank financial institutions and stock markets often grow in step with the
banking sector. Goldsmith was limited by a lack of data, however, and was unable to
deepen his assessment much beyond the relationship between financial market size and
economic development moving hand-in-hand. But he was able to determine that
institutional environment, business environment, and financial stability are critical drivers
of financial intermediary development. (Krishnan 2011)
While Goldsmith relied on data up to 1964, recent research has not yet
substantiated Goldsmith’s conclusions with more recent observations. There is now a
much wider availability of firm-level, industry-level, and cross-country data examining
the size of domestic financial markets, offering economists the ability to study the
finance-growth relationship in greater detail. Allen and Gale (2000) and La Porta (1998)
were among the first to do cross-country studies using the newly available data in the

11
World Bank’s database, and found that differences in legal systems impact countries’
financial development and by extension their economic growth.
D. Areas for Further Research
The existing literature on bank access and job creation remains lacking in two
major areas. First, there is a dearth of research to support the theory of financial
inclusion, namely that financial sector development is related to poverty alleviation. Few
studies have addressed the outcomes of increased access to banking products at the
household level. Though this paper focuses exclusively on access to finance for firms, by
drawing a connection between financial sector development and job creation, this paper
may help begin to bridge the gap in this body of knowledge. Much of the difficulty in this
type of assessment stems from the fact that few individual household surveys on financial
inclusion exist, and those that do have yet to be aggregated into global-level data that
could be used for cross-country assessments. Building datasets to benchmark countries on
financial inclusion from the demand side, as opposed to the supply side, will be necessary
to better equip policymakers with the tools to identify the differences between the banked
and the commercially bankable populations and prioritize their efforts at financial
outreach accordingly.
Second, while there exist many broad domestic measures of job creation among
SMEs, there is little ability for researchers to delve deeper into those figures to ascertain
what types of firms create more jobs than others. Additional firm-level studies into labor
productivity and wage levels would also help clear up questions that exist regarding the
reallocation of labor between economic sectors. In recent research, great emphasis is
12
placed on the importance of diversification away from agriculture in promoting broad-
based economic growth in developing countries, but it is unclear whether individual
participants in the labor force see any benefits from a transition to work in a different
sector. Without more information from microenterprises and small businesses on inputs
and outputs, no distinction can be drawn between labor growth and “churning” – that is,
moving between sectors. New developments in this arena should fill the void of
economic research concerning formation, dissolution and growth of businesses and shed
some light on how the impact of regulations differs across businesses of different sizes.
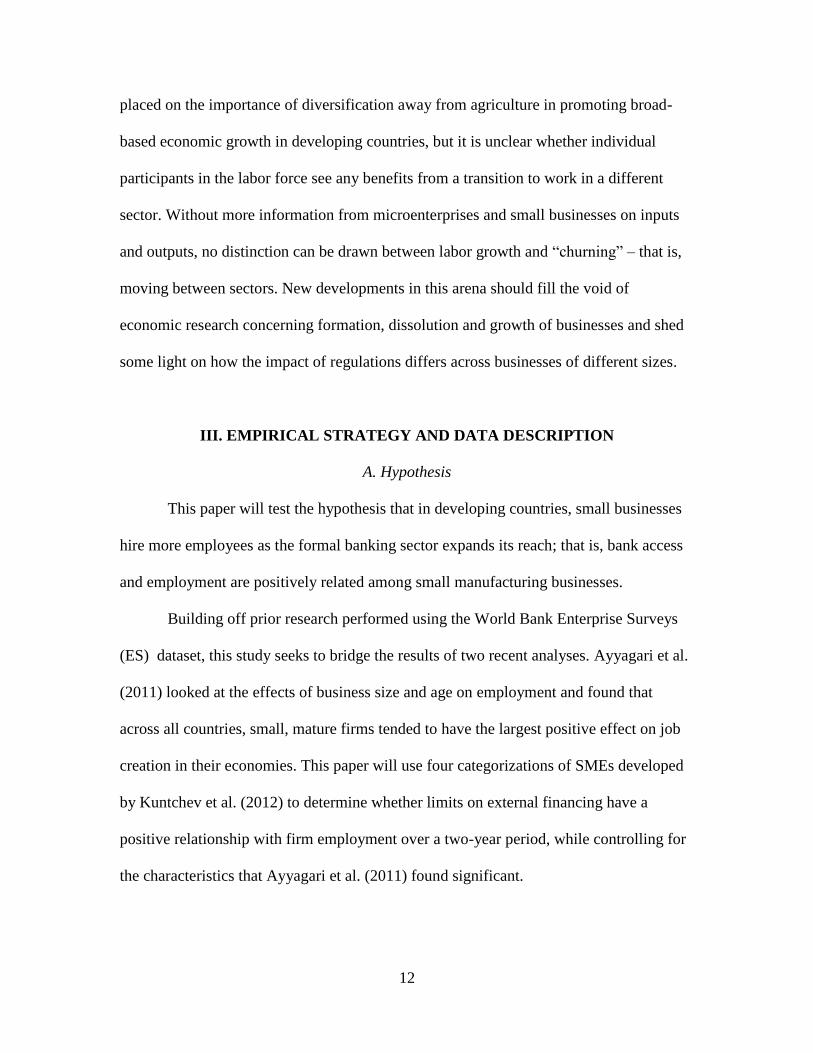
III. EMPIRICAL STRATEGY AND DATA DESCRIPTION
A. Hypothesis
This paper will test the hypothesis that in developing countries, small businesses
hire more employees as the formal banking sector expands its reach; that is, bank access
and employment are positively related among small manufacturing businesses.
Building off prior research performed using the World Bank Enterprise Surveys
(ES) dataset, this study seeks to bridge the results of two recent analyses. Ayyagari et al.
(2011) looked at the effects of business size and age on employment and found that
across all countries, small, mature firms tended to have the largest positive effect on job
creation in their economies. This paper will use four categorizations of SMEs developed
by Kuntchev et al. (2012) to determine whether limits on external financing have a
positive relationship with firm employment over a two-year period, while controlling for
the characteristics that Ayyagari et al. (2011) found significant.

13
Table 1: Credit Constraints by Firm Age and Size in Developing Countries, 2006-09
Firm age Data Firm size
5-100
employees
101-250
employees
>=251
employees
All sizes
<=2 years No. of
observations
476 13 10 499
No. partly/fully
constrained
273 4 3 280
% partly/fully
constrained
57.4% 30.8% 30.0% 56.1%
3-5 years No. of
observations
1,362 71 52 1,485
No. partly/fully
constrained
699 19 10 728
% partly/fully
constrained
51.3% 26.8% 19.2% 49.0%
>=6 years No. of
observations
9,205 1,141 890 11,236
No. partly/fully
constrained
3,909 281 172 4,362
% partly/fully
constrained
42.5% 24.6% 19.3% 38.9%
All ages No. of
observations 11,043 1,225 952 13,220
No. partly/fully
constrained 4,881 304 185 5,370
% partly/fully
constrained 44.2% 24.8% 19.4% 40.6%
Percentages represent the proportion of observations that fall into the partly-credit constrained or fully-
credit constrained categories out of the total number of observations in each age-size group. Source: World
Bank Enterprise Surveys.
Table 1 categorizes the observations in this analysis by firm age and size and
notes the percentage of firms in each category that are either partly or fully credit-
constrained. The youngest and smallest firms are over four times more likely to face
challenges accessing credit than the oldest and largest firms. In fact, firms in existence for
two years or less are more likely to be credit-constrained than not.
B. Data
The ES are a stratified random sample of over 120,000 firms based on interviews
that have been conducted since 1999. The data have been stratified and weighted on the

14
basis of sector, firm size, and geographical location. The interviews capture firm
characteristics and perceptions of investment climate in country, including access to
finance, access to services, exports and imports, and perceptions of local regulations and
institutions. Prior to 2006, differences in survey questions and methodologies across
countries make comparisons difficult. Therefore, the more comparable data collected
between 2006 and 2009 are utilized here.
One challenge that the ES data helps overcome is that there exists little consensus
as to how to determine whether or not a firm qualifies as an SME. Many governments
base their classification schema on firm employment, but there are others who suggest
that classifications using annual revenue or capital investment are more representative.
Even among these criteria there is much debate: the U.S. Small Business Administration
categorizes firms differently depending upon what sector they are in; countries in the
European Union use different thresholds for maximum employment in an SME (in
Belgium, it is 100, while in Germany, it is 255). (Tracy 2011)
For the first time, the ES offers economists specific firm employment statistics
including the number of workers, allowing a consistent definition of SME to be applied
to all countries. For example, the paper will count businesses with up to 250 employees
as SMEs, which is the most commonly used definition among countries and international
organizations that define firm size based on number of workers. (Ayyagari et al. 2005)
The size categorizations stem directly from those used by Ayyagari et al. (2011) Here,
firm size is classified as small (5-100 employees), medium (101-250 employees), or large
(>=251 employees). Similarly for firm age, observations are categorized as young (0-2
years), middle-aged (3-5 years), or mature (>=6 years).
15
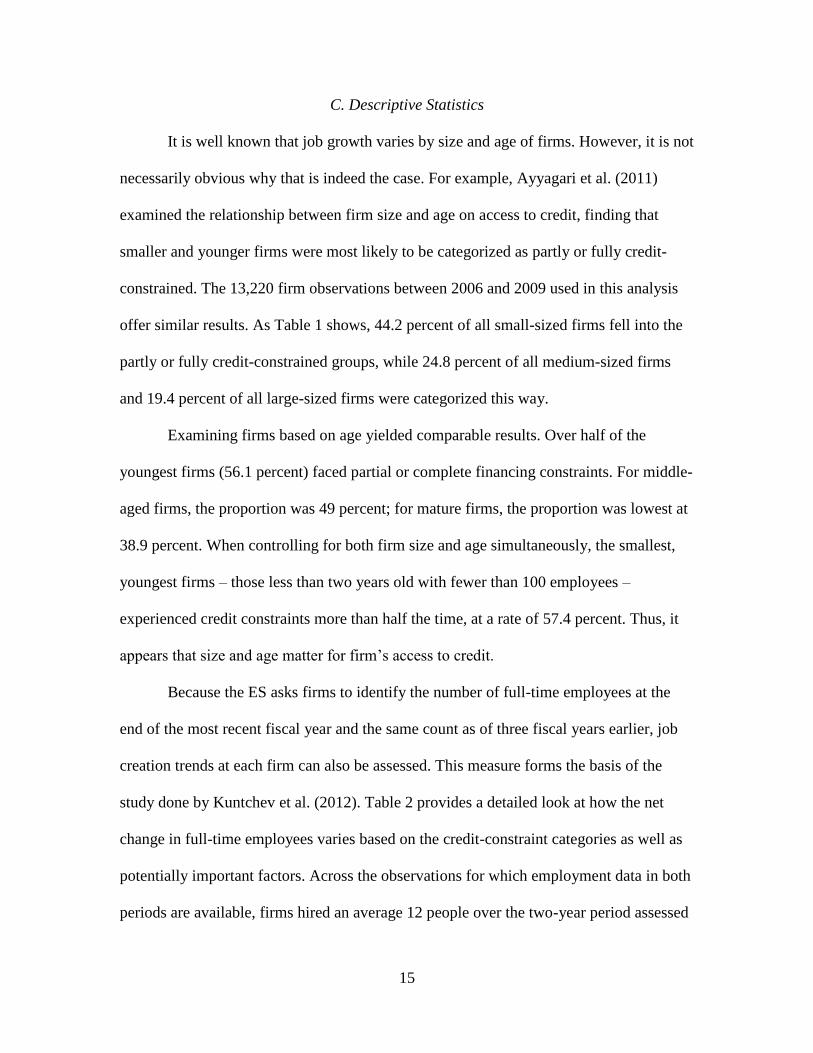
C. Descriptive Statistics
It is well known that job growth varies by size and age of firms. However, it is not
necessarily obvious why that is indeed the case. For example, Ayyagari et al. (2011)
examined the relationship between firm size and age on access to credit, finding that
smaller and younger firms were most likely to be categorized as partly or fully credit-
constrained. The 13,220 firm observations between 2006 and 2009 used in this analysis
offer similar results. As Table 1 shows, 44.2 percent of all small-sized firms fell into the
partly or fully credit-constrained groups, while 24.8 percent of all medium-sized firms
and 19.4 percent of all large-sized firms were categorized this way.
Examining firms based on age yielded comparable results. Over half of the
youngest firms (56.1 percent) faced partial or complete financing constraints. For middle-
aged firms, the proportion was 49 percent; for mature firms, the proportion was lowest at
38.9 percent. When controlling for both firm size and age simultaneously, the smallest,
youngest firms – those less than two years old with fewer than 100 employees –
experienced credit constraints more than half the time, at a rate of 57.4 percent. Thus, it
appears that size and age matter for firm’s access to credit.
Because the ES asks firms to identify the number of full-time employees at the
end of the most recent fiscal year and the same count as of three fiscal years earlier, job
creation trends at each firm can also be assessed. This measure forms the basis of the
study done by Kuntchev et al. (2012). Table 2 provides a detailed look at how the net
change in full-time employees varies based on the credit-constraint categories as well as
potentially important factors. Across the observations for which employment data in both
periods are available, firms hired an average 12 people over the two-year period assessed

16
in the survey, although the range was wide. For example, workforce reductions of over
2,000 people to gains of more than 5,000 employees among some of the largest firms
were reported.
However, when individual firms are aggregated by common characteristics, the
range of job changes shrinks dramatically. The smallest average increase was three
workers, while the largest was 73. Firms in the not and maybe credit-constrained groups
averaged 12 and 24 more jobs, respectively, at the end of the period of analysis than at
the beginning. In contrast, firms that were partly constrained averaged six additional
employees. Firms that were fully constrained averaged only three new workers – the
smallest change among all characteristics.
Significant employment growth was also apparent when segregating firms based
on other characteristics. There was dramatic but expected variation based on firm size:
small-sized firms created seven jobs, medium-sized firms created 23, and large-sized
firms created 73. Job creation was highest among the youngest firms and lowest among
the oldest firms. Firms that had been around for two or less years grew by 38 employees.
Firms that had been in business for at least six years expanded by 10 employees.
Exporting firms added 28 employees while non-exporting firms hired only five more
people. Firms with worker training opportunities added 24 full-time positions; their
counterparts without training grew by just five people.

17
Table 2: Net Change in Full-Time Employees for Firms in Developing Countries
by Firm Characteristics, 2006-09
Characteristic No. of
Observations
Mean Employees,
Three Years Ago
Mean Net
Change in Jobs
Mean Percentage
Change in Jobs
Access to Credit
Not credit-constrained
4,848 88 11.5 29%
Maybe credit-constrained
3,272 140 24.4 52%
Partly credit-constrained
3,096 42 5.7 36%
Fully credit-constrained
2,172 59 3.3 33%
Trade
Exporter
3,634 213 28.1 44%
Not exporter
9,272 35 5.7 35%
Ownership
Female-owned
4,730 91 12.3 37%
Not female-owned
8,176 82 11.9 38%
Training
Worker training
4,829 157 24.1 44%
No worker training
8,077 42 4.8 34%
Age
Firm age: <=2 years
470 2 37.7 72%
Firm age: 3-5 years
1,460 37 22.6 77%
Firm age: >=6 years
10,976 95 9.5 33%
Size
Firm size: 5-100 employees
10,059 24 6.7 31%
Firm size: 101-250 employees
1,046 157 22.6 12%
Firm size: >=251 employees 822 848 73.2 8%
All categories 12,906 86 12.0 37%
This table does not include 314 observations for which employment data were not provided for the period three years
prior. Source: World Bank Enterprise Surveys.

18
IV. ECONOMETRIC ANALYSIS
A. Methodology
To test the hypothesis that in developing countries, bank access and employment
are positively related among small businesses, this paper uses an ordinary least squares
(OLS) linear regression. Based on firms’ responses to the ES questions, employment is
measured as the number of full-time employees at a firm at the conclusion of the most
recent fiscal year, based on the time of the survey.
In order to determine if employment growth and access to credit are related,
several other possible factors must be accounted for. The regression model used in this
paper controls for firm sales in the most recent fiscal year, years of managerial
experience, hours per week spent by firm owners and managers on complying with
regulatory requirements, whether the firm exports its goods abroad, whether any owner or
co-owner of the firm is female, average years of education among firm employees,
whether the firm offers training to its employees, and the age of the firm. Once each of
these controls have been added to the regression model, the observations for which data
are available for all variables span 42 countries and 11 industry sectors. (See Table 7 in
the Appendix for a breakdown of these observations by country.)
While country, year, and industry controls were incorporated into the assessments
of Kuntchev et al. (2012) and Ayyagari et al. (2011), preliminary regression results here
demonstrated that these factors did not significantly change the outcome of the analysis.
Therefore, to conserve degrees of freedom, all three of these categories have not been
included in the model. Exhibits 1 and 2 depict the final model applied in this analysis.

19
Exhibit 1: Definition of Variables and Calculations
where: = JOBS
Log of firm employees at end of last fiscal year
= CREDSTAT
Firm access to credit
Model 1: = BANKFIN
Firm has direct access to external bank financing = 1
Model 2: = FINOBST
Subjective measure of access to credit as a business obstacle (0-4)
Model 3: = MCC
Firm is maybe credit-constrained = 1
= PCC
Firm is partly credit-constrained = 1
= FCC
Firm is fully credit-constrained = 1
= SMALL
Firm size three years ago is between five and 100 employees = 1
= MEDIUM
Firm size three years ago is between 101 and 250 employees = 1
= SALES
Log of firm sales in U.S. dollars in the last fiscal year
= MGREXP
Years of experience for firm’s lead manager
= REGTIME
Average hours per week spent on regulatory compliance
= EXPORTER
Firm exports any share of goods produced = 1
= FEMOWNER
One or more of firm owners are female = 1
= WORKERED
Average years of employees’ formal education
= WORKERTRAIN
Firm provides formal training opportunities for employees
= YOUNG
Firm age is less than or equal to two years = 1
= MIDDLE
Firm age is between three and five years = 1
= Unexplained variance: error term
= Y-intercept
= Coefficients of respective independent variables:
partial slope coefficients
Sources of Variables: All variables from World Bank Enterprise Surveys, data revision as of Feb. 3, 2013.
20
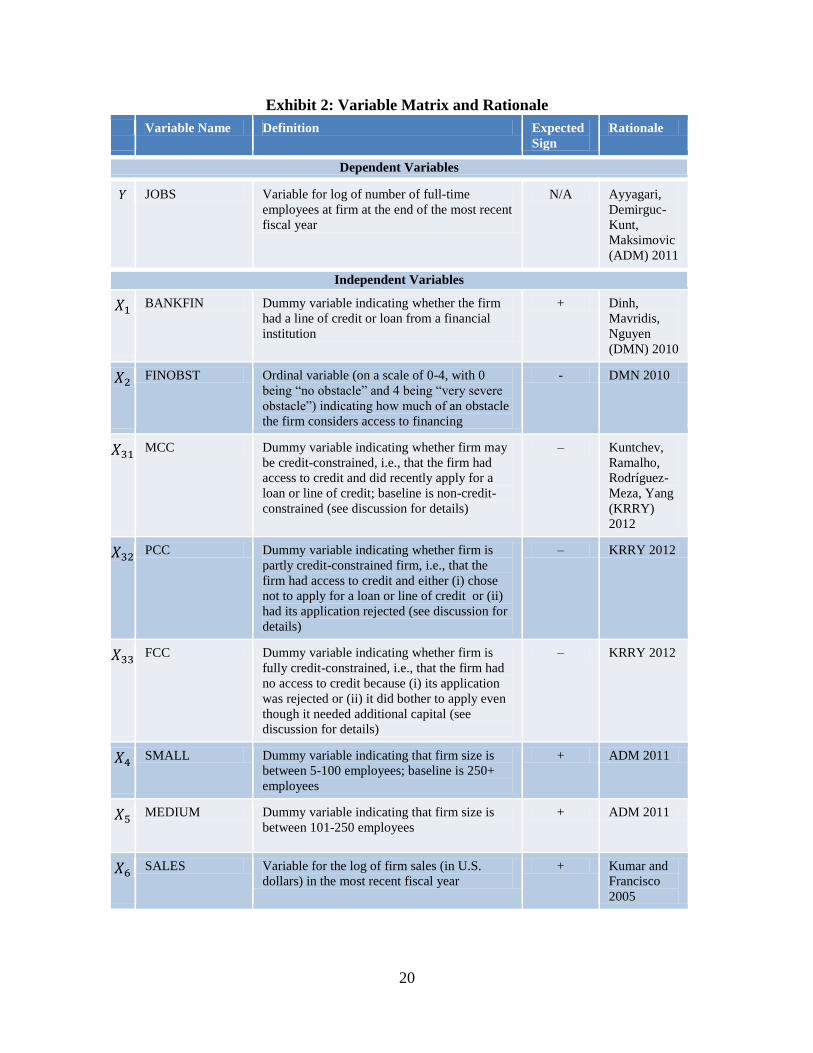
Exhibit 2: Variable Matrix and Rationale
Variable Name Definition Expected
Sign
Rationale
Dependent Variables
JOBS Variable for log of number of full-time
employees at firm at the end of the most recent
fiscal year
N/A Ayyagari,
Demirguc-
Kunt,
Maksimovic
(ADM) 2011
Independent Variables
BANKFIN Dummy variable indicating whether the firm
had a line of credit or loan from a financial
institution
+ Dinh,
Mavridis,
Nguyen
(DMN) 2010
FINOBST Ordinal variable (on a scale of 0-4, with 0
being “no obstacle” and 4 being “very severe
obstacle”) indicating how much of an obstacle
the firm considers access to financing
- DMN 2010
MCC Dummy variable indicating whether firm may
be credit-constrained, i.e., that the firm had
access to credit and did recently apply for a
loan or line of credit; baseline is non-credit-
constrained (see discussion for details)
– Kuntchev,
Ramalho,
Rodríguez-
Meza, Yang
(KRRY)
2012
PCC Dummy variable indicating whether firm is
partly credit-constrained firm, i.e., that the
firm had access to credit and either (i) chose
not to apply for a loan or line of credit or (ii)
had its application rejected (see discussion for
details)
– KRRY 2012
FCC Dummy variable indicating whether firm is
fully credit-constrained, i.e., that the firm had
no access to credit because (i) its application
was rejected or (ii) it did bother to apply even
though it needed additional capital (see
discussion for details)
– KRRY 2012
SMALL Dummy variable indicating that firm size is
between 5-100 employees; baseline is 250+
employees
+ ADM 2011
MEDIUM Dummy variable indicating that firm size is
between 101-250 employees
+ ADM 2011
SALES Variable for the log of firm sales (in U.S.
dollars) in the most recent fiscal year
+ Kumar and
Francisco
2005
21
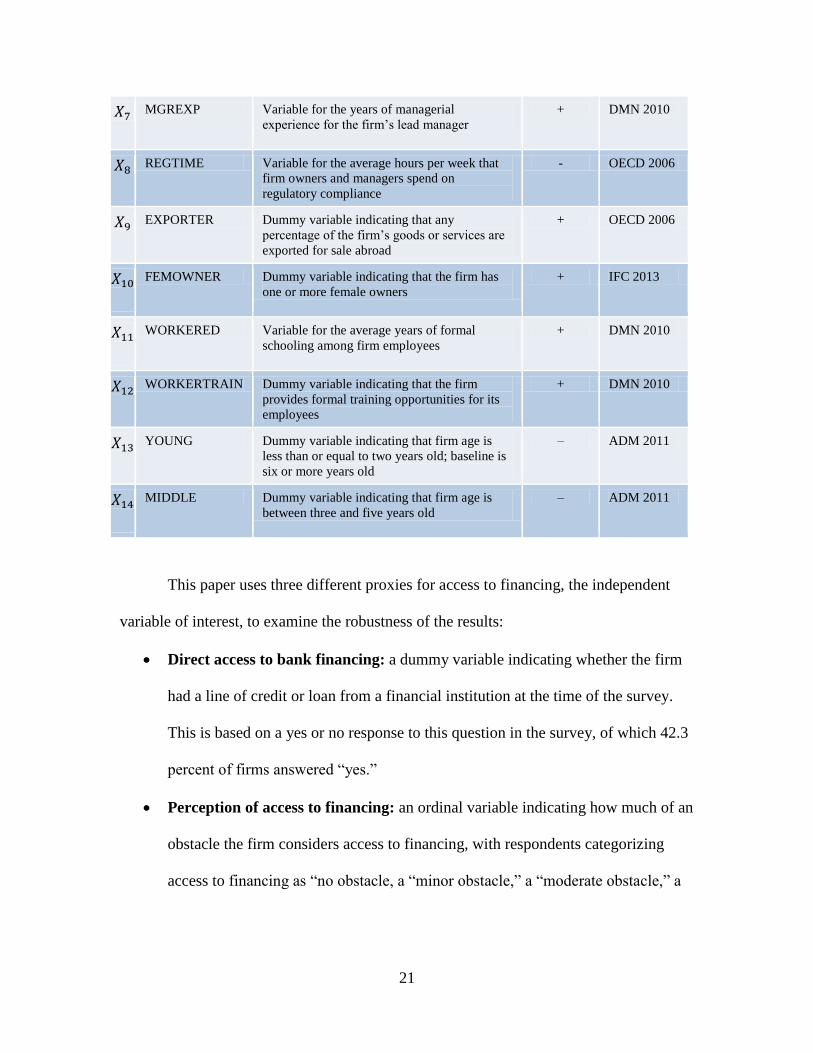
MGREXP Variable for the years of managerial
experience for the firm’s lead manager
+ DMN 2010
REGTIME Variable for the average hours per week that
firm owners and managers spend on
regulatory compliance
- OECD 2006
EXPORTER Dummy variable indicating that any
percentage of the firm’s goods or services are
exported for sale abroad
+ OECD 2006
FEMOWNER Dummy variable indicating that the firm has
one or more female owners
+ IFC 2013
WORKERED Variable for the average years of formal
schooling among firm employees
+ DMN 2010
WORKERTRAIN Dummy variable indicating that the firm
provides formal training opportunities for its
employees
+ DMN 2010
YOUNG Dummy variable indicating that firm age is
less than or equal to two years old; baseline is
six or more years old
– ADM 2011
MIDDLE Dummy variable indicating that firm age is
between three and five years old
– ADM 2011
This paper uses three different proxies for access to financing, the independent
variable of interest, to examine the robustness of the results:
Direct access to bank financing: a dummy variable indicating whether the firm
had a line of credit or loan from a financial institution at the time of the survey.
This is based on a yes or no response to this question in the survey, of which 42.3
percent of firms answered “yes.”
Perception of access to financing: an ordinal variable indicating how much of an
obstacle the firm considers access to financing, with respondents categorizing
access to financing as “no obstacle, a “minor obstacle,” a “moderate obstacle,” a
22
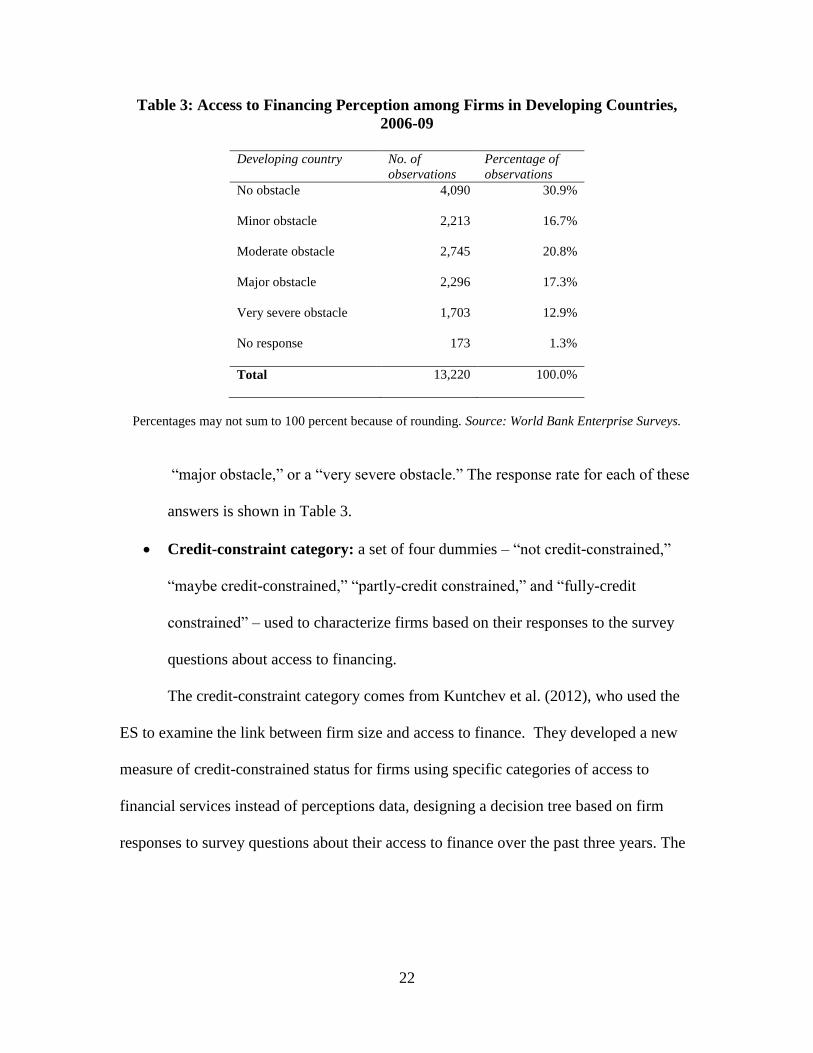
Table 3: Access to Financing Perception among Firms in Developing Countries,
2006-09
Developing country No. of
observations
Percentage of
observations
No obstacle
4,090 30.9%
Minor obstacle
2,213 16.7%
Moderate obstacle
2,745 20.8%
Major obstacle
2,296 17.3%
Very severe obstacle
1,703 12.9%
No response 173 1.3%
Total
13,220 100.0%
Percentages may not sum to 100 percent because of rounding. Source: World Bank Enterprise Surveys.
“major obstacle,” or a “very severe obstacle.” The response rate for each of these
answers is shown in Table 3.
Credit-constraint category: a set of four dummies – “not credit-constrained,”
“maybe credit-constrained,” “partly-credit constrained,” and “fully-credit
constrained” – used to characterize firms based on their responses to the survey
questions about access to financing.
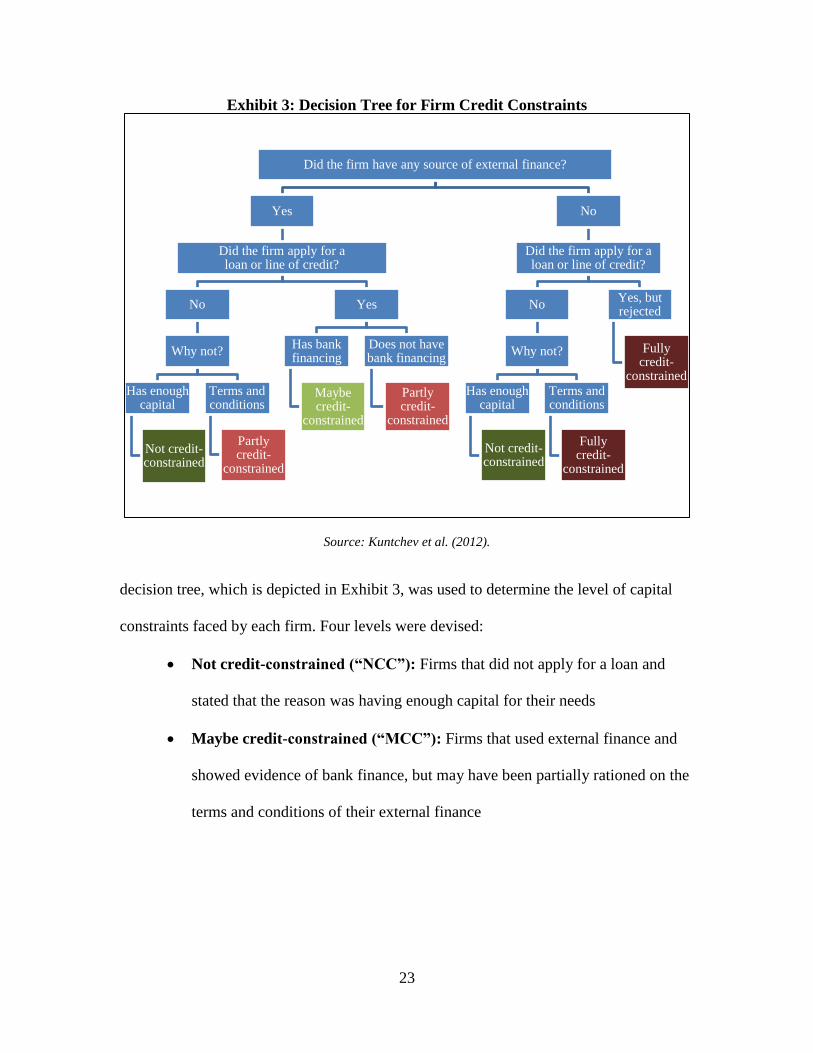
The credit-constraint category comes from Kuntchev et al. (2012), who used the
ES to examine the link between firm size and access to finance. They developed a new
measure of credit-constrained status for firms using specific categories of access to
financial services instead of perceptions data, designing a decision tree based on firm
responses to survey questions about their access to finance over the past three years. The
23
Exhibit 3: Decision Tree for Firm Credit Constraints
Source: Kuntchev et al. (2012).
decision tree, which is depicted in Exhibit 3, was used to determine the level of capital
constraints faced by each firm. Four levels were devised:
Not credit-constrained (“NCC”): Firms that did not apply for a loan and
stated that the reason was having enough capital for their needs
Maybe credit-constrained (“MCC”): Firms that used external finance and
showed evidence of bank finance, but may have been partially rationed on the
terms and conditions of their external finance
Did the firm have any source of external finance?
Yes
Did the firm apply for a loan or line of credit?
No
Why not?
Has enough capital
Not credit-constrained
Terms and conditions
Partly credit-
constrained
Yes
Has bank financing
Maybe credit-
constrained
Does not have bank financing
Partly credit-
constrained
No
Did the firm apply for a loan or line of credit?
No
Why not?
Has enough capital
Not credit-constrained
Terms and conditions
Fully credit-
constrained
Yes, but rejected
Fully credit-
constrained

24
Partly credit-constrained (“PCC”): Firms that used external finance but
either (i) did not apply for a loan for any other reason than having enough
capital1 or (ii) had their loan application rejected
Fully credit-constrained (“FCC”): Firms that did not use external finance
but applied for a loan and did not have one outstanding at the time of the
survey
With this status, Kuntchev et al. found that SMEs are more likely to be credit constrained
– either partly or fully – than large firms.
B. Regression Results
Model 1 uses the simple dummy of access to bank financing as the variable of
interest. The baseline scenario is therefore a firm that no bank financing at the time of the
survey, did not export, had no female owners or part-owners, did not offer worker
training, and had been in business for at least six years, with all remaining interval-ratio
variables held at their means. Keeping all other factors constant, a firm with a line of
credit or a loan had more employees than a firm without bank financing. The average
business with external bank financing hired 24 percent more workers than a similar
business without this form of credit. This regression explained 68 percent of the variation
in full-time firm employment.
Sales, manager experience, regulatory constraints, export status and worker
training all had highly statistically significant positive relationships with firm
1 Survey respondents are given seven options when asked what was the main reason their firm did not
apply for a loan or line of credit: (i) no need – sufficient capital; (ii) complex application procedures; (iii)
unfavorable interest rates; (iv) unattainable collateral requirements; (v) insufficient loan size and maturity;
(vi) did not think it would be approved; and (vii) other.
25
employment. Younger firms – both in the 0-2 years and the 3-5 years categories – had
robustly lower levels of firm employment on average compared to the baseline case of
firms aged six years or older.
As the coefficients in Model 2 demonstrate, increasing the level of the obstacle
ranking for access to financing reduced the expected number of employees at that firm.
As an example, a firm that saw access to financing as a “major” obstacle had 4 percent
fewer employees on average than a firm that perceived access to financing as a
“moderate” obstacle, 7 percent fewer employees than a “minor” obstacle firm, and 11
percent fewer employees than a firm that said it experienced no access to financing
constraints. Meanwhile, this firm with access to financing as a “major” obstacle would be
expected to have 4 percent more employees than a firm which labeled credit as a “very
severe” obstacle. The robustness of this assessment was examined using a regression
model in which each category was given its own dummy variable. With the same set of
controls, the moderate, major, and very severe categories were all found to be negatively
related to firm employment when compared to the baseline of no access to credit
obstacles. Across the control variables, Model 2 resulted in the same significance levels
as Model 1.
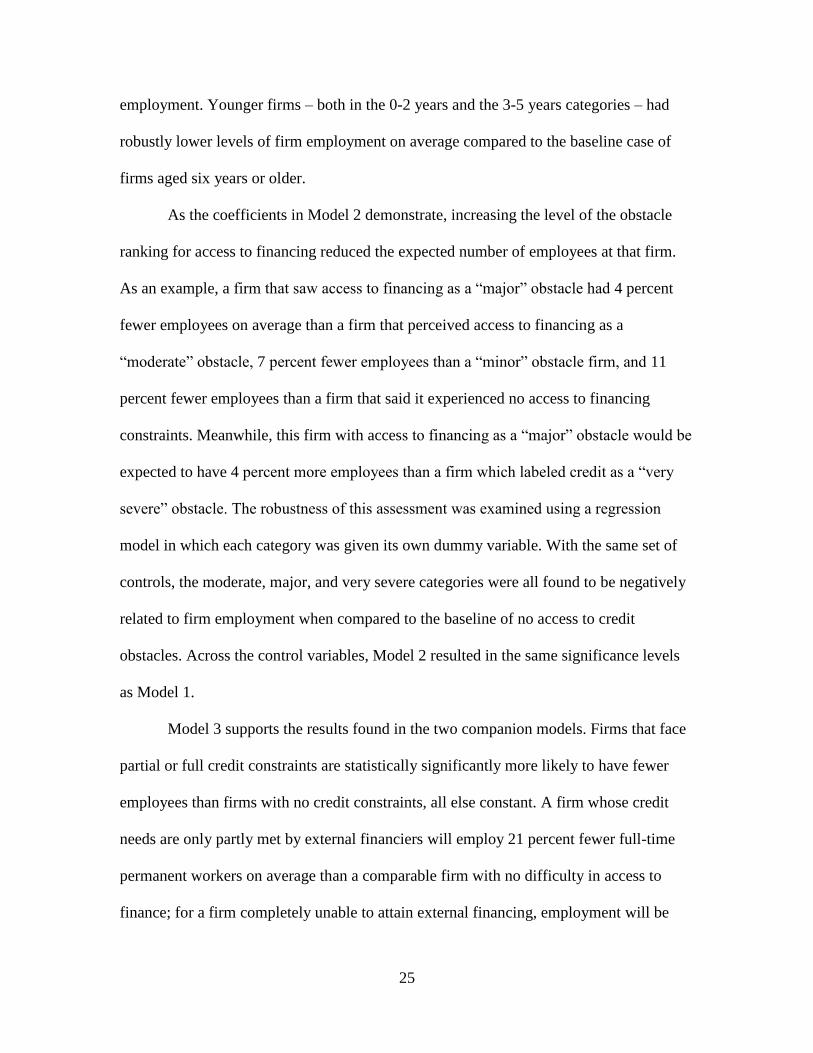
Model 3 supports the results found in the two companion models. Firms that face
partial or full credit constraints are statistically significantly more likely to have fewer
employees than firms with no credit constraints, all else constant. A firm whose credit
needs are only partly met by external financiers will employ 21 percent fewer full-time
permanent workers on average than a comparable firm with no difficulty in access to
finance; for a firm completely unable to attain external financing, employment will be
26
Table 4: Regression Results Using OLS for Full-Time Employees
(1) (2) (3)
Full-Time Employees in Most Recent Fiscal Year
Dummy: Access to bank financing 0.231***
(16.97)
Perception of access to finance -0.0362***
(-7.859)
Dummy: Maybe-credit constrained 0.0556***
(3.273)
Dummy: Partly-credit constrained -0.213***
(-12.51)
Dummy: Fully-credit constrained -0.228***
(-12.04)
Size Dummy (5-100 employees) -2.801*** -2.808*** -2.788***
(-101.4) (-100.4) (-101.0)
Size Dummy (101-250 employees) -1.096*** -1.102*** -1.099***
(-34.54) (-34.34) (-34.71)
Ln(Sales), most recent fiscal year 0.0711*** 0.0728*** 0.0729***
(36.06) (36.40) (36.82)
Manager experience 0.00350*** 0.00402*** 0.00357***
(6.054) (6.865) (6.184)
Time spent on regulatory requirements 0.00442*** 0.00477*** 0.00440***
(11.62) (12.41) (11.59)
Dummy: Exporter 0.368*** 0.380*** 0.368***
(23.64) (24.19) (23.72)
Dummy: Female owner 0.00288 0.0173 0.00545
(0.218) (1.299) (0.414)
Average worker education 0.00676 0.0139** 0.00906
(1.023) (2.082) (1.378)
Dummy: Worker training 0.303*** 0.333*** 0.311***
(21.60) (23.68) (22.22)
Age Dummy (<=2 years) -0.209*** -0.244*** -0.216***
(-6.176) (-7.142) (-6.409)
Age Dummy (3-5 years) -0.164*** -0.174*** -0.166***
(-7.929) (-8.293) (-8.050)
Constant -2.801*** -2.808*** -2.788***
(-101.4) (-100.4) (-101.0)
Observations 13,180 13,047 13,220
R-Squared 0.712 0.707 0.713
F-Statistic 2717 2616 2342
Probability 0 0 0
T-statistics are given in parentheses. *, **, and *** represent statistical significance at the 90 percent, 95
percent, and 99 percent levels. There are 40 observations for which data was not available for the access to
finance dummy, and 173 observations which lacked data on perception of access to finance.

27
23 percent lower. It is, however, interesting to note that maybe credit-constrained firms
are likely to have more employees than firms without any constraints. This is attributable
to the difficulty of accurately characterizing maybe credit-constrained firms, which is
noted by Kuntchev et al. (2012), who originated this categorization system. As discussed
previously, the absence of more specific data in the ES prevents the credit constraints
facing firms in this category from being properly identified. In Model 3, the same
significant relationships hold as in both previous models.
Segmenting the results of Model 3 by firm size, as shown in Table 5, provides
some variation in outcomes for medium-sized and large-sized firms. The regression for
small-sized firms (Model 4) yields the same results as the analysis across all firms. For
medium-sized and large-sized firms, depicted by Model 5 and Model 6 respectively,
however, none of the credit-constraint categories have coefficients significantly different
from zero. Only firm sales, export status, and worker training have robust positive
relationships with firm employment level across all three size categories. This trend is
maintained regardless of which of the three measures of access to finance is used. (Table
8 in the Appendix provides detailed regression results for models that segment the banks
by number of employees while incorporating the access to bank financing dummy and
the perception of financing constraints variable as the independent variable of interest.)
Some of these outcomes may result from the dearth of observations in certain
categories: for example, as Table 1 shows, there are fewer than 20 firms that fall into the
category of medium- or large-sized and under two years old. This may explain why the
results of this assessment do not completely support those conclusions reached by
Ayyagari et al. (2011), who found firm age to be a significant driver of employment

28
Table 5: Regression Results Using OLS for Full-Time Employees by Firm Size
(4)
Small
(5-100 employees)
(5)
Medium
(101-250 employees)
(6)
Large
(251+ employees)
Full-Time Employees in Most Recent Fiscal Year
Dummy: Maybe-credit constrained 0.0944*** 0.0248 -0.0788
(4.747) (1.424) (-1.455)
Dummy: Partly-credit constrained -0.221*** -0.00404 -0.150*
(-11.80) (-0.179) (-1.743)
Dummy: Fully-credit constrained -0.245*** 0.0131 0.0331
(-11.73) (0.500) (0.391)
Ln(Sales), most recent fiscal year 0.0822*** 0.00794*** 0.0446***
(36.21) (3.518) (6.787)
Manager experience 0.00376*** 0.000311 0.00476**
(5.760) (0.476) (2.177)
Time spent on regulatory requirements 0.00437*** -0.000124 0.00438***
(10.23) (-0.278) (2.955)
Dummy: Exporter 0.420*** 0.0550*** 0.300***
(23.28) (3.651) (5.259)
Dummy: Female owner 0.00393 0.00283 0.0195
(0.264) (0.185) (0.394)
Average worker education 0.0111 0.00525 -0.0420*
(1.494) (0.657) (-1.703)
Dummy: Worker training 0.344*** 0.0306** 0.185***
(21.74) (1.982) (3.342)
Age Dummy (<=2 years) -0.215*** -0.160** 0.183
(-5.994) (-2.239) (0.799)
Age Dummy (3-5 years) -0.177*** -0.0642** 0.0522
(-7.927) (-2.030) (0.504)
Constant 1.242*** 4.795*** 5.107***
(27.20) (92.80) (30.10)
Observations 11,043 1,225 952
R-Squared 0.268 0.043 0.094
F-Statistic 336.3 4.549 8.075
Probability 0 3.20e-07 0
T-statistics are given in parentheses. *, **, and *** represent statistical significance at the 90 percent, 95
percent, and 99 percent levels.

29
level. Overall, the models presented here demonstrate support for the hypothesis that
bank access and firm employment are positively related among emerging market firms.
This relationship is most definitively pronounced among small-sized firms.
C. Robustness of the Models
The models admittedly have several limitations. First, the dataset only includes
formal private-sector firms, so this analysis cannot cover the vast network of informal
businesses operating throughout emerging markets. International Labor Organization
statistics indicate that across emerging markets, roughly 60 percent of the workforce is
employed by the formal sector. (ILO 2012) Second, the ES survey is only administered to
small businesses with more than five employees, so that the results may not be
representative of the tiniest microenterprises. (Bauchet and Morduch 2011) Third, given
the vast turnover of firms in any economy, this assessment can only examine firms that
have survived, not those that have failed, causing the magnitude of the estimators to be
overstated. Finally, the proxies used in this assessment are only as good as the data upon
which they are based. Among the concepts which are thought to be associated with job
growth are:
Access to resources (e.g., land, credit, electricity)
Regulatory burdens (e.g., high taxes, high entry costs, strict labor regulations)
Institutional quality (e.g., corruption, lack of transparency and accountability,
weak rule of law)
Human capital (e.g., characteristics of managers, like gender and experience)
Economic inequality

30
Quality of public services (e.g., infrastructure, safety nets)
Many of these notions are difficult to capture in proxy measures. Gender provides
a useful example. While some experts in gender issues contend that having women
owners or managers provides a boost to firm growth, the only measure available in the
ES is whether any owner is a female. This assessment groups together single-owner firms
held by women and cooperatives in which a single woman is one of many owners.
Though the ES is able to provide enough data to use three different proxies for access to
financing, this is the only proxy available for women ownership. Throughout the
literature based on the ES, this issue of data availability is cited as a concern. Though the
ES has made huge strides and provided researchers for the first time with detailed firm
level data across many different markets, missing observations across certain categories
of firms and other consistency issues are commonly reported. (Seker 2011; Amin 2010;
Djankov et al. 2010)
As a result, the results of certain model specification tests should not be taken to
refute the conclusions of the analysis. Various robustness tests, including a regression of
linear predicted values against firm employment levels and the Ramsey RESET test, raise
potential issues with model specification.2 Given the aforementioned issue of data
quality, however, there is little reason to disregard the regression results based solely on
this concern.
The models used in this assessment do not include robust standard errors despite a
significant test statistic on Cameron & Trivedi’s decomposition of IM test for
heteroskedasticity. In analyzing the regression results using both regular and robust
2 See Chart 3 and Table 11 in Appendix.

31
standard errors, the results did not differ tremendously.3 In addition, an examination of
the residuals versus the fitted values did not produce any noteworthy trends that would
lead to a conclusion that heteroskedasticity is a serious problem. Though there is some
collinearity between the regressors, particularly the various category dummies, the
variance inflation factors do not indicate a cause for concern.4
V. POLICY RELEVANCE
A. Relationship of Findings to Literature
Much of the current research into employment channels examines policies that
promote the growth of small businesses. SMEs provide two-third of the formal jobs in the
private sector in emerging markets. (IFC 2010) SMEs enjoying high worker productivity
per capita create jobs faster than less productive SMEs, and there is a positive
relationship between initial labor productivity and employment growth across firms.
(World Bank 2012) Policies to encourage the development of SMEs in emerging markets
can therefore be an effective way to support job creation for large swathes of the
population.
In industry surveys, SMEs around the globe have consistently reported access to
finance and access to electricity as the leading constraints on business growth. However,
these are just two of a multitude of reasons why an entrepreneur may choose not to
launch or expand a business. Many potential constraints exist that can stunt the job
creation and productivity potential of small businesses. Burdensome regulations prevent
the hiring and firing of employees and cause business owners to spend long periods of
3 See Chart 2 in Appendix.
4 See Tables 9 and 10 in Appendix.

32
time applying for permits or completing tax returns. Poor institutions make firms less
likely to invest in research and development because they cannot count on the legal
system for intellectual property protections. Low human capital makes workers less
productive, forcing employers to do more hiring to sustain output levels. High economic
inequality helps firms already in the market lobby the government to protect the status
quo in order to maintain the advantages they have acquired and keep reformers at bay.
Poor public services, such as infrastructure, may make it difficult to ship goods to market
and engage in international trade. Policies that eliminate these barriers and create
incentives to small business entry, exit and formalization will promote more dynamic,
productive small business segments.
Each of these constraints stunts the job creation and productivity potential of
small businesses. Among the sample of firms examined in this analysis, access to
financing was the second most common response to the question, “What is the biggest
problem you currently face?”, selected by 16 percent of firms. This ranks access to
financing behind access to electricity (18 percent), and just ahead of the practices of
competitors in the informal sector (15 percent), tax rates (9 percent), and political
instability (7 percent). The full list of responses is shown in Table 6.
As one of the biggest challenges faced by emerging market SMEs, access to
finance must be one of the major policies taken into account by policymakers when
examining how markets function and what barriers to entry new businesses face. Policies
that eliminate these barriers and create incentives to small business entry, exit and
formalization will promote more dynamic, productive small business segments.

33
Table 6: Reported Obstacles to Firm Operation and Growth
Most severe obstacle Number of respondents
Electricity 2,336
Access to finance (availability and cost) 2,084
Practices of informal sector competition 1,982
Tax rates 1,159
Political instability 880
Crime, theft and disorder 737
Corruption 711
Inadequately educated workforce 706
Labor regulations 534
Tax administration 392
Access to land 335
Transportation of goods, supplies and inputs 330
Business licensing and permits 329
Customs and trade regulations 256
Courts 133
All responses 12,904
This table does not include 316 observations for which responses were not given. Source: World Bank
Enterprise Surveys.
While there are not many studies that have used the ES to examine firm access to
financing because of how new the database is, there is much theory across popular
development literature that postulates relationships between certain firm characteristics
and firms’ ability to create permanent employment opportunities for workers in the
surrounding communities. Some of them have been examined here. For example,
exporting firms have significantly more employees than non-exporting firms, supporting
literature that emphasizes the importance of international trade to employment growth.
(Lippoldt 2012) This finding suggests that government policies to help firms expand
their business into overseas markets, such as financing from export credit agencies and
other multilateral agencies, can have a substantial impact on firm employment levels.
(OECD 2006)

34
Firms that offer worker training hire significantly more employees on average
than their counterparts that do not provide such opportunities, highlighting the
importance of human capital. More research would be needed to assess how this
mechanism contributes to employment gains. Perhaps the returns to employment as a
result of employee training stem from improvements in the operational efficiency of the
business, which allows for growth. On the other hand, it could also be that good owners
and managers recognize the value of a well-trained workforce, and managerial skills
contribute both to the availability of specialized training and the success of the overall
business.
Finally, firm sales are significantly positively related to firm employment levels.
Fundamental microeconomic theory indicates that a firm’s output is a function of its
labor and capital stock, so it should come as no surprise that output and labor were found
to rise and fall in lockstep in this analysis. Meanwhile, variables that measure manager
experience, female ownership, and average worker education do not prove to be robust
drivers of firm employment.
In summary, credit constraints had a highly significant negative relationship with
firm employment, supporting this paper’s hypothesis as well as many previous studies.
(IFC 2013; Kuntchev et al. 2012; World Bank 2012; Dinh et al. 2010) This relationship
held regardless of whether the variable of interest was based on the response to a single
objective survey question about banking access, a subjective ranking of a firm’s credit
constraints, or a categorization of a firm by credit-constraints level based on its responses
to a series of questions. The explanatory power of all models was high, and a model using
the four credit-constrained categories devised by Kuntchev et al. (2012) resulted in the
35
highest R-squared value. When examining the firms according to size, however, the
negative relationship between credit constraints and employment was only apparent for
small-sized firms. This relationship was likely not found significant for medium-sized
firms and large-sized firms because of a lack of data on large-sized firms and other issues
with the quality of data available in the ES.
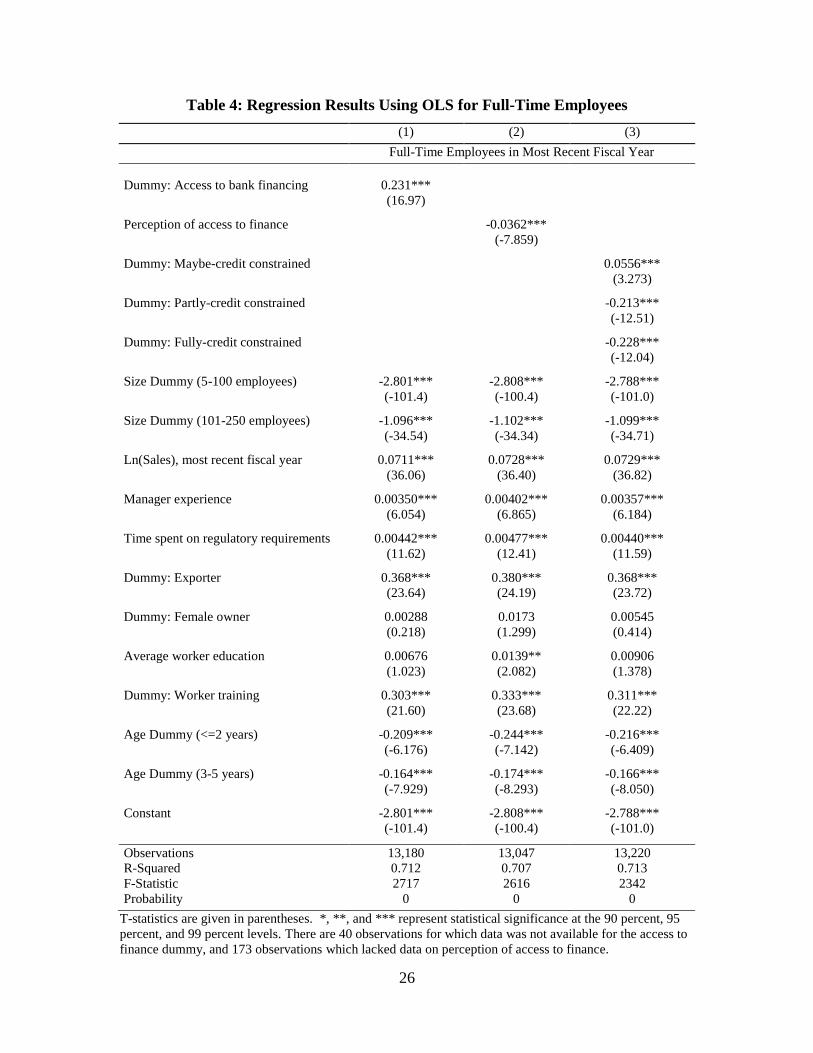
B. Policy Recommendations
In the aftermath of the European financial crisis, macroeconomic conditions have
temporarily suspended the growth of credit in emerging markets, with significant effects
for governments, businesses, and households. European banks have traditionally supplied
the majority of external financing to certain regions of the developing world, such as sub-
Saharan Africa. But these banks are increasingly reducing their activities in emerging
markets as part of a massive “deleveraging” process. Data from the Bank of International
Settlements (BIS) show that at recently as December 2010, European banks provided
over 80 percent of cross-border lending available in sub-Saharan Africa. In the most
recently available data, covering through September 2012, European banks’ share has
fallen to less than 50 percent. (Avdjiev et al. 2012) This deleveraging has been brought
about by changing risk perceptions and the requirements of new regulatory regimes. As a
result of the financial crisis, regulators around the globe have enacted stricter standards to
help prevent the overleveraging and other risky behavior by financial institutions that led
to the crisis.
Though these new regulations are not expected to be fully in place until 2018,
their impacts are already being felt in global markets. The International Monetary Fund

36
(2011) estimated that $3.6 trillion in financing provided by global banks will need to be
refinanced by the end of 2013. Concurrent with massive public sector financing needs
rising into the hundreds of billions of dollars, this means that the riskiest investments –
most commonly SMEs in emerging markets – are most likely to see their financing needs
go unmet in global financial markets.
As emerging markets grow more capital-constrained amid new regulatory regimes
and higher costs of client due diligence, policymakers will be challenged to find new
pathways for channeling support for banks based in these countries, as well as the small
businesses that rely on them for financing. This paper supports the existing literature by
validating and expanding upon the results of previous studies that have demonstrated the
need to pay particular attention to the constraints faced by SMEs if the ultimate objective
is job creation. Firms that require additional financing to grow but experience partial or
complete interruptions in credit access will be unable to expand their workforce. In the
absence of policies to ensure a continued flow of financing to these businesses –
especially those small-sized firms most prone to credit constraints – the economy will be
at greater risk of falling below its potential employment level, and policymakers will be
more likely to fall short of their job creation targets.
SME-friendly credit policies are essential to drive broad-based economic growth
and propel the creation of new permanent employment opportunities. Measures that can
improve access to finance for SMEs include reform of financial sector regulations,
policies to help banks broaden their lending activities to underserved groups, increased
competition among banks, and enhancement and development of financial infrastructure.
Financial liberalization can remove barriers to entry and exit and promote the
37
establishment of new firms and the closure of inefficient or unprofitable ones, which
frees up capital for innovative enterprises. Better protection of property rights can
increase access to finance, especially for smaller enterprises. Simpler business
registration procedures promote greater entrepreneurship and firm productivity, while
lower-cost registration encourages formalization and allows for better understanding of
the size and composition of the small business sector. Heightened competition can reduce
interest rates, which benefit businesses that seek to obtain credit. Finally, a more
developed financial infrastructure – national credit bureaus and collateral registries, for
example – can make more information available about potential clients, and therefore
reduce transaction costs and expand credit, particularly for micro- and small-sized firms
that presently face credit constraints as part of the “missing middle.”
Other less common approaches have also seen mixed success as part of a
comprehensive policy package intended to address the SME credit gap and spur
sustainable economic development. In the 1990s, several Asian countries implemented a
“priority sector” approach, which required banks to set aside a portion of their loan
portfolio to support a particular industry segment. In Bangladesh, regulators issued
directives that banks must use 5 percent of their portfolio to support small-scale
industries serving the domestic market in an effort to drive the sector’s development. In
India, all banks were required to lend at least 40 percent of their net credit to agriculture,
agricultural processing, transport, and other small-scale industries, and participating
businesses saw their operations expand. (Jesmin 2009; Banerjee and Duflo 2004) These
programs may not be preferable in all situations, however, since these requirements may
prevent banks from properly managing their risk exposure and cause them to pass on

38
lending opportunities to large-sized firms that could have greater returns to job creation.
Both examples mentioned here were short-lived, but they represent examples of
developing countries trying alternative approaches as part of a more holistic approach to
bring together lenders and small business borrowers to maximize economic potential.
VI. CONCLUSION
Using a newly available dataset from the World Bank Enterprise Surveys for
13,220 firms across 42 countries, this paper investigates the relationship between access
to finance and firm employment levels. This paper builds on prior research that found
positive relationships between both firm size, as measured by number of employees, and
firm age and the likelihood of receiving bank financing, as well as a new categorization
of firms on a scale of credit constraints using their responses to specific questions in the
ES. Descriptive statistics supported existing research, demonstrating that smaller,
younger firms tend to experience moderate to severe credit constraints more often than
larger, older firms. However, younger firms added jobs much faster on average than did
older firms; in terms of headcount, larger firms increased employment more than smaller
firms.
This analysis uses several representations of credit access to reach a conclusion
that is robust across all models. Focusing on the small enterprises employing fewer than
100 people, which make up the majority of firms in most developing countries, an
econometric model is used to determine how access to finance plays a role in firm-level
job creation, while controlling for other factors – including trade status, firm ownership,
worker skills, and regulatory obligations – considered to be important to firm growth.

39
Constraints to access to bank financing are negatively related to employment levels,
especially among small enterprises. Firms whose access to finance is fully constrained
will be expected to have 23 percent fewer full-time permanent employees than
comparable firms facing no credit constraints. Exporting firms are also more likely to
create more jobs, as are firms that provide regular and formal training opportunities to
their employees. Higher sales volumes are also positively associated with higher
employment levels. These findings held true regardless of whether the analysis used a
simple dummy for access to bank loans, a variable that captures the firm manager’s
perception of access to finance challenges, and a variable devised to place firms into four
credit-constraint categories. It is noted that a critical limitation of the dataset is that it
does not include informal-sector firms, microenterprises of less than five employees, and
firms that failed.
The findings have several implications for development practitioners and
policymakers in developing countries. As demonstrated by industry surveys like the ES,
access to finance represents one of the biggest challenges faced by emerging market
SMEs and must be one of the major policies taken into account by policymakers when
examining how markets function and what barriers to entry new businesses face.
Relieving credit and financing constraints can have a positive effect on job creation
among developing country firms. Measures that can improve access to finance for
emerging market SMEs, like reform of financial sector regulations, can help these
businesses make new job opportunities and put residents to work. In the face of an
enormous financing gap for SMEs, implementing policies to relieve that gap by

40
increasing the supply of financing available could go a long way toward spurring broad-
based, sustainable economic growth and ultimately reducing poverty.

41
APPENDIX
Table 7: Number and Percentage of Firms by Developing Country, 2006-09
Developing country Survey
year
No. of
observations
Percentage of
observations
Afghanistan 2008 102 0.77%
Albania 2007 68 0.51%
Angola 2006 197 1.49%
Argentina 2006 548 4.15%
Bolivia 2006 288 2.18%
Botswana 2006 108 0.82%
Brazil 2009 780 5.90%
Bulgaria 2007 496 3.75%
Burundi 2006 102 0.77%
Chile 2006 559 4.23%
Colombia 2006 592 4.48%
Croatia 2007 273 2.07%
DRC 2006 149 1.13%
Ecuador 2006 310 2.34%
El Salvador 2006 411 3.11%
Gambia 2006 31 0.23%
Ghana 2007 291 2.20%
Guatemala 2006 293 2.22%
Guinea 2006 120 0.91%
Guinea-Bissau 2006 46 0.35%
Honduras 2006 235 1.78%
Indonesia 2009 849 6.42%
Mali 2007 301 2.28%
Mauritania 2006 79 0.60%
Mexico 2006 892 6.75%
Mozambique 2007 335 2.53%
Namibia 2006 96 0.73%
Nepal 2009 131 0.99%
Nicaragua 2006 315 2.38%
Panama 2006 173 1.31%
Paraguay 2006 259 1.96%
Peru 2006 336 2.54%
Philippines 2009 637 4.82%
Rwanda 2006 57 0.43%
Senegal 2007 259 1.96%
South Africa 2007 678 5.13%
Swaziland 2006 65 0.49%
Tanzania 2006 262 1.98%
Uganda 2006 274 2.07%
Uruguay 2006 254 1.92%
Vietnam 2009 665 5.03%
Zambia 2007 304 2.30%
Total 13,220 100.00%
Source: World Bank Enterprise Surveys.

42
Table 8: Additional Regression Results Using OLS for Full-Time Employees by
Firm Size
(7)
Small
(5-100 employees)
(8)
Medium
(101-250 employees)
(9)
Large
(251+ employees)
Full-Time Employees in Most Recent Fiscal Year
Dummy: Access to bank financing 0.276*** 0.0221 -0.0263
(17.98) (1.436) (-0.508)
Perception of access to finance
Ln(Sales), most recent fiscal year 0.0810*** 0.00807*** 0.0439***
(35.87) (3.598) (6.696)
Manager experience 0.00372*** 0.000369 0.00411*
(5.679) (0.568) (1.889)
Time spent on regulatory requirements 0.00445*** -4.38e-05 0.00431***
(10.38) (-0.0983) (2.902)
Dummy: Exporter 0.417*** 0.0547*** 0.297***
(23.05) (3.651) (5.182)
Dummy: Female owner 0.00229 0.00245 0.00770
(0.154) (0.160) (0.157)
Average worker education 0.00934 0.00602 -0.0397
(1.257) (0.758) (-1.606)
Dummy: Worker training 0.337*** 0.0285* 0.185***
(21.23) (1.832) (3.323)
Age Dummy (<=2 years) -0.205*** -0.160** 0.184
(-5.724) (-2.236) (0.802)
Age Dummy (3-5 years) -0.173*** -0.0631** 0.0493
(-7.754) (-2.002) (0.475)
Constant 1.082*** 4.787*** 5.103***
(24.31) (93.35) (30.00)
Observations 11,008 1,222 950
R-Squared 0.267 0.042 0.088
F-Statistic 400.1 5.312 9.115
Probability 0 1.06e-07 0
T-statistics are given in parentheses. *, **, and *** represent statistical significance at the 90 percent, 95
percent, and 99 percent levels. There are 40 observations for which data was not available for the access to
bank financing dummy.

43
(10)
Small
(5-100 employees)
(11)
Medium
(101-250 employees)
(12)
Large
(251+ employees)
Full-Time Employees in Most Recent Fiscal Year
Dummy: Access to bank financing
Perception of access to finance -0.0416*** -0.00775 0.0181
(-8.101) (-1.353) (0.952)
Ln(Sales), most recent fiscal year 0.0832*** 0.00802*** 0.0446***
(36.21) (3.572) (6.662)
Manager experience 0.00428*** 0.000398 0.00377*
(6.428) (0.611) (1.733)
Time spent on regulatory requirements 0.00483*** -7.89e-05 0.00410***
(11.13) (-0.176) (2.744)
Dummy: Exporter 0.435*** 0.0577*** 0.294***
(23.78) (3.842) (5.111)
Dummy: Female owner 0.0182 0.00659 0.00731
(1.202) (0.431) (0.148)
Average worker education 0.0180** 0.00621 -0.0399
(2.394) (0.779) (-1.601)
Dummy: Worker training 0.371*** 0.0325** 0.186***
(23.20) (2.116) (3.326)
Age Dummy (<=2 years) -0.245*** -0.164** 0.192
(-6.755) (-2.289) (0.836)
Age Dummy (3-5 years) -0.187*** -0.0623** 0.0521
(-8.185) (-1.968) (0.496)
Constant 1.173*** 4.803*** 5.059***
(24.97) (91.88) (28.46)
Observations 10,889 1,217 941
R-Squared 0.247 0.042 0.088
F-Statistic 357.7 5.335 9.006
Probability 0 9.72e-08 0
T-statistics are given in parentheses. *, **, and *** represent statistical significance at the 90 percent, 95
percent, and 99 percent levels. There are 173 observations for which data was not available for the
perception of access to finance variable.

44
Table 9: Pairwise Correlations for Regressors
Variables MCC PCC FCC Ln(Sales) MgrExp RegTime
Dummy: Maybe-credit
constrained
1.0000
Dummy: Partly-credit
constrained
-0.3259* 1.0000
Dummy: Fully-credit
constrained
-0.2618* -0.2513* 1.0000
Ln(Sales), most
recent fiscal year
0.1779* -0.0515* -0.0327* 1.0000
Manager
experience
0.0902* -0.0761* -0.0436* -0.0530* 1.0000
Time spent on
regulatory requirements
0.0596* -0.0486* -0.0518* -0.1091* 0.0906* 1.0000
Dummy:
Exporter
0.1692* -0.0886* -0.0918* 0.1986* 0.1029* 0.0394*
Dummy:
Female owner
0.0780* -0.0517* -0.0245* 0.0117 0.0539* 0.0283*
Average worker
education
0.1415* -0.0913* -0.0426* 0.1489* 0.0280* 0.0168
Dummy:
Worker training
0.1870* -0.0888* -0.1128* 0.1240* 0.1051* 0.0933*
Age Dummy
(<=2 years)
-0.0579* 0.0551* 0.0193* -0.0191* -0.1512* -0.0275*
Age Dummy
(3-5 years)
-0.0349* 0.0529* 0.0196* -0.0149 -0.2047* -0.0371*
Variables Exporter FemOwner WorkerEd WorkerTrain Young Middle
Dummy: Maybe-credit
constrained
Dummy: Partly-credit
constrained
Dummy: Fully-credit
constrained
Ln(Sales), most
recent fiscal year
Manager
experience
Time spent on
regulatory requirements
Dummy:
Exporter
1.0000
Dummy:
Female owner
0.0299* 1.0000
Average worker
education
0.1408* 0.0625* 1.0000
Dummy:
Worker training
0.2462* 0.0367* 0.1187* 1.0000
Age Dummy
(<=2 years)
-0.0659* -0.0246* -0.0255* -0.0483* 1.0000
Age Dummy
(3-5 years)
-0.0649* -0.0229* -0.0170 -0.0680* -0.0705* 1.0000
* represents statistical significance at the 95 percent level.

45
Table 10: Variance Inflation Factors for Regressors
Variables
VIF 1/VIF
Dummy: Maybe-credit constrained
1.35 0.7434
Dummy: Partly-credit constrained
1.33 0.7495
Dummy: Fully-credit constrained
1.28 0.7830
Manager experience
1.11 0.8973
Dummy: Worker training
1.07 0.9334
Age Dummy (3-5 years)
1.07 0.9368
Dummy: Exporter
1.06 0.9409
Ln(Sales), most recent fiscal year
1.06 0.9472
Age Dummy (<=2 years)
1.05 0.9560
Average worker education
1.05 0.9562
Time spent on regulatory requirements
1.04 0.9604
Dummy: Female owner
1.01 0.9860
Mean VIF
1.12
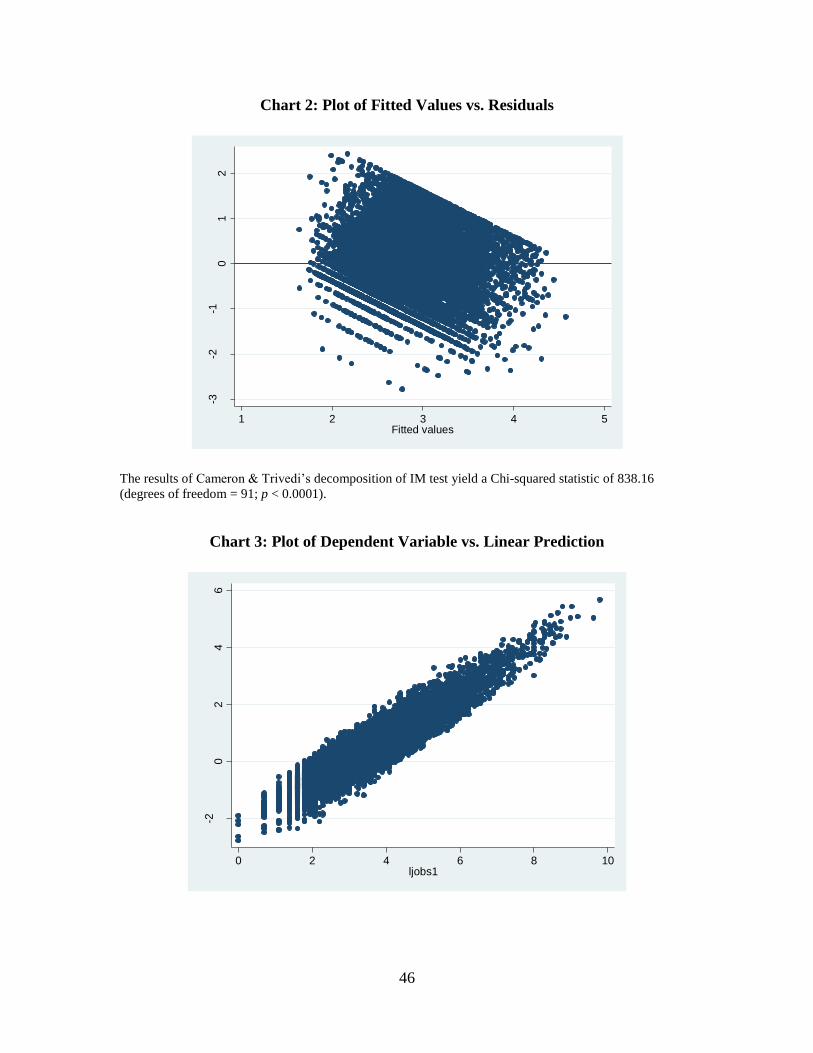
46
Chart 2: Plot of Fitted Values vs. Residuals
The results of Cameron & Trivedi’s decomposition of IM test yield a Chi-squared statistic of 838.16
(degrees of freedom = 91; p < 0.0001).
Chart 3: Plot of Dependent Variable vs. Linear Prediction
-3-2
-10
12
Resid
uals
1 2 3 4 5Fitted values
-20
24
6
Resid
uals
0 2 4 6 8 10ljobs1
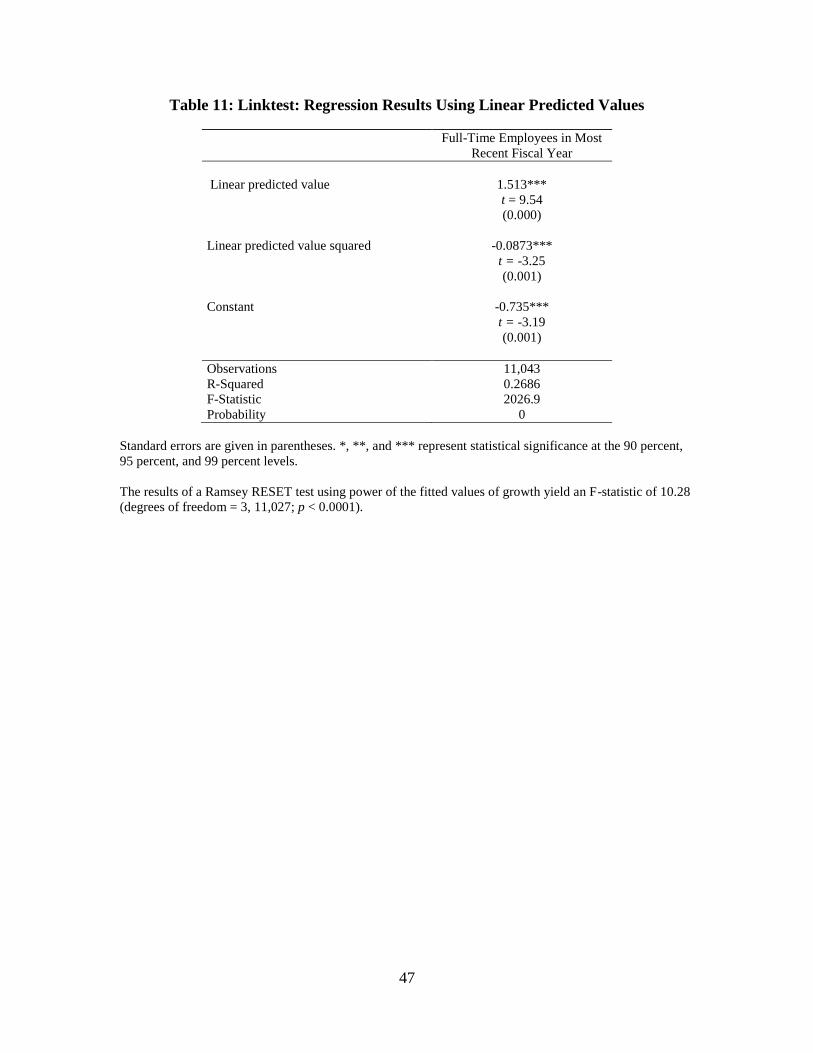
47
Table 11: Linktest: Regression Results Using Linear Predicted Values
Full-Time Employees in Most
Recent Fiscal Year
Linear predicted value 1.513***
t = 9.54
(0.000)
Linear predicted value squared -0.0873***
t = -3.25
(0.001)
Constant -0.735***
t = -3.19
(0.001)
Observations 11,043
R-Squared 0.2686
F-Statistic 2026.9
Probability 0
Standard errors are given in parentheses. *, **, and *** represent statistical significance at the 90 percent,
95 percent, and 99 percent levels.
The results of a Ramsey RESET test using power of the fitted values of growth yield an F-statistic of 10.28
(degrees of freedom = 3, 11,027; p < 0.0001).

48
REFERENCES
Acs, Zoltan J., Bo Carlsson, and Charlie Karlsson. (1999). Entrepreneurship, Small and
Medium-Sized Enterprises, and the Macroeconomy. New York: Cambridge
University Press.
Allen, Franklin, and Douglas Gale. (2000). Comparing financial systems. Cambridge,
Mass.: MIT Press.
Aterido, Reyes, Mary Hallward-Driemeier, and Carmen Pages. (2007). Investment
Climate and Employment Growth: The Impact of Access to Finance, Corruption,
and Regulations Across Firms. Bonn, Germany: Institute for the Study of Labor
(IZA).
Avdjiev, Stefan, Zsolt Kuti, and Elod Takats. (2012). The euro area crisis and cross-
border bank lending to emerging markets. BIS Quarterly Review, December 2012,
37-47.
Ayyagari, Meghana, Thorsten Beck, and Asli Demirguc-Kunt. (2005). Small and
Medium Enterprises across the Globe. Washington, D.C.: World Bank.
Ayyagari, Meghana, Asli Demirguc-Kunt, and Vojislav Maksimovic. (2011). Small vs.
Young Firms across the World: Contribution to Employment, Job Creation, and
Growth. Washington, D.C.: World Bank.
Baily, Martin. (2012). Restoring Economic Growth. Washington, D.C.: Brookings
Institution.
Banerjee, A. and Duflo, E. (2004). Do Firms Want to Borrow More? Testing Credit
Constraints Using a Directed Lending Program. Cambridge, Mass.: Massachusetts
Institute of Technology.
Bauchet, Jonathan, and Jonathan Morduch. (2011). Is micro too small? Microcredit vs.
SME finance. New York: New York University.
Beck, Thorsten. (2012). The Role of Finance in Economic Development – Benefits,
Risks, and Politics, in: Dennis Müller (Ed.): Oxford Handbook of Capitalism.
Beck, Thorsten, and Asli Demirguc-Kunt. (2008). Access to Finance: An Unfinished
Agenda. World Bank Economic Review, 22(3), 383-396.
Beck, Thorsten, and Asli Demirguc-Kunt. (2009). Financial Institutions and Markets
Across Countries and over Time: Data and Analysis. Washington, D.C.: World
Bank.
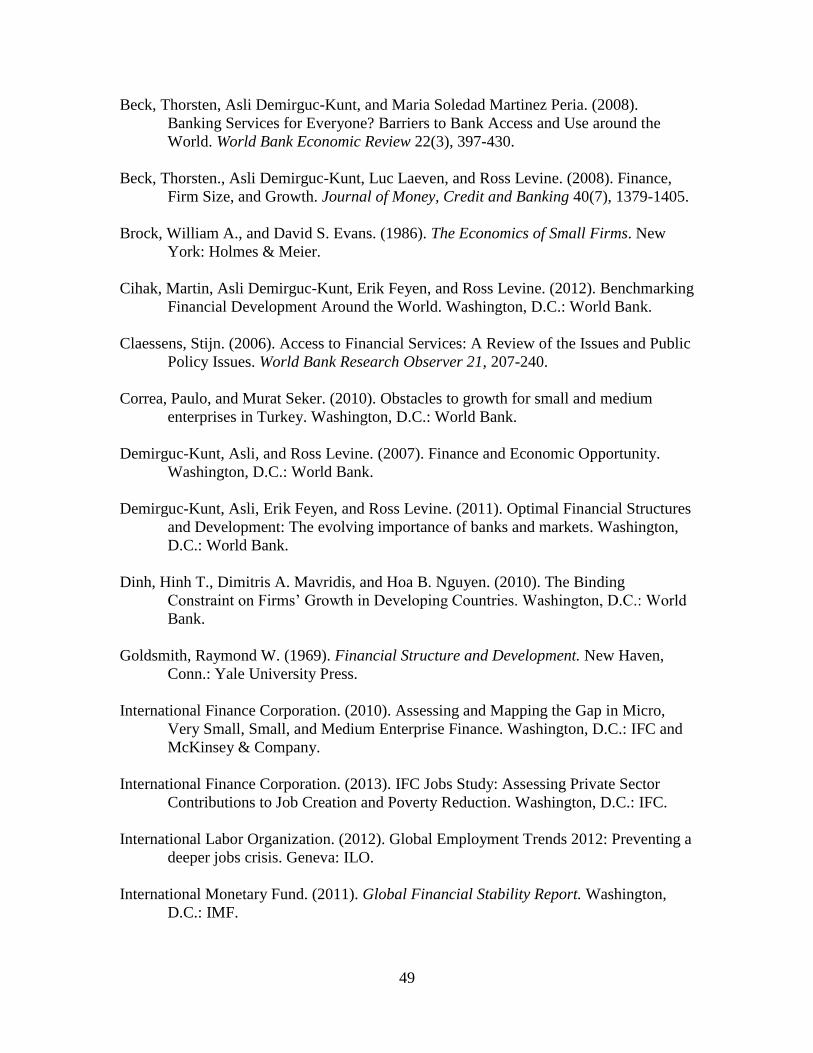
49
Beck, Thorsten, Asli Demirguc-Kunt, and Maria Soledad Martinez Peria. (2008).
Banking Services for Everyone? Barriers to Bank Access and Use around the
World. World Bank Economic Review 22(3), 397-430.
Beck, Thorsten., Asli Demirguc-Kunt, Luc Laeven, and Ross Levine. (2008). Finance,
Firm Size, and Growth. Journal of Money, Credit and Banking 40(7), 1379-1405.
Brock, William A., and David S. Evans. (1986). The Economics of Small Firms. New
York: Holmes & Meier.
Cihak, Martin, Asli Demirguc-Kunt, Erik Feyen, and Ross Levine. (2012). Benchmarking
Financial Development Around the World. Washington, D.C.: World Bank.
Claessens, Stijn. (2006). Access to Financial Services: A Review of the Issues and Public
Policy Issues. World Bank Research Observer 21, 207-240.
Correa, Paulo, and Murat Seker. (2010). Obstacles to growth for small and medium
enterprises in Turkey. Washington, D.C.: World Bank.
Demirguc-Kunt, Asli, and Ross Levine. (2007). Finance and Economic Opportunity.
Washington, D.C.: World Bank.
Demirguc-Kunt, Asli, Erik Feyen, and Ross Levine. (2011). Optimal Financial Structures
and Development: The evolving importance of banks and markets. Washington,
D.C.: World Bank.
Dinh, Hinh T., Dimitris A. Mavridis, and Hoa B. Nguyen. (2010). The Binding
Constraint on Firms’ Growth in Developing Countries. Washington, D.C.: World
Bank.
Goldsmith, Raymond W. (1969). Financial Structure and Development. New Haven,
Conn.: Yale University Press.
International Finance Corporation. (2010). Assessing and Mapping the Gap in Micro,
Very Small, Small, and Medium Enterprise Finance. Washington, D.C.: IFC and
McKinsey & Company.
International Finance Corporation. (2013). IFC Jobs Study: Assessing Private Sector
Contributions to Job Creation and Poverty Reduction. Washington, D.C.: IFC.
International Labor Organization. (2012). Global Employment Trends 2012: Preventing a
deeper jobs crisis. Geneva: ILO.
International Monetary Fund. (2011). Global Financial Stability Report. Washington,
D.C.: IMF.
50
Krishnan, K.P. (2011). Financial Development in Emerging Markets: The Indian
Experience. ADBI Working Paper 276. Tokyo: Asian Development Bank
Institute.
Kumar, Anjali, and Manuela Francisco. (2005). Enterprise Size, Financing Patterns, and
Credit Constraints in Brazil : Analysis of Data from the Investment Climate
Assessment Survey. Washington, DC: World Bank.
Kuntchev, Veselin, Rita Ramalho, Jorge Rodriguez-Meza, and Judy S. Yang. (2012).
What have we learned from the Enterprise Surveys regarding access to finance by
SMEs? Washington, D.C.: World Bank.
La Porta, Rafael, Florencio Lopez-de-Silanes, Andrei Shleifer, and Robert W. Vishny.
(1998). Law and Finance. Journal of Political Economy 106(6): 1113-1155.
Levine, Ross. (2005). Finance and Growth: Theory and Evidence, in: Philippe Aghion
and Steven Durlauf (ed.). Handbook of Economic Growth (1st ed.), 865-934.
Amsterdam: Elsevier.
OECD. (2006). The SME Financing Gap (Vol. I): Theory and Evidence. Paris: OECD
Publishing.
Jesmin, Rubayat. (2009). Financing the Small Scale Industries in Bangladesh: the Much-
Talked About, but Less Implemented Issue. Proceedings of American Society of
Business and Behavioral Sciences 16(1): 1-13.
Ruiz-Porras, Antonio. (2009). Financial Structure, Financial Development and Banking
Fragility: International Evidence. Análisis Económico 24(56): 147-173.
Tracy, Spencer L. (2011). Accelerating Job Creating in America: The Promise of High-
Impact Companies. Washington, D.C.: U.S. Small Business Administation.
World Bank. (2012). World Development Report 2013: Jobs. Washington, D.C.: World
Bank.
World Bank. (2013). World Development Indicators 2013. Washington, D.C.: World
Bank.