S C S U Technology Update FY06. Technology for Teaching and Learning.
39
S C S U Technology Update FY06
-
Upload
arturo-gumbel -
Category
Documents
-
view
212 -
download
0
Transcript of S C S U Technology Update FY06. Technology for Teaching and Learning.

S C S UTechnology
Update FY06

Technology for Teaching Technology for Teaching and Learningand Learning
Technology for Teaching Technology for Teaching and Learningand Learning

SCSU Electronic Classroom Growth
1 59
1520
2631
62
79
90 9398
102
121 123
0
20
40
60
80
100
120
140
1990 1991 1994 1995 1996 1997 1998 1999 2000 2001 2002 2003 2004 2005 2006
Year

Electronic Classroom SupportElectronic Classroom SupportElectronic Classroom SupportElectronic Classroom Support Successfully upgraded and retrofitted all e-
classrooms to a new control/management system.
Began implementation of an equipment replacement schedule for the majority of e-classrooms.
Integrated the Helpdesk interface into each e-classroom.

ITV/Video ConferencingITV/Video ConferencingITV/Video ConferencingITV/Video Conferencing Performed a state-
mandated upgrade to the entire network to improve the ability to interconnect with other regional networks.
Upgraded all control systems and 90% of the transmission systems to reduce down time.
Redesigned the operations center to better incorporate the upgrades.

ITV Classes at SCSU
12
24
27 27 27 27
17
26
15
18
39
22
3028
19
27
0
5
10
15
20
25
30
35
40
45

ITV/Video ConferencingITV/Video ConferencingITV/Video ConferencingITV/Video Conferencing
Added a second Mediasite system to meet demand.
Allows the end user to participate from any location with an Internet-connected computer and a telephone, instead of going to an ITV site.
Sessions are recorded and can be viewed afterwards, or incorporated into D2L

Course Management System Course Comparison
79152
240
330
573
767
0
100
200
300
400
500
600
700
800
900
Semester
# C
ou
rses
Spring 2001
Spring 2002
Spring 2003
Spring 2004
Spring 2005
Spring 2006
74%increase
34%increase

Course Management System Student Use Comparison
3,689
6,0777,380
14,145
11,37211,712
0
2,000
4,000
6,000
8,000
10,000
12,000
14,000
16,000
Sem ester
# o
f S
tud
ents
Spring 2001
Spring 2002
Spring 2003
Spring 2004
Spring 2005
Spring 2006
§There is a dif ference in how WebCT and Desire2Learn count students
§

Research/Instruction ToolsResearch/Instruction ToolsResearch/Instruction ToolsResearch/Instruction Tools
Continue to add online tools to assist with research and instruction
Course Quickstart was added, with content for 46 different courses

§ drop due to change in database aggregator contracts
§
Electronic Resources
6,845
5,724
8,991
6,324
14,042
9,857
14,695
10,233
16,139
13,776
9,206
15,361
12,904
15,130
0
2,000
4,000
6,000
8,000
10,000
12,000
14,000
16,000
18,000
Electronic Subscriptions Electronic Books
FY00
FY01
FY02
FY03
FY04
FY05
FY06

Gate Count Comparisons
551,646
835,238
930,851 954,494 949,662
858,388 882,043
0
200,000
400,000
600,000
800,000
1,000,000
1,200,000
September - May Comparison
# o
f P
atr
on
s
FY00
FY01
FY02
FY03
FY04
FY05 §
FY06

Technology for StudentsTechnology for StudentsTechnology for StudentsTechnology for Students

General General Access Access
Computer Computer Lab Lab
LocationsLocations

14 Open Labs (386 Computers)14 Open Labs (386 Computers)7 Miller Center Labs (193 Computers)7 Miller Center Labs (193 Computers)
31 Discipline Related Labs (788 Computers)31 Discipline Related Labs (788 Computers)--------------------------------------------------------------------------------------------------------------------
52 Total Labs (1367 Computers)52 Total Labs (1367 Computers)
0
200
400
600
800
1000
1200
1400
1600
PCs Macs Total
Open Labs
Miller Center Labs
Discipline-Related Labs
Total

Student TrainingStudent TrainingStudent TrainingStudent Training 101 Software workshops offered on 17
different topics; 1,279 students attended, a 97% increase over the previous year.
This included special sessions for First Year Experience, College 150, and In-coming Orientation.
293 Library instruction sessions,6,299 students attended

Total ResNet Connections
704
1,026
1,415
1,733
2,0952,233
2,737 2,7472,573
0
500
1000
1500
2000
2500
3000
FY98 FY99 FY00 FY01 FY02 FY03 FY04 FY05 FY06
Fiscal Year

ResNet Operating Systems FY06
91%
3%2%
4% 0%
Win XP
Win 95/98
Win NT/2000
Mac
Other
ResNet Operating Systems FY05
85%
7%
3%4% 1%
Win XP
Win 95/98
Win NT/2000
Mac
Other
OS Change ComparisonOS Change Comparison

Technology for Faculty Technology for Faculty and Staffand Staff
Technology for Faculty Technology for Faculty and Staffand Staff

Number & Type Workstation by College
0
100
200
300
400
500
600
700
800
900
Business Education FA & H Sci. &Engineering
Soc. Science Total
College
Mac
PC
24.1%
75.9%

Num ber & Type Workstation in Other Areas
0
500
1000
1500
2000
2500
3000
3500
Admin Computing Technology Fee eClassrooms Curriculum Labs HelpDesk Supported Miller Center TOTAL
Area
Mac
PC
18.4%
81.6%

Age of Faculty/Staff Computers
162
389
257239
222
261
121
42
0
50
100
150
200
250
300
350
400
450
1 2 3 4 5 6 7 8
# Years Old

College Support TechniciansCollege Support TechniciansCollege Support TechniciansCollege Support Technicians Have at least one college technician in every
college Worked as a team to assist in the rollout of a
campus-wide HelpDesk system and asset management system
Collaborated with the workstation/application team and Computer Store to develop software imaging for new Windows desktop and laptop machines prior to campus distribution

Center for Information Systems Focused primarily on Microsoft products More than 800 participants received training 20 people completed and received Microsoft Office
Specialist (MOS) Certification through the CIS testing center
InforMedia Services Focused primarily on software for instruction 70 different topic areas, many on aspects of
Desire2Learn More than 1,800 participants received training
Training/WorkshopsTraining/Workshops

Training/WorkshopsTraining/WorkshopsWorkshop Comparisons
137
665
167
1,122
143
917
176
767
246
1,304
272
1,848
0
500
1,000
1,500
2,000
Workshops Offered Participants
FY01
FY02
FY03
FY04
FY05
FY06

Other Information Other Information Technology ResourcesTechnology Resources
Other Information Other Information Technology ResourcesTechnology Resources

Campus Microsoft Agreement Operating Systems, Office
Additional Microsoft licensing SharePoint, Project, Visio
Symantec Antivirus agreement Allows both campus and home use
MnSCU negotiates volume pricing: Adobe (Macromedia) Maplesoft ESRI Geographical Information Systems (ArcView) $7–10K
annual cost
Software Licensing Software Licensing AgreementsAgreements

IT SecurityIT SecurityIT SecurityIT Security Priority for both MnSCU and SCSU SCSU IT Security Coordinator
Coordinates with MnSCU on security initiatives, helping to develop security standards
Developing a systematic way to respond to the wide variety of issues
76 incidents were investigated in FY06, a 43% increase over FY05

Inbound e-mail/spam comparison
21,868,858
34,959,028
45,243,061
14,432,677
27,237,556
33,540,727
0
5,000,000
10,000,000
15,000,000
20,000,000
25,000,000
30,000,000
35,000,000
40,000,000
45,000,000
50,000,000
FY04 FY05 FY06
Total inbound mail messages
Total spam messages78%
66%
74%
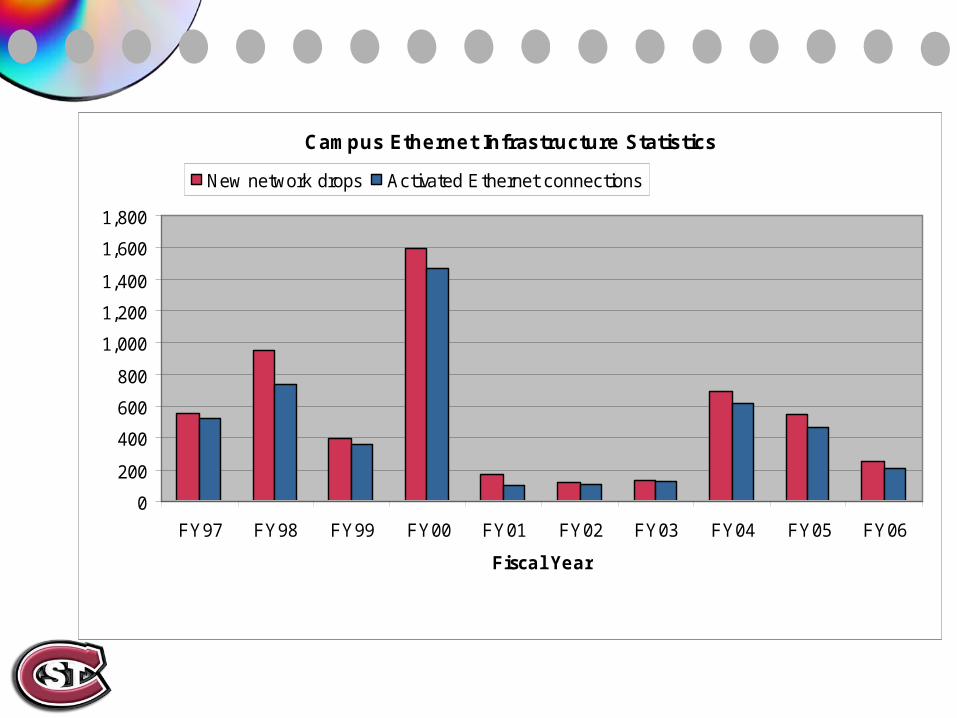
Campus Ethernet Infrastructure Statistics
0
200
400
600
800
1,000
1,200
1,400
1,600
1,800
FY97 FY98 FY99 FY00 FY01 FY02 FY03 FY04 FY05 FY06
Fiscal Year
New network drops Activated Ethernet connections

Equipment Checkout
356
174250
344
30
428
28
889
363
502
242
68
295
30
621
397482
893
659
46
232
33
0100200300400500600700800900
1,000
Au
dio
Eq
uip
me
nt
Da
tap
roje
cto
rs
Dig
ita
lc
am
era
s
Stu
de
nt
lap
top
co
mp
ute
rs
Sh
ort
te
rmla
pto
pc
he
ck
ou
t
Pro
jec
tors
VH
Sc
am
co
rde
rs
Vid
eo
eq
uip
me
nt
Ch
arg
es
FY04 FY05 FY06
Network UptimeNetwork UptimeNetwork UptimeNetwork Uptime
Uptime was 99.90%, compared to 99.73% in FY05 and 99.80% in FY04
Down an average of less than an hour per month total, with equipment or technical malfunctions the primary reason
Only down 3 hours for the year due to security, virus, or denial of service

SCSU Internet Connection Bandwidthin Megabits/second
6.168 8 8
16
45 45 45
0
5
10
15
20
25
30
35
40
45
50
FY99
FY00
FY01
FY02
FY03
FY04
FY05
FY06

SCSU was ranked #49 in Intel's 2005 "Most Unwired College Campuses" survey, which rates schools based on their wireless Internet infrastructure and services.
Campus wireless network coverage area was expanded to improve reception and include previously unserved areas, including the residence halls
Wireless Network Wireless Network AccessAccess

Growth in # Wireless Users
0 85
552
1,474
5,588
0
1000
2000
3000
4000
5000
6000
Fiscal Year
FY02
FY03
FY04
FY05
FY06

HelpDesk Traffic Comparisons
42905008
79138958
13,071
14,706
9,796
12,028
0
2000
4000
6000
8000
10000
12000
14000
16000
Fiscal Year
Req
ues
ts
FY99
FY00
FY01
FY02
FY03
FY04
FY05
FY06

Completed moving all official sites from Condor to the primary server environment
Added a staff member to help support online courses offered through the Center for Continuing Studies
Stamats conducted an audit of the SCSU sites
Several recommended changes have been implemented
Focused more on marketing SCSU to external audiences
Multimedia/Web ServicesMultimedia/Web Services

Technology CommitteesTechnology CommitteesTechnology CommitteesTechnology Committees
Faculty Technology and Pedagogical Resources Committee
Teaching Learning Technology Roundtable
Student Technology Fee Committee College Technology Committees

Thank you!