S-C-O Isotopes, Fluid Inclusion Microthermometry, and the Genesis of Ore Bearing Fluids at...
16
Journal of Sciences, Islamic Republic of Iran 16(2): 153-168 (2005) http://jsciences.ut.ac.ir University of Tehran, ISSN 1016-1104 153 S-C-O Isotopes, Fluid Inclusion Microthermometry , and the Genesis of Ore Bearing Fluids at Qaleh-Zari Fe-Oxide Cu-Au-Ag Mine, Iran M.H. Karimpour, 1,* Khin Zaw, 2 and D.L. Huston 3 1 Department of Geology, Faculty of Sciences, Ferdowsi University, Mashhad, Islamic Republic of Iran 2 Centre for Ore Deposit Research, University of Tasmania, Hobart, Tasmania, Australia 7001 3 Australian Geological Survey Organization, Canberra, ACT, Australia 2601 Abstract Qaleh-Zari is a Fe-oxide Cu-Ag-Au vein type deposit located 180 km south of Birjand, in eastern Iran. Host rocks are mainly Tertiary calc-alkaline to K-rich calc-alkaline with transition to shoshonitic andesite and andesitic basalts, but in the central part shale and sandstone of Jurassic age. Andesitic rocks from the western region of Qaleh-Zari were dated to 40.5 ± 2 Ma. Four trends of faults and joints are identified in the mine area. Cu-Ag-Au mineralization is present only in the oldest sets of faults and joints that crosscut the Tertiary and Jurassic units. Three major sub- parallel steep quartz veins are identified. No.1 vein is about 650 m long and No.3 vein is less than 500 m long. No.2 vein is traced for more than 3.5 km horizontally along strike (N40° W) and more than 350 m down dip. Specularite and quartz are the most abundant primary oxides. Chalcopyrite is the only hypogene copper mineral. Silver is present as sulfosalt minerals. Paragenesis: Stage I: specularite, quartz, Fe-chlorite, chalcopyrite and sulfosalts. Specularite deposited first and forms 10 to 25 percent of the vein. Stage II: quartz, chalcopyrite, pyrite, chlorite ± hematite ± sulfosalt minerals. Stage III: quartz ± pyrite ± chalcopyrite. Stage IV: hematite, quartz, and ± calcite. The ores grade typically 2-9% Cu, 100-650 ppm Ag, and 0.5-35 ppm Au. Homogenization temperatures of fluid inclusions associated with Cu, Ag, and Au deposition were varying between 360°C and 240°C. The salinity of the fluid was between 1 to 6 wt % NaCl equiv and the CO 2 content was low (less than 1 mole %). The δ 34 S CDT values of pyrite and chalcopyrite were between 0.4 to 2.2‰, which was consistent with a magmatic-hydrothermal or leached volcanic source. The δ 13 C PDB values of calcite were between 16.9 to 17.4‰ and the calculated δ 13 C PDB of the fluid is between −3.8 and −3.0‰. The δ 18 O SMOW of the carbonates were between 16.96 and 19.40‰. Calculated fluid δ 18 O SMOW values were 7.4 to 9.8‰, which overlapped the range of magmatic water. The C and O isotopic values of calcite were similar to porphyry copper deposits, possibly indicating magmatic affinities for the ore fluids. Based on the presence of hematite, chalcopyrite, Fe-rich chlorite and locally pyrite, and on the absence of magnetite and pyrrhotite, the ore fluid was very oxidized. Oxygen fugacity was estimated to have been between 10 −27 and 10 −32 , and the fugacity of H 2 S was less than 10 −3.5 . Keywords: Qaleh Zari; C-O isotopes; Fluid in clusion microthermometry; Iran * E-mail: [email protected] 1. Introduction The Qaleh-Zari deposit consists of a series of specularite-rich Cu-Au-Ag-bearing vein located 180 km south of Birjand (Province of Khorasan) at an elevation between 1500 to 1600 m. Mining in the Qaleh-Zari area dates back more than 2000 years. Historic mining extended to a depth of 90 m, and historic production is estimated at 0.9 Mt based on the extent of open cavities. The historic miners appear to have the known smelting techniques as old slag dumps and mining tools are recovered in the area. More than 4 million tons of ore
Transcript of S-C-O Isotopes, Fluid Inclusion Microthermometry, and the Genesis of Ore Bearing Fluids at...
8/2/2019 S-C-O Isotopes, Fluid Inclusion Microthermometry, and the Genesis of Ore Bearing Fluids at Qaleh-Zari Fe-Oxide Cu-…
http://slidepdf.com/reader/full/s-c-o-isotopes-fluid-inclusion-microthermometry-and-the-genesis-of-ore-bearing 1/16
Journal of Sciences, Islamic Republic of Iran 16(2): 153-168 (2005) http://jsciences.ut.ac.ir University of Tehran, ISSN 1016-1104
153
S-C-O Isotopes, Fluid Inclusion Microthermometry, and
the Genesis of Ore Bearing Fluids at Qaleh-Zari
Fe-Oxide Cu-Au-Ag Mine, Iran
M.H. Karimpour,1,* Khin Zaw,2 and D.L. Huston3
1 Department of Geology, Faculty of Sciences, Ferdowsi University, Mashhad, Islamic Republic of Iran
2Centre for Ore Deposit Research, University of Tasmania, Hobart, Tasmania, Australia 7001
3 Australian Geological Survey Organization, Canberra, ACT, Australia 2601
AbstractQaleh-Zari is a Fe-oxide Cu-Ag-Au vein type deposit located 180 km south of Birjand, ineastern Iran. Host rocks are mainly Tertiary calc-alkaline to K-rich calc-alkaline with transition toshoshonitic andesite and andesitic basalts, but in the central part shale and sandstone of Jurassicage. Andesitic rocks from the western region of Qaleh-Zari were dated to 40.5 ± 2 Ma. Four trendsof faults and joints are identified in the mine area. Cu-Ag-Au mineralization is present only in theoldest sets of faults and joints that crosscut the Tertiary and Jurassic units. Three major sub-
parallel steep quartz veins are identified. No.1 vein is about 650 m long and No.3 vein is less than500 m long. No.2 vein is traced for more than 3.5 km horizontally along strike (N40° W) and morethan 350 m down dip. Specularite and quartz are the most abundant primary oxides. Chalcopyriteis the only hypogene copper mineral. Silver is present as sulfosalt minerals. Paragenesis: Stage I:specularite, quartz, Fe-chlorite, chalcopyrite and sulfosalts. Specularite deposited first and forms10 to 25 percent of the vein. Stage II: quartz, chalcopyrite, pyrite, chlorite ± hematite ± sulfosalt
minerals. Stage III: quartz ± pyrite ± chalcopyrite. Stage IV: hematite, quartz, and ± calcite. Theores grade typically 2-9% Cu, 100-650 ppm Ag, and 0.5-35 ppm Au. Homogenization
temperatures of fluid inclusions associated with Cu, Ag, and Au deposition were varying between
360°C and 240°C. The salinity of the fluid was between 1 to 6 wt % NaCl equiv and the CO2
content was low (less than 1 mole %). The δ34
SCDT values of pyrite and chalcopyrite were between0.4 to 2.2‰, which was consistent with a magmatic-hydrothermal or leached volcanic source. The
δ13
CPDB values of calcite were between 16.9 to 17.4‰ and the calculated δ13
CPDB of the fluid is
between −3.8 and −3.0‰. The δ18
OSMOW of the carbonates were between 16.96 and 19.40‰.
Calculated fluid δ18OSMOW values were 7.4 to 9.8‰, which overlapped the range of magmatic
water. The C and O isotopic values of calcite were similar to porphyry copper deposits, possibly
indicating magmatic affinities for the ore fluids. Based on the presence of hematite, chalcopyrite,Fe-rich chlorite and locally pyrite, and on the absence of magnetite and pyrrhotite, the ore fluidwas very oxidized. Oxygen fugacity was estimated to have been between 10
−27and 10
−32, and the
fugacity of H2S was less than 10−
3.5.
Keywords: Qaleh Zari; C-O isotopes; Fluid inclusion microthermometry; Iran
* E-mail: [email protected]
1. Introduction
The Qaleh-Zari deposit consists of a series of
specularite-rich Cu-Au-Ag-bearing vein located 180 km
south of Birjand (Province of Khorasan) at an elevation
between 1500 to 1600 m. Mining in the Qaleh-Zari area
dates back more than 2000 years. Historic mining
extended to a depth of 90 m, and historic production is
estimated at 0.9 Mt based on the extent of open cavities.
The historic miners appear to have the known smelting
techniques as old slag dumps and mining tools are
recovered in the area. More than 4 million tons of ore

8/2/2019 S-C-O Isotopes, Fluid Inclusion Microthermometry, and the Genesis of Ore Bearing Fluids at Qaleh-Zari Fe-Oxide Cu-…
http://slidepdf.com/reader/full/s-c-o-isotopes-fluid-inclusion-microthermometry-and-the-genesis-of-ore-bearing 2/16
Vol. 16 No. 2 Spring 2005 Karimpour et al. J. Sci. I. R. Iran
154
have been mined up and it is estimated that there is
more than 3 million tons still present in the area. Qaleh-
Zari is a high grade Cu-Ag-Au deposit. The ores grade
typically 2-9% Cu, 100-650ppm Ag, and 0.5-35ppm Au.
Modern exploration was started by two Iranian andJapanese Nittetsu mining Companies in 1971, and
production started in 1975 at rate of 18,000 tons/year
with continuous operation for the last 30 years. Only
four case of study beside this work have been done at
Qaleh-Zari deposit [1-4].
The aims of this study were: 1) to document the
geological setting and the geochemical signature of host
volcanic sequence, 2) to establish the paragenesis of the
deposit, 3) to characterize the ore-bearing fluid, and 4)
to document the distribution of ore metals in the deposit.
2. Regional Geology
Qaleh-Zari is situated within the Central Lut Block at
31° 50′ N, 59° 00′ E (Eastern Iran). The Lut Block is
essentially a north-south-trending rigid mass smoothly
surrounded by ranges of central and eastern Iran (Fig.
1a). The Lut Block extends over 900 km in north-south
direction and only 200 km wide in east-west direction. It
is confined by Nayband fault and Shotori Range in the
west and the Eastern Iranian Ranges in the east (Fig.
1a). The western edge of the Lut Block is cut off by
Nayband normal fault. The northern termination of Lut
Block is the depression of Kavir-e-Namak and the Great
Kavir Fault. The Bazman volcanic complex and the Jaz-
Murian-Depression define the southern edge. The
eastern edge is dissected by Sistan suture zone (Fig. 1a).
The Lut Massif has a relatively low degree of
Cretaceous Alpine deformation. Most of the area is
covered with Tertiary continental sediments and
volcanic rocks with scattered outcrops of Mesozoic and
Paleozoic rocks.
The Sistan suture zone extends from Makran in
southeastern Iran and northward to Ghayen. This suture
zone separates Lut Block from Afghan Block (Fig. 1a).
Rifting between Lut Block and Afghan Block took place
in Cretaceous [6]. This suture zone is younger than Neo-Tethys, a deformed accretionary prism and a flanking
forearc basin extending from Birjand southeast to
Zahedan. The accretionary prism at 32 degrees N is
subdivided into two northwest-trending en echelon belts
termed the "Ratuk" and "Neh" complexes, respectively.
Extensive post-Miocene right-slip faulting is inferred to
be an effect of Miocene "terminal" collision of Arabia
and Eurasia [6]. These faults are causing a large scale
feather appearance (Fig. 1b). Volcanic and some
plutonic rocks of the Lut Block are the result of west
dipping subduction zone.
Figure 1a. Schematic structural map of Iran. A: Zagrosfracture zone, b: Great Kevir fault, c: Harirud fault, Te:Tehran, M: Mashhad, E: Esfahan [5].
Figure 1b. Map showing Cu, Pb-Zn mineralized area in
central lut region. 1-Gazu, 2-Sorkh-Kuh, 3-Qaleh-Zari, 4-Howze Dough, 5-Ghare Kaftar, 6-Shurk, 7-Shikasteh Sabz, 8-
Mire Khash, 9-Madan-e-Rahi I, 10-Madan-e-Rahi II, 11-Sehchangi, 12-Howze Rasi, 13-Shurab, 14-Gale Chah, and 15-
Chah Nogre [7].

8/2/2019 S-C-O Isotopes, Fluid Inclusion Microthermometry, and the Genesis of Ore Bearing Fluids at Qaleh-Zari Fe-Oxide Cu-…
http://slidepdf.com/reader/full/s-c-o-isotopes-fluid-inclusion-microthermometry-and-the-genesis-of-ore-bearing 3/16
J. Sci. I. R. Iran Karimpour et al. Vol. 16 No. 2 Spring 2005
155
Figure 1c. Geological map of Qaleh-Zari area, revised from[2].
Recent and Quaternary sand dunes, salt flats, and
alluvial fans cover large area of Lut Block. The Lut
Block is underlain by continental crust of some 40 km
thickness [8]. The oldest sediments are from Devonian
to Cretaceous. Geological observation and radiometric
data indicate that the oldest magmatic activity in the
Central Lut took place in the Jurassic time [7]. Rb-Sr
isotopic determination of two samples from Shorkh Kuh
granite to granodiorites based on whole-rock and
biotites of the two samples yield Middle to Late Jurassic
age (164.8±1.9 Ma resp. 170±1.9 Ma). In Northern Lut
Block, magmatic activity started in the Upper Cretace-ous time (75 m.y.) both as volcanic and intrusive rocks.
Maximum volcanic activity took place at the end of
Eocene time. The Middle Eocene (47 m.y.) is
distinguished by alkaline and shoshonitic volcanism [9].
In addition to calc-alkaline series, basalts and basaltic-
andesite were formed in Eocene-Oligocene (40 to 31
m.y.) and Quaternary. The western part of the Central
Lut Block is covered by terrestrial volcanic rocks [9]. In
Shurab and Khur regions, Kerman Conglomerate occurs
as a basis of volcanic sequence dated 39-40 Ma.
Cu and Pb-Zn mineralization related to different
episodes of magmatism in Central Lut is shown in
Figure 1b. The earliest mineralization is associated with
Sorkh-Kuh granite to granodiorites Middle to late
Jurassic age (164.8±1.9 Ma resp.170±1.9 Ma). Bothdisseminated and stockwork mineralization is reported
from the contact zone of these intrusive rocks [7]. In
Late Cretaceous (75.2±3.5 Ma), porphyry Cu- type
mineralization is reported in Gazu area (Fig. 1b) which
is associated with intermediate intrusive rocks. Pb-Zn
vein types are hosted by volcanic rocks age of 41 to 44
Ma are discovered in Seh Changi, Shurab, and other
places (Fig. 1b). Cu-vein-type mineralization is hosted
by volcanic rocks age of 39-40 Ma. Qaleh-Zari is the
best known (Fig. 1b).
3. Local Geology
The oldest rocks exposed in the mine area are
Jurassic shale and sandstone, which form the core of
anticline in central part of the Figure 1c. Out side from
the mine area, there are some older rock unites
presented in Figure 1c. Dome Robah mountain area,
Jurassic shale and sandstone are overlapped with
angular uncomfortably by a reddish conglomerate of
upper Cretaceous age. In upper Cretaceous, a sandy
limestone (having 200 m thickness) was deposited on
conglomerate. A massive (130 m thickness) pale cream
color limestone was deposited, continuous
sedimentation in Paleocene time (on the south side of
Dome Robah Mountain). Volcanic activity started in
this region in Late Eocene time.
Coherent and pyroclastic Tertiary volcanic rocks are
dominant in the mine area and in the region. They
consist mainly of k-rich andesite and andesitic-basalts,
with minor dacite and basalt (Appendix 1). Total Fe of
the volcanic rocks in the Qaleh-Zari region is high
(TFeO = 6 to 8.4%) mostly presents as Fe2O3 (Fe2O3 =
2.2 to 5.34 %). Andesitic rocks from the western region
of Qaleh-Zari were dated to 40.5 ± 2 Ma [10]. These
volcanic rocks are calc-alkaline to K-rich calc-alkaline
with transition to shoshonitic association. They have ageochemical signature typical of subduction-related
magma [1,11].
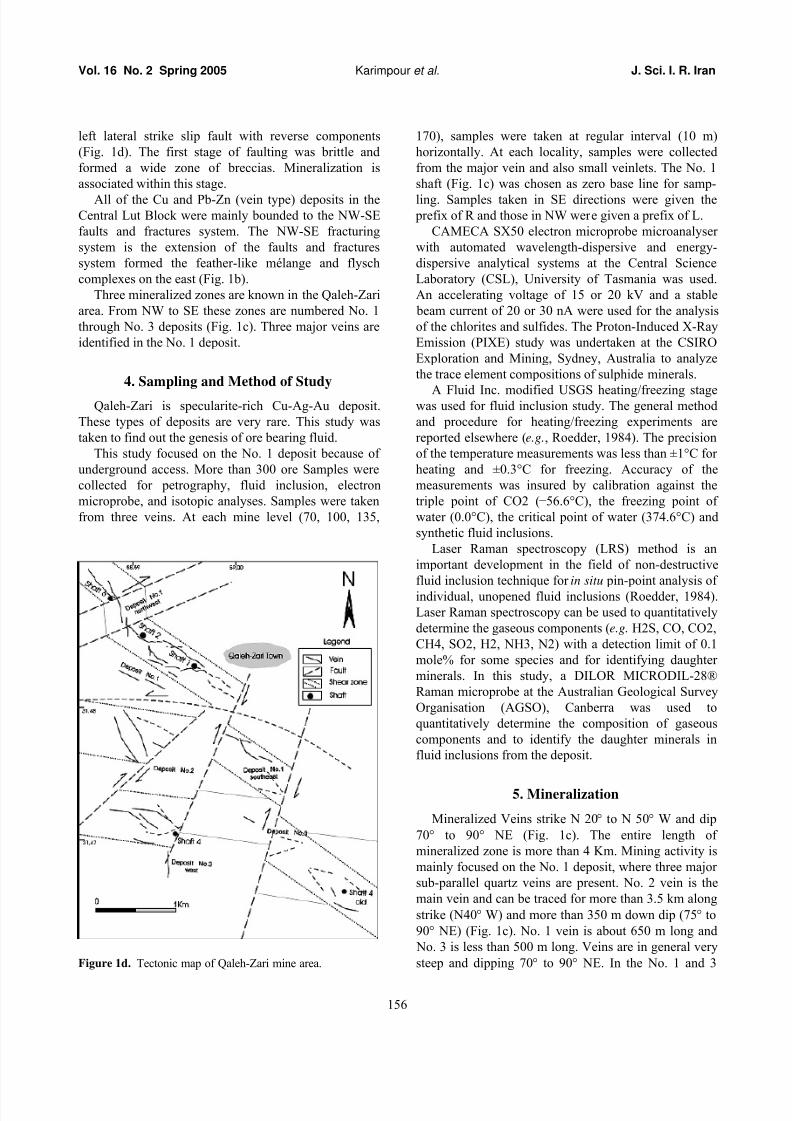
Four trends of faults and joints were identified in the
mine area (Fig. 1d). From the oldest to youngest they
were: 1) a N135°, 75°E trending right lateral strike slip
fault with reverse components, 2) N 150°, 80° NE
tending set right lateral strike slip fault with reverse
components, 3) a NE-SW trending set, and (3) a N 210°,
7o° SE trending right lateral strike slip fault with
reverse components and 4) N 120°, 85° NE tending set
8/2/2019 S-C-O Isotopes, Fluid Inclusion Microthermometry, and the Genesis of Ore Bearing Fluids at Qaleh-Zari Fe-Oxide Cu-…
http://slidepdf.com/reader/full/s-c-o-isotopes-fluid-inclusion-microthermometry-and-the-genesis-of-ore-bearing 4/16
Vol. 16 No. 2 Spring 2005 Karimpour et al. J. Sci. I. R. Iran
156
left lateral strike slip fault with reverse components
(Fig. 1d). The first stage of faulting was brittle and
formed a wide zone of breccias. Mineralization is
associated within this stage.
All of the Cu and Pb-Zn (vein type) deposits in theCentral Lut Block were mainly bounded to the NW-SE
faults and fractures system. The NW-SE fracturing
system is the extension of the faults and fractures
system formed the feather-like mélange and flysch
complexes on the east (Fig. 1b).
Three mineralized zones are known in the Qaleh-Zari
area. From NW to SE these zones are numbered No. 1
through No. 3 deposits (Fig. 1c). Three major veins are
identified in the No. 1 deposit.
4. Sampling and Method of Study
Qaleh-Zari is specularite-rich Cu-Ag-Au deposit.
These types of deposits are very rare. This study was
taken to find out the genesis of ore bearing fluid.
This study focused on the No. 1 deposit because of
underground access. More than 300 ore Samples were
collected for petrography, fluid inclusion, electron
microprobe, and isotopic analyses. Samples were taken
from three veins. At each mine level (70, 100, 135,
Figure 1d. Tectonic map of Qaleh-Zari mine area.
170), samples were taken at regular interval (10 m)
horizontally. At each locality, samples were collected
from the major vein and also small veinlets. The No. 1
shaft (Fig. 1c) was chosen as zero base line for samp-
ling. Samples taken in SE directions were given the prefix of R and those in NW were given a prefix of L.
CAMECA SX50 electron microprobe microanalyser
with automated wavelength-dispersive and energy-
dispersive analytical systems at the Central Science
Laboratory (CSL), University of Tasmania was used.
An accelerating voltage of 15 or 20 kV and a stable
beam current of 20 or 30 nA were used for the analysis
of the chlorites and sulfides. The Proton-Induced X-Ray
Emission (PIXE) study was undertaken at the CSIRO
Exploration and Mining, Sydney, Australia to analyze
the trace element compositions of sulphide minerals.
A Fluid Inc. modified USGS heating/freezing stagewas used for fluid inclusion study. The general method
and procedure for heating/freezing experiments are
reported elsewhere (e.g., Roedder, 1984). The precision
of the temperature measurements was less than ±1°C for
heating and ±0.3°C for freezing. Accuracy of the
measurements was insured by calibration against the
triple point of CO2 (−56.6°C), the freezing point of
water (0.0°C), the critical point of water (374.6°C) and
synthetic fluid inclusions.
Laser Raman spectroscopy (LRS) method is an
important development in the field of non-destructive
fluid inclusion technique for in situ pin-point analysis of
individual, unopened fluid inclusions (Roedder, 1984).
Laser Raman spectroscopy can be used to quantitatively
determine the gaseous components (e.g. H2S, CO, CO2,
CH4, SO2, H2, NH3, N2) with a detection limit of 0.1
mole% for some species and for identifying daughter
minerals. In this study, a DILOR MICRODIL-28®
Raman microprobe at the Australian Geological Survey
Organisation (AGSO), Canberra was used to
quantitatively determine the composition of gaseous
components and to identify the daughter minerals in
fluid inclusions from the deposit.
5. Mineralization
Mineralized Veins strike N 20° to N 50° W and dip
70° to 90° NE (Fig. 1c). The entire length of
mineralized zone is more than 4 Km. Mining activity is
mainly focused on the No. 1 deposit, where three major
sub-parallel quartz veins are present. No. 2 vein is the
main vein and can be traced for more than 3.5 km along
strike (N40° W) and more than 350 m down dip (75° to
90° NE) (Fig. 1c). No. 1 vein is about 650 m long and
No. 3 is less than 500 m long. Veins are in general very
steep and dipping 70° to 90° NE. In the No. 1 and 3
8/2/2019 S-C-O Isotopes, Fluid Inclusion Microthermometry, and the Genesis of Ore Bearing Fluids at Qaleh-Zari Fe-Oxide Cu-…
http://slidepdf.com/reader/full/s-c-o-isotopes-fluid-inclusion-microthermometry-and-the-genesis-of-ore-bearing 5/16
J. Sci. I. R. Iran Karimpour et al. Vol. 16 No. 2 Spring 2005
157
deposits, volcanic rocks host the veins where in No. 2
Jurassic shale and sandstone (Fig. 1c) host the deposit.
Textures, such as crustification, comb structures,
symmetrical banding, cockade structure and cavities,
which are indicative of open space filling, are present.
Paragenesis
In all veins quartz is by far the most common
constituent. Coarse-grained bands of euhedral dogtooth
clear quartz occurs in all places. The larger clear
euhedral quartz crystals terminate within open cavities.
Hematite (specularite) is the most abundant oxide after
quartz (up to 25%). Mineralization can be divided into 4
stages based on crosscutting relation and temperatures
of homogenization of fluid inclusions (see later section)
(Fig. 2).Stage I : The earliest paragenetic stage is
characterized by hematite (specularite), chlorite, quartz,
chalcopyrite, and Cu-Pb-Bi-Ag sulfosalt minerals (e.g.
aikinite, a proton microprobe mineral). Deposited
Sulfosalts on this stage are: aikinite, matildite, Bi-rich
galena, and wittichinite. Most of sulfosalts are found as
inclusion within chalcopyrite. Quartz veins and veinlets
typically have hematite bands in the margins. Quartz
formed as 1-10 cm clear crystals. Silver is present as
sulfosalt minerals that are mainly found as inclusion
within chalcopyrite. Chlorites were formed either due to
alteration of hornblende, biotite, and pyroxene within
the country rocks as part of propylitic assemblages, or
they crystallized directly from the hydrothermal fluid
into the veins. Chlorites, directly crystallized from the
hydrothermal fluid, are situated mainly in the vein.
Hematite (specularite) forms 10 to 25 percent of the
veins. Most of chalcopyrite, sulfosalts, and hematite
were deposited in this stage. In all veins (along the veins
and down deep) hematite formed first, followed by the
clear quartz-chlorite and then by chalcopyrite and
occasionally pyrite (Fig. 3a-b). Electrum was identified
in only one, out of 200 polished section examined.
Stage II : quartz, chalcopyrite, pyrite, chlorite ±
hematite ± sulfosalt minerals. This stage is lessimportant in comparison with the first stage. Pyrite
forms mainly euhedral crystals and is more abundant in
this stage. Sulfosalts formed at this stage are: arcubisite,
wittichinite, aikinite, cosalite-berryite, Ag-rich
sulfosalts, and Ag-rich galena. Quartz are very clear and
formed very large crystals (up to 20 cm long).
Stage III : quartz ± pyrite ± chalcopyrite. This stage is
present only as small veinlets. Quartz crystals are
becoming less clear. Very minor chalcopyrite is
associated with these veins.
Stage IV : hematite + quartz + calcite ± pyrite ±
chalcopyrite ± Ag-rich sulfosalts. Calcites are clear to
milky. They are grown over the quartz crystals or they
form crystals of different shape. Similar to stage I,
hematite formed first followed by quartz. Occasionally
pyrite and chalcopyrite are found on this stage. Calciteis abundant in the No. 3 deposit.
6. Alteration
Propylitic alteration assemblages are very
widespread in the Qaleh-Zari area (Fig. 1c). Epidote and
chlorite are the two characteristic minerals of this
assemblage. Epidote is very abundant and formed by
alteration of plagioclase, pyroxene, and hornblende.
Epidote is also abundant as veinlets filling the joints.
Chlorite formed by alteration of mafic minerals or
directly from the ore fluid within the vein. Chlorites aregenerally Fe-rich types such as ripidolite with minor
bronsvigite-pycnochlorite [12]. Argillic alteration is
locally present (Fig. 1c). Silicification is mainly found
within a zone adjacent to the veins.
7. Ore Grade Distribution
Table 1 summarizes the typical ore grades and width
of veins. To determine the distribution of and
correlation between Cu, Ag and Au, mine assay data
were used to contour grade variations along long
sections of the No. 1 (Figs. 4-6) and 3 veins (Figs. 7-9).
Ore grades are presented on cross sections.
In the No. 1 vein there are two zones with higher Cu-
contents (Fig. 4). In zone A, the highest Cu ore grade
(Cu=7%) was occurs mainly in area between 100 to 135
m mine level. In zone B, the highest Cu ore grade (Cu =
6 %) occurs mainly in an area between 70 to 170 m
mine levels (Fig. 4). In zone A, the Cu-ore grade
decreases toward the surface in NW direction (Fig. 4).
The highest Ag contents (160 to 180 ppm) is coincident
with the high grade copper ore body (Fig. 5). The
highest Au contents (to 4.5 ppm) are situated between
70 to 100 meter mine levels (Fig. 6). In zone B, the high
Au grades (2 ppm) are mainly associated with high Cugrades (Fig. 6).
In the No. 3 vein the highest Cu (to 8.5%) and Ag
(325-400 ppm) grades occur mainly between the 100
and 135 m mine levels (Fig. 7). The close association of
Ag-bearing sulfosalts with chalcopyrite accounts for this
close Cu-Ag association. This explains the association
and distribution of high grade Cu and Ag of the ore. The
highest Au (Au = 30-40 ppm) is found in No. 3 vein. It
occurs in area between 40 to 100 meters mine levels
(Fig. 9).
8/2/2019 S-C-O Isotopes, Fluid Inclusion Microthermometry, and the Genesis of Ore Bearing Fluids at Qaleh-Zari Fe-Oxide Cu-…
http://slidepdf.com/reader/full/s-c-o-isotopes-fluid-inclusion-microthermometry-and-the-genesis-of-ore-bearing 6/16
Vol. 16 No. 2 Spring 2005 Karimpour et al. J. Sci. I. R. Iran
158
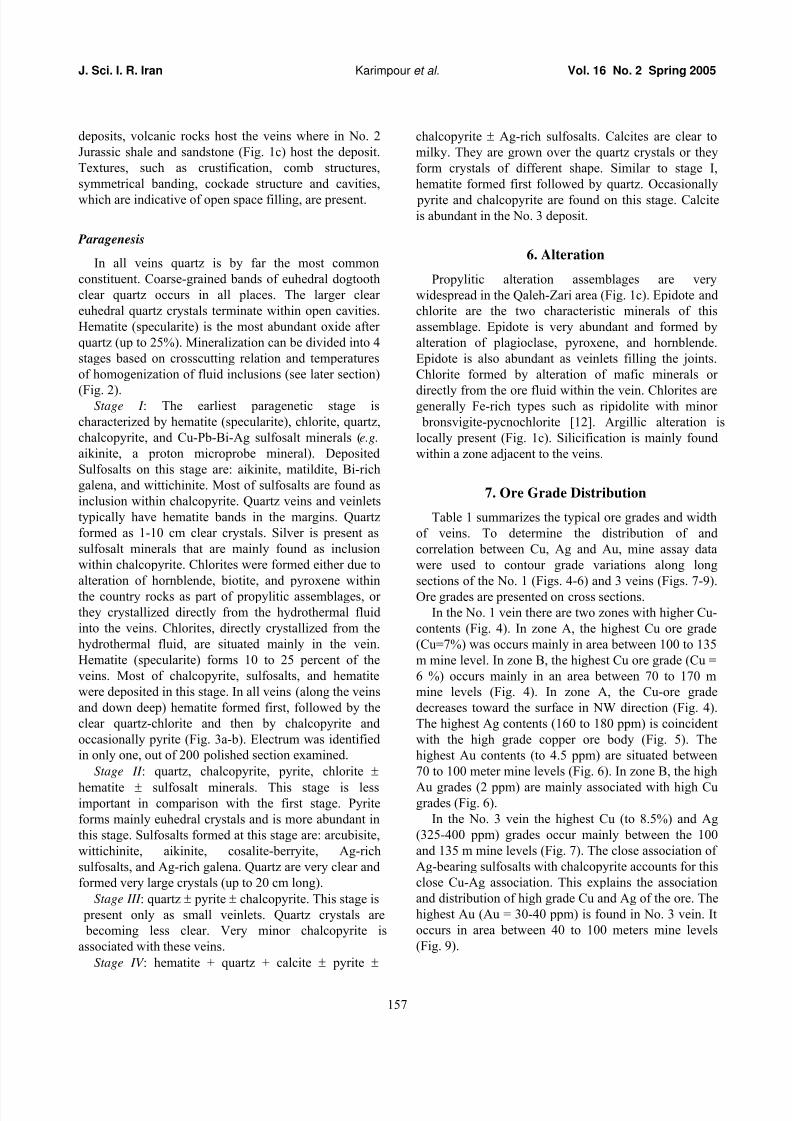
Figure 2. Mineral paragenesis of Qaleh-Zari Cu-Au-Agdeposit.
Figure 3a. Photomicrograph shows the sequence of mineralization, specularite (sp) and chlorite crystallized first,
then quartz (Qtz) and finally chalcopyrite (Cp).
Figure 3b. Photomicrograph shows specularite formed first,quartz with euhedral shape fallow the specularite, chalcopyrite
and sulfosalts are formed later.
Table 1. The average ore grade and width of veins [2]
Vein 1 2 2 3
%Cu 7 8.7 8.9 7.3
Au (ppm) 4.5 0.3 8.7 40
Ag (ppm) 180 246 620 255
%Bi n.a n.a 0.28 0.24
%Pb n.a n.a 0.33 0.13
%Zn n.a n.a 0.1 0.03
%As n.a n.a 0.007 0.005
%Fe n.a n.a 27.6 24
%SiO2 n.a n.a 29.2 36.6
%Ca n.a n.a 2 1.5
n.a not available
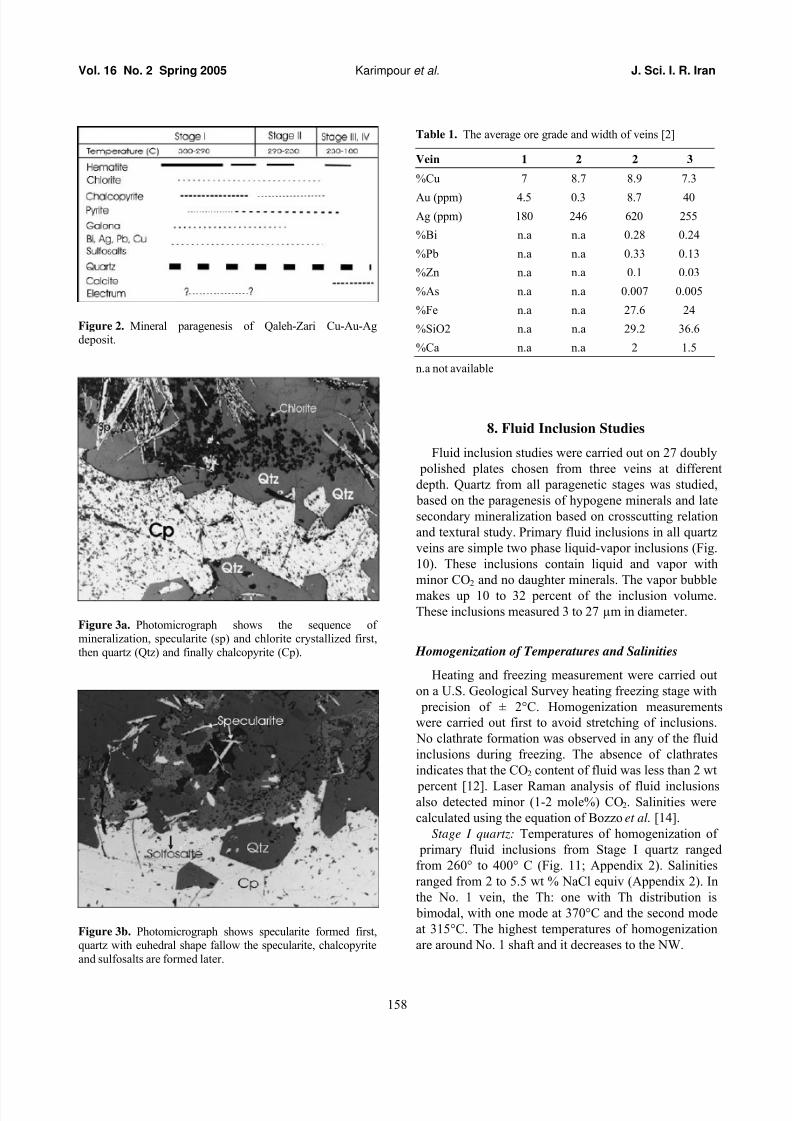
8. Fluid Inclusion Studies
Fluid inclusion studies were carried out on 27 doubly
polished plates chosen from three veins at different
depth. Quartz from all paragenetic stages was studied,
based on the paragenesis of hypogene minerals and late
secondary mineralization based on crosscutting relation
and textural study. Primary fluid inclusions in all quartz
veins are simple two phase liquid-vapor inclusions (Fig.
10). These inclusions contain liquid and vapor with
minor CO2 and no daughter minerals. The vapor bubble
makes up 10 to 32 percent of the inclusion volume.
These inclusions measured 3 to 27 µm in diameter.
Homogenization of Temperatures and Salinities
Heating and freezing measurement were carried out
on a U.S. Geological Survey heating freezing stage with
precision of ± 2°C. Homogenization measurements
were carried out first to avoid stretching of inclusions.
No clathrate formation was observed in any of the fluid
inclusions during freezing. The absence of clathrates
indicates that the CO2 content of fluid was less than 2 wt
percent [12]. Laser Raman analysis of fluid inclusionsalso detected minor (1-2 mole%) CO2. Salinities were
calculated using the equation of Bozzo et al. [14].
Stage I quartz: Temperatures of homogenization of
primary fluid inclusions from Stage I quartz ranged
from 260° to 400° C (Fig. 11; Appendix 2). Salinities
ranged from 2 to 5.5 wt % NaCl equiv (Appendix 2). In
the No. 1 vein, the Th: one with Th distribution is
bimodal, with one mode at 370°C and the second mode
at 315°C. The highest temperatures of homogenization
are around No. 1 shaft and it decreases to the NW.

8/2/2019 S-C-O Isotopes, Fluid Inclusion Microthermometry, and the Genesis of Ore Bearing Fluids at Qaleh-Zari Fe-Oxide Cu-…
http://slidepdf.com/reader/full/s-c-o-isotopes-fluid-inclusion-microthermometry-and-the-genesis-of-ore-bearing 7/16
J. Sci. I. R. Iran Karimpour et al. Vol. 16 No. 2 Spring 2005
159
Figure 4. Cross section showing distribution of Cu grade in
vein No. 1.
Figure 6. Cross section showing distribution of Au grade in
vein No. 1.
Figure 8. Cross section showing distribution of Ag grade invein No. 3.
In the No. 2 vein, Th are between 295° to 370°C,
with a mode at 325°-350°C (Fig. 11; Appendix 2). In
the No. 3 vein, the mode of Th is between 300° and
310°C (Fig. 11; Appendix 1). Although temperatures of
homogenization for Stage I quartz are similar in the No.
1 & 2 veins, Th in the No. 3 vein is significantly lower.
Figure 5. Cross section showing distribution of Ag grade in
vein No. 1.
Figure 7. Cross section showing distribution of Cu grade in
vein No. 3.
Figure 9. Cross section showing distribution of Au grade invein No. 3.
Stage II quartz: Temperatures of homogenization of
primary fluid inclusions from Stage II quartz ranged
from 230° to 290°C (Fig. 11; Appendix 3). Salinities
ranged from 2.2 to 5.8 wt % NaCl equiv (Appendix 3).
Stage III quartz: Temperatures of homogenization of
primary fluid inclusions from Stage III quartz ranged

8/2/2019 S-C-O Isotopes, Fluid Inclusion Microthermometry, and the Genesis of Ore Bearing Fluids at Qaleh-Zari Fe-Oxide Cu-…
http://slidepdf.com/reader/full/s-c-o-isotopes-fluid-inclusion-microthermometry-and-the-genesis-of-ore-bearing 8/16
Vol. 16 No. 2 Spring 2005 Karimpour et al. J. Sci. I. R. Iran
160
from 240° to 256°C (Fig. 11; Appendix 4) Salinities
ranged from 1.8 to 2.3 wt % NaCl equiv (Appendix 4).
Stage IV quartz: Temperatures of homogenization of
primary fluid inclusions from this Stage IV quartz
ranged from 180° to 210°C (Fig. 11; Appendix 4).Salinities of these inclusions ranged from 1.3 to 1.8 wt
% NaCl equiv (Appendix 4).
Discussion: The salinity of the ore fluid appears to
have decreased from about 6 wt % NaCl equiv in the
earliest stage of mineralization to 1 wt % NaCl in latest
stage of mineralization (Fig. 12). Most of the
chalcopyrite and sulfosalts minerals were deposited
early in the paragenesis at high temperatures commonly
in excess of 300°C, mainly hematite, quartz, and calcite
were deposited.
Laser Raman analysis of fluid inclusions detected
minor (to 1-2 mole%) CO2 in the vapor phase, but nomethane and N2 in the vapor phase, nor any sulfate in
the liquid.
9. Carbon Oxygen Isotopes
Calcite samples, which formed during the hypogene
stage of mineralization, were analyzed for C and O
isotopes at the University of Tasmania (Table 2). Based
on temperature of fluid inclusions in quartz crystals,
calcite formed at 200-250°C using a temperature of
200°C and fractionation data of O'Neil et al. [15] and
Ohmoto and Rye [16], the fluid δ18O
SMOWwas estimated
at 7.4 to 9.8‰, and CO2 in the fluid had δ13CPDB of −3.8
to −3.0‰. When compared to other Cu deposits, Qaleh
Zari carbonates had similar isotopic composition to
those from porphyry Cu deposits (Fig. 13). The fluid
δ18OSMOW overlaps the range of magmatic waters, but is
inconsistent with that of meteoric waters [17]. The δ18
O
of quartz studied by Hassan Nejad [18] also indicates a
magmatic source for the water.
Figure 10. Photomicrograph showing the fluid inclusion inquartz, from Qaleh-Zari Mine. They are liquid rich type.
10. Sulfur Isotopes
Eight chalcopyrite and two pyrite were selected from
different veins which are formed within the first and
second stage of mineralization (Table 3). Chalcopyriteand pyrite were extracted using a drill from different
veins and analyzed for δ34S CDT at the University of
Tasmania, where sample reproducibility is typically
±0.2‰. The results are summarized in Table 3 and
plotted in Figure 14. δ34
SCDT values of chalcopyrite
separates vary between 0.4 and 2.2‰, and for pyrite
separates vary between 2.0 and 2.2‰. Using
fractionation equations in Ohmoto and Rye [16] and a
temperature estimate of 250-300°C, the δ34SCDT of the
fluid was between 0.5 to 1.9‰. The sulfur may be
originated from the following sources: 1) direct input
from buried magmatic pluton, 2) leached from host
volcanic rocks, or 3) leached from the nearby
sedimentary rocks. Jurassic shale in the area is carbo-
naceous and it is found only in the middle part of the
area. The Qaleh-Zari ore bearing fluid was very oxidi-
zing (because of at least 20% specularite) and it did not
appear to interact with the Jurassic carbonaceous shale,
therefore sulfur is not likely originated from the shale.
11. Chlorite Geochemistry
Chlorites were formed either due to alteration of
hornblende, biotite, and pyroxene within the country
rocks as part of propylitic assemblages, or theycrystallized directly from the hydrothermal fluid into the
veins (Fig. 15). Chlorites crystallized directly from the
hydrothermal fluid are situated mainly in the vein. To
compare the temperature of fluid inclusion with chlorite
and also determining the physiochemical condition of
ore bearing fluid chlorite from different veins and from
different stages of mineralization were analyzed.
Following detailed petrography studies, chlorites next to
quartz were selected (within the vein zone) for Cameca
SX 50 electron microprobe EDS analysis at the
University of Tasmania. An accelerating voltage of 15
kV was used with a beam current of 20 nA. Chloritesare generally, Fe-rich types such as ripidolite with
minor bronsvigite-pycnochlorite (Fig. 16).
Using the equation of Cathelineau, the temperature of
chlorite formation was calculated. The temperature of
fluid inclusion in quartz and chlorite formed next to
each other for 17 samples from three different veins
were then compared. In all cases, the calculated
temperature of chlorite was 15° to 20°C less than the
homogenization temperature of fluid inclusions.
Noting this systematic difference and that the
Cathelineau and Nieva [19] equation was extrapolation
8/2/2019 S-C-O Isotopes, Fluid Inclusion Microthermometry, and the Genesis of Ore Bearing Fluids at Qaleh-Zari Fe-Oxide Cu-…
http://slidepdf.com/reader/full/s-c-o-isotopes-fluid-inclusion-microthermometry-and-the-genesis-of-ore-bearing 9/16
J. Sci. I. R. Iran Karimpour et al. Vol. 16 No. 2 Spring 2005
161
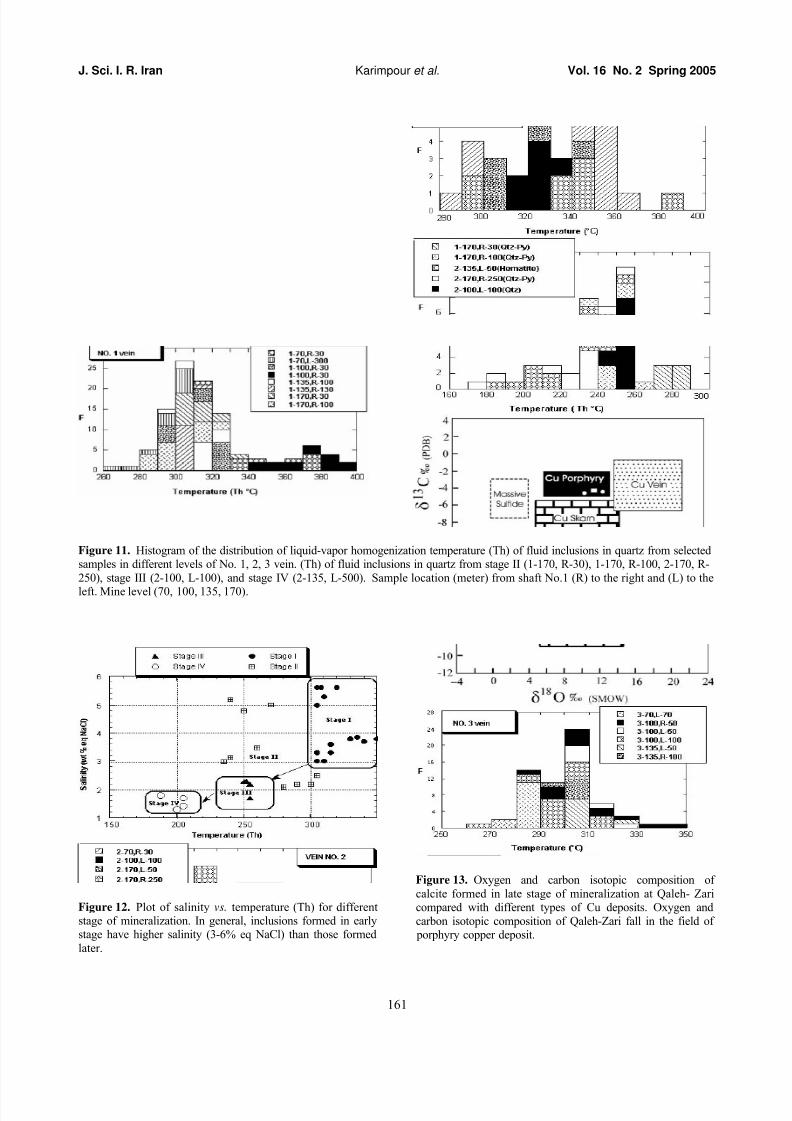
Figure 11. Histogram of the distribution of liquid-vapor homogenization temperature (Th) of fluid inclusions in quartz from selectedsamples in different levels of No. 1, 2, 3 vein. (Th) of fluid inclusions in quartz from stage II (1-170, R-30), 1-170, R-100, 2-170, R-
250), stage III (2-100, L-100), and stage IV (2-135, L-500). Sample location (meter) from shaft No.1 (R) to the right and (L) to the
left. Mine level (70, 100, 135, 170).
Figure 12. Plot of salinity vs. temperature (Th) for differentstage of mineralization. In general, inclusions formed in earlystage have higher salinity (3-6% eq NaCl) than those formed
later.
Figure 13. Oxygen and carbon isotopic composition of
calcite formed in late stage of mineralization at Qaleh- Zaricompared with different types of Cu deposits. Oxygen and
carbon isotopic composition of Qaleh-Zari fall in the field of porphyry copper deposit.

8/2/2019 S-C-O Isotopes, Fluid Inclusion Microthermometry, and the Genesis of Ore Bearing Fluids at Qaleh-Zari Fe-Oxide Cu-…
http://slidepdf.com/reader/full/s-c-o-isotopes-fluid-inclusion-microthermometry-and-the-genesis-of-ore-bearing 10/16
Vol. 16 No. 2 Spring 2005 Karimpour et al. J. Sci. I. R. Iran
162
Table 2. Carbon and Oxygen isotopic composition of Calcite
and fluid at T 200°C
Sample No. δ18OSMOW (‰) δ
13CPDB (‰)
Calcite Fluid Calcite CO2
Vein-1 (3972) 17.41 7.86 −3.36 −3.54
Vein-1 (3973) 19.40 9.8 −2.86 −3.04
Vein-2 (3974) 16.96 7.47 −3.61 −3.79
Figure 14. Histogram of S-isotopic composition of pyrite andchalcopyrite from selected samples in different mine levels of
No. 1, 2, and 3 veins.
Figure 15. Photomicrograph shows that chlorite formed thesame time as quartz crystal was growing.
for temperatures above 240°C, Karimpour and Zaw [12]
proposed a new equation for estimating temperatures
from chlorite composition:0.0039T = AlIV - 0.0756,
where T is in Kelvin and AlIV is based on 14 oxygen
atoms (Fig. 17).
By using Walshe & Solomon [20] and Walshe [20]
procedures, both temperature and logfO2 formation of
chlorite were calculated. Temperature was lower than
fluid inclusion. The logfO2 of formation of chlorite was
calculated using Walshe & Solomon [20] and Walshe[21] procedures. The results indicate that chlorite
formed in the field of magnetite. More than 250
polished section and thin section were studied from
different veins at different depth. No magnetite was
found to form from hydrothermal fluid at Qaleh-Zari.
Hematite (specularite) is the only primary iron oxides
present at Qlaeh-Zari. Therefore based on very detail
and accurate fluid inclusion thermometry and
paragenesis study, both Walshe & Solomon [20] and
Walshe [21] and Cathelineau and Nieva [19] methods
for calculating the temperature of formation of chlorite
and determining the logfO2 has some problems or chlorite is not a reliable mineral to use for calculating
the temperature of formation or determining the logfO2
of the fluid.
MgO and FeO content of chlorites changed with
respect to temperature. The FeO content of chlorite was
37 wt % at 310°C and decreased to about 29 % at
260°C. The MgO content of chlorite increased while the
temperature of fluid was decreasing. The MgO content
was about 8% at 310°C and increased to 13.5 % at
260°C.
12. Trace Element Contents of Chalcopyriteand Pyrite
As mineragraphic investigations indicated that
electrum could not account for the observed Au grades
in the Qaleh-Zari deposit, a proton microprobe study
using the HIAF Proton Microprobe at CSIRO in Sydney
was undertaken to establish the mineralogical host to
Au. Table 4 lists analytical results for analysis of pyrite
and chalcopyrite and an analysis of aikinite.
Pyrite
Based on trace element content, pyrite can be dividedinto two groups. The first group is characterized by high
As (to 2800 ppm) with associated high Au (to 20 ppm),
Mo (to 4.3 ppm) and Se (to 190 ppm). In contrast, the second group has much lower As values, but is enriched
in Zn (to 200 ppm), Pb (to 190 ppm), Sn (to 17 ppm),
Sb (to 6 ppm) and Cd (to 6 ppm) relative to the first
group. The Cu content of both groups is similar, with
values between 54 to 870 ppm.
The enrichment of Au in As-rich pyrite has been
observed in a number of deposit types including, among
others, lode Au [22,23] and volcanic-hosted massive

8/2/2019 S-C-O Isotopes, Fluid Inclusion Microthermometry, and the Genesis of Ore Bearing Fluids at Qaleh-Zari Fe-Oxide Cu-…
http://slidepdf.com/reader/full/s-c-o-isotopes-fluid-inclusion-microthermometry-and-the-genesis-of-ore-bearing 11/16
J. Sci. I. R. Iran Karimpour et al. Vol. 16 No. 2 Spring 2005
163
Figure 16. Plot shows types of chlorites formed in No. 1, 2,and 3 veins.
Figure 17. Equation of Cathelineau and Nieva (1985) andKarimpour.
Figure 18. Plot of Log fO2 – T, at pH= 4.5, m∑S 10−3, P=500 b. At Qaleh-Zari due to high oxygen fugacity and low
sulfur specularite was formed first and pyrite formed onlywithin the 2nd and 3rd stage of mineralization. At the laststage (IV), specularite was dominant.
sulfide deposits [24,25]. Although a great amount of
uncertainty exist regarding the causes of this
association, recent work by Simon et al. [26,27] indicate
that gold bearing from the Twin Creek Carlin-type gold
deposits show that gold is present as both Au0 and Au1+ and arsenic present as As1−. Au0 is present as sub-
micrometer size inclusions of free gold, whereas Au1+
is
attributed to gold in the lattice of arsenian pyrite.
The generally high Se levels in the pyrite (and in the
chalcopyrite; see below) indicate deposition from either
an oxidized fluid or a fluid with a high Se/S ratio [28].
Such fluid is consistent with derivation from a
magmatic-hydrothermal source
Chalcopyrite
Chalcopyrite was also divided into two groups basedon paragenesis. The first group is characterized by high
Ag (to 44 ppm) and Ba (to 360 ppm), whereas the
second group is characterized by high Zn (to 470 ppm).
Both groups lack detectable As, Te, Tl, Mo, Co, and Ni,
but contain significant Se (to 110 ppm), Sn (to 42 ppm),
Cd (to 33 ppm) and Au (to 42 ppm). These data confirm
the Se-rich character of Qaleh-Zari sulfides and suggest
that chalcopyrite may be a significant repository of Au.
Experiments in the Au-Cu-Fe-S system were carried out
at 400°C to 700°C to determine how much gold could
be accommodated by bornite and chalcopyrite [29].
Results show that for all temperatures bornite contains
one order of magnitude more gold than chalcopyrite.
The range of gold concentrations in bornite and chal-
copyrite decreases with decreasing temperature [29].
Sulfosalt Minerals
A single analysis of aikinite (CuPbBiS3) suggests
enrichment in Te (756 ppm), Re (332 ppm), Se (0.179
%), and Sb (34.8 ppm; Table 5) in addition to Ag
(0.45%). This analysis suggests that sulfosalt minerals
are probably the most significant repositories of Ag.
13. Ore Transport and Deposition
Based on our fluid inclusion data, the Qaleh-Zari ore
fluids decreased from temperatures in excess of 350°C
in Stage I to less than 200°C in stage IV. There was a
corresponding decrease in salinities from 5-6 to ~2 eq
wt % NaCl. Variations in homogenization temperatures
of stage I fluid inclusions relative to shaft 1 suggest that
this variation was spatial as well as temporal. These data
suggest either the ore fluid evolved in time and space or
that a high temperature and salinity fluid mixed with a
lower temperature and salinity fluid at Qaleh-Zari.
8/2/2019 S-C-O Isotopes, Fluid Inclusion Microthermometry, and the Genesis of Ore Bearing Fluids at Qaleh-Zari Fe-Oxide Cu-…
http://slidepdf.com/reader/full/s-c-o-isotopes-fluid-inclusion-microthermometry-and-the-genesis-of-ore-bearing 12/16
Vol. 16 No. 2 Spring 2005 Karimpour et al. J. Sci. I. R. Iran
164
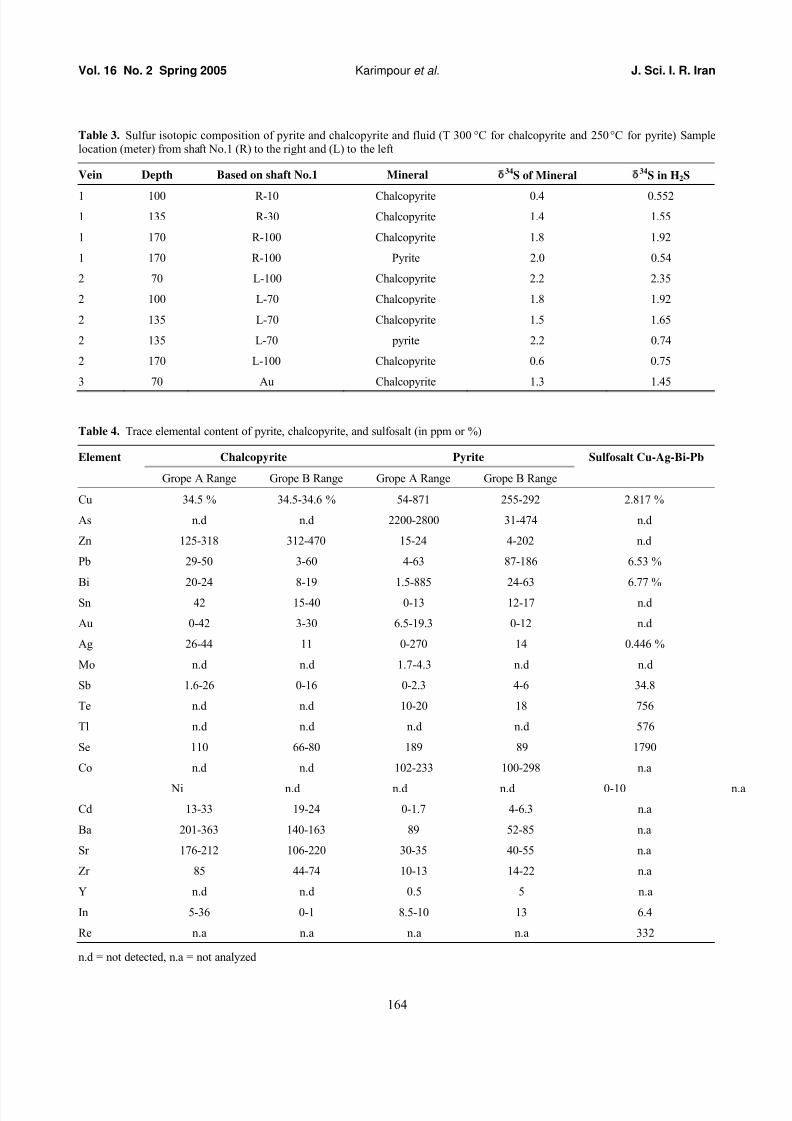
Table 3. Sulfur isotopic composition of pyrite and chalcopyrite and fluid (T 300°C for chalcopyrite and 250°C for pyrite) Samplelocation (meter) from shaft No.1 (R) to the right and (L) to the left
Vein Depth Based on shaft No.1 Mineral δ34
S of Mineral δ34
S in H2S
1 100 R-10 Chalcopyrite 0.4 0.552
1 135 R-30 Chalcopyrite 1.4 1.55
1 170 R-100 Chalcopyrite 1.8 1.92
1 170 R-100 Pyrite 2.0 0.54
2 70 L-100 Chalcopyrite 2.2 2.35
2 100 L-70 Chalcopyrite 1.8 1.92
2 135 L-70 Chalcopyrite 1.5 1.65
2 135 L-70 pyrite 2.2 0.74
2 170 L-100 Chalcopyrite 0.6 0.75
3 70 Au Chalcopyrite 1.3 1.45
Table 4. Trace elemental content of pyrite, chalcopyrite, and sulfosalt (in ppm or %)
Element Chalcopyrite Pyrite Sulfosalt Cu-Ag-Bi-Pb
Grope A Range Grope B Range Grope A Range Grope B Range
Cu 34.5 % 34.5-34.6 % 54-871 255-292 2.817 %
As n.d n.d 2200-2800 31-474 n.d
Zn 125-318 312-470 15-24 4-202 n.d
Pb 29-50 3-60 4-63 87-186 6.53 %
Bi 20-24 8-19 1.5-885 24-63 6.77 %
Sn 42 15-40 0-13 12-17 n.d
Au 0-42 3-30 6.5-19.3 0-12 n.d
Ag 26-44 11 0-270 14 0.446 %
Mo n.d n.d 1.7-4.3 n.d n.d
Sb 1.6-26 0-16 0-2.3 4-6 34.8
Te n.d n.d 10-20 18 756
Tl n.d n.d n.d n.d 576
Se 110 66-80 189 89 1790
Co n.d n.d 102-233 100-298 n.a
Ni n.d n.d n.d 0-10 n.a
Cd 13-33 19-24 0-1.7 4-6.3 n.a
Ba 201-363 140-163 89 52-85 n.a
Sr 176-212 106-220 30-35 40-55 n.a
Zr 85 44-74 10-13 14-22 n.a
Y n.d n.d 0.5 5 n.a
In 5-36 0-1 8.5-10 13 6.4
Re n.a n.a n.a n.a 332
n.d = not detected, n.a = not analyzed

8/2/2019 S-C-O Isotopes, Fluid Inclusion Microthermometry, and the Genesis of Ore Bearing Fluids at Qaleh-Zari Fe-Oxide Cu-…
http://slidepdf.com/reader/full/s-c-o-isotopes-fluid-inclusion-microthermometry-and-the-genesis-of-ore-bearing 13/16
J. Sci. I. R. Iran Karimpour et al. Vol. 16 No. 2 Spring 2005
165
Hematite, the predominant Fe-S-O mineral in the
Qaleh-Zari vein is stable at all temperatures at highly
oxidized conditions (i.e. *SO4 > *H2S), but it is also
stable at high temperature in moderately oxidized
conditions (i.e. *H2S * *SO4) if *S is low (Fig. 18).Although the presence of hematite in the ore stages
indicates relatively low H2S, the redox conditions (i.e.
*SO4 > *H2S verses *H2S * *SO4) cannot be determined
by the Fe-O-S mineral assemblages.
However, the sulfur isotope data suggest that the
conditions were H2S dominant (i.e. moderately oxidized
with *H2S * *SO4). The range in δ34S or sulfide
minerals reported in this study is narrow (0.4-2.2),
which is inconsistent with highly oxidized conditions
(*SO4 > *H2S) where a much larger range in d34S
would be expected [30]. Using these isotopic constraints
and the mineralogical and fluid inclusion data, the fluidconditions inferred for paragenetic stages I to IV are
plotted on Figure 18. Although the fluids decreased in
temperature and salinity temporally and spatially, no
major changes in redox relative to *H2S/*SO4 were
necessary. Such trajectory in fO2-temperature space
could be produced either by rock buffered cooling or by
mixing of a high temperature ore fluid (possibly
magmatic) with a lower temperature ambient (possibly
meteoric) fluid. As the salinity also varies between
paragenetic stages, we prefer the fluid mixing model.
This simple mixing model can easily account for the
deposition of Cu, Au and Ag in the veins. Figure 20
illustrates that the solubility of Cu as a chloride complex
decreases rapidly with temperature, with the stage III
fluids only capable of carrying minor Cu. The
mechanism of Au transport and deposition is more
problematic. For the conditions inferred for stage I ore
fluids (e.g. 300-400°C, 5.5 wt % NaCl, 10−3
m H2S, pH
of 4.5), gold could have been carried either by
chlorocomplexes or thiocomplexes, depending on the
exact sulfur content and pH of the ore fluids (c.f.
Huston, 2000). In either case, however, fluid mixing
would have effectively deposited gold, either by dilution
(reducing *H2S in the case of gold thiocomplexes or
reducing salinity for gold chlorocomplexes) or bycooling (for gold chlorocomplexes). Hence, the
depositional mechanism at Qaleh-Zari is most likely
simple fluid mixing, and it does not appear to involve
redox reactions as at some other Fe-oxide-related Cu-
Au deposits.
14. Conclusion
Tertiary volcanic rocks cover an area more than 400
km2. The Qaleh-Zari Cu-Ag-Au mineralization is
localized and is present in small region of the volcanic
rocks. The Qaleh-Zari deposit consists of a series of
specularite-rich Cu-Au-Ag-bearing vein deposits. Host
rocks are mainly Tertiary andesite and andesitic basalts,
but in the central part shale and sandstone of Jurassic
age. Andesitic rocks from the western region of Qaleh-Zari were dated to 40.5 ± 2 Ma [10]. These volcanic
rocks are calc-alkaline to K-rich calc-alkaline with
transition to shoshonitic association. They have a
geochemical signature typical of subduction-related
magma [1,11].
The Qaleh-Zari Cu-Ag-Au deposit has several unique
and important features such as: 1) high grade Cu-Ag-Au
deposit. 2) the ore fluid is very oxidizing as evidenced
by the presence of abundant specularite, 3) no magnetite
is formed from the ore fluid, 4) low sulfide, 5) moderate
to high temperature with moderate to low salinities.
Most of chalcopyrite and some sulfosalt mineralswere deposited at temperature of 350° to 290°C. The
oxygen isotopic values (measured from calcite) indicate
that the fluid had a magmatic origin. Both C and S
isotopic values also suggest magmatic affinities. It is
interpreted that an intermediate subvolcanic stock at
depth was the source of ore fluid. The moderate to low
salinities of ore fluids indicate that input of meteoric
fluids during the later stages of mineralization cannot be
ruled out. The style of mineralization may change with
depth to porphyry type. Shape and depth of porphyry
style of mineralization can be defined using appropriate
geophysical method.
Acknowledgements
We would like to thank to Iranian industrial Copper
company and Minakan Mining company for allowing
access to Qaleh-Zari mine and also to geologist working
at Qaleh-Zari mine for being very cooperative. The
authors wish to thank Dr Ross R Large director of
Centre for Ore Deposit Research, University of
Tasmania, Hobart, Australia for accessing the research
facilities. Thanks to people working in Central Sciences
Laboratory, University of Tasmania for electron
microprobe analysis and S, C, and O isotopesdetermination.
References
1. Sadaghyani-Avval F., Etude geologique de la region de la
mine de Khali-Eh-Zari (Iran) mineralization et inclusionsfluids. Ph.D. Theses, unpublished equipe de recherche aur
les equilibrites entre fluides et mineraux, Universite de Nancy I., 165 p. (1976).
2. Yuichi S., Ogawa K., and Akiyama N. Copper ores from
Qaleh Zari mine, Iran. Mining Geology, 26: 385-391(1976).
8/2/2019 S-C-O Isotopes, Fluid Inclusion Microthermometry, and the Genesis of Ore Bearing Fluids at Qaleh-Zari Fe-Oxide Cu-…
http://slidepdf.com/reader/full/s-c-o-isotopes-fluid-inclusion-microthermometry-and-the-genesis-of-ore-bearing 14/16
Vol. 16 No. 2 Spring 2005 Karimpour et al. J. Sci. I. R. Iran
166
3. DaymehVar M. Geology and geochemistry of Qaleh-ZariCu-Au deposit: Unpublished, M.Sc. Thesis, University of
Tarbite Modaress, Iran (1993).4. Hassan Nejad A.A. Geology and Geochemistry of Qaleh-
Zari Cu-Au-Ag deposit. Unpublished, M.Sc. Thesis,University of Shiraz, Iran (1993).
5. Soffel H.C. and Forster H.G. Polar Wander path of
Central-East-Iran microplate including new results. N. Jb.
Geol. Palaont. Abh., 168(2/3): 165-172 (1984).
6. Tirrul R., Bell L.R., Griffis R.J., and Camp V.E. TheSistan suture zone of eastern Iran. G.S.A. Bulletin, 84:134-150 (1983).
7. Tarkian M., Lotfi M., and Baumann A. Magmatic copper and Lead Zinc ore deposits in the Central Lut, Eastern
Iran. N. Jb. Geol. Palaont. Abh., 168(2/3): 497-523(1984).
8. Dehghani G. Schwerefeld und Krustenaufbau im Iran-
Humburger Geophys. Einzelscher., R. A., H., 54, S.,Hamburg (1981).
9. Lensch G. and Schmidt K. Plate tectonic, orogeny, andmineralization in the Iranian fold belts results and
conclusions. N. Jb. Geol. Palaont. Abh., 168(2/3): 558-568 (1984).
10. Kluyver H.M., Griffts R.J., Tirrul R., Chance P.N., andMeixner H.M. Geological Quadrangle Map Sheet Lakar
Kuh Quadrangle 1:250,000. Geol. Surv. Iran (1978).11. Tarkian M., Lotfi M. and Bauman A. Tectonic,
magmatism and the formation of mineral deposits incentral Lut, East of Iran. Geol. Survey of Iran, Rep. No.
57, p. 357-383 (1983).12. Karimpour M.H. and Khin Z. Geochemistry and
physicochemical condition of Qaleh-Zari Cu-Ag-Au ore
bearing solution based on chlorite composition. Iranian
Journal of Crystallography and Mineralogy, 8: 3-22(2000).
13. Hedenquist J.W. and Henley R.W. The important of CO2 on freezing point measurements of fluid inclusion:
evidence from active geothermal system and implicationfor epithermal ore deposition. Econ. Geol., 80: 1379-1406
(1985).14. Bozzo A.T., Chen R. and Barduhn A.J. The properties of
hydrates of chlorine and carbon dioxide. In: Delyannis A.and Delyannis E. (Eds.), fourth international symposium
on fresh water from the sea, V. 3: 437-451 (1973).15. O’Neil J.R., Clayton R.N. and Mayeda T.K. Oxygen
isotopes fractionation in divalent metal carbonates. J.
Chem. Phys., 51: 5547-5558 (1969).16. Ohmoto H. and Rye R.O. Isotopes of sulfur and carbon.
In: Barnes H.L. (Ed.) Geochemistry of Hydrothermal Ore
Deposits, Wiley, New York, pp. 509-567 (1979).
17. Taylor H.P. Oxygen and hydrogen isotopic studies of plutonic granitic rocks. Earth Planet. Sci. Lett., 38: 177-
210 (1978).18. Hassan Nejad A.A. and Moor F. The source of Qaleh Zari
copper deposits with respect to new isotopic and fluidinclusion data. Proceeding of the 6th symposium of
Geological Society of Iran, Kerman, Iran, 114-117(2002).
19. Cathelineau M. and Nieva D. A chlorite solid solutiongeothermometer, the Los Azufres (Mexico) geothermal
system. Contrib. Mineral Petrol, 19: 235-244 (1985).20. Walshe J.L. and Solomon M. An investigation into the
environment of formation of the volcanic-hosted Mt.
Lyell copper deposits, using geology, mineralogy, stableisotopes and a six component chlorite solid-solution
model. Econ. Geol., 76: 246-238 (1981).21. Walshe J.L. A six-component solid solution model and
the conditions of chlorite formation in hydrothermal and
geothermal systems. Econ. Geol., 81: 681-703 (1986).22. Davies J. and Egerton P. The application of
lithogeochemistry to gold exploration in the Casa Berardiarea, northwestern Quebec. Doctoral Queen's University,Kingston, ON, Canada, p. 399 (1994).
23. Hammond N.Q. and Tabata H. Characteristics of oreminerals associated with gold at the Prestea mine. Ghana.
Mineralogical Magazine, 61(6): 879-894 (1997).24. Huston D.L., Sie S.H., Suter G.F., Cooke D.R., Both
R.A., and Walshe J.L. Trace elements in sulfide mineralsfrom Eastern Australian volcanic hosted massive sulfide
deposits. Part I. Proton Microprobe Analyses of Pyrite,chalcopyrite and Sphalerite. Part II. Selenium levels in
Pyrite: comparison with D34S values and implications tothe source of sulfur in volcanogenic hydrothermal
systems. Econ. Geol., 90: 1167-1196 (1995).25. Huston D.L., Sie S.H., Suter G.F. and Ryan C.G. The
composition of pyrite in volcanogenic massive sulfidedeposits as determined with the proton microprobe.
Nuclear Instruments and Methods in Physics Research,
B75: 531-533 (1993).
26. Simon G., Huang H., Penner-Hahn J., Kesler S.E., andKao L.-S. Oxidation state of gold and arsenic in gold- bearing arsenian pyrite. Am. Mineralogist , 84: 1071-1079(1999).
27. Simon G., Kesler S.E., and Chryssoulis S. Geochemistryand textures of gold-bearing arsenian pyrite, Twin
Creeks, Nevada: Implications for deposition of gold inCarlin-type deposits: The Bulletin of the Society of
Economic Geologists, 94(3): 405-421 (1999). 28. Huston D.L., Sie S.H., and Suter G.F. Selenium and its
importance to the study of ore genesis: the theoretical basis and its application to volcanic-hosted massive
sulfide deposits using pixeprobe analysis. Nuclear
Instruments and Methods in Physics Research, B104:476-480 (1995).
29. Simon G., Kesler S.E., Essene E.J., and Chryssoulis S.L.Gold in porphyry copper deposits: Experimental
determination of the distribution of gold in the Cu-Fe-S
system at 400°C to 700°C. Econ. Geol., 95(2): 259-270
(2000).30. Ohmoto H. Systematics of sulfur and carbon isotopes in
hydrothermal ore deposits. Ibid., 67: 551-578 (1972).

8/2/2019 S-C-O Isotopes, Fluid Inclusion Microthermometry, and the Genesis of Ore Bearing Fluids at Qaleh-Zari Fe-Oxide Cu-…
http://slidepdf.com/reader/full/s-c-o-isotopes-fluid-inclusion-microthermometry-and-the-genesis-of-ore-bearing 15/16
J. Sci. I. R. Iran Karimpour et al. Vol. 16 No. 2 Spring 2005
167
Appendiex 1. Major and trace element content of volcanic rocks from Qaleh-Zari area [7]
Oxides % 1 2 3 4 5
SiO2 60.57 56.90 57.16 55.30 52.17
Al2O3 18.31 16.77 16.55 16.32 17.87Fe2O3 3.38 5.34 5.34 5.41 3.37
FeO 1.52 2 2.13 2.13 4.93
MnO 0.18 0.24 0.13 0.16 0.15
MgO 0.80 3.43 3.48 2.73 4.35
CaO 3.85 6.69 5.97 7.29 8.30
Na2O 2.81 2.08 2.53 2.36 2.03
K 2O 5.27 2.41 2.17 2.29 0.73
TiO2 0.82 0.8 0.74 0.72 0.87
P2O5 0.19 0.15 0.19 0.19 0.21
H2O+ 1.88 2.68 2.03 1.64 3.09
H2O 0.27 0.14 0.21 0.35 0.25
CO2 0.46 0.66 1.41 2.64 2.34
Trace (ppm)
Cu 15 150 44 72 73
Pb 281 121 22 21 15
Zn 282 89 60 63 79
Rb 217 83 24 67 9
Sr 357 302 302 320 334
Ba 770 468 402 424 472
Ce 88 42 9 — 31
Appendix 2. Temperatures of homogenization and salinities of primary fluid inclusions from Stage I of mineralization (fluid
inclusions in quartz are measured)
Vein Depth Sample No. Th°C* Range Th°C Mean T ice melting Salinities** Range Salinities Mean
1 70 R-30 310-376 343 — n.m —
1 70 L-300 275-303 287 — n.m —
1 100 R-30 296-380 355 −1.45 to −2.1 2.5-3.4 3
1 135 R-100 300-335 315 −2.4 to −3.3 3.9-5.5 4.2
1 135 R-130 301-311 304 −1.8 to −3.4 3-5 3.6
1 170 R-30 312-343 318 −1.1 to −1.3 1.8-2.2 2
1 170 R-100 311-328 318 −3.2 to −3.5 5.3-5.5 5.4
2 70 R-30 280-357 350 — n.m —
2 100 L-100 314-338 322 −2.3 to −3.4 3.8-5.5 4.6
2 170 L-50 301-347 310 — n.m —
2 170 R-250 290-380 342 −2.3 to −2.4 3.8-4 3.9
3 70 L-50 270-287 284 — n.m —
3 100 L-50 298-324 309 — n.m —
3 100 L-100 270-316 298 — n.m —
3 100 R-50 296-344 314 −3.2 to −3.6 5.2-5.8 5.4
3 135 L-50 302-325 307 — n.m —
3 135 L-100 299-302 300 — n.m —
*Th = temperature of homogenization, **Salinities in wt % NaCl equiv, n.m.= not measured. Sample location (meter) from shaft
No.1 (R) to the right and (L) to the left.
8/2/2019 S-C-O Isotopes, Fluid Inclusion Microthermometry, and the Genesis of Ore Bearing Fluids at Qaleh-Zari Fe-Oxide Cu-…
http://slidepdf.com/reader/full/s-c-o-isotopes-fluid-inclusion-microthermometry-and-the-genesis-of-ore-bearing 16/16
Vol. 16 No. 2 Spring 2005 Karimpour et al. J. Sci. I. R. Iran
168
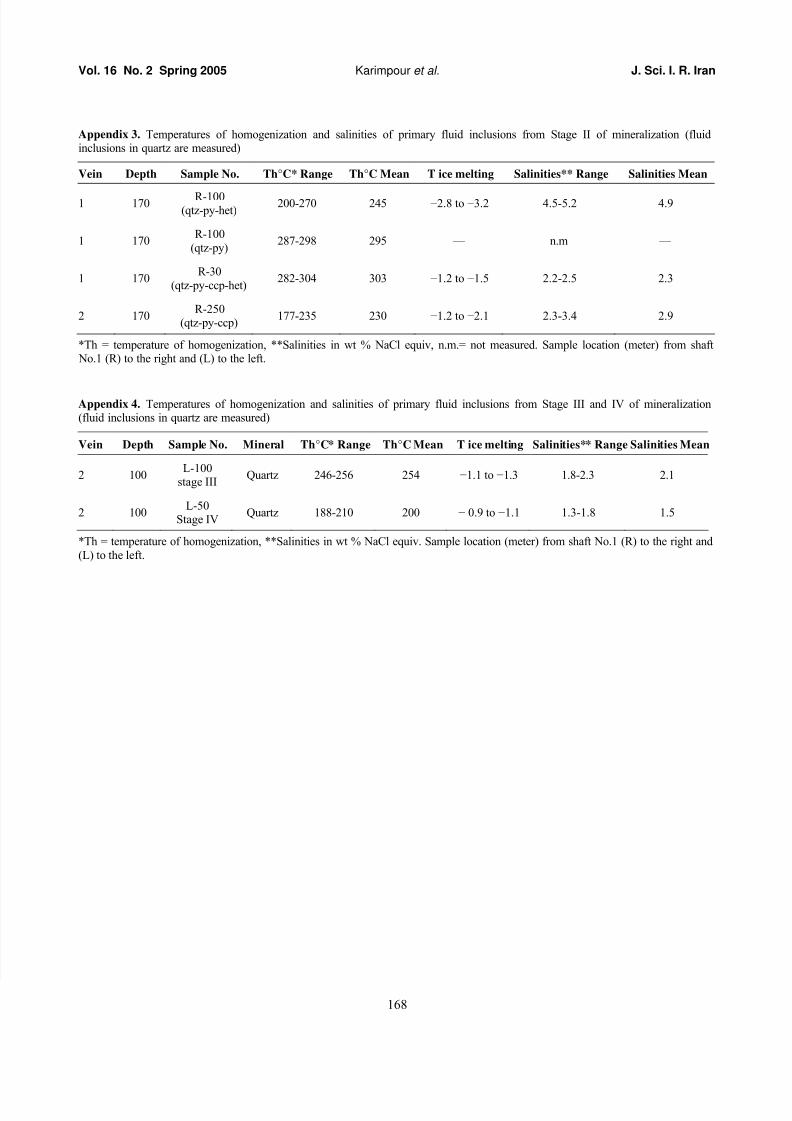
Appendix 3. Temperatures of homogenization and salinities of primary fluid inclusions from Stage II of mineralization (fluidinclusions in quartz are measured)
Vein Depth Sample No. Th°C* Range Th°C Mean T ice melting Salinities** Range Salinities Mean
1 170 R-100(qtz-py-het)
200-270 245 −2.8 to −3.2 4.5-5.2 4.9
1 170R-100
(qtz-py)287-298 295 — n.m —
1 170R-30
(qtz-py-ccp-het)282-304 303 −1.2 to −1.5 2.2-2.5 2.3
2 170R-250
(qtz-py-ccp)177-235 230 −1.2 to −2.1 2.3-3.4 2.9
*Th = temperature of homogenization, **Salinities in wt % NaCl equiv, n.m.= not measured. Sample location (meter) from shaft No.1 (R) to the right and (L) to the left.
Appendix 4. Temperatures of homogenization and salinities of primary fluid inclusions from Stage III and IV of mineralization(fluid inclusions in quartz are measured)
Vein Depth Sample No. Mineral Th°C* Range Th°C Mean T ice melting Salinities** Range Salinities Mean
2 100L-100
stage IIIQuartz 246-256 254 −1.1 to −1.3 1.8-2.3 2.1
2 100L-50
Stage IVQuartz 188-210 200 − 0.9 to −1.1 1.3-1.8 1.5
*Th = temperature of homogenization, **Salinities in wt % NaCl equiv. Sample location (meter) from shaft No.1 (R) to the right and
(L) to the left.