S A P P S A P P - Southern African Power Pool Annual Report 2005.pdf · REPORT OF THE INDEPENDENT...
21
1 Southern African Power Pool 2005 Annual Report SAPP VISION AND OBJECTIVES .................................................................................................................................................................................................................... 2 ORGANOGRAM AND MEMBERS .................................................................................................................................................................................................. 3 ABOUT SAPP ................................................................................................................................................................................................................................................ 4 HIGHLIGHTS OF THE SAPP ACTIVITIES ............................................................................................................................................................................ 5 - 6 SAPP EXECUTIVE COMMITTEE ...................................................................................................................................................................................................... 7 EXECUTIVE COMMITTEE CHAIRMAN’S REPORT .................................................................................................................................................... 8 - 9 REPORT OF THE MANAGEMENT COMMITTEE .................................................................................................................................................... 10 - 12 OPERATING SUB-COMMITTEE REPORT .................................................................................................................................................................... 13 - 17 PLANNING SUB-COMMITTEE REPORT ...................................................................................................................................................................... 18 - 20 ENVIRONMENTAL SUB-COMMITTEE REPORT ...................................................................................................................................................... 21 - 22 SAPP CO-ORDINATION CENTRE REPORT ............................................................................................................................................................ 23 - 26 STATISTICS ........................................................................................................................................................................................................................................ 26 - 31 REPORT OF THE INDEPENDENT AUDITORS .................................................................................................................................................................... 32 STATEMENT OF ACCOUNTING POLICIES .......................................................................................................................................................................... 33 INCOME STATEMENT .......................................................................................................................................................................................................................... 34 BALANCE SHEET .................................................................................................................................................................................................................................... 35 CASH FLOW STATEMENT ................................................................................................................................................................................................................ 36 NOTES TO THE FINANCIAL STATEMENTS ................................................................................................................................................................ 37 - 39 CONTENTS
Transcript of S A P P S A P P - Southern African Power Pool Annual Report 2005.pdf · REPORT OF THE INDEPENDENT...

1S o u t h e r n A f r i c a n P o w e r P o o l 2 0 0 5 A n n u a l R e p o r t
SSAAPPPPVISION AND OBJECTIVES .................................................................................................................................................................................................................... 2
ORGANOGRAM AND MEMBERS .................................................................................................................................................................................................. 3
ABOUT SAPP ................................................................................................................................................................................................................................................ 4
HIGHLIGHTS OF THE SAPP ACTIVITIES ............................................................................................................................................................................ 5 - 6
SAPP EXECUTIVE COMMITTEE ...................................................................................................................................................................................................... 7
EXECUTIVE COMMITTEE CHAIRMAN’S REPORT .................................................................................................................................................... 8 - 9
REPORT OF THE MANAGEMENT COMMITTEE .................................................................................................................................................... 10 - 12
OPERATING SUB-COMMITTEE REPORT .................................................................................................................................................................... 13 - 17
PLANNING SUB-COMMITTEE REPORT ...................................................................................................................................................................... 18 - 20
ENVIRONMENTAL SUB-COMMITTEE REPORT ...................................................................................................................................................... 21 - 22
SAPP CO-ORDINATION CENTRE REPORT ............................................................................................................................................................ 23 - 26
STATISTICS ........................................................................................................................................................................................................................................ 26 - 31
REPORT OF THE INDEPENDENT AUDITORS .................................................................................................................................................................... 32
STATEMENT OF ACCOUNTING POLICIES .......................................................................................................................................................................... 33
INCOME STATEMENT .......................................................................................................................................................................................................................... 34
BALANCE SHEET .................................................................................................................................................................................................................................... 35
CASH FLOW STATEMENT ................................................................................................................................................................................................................ 36
NOTES TO THE FINANCIAL STATEMENTS ................................................................................................................................................................ 37 - 39
CONTENTS

2 S o u t h e r n A f r i c a n P o w e r P o o l 2 0 0 5 A n n u a l R e p o r t 3S o u t h e r n A f r i c a n P o w e r P o o l 2 0 0 5 A n n u a l R e p o r t
SSAAPPPPSSAAPPPP
SAPP Membership
Full Name of Utility Status Abbreviation Country
Botswana Power Corporation OP BPC Botswana
Electricidade de Mocambique OP EDM Mozambique
Electricity Supply Corporation of Malawi NP ESCOM Malawi
Empresa Nacional de Electricidade NP ENE Angola
ESKOM OP Eskom South Africa
Lesotho Electricity Corporation OP LEC Lesotho
NAMPOWER OP NamPower Namibia
Societe Nationale d’Electricite OP SNEL Democratic Republic of Congo
Swaziland Electricity Board OP SEB Swaziland
Tanzania Electricity Supply Company Ltd NP TANESCO Tanzania
ZESCO Limited OP ZESCO Zambia
Zimbabwe Electricity Supply Authority OP ZESA Zimbabwe
OP = Operating Member NP = Non-Operating Member
VISION AND OBJECTIVES ORGANOGRAM AND MEMBERS
SADC Directorate ofInfrastructure and Services
Executive Committee
Management Committee
Planning Operating EnvironmentalSub-committee Sub-committee Sub-committee
Co-ordination Centre
Vision
The Southern African Power Pool will:
• Facilitate the development of a competitive electricity market in the SADC region.
• Give the end user a choice of electricity supplier.
• Ensure that the southern African region is the region of choice for investment by energy intensive users.
• Ensure sustainable energy developments through sound economic, environmental and social practices.
Objectives
The Southern African Power Pool aims to:
• Provide a forum for the development of a world class, robust, safe, efficient, reliable and stable interconnected electrical
system in the southern African region.
• Co-ordinate and enforce common regional standards of Quality of Supply; measurement and monitoring of systems
performance.
• Harmonise relationships between member utilities.
• Facilitate the development of regional expertise through training programmes and research.
• Increase power accessibility in rural communities.
• Implement strategies in support of sustainable development priorities.
5
SSAAPPPPHIGHLIGHTS OF THE SAPP ACTIVITIES
In the year under review, the SAPP worked on the followingkey areas, solution and way forward for the region’sdiminishing generation surplus capacity, SAPP restructuringand documentation review, energy trading and marketdevelopment, congestion management and operationaldiscipline, and capacity building.
1. Diminishing generation surplus capacityThe year saw a much greater interaction between theSAPP Executive Committee and the HonourableMinisters responsible for energy in the Southern AfricanDevelopment Community (SADC) on the solution andway forward to the diminishing generation surpluscapacity in the SADC region. From the demand sidemanagement, the SAPP has estimated that the currentgeneration reserve surplus capacity will run out after2007 if SAPP members undertake no new investment ingeneration.This situation is not desirable for SAPP, as it willhave a negative impact on the SADC economies, and willcreate power shortages that will hinder the progress inrural electrification in member states, and scare awayInvestors from coming to invest in the SADC region.
Much of the rise in the power demand in the region hasbeen partially caused by Increase in the population ofmost SADC member states, economic expansion inmember states requiring more power to supply the newindustries, non-economic tariffs in some cases that donot support re-investment in power generation, butallow for large energy intensive users to come into theSADC region and set up their operations, and nosignificant capital injection into generation projects fromeither the private or the public sector. A way ofmarketing and attracting investments into generation andtransmission projects as well as the creation of a suitableenvironment for investment in member countries byaddressing regulation and implementation of costreflective tariffs is therefore necessary for the region.
The SAPP held two meetings with the HonourableMinisters responsible for energy in the SADC.The firstmeeting was held in July 2004 in Windhoek, Namibia,and this was followed up with a second meeting inOctober 2004 held in Johannesburg, South Africa. Atboth meetings, the Ministers reaffirmed theircommitment to ensure that there is no deficiency ingeneration surplus capacity in the SADC region. TheMinisters committed their governments to worktogether with the SAPP in addressing the diminishing
generation surplus capacity in SADC. Whilst theysupport the principles of affordable and competitiveenergy prices, the Ministers agreed to commit toembrace the principle of cost reflective tariffs and toadopt regulatory principles in their respective countriesthat will enhance those tariffs. The Ministerscommended the progress made by SAPP in theimplementation of the identified short-term and long-term generation and transmission projects. Most of theshort-term generation projects in the region were oncourse and expected to be completed andcommissioned as planned.The SAPP took the necessarysteps to secure funding for the short-term projects.
On the way forward, the Ministers mandated the SAPPto convene a regional electricity investment conferencethat will raise funding for the short and long-termgeneration and transmission projects.The conference isexpected to involve a wide range of stakeholdersincluding governments, private sector, and cooperatingpartners. The venue for the conference was chosen asWindhoek, Namibia, and the agreed date wasSeptember 2005 in consultation with otherstakeholders.
2. SAPP Restructuring and Documentation ReviewThe tasks of restructuring the SAPP and the revision ofthe associated documentation were given to the SAPPManagement Committee. During the year, theManagement Committee came up with arecommendation that has now been approved andaccepted by the SAPP Executive Committee forimplementation after the Honourable Ministersresponsible for energy in SADC have signed the revisedInter-Governmental MOU.
In the proposed structure, the Coordination Centre willreport to the Coordination Centre Board composed ofsenior representatives from member utilities. TheCoordination Centre Board will in turn report to theManagement Committee who will report to theExecutive Committee as before. The three sub-committees, Planning, Operating and Environmentalremains and will continue to report to the ManagementCommittee. A new sub-committee, called the MarketsSub-Committee, has been proposed. The duties of theMarkets Sub-Committee will include the continueddevelopment and improvement of the short-termenergy market (STEM) and market rule changes, the
4 S o u t h e r n A f r i c a n P o w e r P o o l 2 0 0 5 A n n u a l R e p o r t S o u t h e r n A f r i c a n P o w e r P o o l 2 0 0 5 A n n u a l R e p o r t
SSAAPPPP• SAPP was created in August 1995 at the SADC summit
held in Kempton Park, South Africa, when membergovernments of SADC (excluding Mauritius) signed anInter-Governmental Memorandum of Understanding forthe formation of an electricity power pool in the regionunder the name of the Southern African Power Pool.
• SAPP is governed by four agreements: the Inter-Governmental Memorandum of Understanding whichenabled the establishment of SAPP; the Inter-UtilityMemorandum of Understanding, which establishedSAPP’s basic management and operating principles; theAgreement Between Operating Members whichestablished the specific rules of operation and pricing;and the Operating Guidelines, which provide standardsand operating guidelines.
• SAPP has twelve member countries represented bytheir respective electric power utilities organisedthrough SADC.
• SAPP has three working committees: the OperatingSub-Committee, the Planning Sub-Committee and theEnvironmental Sub-Committee under a Management
Committee which in turn reports to the ExecutiveCommittee.
• SAPP coordinate the planning and operation of theelectric power system among member utilities.
• SAPP provide a forum for regional solutions to electricenergy problems.
• SAPP has established and is operating the Short-TermEnergy Market.
ABOUT SAPP
6 S o u t h e r n A f r i c a n P o w e r P o o l 2 0 0 5 A n n u a l R e p o r t 7S o u t h e r n A f r i c a n P o w e r P o o l 2 0 0 5 A n n u a l R e p o r t
SSAAPPPPSSAAPPPPAPRIL 2004 TO MARCH 2005
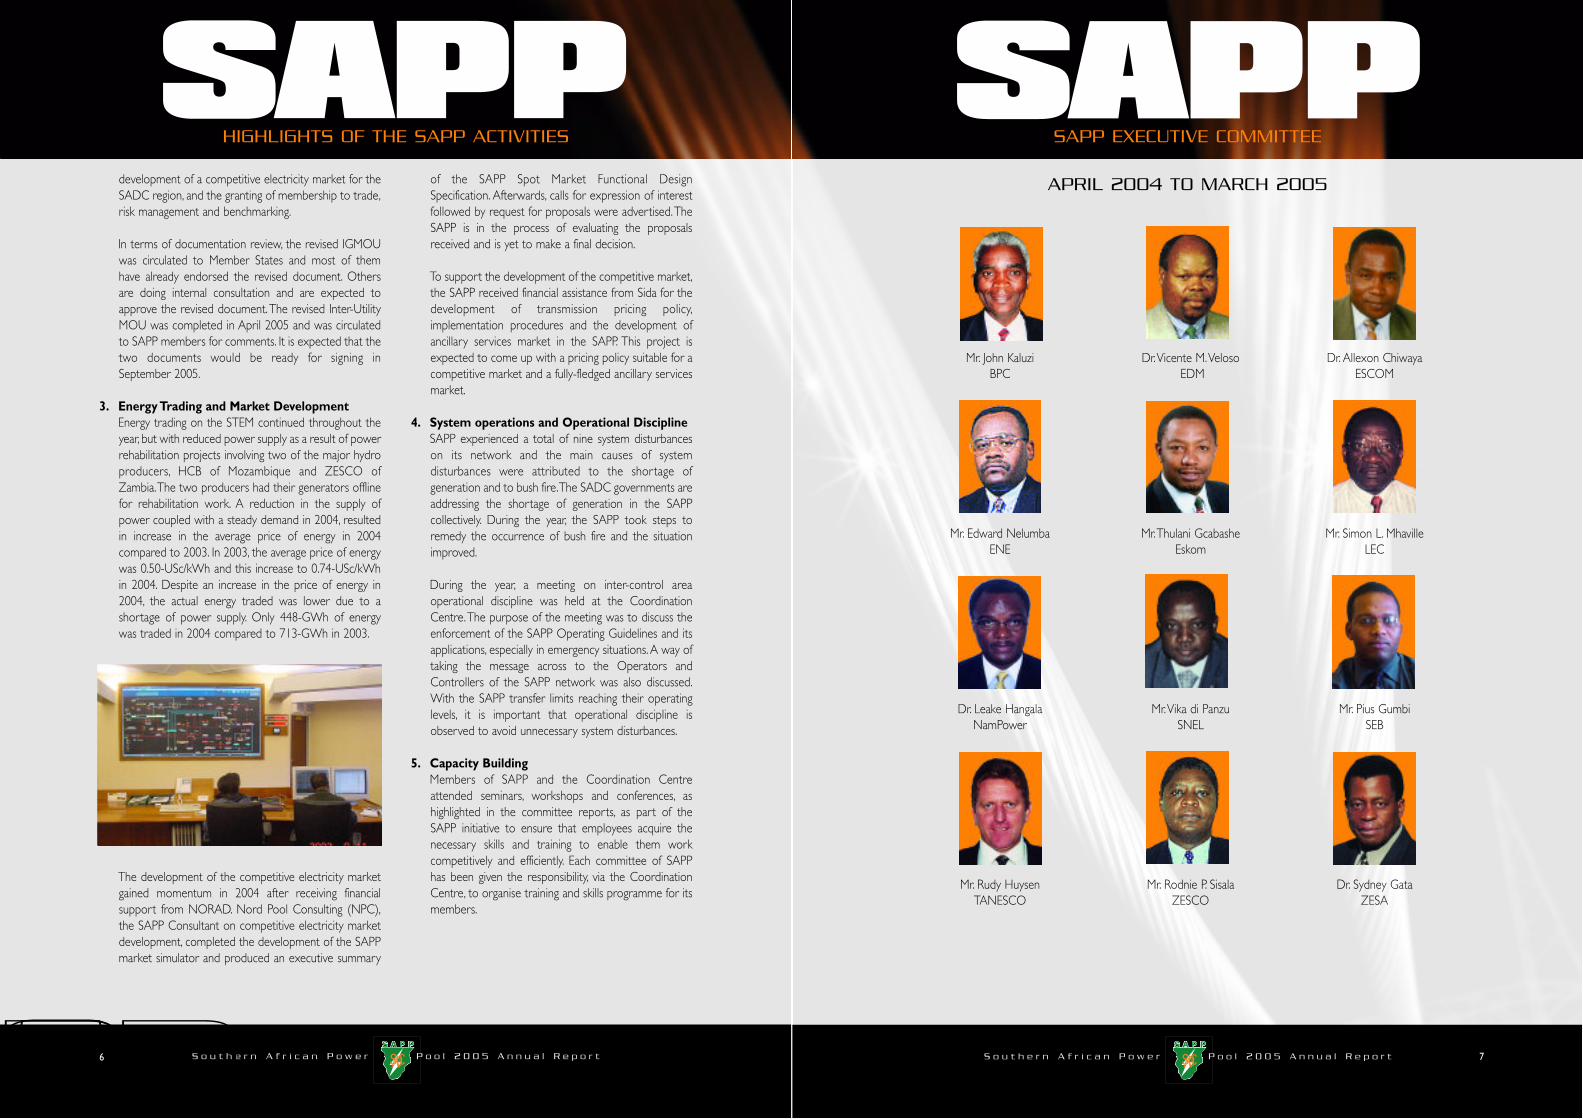
Mr. John Kaluzi Dr.Vicente M.Veloso Dr. Allexon ChiwayaBPC EDM ESCOM
Mr. Edward Nelumba Mr.Thulani Gcabashe Mr. Simon L. MhavilleENE Eskom LEC
Dr. Leake Hangala Mr.Vika di Panzu Mr. Pius GumbiNamPower SNEL SEB
Mr. Rudy Huysen Mr. Rodnie P. Sisala Dr. Sydney GataTANESCO ZESCO ZESA
SAPP EXECUTIVE COMMITTEE
development of a competitive electricity market for theSADC region, and the granting of membership to trade,risk management and benchmarking.
In terms of documentation review, the revised IGMOUwas circulated to Member States and most of themhave already endorsed the revised document. Othersare doing internal consultation and are expected toapprove the revised document.The revised Inter-UtilityMOU was completed in April 2005 and was circulatedto SAPP members for comments. It is expected that thetwo documents would be ready for signing inSeptember 2005.
3. Energy Trading and Market DevelopmentEnergy trading on the STEM continued throughout theyear, but with reduced power supply as a result of powerrehabilitation projects involving two of the major hydroproducers, HCB of Mozambique and ZESCO ofZambia.The two producers had their generators offlinefor rehabilitation work. A reduction in the supply ofpower coupled with a steady demand in 2004, resultedin increase in the average price of energy in 2004compared to 2003. In 2003, the average price of energywas 0.50-USc/kWh and this increase to 0.74-USc/kWhin 2004. Despite an increase in the price of energy in2004, the actual energy traded was lower due to ashortage of power supply. Only 448-GWh of energywas traded in 2004 compared to 713-GWh in 2003.
The development of the competitive electricity marketgained momentum in 2004 after receiving financialsupport from NORAD. Nord Pool Consulting (NPC),the SAPP Consultant on competitive electricity marketdevelopment, completed the development of the SAPPmarket simulator and produced an executive summary
of the SAPP Spot Market Functional DesignSpecification. Afterwards, calls for expression of interestfollowed by request for proposals were advertised.TheSAPP is in the process of evaluating the proposalsreceived and is yet to make a final decision.
To support the development of the competitive market,the SAPP received financial assistance from Sida for thedevelopment of transmission pricing policy,implementation procedures and the development ofancillary services market in the SAPP. This project isexpected to come up with a pricing policy suitable for acompetitive market and a fully-fledged ancillary servicesmarket.
4. System operations and Operational DisciplineSAPP experienced a total of nine system disturbanceson its network and the main causes of systemdisturbances were attributed to the shortage ofgeneration and to bush fire.The SADC governments areaddressing the shortage of generation in the SAPPcollectively. During the year, the SAPP took steps toremedy the occurrence of bush fire and the situationimproved.
During the year, a meeting on inter-control areaoperational discipline was held at the CoordinationCentre.The purpose of the meeting was to discuss theenforcement of the SAPP Operating Guidelines and itsapplications, especially in emergency situations. A way oftaking the message across to the Operators andControllers of the SAPP network was also discussed.With the SAPP transfer limits reaching their operatinglevels, it is important that operational discipline isobserved to avoid unnecessary system disturbances.
5. Capacity BuildingMembers of SAPP and the Coordination Centreattended seminars, workshops and conferences, ashighlighted in the committee reports, as part of theSAPP initiative to ensure that employees acquire thenecessary skills and training to enable them workcompetitively and efficiently. Each committee of SAPPhas been given the responsibility, via the CoordinationCentre, to organise training and skills programme for itsmembers.
HIGHLIGHTS OF THE SAPP ACTIVITIES

8 S o u t h e r n A f r i c a n P o w e r P o o l 2 0 0 5 A n n u a l R e p o r t 9S o u t h e r n A f r i c a n P o w e r P o o l 2 0 0 5 A n n u a l R e p o r t
SSAAPPPPSSAAPPPPThe purpose of revising the Inter-Governmental MOU is toreflect the new structure of the SADC, improve corporategovernance of the SAPP and allow the participation of otherplayers in SAPP such as Independent Power Producers andthe private sector.
Executive Committee Delegates at a meeting in Lesotho in April 2005.
Other Activities
SAPP Power Market ProjectThe development of the SAPP competitive electricity marketprogressed well during 2004. The simulation of the SAPPregional market and the development of the functional anddetailed design specifications of the SAPP trading platformwere both completed during 2004.What is now remaining isthe procurement of hardware and software for the tradingplatform and implementation of the project.
SAPP Pool Plan and Strategic PlanThe SAPP has agreed to revise the SAPP Pool Plan of 2001and to develop a SAPP Strategic Plan. The Pool Plan willprovide a detailed regional perspective by addressing theoptimisation of regional resources and identification of leastcost generation and transmission projects worth promotingfor the benefit of the SADC region. The Strategic Plan willgive an overview of country priority projects.
Short-Term Energy Market (STEM)STEM is a firm energy market and was started in April 2001.In April 2005, STEM clocked four years of operation. Arecord sale of 55-GWh at a cost of USD778,000 wasachieved in March 2005.This is the highest recoded monthlysale since the start of the STEM in April 2001.
AcknowledgementsThe Executive Committee would like to take thisopportunity to thank the donor community and particularlyNORAD and Sida for their assistance and support to theSAPP activities.
The Norwegian Embassy in Harare is the officialrepresentative of NORAD and is funding the developmentof the SAPP competitive electricity market. Sida issupporting the development of transmission pricing policy,implementation procedures and ancillary services marketdevelopment.
Finally, I would like to thank members of the SAPP ExecutiveCommittee for their support whilst I was Chairperson ofthe Executive Committee from April 2003 to April 2005.
In April 2005, the SAPP Executive Committee unanimouslyelected Dr. Vicente Veloso, Chief Executive of Electricidadede Mocambique (EdM) of Mozambique, Chairperson of theSAPP Executive Committee. Mr. Simon Mhaville of LesothoElectricity Corporation (LEC) was elected Vice Chairman.May I take this opportunity to congratulate the two and towish them well in the running of the SAPP affairs in thecoming year.
Newly elected SAPP Executive Committee Chairperson, Dr VicenteVeloso, of Mozambique.
The SAPP was given a mandate to host a regional electricityinvestment conference in Namibia in September 2005, and Ilook forward to a successful conference aimed at attractinginvestors into generation and transmission projects of theSADC region.
Dr. Leake HangalaChairperson, SAPP Executive Committee
EXECUTIVE COMMITTEE CHAIRMAN’S REPORT - CONT.
Dr. Leake HangalaExecutive Committee Chairman 2004/5
The Southern African Power Pool (SAPP) faced a lot ofchallenges in the year under review, but also made greatadvancements in finding the solutions to the challenges facingthe region.The major challenges that were faced included:
Diminishing generation surplus capacityThe SAPP is faced with the challenge of diminishinggeneration surplus capacity, coupled with new congestionpoints appearing within utilities as the transmission transferlimits are being reached.
In the last ten years, the power demand in the SADC regionhas been increasing at a rate of about three percent peryear. Unfortunately, there has not been a correspondingincrement of investment in power generation during thesame period. As a result, the generation surplus capacity hasbeen diminishing steadily. The continued diminishinggeneration surplus capacity would have a negative impact onthe economies of the region and potential investors wouldbe frightened.The diminishing generation surplus capacity islargely due to the rise in the power demand in the SADCregion partially caused by:
• The increase in the population of most SADC memberstates,
• Economic expansion in most member states requiring more power to supply the new industries,
• Non-economic tariffs in some cases that do not supportre-investment in power generation, but allow for largeenergy intensive users to come into the SADC regionand set up operations, and
• No significant capital injection into generation projectsfrom either the private or the public sector. Massive investment in both generation and transmissioninfrastructure would be required to sustain theprojected increase in the power demand in theSADC region.
The Ministers responsible for energy in the SADC regionmet in July 2004 in Namibia and then again in October 2004in South Africa at the request of the SAPP to discuss,develop and propose a regional solution and approach tothe problem. The Ministers mandated the SAPP to host aregional electricity investment conference with the solepurpose of attracting investments in both generation andtransmission.The SAPP Executive Committee has agreed tohost the conference in Namibia in September 2005 underthe theme:
“Emerging Investment Opportunities for sustainabledevelopment in the southern African power sector”.
Following the political support from the Ministersresponsible for energy in the SADC region, the members ofSAPP identified short-term and long-term generationpriority projects in their countries and reaffirmed theircommitment to the implementation of the projects. It wasagreed that SADC should come up with ways of marketingand attracting investments into generation and transmissioninfrastructure. Whilst the principles of affordable andcompetitive energy prices were to be recognised, there wasneed for SADC to embrace the principle of cost reflectivetariffs and adopt regulatory principles in their respectivecountries that will enhance those tariffs.
Members of the SAPP responded well to the challenge ofdiminishing generation surplus capacity by acceleratingshort-term generation projects. In Angola, 260MW ofhydropower was commissioned during the last quarter of2004, in Tanzania 80MW was commissioned at Ubongoduring 2004 and in South Africa; Eskom made 190MW fromCamden available towards the end of May 2005.
SAPP restructuringThe challenge of restructuring the SAPP continued during2004.The SAPP completed the revision of the SAPP Inter-Governmental MOU and circulated the document toMember States for review and comments. Some MemberStates have indicated acceptance of the revised documentand others are still undertaking internal consultation. At aMinisterial meeting of the Ministers responsible for energy inthe SADC region held in October 2004 in South Africa, theMinisters urged the remaining members to expedite theprocess of internal consultation so that the document couldbe signed before August 2005.
EXECUTIVE COMMITTEE CHAIRMAN’S REPORT

10 S o u t h e r n A f r i c a n P o w e r P o o l 2 0 0 5 A n n u a l R e p o r t 11S o u t h e r n A f r i c a n P o w e r P o o l 2 0 0 5 A n n u a l R e p o r t
SSAAPPPPSSAAPPPPdocument signed. The English version of the document will
be the main document’s working language. The SADC
Secretariat will translate the document into Portuguese and
French versions.
The revised IUMOU was completed in April 2005 and was
circulated to SAPP members for comments. It is expected
that the two documents would be ready for signing in
September 2005.
Interaction with Cooperating PartnersAt a biannual meeting of the SAPP Management Committee
held in Swaziland on 3 September 2004, the Management
Committee agreed to send two representatives to the USA
to make a presentation on the SAPP activities and to seek for
continued financial support from USAID.The Committee also
agreed to take the opportunity of the visit to the USA and to
have additional meetings with the World Bank and USEA.
The two SAPP representatives selected for the purpose
were Mr. A de Sousa Fernando, the Management
Committee Chairperson, and Dr. Lawrence Musaba, the
SAPP Coordination Centre Manager.
The two Management Committee representatives held a
meeting with USAID on 5 October 2004 in Washington
DC.At this meeting, SAPP presented the current and future
activities. The aim was to solicit for extended financial
support from USAID up to December 2007, when SAPP
would be expected to be self-sufficient. Senior officials from
USAID, the World Bank, USEA, Nexant, CORE and others
attended the meeting.The meeting was organized by USAID
at the request of SAPP.At the end of the presentation, SAPP
had a closed meeting with USAID at which the way forward
was reached and agreed by the two parties.
The SAPP held a separate meeting with the World Bank on
6 October 2004. The meeting discussed the SAPP Power
Market Project, which is a projected supported by the
World Bank, SAPP activities, SAPP interconnectors and the
Western Power Corridor project.
The World Bank pledged continued financial support to the
SAPP priority interconnectors.
The SAPP also had a meeting with USEA on 6 October
2004. At this meeting, SAPP thanked USEA for the
cooperation that USEA gave to SAPP in the execution of
the SAPP-USEA Technical Cooperation Programme that
came to an end in June 2004. USEA informed SAPP that a
new programme with EDM of Mozambique was going to
start once the terms of reference were drawn up,
completed and submitted by EDM.
REPORT OF THE MANAGEMENT COMMITTEE - CONT.
Mr. Augusto de Sousa Fernando
Management Committee Chairperson (2004/5)
In the year under review, the SAPP Management Committee
had three responsibilities; formulation of a new management
structure for the SAPP, review of the SAPP management and
governance documents, and interaction with the SAPP
Cooperating Partners.
Proposed SAPP Management Structure The SAPP Management Committee unveiled a new
management structure for SAPP to the Executive
Committee at an Executive Committee meeting held in
Malawi in November 2004.
In the proposed structure, the Coordination Centre will
report to the Coordination Centre Board composed of
senior representatives from member utilities. The
Coordination Centre Board will in turn report to the
Management Committee. The Coordination Centre Board
will be responsible for the affairs of the Coordination Centre
and will recommend the approval of the Coordination
Centre budget to the Management Committee.
A new sub-committee, called the Markets Sub-Committee,
has been proposed. The duties of the Markets Sub-
Committee will include the continued development and
improvement of the short-term energy market (STEM) and
market rule changes, the development of a competitive
electricity market for the SADC region, and the granting of
membership to trade, risk management and benchmarking.
The other three sub committees, Planning, Operating and
Environmental remains as before.The three will continue to
report to the Management Committee that will in turn
report to the Executive committee.
Documentation ReviewThe Inter-Governmental MOU (IGMOU) was signed in
August 1995 and lead to the creation of the SAPP. At the
time of creation, national power utilities residing within the
SADC region were the only utilities allowed to join the
SAPP. Non-national power utilities within the SADC region
and national power utilities outside of the SADC were not
allowed to join.
The governance and membership of the SAPP was derived
from the desire for economic co-operation, equitable sharing
of resources and support of one another in times of crisis
under the SADC protocol.The environment under which the
power pool now operates has significantly changed warranting
a review of the SAPP governance and membership criteria.
The revision of the IGMOU and the Inter-Utility MOU
(IUMOU) are expected to address the reforms that have
taken place in the SADC organisational structure, the organ to
which SAPP reports, power sector reforms and restructuring
in member countries and the recognition and admission of
new members into the SAPP such as independent power
producers residing in the SADC region.
The revised IGMOU was circulated to Member States
Utilities and they have endorsed the revised document.
Subsequently the document was sent to the SADC
Secretariat for the SADC Secretariat Legal Counsel to
review the revised document and ensure that it is in
compliance with the SADC protocols and thereafter the
document will be sent to Member States for comments. The
SADC Secretariat completed the review and sent the
document to Member States in April 2005 with a deadline
for submission of comments by the end of May 2005. If the
comments from Member States were found to be
substantial, then the SADC Secretariat would call a meeting
to consider the proposed changes. After the document has
been agreed upon by all parties concerned, the Secretariat
will call a meeting of the Energy Ministers to have the
REPORT OF THE MANAGEMENT COMMITTEE
SADC Directorate ofInfrastructure and Services
Executive Committee
Management Committee
Planning Operating Co-ordination Environmental MarketsSub-committee Sub-committee Central Board Sub-committee Sub-committee
Co-ordinationCentre
Proposed Management structure of the SAPP

12 S o u t h e r n A f r i c a n P o w e r P o o l 2 0 0 5 A n n u a l R e p o r t 13S o u t h e r n A f r i c a n P o w e r P o o l 2 0 0 5 A n n u a l R e p o r t
SSAAPPPPSSAAPPPP
Ms Erica Johnson of Eskom, South Africa
Operating Sub-Committee Chairperson (2004/5))
1 The Short-Term Energy Market
The Short-Term Energy Market (STEM) started in April
2001 and clocked four years in April 2005. In the last
four years, seven member utilities have been
participating in the market and these include BPC, EDM,
Eskom, NamPower, SEB, ZESA and ZESCO, and one
Independent Power Producer, HCB of Mozambique.
1.1 Supply and demand
In terms of supply and demand, the supply reduced in
2004 compared to 2003 as a result of power
rehabilitation projects involving two of the major hydro
producers in the SAPP, HCB of Mozambique and
ZESCO of Zambia.The two hydro producers had their
generators offline for rehabilitation work.As a result, the
power supply on the STEM reduced as shown in Figure-
1. The power demand on the STEM remained steady
throughout 2004 and was similar to 2003.
1.2 Average Energy Prices
A reduction in the supply of power coupled with a
steady demand in 2004, resulted in increment in the
average price of energy on the STEM in 2004 compared
to 2003 as illustrated in Figure-2. In 2003, the average
energy price was 0.50-USc/kWh. In 2004, the average
price shot to 0.74-USc/kWh, and has been on the
increase since then.
1.3 Energy traded and cost
The energy traded in 2004 was lower than in 2003. In
2003, 713-GWh of energy costing USD3.6 million was
traded compared to 448-GWh costing USD3.4 million
in 2004, see Figure-3. The reduction in the amount of
energy traded in 2004 was attributed to the shortage of
supply mentioned in the previous section on supply and
demand.
Fig.1: Energy supply and demand (2001 to 2004)
Fig.2: Average Energy Prices in the STEM
1.4 STEM Automation
The SAPP Coordination Centre performed on line
STEM trading tests in November 2004. This included
online submission of offers and bids, matching,
automated result publications, and the generation of
OPERATING SUB-COMMITTEE REPORT
As part of the Norwegian aid to the NILE basin initiative, the
Norwegian Water Resources and Energy Directorate (NVE)
organized a seminar on regional power trade intended
for representatives from the NILE-region involved in the
power sector.
The seminar was held in Oslo, Norway, from January 24-29
2005. The main objective of the seminar was to illustrate
how national initiatives could be integrated into a regional
approach in order to improve efficiency for the benefit of all
involved parties.The seminar was based on the experiences
made from the development of a regional power market in
the Nordic countries and the Southern African Region.
Dr. Lawrence Musaba, the Coordination Centre Manager
and Mr. Augusto Fernando De Sousa, Management
Committee Chairperson, represented SAPP.The main topics
covered by SAPP were Overview of the Southern African
Power System, Institutional Arrangements in the SAPP,
Review of Power Trading Options under SAPP, SAPP and
Investment - experiences and opportunities, and Review of
Experiences and Lessons Learned.
Some of the delegates who attended the seminar in Norway
(Left to Right: Mr. Jean Dieudonne from DRC, Mr.A de Sousa Fernando
and Dr. L. Musaba from SAPP, and Mr. Gerald Muganga from Uganda)
AcknowledgementsI would like to thank members of the Management
Committee for electing me as Chairperson of the SAPP
Management Committee at a Management Committee
Meeting held in Mbabane, Swaziland, in September 2004.
I would also like to take this opportunity and thank the former
and outgoing SAPP Management Committee Chairperson,
Mr. Bertholdt Mbuere ua Mbuere, for the job well done during
his tenure of office. The SAPP achieved a lot under his
leadership and I will continue from where he ended.
Mr. Bertholdt Mbuere ua Mbuere
Former Management Committee Chairperson
I would also like to congratulate Mr. Peterson Zembani of
Malawi for his promotion to the post of Director of
Transmission of ESCOM Malawi effective from May 2004.
Mr. Zembani is the confirmed ESCOM representative in the
SAPP Management Committee.
Mr. Mr. Peterson Zembani
Transmission Director, ESCOM
A de Sousa Fernando
Mr. Augusto de Sousa Fernando
SAPP Management Committee Chairperson
REPORT OF THE MANAGEMENT COMMITTEE - CONT.
4500
4000
3500
3000
2500
2000
1500
1000
500
02001 2002 2003 2004
Supply Demand
Ener
gy in
GW
h
0.80
0.70
0.60
0.50
0.40
0.30
0.20
0.10
02000 2001 2002 2003 2004 2005
Ave
rage
Pric
e [U
Sc/k
Wh]

14 S o u t h e r n A f r i c a n P o w e r P o o l 2 0 0 5 A n n u a l R e p o r t 15S o u t h e r n A f r i c a n P o w e r P o o l 2 0 0 5 A n n u a l R e p o r t
SSAAPPPPSSAAPPPPthe development of the SAPP competitive electricity
market in the international press. Two companies
responded to the call, one from Africa (Enerweb) and
the other from Europe (Nord Pool).
Afterwards, RFP documents were sent to the two
companies that had responded to the SAPP advert on
expression of interest for the development of the
market. The two companies, Nord Pool and Enerweb,
then indicated to SAPP that they would submit a joint
proposal and that if the proposal is accepted, Nord Pool
would be the Lead Contractor and Enerweb would be
sub-Contractor to Nord Pool.The SAPP is yet to make
a final decision on the submitted joint proposal.
OPERATING SUB-COMMITTEE REPORT - CONT.
invoices.The system performed well and is expected to
be implemented in 2005 after the testing is completed.
The aim is to improve STEM trading and reduce human
errors and intervention in the STEM trading process.
Fig.3: Energy traded and cost of energy
2 System Operations
2.1 Changes in SAPP Grid Configuration
• Commissioning of new 330kV transmission lines and
substations in Zambia
The new Kansanshi mine, 200km west of Chingola
town in the Copperbelt province of Zambia, was
energised via a 200km 330kV transmission line from
Luano substation. The initial load at the mine is
expected to be 40MW in the first year.This is expected
to increase to 60MW in the years that follow. A new
42km 330 kV transmission line from Kafue West to
Lusaka West with a 330/132kV 125MVA transformer
and a reconfigured 132kV sub transmission network
were commissioned during 2004 by ZESCO.
• New transformers commissioned in Botswana
The national power utility in Botswana, BPC, upgraded
the transmission line between Segoditshane and
Thamaga substations from 132kV to 220kV and
commissioned two new transformers at Thamaga
substation, each rated at 125MVA 220/132kV.
Completion of the project altered the BPC system
transfer capability, as the transformers at Thamaga
formed a parallel path with the ones at Segoditshane via
the 132kV connection between Thamaga and
Gaborone South.
2.2 System Disturbances
The SAPP expressed a total of nine major system
disturbances on its network in 2004 as indicated in
Table-1. The main causes of system disturbances in
Eskom can be attributed to the shortage of generation
in Eskom. Shortage of generation is now a regional
problem that is being addressed by the SADC
governments collectively. In the ZESA control area,
system disturbances were caused by bush fire. ZESA
took steps to remedy the situation and the occurrence
of system faults as a result of bush fire were reduced. In
the ZESCO control area, the major disturbance that
occurred was attributed to fire under the transmission
lines caused by peasant farmers preparing their fields.
3 Working Group Reports
3.1 Markets Development Working Group
The development of the SAPP competitive electricity
market progressed well in 2004. Nord Pool Consulting
(NPC), the SAPP Consultant on competitive market
development, completed the development of the SAPP
market simulator. NPC also produced the executive
summary of the SAPP Spot Market Functional Design
Specification.
In December 2004, the SAPP Coordination Centre
placed an advert for call for expression of interest for
OPERATING SUB-COMMITTEE REPORT - CONT.
No Date Location Brief Description
1 15 Apr 2004 Eskom Eskom experienced a shortage of generation on the network.
2 1 June 2004 Eskom The Juno-Helios 400kV line was switched out ofservice for planned maintenance. At 08h20,Hydra-Kronos 400kV line tripped.
3 6 Jan 2004 HCB Songo Power Station lost three Bridges. Bus-coupler tripped splitting the AC and the DC busbars.
4 13 Aug 2004 ZESA The Warren-Alaska 330kV feeder no.1 tripped.The fault current was picked up by all the 330kVtransmission lines feeding into and out of AlaskaBulk Supply Points resulting in all of them tripping on distance protection.
5 9 Sept 2004 ZESA The Warren and Harare Bulk Supply Points blacked out due to delayed fault clearance on Warren-Alaska feeder.
6 23 Oct 2004 ZESA The Hwange-Insukamini 330kV feeder tripped on distance protection.
7 21 Feb 2005 ZESA 400/330kV transfer at Insukamini substation tripped.
8 26 Fe 2005 ZESA ZESA-BPC interconnector tripped followed by theSherwood-Alaska and Warren-Norton feeders.
9 26 Sept 2004 ZESCO Both the 330kV Leopards Hill- Kariba North lines No.1 and 2 tripped resulting in Kariba North being decoupled from the rest of the ZESCO system but synchronised to ZESA.
Load Lost
1193 MW of load was shed. The actualload was significantly higher thanexpected (in excess of 1500 MW), aswell as generation load losses of up to1600 MW.
NamPower supply from Eskom was lost;at the time the import was about 142MW.
Songo-Bindura line remained in service,but power exports increased from170MW to 260MW. The HVDC poweralso dropped from 480MW to 240MW.
60MW
303MW Bush fire
427MW
All bilateral and STEM transactions werecancelled.
-
115MW
Cause of disturbance
The actual load was significantly higherthan expected (in excess of 1500 MW),as well as generation load losses of up to1600 MW.
Not yet known
Fault on main auxiliary supply systemthat feeds the HVDC control andmonitoring systems.
Bush fire
Bush fire
Phase-to-phase fault.
Not yet known
Transient lightning and over current.
Fire under the transmission lines causedby peasant farmers preparing their fields.
TABLE-1
Nature of the 2004 System Disturbances on the SAPP Grid
4000
3500
3000
2500
2000
1500
1000
500
02001 2002 2003 2004
Energy Traded in GWh
Cost of Energy in USD'000
Ener
gy a
nd C
ost
16 S o u t h e r n A f r i c a n P o w e r P o o l 2 0 0 5 A n n u a l R e p o r t 17S o u t h e r n A f r i c a n P o w e r P o o l 2 0 0 5 A n n u a l R e p o r t
SSAAPPPPSSAAPPPP5 Workshops and Conferences
5.1SAPP Meetings in Swaziland
The SAPP Operating, Planning, Environmental and
Management Committee meetings took place in
Swaziland from 1- 3 September 2004.
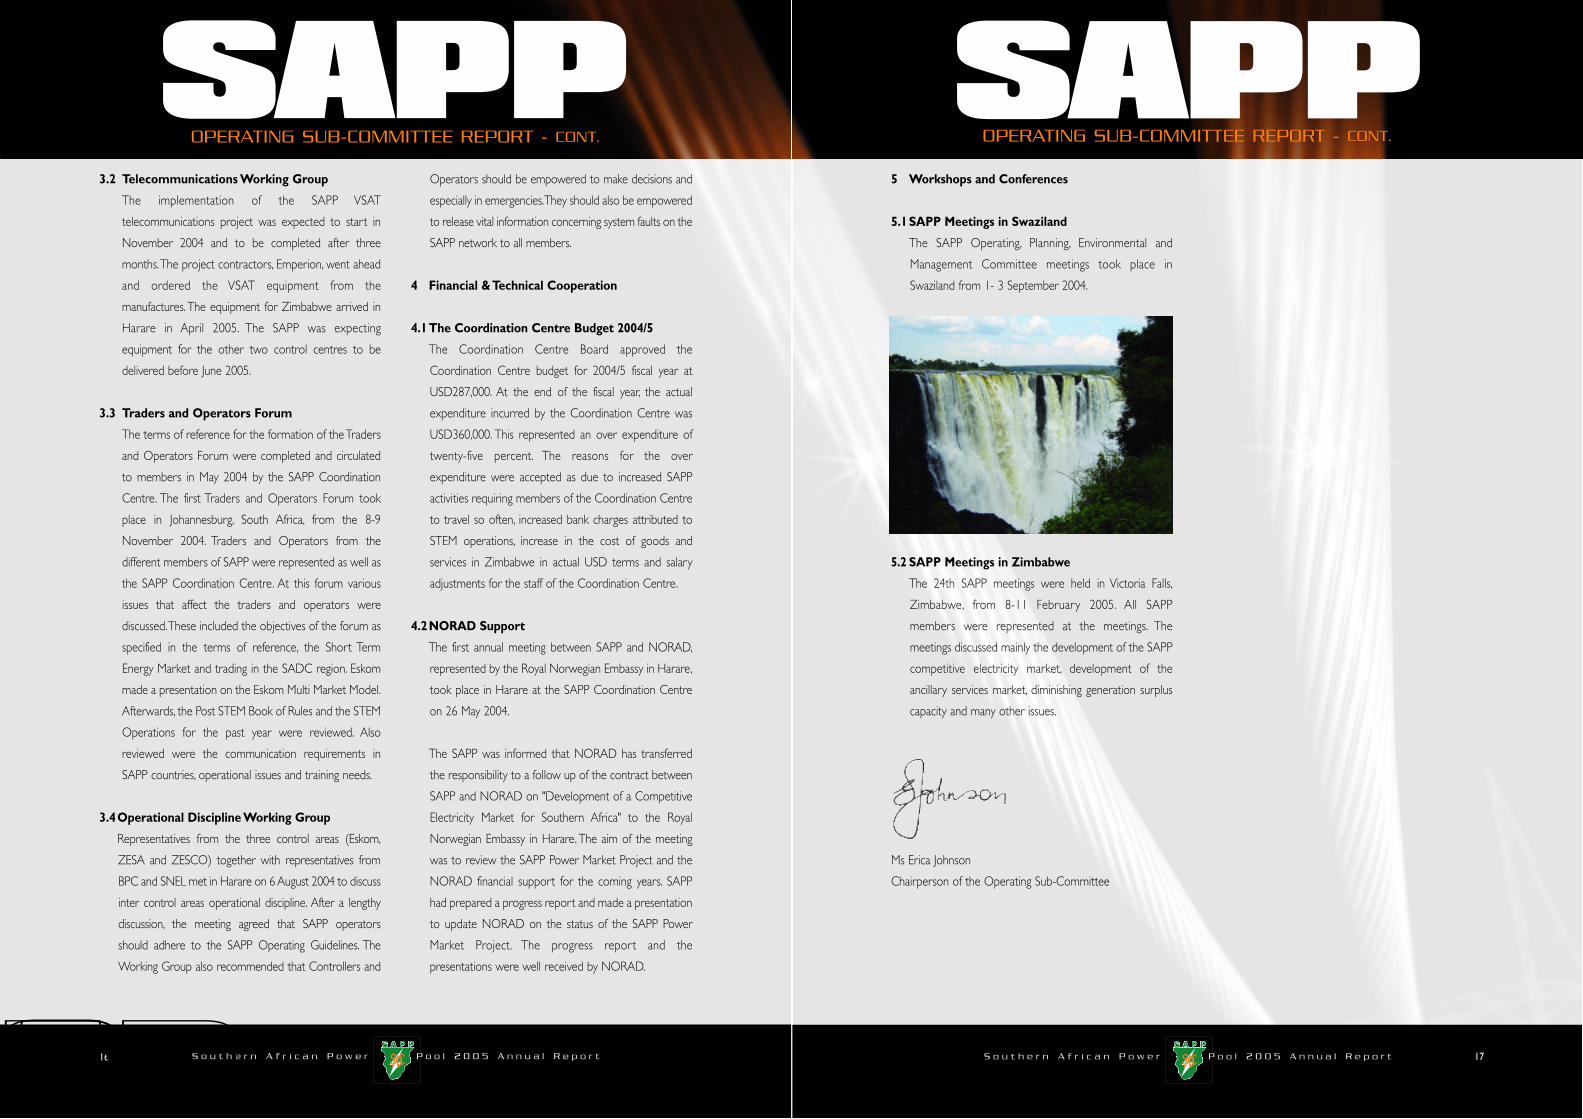
5.2 SAPP Meetings in Zimbabwe
The 24th SAPP meetings were held in Victoria Falls,
Zimbabwe, from 8-11 February 2005. All SAPP
members were represented at the meetings. The
meetings discussed mainly the development of the SAPP
competitive electricity market, development of the
ancillary services market, diminishing generation surplus
capacity and many other issues.
Ms Erica Johnson
Chairperson of the Operating Sub-Committee
OPERATING SUB-COMMITTEE REPORT - CONT.
3.2 Telecommunications Working Group
The implementation of the SAPP VSAT
telecommunications project was expected to start in
November 2004 and to be completed after three
months.The project contractors, Emperion, went ahead
and ordered the VSAT equipment from the
manufactures. The equipment for Zimbabwe arrived in
Harare in April 2005. The SAPP was expecting
equipment for the other two control centres to be
delivered before June 2005.
3.3 Traders and Operators Forum
The terms of reference for the formation of the Traders
and Operators Forum were completed and circulated
to members in May 2004 by the SAPP Coordination
Centre. The first Traders and Operators Forum took
place in Johannesburg, South Africa, from the 8-9
November 2004. Traders and Operators from the
different members of SAPP were represented as well as
the SAPP Coordination Centre. At this forum various
issues that affect the traders and operators were
discussed.These included the objectives of the forum as
specified in the terms of reference, the Short Term
Energy Market and trading in the SADC region. Eskom
made a presentation on the Eskom Multi Market Model.
Afterwards, the Post STEM Book of Rules and the STEM
Operations for the past year were reviewed. Also
reviewed were the communication requirements in
SAPP countries, operational issues and training needs.
3.4Operational Discipline Working Group
Representatives from the three control areas (Eskom,
ZESA and ZESCO) together with representatives from
BPC and SNEL met in Harare on 6 August 2004 to discuss
inter control areas operational discipline. After a lengthy
discussion, the meeting agreed that SAPP operators
should adhere to the SAPP Operating Guidelines. The
Working Group also recommended that Controllers and
Operators should be empowered to make decisions and
especially in emergencies.They should also be empowered
to release vital information concerning system faults on the
SAPP network to all members.
4 Financial & Technical Cooperation
4.1The Coordination Centre Budget 2004/5
The Coordination Centre Board approved the
Coordination Centre budget for 2004/5 fiscal year at
USD287,000. At the end of the fiscal year, the actual
expenditure incurred by the Coordination Centre was
USD360,000. This represented an over expenditure of
twenty-five percent. The reasons for the over
expenditure were accepted as due to increased SAPP
activities requiring members of the Coordination Centre
to travel so often, increased bank charges attributed to
STEM operations, increase in the cost of goods and
services in Zimbabwe in actual USD terms and salary
adjustments for the staff of the Coordination Centre.
4.2NORAD Support
The first annual meeting between SAPP and NORAD,
represented by the Royal Norwegian Embassy in Harare,
took place in Harare at the SAPP Coordination Centre
on 26 May 2004.
The SAPP was informed that NORAD has transferred
the responsibility to a follow up of the contract between
SAPP and NORAD on "Development of a Competitive
Electricity Market for Southern Africa" to the Royal
Norwegian Embassy in Harare. The aim of the meeting
was to review the SAPP Power Market Project and the
NORAD financial support for the coming years. SAPP
had prepared a progress report and made a presentation
to update NORAD on the status of the SAPP Power
Market Project. The progress report and the
presentations were well received by NORAD.
OPERATING SUB-COMMITTEE REPORT - CONT.

18 S o u t h e r n A f r i c a n P o w e r P o o l 2 0 0 5 A n n u a l R e p o r t 19S o u t h e r n A f r i c a n P o w e r P o o l 2 0 0 5 A n n u a l R e p o r t
SSAAPPPPSSAAPPPP4. SAPP Pool Plan Review
The Coordination Centre acquired the PSS/E version30 transmission planning software through fundingfrom NORAD.
The World Bank offered to assist SAPP in seekingfunding for the review of the Pool Plan Studies. Anintegrated regional least cost optimal generation andtransmission expansion program would be developed.
5. Transmission InterconnectionsThe details of the transmission projects at anadvanced stage are given below:
5.1 WESTCORThe Honourable Energy Ministers from Angola,Botswana, DR Congo, Namibia and South Africasigned an Inter-Governmental MOU on co-operationfor the development of the Western Power Corridorproject (Westcor) on 22 October 2004 inJohannesburg, South Africa.
The Chief Executives from the five national powerutilities from ENE (Angola), BPC (Botswana), SNEL(DR Congo), NamPower (Namibia) and Eskom(South Africa) also signed an Inter-Utility MOU. Thiswill pave the way for the creation of a joint venturecompany, Westcor. The Westcor Joint VentureCompany will be registered in Botswana to fund theengineering and financial studies, and will build, own,and operate the generation, transmission andtelecommunications infrastructure should the projectprove to be viable. Initially, each utility will contributeUSD 100,000 towards the setting up of a projectOffice in Gaborone.
5.2 DRC – Zambia• Terminal equipment upgrade at Luano in Zambia was
completed. This would allow for the increase intransfer capacity from 210 MW to 260 MW.
• Other upgrade works to be done to increase thetransfer capacity to 320 MW.
• The upgrades in the DRC would be funded by the
World Bank while the work in Zambia would befunded by the Copperbelt Energy Corporation (CEC)
• SNEL negotiated short term and medium term supplyagreements with ZESA and ESKOM.
5.3 Mozambique Malawi• The Project Planning Facility Fund (PPF) for
Mozambique expired in June 2004. Unfortunately, theproject had the same PPF number as another projectin Mozambique.The World Bank agreed to process anew number. It was noted that the EnvironmentalImpact Assessment on the Mozambique side wascompleted
• There has been a delay on the purchase agreement(PPA) between ESCOM Malawi, the buyer, and thepotential seller. The SAPP Coordination Centre wasrequested to call a meeting and finalize the PPA.
• It is expected that the World Bank funding would beapproved during 2005.
5.4 Zambia - Tanzania - KenyaThe economic analysis for the interconnector is stillpending and there has been changes in Tanzania thathave called for a review of the interconnector studies.The benefits of the Zambia-Tanzania interconnectionare to be compared to the just completed EastAfrican Power Master Plan. Tanzania has discoveredgas deposits and is in the process of constructingCCGT power stations.This cost will now have to becompared with the Zambian hydro supply, whichwould be non-firm, unless Kafue Lower is constructedand commissioned.
The current estimates are that Kafue Lower wouldland power in Tanzania at a price most likely higherthan the Tanzanian gas.
5.5 Zambia - Namibia• This is a proposed 220 kV line Livingstone in Zambia
and Katima Mulilo in Namibia for the transfer of 200 MW.
• A combination of AC and HVDC light technology isbeing studied.
PLANNING SUB-COMMITTEE REPORT 2003/4 - CONT.PLANNING SUB-COMMITTEE REPORT 2003/4
2004/5 DEMAND GROWTH
-5
0
5
10
15
20
25
30
Perc
ent
(%)
Average MD Sales Growth
ENE
BPC
SNEL
L
LEC
ESCO
M
EDM
Nam
Powe
r
ESKO
M
SEB
TANE
SCO
ZESC
O
ZESA
Mrs Angela Dava of EDM (Mozambique)Planning Sub-Committee Chairperson
1. IntroductionThe year 2004/5 was eventful. The following is asummary of some of the activities that took placeduring the year under review:
• All utilities recorded a positive growth in electricitydemand.The average SAPP demand growth was 3%.
• The Mozambique Malawi interconnection is now atan advanced stage whereby the line route survey isbeing carried out.
• The completion of the SAPP Five Year Strategic Plan.• The engagement of a Consultant for the development
of a transmission pricing policy, implementationprocedures and ancillary services marketdevelopment through funding from Sida.The major challenge is how to address the diminishingexcess generation surplus capacity in the region. It wasnoted the region would run out of generation capacityby the year 2007, hence is a need to actively promotegeneration and transmission projects in SAPP.
2. SAPP Accredited Capacity Obligation andProject TrackingAs demand is rising at approximately 3% per annumthe Planning Sub Committee is closely monitoring theoverall generation reserve capacity in the region.
Graph 1: Utility Peak demand growth
It has been noticed that excess generation capacity isrunning out quite fast due to positive developments inmost countries. A comprehensive projects track taskwas done. During the reporting period 260MW ofhydropower was commissioned during the lastquarter of 2004 in Angola, 80 MW at Ubongo inTanzania, 2 x 150 MW generators at Kafue Gorge inZambia was rehabilitated giving an additional 30 MWcapacity. At Kariba North the first generator wasupgraded from 150 to 180 MW and 4 x 10 MWmachines were re-commissioned at Victoria FallsPower Station and 190 MW is expected to becommissioned at Campden in South Africa. Thatincreases the regional generation capacity by 620MW.The detailed generation expansion program forshort term and long-term utility priority projects arehighlighted in Table 3 and 4.
Country Plant Capacity CommissioningDate
Angola Capanda 1&2 260MW 2004Tanzania Ubongo 2 x 40 MW 2004Zambia Kariba North 2 x 30 MW 2004South Africa Campden #6 190 MW 2005Zambia Kariba North 30MW 2005Total 620 MW
Table 1. Commissioned Plants 2004/5
3. Transmission Pricing and Ancillary ServicesMarket DevelopmentSAPP is in the process of developing an ancillaryservices market and also reviewing the currenttransmission pricing policy as SAPP is moving from acooperative into as competitive pool. A project hasbeen initiated to address these challenges withfunding from Sida.The project timeframe is from July2004 to December 2007. Detailed terms ofreferences were developed and tenders were floatedin December 2004 for the engagement of aConsultant for the study. A Consultant has now beenappointed who will work closely with SAPP.

21
Mr. Lovemore Nyahuma of ZESA Environmental
Sub-Committee Chairperson (2004/5)
The momentum that was gathered during the
previous year continued.This witnessed the coverage
of a lot of ground with some of the notable
achievements detailed below.
1. Evaluation of Environmental Impacts of
SAPP Projects
1. WESTCOR
The timetable for the project’s pre and feasibility
studies was approved. An environmental committee
was set up to coordinate the environmental aspects
of the abovementioned project, with guidance and
support from the environmental Sub-Committee.
1.2 DRC-Zambia Inter-connector
The Environmental Impact Assessment (EIA) study for
the DRC portion of the line was completed.The 330
kV line on the Zambian side was commissioned in
November 2004 and all environmental issues were
handled according to the Environmental Management
Plan (EMP). The Environmental Council of Zambia
(ECZ) approved the EIA study for the 220 kV line.
Major issues related to relocation and compensation.
1.3 Zambia-Tanzania-Kenya Inter-connector
The EIA study for the 330 kV line from Zambia to
Mbeya in Tanzania was approved. The EIA study for
upgrading the 220 kV line in Tanzania was still to be
done, whilst that for the proposed Mbeya to Singida
330 kV line was in the preparatory stages.The EIA for
the Arusha (Tanzania) to Nairobi (Kenya) 220 kV line
was completed.
1.4 Mozambique-Malawi Inter-connector
The EIA study and EMP for the Malawian portion of
the 220 kV line were completed. Approval of the
study for the Mozambican portion was still being
awaited. Meanwhile, aerial survey was completed and
work was progressing on the resettlement plan.
1.5 Zambia-Namibia Inter-connector
The EIA for the Zambian portion of the 220 kV line
was done in 2000. The EMP has been included into
contracts for the construction of the line. The major
environmental issues are that the line traverses
through forest reserves and compensation for
resettlements.
1.6 Lower Kafue-Gorge Power Station-750MW
The EIA that was conducted in-house was completed.
Some of the environmental impacts from the project
are tree-cutting, noise, erosion, HIV/AIDS, relocation of
17 fishing families. Some of the mitigatory measures
included water and power supply to the affected
community, creation of a nature reserve to protect the
fragile environment and setting up of a health center.
2. Working Group Reports
2.1 EIA Guidelines for Hydropower Projects
Terms of reference for the engagement of consultants
to prepare the guidelines were prepared, discussed
and agreed upon by the ESC.
20 S o u t h e r n A f r i c a n P o w e r P o o l 2 0 0 5 A n n u a l R e p o r t S o u t h e r n A f r i c a n P o w e r P o o l 2 0 0 5 A n n u a l R e p o r t
SSAAPPPP• Techno-economic justification was completed and
accepted by African Development Bank.• Substation works are in progress with designs
completed and earthworks are already underway.• The planned commissioning date is May 2006.
6. Technical IssuesBPC upgraded the transmission line betweenSegoditshane and Thamaga substations from 132kV to220kV and has commissioned two new transformersat Thamaga substation, each rated at 125MVA220/132kV. Completion of the project alters the BPCsystem transfer capability, as the transformers atThamaga will form a parallel path with the ones atSegoditshane via 132kV connection betweenThamaga and Gaborone South. In Zambia a new330kV line was commissioned in November 2004 inorder to feed a new mine in Kansanshi, 200km westof Chingola town in the Copperbelt province ofZambia. The line was energized via a 200km 330kVline extension from Luano substation to Kansanshi.
DRC-Zambia Interconnector Studies A team of Engineers from CEC, SNEL and ZESCOtogether with the Coordination Centre met at theSAPP Coordination Centre in Harare to carry outinvestigations on the transfer capability of the existingDRC-Zambia interconnector to enable SNEL toexport additional power down South. An earlierreview of the studies was done in April of 2002.TheStudy Team concluded that the transfer limit of 210MW from the DRC to Zambia could be increased to310 MW without reactive power compensationequipment. It was recommended that 310 MW beused as the operational limit of the DRC-Zambia 220kV line under normal operating conditions.
Mrs Angela DavaChairperson of the Planning Sub-Committee
PLANNING SUB-COMMITTEE REPORT 2003/4 - CONT.
Members of the SAPP Executive Committee pose for a group photo with the Deputy Minister of Energy of Malawi, Hon. B. Khamisa.
SSAAPPPPENVIRONMENTAL SUB-COMMITTEE REPORT

22 S o u t h e r n A f r i c a n P o w e r P o o l 2 0 0 5 A n n u a l R e p o r t 23S o u t h e r n A f r i c a n P o w e r P o o l 2 0 0 5 A n n u a l R e p o r t
SSAAPPPPSSAAPPPPSAPP CO-ORDINATION CENTRE REPORT
Dr. Lawrence Musaba Mr. Alison ChikovaThe Coordination Centre Manager Supervisor, System Studies
Mrs. Joyce Mutsau Miss Caroline Ganyani Finance and Administration Officer IT Specialist
Mr. Elisha Mutambudzi Ms. Daisy MudangweSTEM Finance Officer STEM Finance Officer
Mr. Simon Jaricha Mr.William BaletMessenger SAPP Senior Advisor
2.2 Sustainable Development
The working group was reconstituted with a view to
explore initiatives contained in the World Summit on
Sustainable Development document and come up
with a list of those that could be considered.
2.3 Training
There were two training sessions that were held
during the course of the year. The first one was on
Social Impact Assessment (SIA) followed by the one
on Strategic Environmental Assessment (SEA).
2.4 SAPP Position on Climate Change
The position paper was awaiting Management
Committee approval.
2.5 Negative Impacts of Climate Change
The consultants doing the studies on Improvement of
Emission Factors and Vulnerability and Adaptation to
Climate Change for hydropower generation in the
Zambezi river basin were requested to a presentation
in order for the ESC to have a better appreciation.
2.6 Guidelines on Management of oil Spills
The guidelines were finalized and were to be
submitted to the Management Committee for
consideration and approval.
2.7 Guidelines Management of Asbestos
The guidelines were submitted to the Management
Committee for consideration and approval.
2.8 Guidelines on Animal Interactions
The guidelines were submitted to the Management
Committee for consideration and approval.
2.9 Environmental Management of Policy
A new group was constituted to come up with an
Environmental Management Policy.
Mr. Lovemore Nyahuma
Chairman of the Environmental Sub-Committee
ENVIRONMENTAL SUB-COMMITTEE REPORT - CONT.
24 S o u t h e r n A f r i c a n P o w e r P o o l 2 0 0 5 A n n u a l R e p o r t 25S o u t h e r n A f r i c a n P o w e r P o o l 2 0 0 5 A n n u a l R e p o r t
SSAAPPPPSSAAPPPP1. Introduction
During the year under review, the management andoperations of the SAPP Coordination Centre werereviewed towards viability and sustainability. Theproposed management structure of the SAPPdescribed in the Management Committee report isaimed at enhancing corporate governance in SAPPand at the Coordination Centre. SAPP membersthrough yearly contributions to the CoordinationCentre budget fund the activities of the CoordinationCentre. Therefore, use of funds in an economic,efficient and effective manner is desirable.
The activities of the Coordination Centre in the pastyear included, but were not limited to STEMoperations and management, review of wheelingcharges for both bilateral and STEM trading, systemstudies, competitive market development, and manyother activities.
2. Human Resources
Miss Caroline GanyaniNew SAPP IT Specialist
In October 2004 the then SAPP IT Specialist, Mr.Chatwel Ncube, left the Co-ordination Centre andwas later replaced by Miss Caroline Ganyani inDecember 2004. Miss Ganyani joined the SAPPCoordination Centre as an IT Specialist from 1 Januray2005. Prior to joining the Coordination Centre, shewas on attachment with the Coordination Centrefrom July 2002 to August 2003 as a Student ondevelopment. She graduated with BSc(Hons) degreein Information Systems from Midlands State Universityof Zimbabwe.
In June 2004, Mr. Simon Jaricha was recruited as thenew Messenger for the Coordination Centre. He tookover from Mr. Misheck Tembo who left theCoordination Centre when his contract expired atthe end of May 2004. Mr. Tembo worked for theCoordination Centre for four years from May 2000 toMay 2004.
The Coordination Centre would like to thank bothMr. Chatwel Ncube and Mr. Misheck Tembo for their
valuable services and contributions whilst with theCoordination Centre and wish them both the best intheir future careers.
3. Conferences and Workshops
3.1 IEEE Annual General MeetingThe IEEE Annual General Meeting was held in Denver,USA, from the 6-10 June 2004. Mr. Alison Chikovafrom the Coordination Centre and Mr. Pat Naidoo ofEskom represented SAPP. A paper on theDevelopment of a competitive electricity market inSouthern Africa was presented.The SAPP agreed to aproposal from IEEE to host the general meeting inSouthern Africa in July 2005 in Durban, South Africa.
3.2 Power Africa SummitThe Power Africa Summit 2004 was held inJohannesburg, South Africa, from 7-10 June 2004 atVodaworld. Dr L. Musaba and Mr. W. Balet both fromthe Coordination Centre represented SAPP.The twopresented a paper entitled Power Sector Reforms inSAPP Member Countries.
Critical issues addressed at this summit includedsecurity of supply in competitive and deregulatedmarkets, developments in cross-border powersharing, strategies in effective and accurate demandside management, privatization of power utilities,infrastructure to guarantee the reliable flow ofelectricity throughout Africa, energy scenarios forAfrica, etc.
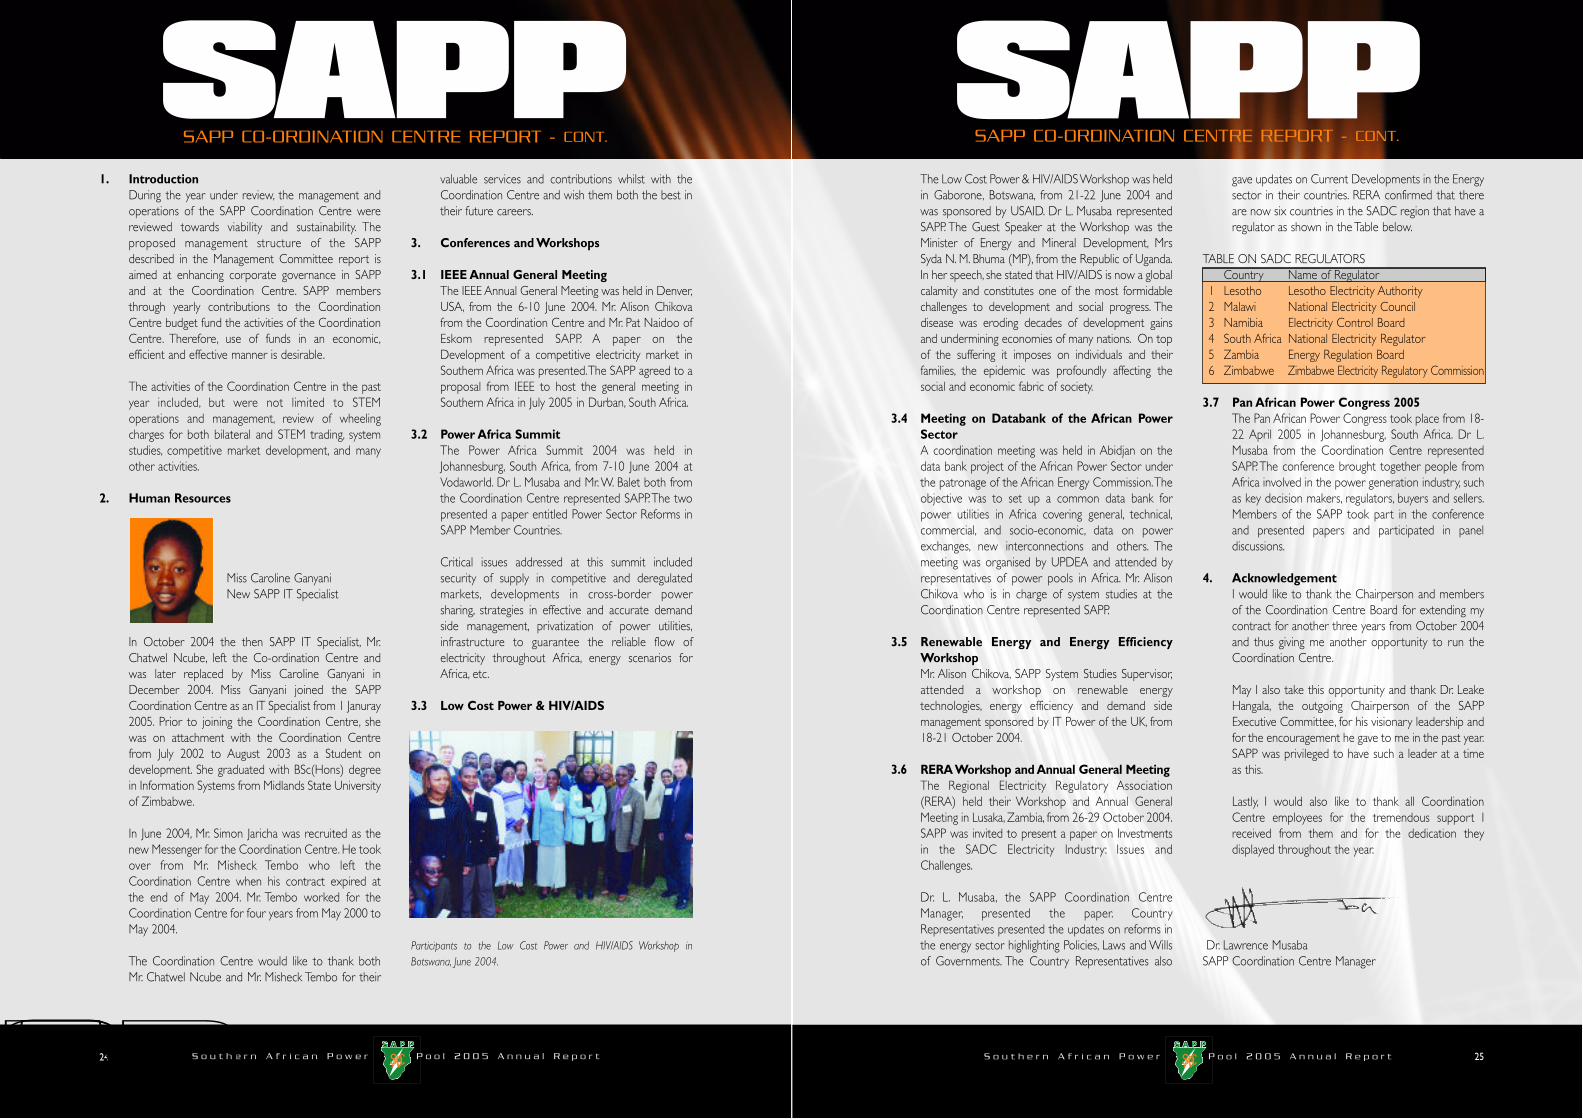
3.3 Low Cost Power & HIV/AIDS
Participants to the Low Cost Power and HIV/AIDS Workshop inBotswana, June 2004.
SAPP CO-ORDINATION CENTRE REPORT - CONT. SAPP CO-ORDINATION CENTRE REPORT - CONT.
The Low Cost Power & HIV/AIDS Workshop was heldin Gaborone, Botswana, from 21-22 June 2004 andwas sponsored by USAID. Dr L. Musaba representedSAPP. The Guest Speaker at the Workshop was theMinister of Energy and Mineral Development, MrsSyda N. M. Bhuma (MP), from the Republic of Uganda.In her speech, she stated that HIV/AIDS is now a globalcalamity and constitutes one of the most formidablechallenges to development and social progress. Thedisease was eroding decades of development gainsand undermining economies of many nations. On topof the suffering it imposes on individuals and theirfamilies, the epidemic was profoundly affecting thesocial and economic fabric of society.
3.4 Meeting on Databank of the African PowerSectorA coordination meeting was held in Abidjan on thedata bank project of the African Power Sector underthe patronage of the African Energy Commission.Theobjective was to set up a common data bank forpower utilities in Africa covering general, technical,commercial, and socio-economic, data on powerexchanges, new interconnections and others. Themeeting was organised by UPDEA and attended byrepresentatives of power pools in Africa. Mr. AlisonChikova who is in charge of system studies at theCoordination Centre represented SAPP.
3.5 Renewable Energy and Energy EfficiencyWorkshopMr. Alison Chikova, SAPP System Studies Supervisor,attended a workshop on renewable energytechnologies, energy efficiency and demand sidemanagement sponsored by IT Power of the UK, from18-21 October 2004.
3.6 RERA Workshop and Annual General MeetingThe Regional Electricity Regulatory Association(RERA) held their Workshop and Annual GeneralMeeting in Lusaka, Zambia, from 26-29 October 2004.SAPP was invited to present a paper on Investmentsin the SADC Electricity Industry: Issues andChallenges.
Dr. L. Musaba, the SAPP Coordination CentreManager, presented the paper. CountryRepresentatives presented the updates on reforms inthe energy sector highlighting Policies, Laws and Willsof Governments. The Country Representatives also
gave updates on Current Developments in the Energysector in their countries. RERA confirmed that thereare now six countries in the SADC region that have aregulator as shown in the Table below.
TABLE ON SADC REGULATORSCountry Name of Regulator
1 Lesotho Lesotho Electricity Authority2 Malawi National Electricity Council3 Namibia Electricity Control Board4 South Africa National Electricity Regulator5 Zambia Energy Regulation Board6 Zimbabwe Zimbabwe Electricity Regulatory Commission
3.7 Pan African Power Congress 2005The Pan African Power Congress took place from 18-22 April 2005 in Johannesburg, South Africa. Dr L.Musaba from the Coordination Centre representedSAPP. The conference brought together people fromAfrica involved in the power generation industry, suchas key decision makers, regulators, buyers and sellers.Members of the SAPP took part in the conferenceand presented papers and participated in paneldiscussions.
4. AcknowledgementI would like to thank the Chairperson and membersof the Coordination Centre Board for extending mycontract for another three years from October 2004and thus giving me another opportunity to run theCoordination Centre.
May I also take this opportunity and thank Dr. LeakeHangala, the outgoing Chairperson of the SAPPExecutive Committee, for his visionary leadership andfor the encouragement he gave to me in the past year.SAPP was privileged to have such a leader at a timeas this.
Lastly, I would also like to thank all CoordinationCentre employees for the tremendous support Ireceived from them and for the dedication theydisplayed throughout the year.
Dr. Lawrence MusabaSAPP Coordination Centre Manager
POTENTIAL NEW GENERATION PROJECTS IN SAPP - Table 1: Short Term Generation Projects in SAPP Countries
No. Country Project Name Capacity [MW] Type Expected Commissioning
Year1 Angola Capanda 260 Hydro 20072 Botswana Morupule Expansion 240 Coal 20093 DRC Refurbish Inga-1 & 2 500 Hydro 20074 Lesotho Muela Phase-2 110 Hydro 20105 Malawi Kaphichira Phase-2 64 Hydro 20096 Namibia Kudu 800 Gas 20097 South Africa Mothballed Plants 3,500 Coal 2005 to 2010
Open Cycle Gas Turbine 1050 Gas 2007Open Cycle Gas Turbine 1050 Gas 2008
8 Swaziland Maguga 20 Hydro 2007Ubungo 40 Gas 2005
9 Tanzania Ubungo 40 Gas 2005Kinyerezi 60 Gas 2007Kinyerezi 80 Gas 2009
10 Zambia Refurbishment 210 Hydro 2006Itezhi-Tezhi 120 Hydro 2007Kafue Lower 600 Hydro 2009Kariba North 360 Hydro 2009
11 Zimbabwe Kariba South 300 Hydro 2007Hwange 7 & 8 660 Thermal 2008Lupani 300 Gas 2009Western Power Station 1200 Coal 2008TOTAL 11,564
26 S o u t h e r n A f r i c a n P o w e r P o o l 2 0 0 5 A n n u a l R e p o r t 27S o u t h e r n A f r i c a n P o w e r P o o l 2 0 0 5 A n n u a l R e p o r t
SSAAPPPPSSAAPPPPSTATISTICS - CONT.STATISTICS
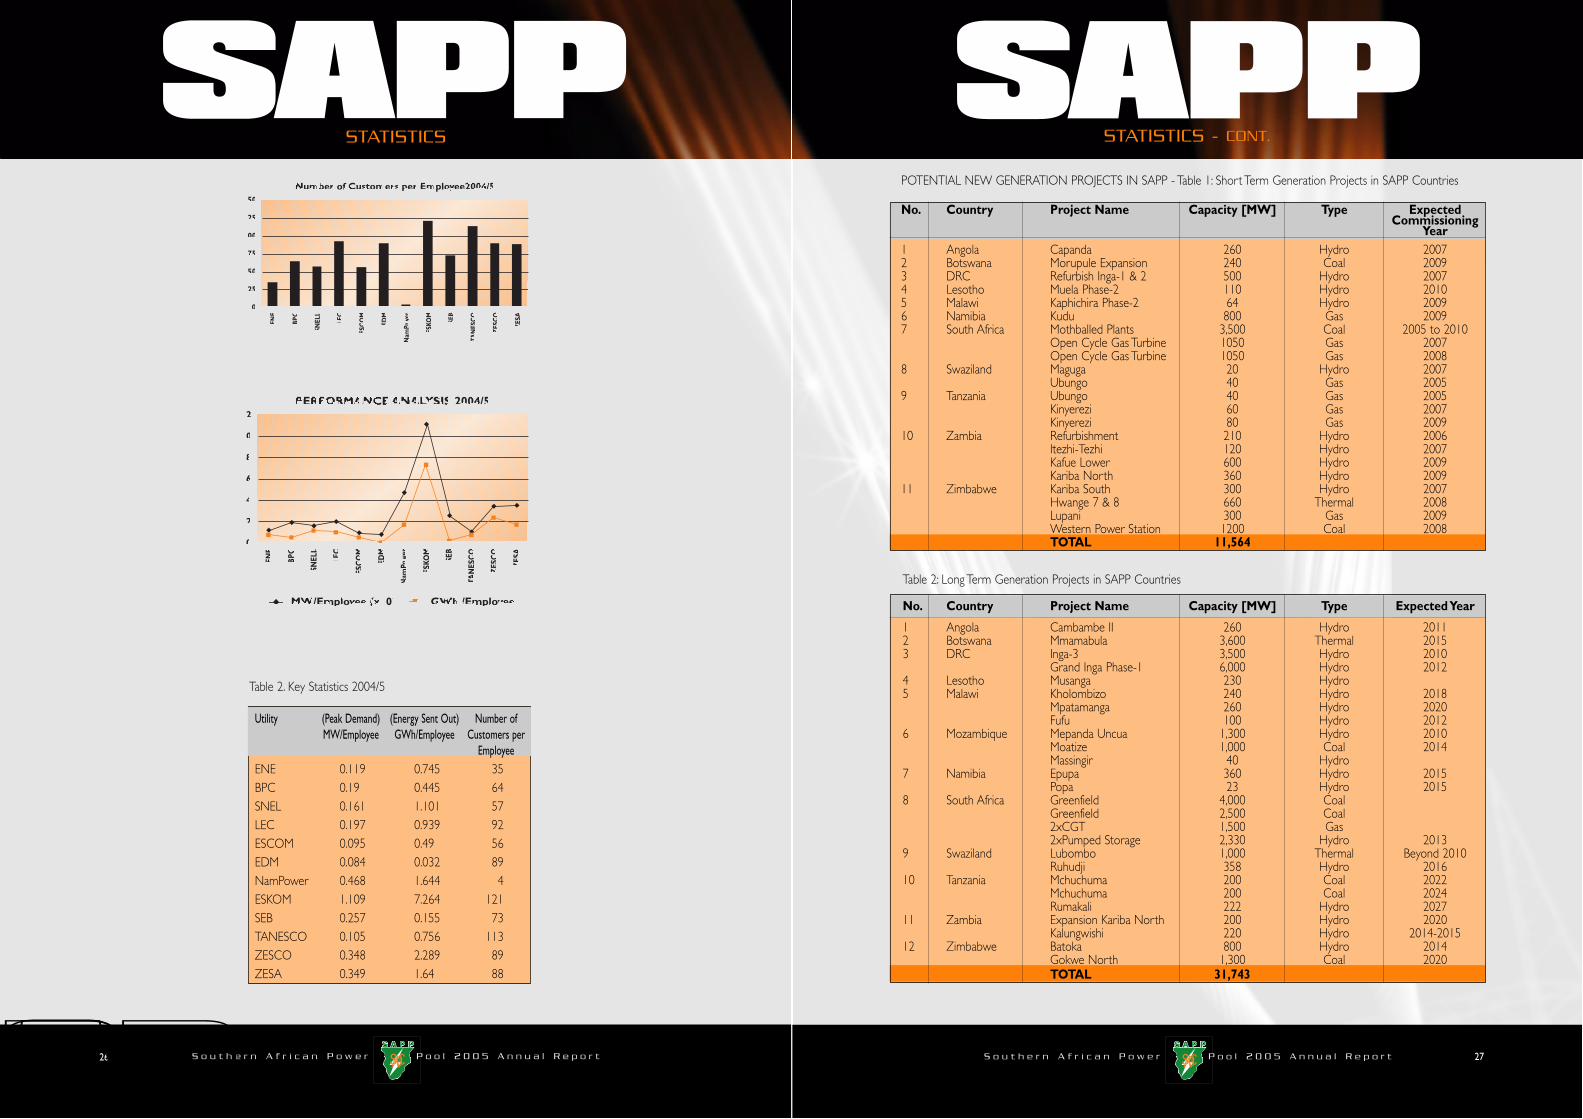
Number of Customers per Employee2004/5
0
25
50
75
100
125
150
ENE
BPC
SNEL
L
LEC
ESC
OM
EDM
Nam
Pow
er
ESKO
M
SEB
TAN
ESC
O
ZESC
O
ZESA
PERFORMANCE ANALYSIS 2004/5
0
2
4
6
8
10
12
MW/Employee (x10) GWh /Employee
ENE
BPC
SNEL
L
LEC
ESC
OM
EDM
Nam
Pow
er
ESKO
M
SEB
TAN
ESC
O
ZESC
O
ZESA
Table 2. Key Statistics 2004/5
Utility (Peak Demand) (Energy Sent Out) Number ofMW/Employee GWh/Employee Customers per
EmployeeENE 0.119 0.745 35BPC 0.19 0.445 64SNEL 0.161 1.101 57LEC 0.197 0.939 92ESCOM 0.095 0.49 56EDM 0.084 0.032 89NamPower 0.468 1.644 4ESKOM 1.109 7.264 121SEB 0.257 0.155 73TANESCO 0.105 0.756 113ZESCO 0.348 2.289 89ZESA 0.349 1.64 88
Table 2: Long Term Generation Projects in SAPP Countries
No. Country Project Name Capacity [MW] Type Expected Year
1 Angola Cambambe II 260 Hydro 20112 Botswana Mmamabula 3,600 Thermal 20153 DRC Inga-3 3,500 Hydro 2010
Grand Inga Phase-1 6,000 Hydro 20124 Lesotho Musanga 230 Hydro5 Malawi Kholombizo 240 Hydro 2018
Mpatamanga 260 Hydro 2020Fufu 100 Hydro 2012
6 Mozambique Mepanda Uncua 1,300 Hydro 2010Moatize 1,000 Coal 2014Massingir 40 Hydro
7 Namibia Epupa 360 Hydro 2015Popa 23 Hydro 2015
8 South Africa Greenfield 4,000 CoalGreenfield 2,500 Coal2xCGT 1,500 Gas2xPumped Storage 2,330 Hydro 2013
9 Swaziland Lubombo 1,000 Thermal Beyond 2010Ruhudji 358 Hydro 2016
10 Tanzania Mchuchuma 200 Coal 2022Mchuchuma 200 Coal 2024Rumakali 222 Hydro 2027
11 Zambia Expansion Kariba North 200 Hydro 2020Kalungwishi 220 Hydro 2014-2015
12 Zimbabwe Batoka 800 Hydro 2014Gokwe North 1,300 Coal 2020TOTAL 31,743
28 S o u t h e r n A f r i c a n P o w e r P o o l 2 0 0 5 A n n u a l R e p o r t 29S o u t h e r n A f r i c a n P o w e r P o o l 2 0 0 5 A n n u a l R e p o r t
SSAAPPPPSSAAPPPPSTATISTICS - CONT.
Table 3: UTILITY GENERAL INFORMATION
APRIL 2004 TO MARCH 2005
Country Utility Installed Maximum MD Sales Sales Number of Number of Generation Net Net Transmission Revenue Debtor Rate of NetCapacity Demand Growth Growth Customers Employees Sent Out Imports Exports System US$ Days Return Income
losses Million USDMW MW % GWh % GWh GWh GWh % % Million
Angola ENE 624 374 16 1,636 6.1 110,801 3,148 2,344 17.5 - 25 47.16 49 n/a -24.73
Botswana BPC 132 402 2 2420.7 2.3 136,398 2,118 941.7 1,864.20 - 11.7 134.4 44 1.4 32
DRC SNEL 2,442 1012 2.53 4,656 13 360,329 6,268 6,904 - 1,800.00 6.3 149.2 n/a n/a n/a
Lesotho LEC 72 90 1 311 -3 42,173 456 428 8 39 22 19.2 45 -1 -0.97
Malawi ESCOM 285 227 7 970 4 135,000 2,400 1,177 N/A N/A 19 5.319 110 1 2.218
Mozambique EDM 177 266 3.1 1,452 5 284,562 3,185 102.2 1,773 1,496 20 102.7 58 3.2 4.8
Namibia NamPower 461 393 24.3 2,795 24.4 3,261 839 1,379 1,566.0 - 8 159 34 0.92 10
South Africa ESKOM 42,011 32,082 1 196,980 4.8 3,505,039 28,938 210,218 8,194 9,977 8.3 4,782.00 27 10.58 487
Swaziland SEB 51 171.5 1 852.8 2.5 48,500 667 103.5 916.8 - 16 59.7 85 4.5 5.1
Tanzania TANESCO 839 509 5.9 2,549 10.3 550,863 4857 3674 43 - 24 188 92 n/a n/a
Zambia ZESCO 1,672 1,294 6.4 8,201 4.4 332,000 3,719 8,512 - 231 3.7 154.08 172 0.4 3.682
Zimbabwe ZESA 1,975 2,069 3.1 10,117 -4.21 522,427 5,925 9,719 1,993 255.5 13.6 200.4 52 -1.81 -389.2
STATISTICS - CONT.
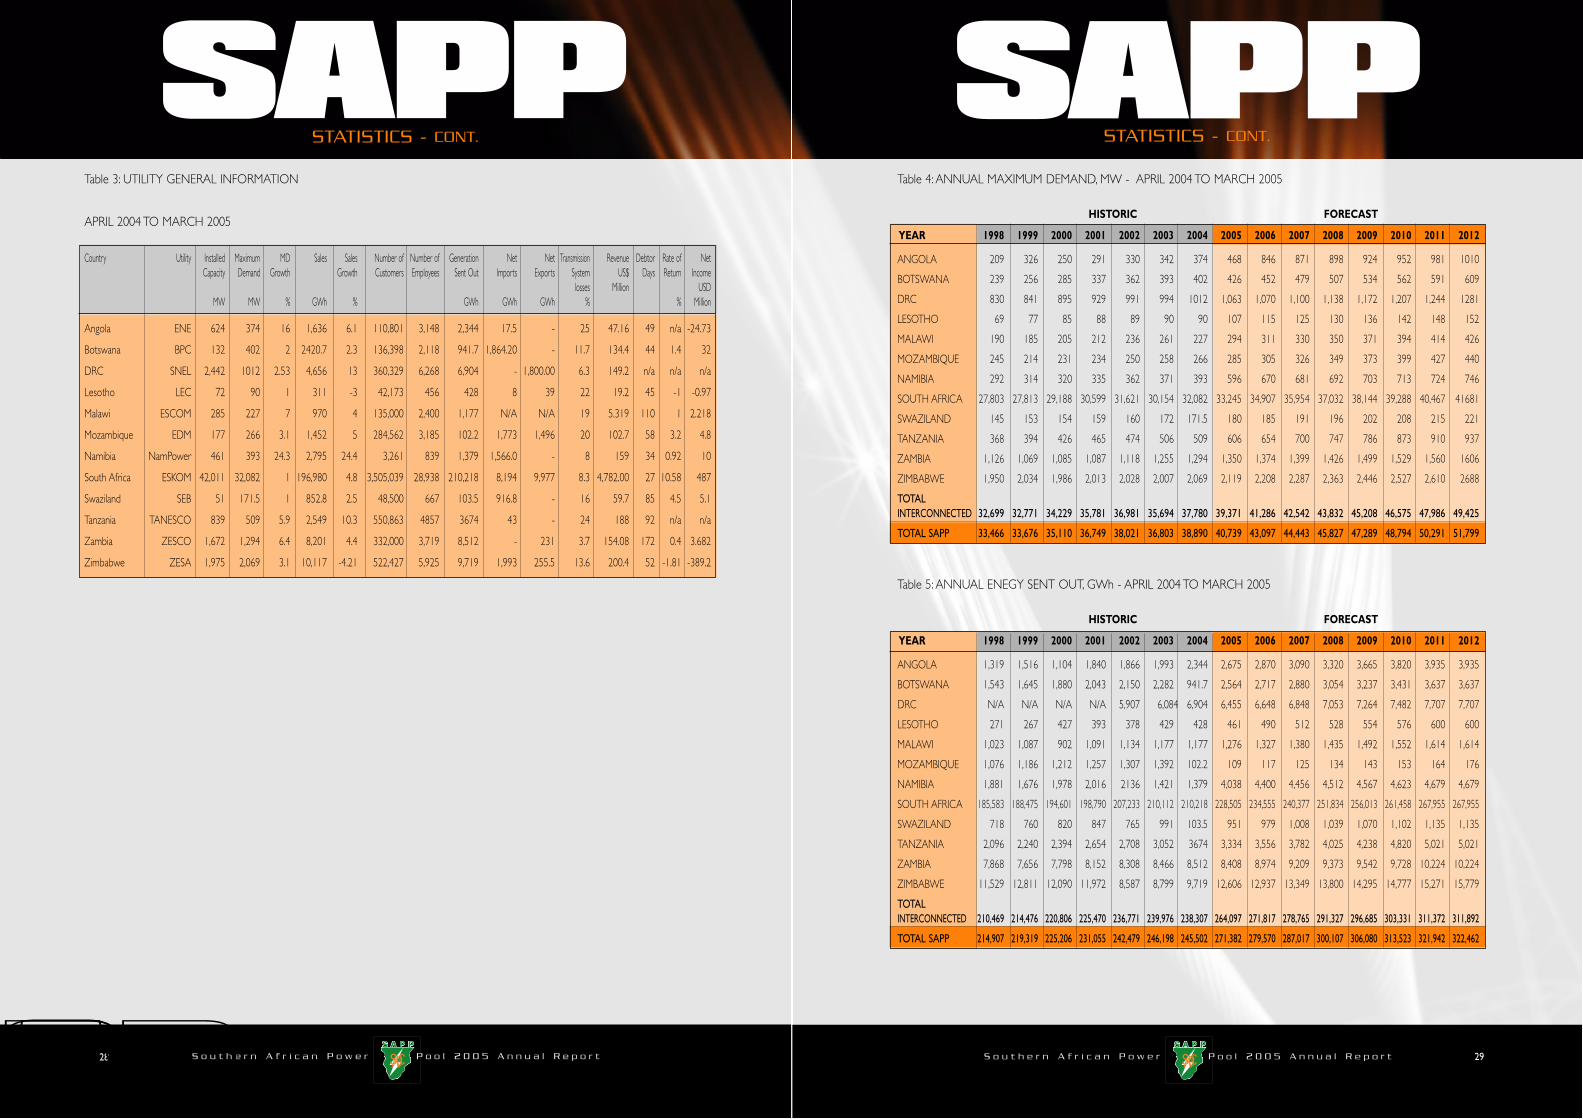
Table 4: ANNUAL MAXIMUM DEMAND, MW - APRIL 2004 TO MARCH 2005
HISTORIC FORECAST
YEAR 1998 1999 2000 2001 2002 2003 2004 2005 2006 2007 2008 2009 2010 2011 2012
ANGOLA 209 326 250 291 330 342 374 468 846 871 898 924 952 981 1010
BOTSWANA 239 256 285 337 362 393 402 426 452 479 507 534 562 591 609
DRC 830 841 895 929 991 994 1012 1,063 1,070 1,100 1,138 1,172 1,207 1,244 1281
LESOTHO 69 77 85 88 89 90 90 107 115 125 130 136 142 148 152
MALAWI 190 185 205 212 236 261 227 294 311 330 350 371 394 414 426
MOZAMBIQUE 245 214 231 234 250 258 266 285 305 326 349 373 399 427 440
NAMIBIA 292 314 320 335 362 371 393 596 670 681 692 703 713 724 746
SOUTH AFRICA 27,803 27,813 29,188 30,599 31,621 30,154 32,082 33,245 34,907 35,954 37,032 38,144 39,288 40,467 41681
SWAZILAND 145 153 154 159 160 172 171.5 180 185 191 196 202 208 215 221
TANZANIA 368 394 426 465 474 506 509 606 654 700 747 786 873 910 937
ZAMBIA 1,126 1,069 1,085 1,087 1,118 1,255 1,294 1,350 1,374 1,399 1,426 1,499 1,529 1,560 1606
ZIMBABWE 1,950 2,034 1,986 2,013 2,028 2,007 2,069 2,119 2,208 2,287 2,363 2,446 2,527 2,610 2688
TOTAL INTERCONNECTED 32,699 32,771 34,229 35,781 36,981 35,694 37,780 39,371 41,286 42,542 43,832 45,208 46,575 47,986 49,425
TOTAL SAPP 33,466 33,676 35,110 36,749 38,021 36,803 38,890 40,739 43,097 44,443 45,827 47,289 48,794 50,291 51,799
Table 5: ANNUAL ENEGY SENT OUT, GWh - APRIL 2004 TO MARCH 2005
HISTORIC FORECAST
YEAR 1998 1999 2000 2001 2002 2003 2004 2005 2006 2007 2008 2009 2010 2011 2012
ANGOLA 1,319 1,516 1,104 1,840 1,866 1,993 2,344 2,675 2,870 3,090 3,320 3,665 3,820 3,935 3,935
BOTSWANA 1,543 1,645 1,880 2,043 2,150 2,282 941.7 2,564 2,717 2,880 3,054 3,237 3,431 3,637 3,637
DRC N/A N/A N/A N/A 5,907 6,084 6,904 6,455 6,648 6,848 7,053 7,264 7,482 7,707 7,707
LESOTHO 271 267 427 393 378 429 428 461 490 512 528 554 576 600 600
MALAWI 1,023 1,087 902 1,091 1,134 1,177 1,177 1,276 1,327 1,380 1,435 1,492 1,552 1,614 1,614
MOZAMBIQUE 1,076 1,186 1,212 1,257 1,307 1,392 102.2 109 117 125 134 143 153 164 176
NAMIBIA 1,881 1,676 1,978 2,016 2136 1,421 1,379 4,038 4,400 4,456 4,512 4,567 4,623 4,679 4,679
SOUTH AFRICA 185,583 188,475 194,601 198,790 207,233 210,112 210,218 228,505 234,555 240,377 251,834 256,013 261,458 267,955 267,955
SWAZILAND 718 760 820 847 765 991 103.5 951 979 1,008 1,039 1,070 1,102 1,135 1,135
TANZANIA 2,096 2,240 2,394 2,654 2,708 3,052 3674 3,334 3,556 3,782 4,025 4,238 4,820 5,021 5,021
ZAMBIA 7,868 7,656 7,798 8,152 8,308 8,466 8,512 8,408 8,974 9,209 9,373 9,542 9,728 10,224 10,224
ZIMBABWE 11,529 12,811 12,090 11,972 8,587 8,799 9,719 12,606 12,937 13,349 13,800 14,295 14,777 15,271 15,779
TOTAL INTERCONNECTED 210,469 214,476 220,806 225,470 236,771 239,976 238,307 264,097 271,817 278,765 291,327 296,685 303,331 311,372 311,892
TOTAL SAPP 214,907 219,319 225,206 231,055 242,479 246,198 245,502 271,382 279,570 287,017 300,107 306,080 313,523 321,942 322,462

30 S o u t h e r n A f r i c a n P o w e r P o o l 2 0 0 5 A n n u a l R e p o r t 31S o u t h e r n A f r i c a n P o w e r P o o l 2 0 0 5 A n n u a l R e p o r t
SSAAPPPPSSAAPPPPThe following principal accounting policies have been
consistently applied throughout the period:
ACCOUNTING CONVENTION
The financial statements are prepared under the historical
cost convention. No procedures are adopted to reflect the
impact on the financial statements of specific price changes or
changes in the general level of prices.
CURRENCY
The financial statements are expressed in United States
dollars. Assets and liabilities are translated to the relevant
currencies at the exchange rate ruling on the balance sheet
date, income and expenditure items are translated at the
ruling average monthly rates for the period to which they
relate. Realised exchange differences are taken to the
income statement in the year in which they arise. Surpluses
and deficits on translation are dealt with in the income
statement in the determination of net income.
DEPRECIATION
Fixed assets are depreciated over their expected useful lives
on a straight line basis as follows:-
Computer equipment - 3 years
Office equipment - 5 years
Office furniture and fittings - 10 years
The carrying amounts of fixed assets are reviewed at each
balance sheet date to assess whether they are recorded in
excess of their receivable amounts and where carrying values
exceed this estimated recoverable amount, assets are written
down to their recoverable amount.
SPECIAL FUND
Funds granted for specific purposes are not included in the
income and expenditure account, but are accounted for
separately as Special Fund on the balance sheet. They are
maintained in a separate bank account and any interest
earned on the unused funds is credited to the Special Fund.
PROVISIONS
Provisions are recognised when the Organisation has a
present obligation (legal or constructive) as a result of a past
event, it is probable that an outflow of resources embodying
economic benefits will be required to settle the obligation
and a reliable estimate can be made of the amounts of the
obligation.
RETIREMENT BENEFIT COSTS
Retirement benefits are provided for the organisation
employees through the National Social Security Authority
(NSSA) scheme.
Employer's contributions to the NSSA scheme are charged
to the income statement when due.
REVENUE RECOGNITION
Funds Income
Income received is based on a set budget agreed upon by all
members of the organisation and contributions made by
members are based on set percentages and proportions
based on electricity usage. The income is brought to account
per issued invoice to each of the member countries.
Interest
Revenue is recognised as the interest accrues.
STATEMENT OF ACCOUNTING POLICIES
We have audited the annual financial statements set out on pages 3 to 9 for the year ended 31 March 2005.
Respective responsibilities of the executive committee and auditors
The financial statements are the responsibility of the executive committee of the organisation. Our responsibility is to express
an opinion on these financial statements based on our audit.
Scope
We conducted our audit in accordance with approved International Standards on Auditing. Those standards require that we
plan and perform the audit to obtain reasonable assurance that the financial statements are free of material misstatement. An
audit includes:
• examining, on a test basis, evidence supporting the amounts and disclosures in the financial statements,
• assessing the accounting principles used and significant estimates made by management, and
• evaluating the overall financial statement presentation.
Audit opinion
In our opinion, the financial statements, in all material respects, give a true and fair view, of the financial position of the
organisation at 31 March 2005 and of the results of its operations and cash flows for the year then ended in conformity with
International Financial Reporting Standards.
CHARTERED ACCOUNTANTS (ZIMBABWE)
HARARE
11 July 2005
REPORT OF THE INDEPENDENT AUDITORS

32 S o u t h e r n A f r i c a n P o w e r P o o l 2 0 0 5 A n n u a l R e p o r t 33S o u t h e r n A f r i c a n P o w e r P o o l 2 0 0 5 A n n u a l R e p o r t
SSAAPPPPSSAAPPPP31 MARCH 2005
Notes 2005 2004US$ US$
FUNDS AND LIABILITIES
FUNDSAccumulated funds 3 231 571 275 073Special fund - Norad Grant 4 72 805 543 716General reserve 75 000 50 000
CURRENT LIABILITIESAccounts payable 5 139 470 20 362_________ _________TOTAL LIABILITIES 518 846 889 151_________ __________________ _________
ASSETS
NON-CURRENT ASSETSProperty, plant and equipment 6 29 213 40 220
CURRENT ASSETSAccounts receivable 7 148 225 52 964Cash at bank and on hand- Co-ordination centre funds 268 603 252 251- Special fund - Norad Grant 72 805 543 716_________ _________TOTAL ASSETS 518 846 889 151_________ __________________ _________
E JOHNSONCO-ORDINATION CENTRE BOARD CHAIRPERSON
L MUSABA CO-ORDINATION CENTRE MANAGER
11 July 2005SOUTHERN AFRICAN POWER POOL
BALANCE SHEET
31 MARCH 2005Notes 2005 2004
US$ US$INCOME
OPERATING INCOMEOperating members 69 000 75 000Imported energy 69 000 75 000Peak demand 46 000 50 000Thermal rating 23 000 25 000Host member 23 000 25 000Short Term Energy Market 51 482 42 108Non-member participation fees 30 000 -_________ _________
311 482 292 108_________ _________
OTHER INCOME/EXPENSESSpecial fund - Telecoms Project 392 409 -Sundry income 6 980 -Foreign exchange loss (2 013) (2 646)Foreign exchange difference on fixed assets - (10 699)Interest received
9 856 16 077Profit on disposal of fixed assets 237 -_________ _________
718 951 294 840_________ _________
EXPENDITUREWestcor Project expenses - 1 738 Administration expenses 2 737 453 215 137_________ _________
(DEFICIT)/SURPLUS FOR THE YEARTRANSFERRED TO ACCUMULATED FUND 3 (18 502) 77 965_________ __________________ _________
INCOME STATEMENT

34 S o u t h e r n A f r i c a n P o w e r P o o l 2 0 0 5 A n n u a l R e p o r t 35S o u t h e r n A f r i c a n P o w e r P o o l 2 0 0 5 A n n u a l R e p o r t
SSAAPPPPSSAAPPPP31 MARCH 2005
2005 2004US$ US$
1 ACTIVITIESThe main object of the organisation is to co-ordinate the planning and development of electricity inter-connections between members' respective networks and to expandthe Interconnected Power System and electricity trading in the region.
2 ADMINISTRATIONCleaning 828 18Audit fee- current year annual audit 8 788 1 843- prior year charge 2 430 -- STEM review 2 944 541Advertising and promotions 438 -Bank charges 14 693 7 590Computer expenses 3 086 1 811Consultancy - 2 500Courier and postage 6 602 2 778Depreciation 15 758 19 873Entertainment 379 237Insurance 2 477 953Interest paid 319 210Magazines and books 50 50Printing and stationery 2 211 2 257Recruitment and relocation 656 383Rent paid 12 500 4 488Repairs and maintenance 1 198 346Salaries and wages 194 862 105 664Staff expenses 292 169Staff training 1 737 2 924Subscriptions 405 102Sundry expenses 2 387 1 514Telephone and fax 7 519 2 861Internet 6 092 2 729Travel and accommodation 45 223 25 268Withholding tax on interest 5 1 239Reports and periodicals 7 446 9 650Telecommunications - VSAT Project 396 128 17 139_________ _________TOTAL ADMINISTRATION EXPENSES 737 453 215 137_________ __________________ _________
NOTES TO THE FINANCIAL STATEMENTS
31 MARCH 2005Note 2005 2004
US$ US$
NET CASH INFLOW FROM OPERATING ACTIVITIES 1 11 329 65 377
RETURNS ON INVESTMENTSInterest received 9 856 16 077Interest paid (319) (210)
INVESTING ACTIVITIESCapital expenditure (4 751) (10 602)Disposal of fixed assets 237 - Disposal of investment - 42 188
FINANCING ACTIVITIESGrants received - 543 716Grants utilised/remitted (470 911) - _________ _________(DECREASE)/INCREASE IN CASH RESOURCES 2 (454 559) 656 546 _________ __________________ _________
NOTES TO THE CASH FLOW STATEMENT
1 NET CASH INFLOW/(OUTFLOW) FROM OPERATING ACTIVITIESThis is arrived at as follows:(Deficit)/surplus for the year (18 502) 77 965Depreciation 15 758 19 873Exchange difference on fixed assets - 10 699Interest receivable (9 856) (16 077)Interest payable 319 210(Increase) in accounts receivable (95 261) (27 874)Increase in provisions 41 362 2 876(Decrease)/increase in accounts payable 77 746 (2 295)Profit on sale of fixed assets (237) - _________ _________
11 329 65 377 _________ __________________ _________
2 (DECREASE)/INCREASE IN CASH RESOURCESThe (decrease)/increase in cash resources is represented by a movement in balances, as follows:At 1 April 2004 795 967 139 421At 31 March 2005 341 408 795 967_________ _________
(454 559) 656 546 _________ __________________ _________
CASH FLOW STATEMENT

36 S o u t h e r n A f r i c a n P o w e r P o o l 2 0 0 5 A n n u a l R e p o r t 37S o u t h e r n A f r i c a n P o w e r P o o l 2 0 0 5 A n n u a l R e p o r t
SSAAPPPPSSAAPPPP31 MARCH 2005
2005 2004US$ US$
5 ACCOUNTS PAYABLEProvisions 22 215 11 725United States Agency for International Development (USAID) 30 872 -Other creditors 86 383 8 637_________ _________
139 470 20 362_________ __________________ _________
6 PROPERTY, PLANT AND EQUIPMENT6.1 Summary
Computer equipmentCost 45 091 54 842Aggregate depreciation 36 992 42 427_________ _________Net book value 8 099 12 415_________ _________
Office equipmentCost 20 000 20 000Aggregate depreciation 18 245 14 273_________ _________Net book value 1 755 5 727_________ _________
Office furniture and fittingsCost 35 422 34 536Aggregate depreciation 16 063 12 458_________ _________Net book value 19 359 22 078_________ _________TotalCost 100 513 109 378Aggregate depreciation 71 300 69 158_________ _________Net book value 29 213 40 220_________ __________________ _________
NOTES TO THE FINANCIAL STATEMENTS - CONT.
31 MARCH 20052005 2004US$ US$
3 ACCUMULATED FUNDAt 1 April 2004 275 073 222 108(Deficit)/surplus for the year (18 502) 77 965Transfer to General Reserve (25 000) (25 000)_________ _________At 31 March 2005 231 571 275 073_________ __________________ _________
4 SPECIAL FUND - NORAD GRANTBalance as at 1 April 2004 543 716
Additional advance 04.10.04 297 937
Payments: (769 612)
Nordpool Consulting 21.04.04 (75 465)Nordpool Consulting 28.05.04 (63 848)Nordpool Consulting 08.06.04 (65 500)Nordpool Consulting 07.07.04 (64 187)Nordpool Consulting 06.08.04 (62 200)Nordpool Consulting 09.09.04 (61 307)Shaw Technologies Incorporation (Planning Software) 29.10.04 (69 250)Nordpool Consulting 04.10.04 (61 307)Nordpool Consulting 22.11.04 (63 228)Nordpool Consulting 20.12.04 (52 007)Nordpool Consulting 04.01.05 (35 303)Nordpool Consulting 07.02.05 (35 303)Nordpool Consulting 02.03.05 (35 303)Nordpool Consulting 24.03.05 (17 069)Norwegian Water Resources 17.11.04 ( 8 337)
Bank charges (477)
Interest received 1 241_________Balance as at 31 March 2005 72 805__________________
The goal of the project funded by Norad is to provide least cost, environmentally friendly and affordable energy and increaseaccessibility for rural areas in Southern Africa through the development of a competitive electricity market. The project is expectedto run until 2007.
NOTES TO THE FINANCIAL STATEMENTS - CONT.

39S o u t h e r n A f r i c a n P o w e r P o o l 2 0 0 5 A n n u a l R e p o r t
SSAAPPPP
38 S o u t h e r n A f r i c a n P o w e r P o o l 2 0 0 5 A n n u a l R e p o r t
SSAAPPPPNOTES TO THE FINANCIAL STATEMENTS - CONT. NOTES
31 MARCH 20052005 2004US$ US$
6.2 Movements for the yearNet book value of total property,plant and equipment at 1 April 2004 40 220 60 190_________ _________Capital expenditure - at costComputer equipment 3 866 7 699Office equipment - 93Office furniture and fittings 885 2 810_________ _________
4 751 10 602_________ _________Foreign exchange difference - (10 699)_________ _________
Depreciation chargeComputer equipment 8 182 10 658Office equipment 3 971 3 741Furniture 3 605 5 474_________ _________
15 758 19 873_________ _________
Net book value of total property, plant and equipment at 31 March 2005 29 213 40 220_________ __________________ _________
The foreign exchange difference arose from conversion of the fixed assets bought over the years from Zimbabwe dollars to United States dollars, due to different exchange rates at the date of acquisition of each asset and the balance sheet date.
7 ACCOUNTS RECEIVABLETrade debtors 132 164 39 581United States Agency for International Development (USAID) - 7 943Prepayments 14 371 4 542Other debtors 1 690 898_________ _________
148 225 52 964_________ __________________ _________

40 S o u t h e r n A f r i c a n P o w e r P o o l 2 0 0 5 A n n u a l R e p o r t
SSAAPPPPNOTES