RWE Power’s Coal Innovation Centre › fileadmin › DAM › energy › se › pp › ... ·...
29
RWE Power’s Coal Innovation Centre at Niederaussem, Germany Dr. Peter Moser Emission Reduction Technologies RWE Power AG UNECE 20./21.10.2014, Geneva
Transcript of RWE Power’s Coal Innovation Centre › fileadmin › DAM › energy › se › pp › ... ·...

RWE Power’s Coal Innovation Centre
at Niederaussem, Germany
Dr. Peter Moser
Emission Reduction Technologies
RWE Power AG
UNECE
20./21.10.2014, Geneva

RWE Power AG, POR-FE 20./21.10.2014 Page 2
Coal Innovation Center Niederaussem
FGDplus
Since 2009
→ SO2/Dust-Mitigation
Power-to-Gas
2013
→ Energy Storage
WTA®-Drier since late 2008
→ Efficiency enhancement
CO2-Scrubber since 2009
→ CO2-Capture
CO2-Filling station since 2011
→ CO2-Utilisation
Catalyst testing
since 2013
→ CO2 usage

RWE Power AG, POR-FE 20./21.10.2014 Page 3
Coal Innovation Center Niederaussem
Power plant
Capture Plant
Flue gas, raw lignite
Lignite
Pre-drying WTA®
Flue gas, dry lignite
Lignite combustion Flue gas pre-treatment Post-combustion
capture Conventional FGD
Dust dosing
SO2/SO3 dosing
FGDplus
Wet ESP
CO2
CO2-lean flue gas
RWE Power AG, POR-FE 20./21.10.2014 Page 4
1 WTA
2 FGDplus
3 CO2 Capture and Utilisation
Selected R&D projects
RWE Power AG, POR-FE 20./21.10.2014 Page 5
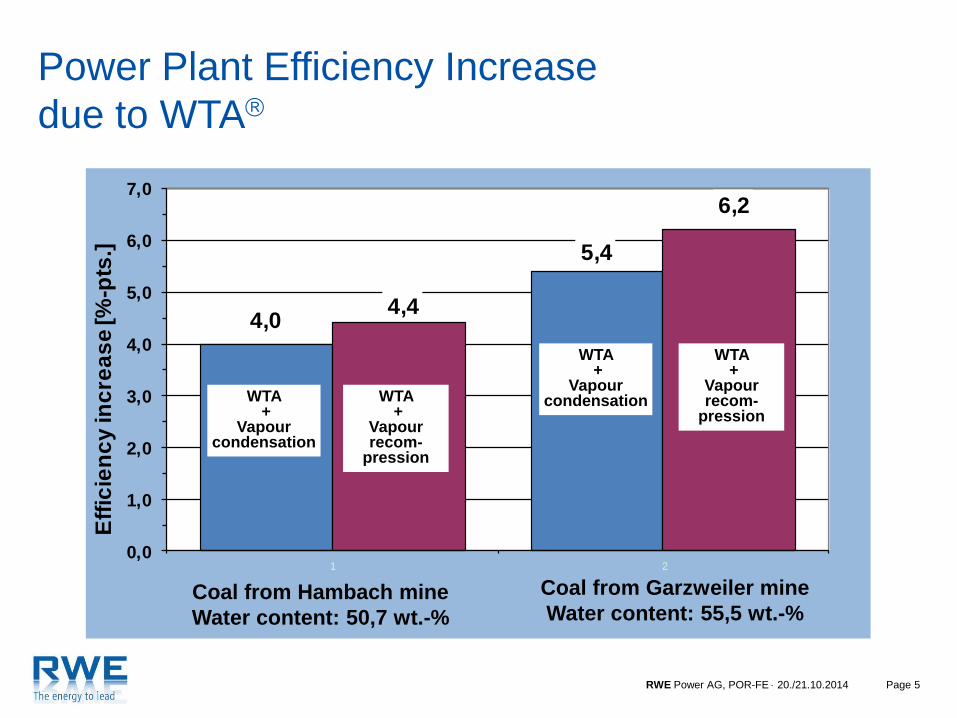
4,0
5,4
4,4
6,2
0,0
1,0
2,0
3,0
4,0
5,0
6,0
7,0
1 2
Eff
icie
nc
y in
cre
as
e [%
-pts
.]
Coal from Hambach mine
Water content: 50,7 wt.-%
Coal from Garzweiler mine
Water content: 55,5 wt.-%
WTA +
Vapour condensation
WTA +
Vapour recom-
pression
WTA +
Vapour condensation WTA
+ Vapour recom-
pression
Power Plant Efficiency Increase
due to WTA
RWE Power AG, POR-FE 20./21.10.2014 Page 6
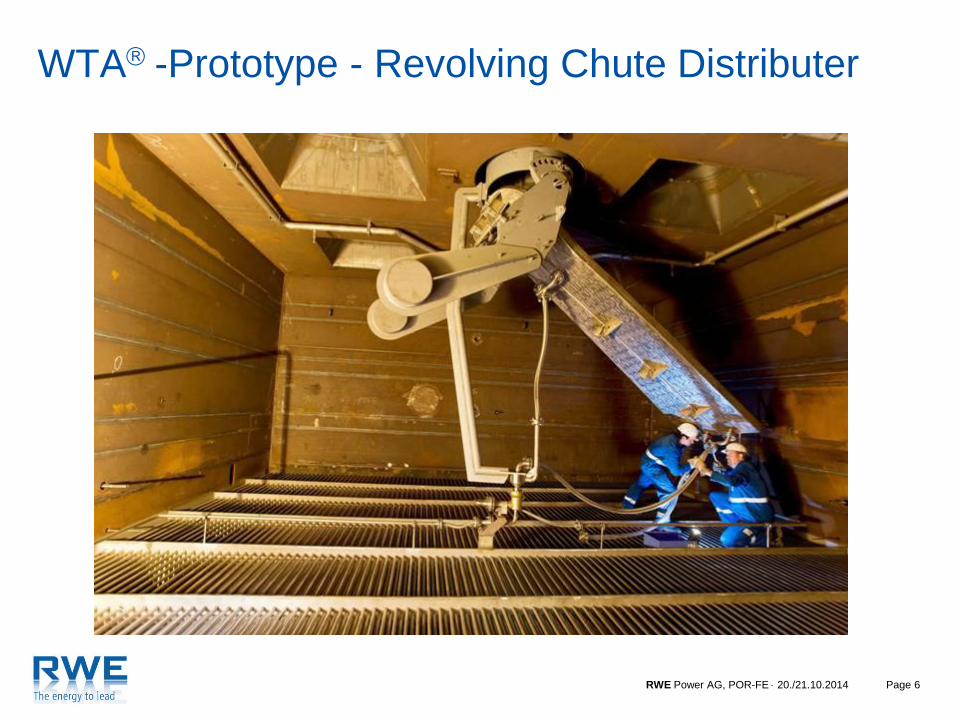
WTA -Prototype - Revolving Chute Distributer
RWE Power AG, POR-FE 20./21.10.2014 Page 7
1 WTA
2 FGDplus
3 CO2 Capture and Utilisation
Selected R&D projects
RWE Power AG, POR-FE 20./21.10.2014
RWE Power AG, POR-FE 20./21.10.2014 Page 8
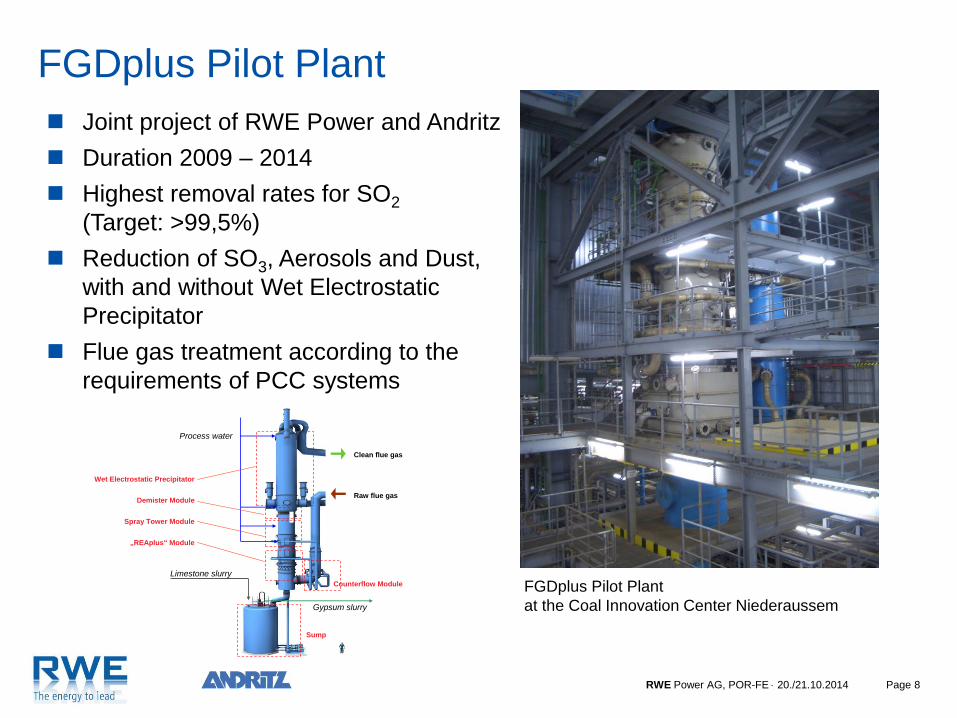
FGDplus Pilot Plant Joint project of RWE Power and Andritz
Duration 2009 – 2014
Highest removal rates for SO2
(Target: >99,5%)
Reduction of SO3, Aerosols and Dust,
with and without Wet Electrostatic
Precipitator
Flue gas treatment according to the
requirements of PCC systems
FGDplus Pilot Plant
at the Coal Innovation Center Niederaussem
Raw flue gas
Clean flue gas
Gypsum slurry
Process water
Limestone slurry
Sump
Counterflow Module
„REAplus“ Module
Spray Tower Module
Wet Electrostatic Precipitator
Demister Module
RWE Power AG, POR-FE 20./21.10.2014 Page 9
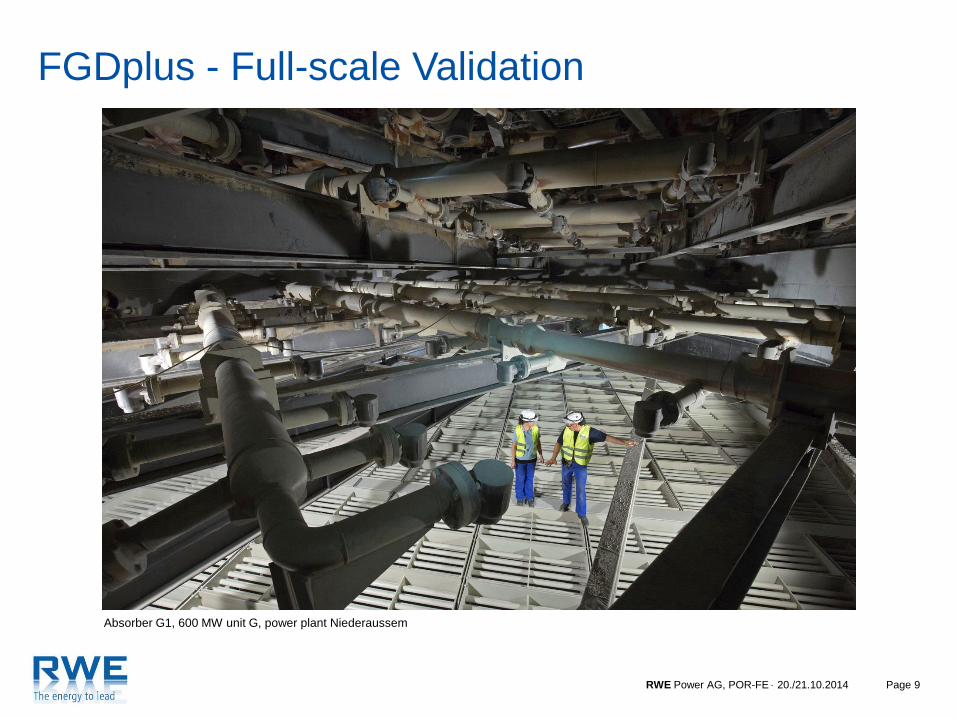
FGDplus - Full-scale Validation
Absorber G1, 600 MW unit G, power plant Niederaussem
RWE Power AG, POR-FE 20./21.10.2014 Page 10
1 WTA
2 FGDplus
3 CO2 Capture and Utilisation
Selected R&D projects
RWE Power AG, POR-FE 20./21.10.2014
PAGE 11 RWE Power AG, POR-FE 20./21.10.2014
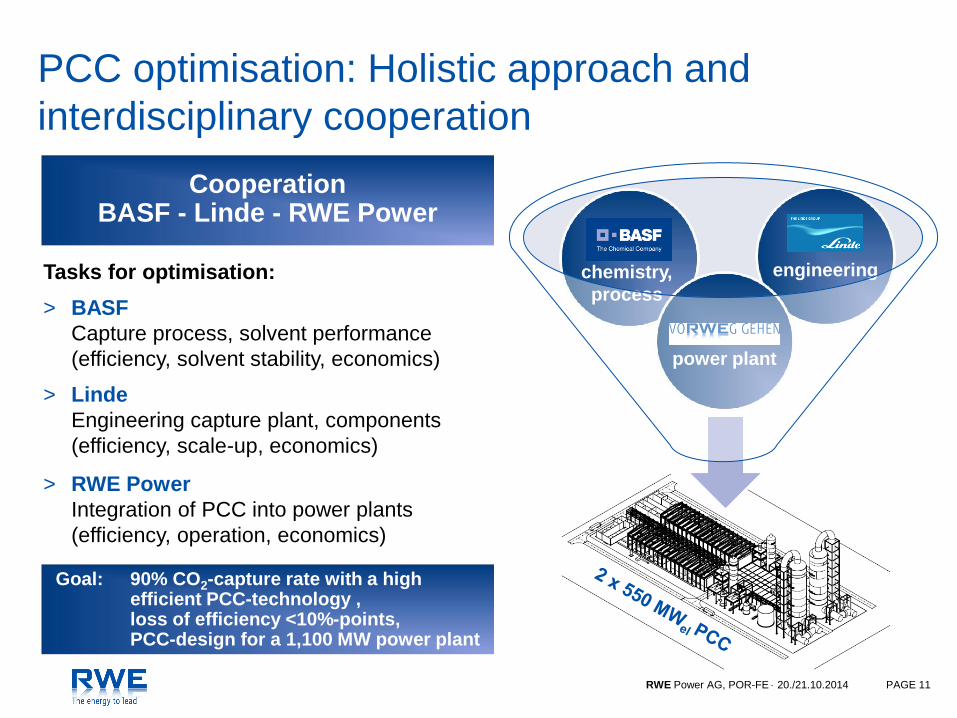
PCC optimisation: Holistic approach and
interdisciplinary cooperation
Cooperation BASF - Linde - RWE Power
chemistry,
process
engineering
Goal: 90% CO2-capture rate with a high efficient PCC-technology , loss of efficiency <10%-points, PCC-design for a 1,100 MW power plant
Tasks for optimisation:
> BASF
Capture process, solvent performance
(efficiency, solvent stability, economics)
> Linde
Engineering capture plant, components
(efficiency, scale-up, economics)
> RWE Power
Integration of PCC into power plants
(efficiency, operation, economics)
power plant

Page 12 RWE Power AG, POR-FE 20./21.10.2014
Solvent regeneration
CO2-capture Flue gas cooling,
SO2-pre scrubbing CO2
Desorber
Flue gas
Absorber Prescrubber
CO2-lean
flue gas
NaOH
solution tank Solvent tank
CO2 Capture Pilot Plant at Niederaussem
Flue gas: 1,550 m3N/h Availability: 97%
CO2 product: 7.2 tCO2/day; capture rate 90% Budget of RWE for phases I/II/III: 20 Mio. €
Absorber height corresponds to full scale 40% funding by the Federal Ministry of
Instrumentation: 275 measuring points Economics and Technology
RWE Power AG, POR-FE 20./21.10.2014 Page 13
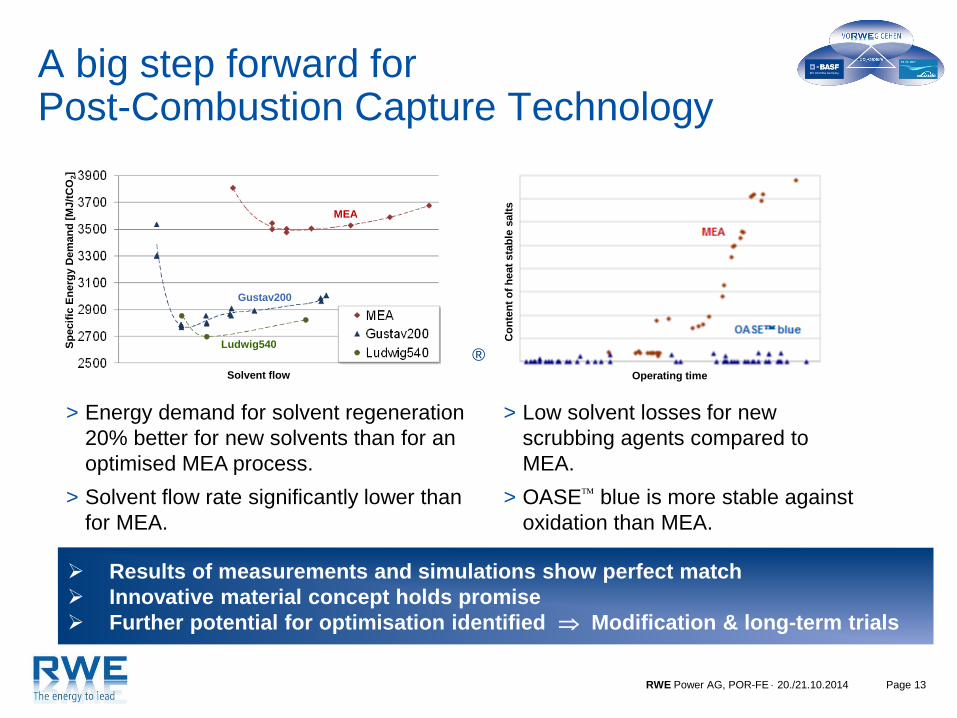
A big step forward for Post-Combustion Capture Technology
Results of measurements and simulations show perfect match
Innovative material concept holds promise
Further potential for optimisation identified Modification & long-term trials
MEA
Ludwig540
> Energy demand for solvent regeneration
20% better for new solvents than for an
optimised MEA process.
> Solvent flow rate significantly lower than
for MEA.
> Low solvent losses for new
scrubbing agents compared to
MEA.
> OASE blue is more stable against
oxidation than MEA.
Operating time
Co
nte
nt
of
he
at
sta
ble
salt
s
Solvent flow
Sp
ecif
ic E
ne
rgy D
em
an
d [
MJ/t
CO
2]
Gustav200
®

RWE Power AG, POR-FE 20./21.10.2014 Page 14
Test run history with OASE blue
0
3000
6000
9000
12000
15000
18000
21000
24000
0
1000
2000
3000
4000
5000
6000
7000
8000
Betr
ieb
sze
it O
AS
E b
lue [
h],
Wasch
mit
telf
luss [
-]
Ab
ge
tren
nte
s C
O2
[t],
Leis
tun
g B
l. K
[M
W]
OASE blue Versuchszeit [h]
CO2
Pel
Solvent circulation
OASE® blueoperating time
Time of the trial phase with the solvent OASE® blue [h]
Cap
ture
dC
O2
[t],
Po
wer
ou
tpu
tB
l. K
[M
W]
OA
SE
®b
lue o
pera
tin
g t
ime [
h],
So
lven
t cir
cu
lati
on
[-]
More than 24,000 h operating time with OASE® blue provide reliable results

Page 15 RWE Power AG, POR-FE 20./21.10.2014
Change of the Packing in the Absorber Column Smaller column design is possible

Page 16 RWE Power AG, POR-FE 20./21.10.2014
Emission Mitigation „Dry Bed”
Reduction of amine emissions by an order of magnitude: Process configuration
„Dry Bed“
1 3 5 7 9 11 13 15 17 19 21 23 25 27
Am
ink
on
ze
ntr
ati
on
Zeit [Tage]
Absorber
Flue gas
Long column short column & „Dry Bed"
Absorber
Flue gas
„Dry Bed"
Make-up
Wasser
Am
ine
Co
nc
en
tra
tio
n
Time [days]

RWE Power AG, POR-FE 20./21.10.2014 Page 17
Emission Reduction by Upstream Measure OASE blue run
Reduction of amine emissions by an order of magnitude: Process configuration
„Upstream Measure“
RWE Power AG, POR-FE 20./21.10.2014 Page 18
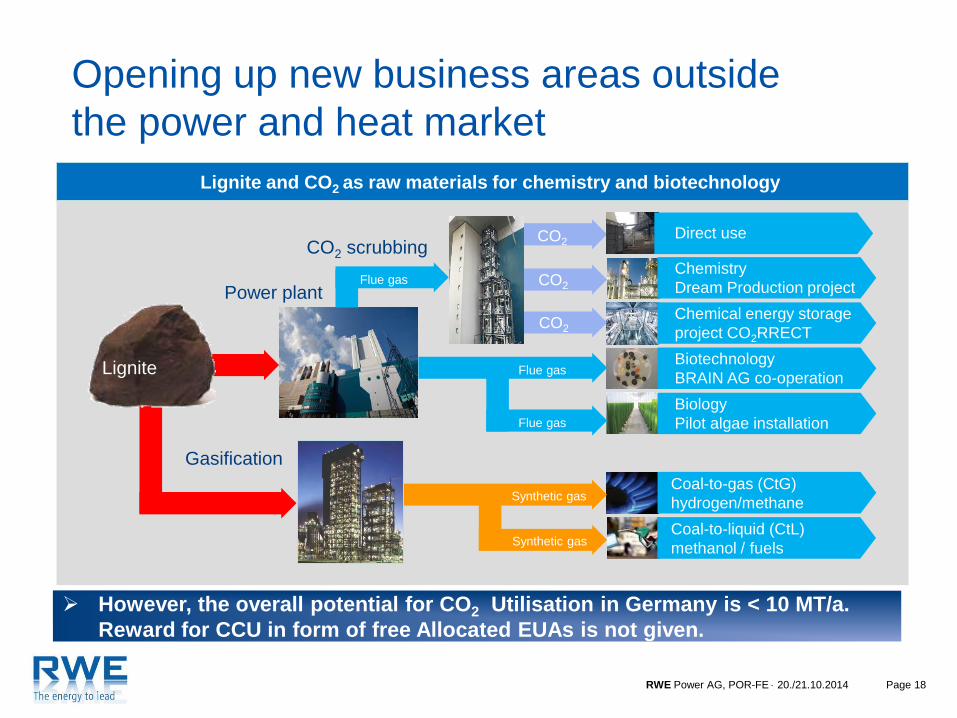
Lignite and CO2 as raw materials for chemistry and biotechnology
Power plant
CO2 CO2 scrubbing
CO2
CO2
Flue gas
Flue gas
Flue gas
Coal-to-gas (CtG)
hydrogen/methane
Coal-to-liquid (CtL)
methanol / fuels
Lignite
Direct use
Chemistry
Dream Production project
Biotechnology
BRAIN AG co-operation
Chemical energy storage
project CO2RRECT
Biology
Pilot algae installation
Gasification
Synthetic gas
Synthetic gas
Opening up new business areas outside
the power and heat market
However, the overall potential for CO2 Utilisation in Germany is < 10 MT/a.
Reward for CCU in form of free Allocated EUAs is not given.
Challenges for Power Generation
and CCS at Germany
Dr. Peter Moser
RWE Power AG
UNECE
20./21.10.2014, Geneva

RWE Power AG, POR-FE 20./21.10.2014 Page 20
To be considered:
Deployment
potential of
renewables
Security of supply
and power quality
Price development
Grid stability and
grid extension 25%
17%
58%
80 %
20 %
(EWI/Prognos/GWS Studie)
2020 2030 2040 2050 2010
10%
conventional
generation
renewables
import
demand reduction
45%
20%
25%
gross power generation
Power Generation Sector to Realize Highest Contribution to match goals of government‘s „Energy Concept“

Page21 RWE Power AG, POR-FE 20./21.10.2014
In Germany a dramatically increasing Asymmetry
between Demand and Supply is expected
- -
++
++
Offshore-Wind
Conventional PP
New-Builds
Nuclear PP
decommissioning
!
!
!
Regional Power Balance 2008 Regional Power Balance 2030 Source: Amprion
Some pumped
hydro feasible
No pumped
hydro feasible, but
salt deposits exist
Power [MW] Power [MW]

Page22 RWE Power AG, POR-FE 20./21.10.2014
Dramatic Changes of Wind Power Output
Datenquelle: ISET
0
2.000
4.000
6.000
8.000
10.000
12.000
14.000
16.000
18.000
20.000
02.02. 03.02. 04.02. 05.02. 06.02. 07.02.
2009
Win
d P
ow
er
[MW
]
I. high fluctuation between 0 - 85% of installed power
II. High power gradients
III. back up for longer calm weather required
Pumped Hydro Capacity in Germany
(approx. 40 GWh)
Feb 2009
Initial strong wind phase
Several days of calm &
foggy weather with very
low temperatures
(inversion weather)
Peak residential heating
demand
Whole Germany was
affected
Installed Wind Power 2009: 25 GW
When doubling installed capacity until 2020 to 50 GW:
grid enforcement required, but alone not sufficient to solve the problem
existing storage capacity too low
at least 90% of demand as back-up required by conv. power plants
focus on NG (CC & OCGT) appears to be very risky

Page23 RWE Power AG, POR-FE 20./21.10.2014
Dec
Periods of Calm Wind happen regularly (Pel_wind<10%Pinst.)
Sep
calm wind period 10-12 days calm wind period > 12 days
Definition of
Calm wind day:
Calender day with
wind power
generation of less
than 10% of
installed wind
power generators
1990
Mar
1995 2000 2005 2010
Jun
Jahr
Month
Feb
Jan
Apr
May
Jul
Aug
Oct
Nov
Experience made during more than 20 years (1989 to 2010)

Page24 RWE Power AG, POR-FE 20./21.10.2014
0.0
20.0
40.0
60.0
80.0
100.0
GW residual load 2050
Properties of conventional Power Plants will
need to change
large power plant fleet, three different
dispatch schemes:
base load power plant
mid load power plant
peak load power plant
High efficiency at nominal power
Still large power plant fleet, three different
dispatch schemes:
fast load gradients
Low min load and many load changes
Good efficiency over wide load range
6. KW 7. KW 8. KW 9. KW 6. KW 7. KW 8. KW 9. KW
future up to now
0.0
20.0
40.0
60.0
80.0
100.0
GW residual load 2008
Page25 RWE Power AG, POR-FE 20./21.10.2014
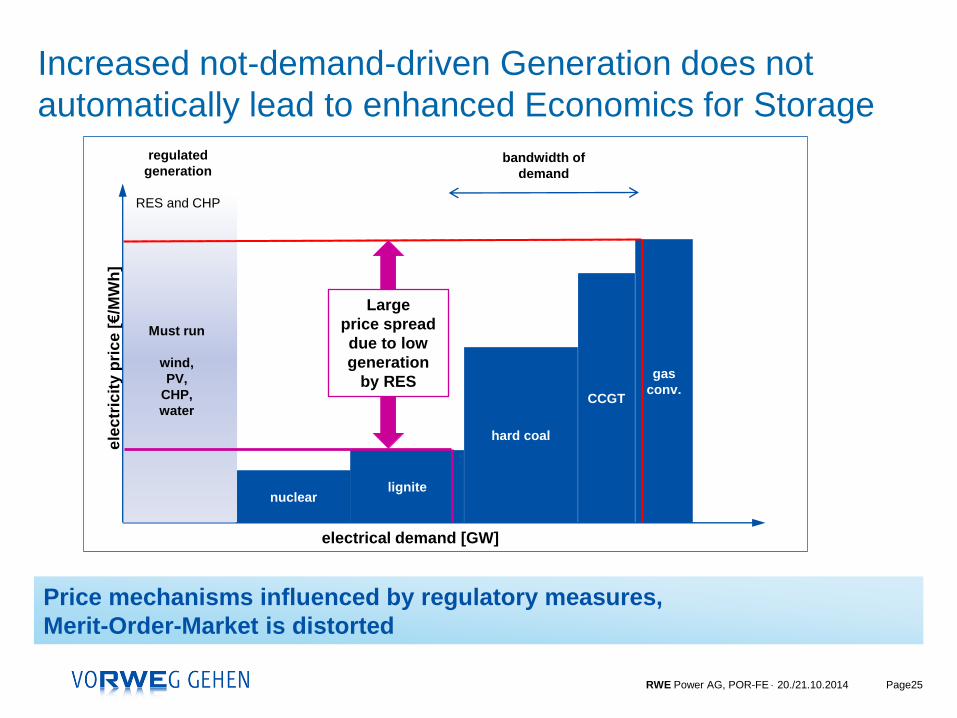
Increased not-demand-driven Generation does not
automatically lead to enhanced Economics for Storage e
lec
tric
ity p
ric
e [
€/M
Wh
]
nuclear lignite
hard coal
CCGT
gas
conv.
electrical demand [GW]
regulated
generation
RES and CHP
Must run
wind,
PV,
CHP,
water
bandwidth of
demand
Price mechanisms influenced by regulatory measures,
Merit-Order-Market is distorted
Large
price spread
due to low
generation
by RES

Page26 RWE Power AG, POR-FE 20./21.10.2014
ele
ctr
icit
y p
ric
e [
€/M
Wh
]
nuclear lignite
hard coal
electrical demand [GW]
regulated
generation
RES and CHP
Must run
wind,
PV,
CHP,
water
bandwidth of
demand
Price mechanisms influenced by regulatory measures,
Merit-Order-Market is distorted
lowered
peak-price
lowered
price spread
Increased not-demand-driven Generation does not
automatically lead to enhanced Economics for Storage

Page27 RWE Power AG, POR-FE 20./21.10.2014
In summer time residual load is more even due to PV price drop, no price spread
PV cuts at Noon Peak of residual Load and Price

Page28 RWE Power AG, POR-FE 20./21.10.2014
NG power plants first to be decommissioned; a reasonable CO2-Price will not change this
Though: Due to lower CO2 foot print, NG plants planned to be complementary to RES in the
government’s Energy Concept
Consequence for Natural gas-fired Power Plants:
Dramatically reduced Operation
Comparison of the dispatch of a 400 MW NG-combi-plant (topping GT + gas fired boiler) 2009 vs 2011
dispatch June/July 2009 dispatch June/July 2009

Thank you for your attention!