RWE Capital Market Day · any of its affiliates assumes any obligations to update any...
105
RWE Capital Market Day London, 28 March 2017
Transcript of RWE Capital Market Day · any of its affiliates assumes any obligations to update any...

RWE Capital Market Day
London, 28 March 2017

2 RWE AG | Capital Market Day | London, 28 March 2017
Disclaimer
This document contains forward-looking statements. These statements are based on the current
views, expectations, assumptions and information of the management, and are based on infor-
mation currently available to the management. Forward-looking statements shall not be construed
as a promise for the materialisation of future results and developments and involve known and
unknown risks and uncertainties. Actual results, performance or events may differ materially from
those described in such statements due to, among other things, changes in the general economic
and competitive environment, risks associated with capital markets, currency exchange rate
fluctuations, changes in international and national laws and regulations, in particular with respect
to tax laws and regulations, affecting the Company, and other factors. Neither the Company nor
any of its affiliates assumes any obligations to update any forward-looking statements.
3 RWE AG | Capital Market Day | London, 28 March 2017
Management team attending today
RWE AG
Markus Krebber
CFO
Rolf Martin Schmitz
CEO
Power Generation Supply & Trading
Frank Weigand
CFO
Roger Miesen
CTO
Hard Coal,
Gas, Biomass,
Nuclear
Lars Kulik
CTO
Lignite
Tom Glover
CCO
Commercial
Asset
Optimisation
Andree
Stracke
CCO
Origination &
Gas Supply
Michael Müller
CFO
Peter Krembel
CCO
Trading

4 RWE AG | Capital Market Day | London, 28 March 2017
Today’s agenda
I.
II.
III.
IV.
V.
VI.
Financial highlights
European Power
Strategic outlook
Lignite & Nuclear
Commercial Asset Optimisation
Supply & Trading
Rolf Martin Schmitz
Markus Krebber
Frank Weigand
Andree Stracke
Roger Miesen
Tom Glover

5 RWE AG | Capital Market Day | London, 28 March 2017
Committed to value creation and sustainable dividend with upside potential
Investment highlights
Leading integrated European generation and trading business
Strong track record of operational excellence and commercial optimisation
Well placed to benefit from fundamental changes in energy markets
Solid financial position and focus on cash flow generation
✔
✔
✔
✔
✔

Strategic outlook
Leading provider of security of supply
with attractive positioning for future market
developments
Rolf Martin Schmitz
Chief Executive Officer
RWE AG

7 RWE AG | Capital Market Day | London, 28 March 2017
Continuing to actively shape our future
Lignite &
Nuclear
European
Power
Supply &
Trading innogy
Portfolio management Operating business
Operational focus Financial investment
8 RWE AG | Capital Market Day | London, 28 March 2017
8.5
GW
26.3
GW
5.4
GW
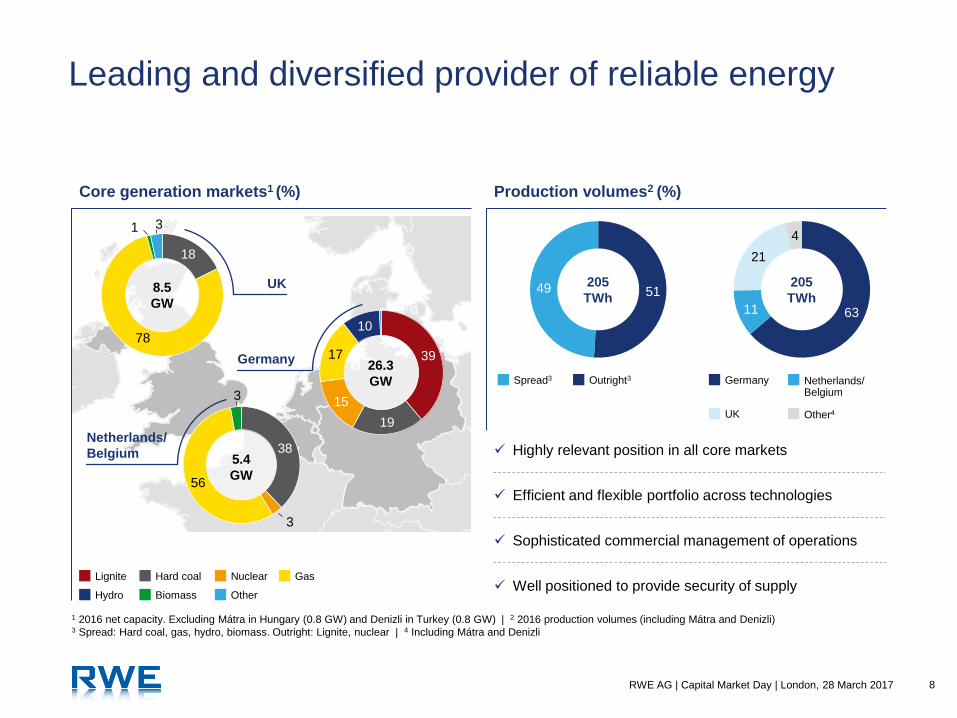
Leading and diversified provider of reliable energy
Core generation markets1 (%) Production volumes2 (%)
1 2016 net capacity. Excluding Mátra in Hungary (0.8 GW) and Denizli in Turkey (0.8 GW) | 2 2016 production volumes (including Mátra and Denizli) 3 Spread: Hard coal, gas, hydro, biomass. Outright: Lignite, nuclear | 4 Including Mátra and Denizli
18
78
1 3
39
19
15
17
10
38
3
56
3
Netherlands/
Belgium
UK
Germany
51 49
63 11
21
4
205
TWh
205
TWh
Lignite Hard coal Nuclear Gas
Hydro Biomass Other
Spread3 Outright3 Germany Netherlands/ Belgium
UK Other4
Highly relevant position in all core markets
Efficient and flexible portfolio across technologies
Sophisticated commercial management of operations
Well positioned to provide security of supply
9 RWE AG | Capital Market Day | London, 28 March 2017
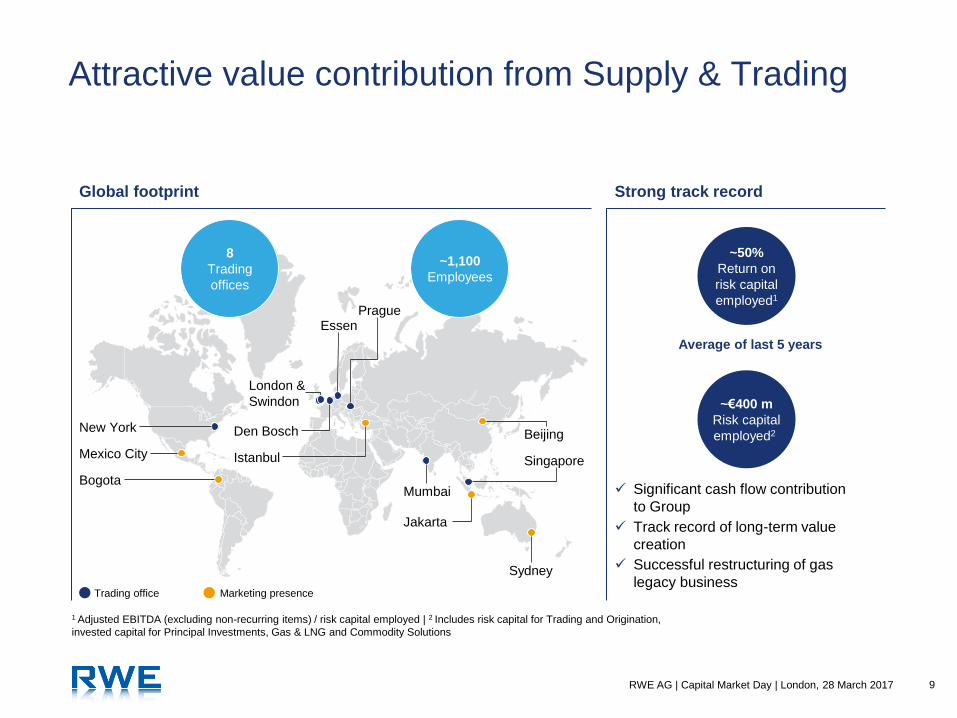
Attractive value contribution from Supply & Trading
London &
Swindon
Den Bosch
Essen Prague
Istanbul
Beijing
Mumbai
Singapore
Jakarta
Trading office Marketing presence
Sydney
New York
Mexico City
Bogota
1 Adjusted EBITDA (excluding non-recurring items) / risk capital employed | 2 Includes risk capital for Trading and Origination,
invested capital for Principal Investments, Gas & LNG and Commodity Solutions
Global footprint Strong track record
~50%
Return on
risk capital
employed1
~€400 m
Risk capital
employed2
~1,100
Employees
8
Trading
offices
Average of last 5 years
Significant cash flow contribution
to Group
Track record of long-term value
creation
Successful restructuring of gas
legacy business
10 RWE AG | Capital Market Day | London, 28 March 2017
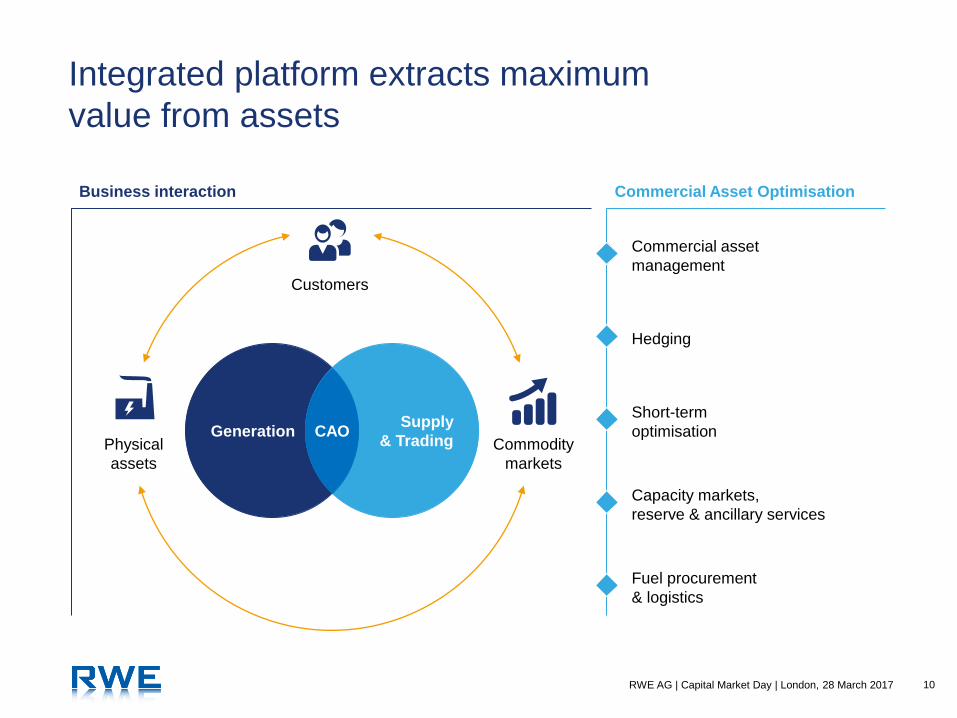
Integrated platform extracts maximum
value from assets
Generation Supply
& Trading CAO
Customers
Physical
assets
Commodity
markets
Commercial asset
management
Hedging
Short-term
optimisation
Capacity markets,
reserve & ancillary services
Fuel procurement
& logistics
Business interaction Commercial Asset Optimisation
11 RWE AG | Capital Market Day | London, 28 March 2017
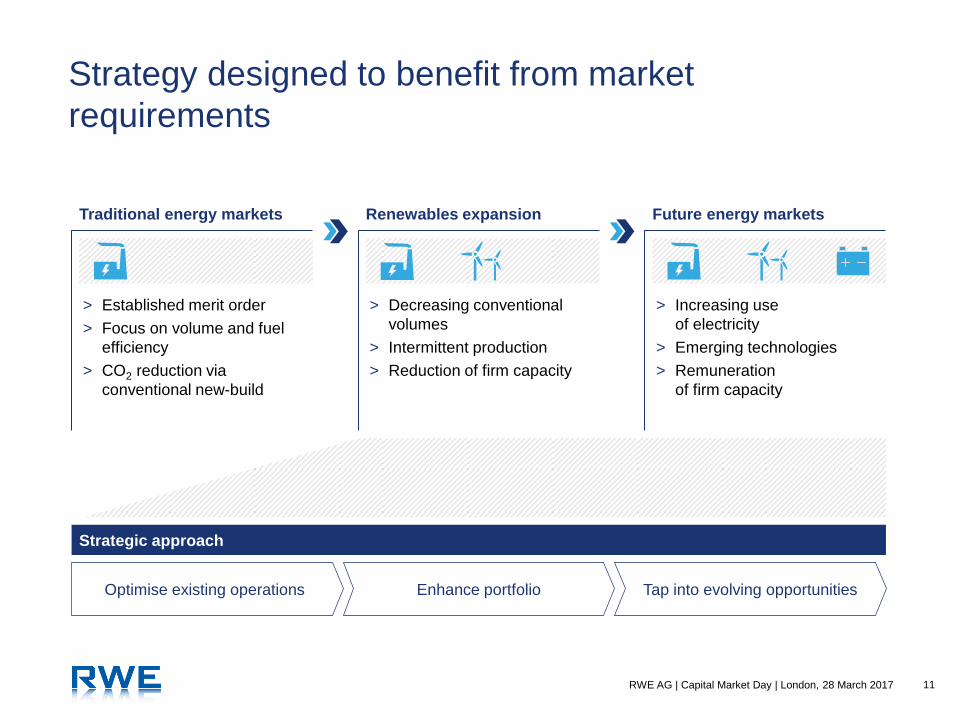
Strategy designed to benefit from market
requirements
Traditional energy markets Renewables expansion Future energy markets
> Established merit order
> Focus on volume and fuel
efficiency
> CO2 reduction via
conventional new-build
> Decreasing conventional
volumes
> Intermittent production
> Reduction of firm capacity
> Increasing use
of electricity
> Emerging technologies
> Remuneration
of firm capacity
Strategic approach
Optimise existing operations Enhance portfolio Tap into evolving opportunities
12 RWE AG | Capital Market Day | London, 28 March 2017
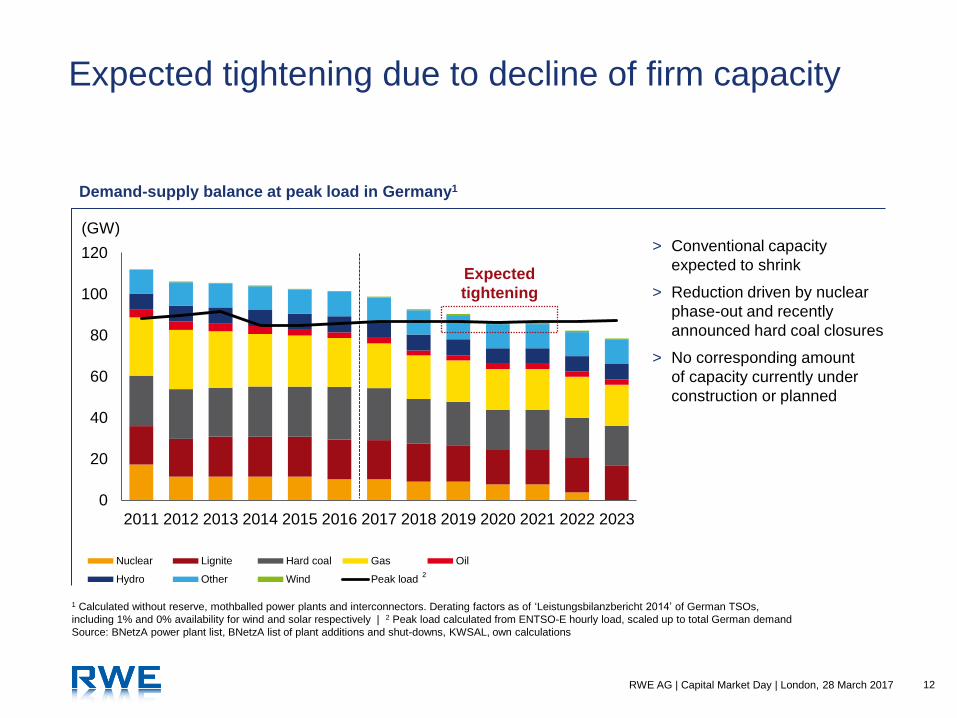
Expected tightening due to decline of firm capacity
1 Calculated without reserve, mothballed power plants and interconnectors. Derating factors as of ‘Leistungsbilanzbericht 2014’ of German TSOs,
including 1% and 0% availability for wind and solar respectively | 2 Peak load calculated from ENTSO-E hourly load, scaled up to total German demand
Source: BNetzA power plant list, BNetzA list of plant additions and shut-downs, KWSAL, own calculations
Demand-supply balance at peak load in Germany1
0
20
40
60
80
100
120
2011 2012 2013 2014 2015 2016 2017 2018 2019 2020 2021 2022 2023
Nuclear Lignite Hard coal Gas Oil
Hydro Other Wind Peak load
> Conventional capacity
expected to shrink
> Reduction driven by nuclear
phase-out and recently
announced hard coal closures
> No corresponding amount
of capacity currently under
construction or planned
Expected
tightening
(GW)
2

13 RWE AG | Capital Market Day | London, 28 March 2017
Increasing reliance on intermittent renewables
and interconnectors risks security of supply
0
20
40
60
80
100
20
09/1
0
20
10/1
1
20
11/1
2
20
12/1
3
20
13/1
4
20
14/1
5
20
15/1
6
(GW)
16% 21% 19% 2% 11% 2%
LOLE1 < 1h LOLE1 > 1h (conservative assumptions)
LOLE1 > 1h
(Winter
period)
24%
To be covered
by firm capacity
> Often very low wind and PV production at times of highest load
> Only 1% of German wind and PV capacity regarded as firm by
German TSOs (for system stability considerations)
> Interconnectors can only contribute if surrounding countries
have sufficient spare capacities
> German situation aggravated by tighter demand-supply
situation in neighbouring countries
1 Loss of Load Expectation: Expected number of hours where load cannot be supplied by local resources and imports | Source: Entso-E Mid term adequacy forecast 2016
German renewables production (at peak load) Loss of load expectation1 in Europe 2025
Wind and PV at peak load Peak load
Wind and PV supply as % of peak load
14 RWE AG | Capital Market Day | London, 28 March 2017
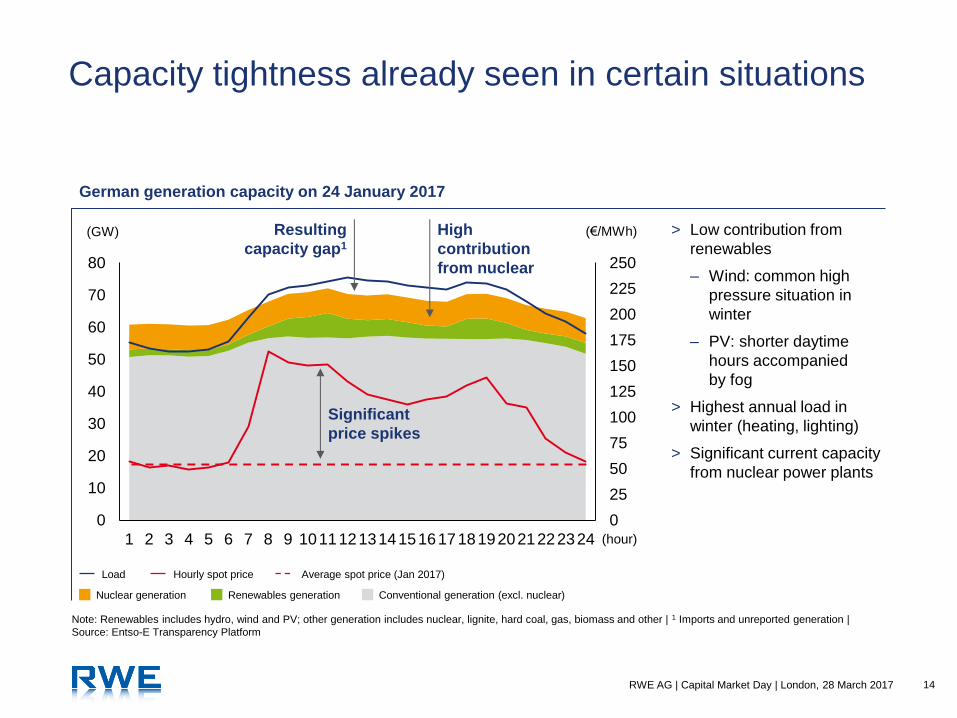
Capacity tightness already seen in certain situations
(GW) (€/MWh)
0
25
50
75
100
125
150
175
200
225
250
0
10
20
30
40
50
60
70
80
1 2 3 4 5 6 7 8 9 101112131415161718192021222324 (hour)
Resulting
capacity gap1
High
contribution
from nuclear
Significant
price spikes
> Low contribution from
renewables
– Wind: common high
pressure situation in
winter
– PV: shorter daytime
hours accompanied
by fog
> Highest annual load in
winter (heating, lighting)
> Significant current capacity
from nuclear power plants
German generation capacity on 24 January 2017
Load
Note: Renewables includes hydro, wind and PV; other generation includes nuclear, lignite, hard coal, gas, biomass and other | 1 Imports and unreported generation |
Source: Entso-E Transparency Platform
Hourly spot price Average spot price (Jan 2017)
Nuclear generation Renewables generation Conventional generation (excl. nuclear)
15 RWE AG | Capital Market Day | London, 28 March 2017
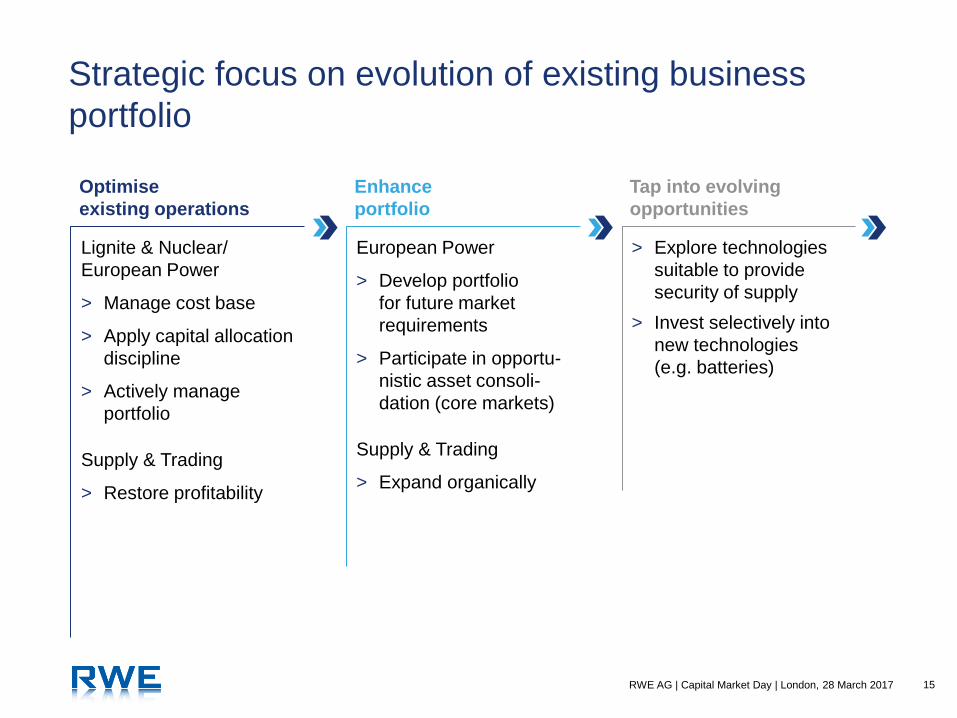
Strategic focus on evolution of existing business
portfolio
Optimise
existing operations
Enhance
portfolio
Tap into evolving
opportunities
Lignite & Nuclear/
European Power
> Manage cost base
> Apply capital allocation
discipline
> Actively manage
portfolio
Supply & Trading
> Restore profitability
European Power
> Develop portfolio
for future market
requirements
> Participate in opportu-
nistic asset consoli-
dation (core markets)
Supply & Trading
> Expand organically
> Explore technologies
suitable to provide
security of supply
> Invest selectively into
new technologies
(e.g. batteries)

16 RWE AG | Capital Market Day | London, 28 March 2017
Well positioned to optimise cash flows from
operations
RWE’s competitive success factors
> Modern and restructured
asset base
> Established infrastructure
at attractive locations
> Highly skilled workforce
> Efficient and flexible operations
> Strong track record
of cost reductions
> Proven commercial optimisation
> Existing portfolio across
all reliable technologies
> Proven system capabilities
> Excellent market knowledge
Asset base
and sites
Operational and
commercial excellence
Technological
expertise and know-how
Management of complex technological and commercial interdependencies
Assessment of market developments and active stakeholder management
Creation of optionality with respect to commercialisation of emerging technologies
17 RWE AG | Capital Market Day | London, 28 March 2017
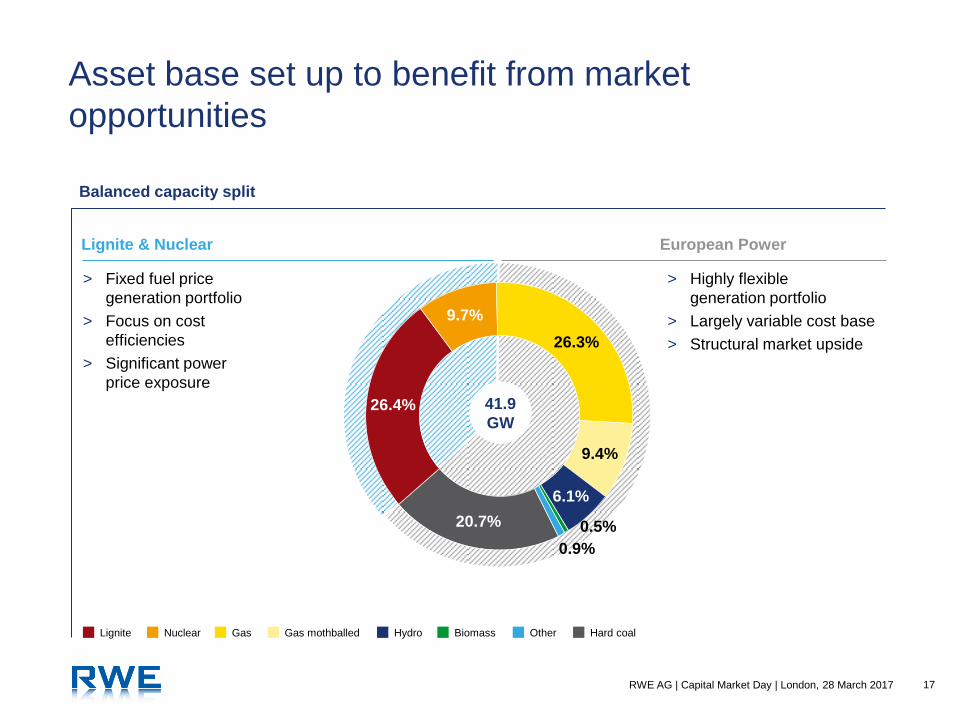
Nuclear
20.7%
26.4%
9.7%
26.3%
9.4%
6.1%
0.5%
0.9%
Asset base set up to benefit from market
opportunities
Lignite Hard coal Gas Gas mothballed Biomass Other Hydro
Balanced capacity split
Lignite & Nuclear European Power
> Highly flexible
generation portfolio
> Largely variable cost base
> Structural market upside
> Fixed fuel price
generation portfolio
> Focus on cost
efficiencies
> Significant power
price exposure
41.9
GW

18 RWE AG | Capital Market Day | London, 28 March 2017
Ongoing cost reduction and active portfolio
measures
4.3 4.0 3.8 3.7
3.4 3.1
2012 2013 2014 2015 2016
1.4
3.2
Shut-
down
11.5
Contract
termination
3.9
Moth-
balled
Total
3.0
Target
2019
Conventional power generation
> Systematic cash flow analysis on plant-by-plant
level
> Disciplined decision making process (watch list)
> PPAs re-negotiated to reduce cash burden
> Focus on total cash costs (opex and capex)
> Additional measures being implemented
– Organisational optimisations
– Continuous process optimisations
– Reduced service levels
(€ bn)
Operational cash cost development1 Active portfolio measures
Since 2012 (GW)
1 Opex and capex excluding large projects
Lignite
stand-by
reserve
19 RWE AG | Capital Market Day | London, 28 March 2017
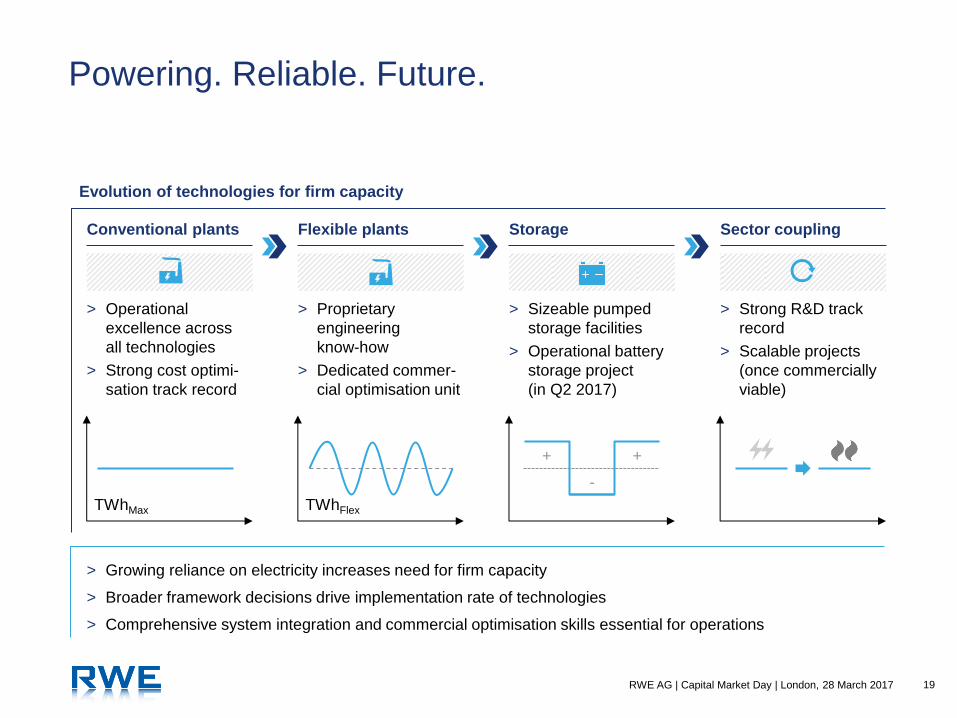
Powering. Reliable. Future.
Evolution of technologies for firm capacity
Conventional plants Flexible plants Storage Sector coupling
> Operational
excellence across
all technologies
> Strong cost optimi-
sation track record
> Proprietary
engineering
know-how
> Dedicated commer-
cial optimisation unit
> Sizeable pumped
storage facilities
> Operational battery
storage project
(in Q2 2017)
> Strong R&D track
record
> Scalable projects
(once commercially
viable)
TWhMax TWhFlex
+ +
-
> Growing reliance on electricity increases need for firm capacity
> Broader framework decisions drive implementation rate of technologies
> Comprehensive system integration and commercial optimisation skills essential for operations

20 RWE AG | Capital Market Day | London, 28 March 2017
Value-maximising management of innogy stake
Cash flow-focused and value-maximising strategy
Leading provider of firm capacity in core markets
Continued efficiency improvements and active management of assets
Well positioned to benefit from tightening markets
Attractive returns and organic growth options in Supply & Trading
✔
✔
✔
✔
✔

Financial highlights
Long-term value creation through strict focus on
cash flows and active portfolio management
Markus Krebber
Chief Financial Officer
RWE AG
22 RWE AG | Capital Market Day | London, 28 March 2017
Clear financial management principles
Strict focus on cash flows and transparent financial disclosure
Disciplined capital allocation and active portfolio management
Sustainable dividend policy with upside potential
23 RWE AG | Capital Market Day | London, 28 March 2017
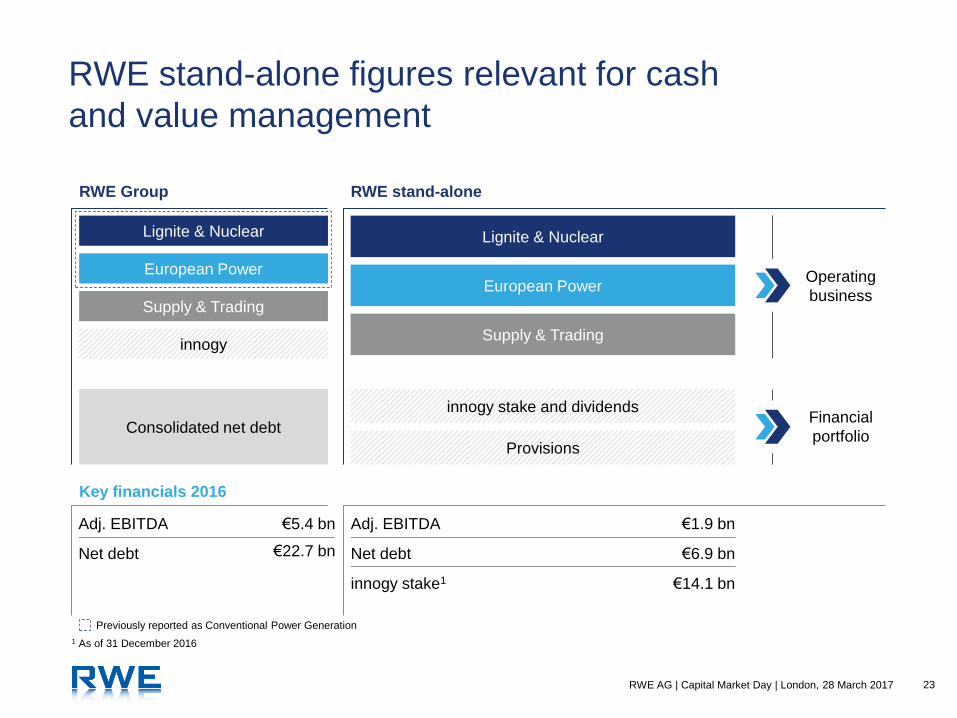
RWE stand-alone figures relevant for cash
and value management
Lignite & Nuclear
Supply & Trading
innogy
European Power
Lignite & Nuclear
Supply & Trading
European Power
Consolidated net debt
innogy stake and dividends
Provisions
Operating
business
Financial
portfolio
Adj. EBITDA
Net debt
Adj. EBITDA
Net debt
innogy stake1
RWE Group RWE stand-alone
1 As of 31 December 2016
Previously reported as Conventional Power Generation
Key financials 2016
€5.4 bn
€22.7 bn
€1.9 bn
€6.9 bn
€14.1 bn
24 RWE AG | Capital Market Day | London, 28 March 2017
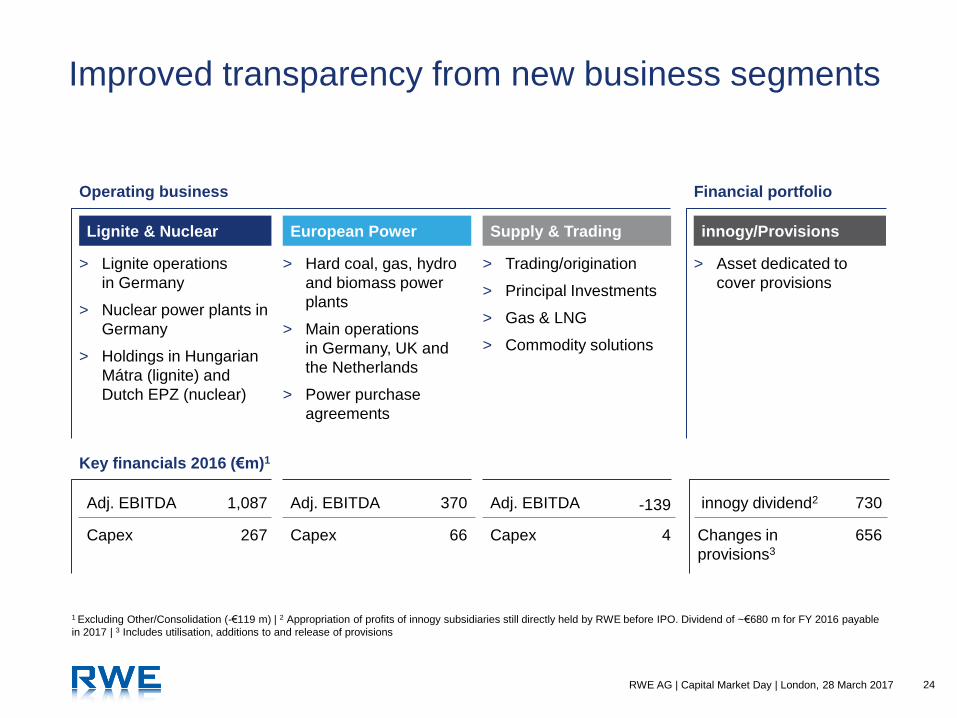
> Lignite operations
in Germany
> Nuclear power plants in
Germany
> Holdings in Hungarian
Mátra (lignite) and
Dutch EPZ (nuclear)
Improved transparency from new business segments
Adj. EBITDA
Capex
Adj. EBITDA
Capex
Lignite & Nuclear European Power
> Hard coal, gas, hydro
and biomass power
plants
> Main operations
in Germany, UK and
the Netherlands
> Power purchase
agreements
Supply & Trading
> Trading/origination
> Principal Investments
> Gas & LNG
> Commodity solutions
Adj. EBITDA
> Asset dedicated to
cover provisions
innogy/Provisions
innogy dividend2
Changes in
provisions3
1 Excluding Other/Consolidation (-€119 m) | 2 Appropriation of profits of innogy subsidiaries still directly held by RWE before IPO. Dividend of ~€680 m for FY 2016 payable
in 2017 | 3 Includes utilisation, additions to and release of provisions
Operating business Financial portfolio
Key financials 2016 (€m)1
1,087
267
370
66
730
656 Capex 4
-139
25 RWE AG | Capital Market Day | London, 28 March 2017
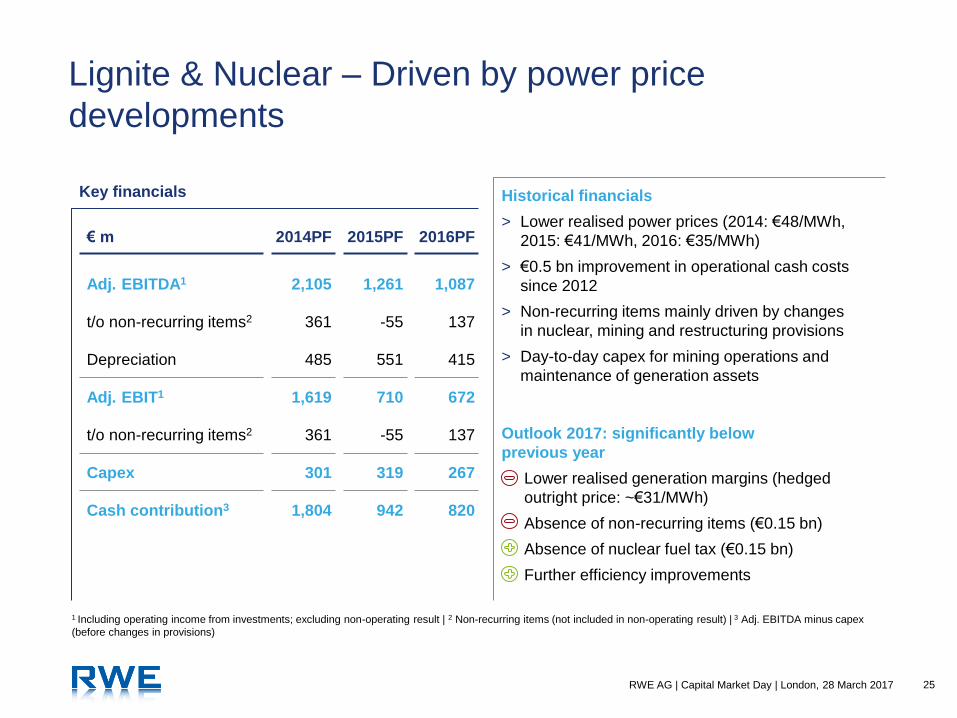
Lignite & Nuclear – Driven by power price
developments
1 Including operating income from investments; excluding non-operating result | 2 Non-recurring items (not included in non-operating result) | 3 Adj. EBITDA minus capex
(before changes in provisions)
Key financials
Adj. EBITDA1
t/o non-recurring items2
Depreciation
Adj. EBIT1
t/o non-recurring items2
Capex
Cash contribution3
2,105
361
485
1,619
361
301
1,804
1,261
-55
551
710
-55
319
942
1,087
137
415
672
137
267
820
Historical financials
> Lower realised power prices (2014: €48/MWh,
2015: €41/MWh, 2016: €35/MWh)
> €0.5 bn improvement in operational cash costs
since 2012
> Non-recurring items mainly driven by changes
in nuclear, mining and restructuring provisions
> Day-to-day capex for mining operations and
maintenance of generation assets
Outlook 2017: significantly below
previous year
Lower realised generation margins (hedged
outright price: ~€31/MWh)
Absence of non-recurring items (€0.15 bn)
Absence of nuclear fuel tax (€0.15 bn)
Further efficiency improvements
€ m 2014PF 2015PF 2016PF

26 RWE AG | Capital Market Day | London, 28 March 2017
European Power – Benefitting from improving
UK spreads
1 Including operating income from investments; excluding non-operating result | 2 Non-recurring items (not included in non-operating result) | 3 Adj. EBITDA minus capex
(before changes in provisions)
€ m
UK
Continental Europe
Adj. EBITDA1
t/o non-recurring items2
Depreciation
Adj. EBIT1
t/o non-recurring items2
Capex
Cash contribution3
2014PF
90
327
417
-
1,058
-640
-638
785
-368
2015PF
190
834
1,024
565
1,138
-114
-89
536
488
2016PF
270
100
370
24
414
-45
24
66
304
Historical financials
> UK: improving spreads and income from
short-term optimisation
> Continental Europe: declining spreads and lower
income from balancing and reserve services
> €0.5 bn improvement in operational cash costs
since 2012
> Non-recurring items dominated by termination
of power plant project in Hamm (compensation
payments and write down of plant)
> Decline in capex driven by finalisation of new-build
projects
Outlook 2017: significantly below
previous year
Lower realised spreads
Further efficiency improvements
Key financials
27 RWE AG | Capital Market Day | London, 28 March 2017
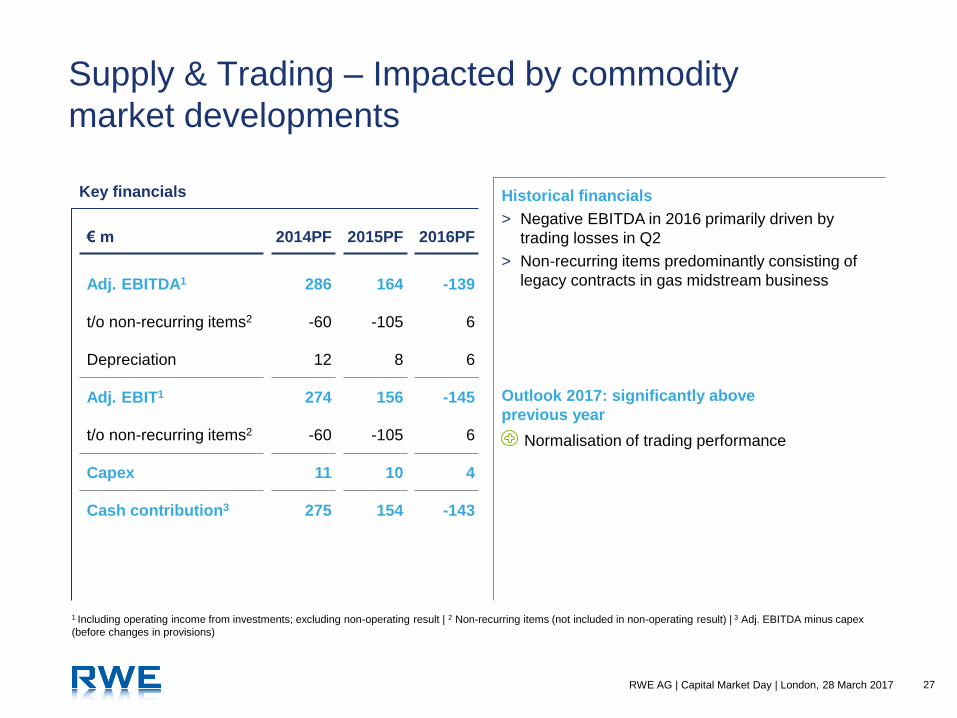
Supply & Trading – Impacted by commodity
market developments
1 Including operating income from investments; excluding non-operating result | 2 Non-recurring items (not included in non-operating result) | 3 Adj. EBITDA minus capex
(before changes in provisions)
Adj. EBITDA1
t/o non-recurring items2
Depreciation
Adj. EBIT1
t/o non-recurring items2
Capex
Cash contribution3
286
-60
12
274
-60
11
275
164
-105
8
156
-105
10
154
-139
6
6
-145
6
4
-143
Historical financials
> Negative EBITDA in 2016 primarily driven by
trading losses in Q2
> Non-recurring items predominantly consisting of
legacy contracts in gas midstream business
Outlook 2017: significantly above
previous year
Normalisation of trading performance
€ m 2014PF 2015PF 2016PF
Key financials
28 RWE AG | Capital Market Day | London, 28 March 2017
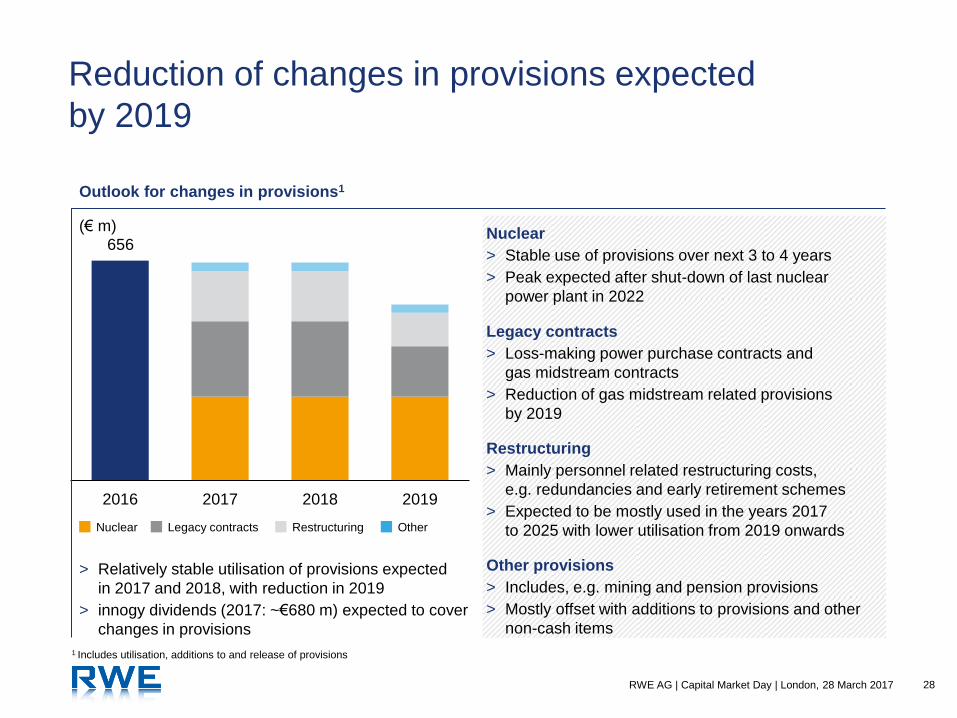
2016 2017 2018 2019
Reduction of changes in provisions expected
by 2019
Nuclear
> Stable use of provisions over next 3 to 4 years
> Peak expected after shut-down of last nuclear
power plant in 2022
> Relatively stable utilisation of provisions expected
in 2017 and 2018, with reduction in 2019
> innogy dividends (2017: ~€680 m) expected to cover
changes in provisions
Nuclear Legacy contracts Restructuring
Outlook for changes in provisions
656
(€ m)
Outlook for changes in provisions1
Legacy contracts
> Loss-making power purchase contracts and
gas midstream contracts
> Reduction of gas midstream related provisions
by 2019
Restructuring
> Mainly personnel related restructuring costs,
e.g. redundancies and early retirement schemes
> Expected to be mostly used in the years 2017
to 2025 with lower utilisation from 2019 onwards
Other provisions
> Includes, e.g. mining and pension provisions
> Mostly offset with additions to provisions and other
non-cash items
Other
1 Includes utilisation, additions to and release of provisions
29 RWE AG | Capital Market Day | London, 28 March 2017
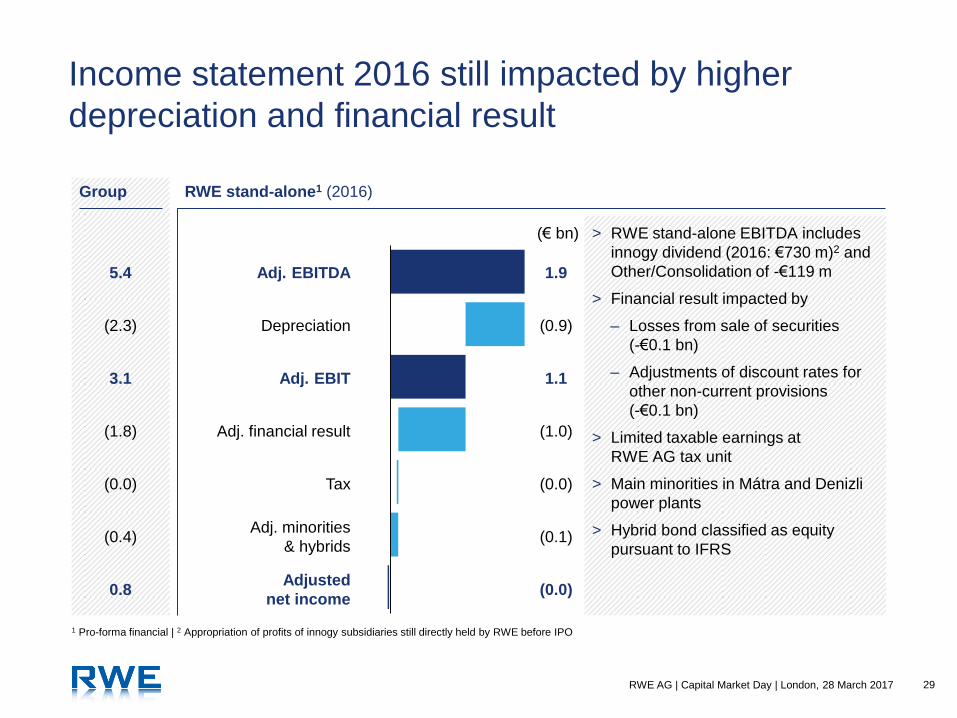
Income statement 2016 still impacted by higher
depreciation and financial result
1.9
1.1
(0.9)
(1.0)
(0.0)
(0.0)
(0.1)
Adj. financial result
Adj. EBITDA
Depreciation
Tax
Adj. EBIT
Adjusted
net income
Adj. minorities
& hybrids
1 Pro-forma financial | 2 Appropriation of profits of innogy subsidiaries still directly held by RWE before IPO
Group RWE stand-alone1 (2016)
5.4
3.1
(2.3)
(1.8)
(0.0)
(0.4)
0.8
(€ bn) > RWE stand-alone EBITDA includes
innogy dividend (2016: €730 m)2 and
Other/Consolidation of -€119 m
> Financial result impacted by
– Losses from sale of securities
(-€0.1 bn)
– Adjustments of discount rates for
other non-current provisions
(-€0.1 bn)
> Limited taxable earnings at
RWE AG tax unit
> Main minorities in Mátra and Denizli
power plants
> Hybrid bond classified as equity
pursuant to IFRS

30 RWE AG | Capital Market Day | London, 28 March 2017
Group
2016 distributable cash flow affected by phasing out of
working capital measures and higher cash interests/taxes
> RWE stand-alone EBITDA includes
innogy dividend (2016: €730 m)2 and
Other/Consolidation of -€119 m
> Change in provisions includes
utilisation, additions to and release of
provisions
> Operating working capital excludes
changes in variation margins; negative
change in 2016 largely driven by
phasing out of working capital
measures
> Cash interests/taxes in 2016 includes
lower interest income after sale of
securities (-€0.1 bn) and one-off
taxable earnings from reorganisation
(-€0.2 bn)
1.9
0.9
(0.7)
(0.3)
(0.6)
(0.4)
(0.2)
(0.1)
Operating working
capital
Adj. EBITDA
Change in provisions &
other non-cash items
Cash interests/taxes
Cash contribution
Capex
Distributable
cash flow
Non-controlling
interest + hybrids
1 Pro-forma financial | 2 Appropriation of profits of innogy subsidiaries still directly held by RWE before IPO
RWE stand-alone1 (2016)
5.4
2.3
(1.1)
(0.9)
(1.5)
(0.4)
(0.5)
(2.0)
(€ bn)

31 RWE AG | Capital Market Day | London, 28 March 2017
Solid capital structure with increased financial
flexibility
Limited relevance of traditional leverage ratios
> Net financial asset position
> Long term provisions well covered by innogy stake
> Financial position commensurate with investment
grade rating
Necessity for tailor-made approach to financing /
leverage / rating
> Intensive dialogue with rating agencies regarding
new financial situation of RWE
> Definition of minimum requirements for coverage of
provisions by fungible assets
> Financing need for operational liquidity management
Optimisation of capital structure and financing
> 50% reduction of hybrids envisaged; no replacement
of 2017 call date hybrids
> Switch to revolving working capital line
RWE stand-alone net economic debt (as of 31 December 2016)
Financial assets and receivables
> Financial receivables against innogy
> Financial assets
(€ bn)
RWE stand-alone liquidity position (as of 31 December 2016) RWE stand-alone net debt (as of 31 December 2016)
1 Includes base amount and risk premium; RWE’s economic stake: €6.8 bn | 2 Excludes nuclear energy fund base amount and risk premium
Financial liabilities
> Bonds and bank debt
> Other financial liabilities
> Hybrid adjustments
> Nuclear energy fund (consolidated stake)1
Net financial assets
Long-term liabilities
> Nuclear provisions2
> Mining provisions
> Pension provisions
Total net debt
16.1
4.3
11.8
12.0
4.9
1.2
(1.1)
7.0
4.1
11.0
5.7
2.4
2.9
6.9

32 RWE AG | Capital Market Day | London, 28 March 2017
Funding strategy reflects strong liquidity position
6.8
~2.0
(€ bn)
~3.0
11.8
RWE stand-alone liquidity position (as of 31 December 2016)
Financing
of nuclear
energy
fund
Remaining
available
liquidity
Of which
not
available
short-term1
Financial
assets
RWE stand-alone liquidity position (as of 31 December 2016)
1 E.g. collaterals and securities of the non-current assets
> Solid liquidity position to cover short-term financial
and operational business requirements
> Nuclear energy fund contribution (including risk
premium) to be paid in full on 1 July 2017
> Financing strategy for operating business to be
adapted to operational liquidity management
– Commercial paper programme available
– Revolving credit facilities and guarantee lines as
additional funding sources

33 RWE AG | Capital Market Day | London, 28 March 2017
RWE stand alone – Outlook 2017
> Reduction by ~€0.3 bn from impairments Depreciation
> 95% tax exemption for innogy dividend
> Potential utilisation of tax assets in German tax unit Taxes
Adjusted EBITDA
Adjusted Net Income
> Reduction in interest accretion to provision (€0.4 – 0.5 bn)
> Absence of losses from sale of securities and impact from
lower discount rates on non-current provisions (€0.2 bn)
Net financial result
> Stable development expected Minorities & hybrids
2016 2017
-€0.9 bn
€0.0 bn
€1.9 bn
-€0.0 bn
-€1.0 bn
-€0.1 bn
€1.6 bn –
€1.9 bn
€0.7 bn –
€1.0 bn
34 RWE AG | Capital Market Day | London, 28 March 2017
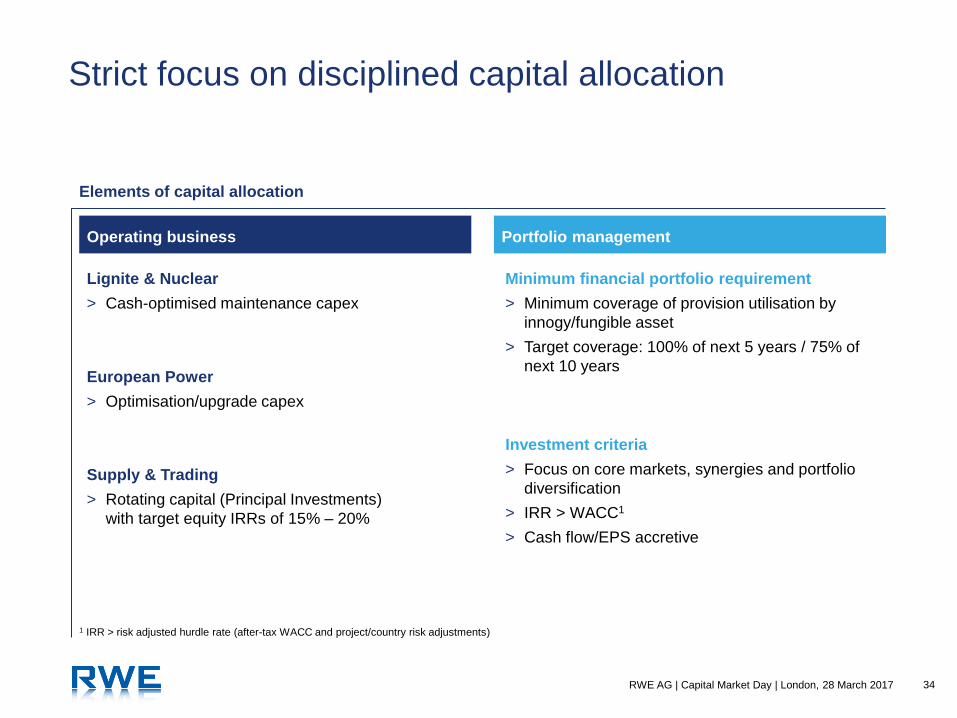
Strict focus on disciplined capital allocation
Elements of capital allocation
Operating business Portfolio management
European Power
> Optimisation/upgrade capex
Supply & Trading
> Rotating capital (Principal Investments)
with target equity IRRs of 15% – 20%
Investment criteria
> Focus on core markets, synergies and portfolio
diversification
> IRR > WACC1
> Cash flow/EPS accretive
Lignite & Nuclear
> Cash-optimised maintenance capex
Minimum financial portfolio requirement
> Minimum coverage of provision utilisation by
innogy/fungible asset
> Target coverage: 100% of next 5 years / 75% of
next 10 years
1 IRR > risk adjusted hurdle rate (after-tax WACC and project/country risk adjustments)
35 RWE AG | Capital Market Day | London, 28 March 2017
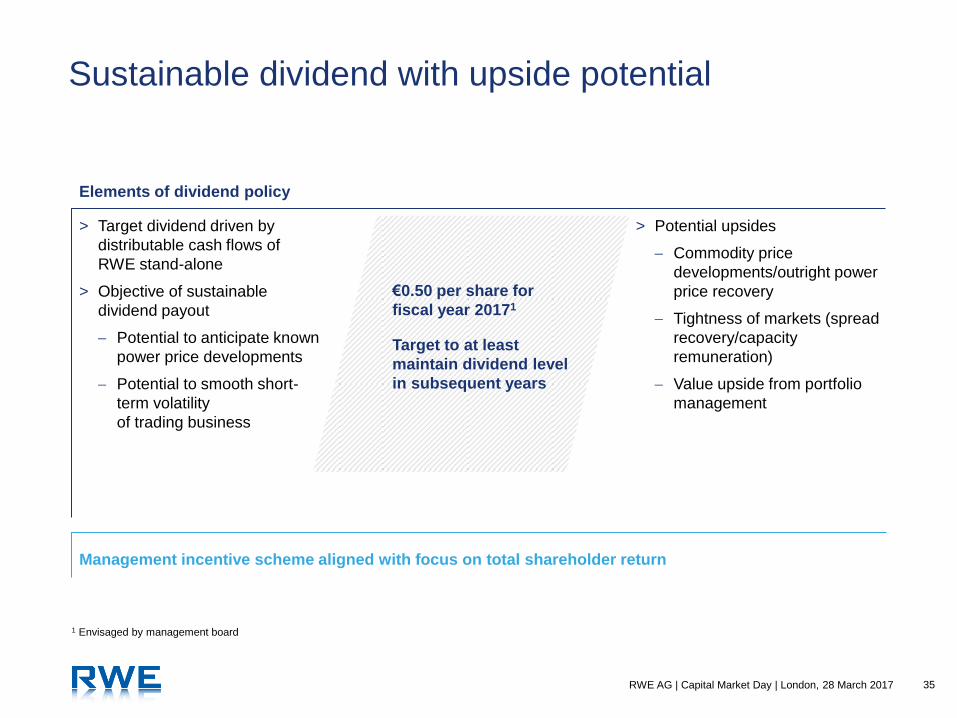
Sustainable dividend with upside potential
> Target dividend driven by
distributable cash flows of
RWE stand-alone
> Objective of sustainable
dividend payout
Potential to anticipate known
power price developments
Potential to smooth short-
term volatility
of trading business
> Potential upsides
Commodity price
developments/outright power
price recovery
Tightness of markets (spread
recovery/capacity
remuneration)
Value upside from portfolio
management
Management incentive scheme aligned with focus on total shareholder return
1 Envisaged by management board
€0.50 per share for
fiscal year 20171
Target to at least
maintain dividend level
in subsequent years
Elements of dividend policy
36 RWE AG | Capital Market Day | London, 28 March 2017
Financial highlights – key messages
Full transparency on operating business and financial portfolio
Operating business managed for cash and positioned for market recovery
Solid capital structure and financial flexibility
Strong financial discipline and sustainable dividend with upside potential
✔
✔
✔
✔
Lignite & Nuclear
Rigorously managed asset base with significant
outright exposure
Frank Weigand
Chief Financial Officer
RWE Generation
38 RWE AG | Capital Market Day | London, 28 March 2017
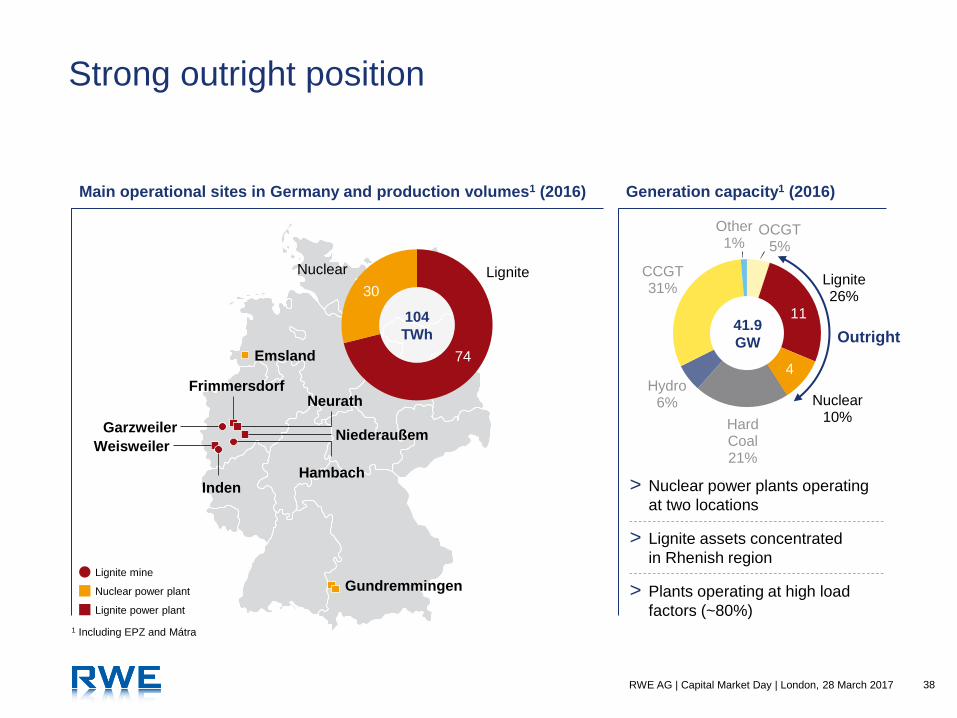
Strong outright position
1 Including EPZ and Mátra
OCGT 5%
Lignite 26%
Nuclear 10%
Hard Coal 21%
Hydro 6%
CCGT 31%
Other 1%
Emsland
Garzweiler
Frimmersdorf Neurath
Niederaußem Weisweiler
Hambach Inden
Gundremmingen
> Nuclear power plants operating
at two locations
> Lignite assets concentrated
in Rhenish region
> Plants operating at high load
factors (~80%)
11
4
Lignite Nuclear
104
TWh
30
74
Lignite power plant
Lignite mine
Nuclear power plant
Outright
Main operational sites in Germany and production volumes1 (2016) Generation capacity1 (2016)
41.9
GW

39 RWE AG | Capital Market Day | London, 28 March 2017
Track record of significant cost reductions in
Lignite & Nuclear
12,500 11,900
11,300 10,600 10,200
9,200
2012 2013 2014 2015 2016
2.8 2.6 2.5 2.4 2.3
2.1
2012 2013 2014 2015 2016 Target
2019
Target
2019
> Total cash cost reduction of ~€0.5 bn since 2012
> Additional cost improvements of ~€0.2 bn targeted until 2019
(€ bn) (Full time equivalent)
1 Opex and capex excluding large projects; excluding EPZ and Mátra
Operational cash cost development1 Employee/headcount development
40 RWE AG | Capital Market Day | London, 28 March 2017
Lignite
41 RWE AG | Capital Market Day | London, 28 March 2017
Power plants
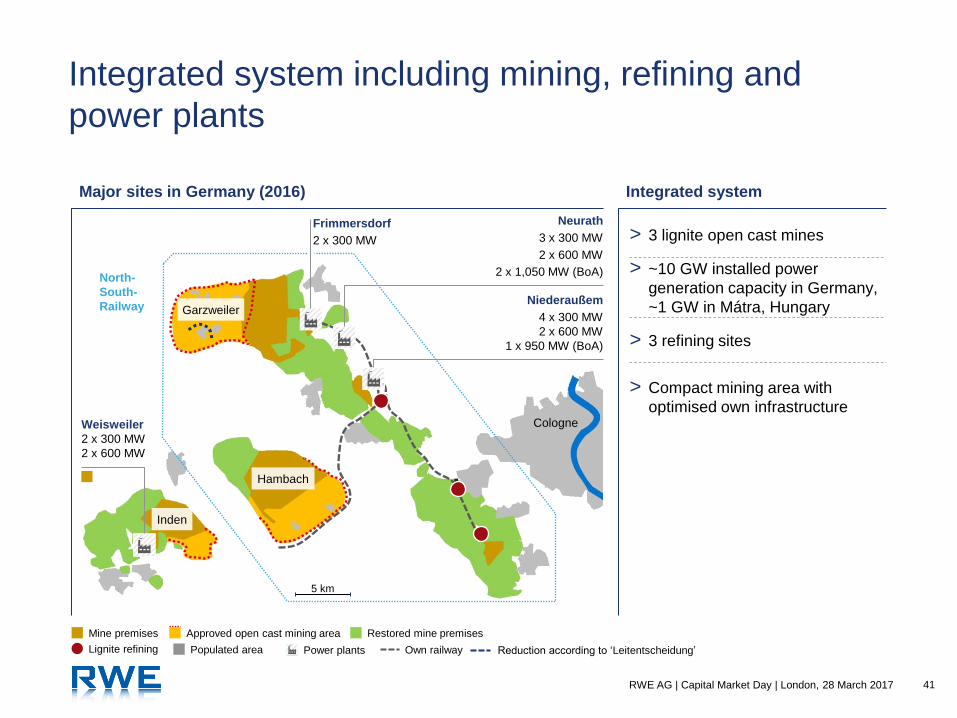
Integrated system including mining, refining and
power plants
Frimmersdorf
2 x 300 MW > 3 lignite open cast mines
> ~10 GW installed power
generation capacity in Germany,
~1 GW in Mátra, Hungary
> 3 refining sites
> Compact mining area with
optimised own infrastructure
Mine premises Restored mine premises Approved open cast mining area
Lignite refining Populated area Own railway
Inden
Niederaußem
4 x 300 MW
2 x 600 MW
1 x 950 MW (BoA)
Hambach
Garzweiler
North-
South-
Railway
Cologne Weisweiler
2 x 300 MW
2 x 600 MW
Neurath
3 x 300 MW
2 x 600 MW
2 x 1,050 MW (BoA)
5 km
Major sites in Germany (2016) Integrated system
Reduction according to ‘Leitentscheidung’

42 RWE AG | Capital Market Day | London, 28 March 2017
Regulatory framework clarified by state ruling
providing planning security for mining
Open cast
mines
Extraction3
(Mt/a)
Reserves
(bn t)
Estimated
end date
Hambach ~ 35 – 40 1.3 Mid-
century
Garz-
weiler
~ 35 – 40 0.8 Mid-
century
Inden ~ 15 – 20 0.3 ~2030
Total ~ 90 – 95 2.4
> State ruling on Rhenish lignite mining1
– Confirmation of lignite mining necessity
to ensure electricity supply
– Accounts for lower expected power generation
from lignite
– Equivalent reduction of Garzweiler mining area
> Stable planning environment for mining operations
1 ‘Leitentscheidung’ adopted by State of North Rhine-Westphalia (NRW) | 2 As of 2016; excluding Mátra, Hungary | 3 Extractions shrinking until mid-century
Clear regulatory framework Sufficient reserves until mid-century2

43 RWE AG | Capital Market Day | London, 28 March 2017
Significant CO2 reduction in line with broader
European and national roadmap
Planned
capacity
de-
crease ~2030
> Shut-down of adjacent plant site Weisweiler
> Additional CO2 reduction measures and
options (efficiency enhancement, reduction
of full-load hours, lower capacity utilisation)2
CO2
reduc-
tion
vs. 2015 -40% ‒ -50%
By 2020 By 2030
-15%
> Transfer of 1.5 GW into stand-by reserve
> Final shut-down after 4 years in reserve
1 When Inden mine’s supply comes to an end | 2 Depending on expansion of renewable energy sources
2020 2030
Stand-by reserve End of Inden mine
2 x 300 MW Weisweiler1
2 x 600 MW Weisweiler1 2021
2022
2023
2017
2018
2019
2 x 300 MW Frimmersdorf
2 x 300 MW Niederaußem
1 x 300 MW Neurath

44 RWE AG | Capital Market Day | London, 28 March 2017
> Rule-of-thumb:
Breakeven at power prices minus CO2 costs of
~€22/MWh including additional planned efficiency
measures
> Example:
Base load price of €28/MWh and CO2 price of
€6/MWh (equivalent to ~€5.5/t at an emissions
factor of 1.1)
Further cost reductions to maintain positive
cash contribution from operations
69 ~74
69-71 64-66 62-65
2016 2017 2018 2019 2020
> Reduction of non-safety relevant technical standards in overhauls and repairs
> Lower external spend
> Reduction of overtime (optimised utilisation of personnel/ flexible working time models)
> Organisational optimisation and staff reduction via early-retirement programs
> Stretching of overhaul cycles for power plants
1 Excluding Mátra; gross generation, not including ~3 TWh of own consumption | 2 Adj. EBITDA minus capex (before changes in provisions)
Efficiency measures
Generation output in Germany (TWh)1 Cash contribution2
Transfer of 5 blocks to stand-by reserve

45 RWE AG | Capital Market Day | London, 28 March 2017
Longstanding experience in lignite operations
Overview of mining activities Overview of mining activities
2
1
3
4
3
4 1
2
Surface preparation (relocation)
Operations Recultivation (ongoing)
Recultivation (after shutdown)
46 RWE AG | Capital Market Day | London, 28 March 2017
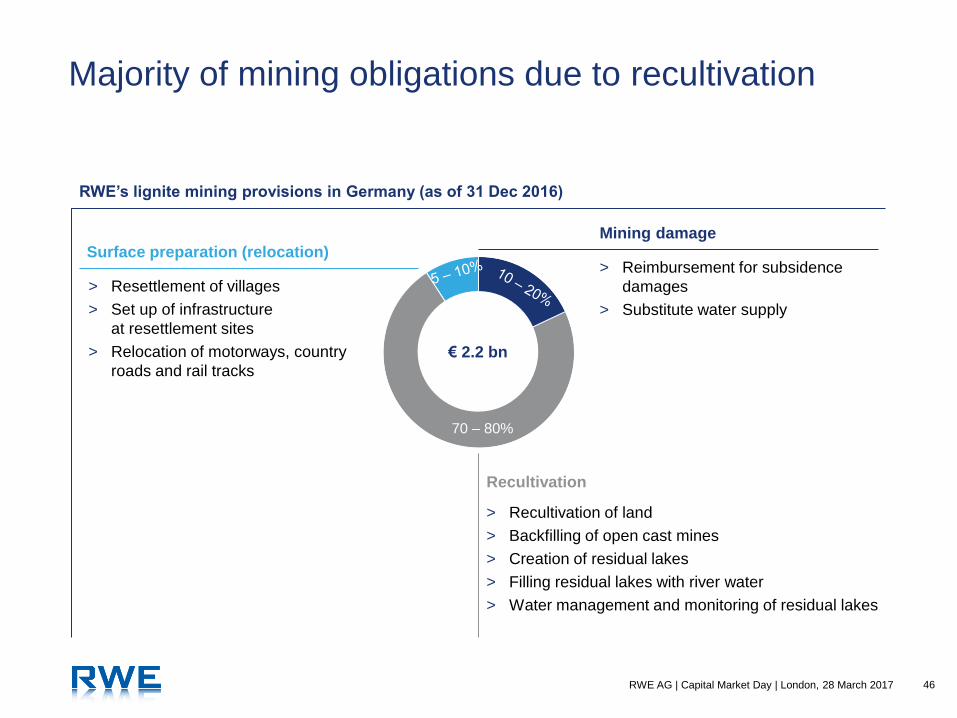
Majority of mining obligations due to recultivation
RWE’s lignite mining provisions in Germany (as of 31 Dec 2016)
€ 2.2 bn
Surface preparation (relocation)
Mining damage
> Reimbursement for subsidence
damages
> Substitute water supply
> Resettlement of villages
> Set up of infrastructure
at resettlement sites
> Relocation of motorways, country
roads and rail tracks
> Recultivation of land
> Backfilling of open cast mines
> Creation of residual lakes
> Filling residual lakes with river water
> Water management and monitoring of residual lakes
Recultivation
70 – 80%

47 RWE AG | Capital Market Day | London, 28 March 2017
Stable utilisation of provisions expected for the
foreseeable future
Example: cash flow profile (one mine) Utilisation of all mining provisions
Until ~2030
> Stable utilisation of provisions,
mainly for relocation, mining
damage and recultivation
> Annual utilisation:
€40 m – €80 m
After 2030
> Increased utilisation of provisions
due to shutdown of Inden
ILLUSTRATIVE
(€ m)
Year
Ongoing operations
and recultivation
Shutdown phase
Pure recultivation phase
End of
operations
20 40 50 60 30 10

48 RWE AG | Capital Market Day | London, 28 March 2017
Lignite – key messages
Experienced operator of well-managed and integrated system
CO2 reduction in line with broader political roadmap
Efficiency improvements to keep system cash positive
✔
✔
✔
49 RWE AG | Capital Market Day | London, 28 March 2017
Nuclear
50 RWE AG | Capital Market Day | London, 28 March 2017
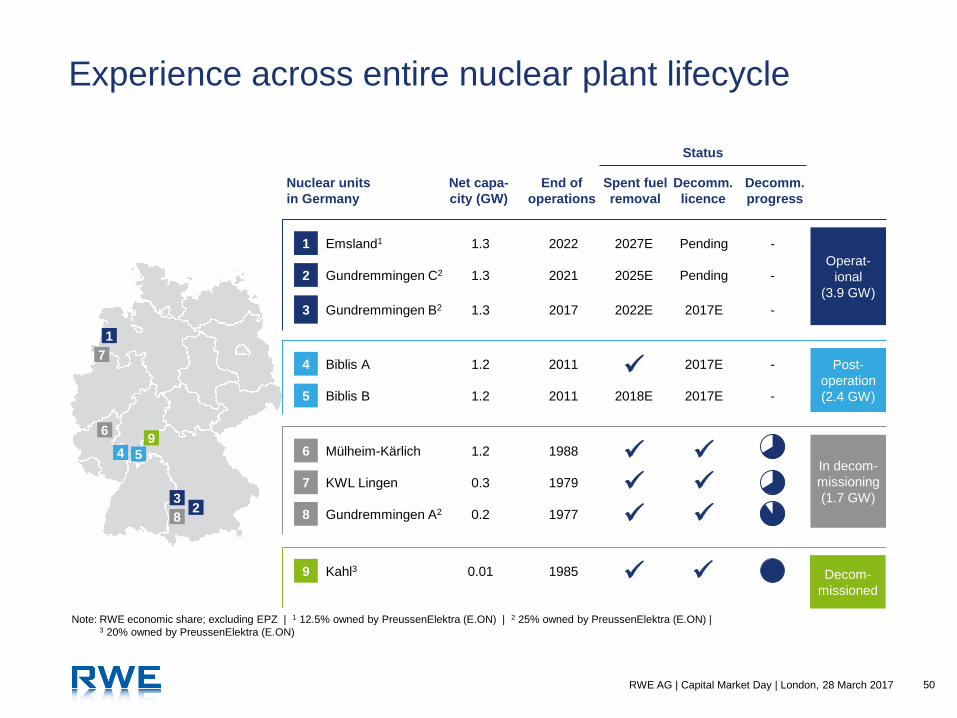
Experience across entire nuclear plant lifecycle
Note: RWE economic share; excluding EPZ | 1 12.5% owned by PreussenElektra (E.ON) | 2 25% owned by PreussenElektra (E.ON) | 3 20% owned by PreussenElektra (E.ON)
5
6
8
1
2 3
4
7
Status
Nuclear units
in Germany
Net capa-
city (GW)
End of
operations
Spent fuel
removal
Decomm.
licence
Decomm.
progress
Post-
operation
(2.4 GW) Biblis B 1.2 2011 2018E 5 2017E -
Biblis A 1.2 2011 4 2017E -
In decom-
missioning
(1.7 GW)
Gundremmingen A2 0.2 1977 8
Mülheim-Kärlich 1.2 1988 6
KWL Lingen 0.3 1979 7
Operat-
ional
(3.9 GW)
Emsland1 1.3 2022 2027E 1 Pending -
Gundremmingen C2 1.3 2021 2025E 2 Pending -
Gundremmingen B2 1.3 2017 2022E 3 2017E -
Kahl3 0.01 1985 9 Decom-
missioned
9

51 RWE AG | Capital Market Day | London, 28 March 2017
25 ~24
16-18 16-18 16-18 16-18
7-8
0
2016 2017 2018 2019 2020 2021 2022 2023
> Breakeven at base load prices of above ~€20/MWh,
including additional planned efficiency measures
> Although cost base already largely optimised,
further efficiency measures in implementation
Positive cash contribution from plants in operation
> Staff reduction via utilisation of early-retirement programs according to decommissioning progress
> Reduction of permanent external staff for units in operation
> Reduction of non-safety relevant age-related replacement measures and maintenance activities
> Lower expenses for uranium and casks for spent fuel
1 RWE economic share, excluding EPZ | 2 Adj. EBITDA minus capex (before changes in provisions)
Efficiency measures
Generation output (TWh)1 Cash contribution2
Shutdowns of units
52 RWE AG | Capital Market Day | London, 28 March 2017
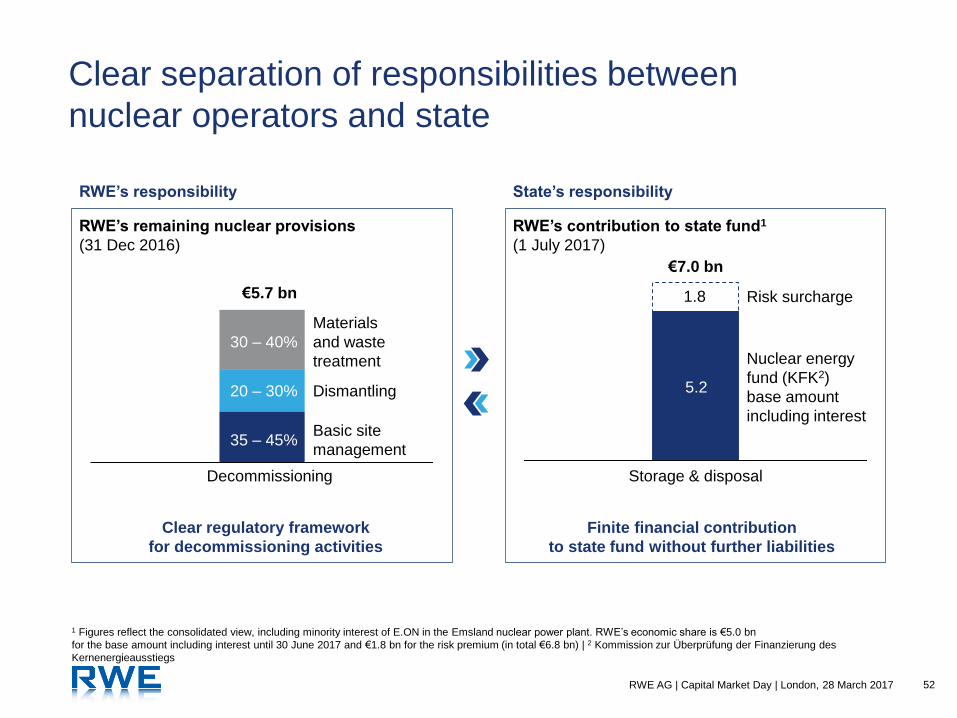
Clear separation of responsibilities between
nuclear operators and state
RWE’s responsibility State’s responsibility
RWE’s remaining nuclear provisions
(31 Dec 2016)
RWE’s contribution to state fund1
(1 July 2017)
1 Figures reflect the consolidated view, including minority interest of E.ON in the Emsland nuclear power plant. RWE’s economic share is €5.0 bn
for the base amount including interest until 30 June 2017 and €1.8 bn for the risk premium (in total €6.8 bn) | 2 Kommission zur Überprüfung der Finanzierung des
Kernenergieausstiegs
Clear regulatory framework
for decommissioning activities
Finite financial contribution
to state fund without further liabilities
€5.7 bn
Storage & disposal
1.8 Risk surcharge
Nuclear energy
fund (KFK2)
base amount
including interest Basic site
management
Dismantling
Materials
and waste
treatment
30 – 40%
20 – 30%
35 – 45%
Decommissioning Storage & disposal
€7.0 bn
5.2
53 RWE AG | Capital Market Day | London, 28 March 2017
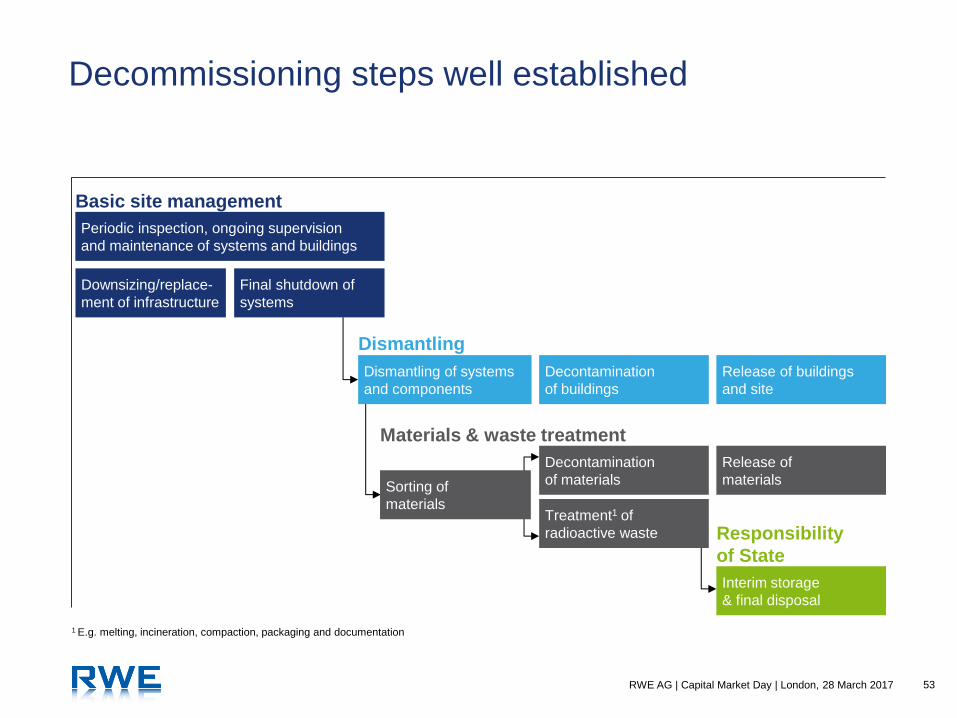
Decommissioning steps well established
Basic site management
Dismantling
Materials & waste treatment
Responsibility
of State
1 E.g. melting, incineration, compaction, packaging and documentation
Downsizing/replace-
ment of infrastructure
Final shutdown of
systems
Decontamination
of buildings
Release of buildings
and site
Decontamination
of materials
Release of
materials
Interim storage
& final disposal
Periodic inspection, ongoing supervision
and maintenance of systems and buildings
Treatment1 of
radioactive waste
Sorting of
materials
Dismantling of systems
and components
54 RWE AG | Capital Market Day | London, 28 March 2017
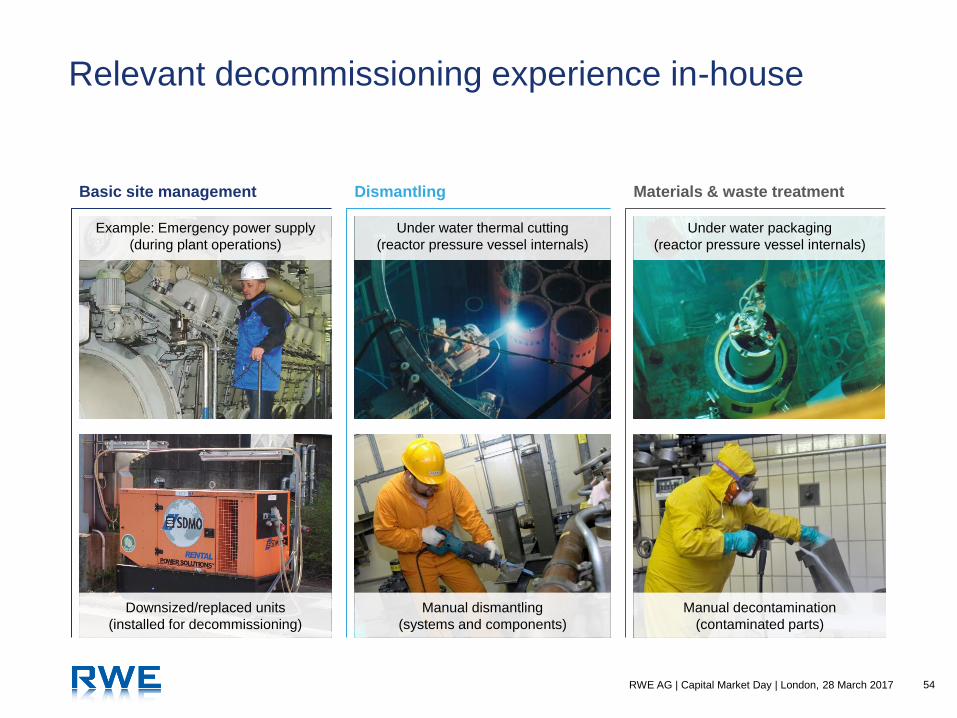
Relevant decommissioning experience in-house
Basic site management Dismantling Materials & waste treatment
Under water packaging
(reactor pressure vessel internals)
Manual decontamination
(contaminated parts)
Example: Emergency power supply
(during plant operations)
Downsized/replaced units
(installed for decommissioning)
Under water thermal cutting
(reactor pressure vessel internals)
Manual dismantling
(systems and components)

55 RWE AG | Capital Market Day | London, 28 March 2017
Key success factors for decommissioning in place
RWE’s approach and experience Key success factors
> Timely receipt of licences
> Clear blueprint for planning
> Avoidance of delays/cost overruns
> Maintaining quality standards
> Availability of key contractors
> Bundling of dismantling activities
> Robust logistic concept
> Availability of back end capacity
> Early initiation of preparation process
> Adequate infrastructure
(field technology)
> Early licencing process
> Project management track record
> Fleet approach (e.g. for dismantling
of large components)
> Qualified service providers are
available
> High safety standards for all parties
> Proven and established techniques
> Preferred on-site treatment
of materials and waste
> Cost cutting experience transferred
> Early replacement/adaption of
expensive infrastructure
Decommissioning
planning &
management
Availability
of suppliers
Dismantling &
materials and
waste treatment
Basic site
management
56 RWE AG | Capital Market Day | London, 28 March 2017
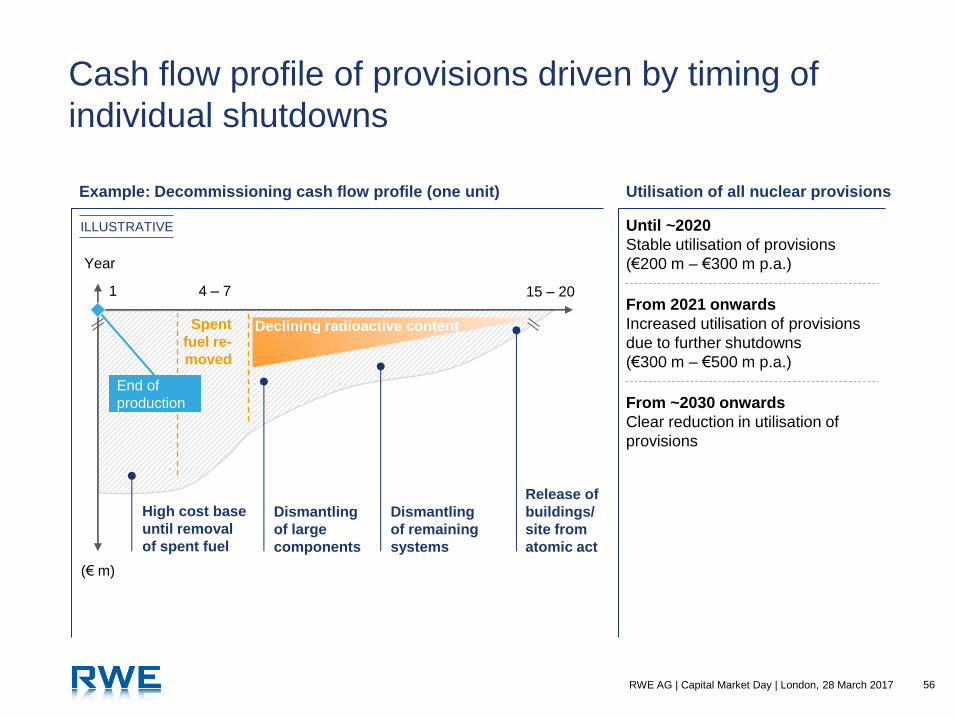
Cash flow profile of provisions driven by timing of
individual shutdowns
Utilisation of all nuclear provisions
Until ~2020
Stable utilisation of provisions
(€200 m – €300 m p.a.)
From 2021 onwards
Increased utilisation of provisions
due to further shutdowns
(€300 m – €500 m p.a.)
(€ m)
Year
1 4 – 7 15 – 20
Example: Decommissioning cash flow profile (one unit)
From ~2030 onwards
Clear reduction in utilisation of
provisions
Declining radioactive content Spent
fuel re-
moved
Dismantling
of large
components
Release of
buildings/
site from
atomic act
Dismantling
of remaining
systems
High cost base
until removal
of spent fuel
ILLUSTRATIVE
End of
production

57 RWE AG | Capital Market Day | London, 28 March 2017
Nuclear – key messages
Strong expertise, both in operations and decommissioning
Positive cash contribution until decommissioning
Significantly improved planning certainty due to new nuclear law
✔
✔
✔
European Power
Efficient operator of modern and flexible
generation fleet
Roger Miesen
Chief Technical Officer
RWE Generation

59 RWE AG | Capital Market Day | London, 28 March 2017
Well positioned portfolio across regions
and technologies
Major power plants and production volumes1 (2016) Generation capacity (2016)
Germany 32%
UK 43%
Netherlands 22%
Other 3%
100
TWh
OCGT 5%
Lignite 26%
Nuclear 10%
Hard Coal 21%
Hydro 6%
CCGT 31%
Other 1%
> Leading market positions in Germany,
UK and the Netherlands
> Diversified market, political and
regulatory exposure
> Attractive site locations, adjacent to
cities and industrial centres
> Operational synergies with
outright power plants
> 2.4 GW portfolio of customer plants
> 990kt waste incineration capacity Gas
Hard Coal
Hydro
Other
41.9
GW
9
13
Spread
3
1 Including Denizli
60 RWE AG | Capital Market Day | London, 28 March 2017
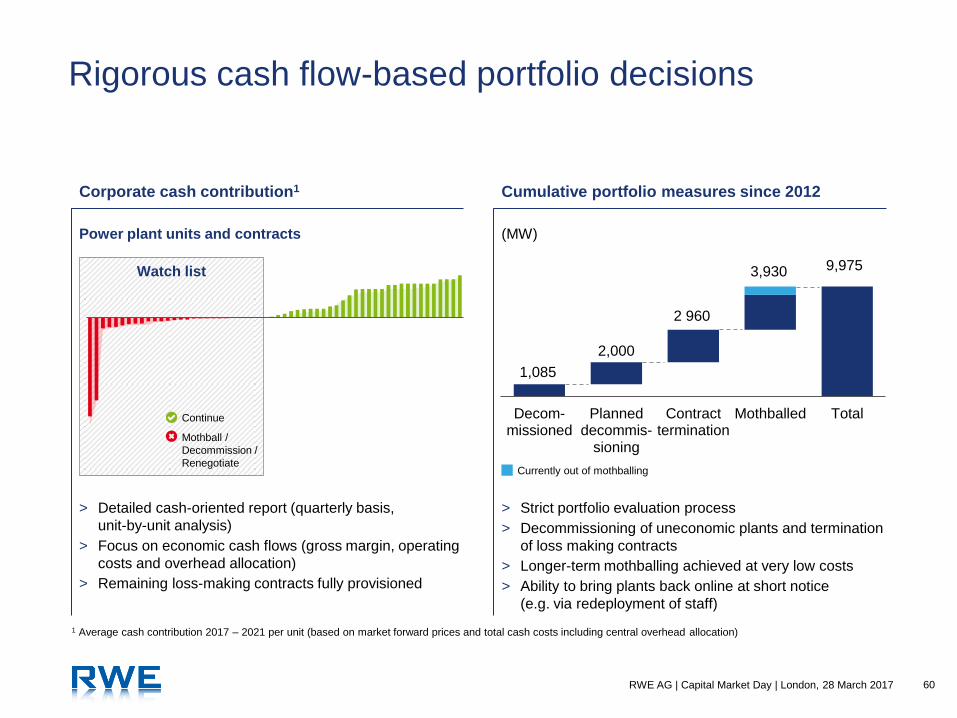
Watch list
Mothball /
Decommission /
Renegotiate
Continue
Rigorous cash flow-based portfolio decisions
Corporate cash contribution1 Cumulative portfolio measures since 2012
1 Average cash contribution 2017 – 2021 per unit (based on market forward prices and total cash costs including central overhead allocation)
> Detailed cash-oriented report (quarterly basis,
unit-by-unit analysis)
> Focus on economic cash flows (gross margin, operating
costs and overhead allocation)
> Remaining loss-making contracts fully provisioned
> Strict portfolio evaluation process
> Decommissioning of uneconomic plants and termination
of loss making contracts
> Longer-term mothballing achieved at very low costs
> Ability to bring plants back online at short notice
(e.g. via redeployment of staff)
1,085
2,000
2 960
3,930 9,975
Decom-missioned
Planneddecommis-
sioning
Contracttermination
Mothballed Total
Currently out of mothballing
Power plant units and contracts (MW)
61 RWE AG | Capital Market Day | London, 28 March 2017
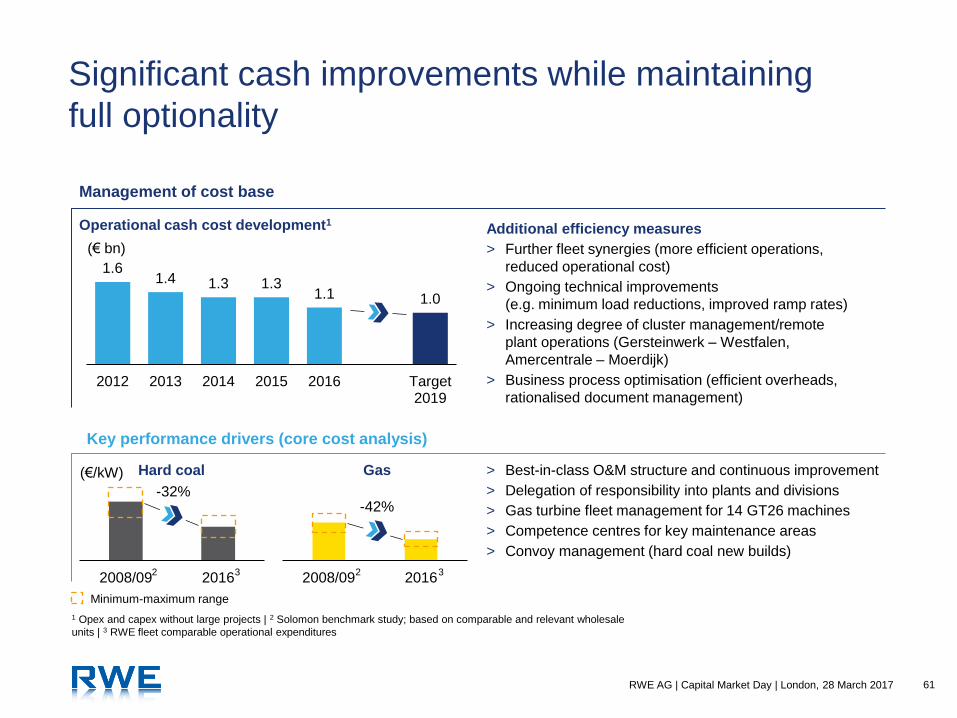
Significant cash improvements while maintaining
full optionality
Additional efficiency measures
> Further fleet synergies (more efficient operations,
reduced operational cost)
> Ongoing technical improvements
(e.g. minimum load reductions, improved ramp rates)
> Increasing degree of cluster management/remote
plant operations (Gersteinwerk – Westfalen,
Amercentrale – Moerdijk)
> Business process optimisation (efficient overheads,
rationalised document management)
1 Opex and capex without large projects | 2 Solomon benchmark study; based on comparable and relevant wholesale
units | 3 RWE fleet comparable operational expenditures
Additional efficiency measures
Management of cost base
Key performance drivers (core cost analysis)
Operational cash cost development1
1.6 1.4 1.3 1.3
1.1 1.0
2012 2013 2014 2015 2016 Target2019
(€ bn)
2008/09 2016
Hard coal (€/kW) > Best-in-class O&M structure and continuous improvement
> Delegation of responsibility into plants and divisions
> Gas turbine fleet management for 14 GT26 machines
> Competence centres for key maintenance areas
> Convoy management (hard coal new builds)
Minimum-maximum range
-32%
2008/09 2016
Gas
-42%
2 3 2 3
62 RWE AG | Capital Market Day | London, 28 March 2017
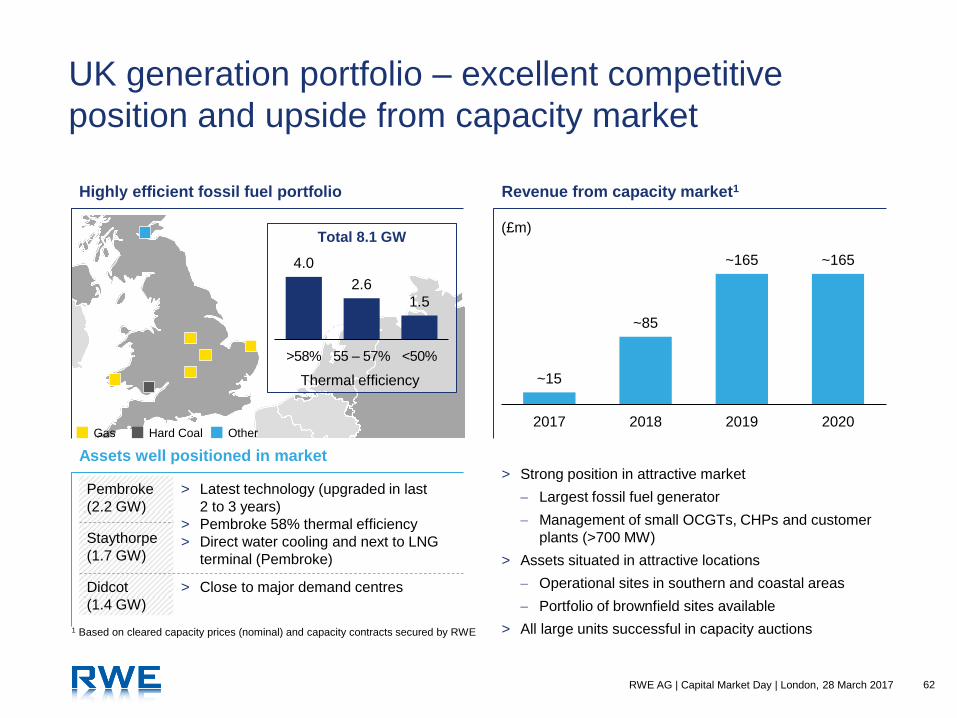
UK generation portfolio – excellent competitive
position and upside from capacity market
Highly efficient fossil fuel portfolio Revenue from capacity market1
4.0
2.6
1.5
>58% 55 – 57% <50%
Total 8.1 GW
Thermal efficiency ~15
~85
~165 ~165
2017 2018 2019 2020
(£m)
1 Based on cleared capacity prices (nominal) and capacity contracts secured by RWE
> Latest technology (upgraded in last
2 to 3 years)
> Pembroke 58% thermal efficiency
> Direct water cooling and next to LNG
terminal (Pembroke)
Pembroke
(2.2 GW)
Staythorpe
(1.7 GW)
Didcot
(1.4 GW)
> Close to major demand centres
> Strong position in attractive market
Largest fossil fuel generator
Management of small OCGTs, CHPs and customer
plants (>700 MW)
> Assets situated in attractive locations
Operational sites in southern and coastal areas
Portfolio of brownfield sites available
> All large units successful in capacity auctions
Assets well positioned in market
Gas Hard Coal Other
63 RWE AG | Capital Market Day | London, 28 March 2017
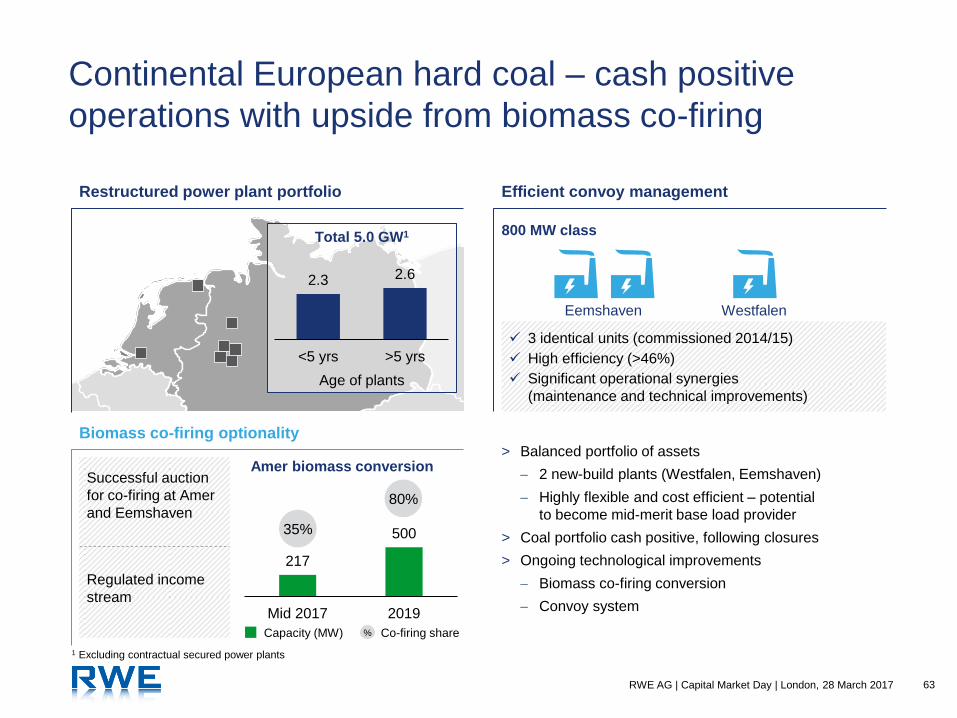
Continental European hard coal – cash positive
operations with upside from biomass co-firing
Restructured power plant portfolio Efficient convoy management
Total 5.0 GW1
Age of plants
2.3 2.6
<5 yrs >5 yrs
Westfalen
3 identical units (commissioned 2014/15)
High efficiency (>46%)
Significant operational synergies
(maintenance and technical improvements)
800 MW class
Eemshaven
Successful auction
for co-firing at Amer
and Eemshaven
Regulated income
stream
217
500
Mid 2017 2019
35%
80%
Amer biomass conversion
Capacity (MW) % Co-firing share
> Balanced portfolio of assets
2 new-build plants (Westfalen, Eemshaven)
Highly flexible and cost efficient – potential
to become mid-merit base load provider
> Coal portfolio cash positive, following closures
> Ongoing technological improvements
Biomass co-firing conversion
Convoy system
Biomass co-firing optionality
1 Excluding contractual secured power plants

64 RWE AG | Capital Market Day | London, 28 March 2017
Continental European gas – modern fleet,
well positioned for tighter markets
Underutilised power plant portfolio Significant utilisation improvements
2.9 3.9
Op
e-
ratin
g
Mo
th-
balle
d
Typical GT26 start up time
Reduction
by ~40 minutes
0 20 40 60 80
Full load
Q4 2015
0
2
4
6
8
Jan 2014 Jan 2015 Jan 2016 Dec 2016
> Modern portfolio well placed to benefit from expected
market tightness
> Ongoing technical improvements
GT26 ramp up time
Black start capability (Lingen, Claus C)
> Attractive portfolio of customer plants
Long-term contracts and stable relationships
Additional optimisation potential (e.g. power-heat
coupling)
Lingen plant
State-of-the art technology
Total 6.8 GW1
(100 GWh)
1 Excluding Denizli
Currently out of mothballing
2014
(minutes)
65 RWE AG | Capital Market Day | London, 28 March 2017
00:00 04:00 08:00 12:00 16:00 20:00 00:00
Conventional generation Sum of RWE generation
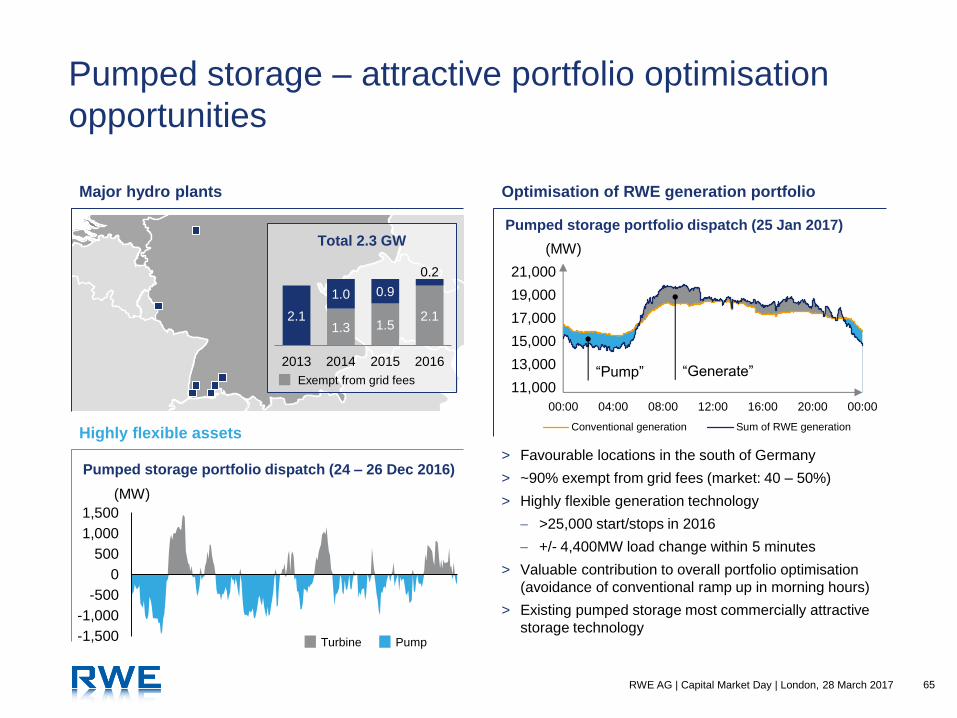
1.3 1.5 2.1 2.1
1.0 0.9
0.2
2013 2014 2015 2016
Pumped storage – attractive portfolio optimisation
opportunities
Major hydro plants
Total 2.3 GW
Exempt from grid fees “Generate” “Pump”
(MW)
11,000
15,000
17,000
13,000
19,000
21,000
Optimisation of RWE generation portfolio
Highly flexible assets
-1,500
-1,000
-500
0
500
1,000
1,500
Turbine Pump
> Favourable locations in the south of Germany
> ~90% exempt from grid fees (market: 40 – 50%)
> Highly flexible generation technology
>25,000 start/stops in 2016
+/- 4,400MW load change within 5 minutes
> Valuable contribution to overall portfolio optimisation
(avoidance of conventional ramp up in morning hours)
> Existing pumped storage most commercially attractive
storage technology
Pumped storage portfolio dispatch (24 – 26 Dec 2016)
Pumped storage portfolio dispatch (25 Jan 2017)
(MW)

66 RWE AG | Capital Market Day | London, 28 March 2017
Initiatives focused on security of supply
Combined battery storage Temporary generation Embedded generation
> 6 MW battery storage project
(Herdecke, Germany)
– Shared infrastructure (grid
connection, personnel)
with pumped storage plant
– Operational in H1 2017
> Leveraging long-term system
integration experience of pumped
storage plants into new storage
technologies
> Long track record with gas engines
(derived from German coal mine
gas activities)
> Small gas engines in UK
(1–2 MW) connected to local
distribution network
(15 – 20 MW project size)
> Planning applications for 4 UK
projects submitted (1 for 20 MW
at Grimsby CHP site;
3 at Cheshire CHP site)
> Grimsby project obtained 15-year
capacity market agreement
> Mutually beneficial partnership
with Aggreko in UK since
November 2014
– RWE: maximise value
of land and connections
– Agrekko: off-season utilisation
of mobile generation units
> Multiple revenue streams (reserve
and wholesale markets/avoided
grid fees)
67 RWE AG | Capital Market Day | London, 28 March 2017
European Power – key messages
Highly flexible and efficient power plant portfolio across core regions
Meticulous management approach to maximise value
Fleet well positioned for tightening energy markets in Europe
Attractive opportunities to further develop business operations
✔
✔
✔
✔
Commercial Asset Optimisation
(CAO)
Extraction and monetisation of value
from generation assets
Tom Glover
Chief Commercial Officer CAO
RWE Supply & Trading

69 RWE AG | Capital Market Day | London, 28 March 2017
Significant value contribution from CAO activities
~15%
~5%
~35%
~40%
~5%
CAO value contribution
Option management
> Re-optimisation of power
station option
> Shape management
> Trading around hedge positions
Short-term optimisation
> Short-term trading
> Balancing markets
> Dispatch/intra-day
trading
Deviation from Reference Hedge Path
> Within defined limits
> Based on fundamental market views
Fuel procurement & logistics
> Physical procurement of fuel
and substitutes
> Commercialisation of by-products
Reserve & ancillary services
> Reserve, voltage support/
reactive power
> Frequency response, black start
€2 – €3
per MWh1
1 On top of realised forward hedges as per Reference Hedge Path. Reported within results of Lignite & Nuclear and European Power

70 RWE AG | Capital Market Day | London, 28 March 2017
Treatment of power plants as real options
Intrinsic value Extrinsic value
> Value inherent in physical asset
> Captured by
– Forward hedging in the liquid tenor
– Regularly reviewing and changing
hedging approach
> Value in asset optionality
> Captured by
– Long-term optimisation
(outages, mothballing, investments)
– Short-term optimisation
(dispatch, re-dispatch)
– Reserve and ancillary services
– Capacity markets
Plant used to convert
fuel into energy
Existing delivery
obligations fulfilled
by external energy
purchases
Power
price Production is
in the money
SELL
Production is
out of the money
BUY BACK
Time Production costs Electricity price
71 RWE AG | Capital Market Day | London, 28 March 2017
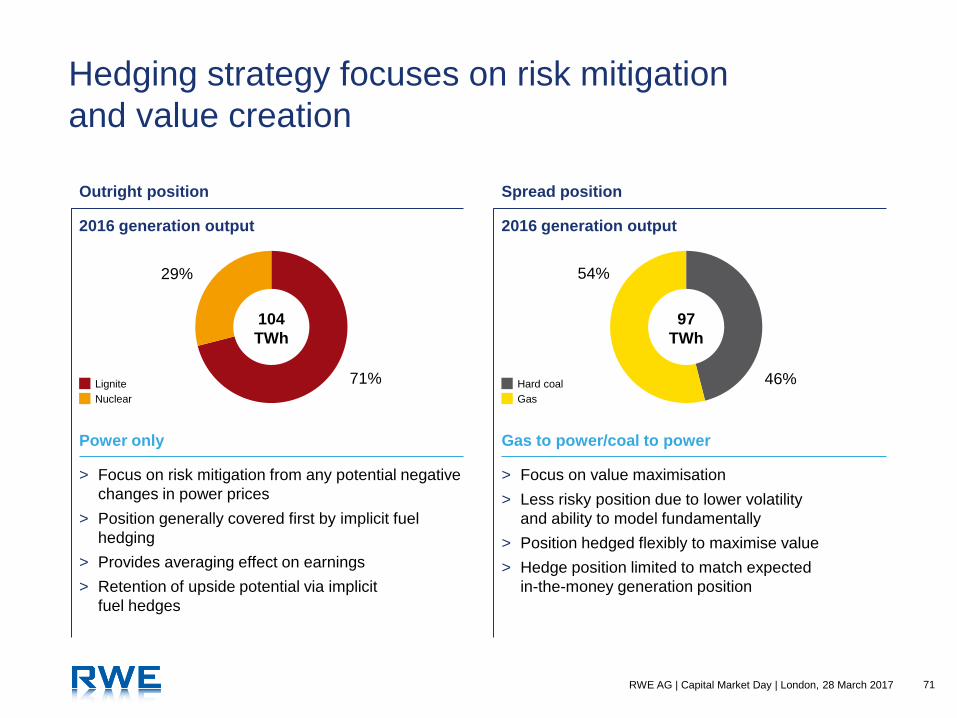
Hedging strategy focuses on risk mitigation
and value creation
46%
54%
71%
29%
Spread position Outright position
Lignite Hard coal
Nuclear Gas
97
TWh
104
TWh
2016 generation output 2016 generation output
> Focus on risk mitigation from any potential negative
changes in power prices
> Position generally covered first by implicit fuel
hedging
> Provides averaging effect on earnings
> Retention of upside potential via implicit
fuel hedges
> Focus on value maximisation
> Less risky position due to lower volatility
and ability to model fundamentally
> Position hedged flexibly to maximise value
> Hedge position limited to match expected
in-the-money generation position
Power only Gas to power/coal to power
72 RWE AG | Capital Market Day | London, 28 March 2017
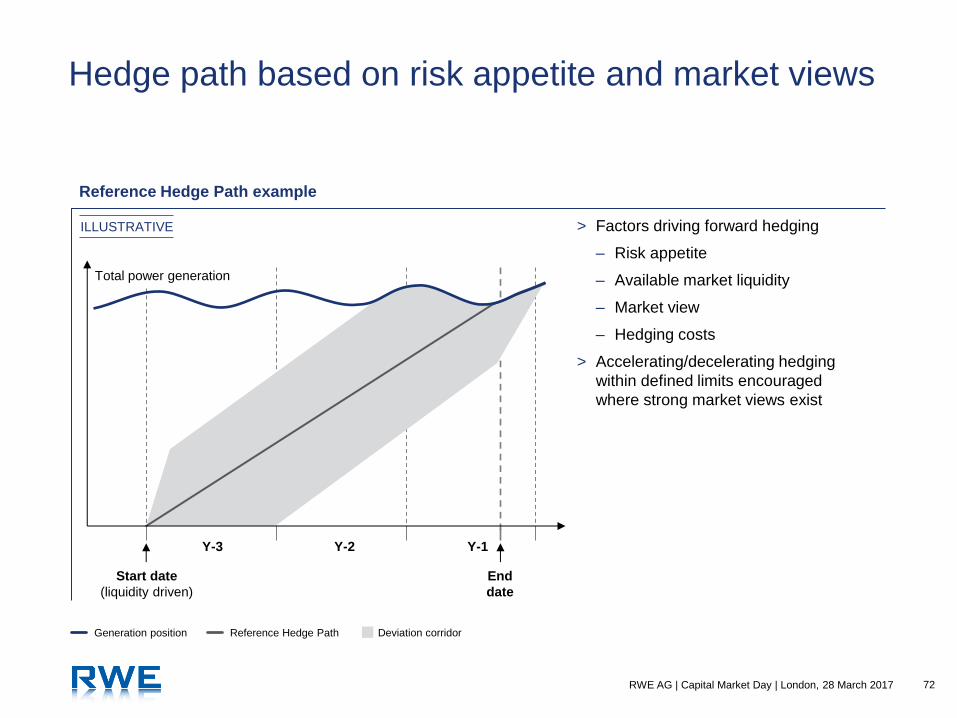
Y-3 Y-2 Y-1
Start date
(liquidity driven)
End
date
Total power generation
Hedge path based on risk appetite and market views
Reference Hedge Path example
> Factors driving forward hedging
– Risk appetite
– Available market liquidity
– Market view
– Hedging costs
> Accelerating/decelerating hedging
within defined limits encouraged
where strong market views exist
Generation position Reference Hedge Path Deviation corridor
ILLUSTRATIVE

73 RWE AG | Capital Market Day | London, 28 March 2017
Optimised hedging to reflect fundamental
market view
Production and hedged position
Simple linear technology-based hedge
Implicit fuel hedge approach
Rationale
> Liquidity in national power markets can constrain
hedging volumes
> Liquidity in fuel markets generally much higher,
allowing for faster hedging if desired
Methodology
> Short selling of fuel converts long outright power
position into lower risk long spread position
> Basket of fuel sold constantly monitored
and adjusted
Advantages
> Effective de-risking of outright position against
volatile fuel prices
> Retained upside from spread positions
(less volatile and higher confidence than
outright prices)
0%
20%
40%
60%
80%
100%
0%
20%
40%
60%
80%
100%
Outright Spread
Outright Outright converted to spread Spread
(Open p
ositio
n)
(Open p
ositio
n)
74 RWE AG | Capital Market Day | London, 28 March 2017
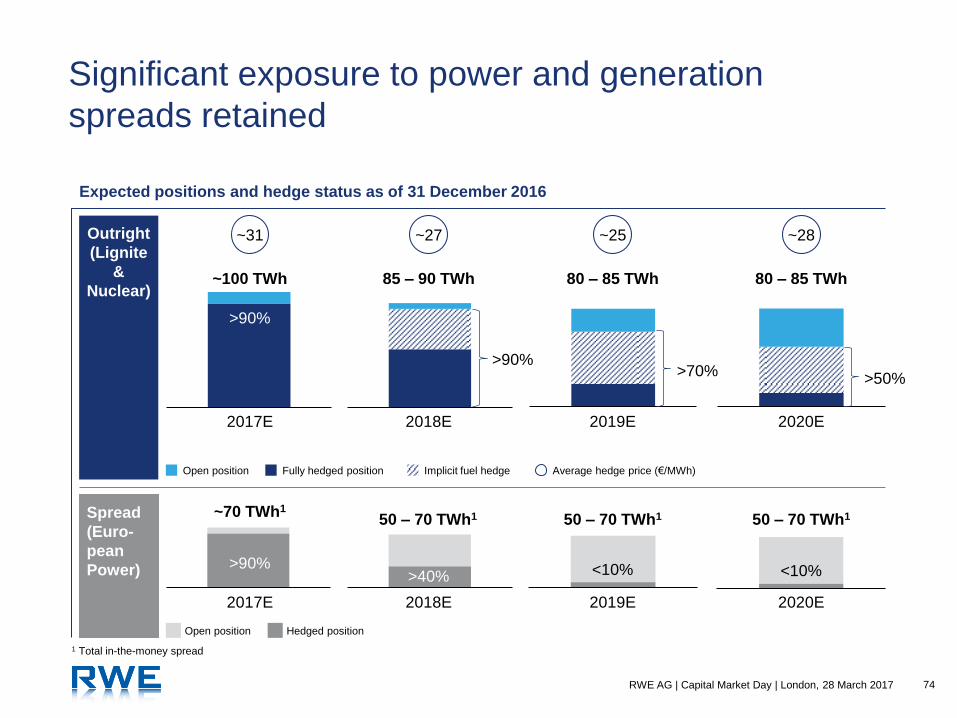
Significant exposure to power and generation
spreads retained
Outright
(Lignite
&
Nuclear)
Spread
(Euro-
pean
Power)
2017E 2018E 2019E 2020E
2017E 2018E 2019E 2020E
Open position Hedged position
~100 TWh 85 – 90 TWh
~70 TWh1
50 – 70 TWh1 50 – 70 TWh1 50 – 70 TWh1
>90%
<10% >40% >90%
<10%
80 – 85 TWh 80 – 85 TWh
Expected positions and hedge status as of 31 December 2016
Fully hedged position Average hedge price (€/MWh) Implicit fuel hedge Open position
~31 ~27 ~25 ~28
1 Total in-the-money spread
>90% >70%
>50%

75 RWE AG | Capital Market Day | London, 28 March 2017
Changes in hedging rates can add significant value
15
20
25
30
35
40
Jan 2014 Jan 2015 Jan 2016 Jan 2017
> Spreads increased nearer to delivery in recent
years
> Decelerated hedging added significant value
> Hedging can be accelerated, depending on
market views
(3.0)
(2.0)
(1.0)
0.0
1.0
2.0
3.0
4.0
5.0
35 33 31 29 27 25 23 21 19 17 15 13 11 9 7 5 3 1
Months to delivery
Cal 16 Cal 17 Cal 18 Cal 19
> High volatility over last 18 months driven by coal
prices
> Hedging approach limited downside risk from very
low outright prices in early 2016
Cal 2017
2017 Ø
hedged price
2018 Ø
hedged price
2019 Ø
hedged price
Cal 2018 Cal 2019
1 Fuel spread defined as: Power price – (pass-through-factor carbon × EUA price + pass-through-factor coal × coal price + pass-through-factor gas × gas price)
Source: Bloomberg as of 31st December 2016
(€/MWh)
Development of German base load prices Development of German fuel spreads1
(€/MWh)
76 RWE AG | Capital Market Day | London, 28 March 2017
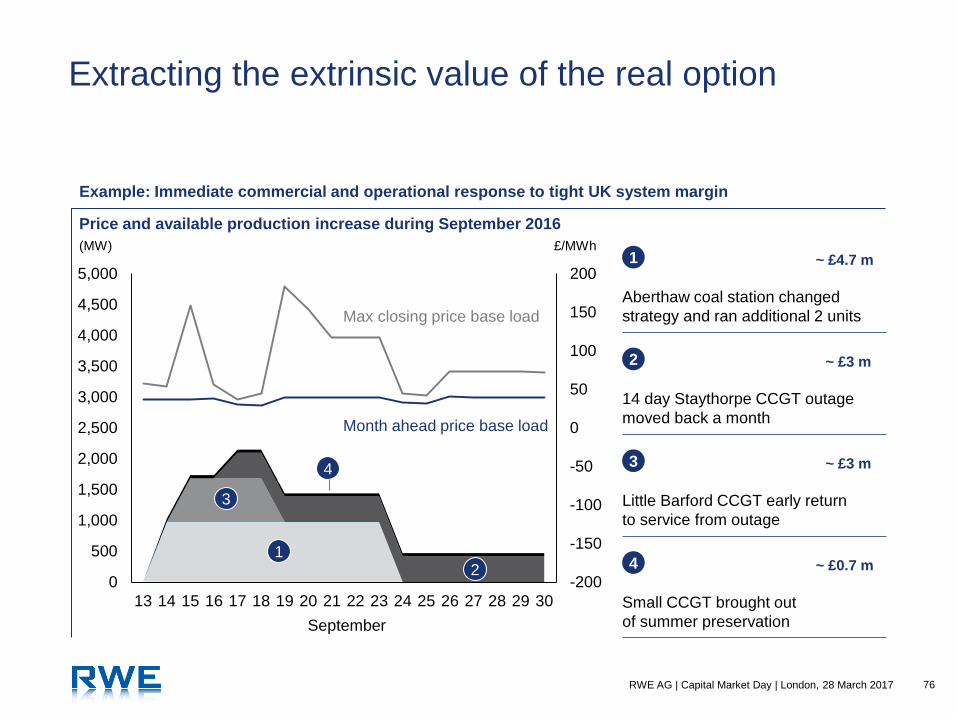
Extracting the extrinsic value of the real option
-200
-150
-100
-50
0
50
100
150
200
0
500
1,000
1,500
2,000
2,500
3,000
3,500
4,000
4,500
5,000
13 14 15 16 17 18 19 20 21 22 23 24 25 26 27 28 29 30
September
Price and available production increase during September 2016
£/MWh (MW)
Aberthaw coal station changed
strategy and ran additional 2 units
1 ~ £4.7 m
14 day Staythorpe CCGT outage
moved back a month
2 ~ £3 m
Little Barford CCGT early return
to service from outage
3 ~ £3 m
4
Small CCGT brought out
of summer preservation
~ £0.7 m 1
2
3
Max closing price base load
Month ahead price base load
4
Example: Immediate commercial and operational response to tight UK system margin
77 RWE AG | Capital Market Day | London, 28 March 2017
CAO – key messages
Application of trading mind-set to commercial management of assets
Flexible and market driven execution of hedging strategies
Proven track record of value extraction from existing asset base
Well positioned to capture upside from increasingly volatile power markets
✔
✔
✔
✔
Supply & Trading
Value creation through fundamental
understanding of markets
Andree Stracke
Chief Commercial Officer Origination & Gas Supply
RWE Supply & Trading

79 RWE AG | Capital Market Day | London, 28 March 2017
Strong commercial platform for Supply & Trading
activities
Customers
Physical
assets Markets
CAO
> Real asset
options
> Commercial
asset
management
Trading
> Trading/
origination
> Principal
Investments
Supply
> Gas & LNG
> Commodity
solutions
Skills and capabilities
Market
know-how
IT and risk
management
Commercial
mind set
People and talents
Market
access
Logistic operations
80 RWE AG | Capital Market Day | London, 28 March 2017
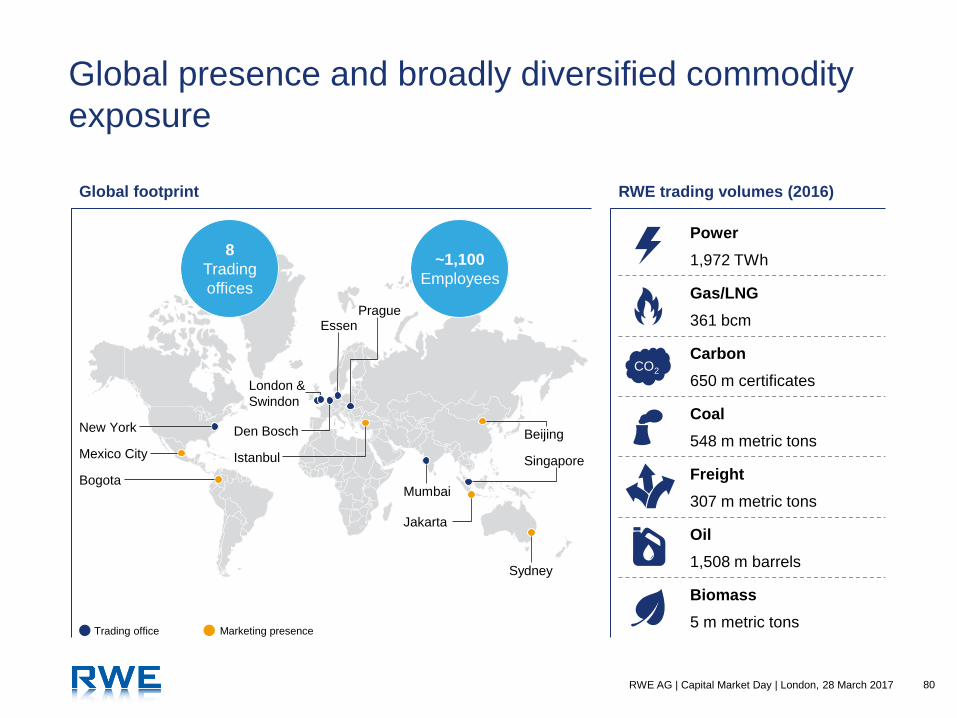
Global presence and broadly diversified commodity
exposure
RWE trading volumes (2016)
Power
1,972 TWh
Gas/LNG
361 bcm
Carbon
650 m certificates
Coal
548 m metric tons
Freight
307 m metric tons
Oil
1,508 m barrels
Biomass
5 m metric tons
CO2
London &
Swindon
Den Bosch
Essen Prague
Istanbul
Beijing
Mumbai
Singapore
Jakarta
Trading office Marketing presence
Sydney
New York
Mexico City
Bogota
Global footprint
~1,100
Employees
8
Trading
offices
81 RWE AG | Capital Market Day | London, 28 March 2017
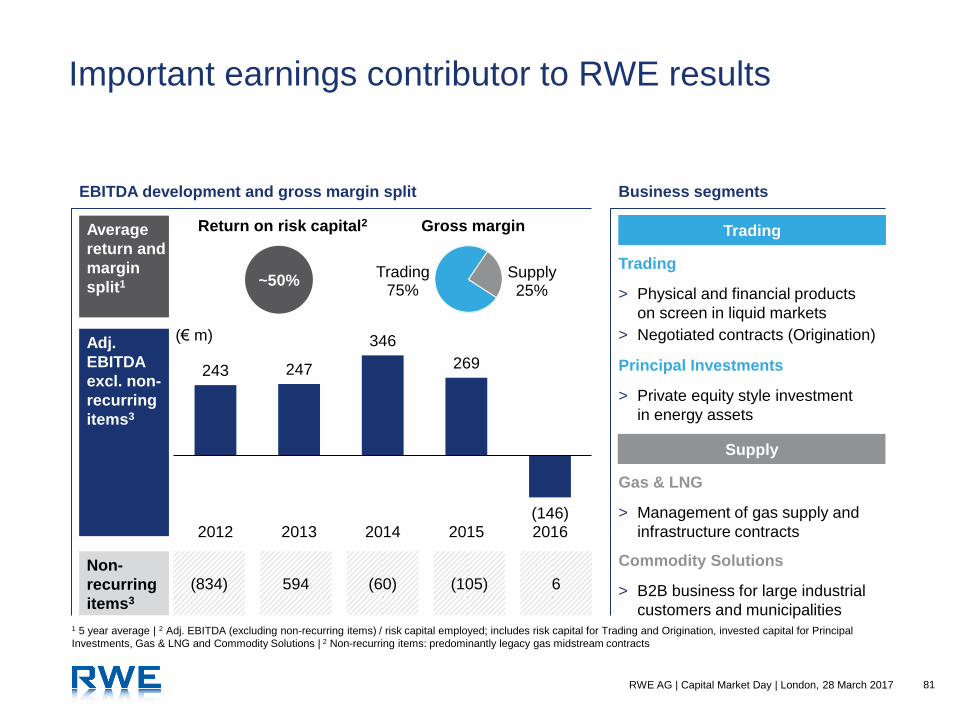
Trading 75%
Supply 25%
Important earnings contributor to RWE results
Trading
Supply
243 247
346
269
(146) 2012 2013 2014 2015 2016
Adj.
EBITDA
excl. non-
recurring
items3
Non-
recurring
items3
(834) 594 (60) (105) 6
(€ m)
EBITDA development and gross margin split Business segments
Trading
> Physical and financial products
on screen in liquid markets
> Negotiated contracts (Origination)
Principal Investments
> Private equity style investment
in energy assets
Gas & LNG
> Management of gas supply and
infrastructure contracts
Commodity Solutions
> B2B business for large industrial
customers and municipalities
Gross margin
~50%
Average
return and
margin
split1
Return on risk capital2
1 5 year average | 2 Adj. EBITDA (excluding non-recurring items) / risk capital employed; includes risk capital for Trading and Origination, invested capital for Principal
Investments, Gas & LNG and Commodity Solutions | 2 Non-recurring items: predominantly legacy gas midstream contracts

82 RWE AG | Capital Market Day | London, 28 March 2017
Trading: Track record of attractive risk adjusted
returns
12.3 12.1 15.4
11.2 13.9 6.3 8.0 10.9
15.8 17.1
(200)
0
200
400
600
800
1,000
1,200
2007 2008 2009 2010 2011 2012 2013 2014 2015 2016
Gross margin (lhs) Annual average VaR (€ m)
Gross margin versus VaR
(€ m) > Strong track record of achieving
attractive returns while staying
below risk limits
> Historically, average portfolio VaR
has been significantly below VaR
limit (1 day, 95%) of €40 m
> Long term average gross margin
of approx. €400 m
> Industry benchmark of 10-times
VaR limit set for performance
83 RWE AG | Capital Market Day | London, 28 March 2017
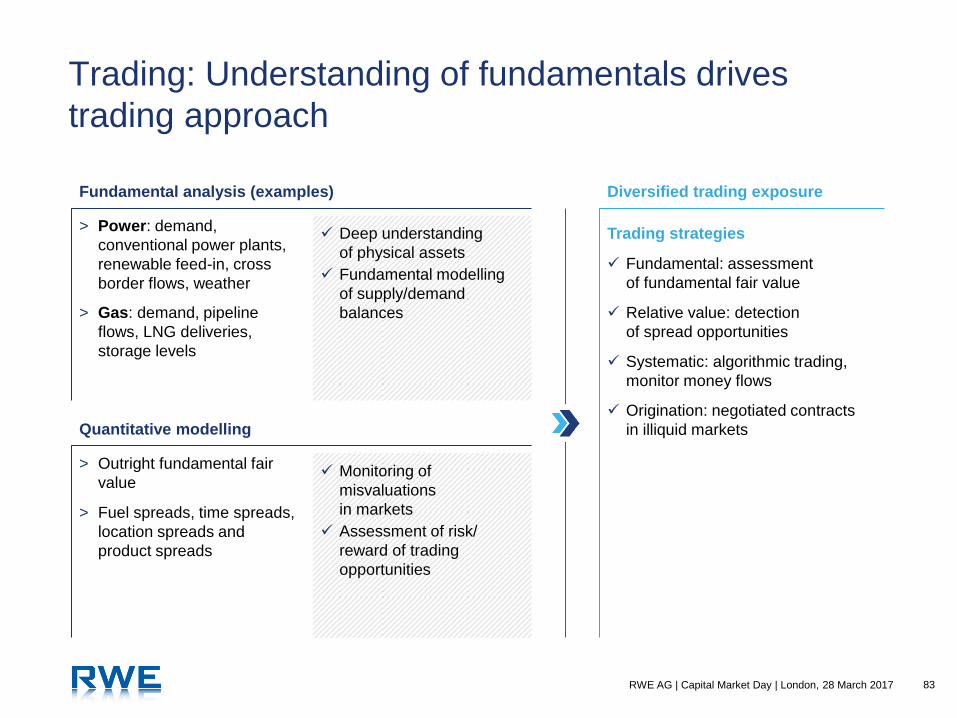
Trading: Understanding of fundamentals drives
trading approach
Fundamental analysis (examples)
Quantitative modelling
> Power: demand,
conventional power plants,
renewable feed-in, cross
border flows, weather
> Outright fundamental fair
value
Deep understanding
of physical assets
Fundamental modelling
of supply/demand
balances
Monitoring of
misvaluations
in markets
Assessment of risk/
reward of trading
opportunities
> Gas: demand, pipeline
flows, LNG deliveries,
storage levels
> Fuel spreads, time spreads,
location spreads and
product spreads
Diversified trading exposure
Trading strategies
Fundamental: assessment
of fundamental fair value
Relative value: detection
of spread opportunities
Systematic: algorithmic trading,
monitor money flows
Origination: negotiated contracts
in illiquid markets
84 RWE AG | Capital Market Day | London, 28 March 2017
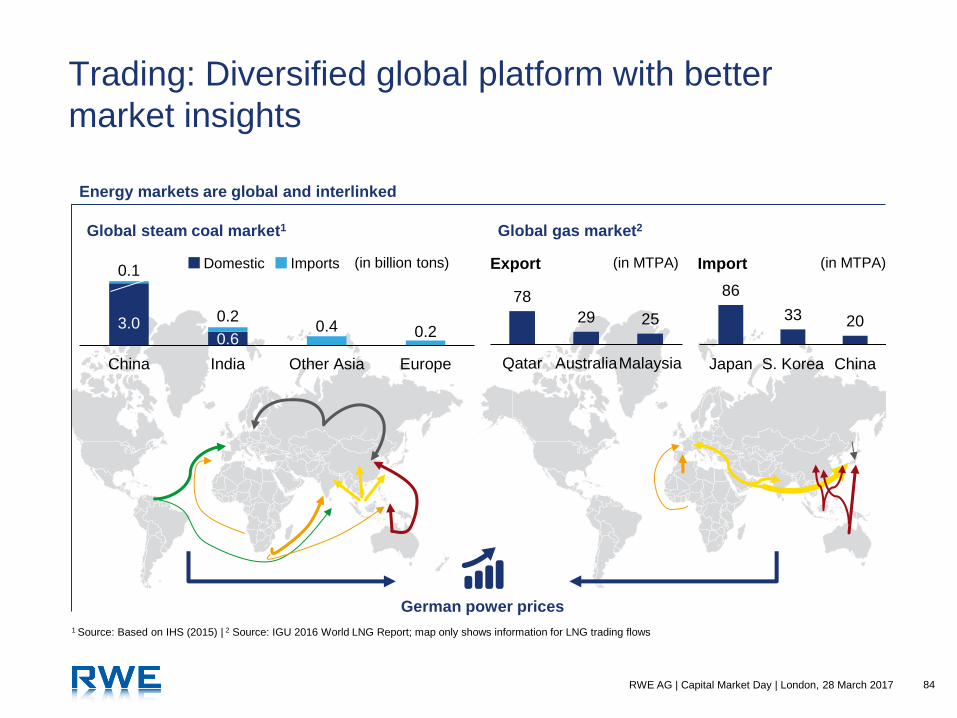
Trading: Diversified global platform with better
market insights
German power prices
Export Import (in MTPA) (in MTPA)
1 Source: Based on IHS (2015) | 2 Source: IGU 2016 World LNG Report; map only shows information for LNG trading flows
Energy markets are global and interlinked
Global steam coal market1 Global gas market2
3.0 0.6
0.1
0.2 0.4 0.2
China India Other Asia Europe
(in billion tons) Domestic Imports
86
33 20
Japan S. Korea China
78
29 25
Qatar AustraliaMalaysia

85 RWE AG | Capital Market Day | London, 28 March 2017
Principal Investments: Successful track record of
energy related investments
Case studies of investments
Lynemouth Power (UK)
> Acquisition of 420 MW coal-fired power station
including permission to convert to biomass in 2012
> RWE developed a “shovel ready” engineering project
for the conversion which was awarded a CfD by UK
government
> Disposal to EPH in January 2016 realising a book gain
of €33m
Blackhawk mining (US)
> Central Appalachian based mining
company producing both metallurgical and thermal coal
> Minority equity investment in 2012 concurrent with coal
marketing agreement leveraging RWE’s global solid
fuels trading platform
> Dominant consolidator during market turmoil of
2013 – 2016, increasing output >10× and shifting
primary focus from thermal to metallurgical coal
> Financial turnaround with significant positive EBITDA
expected in 2017
Strategic approach
> Established to invest across the commodity spectrum
> Focus on private equity-like investments where RWE
Supply & Trading can extract value from strong trading
capability and asset know-how
> Current investment portfolio of ~€100 m with average
deal size of ~€15 m
> Equity IRR targets of 15 – 20%
> Global focus: Europe, Americas and Asia-Pacific
> Target holding period 3 to 5 years
Active investments

86 RWE AG | Capital Market Day | London, 28 March 2017
Gas & LNG: Leading European gas portfolio player
Overview Long-term contracted volumes
> Integrated diversified portfolio of supply, transport,
storage and sales contracts
> Primarily merchant positions (no operation
of pipelines, terminals or storage assets)
> Global LNG sourcing and supplying
> Development of new opportunities with upstream
and midstream partners, and further geographic
expansion of physical portfolio
> Focus on value maximisation from gas and LNG
portfolio and its embedded optionality with portfolio
optimisation and new contracts in existing and new
markets
> Provision of products and services to all of innogy’s
gas retail portfolios and external customers
Successful restructuring of gas portfolio
> Successful renegotiation of supply and storage
contracts to reflect market conditions
> No oil-to-gas spread exposure for the coming years
> Remaining risks fully provisioned
0
5
10
15
2017 2018 2019 2020 2021Supply Storage
(bcm)
87 RWE AG | Capital Market Day | London, 28 March 2017
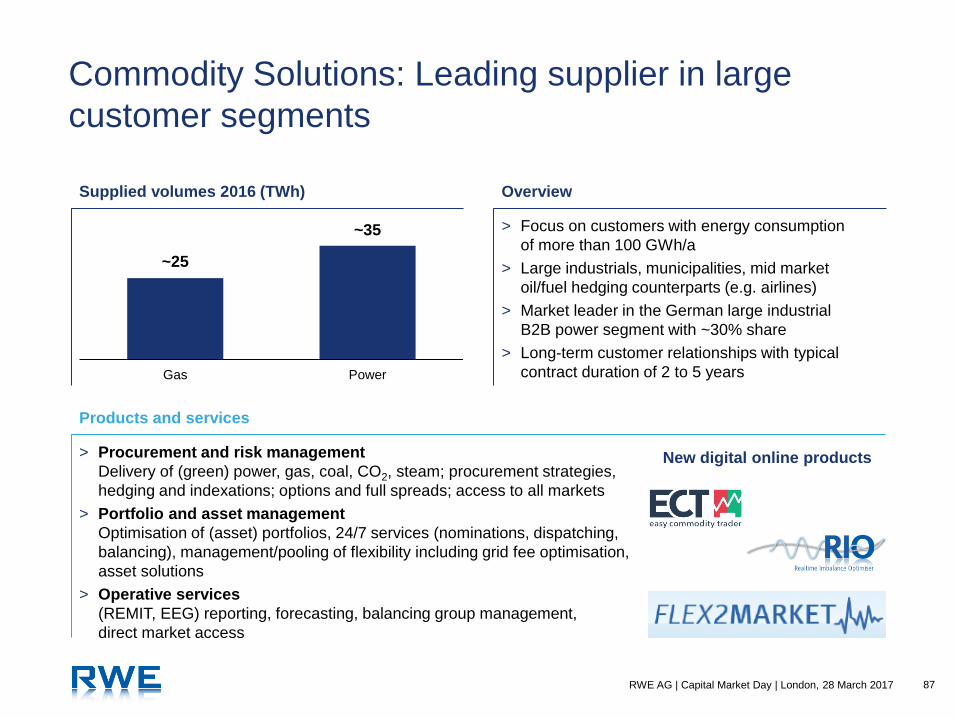
Commodity Solutions: Leading supplier in large
customer segments
Overview Supplied volumes 2016 (TWh)
Products and services
> Focus on customers with energy consumption
of more than 100 GWh/a
> Large industrials, municipalities, mid market
oil/fuel hedging counterparts (e.g. airlines)
> Market leader in the German large industrial
B2B power segment with ~30% share
> Long-term customer relationships with typical
contract duration of 2 to 5 years
> Procurement and risk management
Delivery of (green) power, gas, coal, CO2, steam; procurement strategies,
hedging and indexations; options and full spreads; access to all markets
> Portfolio and asset management
Optimisation of (asset) portfolios, 24/7 services (nominations, dispatching,
balancing), management/pooling of flexibility including grid fee optimisation,
asset solutions
> Operative services
(REMIT, EEG) reporting, forecasting, balancing group management,
direct market access
New digital online products
Gas Power
~35
~25

88 RWE AG | Capital Market Day | London, 28 March 2017
Comprehensive risk management and limit system
Elements of risk management
Value-at-Risk (VaR)
Trading VaR limit: €40m
Delta
Limits for individual commodities
Stress test
Limits for entire position
Stop-loss
Absolute, draw down
HR
Internal development of senior traders
and minimal external hires at senior level
Risk culture
Zero tolerance policy, immediate escalation
Incentive model
Based on EVA including risk capital,
partly deferred bonus with claw back mechanism
Risk governance
MaRisk compliant policy and ongoing
improvements
Quantitative Qualitative

89 RWE AG | Capital Market Day | London, 28 March 2017
Organic growth initiatives: Leveraging skill set and
know-how
Solid fuels Asia Pacific
> Grow Asia-Pacific business footprint
> Develop physical and financial portfolio including
JVs and partnerships with local incumbents
Asian power trading
> Actively seek opportunities to enter liberalising
power markets
> Engage local counterparties, leverage existing
trading know-how and infrastructure
Principal Investments
> Focus on commodity-linked investments
to realise synergies with energy trading
> Develop opportunity pipeline and gradually
grow invested funds
European gas portfolio
> Expand and leverage pan-European gas portfolio
> Innovative service and product offering and
increased focus on structured products
Global LNG portfolio
> Become global boutique portfolio player
> Build and balance portfolio in a step-by-step
approach – adding global diversified supply
Commodity solutions
> Expand customer base and products/
service offering
> Leverage trading platform and Commercial Asset
Optimisation (CAO) services
Global expansion of trading business Growth in gas supply/commodity solutions
90 RWE AG | Capital Market Day | London, 28 March 2017
Supply & Trading – key messages
Leading platform providing competitive advantage through market insights
Strong track record of attractive returns and earnings contribution
Comprehensive risk control and management system
Organic expansion leveraging existing skills and know-how
✔
✔
✔
✔

Closing remarks
92 RWE AG | Capital Market Day | London, 28 March 2017
Committed to value creation and sustainable dividend with upside potential
Investment highlights
Leading integrated European generation and trading business
Strong track record of operational excellence and commercial optimisation
Well placed to benefit from fundamental changes in energy markets
Solid financial position and focus on cash flow generation
✔
✔
✔
✔
✔

Appendix

94 RWE AG | Capital Market Day | London, 28 March 2017
Income statement 2016
(€ million) RWE stand-alone RWE Group
Revenue (including natural gas tax/electricity tax) 19,574 45,833
Natural gas tax/electricity tax -180 -2,243
Revenue 19,394 43,590
Other operating income 1,161 1,435
Cost of materials -16,829 -33,397
Staff costs -1,921 -4,777
Depreciation, amortisation and impairment losses -4,878 -6,647
Other operating expenses -2,519 -4,323
Income from investments accounted for using the equity method 130 387
Other income from investments 1,042 153
Financial result -1,375 -2,228
Income before tax -5,795 -5,807
Taxes on income -6 323
Income -5,800 -5,484
of which: non-controlling interest 52 -167
of which: RWE AG hybrid capital investors’ interest -59 -59
of which: net income/income attributable to RWE AG shareholders -5,807 -5,710
95 RWE AG | Capital Market Day | London, 28 March 2017
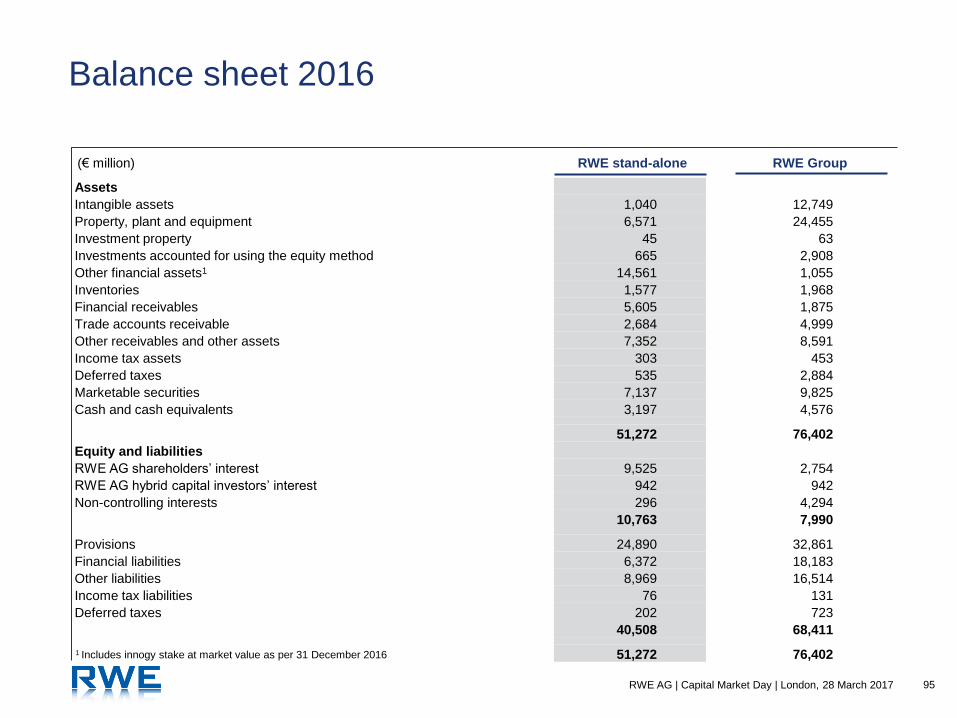
Balance sheet 2016
(€ million) RWE stand-alone RWE Group
Assets
Intangible assets 1,040 12,749
Property, plant and equipment 6,571 24,455
Investment property 45 63
Investments accounted for using the equity method 665 2,908
Other financial assets1 14,561 1,055
Inventories 1,577 1,968
Financial receivables 5,605 1,875
Trade accounts receivable 2,684 4,999
Other receivables and other assets 7,352 8,591
Income tax assets 303 453
Deferred taxes 535 2,884
Marketable securities 7,137 9,825
Cash and cash equivalents 3,197 4,576
51,272 76,402
Equity and liabilities
RWE AG shareholders’ interest 9,525 2,754
RWE AG hybrid capital investors’ interest 942 942
Non-controlling interests 296 4,294
10,763 7,990
Provisions 24,890 32,861
Financial liabilities 6,372 18,183
Other liabilities 8,969 16,514
Income tax liabilities 76 131
Deferred taxes 202 723
40,508 68,411
51,272 76,402 1 Includes innogy stake at market value as per 31 December 2016
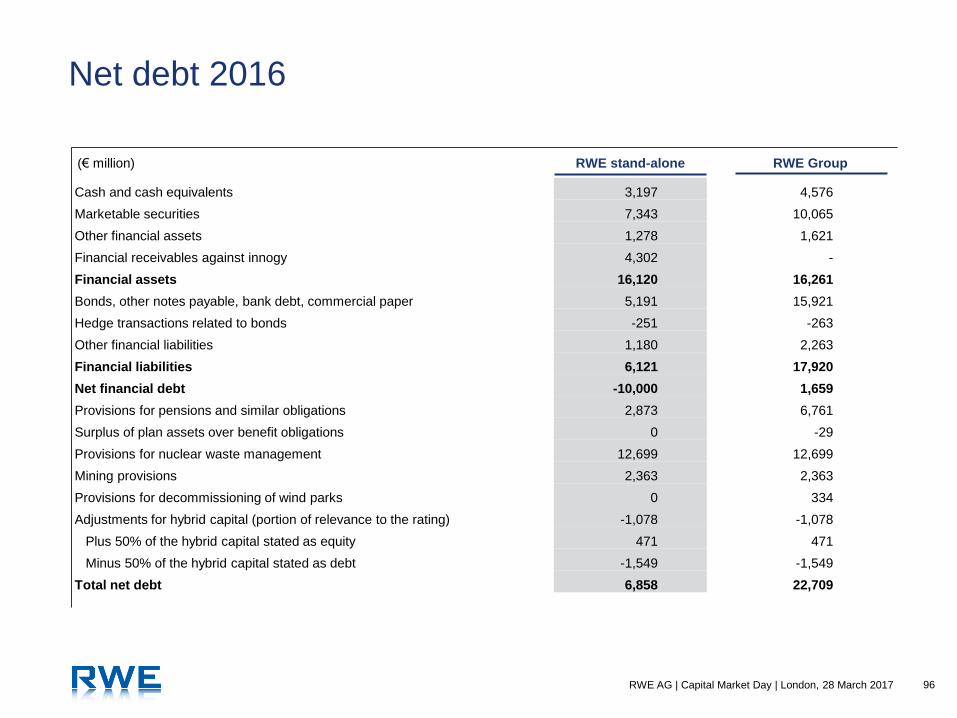
96 RWE AG | Capital Market Day | London, 28 March 2017
Net debt 2016
(€ million) RWE stand-alone RWE Group
Cash and cash equivalents 3,197 4,576
Marketable securities 7,343 10,065
Other financial assets 1,278 1,621
Financial receivables against innogy 4,302 -
Financial assets 16,120 16,261
Bonds, other notes payable, bank debt, commercial paper 5,191 15,921
Hedge transactions related to bonds -251 -263
Other financial liabilities 1,180 2,263
Financial liabilities 6,121 17,920
Net financial debt -10,000 1,659
Provisions for pensions and similar obligations 2,873 6,761
Surplus of plan assets over benefit obligations 0 -29
Provisions for nuclear waste management 12,699 12,699
Mining provisions 2,363 2,363
Provisions for decommissioning of wind parks 0 334
Adjustments for hybrid capital (portion of relevance to the rating) -1,078 -1,078
Plus 50% of the hybrid capital stated as equity 471 471
Minus 50% of the hybrid capital stated as debt -1,549 -1,549
Total net debt 6,858 22,709
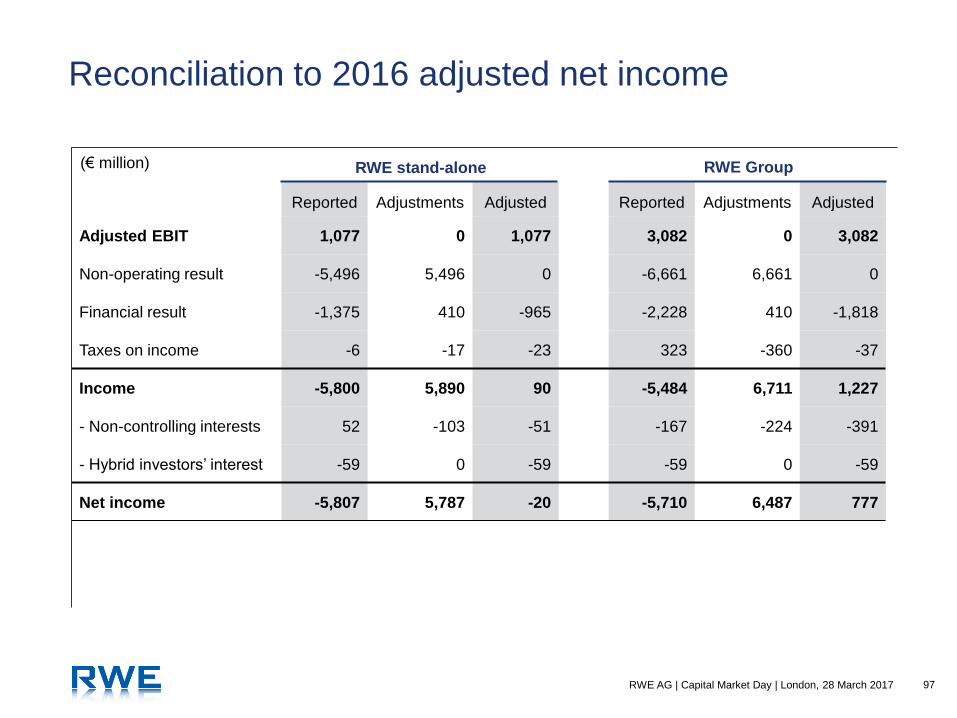
97 RWE AG | Capital Market Day | London, 28 March 2017
Reconciliation to 2016 adjusted net income
Reported Adjustments Adjusted Reported Adjustments Adjusted
Adjusted EBIT 1,077 0 1,077 3,082 0 3,082
Non-operating result -5,496 5,496 0 -6,661 6,661 0
Financial result -1,375 410 -965 -2,228 410 -1,818
Taxes on income -6 -17 -23 323 -360 -37
Income -5,800 5,890 90 -5,484 6,711 1,227
- Non-controlling interests 52 -103 -51 -167 -224 -391
- Hybrid investors’ interest -59 0 -59 -59 0 -59
Net income -5,807 5,787 -20 -5,710 6,487 777
RWE stand-alone RWE Group (€ million)
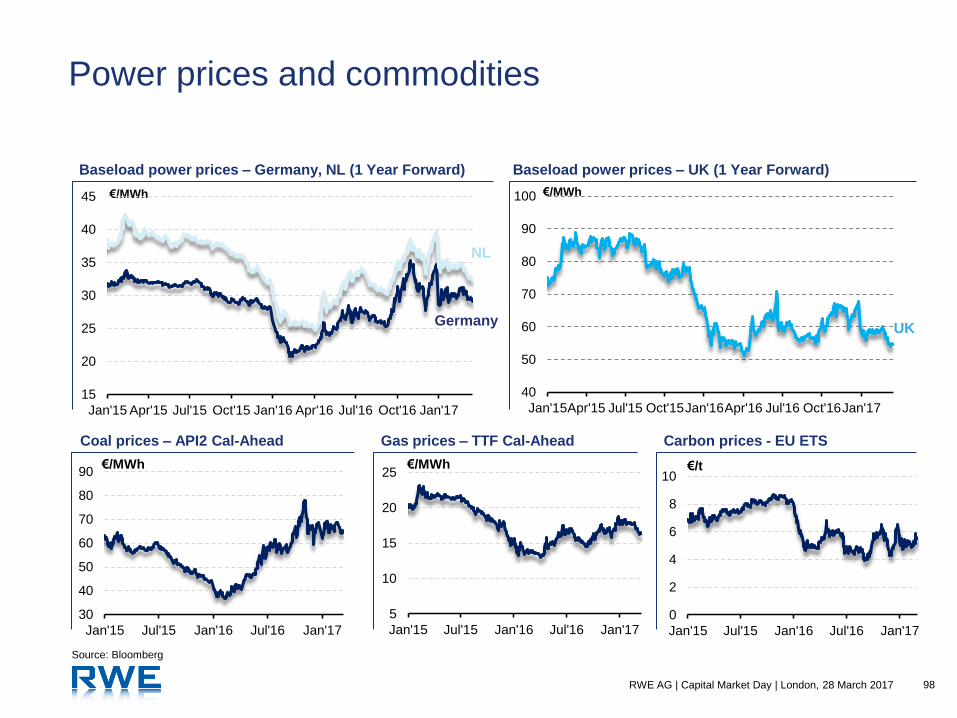
98 RWE AG | Capital Market Day | London, 28 March 2017
Power prices and commodities
Coal prices – API2 Cal-Ahead
30
40
50
60
70
80
90
Jan'15 Jul'15 Jan'16 Jul'16 Jan'17
Gas prices – TTF Cal-Ahead
€/MWh
Carbon prices - EU ETS
€/MWh
0
2
4
6
8
10
Jan'15 Jul'15 Jan'16 Jul'16 Jan'17
€/t
5
10
15
20
25
Jan'15 Jul'15 Jan'16 Jul'16 Jan'17
Source: Bloomberg
Baseload power prices – Germany, NL (1 Year Forward)
€/MWh
15
20
25
30
35
40
45
Jan'15 Apr'15 Jul'15 Oct'15 Jan'16 Apr'16 Jul'16 Oct'16 Jan'17
UK Germany
NL
Baseload power prices – UK (1 Year Forward)
40
50
60
70
80
90
100
Jan'15Apr'15 Jul'15 Oct'15Jan'16Apr'16 Jul'16 Oct'16Jan'17
€/MWh
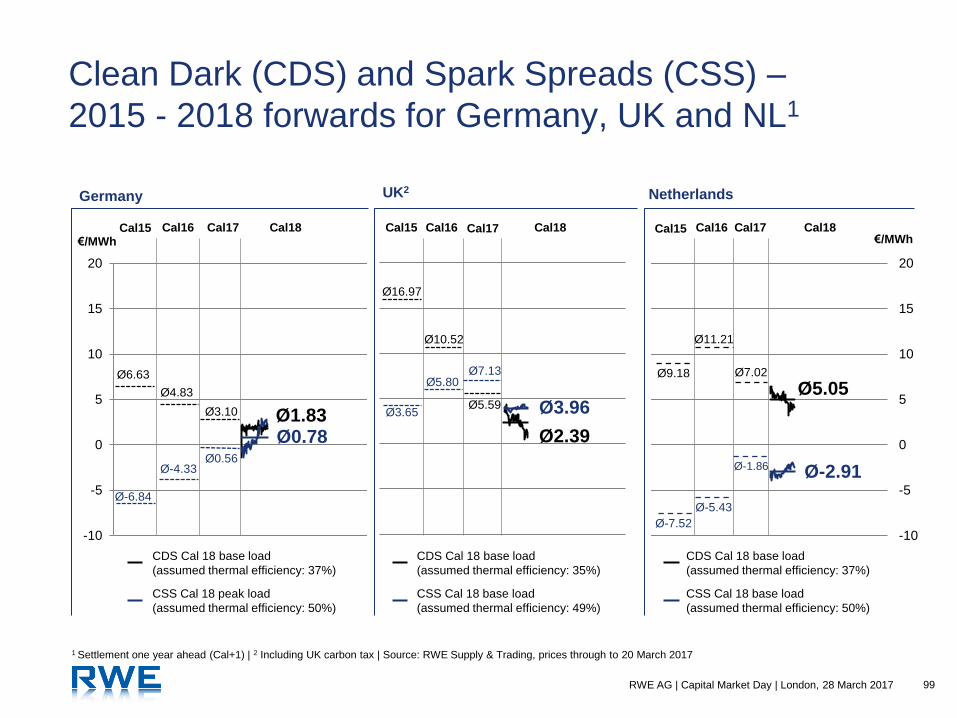
99 RWE AG | Capital Market Day | London, 28 March 2017
Clean Dark (CDS) and Spark Spreads (CSS) –
2015 - 2018 forwards for Germany, UK and NL1
1 Settlement one year ahead (Cal+1) | 2 Including UK carbon tax | Source: RWE Supply & Trading, prices through to 20 March 2017
CDS Cal 18 base load
(assumed thermal efficiency: 37%)
CSS Cal 18 peak load
(assumed thermal efficiency: 50%)
CDS Cal 18 base load
(assumed thermal efficiency: 35%)
CSS Cal 18 base load
(assumed thermal efficiency: 49%)
CDS Cal 18 base load
(assumed thermal efficiency: 37%)
CSS Cal 18 base load
(assumed thermal efficiency: 50%)
€/MWh €/MWh Cal16 Cal18 Cal17 Cal15 Cal18 Cal16 Cal16 Cal18 Cal17
-10
-5
0
5
10
15
20
-10
-5
0
5
10
15
20
Ø3.10
Ø4.83
Ø-4.33 Ø0.56
Ø0.78 Ø1.83 Ø3.96
Ø2.39
Ø10.52
Ø5.80
Ø-2.91
Ø5.05
Ø-5.43
Ø11.21
Ø7.13
Ø5.59
Ø7.02
Ø-1.86
Germany UK2 Netherlands
Ø6.63
Ø-6.84
Cal15 Cal17
Ø16.97
Ø3.65
Ø9.18
Ø-7.52
Cal15

100 RWE AG | Capital Market Day | London, 28 March 2017
RWE power plant portfolio
Power plant
Country
Commissioned
Net
capacity
RWE's legal
consolidation
stake
RWE's
economic
stake
Partner
Stake
in
MW
%
MW
%
MW
%
Lignite
Frimmersdorf Germany 1966,1970 562 100.0 562 100.0 562
Neurath Germany 1972–1976 2,091 100.0 2,091 100.0 2,091
Neurath (BoA 2&3) Germany 2012 2,120 100.0 2,120 100.0 2,120
Niederaussem Germany 1965–1974 2,446 100.0 2,446 100.0 2,446
Niederaussem (BoA1) Germany 2002 944 100.0 944 100.0 944
Weisweiler Germany 1965–1975 1,913 100.0 1,913 100.0 1,913
Goldenberg Germany 1992, 1993 40 100.0 40 100.0 40
Refining plants (Berrenrath, Fortuna, Wachtberg) Germany various 180 100.0 180 100.0 180
Mátra Hungary 1967 763 100.0 763 51.0 389 EnBW, MVM 49.0
Total lignite 11,059 11,059 10,685
Nuclear
KKW Emsland Germany 1988 1,336 87.5 1,336 87.5 1,169 E.ON 12.5
Gundremmingen B Germany 1984 1,284 75.0 1,284 75.0 963 E.ON 25.0
Gundremmingen C Germany 1984 1,288 75.0 1,288 75.0 966 E.ON 25.0
Total nuclear 3,908 3,908 3,098
Hard coal
Gersteinwerk Werne Kv2 Germany 1984 620 100.0 620 100.0 620
GW Bergkamen A Germany 1981 720 100.0 720 100.0 720
Ibbenbüren Germany 1985 794 100.0 794 100.0 794
Westfalen E Germany 2014 764 100.0 764 100.0 764
Eemshaven A Netherlands 2014 777 100.0 777 100.0 777
Eemshaven B Netherlands 2014 777 100.0 777 100.0 777
Amercentrale ST 9 Netherlands 1993 503 100.0 503 100.0 503
Aberthaw B UK 1971–1979 1,560 100.0 1,560 100.0 1,560
Total hard coal (without contractually secured power plants) 6,515 6,515 6,515
As of 31 December 2016

101 RWE AG | Capital Market Day | London, 28 March 2017
RWE power plant portfolio (continued)
Power plant
Country
Commissioned
Net
capacity
RWE's legal
consolidation
stake
RWE's
economic
stake
Partner
Stake
in
MW
%
MW
%
MW
%
Gas
Emsland B, C, D Germany 1973/74, 2010/12 1,837 100.0 1,837 100.0 1,837
Gersteinwerk F – I Germany 1973 1,285 100.0 1,285 100.0 1,285
Gersteinwerk Werne Kv1 Germany 1984 112 100.0 112 100.0 112
Weisweiler VGT G, H Germany 2006 544 100.0 544 100.0 544
Bochum Germany 2004 21 100.0 21 100.0 21
Dortmund Germany 2004 26 100.0 26 100.0 26
GuD Dormagen Germany 2000 326 100.0 326 100.0 326
GuD Dormagen Germany 2000 260 100.0 260 0.0 0 Bayer AG 100.0
Moerdijk Netherlands 1996 339 100.0 339 100.0 339
Moerdijk 2 Netherlands 2012 426 100.0 426 100.0 426
Inesco (Antwerpen) Belgium 2007 133 100.0 133 100.0 133
Clauscentrale A (gas/oil) Netherlands 1977 610 100.0 610 100.0 610
Clauscentrale C Netherlands 2012 1,304 100.0 1,304 100.0 1,304
Swentibold CC Netherlands 1999 245 100.0 245 100.0 245
Elsta CC Netherlands 1998 405 25.0 0 39.5 160 AES, Delta 75.0
Great Yarmouth UK 2001 398 100.0 398 100.0 398
Little Barford UK 1994 727 100.0 727 100.0 727
Didcot B UK 1996-1997 1,440 100.0 1,440 100.0 1,440
Staythorpe UK 2010 1,740 100.0 1,740 100.0 1,740
Pembroke UK 2012 2,181 100.0 2,181 100.0 2,181
Phillips Petroleum UK 1999 55 100.0 55 100.0 55
Cheshire UK 2000 40 100.0 40 100.0 40
Cheshire East UK 2016 6 100.0 6 30.0 2 Aggreko
Hythe UK 2005 56 100.0 56 100.0 56
Whitegate Ireland 1998 6 100.0 6 100.0 6
Mátra Hungary 2007 60 100.0 60 51.0 31 EnBW, MVM 49.0
Denizli Turkey 2013 787 100.0 787 70.0 551 Turcas 30.0
Total gas 15,369 14,964 14,595
As of 31 December 2016

102 RWE AG | Capital Market Day | London, 28 March 2017
RWE power plant portfolio (continued)
Power plant
Country
Commissioned
Net
capacity
RWE's legal
consolidation
stake
RWE's
economic
stake
Partner
Stake
in
MW
%
MW
%
MW
%
Oil
OCGTs (gas oil, various sites) UK 264 100.0 264 100.0 264
Grimsby (gas oil) UK 18 100.0 18 50.0 9 Aggreko
Total oil 282 282 273
Renewables
Various sites (hydro run-of-river) Germany 17 17 17
Linne HH 1-4 (hydro run-of-river) Netherlands 1989 11 100.0 11 100.0 11
Amercentrale ST 9 (biomass) Netherlands 1993 140 100.0 140 100.0 140.0
Markinch (biomass) UK 2014 55 100.0 55 100.0 55
Mátra (solar) Hungary 16 51.0 16 51.0 8 EnBW, MVM 49.0
Total renewables (without contractually secured power plants) 239 239 231
Other
MHKW Karnap (waste incineration) Germany 1987 38 100.0 38 100.0 38
Köpchenwerk (pump storage) Germany 1989 165 100.0 165 100.0 165
MVA Weisweiler Germany 1996 24 100.0 24 100.0 24
SRS Ecotherm Germany 2003 1 100.0 1 100.0 1
Total other 228 228 228
As of 31 December 2016
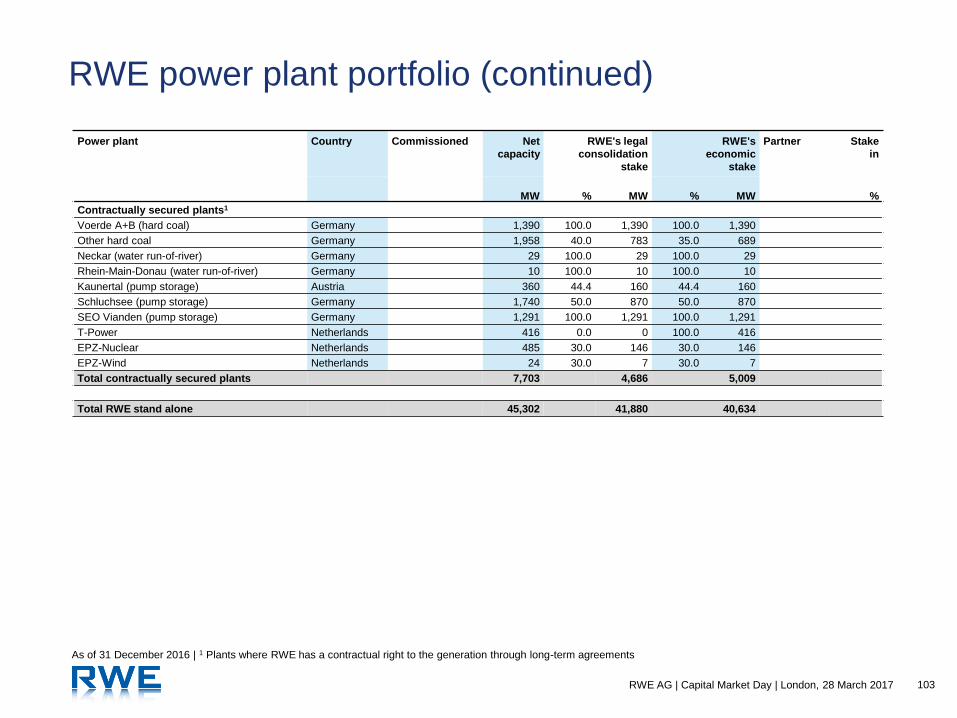
103 RWE AG | Capital Market Day | London, 28 March 2017
RWE power plant portfolio (continued)
Power plant
Country
Commissioned
Net
capacity
RWE's legal
consolidation
stake
RWE's
economic
stake
Partner
Stake
in
MW
%
MW
%
MW
%
Contractually secured plants1
Voerde A+B (hard coal) Germany 1,390 100.0 1,390 100.0 1,390
Other hard coal Germany 1,958 40.0 783 35.0 689
Neckar (water run-of-river) Germany 29 100.0 29 100.0 29
Rhein-Main-Donau (water run-of-river) Germany 10 100.0 10 100.0 10
Kaunertal (pump storage) Austria 360 44.4 160 44.4 160
Schluchsee (pump storage) Germany 1,740 50.0 870 50.0 870
SEO Vianden (pump storage) Germany 1,291 100.0 1,291 100.0 1,291
T-Power Netherlands 416 0.0 0 100.0 416
EPZ-Nuclear Netherlands 485 30.0 146 30.0 146
EPZ-Wind Netherlands 24 30.0 7 30.0 7
Total contractually secured plants 7,703 4,686 5,009
Total RWE stand alone 45,302 41,880 40,634
As of 31 December 2016 | 1 Plants where RWE has a contractual right to the generation through long-term agreements

104 RWE AG | Capital Market Day | London, 28 March 2017
Overview of capacity measures
Measure Plant MW1 Fuel Location Date
Decom-
missioning
Goldenbergwerk 110 Lignite DE Q3-2015
Amer 8 610 Hard coal NL Q1-2016
Westfalen C 285 Hard coal DE Q1-2016
Mid-size units 190 Gas NL Q4-2016
Voerde A/B 1,390 Hard coal DE Q1-2017
Gersteinwerk K2 610 Hard coal DE Q1-2019
Mothballed2 Claus A 610 Gas NL Q1-2012
Weisweiler H 270 Topping gas turbine DE Q3-2013
Weisweiler G 270 Topping gas turbine DE Q3-2013
Gersteinwerk F 355 Gas – steam turbine DE Q3-2013
Gersteinwerk G 355 Gas – steam turbine DE Q2-2014
Claus C 1,300 Gas NL Q3-2014
Moerdijk 1 339 Gas NL Q1-2018
Moerdijk 2 430 Gas NL Q1-2018
Termination
of contracts
Confidential 2,960 Hard coal DE Q4-2013 –
Q2-2015
Stand-by
reserve3
Frimmersdorf P & Q 560 Lignite DE Q4-2017
Niederaußem E & F 590 Lignite DE Q4-2018
Neurath C 290 Lignite DE Q4-2019
Total 11,524
1 Net nominal capacity, rounded | 2 In times of market tightness mothballed plants might return
temporarily to the system | 3 Capacity will be decommissioned after 4 years in the reserve