Rutting of Caltrans Asphalt Concrete and Asphalt-Rubber ... of Caltrans AC.pdfRutting of Caltrans...
169
DRAFT Rutting of Caltrans Asphalt Concrete and Asphalt-Rubber Hot Mix Under Different Wheels, Tires and Temperatures – Accelerated Pavement Testing Evaluation Report Prepared for CALIFORNIA DEPARTMENT OF TRANSPORTATION by John Harvey and Lorina Popescu January 2000 Pavement Research Center Institute of Transportation Studies University of California, Berkeley
Transcript of Rutting of Caltrans Asphalt Concrete and Asphalt-Rubber ... of Caltrans AC.pdfRutting of Caltrans...

DRAFT
Rutting of Caltrans Asphalt Concrete and Asphalt-Rubber Hot Mix
Under Different Wheels, Tires and Temperatures – Accelerated
Pavement Testing Evaluation
Report Prepared for
CALIFORNIA DEPARTMENT OF TRANSPORTATION
by
John Harvey and Lorina Popescu
January 2000Pavement Research Center
Institute of Transportation StudiesUniversity of California, Berkeley

ii

iii
TABLE OF CONTENTS
List of Tables.................................................................................................................................vii
List of Figures ................................................................................................................................ ix
1.0 Background and Scope............................................................................................................ 1
1.1 Background – Caltrans Flexible Overlay Strategies ........................................................... 1
1.2 Scope of this Report ............................................................................................................ 5
2.0 Laboratory and HVS Experiment Designs.............................................................................. 7
2.1 HVS Test Experiment Design ............................................................................................. 8
2.1.1 Layout of Test Sections............................................................................................... 9
2.1.2 Pavement Structures.................................................................................................. 10
2.1.3 Materials.................................................................................................................... 21
2.2 HVS Test Conditions, Instrumentation and Data Collection ............................................ 31
2.2.1 Trafficking................................................................................................................. 31
2.2.2 Tires and Wheels....................................................................................................... 31
2.2.3 Wheel Speed and Direction....................................................................................... 34
2.2.4 Instrumentation and Data Collection......................................................................... 36
2.2.5 Heating and Temperature Control............................................................................. 38
3.0 Heavy Vehicle Simulator Test Results.................................................................................. 41
iv
3.1 Pavement Temperatures .................................................................................................... 41
3.2 Rutting Results .................................................................................................................. 45
3.2.1 Comparison of Tire/Wheel Types ............................................................................. 54
3.2.2 Comparison of Overlay Types .................................................................................. 56
3.2.3 Comparison of Pavement Temperature..................................................................... 59
3.3 Contribution to Rutting of Shear and Densification of Different Layers.......................... 61
3.3.1 Profile changes .......................................................................................................... 61
3.3.2 Air-void content changes .......................................................................................... 62
3.3.3 Thickness Changes.................................................................................................... 66
3.3.4 Identification of Shear and Densification.................................................................. 71
3.4 Rutting in the Underlying Layers...................................................................................... 78
3.5 Late Bonding of Layers..................................................................................................... 80
4.0 Conclusions and Recommendations...................................................................................... 83
4.1 Conclusions ....................................................................................................................... 83
4.2 Recommendations ............................................................................................................. 85
5.0 References ............................................................................................................................. 87
Appendix A: Caltrans ARHM-GG/DGAC Thickness Equivalencies........................................... 89
Appendix B: Thickness Data from Cores and Trench Slabs......................................................... 91

v
Appendix C: Air-Void Content Data .......................................................................................... 101
Appendix D: Deflections and Back-Calculated Moduli ............................................................. 111
Appendix E: Temperature Data................................................................................................... 113
Appendix F: Average Transverse Surface Profiles versus Load Repetitions ............................. 115
Appendix G Transverse Profiles from AC Slabs from Trenches................................................ 125
Appendix H Development of Rut and Hump Volume Under Trafficking from Transverse Surface
Profiles ........................................................................................................................................ 137
Appendix I Transverse Aggregate Base Surface Profiles at Termination of Trafficking........... 147

vi

vii
LIST OF TABLES
Table 1 Matrix of HVS test experiment variables and test numbers....................................... 9
Table 2 Asphalt concrete layer thicknesses (mm) adjacent to rutting test sectionsmeasured from cores and slabs................................................................................. 13
Table 3 Summary of thicknesses (mm) by layer and overlay type. ...................................... 14
Table 4 Approximate thicknesses of underlying layers. ....................................................... 14
Table 5 Air-void contents prior to HVS trafficking, from cores........................................... 16
Table 6 Summary of average air-void contents prior to trafficking (percent) by layer andoverlay type. ............................................................................................................. 16
Table 7 Summary data of measured deflections (microns) and back-calculated moduli(MPa) before overlay construction, 1 March, 1997 ................................................. 19
Table 8 Summary data of measured deflections (microns) and back-calculated moduli(MPa)after overlay construction, 1 April, 1997 ....................................................... 19
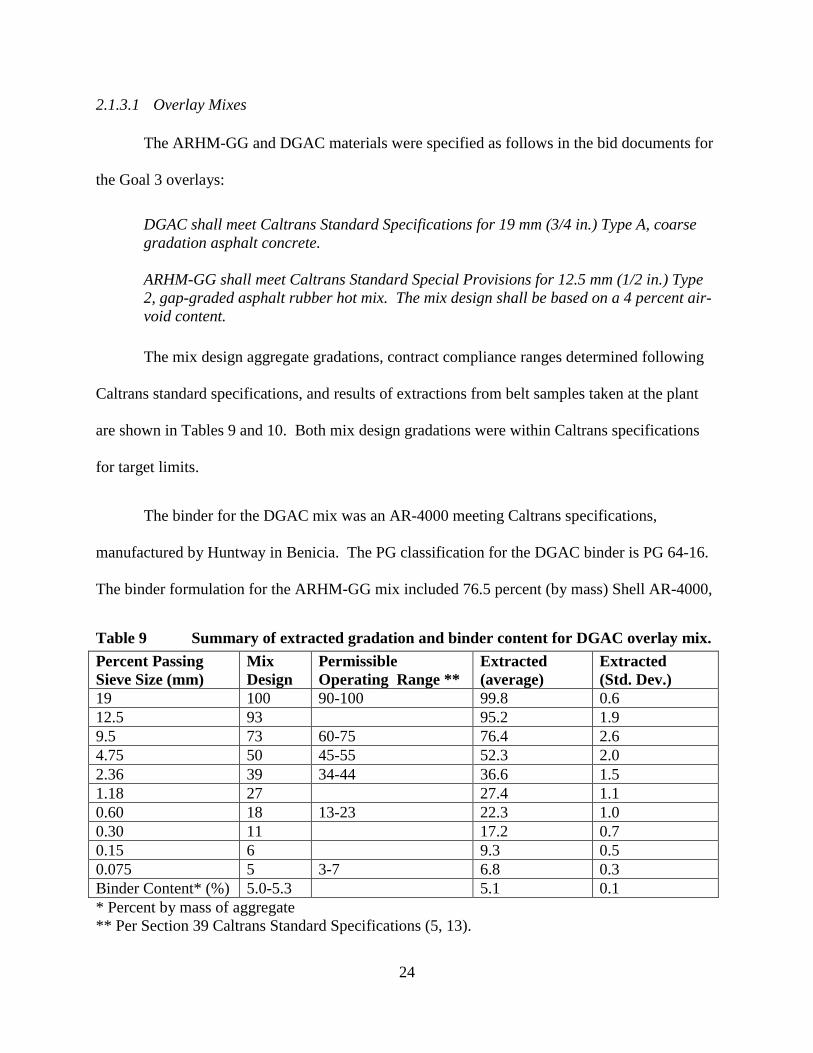
Table 9 Summary of extracted gradation and binder content for DGAC overlay mix. ........ 24
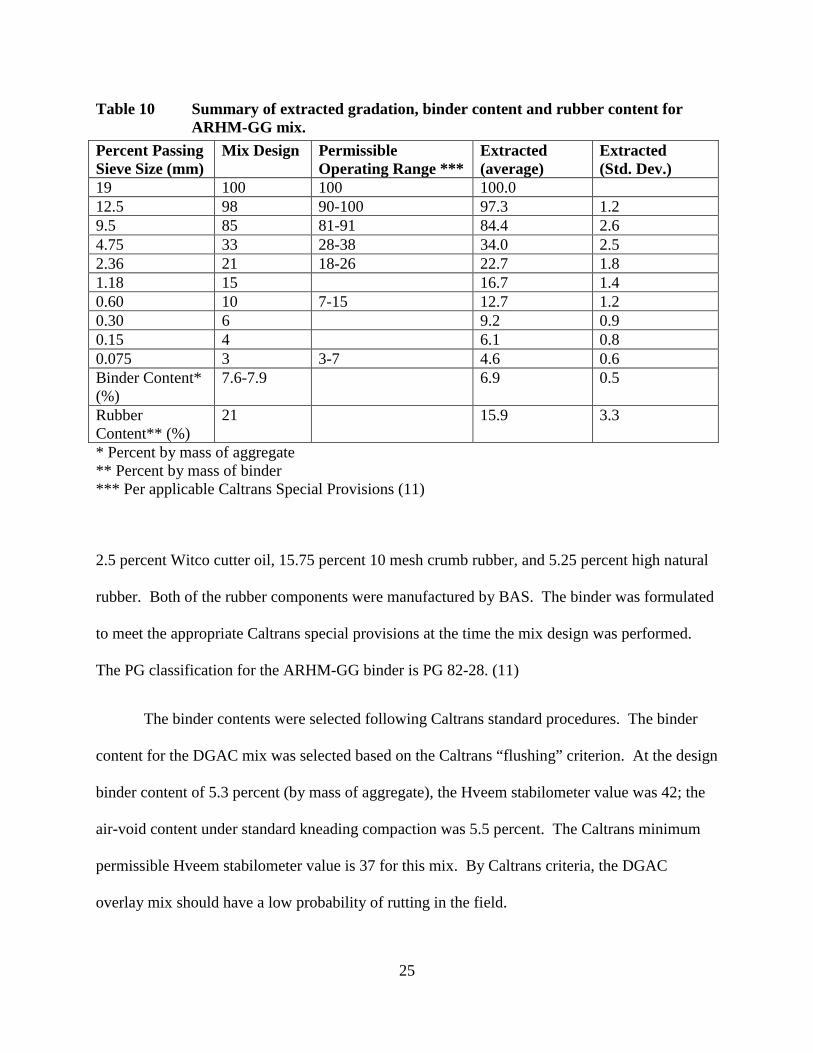
Table 10 Summary of extracted gradation, binder content and rubber content for ARHM-GG mix..................................................................................................................... 25
Table 11. Summary of extracted gradation and binder content for Goal 1 asphalt concretemix............................................................................................................................ 29
Table 12 Calculated surface contact durations for tire/wheel types included in study,assuming average unidirectional wheel speed. (18)................................................. 35
Table 13. Comparison of single variables from HVS test section results.................................... 41
Table 14 Summary of pavement temperatures and thermocouple depths during HVStrafficking. ................................................................................................................ 42
Table 15 Temperature gradients in asphalt bound layers, assuming linear gradient betweentop and bottom thermocouples. ................................................................................ 45
Table 16 Average maximum rut depth and load repetitions at completion of HVStrafficking. ................................................................................................................ 51
Table 17 Load repetitions to 6.25 mm and 12.5 mm average maximum rut depth. ............... 53
Table 18 Air-void contents before and after HVS trafficking, from cores. ............................ 63
Table 19 Final wheelpath air-void contents by tire/wheel type and layer type....................... 65
viii
Table 20 Final hump air-void contents by tire/wheel type and layer type. ............................. 66
Table 21. Thicknesses before and after HVS trafficking, from slabs. ......................................... 67
Table 22 Thicknesses before and after HVS trafficking, from cores. ..................................... 68
Table 23 Thickness of ATPB before and after HVS trafficking, from cores.......................... 68
Table 24 Summary averages for percent change in thickness of asphalt concrete layersunder HVS trafficking.............................................................................................. 70
Table 25 Percent change of layer thickness from slabs and cores, and change of air-voidcontent from cores at end of HVS trafficking. ......................................................... 72
Table 26 Volume of wheelpaths and humps, percent of rut volume attributed to shear(ratio of hump to wheelpath volume) and densification (1-shear), average acrossall data acquisitions during HVS trafficking............................................................ 76
Table 27 Volume of wheelpaths and humps, percent of rut volume attributed to shear(ratio of hump to wheelpath volume) and densification (1-shear), at 13 mm rutdepth. ........................................................................................................................ 76
Table 28 Summary averages of percent of rut volume attributed to shear and densification. 77
Table A-1 California Structural Equivalencies. ......................................................................... 89
Table A-2 California Reflective Crack Retardation Equivalencies............................................ 89
Table B-1 Thickness Data from Before Trafficking. ................................................................. 92
Table B-2 Thickness in the Wheelpaths after Trafficking. ........................................................ 95
Table B-3 Thickness of the Humps After Trafficking. .............................................................. 98
Table C-1 Air-Void Contents Before Trafficking.................................................................... 102
Table C-2 Air-Void Contents in Wheelpaths After Trafficking. ............................................. 105
Table C-3 Air-Void Contents in Humps after Trafficking....................................................... 108
Table D-1 Deflection data on rutting test sections (3/1/1997). ................................................ 111
Table D-2 Deflection data on rutting test section after construction (4/1/1997)...................... 112
Table E-1 Average Temperature, Sections 510RF and 511RF............................................... 113
Table E-2 Average Temperature, Section 512 RF.................................................................. 113
ix
LIST OF FIGURES
Figure 1. Layout of Goal 3 HVS tests sections. ........................................................................... 10
Figure 2. Drained pavement structure. ......................................................................................... 11
Figure 3. Undrained pavement structure. ..................................................................................... 11
Figure 4. Locations of deflection measurements and HVS rutting test sections.......................... 18
Figure 5. Sensor 1 and Sensor 7 deflections along deflection lines, prior to overlay construction.20
Figure 6. Back-calculated moduli for granular layers and subgrade before overlay. .................. 22
Figure 7. Average back-calculated moduli for granular layers and subgrade before and afteroverlay construction...................................................................................................... 23
Figure 8. Extracted aggregate gradations for DGAC and ARHM-GG overlay mixes (sieve sizesto 0.45 power), and Superpave maximum density lines. .............................................. 28
Figures 9a and 9b. Aluminum reflector with resistance-heating element and infrared lamps..... 40
Figure 10. Average pavement temperature profiles during HVS trafficking............................... 44
Figure 11. Average pavement temperature profiles during HVS trafficking for three overlaysunder dual-radial wheel. ............................................................................................... 46
Figure 12. Average pavement temperature profiles during HVS trafficking for three overlaysunder wide-base single wheel. ...................................................................................... 47
Figure 13. Average pavement temperature profiles during HVS trafficking for four tire types onDGAC overlay. ............................................................................................................. 48
Figure 14. Average pavement temperature profiles during HVS trafficking for two temperatures,wide-base single wheel, DGAC overlay....................................................................... 49
Figure 15. Plot of average maximum rut depth versus load repetitions for all test sections........ 50
Figure 16. Plot of average maximum rut development versus load repetitions for four tire/wheeltypes on DGAC overlay................................................................................................ 55
Figure 17. Plot of average maximum rut development versus load repetitions for DGAC, 38 mmARHM-GG and 62 mm ARHM-GG overlays under dual/radial tires.......................... 57
Figure 18. Plot of average maximum rut development versus load repetitions for DGAC, 38 mmARHM-GG and 62 mm ARHM-GG overlays under wide-base single tire. ................ 58
x
Figure 19. Plot of average maximum rut development versus load repetitions for DGAC overlayat two different temperatures. ....................................................................................... 60
Figure 20. Percent change in layer thickness versus air-void content change from HVStrafficking in the wheelpath. ......................................................................................... 74
Figure 21. Percent change in layer thickness versus air-void content change from HVStrafficking in the wheelpath. ......................................................................................... 75
Figure F-1. Profilometer data from Section 505RF. .................................................................. 116
Figure F-2. Profilometer data from Section 506RF. .................................................................. 117
Figure F-3. Profilometer data from Section 507RF. .................................................................. 118
Figure F-4. Profilometer data from Section 508RF. .................................................................. 119
Figure F-5. Profilometer data from Section 509RF. .................................................................. 120
Figure F-6. Profilometer data from Section 510RF. .................................................................. 121
Figure F-7. Profilometer data from Section 511RF. .................................................................. 122
Figure F-8. Profilometer data from Section 512RF. .................................................................. 123
Figure F-9. Profilometer data from Section 513RF. .................................................................. 124
Figure G-1. Transverse profile of trenched AC slab from Section 504RF. ............................... 126
Figure G-2. Transverse profile of trenched AC slab from Section 505RF. ............................... 127
Figure G-3. Transverse profile of trenched AC slab from Section 506RF. ............................... 128
Figure G-4. Transverse profile of trenched AC slab from Section 507RF. ............................... 129
Figure G-5. Transverse profile of trenched AC slab from Section 508RF. ............................... 130
Figure G-6. Transverse profile of trenched AC slab from Section 509RF. ............................... 131
Figure G-7. Transverse profile of trenched AC slab from Section 510RF. ............................... 132
Figure G-8. Transverse profile of trenched AC slab from Section 511RF. ............................... 133
Figure G-9. Transverse profile of trenched AC slab from Section 512RF. ............................... 134
Figure G-10. Transverse profile of trenched AC slab from Section 513RF. ............................. 135
Figure H-1. Development of Rut and Hump Volume Under Trafficking from Transverse SurfaceProfiles, Section 505RF. ............................................................................................. 138
xi
Figure H-2. Development of Rut and Hump Volume Under Trafficking from Transverse SurfaceProfiles, Section 506RF. ............................................................................................. 139
Figure H-3. Development of Rut and Hump Volume Under Trafficking from Transverse SurfaceProfiles, Section 507RF. ............................................................................................. 140
Figure H-4. Development of Rut and Hump Volume Under Trafficking from Transverse SurfaceProfiles, Section 508RF. ............................................................................................. 141
Figure H-5. Development of Rut and Hump Volume Under Trafficking from Transverse SurfaceProfiles, Section 509RF. ............................................................................................. 142
Figure H-6. Development of Rut and Hump Volume Under Trafficking from Transverse SurfaceProfiles, Section 510RF. ............................................................................................. 143
Figure H-7. Development of Rut and Hump Volume Under Trafficking from Transverse SurfaceProfiles, Section 511RF. ............................................................................................. 144
Figure H-8. Development of Rut and Hump Volume Under Trafficking from Transverse SurfaceProfiles, Section 512RF. ............................................................................................. 145
Figure H-9. Development of Rut and Hump Volume Under Trafficking from Transverse SurfaceProfiles, Section 513RF. ............................................................................................. 146
Figure I-1. Transverse Aggregate Base Surface Profile at Termination of Trafficking, Section505RF. ........................................................................................................................ 148
Figure I-2. Transverse Aggregate Base Surface Profile at Termination of Trafficking, Section506RF. ........................................................................................................................ 149
Figure I-3. Transverse Aggregate Base Surface Profile at Termination of Trafficking, Section507RF. ........................................................................................................................ 150
Figure I-4. Transverse Aggregate Base Surface Profile at Termination of Trafficking, Section508RF. ........................................................................................................................ 151
Figure I-5. Transverse Aggregate Base Surface Profile at Termination of Trafficking, Section509RF. ........................................................................................................................ 152
Figure I-6. Transverse Aggregate Base Surface Profile at Termination of Trafficking, Section510RF. ........................................................................................................................ 153
Figure I-7. Transverse Aggregate Base Surface Profile at Termination of Trafficking, Section511RF. ........................................................................................................................ 154
Figure I-8. Transverse Aggregate Base Surface Profile at Termination of Trafficking, Section512RF. ........................................................................................................................ 155

xii
Figure I-9. Transverse Aggregate Base Surface Profile at Termination of Trafficking, Section513RF. ........................................................................................................................ 156
1
1.0 BACKGROUND AND SCOPE
1.1 Background – Caltrans Flexible Overlay Strategies
Overlays are the primary rehabilitation strategy for flexible pavements that have cracking
or ride quality problems. The traditional material used for overlays of flexible pavements is
dense graded asphalt concrete (DGAC). Caltrans has also used asphalt-rubber hot mix gap-
graded (ARHM-GG) for overlays for approximately the last 20 years (1).
Although Caltrans has many years of experience with ARHM-GG overlays, the strategy
is not used routinely. It has been estimated that ARHM-GG is used on about 5 percent of the
lane-km overlaid in the late 1990s (exact figures are not readily available from Caltrans).
According to the 1995 Caltrans State of the Pavement Report (2), Caltrans overlaid about 990
lane-kilometers (615 lane-miles) per year between 1990/01 and 1994/95. Using the five percent
estimate, only about 50 lane-kilometer (31 lane-miles) were ARHM-GG.
In 1993, the average cost of Type A DGAC was $31.5 per ton for quantities of 5,000 tons
or more. In the same year, the average cost per ton of ARHM-GG was $56.5 per ton for
quantities of 1,000 to 10,000 tons, and $40.8 for 10,000 or more tons. Thus, the cost per ton of
ARHM-GG is between about 30 to 80 percent more than that of DGAC. (3)
The Caltrans design method for DGAC overlay thickness for structural overlays is based
on surface deflections and component analysis, and empirical estimates of thickness to retard
reflections cracking (California Test Method 356 [4]). The thickness design method for ARHM-
GG overlays is based on the DGAC design thickness and other criteria, which are included in a
thickness design guide document published by the Caltrans Engineering Service Center (1). The
2
structural and reflection cracking equivalencies of ARHM-GG compared to DGAC have evolved
over the years, primarily based on observations of test section performance. The latest
equivalencies are summarized in Appendix A (1).
Following Caltrans guidelines, the maximum ARHM-GG overlay thickness is 60 mm,
and the minimum is 30 mm. ARHM-GG to DGAC equivalence ratios range between 1.5 and 2.0
for structural applications where fatigue cracking is the expected distress mode, and 1.5 to 2.33
where reflection cracking is the expected is distress mode. The structural and reflection cracking
ratios are larger if a Stress Absorbing Membrane Interlayer (SAMI) is placed between the
existing pavement and the ARHM-GG overlay.
Selection of optimum binder content in the mix design for DGAC is performed following
California Test Method 367 (4). The criteria for DGAC binder content selection are minimum
value for Hveem stabilometer (CTM 366 [4]), four percent air-void content under standard
kneading compaction (CTM 304, 308 [4]), and a “flushing” criterion in which the technician
determines whether the mix looks over-asphalted. The minimum Hveem stabilometer value for
19-mm maximum aggregate size DGAC Type A is 37.
Mix design for ARHM-GG is performed following guide documents published by the
Caltrans Engineering Service Center. The current criteria are a minimum Hveem stabilometer
value of 23, a minimum air-void content of four percent under standard kneading compaction,
and a minimum 18 percent Voids in the Mineral Aggregate (VMA). The air-void content under
laboratory compaction criterion is three percent when less than about 35,000 equivalent single
axle loads (ESALs) are expected in the 10-year design life of the overlay, or when the maximum
ambient air temperature is not expected to exceed 35°C. The air-void content criterion is five
3
percent in desert areas where more than about 3,500,000 ESALs are expected in the 10-year
design life. (1)
In addition to these requirements, allowable binder contents for ARHM-GG are
constrained to be within the range of 7.0 to 9.5 percent (by mass of aggregate). Dense graded
asphalt rubber hot mix (ARHM-DG) must be within 6.5 and 8.5 percent (by mass of aggregate).
(1)
These mix design requirements are based on experience gained through a trial and error
process over the past 20 years. That process has included many successful applications of
ARHM-GG overlays, and a few severe rutting failures on ARHM-GG overlay projects in desert
areas with heavy traffic which lead to the current version of the mix design requirements.
Caltrans has recently been working on performance based specifications for ARHM. In several
cases, a performance based mix design procedure developed as part of the Strategic Highway
Research Program (SHRP) at the University of California, Berkeley has indicated the need for
lower binder contents for ARHM-GG than were recommended using the Caltrans criteria. These
cases were primarily in hot desert locations and locations with heavy traffic. The UCB
procedure includes the use of the Repeated Simple Shear Test at Constant Height (RSST-CH)
The relatively small proportion of ARHM-GG overlays compared to DGAC overlays is
likely due to the following considerations:
• Relative life cycle cost of ARHM-GG versus DGAC, given that the cost per ton in
place of ARHM-GG is greater than the cost of DGAC (although the cost data from
1993 indicate that the differential is more than offset by use of reduced thicknesses),
and
4
• Uncertainty about ability of the Caltrans mix design criteria to prevent rutting
failures, in part because ARHM-GG does not meet the criteria for Hveem
stabilometer values used for DGAC, and despite the performance history which
suggests that ARHM-GG typically has adequate rutting performance as used by
Caltrans.
It has been suggested that greater use of ARHM-GG as an overlay strategy by Caltrans is
warranted provided that the material can be routinely designed and constructed to provide
performance that results in a lower life cycle cost than the DGAC overlay strategy. However, if
life cycle costs for ARHM-GG are greater than those for DGAC, then the use of ARHM-GG is
not warranted. ARHM is assumed to be as recyclable as DGAC.
The objective of CAL/APT Goal 3 is to evaluate the long-term and short-term
performance of the two overlay strategies. Long-term performance is defined as failure from
fatigue cracking, reflection cracking or rutting of the unbound pavement layers. Short-term
performance is defined as failure by rutting of the asphalt bound materials, including the overlay,
underlying asphalt concrete or asphalt treated permeable base (ATPB). Life cycle cost is
dependent upon both long-term and short-term performance.
Rutting of the asphalt-bound layers, in particular the newly laid overlay, can occur within
a few years after rehabilitation. Typically, a rutting failure will occur within five years after
construction, before aging of the asphalt and strain-hardening and densification from trafficking
significantly increase the resistance of the mix to permanent shear deformation.

5
1.2 Scope of this Report
This report presents results from accelerated pavement tests using the Caltrans Heavy
Vehicle Simulator (HVS) of DGAC and ARHM-GG overlays placed at the University of
California, Berkeley Pavement Research Center. The results in this report are from tests
conducted at elevated temperatures to evaluate the rutting performance of the two overlay
strategies. The tests also investigated the effects of tire type, temperature and thickness of the
ARHM-GG overlay.
The overlays were placed on existing flexible pavement structures, sections of which
were previously tested as part of CAL/APT Goal 1 (5-9). The mix designs and thickness designs
for the overlays and their construction are included in References (10, 11).

6
7
2.0 LABORATORY AND HVS EXPERIMENT DESIGNS
The laboratory test and Heavy Vehicle Simulator (HVS) test experiments for this project
were designed to meet the following objectives:
1. Validate existing Caltrans mix design methods for DGAC and ARHM-GG with
respect to rutting of the mix (stability);
2. Validate mechanistic-empirical procedures for predicting rutting behavior, developed
by the University of California, Berkeley as part of the Strategic Highway Research
Program;
3. Evaluate the shear frequency sweep (FS-S) and repeated simple shear test at constant
height (RSST-CH) tests as simple performance tests for rutting;
4. Evaluate the effects of laboratory specimen compaction methods on RSST-CH test
results;
5. Provide input and validation data for mechanistic modeling of rutting in combination
with the VRSPTA test results previously produced by CAL/APT (3-D Load Cell)
data (12);
6. Compare rutting caused by radial tires on dual wheels, bias-ply tires on dual wheels,
wide base single tires (super single), and high-pressure aircraft type tires;
7. Compare the rutting behavior of typical Caltrans DGAC and ARHM-GG overlay
materials; and
8. Quantify the effects of construction variation on rutting performance.

8
Results relating to Objectives 1, 5, 6 and 7 are included in this report. Additional information
relating to completion of the remaining objectives will be included in other reports on the Goal 3
rutting experiments.
2.1 HVS Test Experiment Design
The experiment design for the HVS tests on the Goal 3 overlays included the following
variables:
• Overlay type: asphalt-rubber hot mix gap-graded (ARHM-GG) and dense graded
asphalt concrete (DGAC).
• Overlay thickness: design thicknesses for the ARHM-GG overlays were 38 and 62
mm; design thicknesses for the DGAC overlays were 62 and 75 mm. The DGAC
overlay thicknesses were assumed to be equal for the experiment design.
• Tire/wheel type: the four combinations were bias-ply tires on dual wheels, radial tires
on dual wheels, a wide base single tire/wheel, and an aircraft tire/wheel.
• Pavement temperature: one test was performed with a target temperature of 40°C at a
depth of 50 mm. All other tests were performed with a target temperature of 50°C at
a depth of 50 mm.
The matrix of primary experiment variables and associated test numbers, and the additional tests
are shown in Table 1.
9
Table 1 Matrix of HVS test experiment variables and test numbers.ARHM-GG Overlay DGAC Overlay **50°C at 50 mm depth
Dual Radial 38 mm* thick 62 mm* thick50°C at 50 mmdepth
40°C at 50 mmdepth
Dual Bias-ply 510RF 509RF 506RFWide-baseSingle
505RF
Aircraft 511RF 508RF 507RF 512RF513RF
* design thickness**design thicknesses of 62 and 75 mm; actual thicknesses varied
One test not shown in Table 1, 504RF, was performed on the surface of the Goal 1
pavement prior to placement of the Goal 3 overlays. Test 504RF was performed using the wide-
base single wheel and a target temperature of 45°C at 50 mm depth.
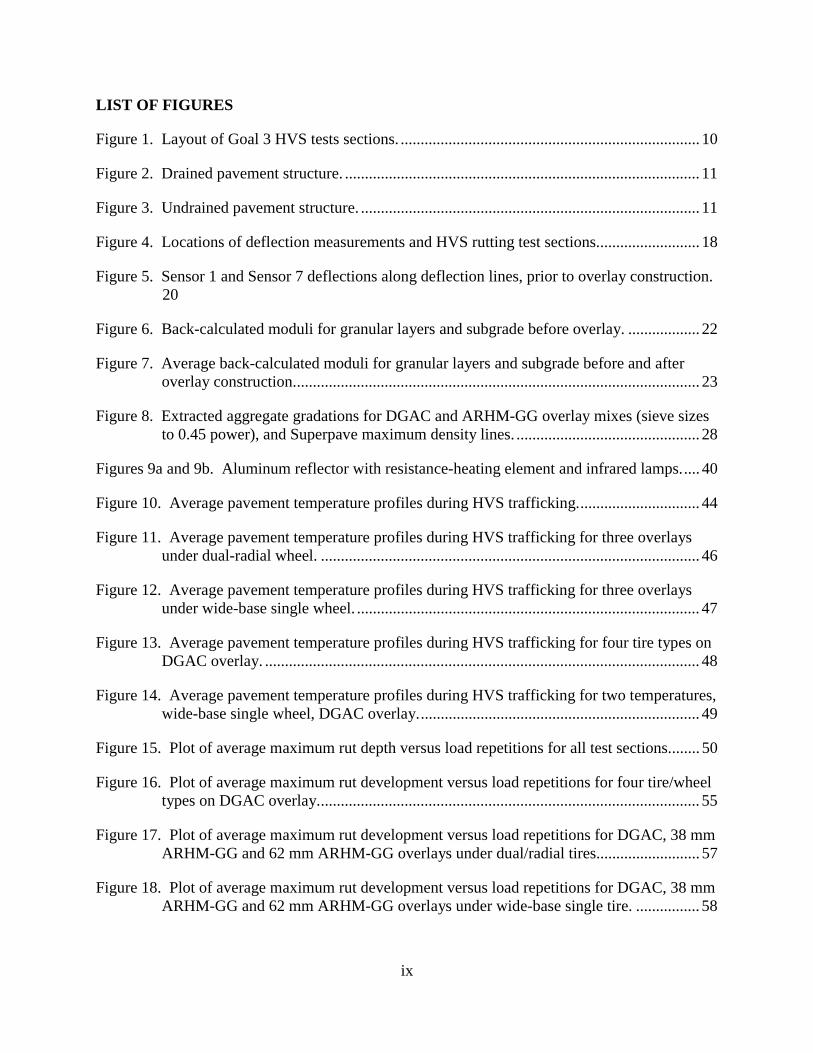
2.1.1 Layout of Test Sections
The Goal 3 Rutting test sections were located on the RFS pavement structures as shown
in Figure 1. The overlay sections included in the HVS rutting tests were in locations where the
underlying pavement structure from Goal 1 had not been trafficked. The top and bottom lifts of
the underlying Goal 1 structure were therefore uncracked. The layout of the rutting test sections
was also situated so that it avoided the transition zones between different pavement structures
and areas where cores had been taken from the underlying Goal 1 structure. It should be noted
that a portion of Section 513RF was placed over an area where some cores had been taken; that
portion of the rut test section was affected.
10
Figure 1. Layout of Goal 3 HVS tests sections.
2.1.2 Pavement Structures
The Goal 3 overlays were constructed upon the Goal 1 pavement structures. The Goal 1
structures included two types: “drained” containing an Asphalt Treated Permeable Base (ATPB)
layer, and “undrained” containing no ATPB layer. The underlying Goal 1 structure type was
ignored in the selection of the HVS rutting test sections, as can be seen in Figure 1. It was
assumed that at the elevated temperatures used for the HVS rutting tests, all of the rutting would
occur in the asphalt concrete and none would occur in the underlying layers.
The drained pavement structure is shown in Figure 2, and the undrained structure in
Figure 3.
The design of the Goal 1 drained and undrained pavement structures is presented in detail
in Reference (5). The design of the Goal 3 ARHM-GG and DGAC overlays are presented in
detail in References (10,11).
11
Overlay
AC 75 mm
AC 75 mm
Untreated Base 274 mm
Aggregate Subbase 229 mm(Constructed thicknesses vary)
ATPB 75 mm
Figure 2. Drained pavement structure.
Overlay
AC 75 mm
AC 75 mm
Untreated Base 274 mm
Aggregate Subbase 229 mm(Constructed thicknesses vary)
Figure 3. Undrained pavement structure.
12
2.1.2.1 Thicknesses Prior to HVS Trafficking
Thicknesses of the asphalt concrete layers prior to HVS trafficking were determined from
cores outside the trafficked areas and from slabs of untrafficked asphalt concrete removed from
trenches. The asphalt concrete layer thicknesses before HVS trafficking were measured on the
cores and slab locations adjacent to the test sections, yet outside the rut and upheaval caused by
the trafficking. Thickness measurements are summarized in Table 2, and indicate that similar
thicknesses were measured using the slabs and cores. The thicknesses of the asphalt concrete
layers of Section 504RF are assumed to be similar to those of Section 508RF due to their close
longitudinal proximity and same transverse location. Complete data is included in Appendix B.
Thickness measurements are summarized by overlay type in Table 3. In the experiment
design, the assumption that the DGAC overlay has essentially same thickness across the five
sections with that overlay type is not strictly valid, as the data presented in Table 3 show. The
thicknesses of the ARHM-GG overlays are more uniform across the two sections with each
design thickness. The thicknesses of the top and bottom lifts of the Goal 1 asphalt concrete are
consistent across the test sections.
It can be assumed that the thicknesses of the Goal 1 top and bottom lifts are similar to the
average values shown in Table 3. Cores and slabs could not be taken on Section 504RF because
of time constraints before the Goal 3 overlays were placed, and the need to reuse that section for
a later HVS test.
Thicknesses of the layers beneath the asphalt concrete layers were determined from
elevations at the surface of each layer measured during construction of the Goal 1 structures.
The thicknesses for each rutting test section were interpolated from the various survey locations.

13
Table 2 Asphalt concrete layer thicknesses (mm) adjacent to rutting test sectionsmeasured from cores and slabs.
Cores SlabsSectionAverage Standard
DeviationAverage Standard
Deviation504RF – Top Lift 76 1 78 1Bottom Lift 82 2 81 1505RF - DGAC Overlay 61 3 54 3Top Lift 75 0 72 2Bottom Lift 75 0 77 3506RF – DGAC Overlay 78 3 78 2Top Lift 79 3 80 3Bottom Lift 78 4 81 4507RF – DGAC Overlay 78 1 76 1Top Lift 76 2 76 1Bottom Lift 76 1 74 1512RF – DGAC Overlay 52 1 49 2Top Lift 69 3 65 4Bottom Lift 72 0 77 5513RF – DGAC Overlay 77 1 80 2Top Lift 67 3 72 1Bottom Lift 78 3 78 2508RF – ARHM 62 mm Overlay 66 2 73 5Top Lift 75 2 76 1Bottom Lift 82 5 75 2509RF – ARHM 62 mm Overlay 70 1 75 0Top Lift 70 4 74 1Bottom Lift 70 3 72 1510RF – ARHM 38 mm Overlay 34 6 35 1Top Lift 61 3 66 1Bottom Lift 74 5 77 0511RF – ARHM 38 mm Overlay 38 2 35 -Top Lift 69 3 66 -Bottom Lift 83 3 77 -
14
Table 3 Summary of thicknesses (mm) by layer and overlay type.Cores SlabsAverage Std. Dev. Max Min Average Std. Dev. Max Min
DGAC72 10 82 51 68 14 81 47
ARHM,62 mm 67 3 71 64 74 4 78 70ARHM,38 mm 36 5 40 26 35 1 36 34
Top Lift72 6 84 58 73 6 84 61
Bottom Lift77 5 88 67 78 4 86 71
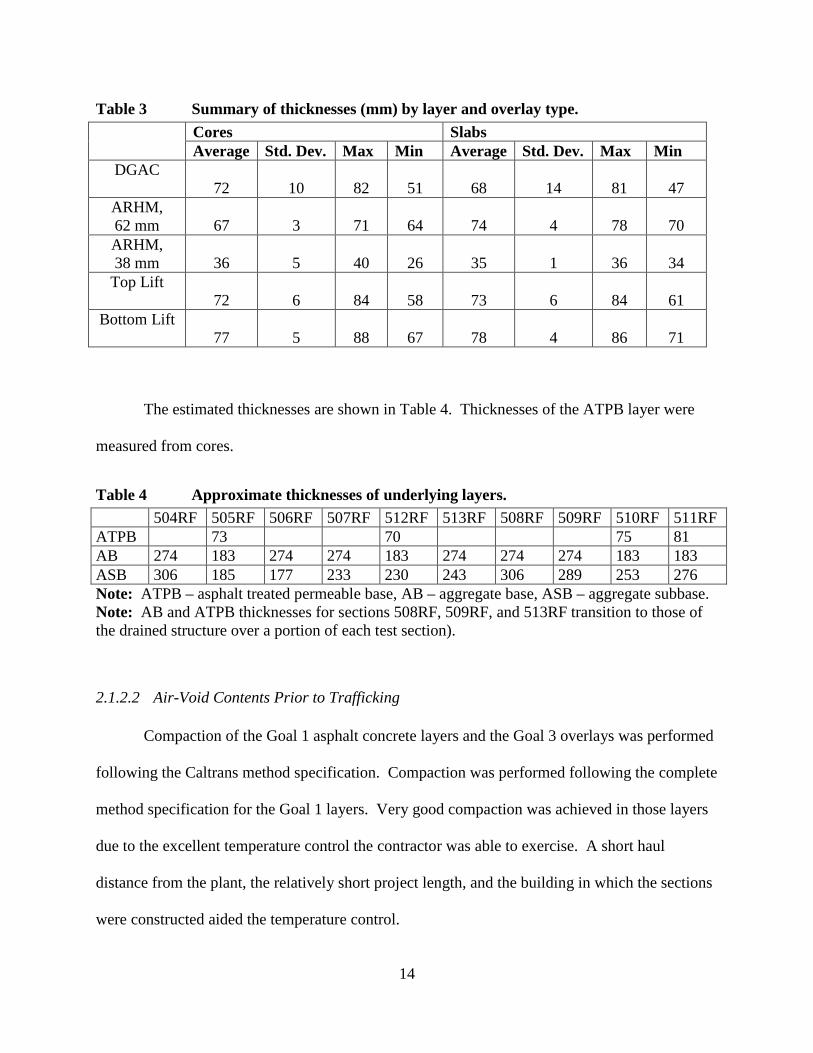
The estimated thicknesses are shown in Table 4. Thicknesses of the ATPB layer were
measured from cores.
Table 4 Approximate thicknesses of underlying layers.504RF 505RF 506RF 507RF 512RF 513RF 508RF 509RF 510RF 511RF
ATPB 73 70 75 81AB 274 183 274 274 183 274 274 274 183 183ASB 306 185 177 233 230 243 306 289 253 276Note: ATPB – asphalt treated permeable base, AB – aggregate base, ASB – aggregate subbase.Note: AB and ATPB thicknesses for sections 508RF, 509RF, and 513RF transition to those ofthe drained structure over a portion of each test section).
2.1.2.2 Air-Void Contents Prior to Trafficking
Compaction of the Goal 1 asphalt concrete layers and the Goal 3 overlays was performed
following the Caltrans method specification. Compaction was performed following the complete
method specification for the Goal 1 layers. Very good compaction was achieved in those layers
due to the excellent temperature control the contractor was able to exercise. A short haul
distance from the plant, the relatively short project length, and the building in which the sections
were constructed aided the temperature control.

15
For the Goal 3 overlays, target air-void contents of 8 to 10 percent for the DGAC and 7 to
11 percent for the ARHM-GG were specified to better replicate typical Caltrans results.
Compaction was to be stopped by UCB if air-void contents went below the target range. The
DGAC overlay air-void contents went below the target range when the method compaction
specification was only partially completed, and compaction was stopped. The method
compaction specification was completed on the ARHM-GG overlay. The ARHM-GG mix
cooled faster than the DGAC mix, particularly in the areas where the design thickness was 38
mm. Compaction of the overlay mixes was somewhat different between HVS tests sections, as
is shown in Table 5.
The average air-void content of 7.2 percent across the DGAC overlays was somewhat
below typical air-void contents of about 8 percent achieved on Caltrans QC/QA projects in the
field (Table 6). The DGAC overlay average air-void contents ranged between 4.7 percent on
Section 506RF and 10.2 percent on Section 512RF. As is discussed in Reference (11), the dense
graded overlay material arrived at the site hotter and retained heat longer during compaction than
did the gap-graded ARHM material. The thicker ARHM-GG lift at Sections 508RF and 509RF
retained heat longer than did the thinner ARHM-GG layer in Sections 510RF and 511RF; the air-
void contents of the two overlay thicknesses show that the different cooling rates had a
tremendous effect (Table 6). The thick ARHM-GG overlay sections are located between the thin
ARHM-GG overlays, and were therefore placed at exactly the same time and subjected to the
same roller passes.

16
Table 5 Air-void contents prior to HVS trafficking, from cores.Air-Void Content (percent)Section
Average Standard Deviation504RF – Top Lift 5.2 0.3Bottom Lift 4.6 1.8505RF – DGAC Overlay 5.8 0.4Top Lift 7.3 1.7Bottom Lift 4.7 1.2506RF – DGAC Overlay 4.7 0.9Top Lift 6.4 0.7Bottom Lift 6.5 0.6507RF – DGAC Overlay 7.9 0.6Top Lift 5.9 0.3Bottom Lift 5.9 1.3512RF – DGAC Overlay 10.3 2.1Top Lift 8.5 1.1Bottom Lift 4.8 0.1513RF – DGAC Overlay 7.1 1.0Top Lift 8.0 1.1Bottom Lift 6.5 0.5508RF – ARHM 62 mm Overlay 12.5 2.2Top Lift 6.4 0.7Bottom Lift 3.5 0.9509RF – ARHM 62 mm Overlay 10.0 0.7Top Lift 8.7 2.4Bottom Lift 4.9 1.7510RF – ARHM 38 mm Overlay 15.2 3.6Top Lift 4.7 0.4Bottom Lift 6.5 1.7511RF – ARHM 38 mm Overlay 17.9 0.5Top Lift 6.4 0.8Bottom Lift 3.3 1.5
Table 6 Summary of average air-void contents prior to trafficking (percent) by layerand overlay type.
Material Average Air-Void ContentDGAC overlay 7.2ARHM 62 mm 11.2ARHM 38 mm 16.6Top Lift 6.0Bottom Lift 4.2
17
The average air-void content for the top and bottom lifts of Goal 1 asphalt concrete were
also considerably smaller than those typically obtained on Caltrans projects in the field. The top
lift average air-void content ranged between 4.6 percent on Section 507RF and 8.7 percent on
Section 509RF. The average air-void content for the bottom lift ranged between 2.9 percent on
Section 505RF and 6.5 percent on Section 510RF. The average air-void content of the ATPB
measured from cores from Section 510RF was 30.8 percent.
Complete air-void content data from the cores is included in Appendix C.
2.1.2.3 Deflections Prior to Rutting Study
Surface deflection measurements were made with a Dynatest Model 3031 Heavyweight
Deflectometer (HWD) immediately before (1 March 1997) and after construction of the overlays
(1 April 1997), prior to the beginning of the HVS rutting tests. Layer moduli were back-
calculated using ELMOD Version 3.0 and 4.0 (12). Deflection measurement locations are
shown relative to the HVS rutting test sections in Figure 4. Deflections and moduli for the HVS
rutting test sections, included in Tables 7 and 8, were assumed to be those of the nearest
deflection line. Pavement temperatures at the time of both sets of deflection measurements were
approximately 20°C.
The Sensor 7 deflection measurements, which are taken farthest from the load, indicate
that subgrade conditions in the rutting test sections were fairly uniform before and after overlay
construction, as shown in Tables 7 and 8. The Sensor 1 deflections, taken at the load, indicate
that the total pavement structures were fairly similar prior to construction, except at one end of

18
Figure 4. Locations of deflection measurements and HVS rutting test sections.
Section 513, which had been subjected to coring (Table 7, Figure 5). The Sensor 1 deflections
after overlay construction were less than those measured before construction, and the Sensor 7
deflections were the same before and after construction, as expected.
All pavement structures were modeled as three layer systems for back-calculation of
elastic moduli. All asphalt concrete layers were considered as Layer 1 including the overlay,
Goal 1 asphalt concrete, and where applicable, the asphalt treated permeable base. The granular
layers, consisting of aggregate base and aggregate subbase were considered as Layer 2, and the
Subgrade as Layer 3.
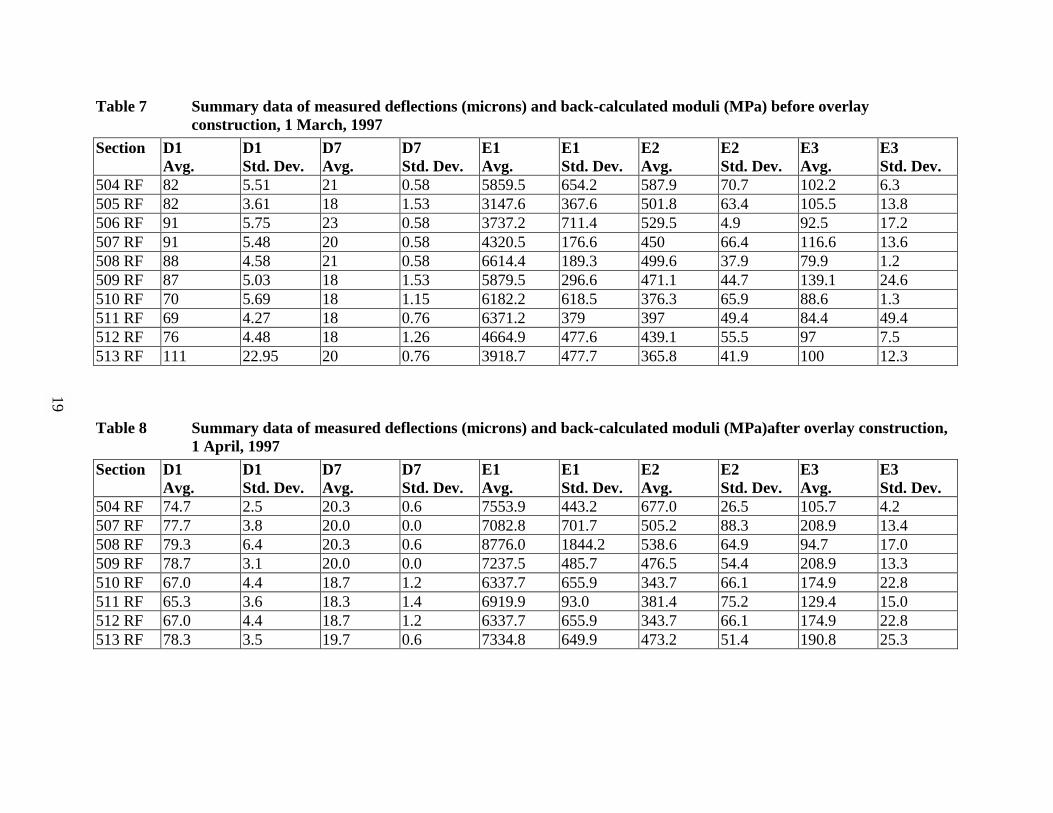
Table 7 Summary data of measured deflectconstruction, 1 March, 1997
Section D1Avg.
D1Std. Dev.
D7Avg.
D7Std.
504 RF 82 5.51 21 0.58505 RF 82 3.61 18 1.53506 RF 91 5.75 23 0.58507 RF 91 5.48 20 0.58508 RF 88 4.58 21 0.58509 RF 87 5.03 18 1.53510 RF 70 5.69 18 1.15511 RF 69 4.27 18 0.76512 RF 76 4.48 18 1.26513 RF 111 22.95 20 0.76
Table 8 Summary data of measured deflect1 April, 1997
Section D1Avg.
D1Std. Dev.
D7Avg.
D7Std.
504 RF 74.7 2.5 20.3 0.6507 RF 77.7 3.8 20.0 0.0508 RF 79.3 6.4 20.3 0.6509 RF 78.7 3.1 20.0 0.0510 RF 67.0 4.4 18.7 1.2511 RF 65.3 3.6 18.3 1.4512 RF 67.0 4.4 18.7 1.2513 RF 78.3 3.5 19.7 0.6
19
ions (microns) and back-calculated moduli (MPa) before overlay
Dev.E1Avg.
E1Std. Dev.
E2Avg.
E2Std. Dev.
E3Avg.
E3Std. Dev.
5859.5 654.2 587.9 70.7 102.2 6.33147.6 367.6 501.8 63.4 105.5 13.83737.2 711.4 529.5 4.9 92.5 17.24320.5 176.6 450 66.4 116.6 13.66614.4 189.3 499.6 37.9 79.9 1.25879.5 296.6 471.1 44.7 139.1 24.66182.2 618.5 376.3 65.9 88.6 1.36371.2 379 397 49.4 84.4 49.44664.9 477.6 439.1 55.5 97 7.53918.7 477.7 365.8 41.9 100 12.3
ions (microns) and back-calculated moduli (MPa)after overlay construction,
Dev.E1Avg.
E1Std. Dev.
E2Avg.
E2Std. Dev.
E3Avg.
E3Std. Dev.
7553.9 443.2 677.0 26.5 105.7 4.27082.8 701.7 505.2 88.3 208.9 13.48776.0 1844.2 538.6 64.9 94.7 17.07237.5 485.7 476.5 54.4 208.9 13.36337.7 655.9 343.7 66.1 174.9 22.86919.9 93.0 381.4 75.2 129.4 15.06337.7 655.9 343.7 66.1 174.9 22.87334.8 649.9 473.2 51.4 190.8 25.3
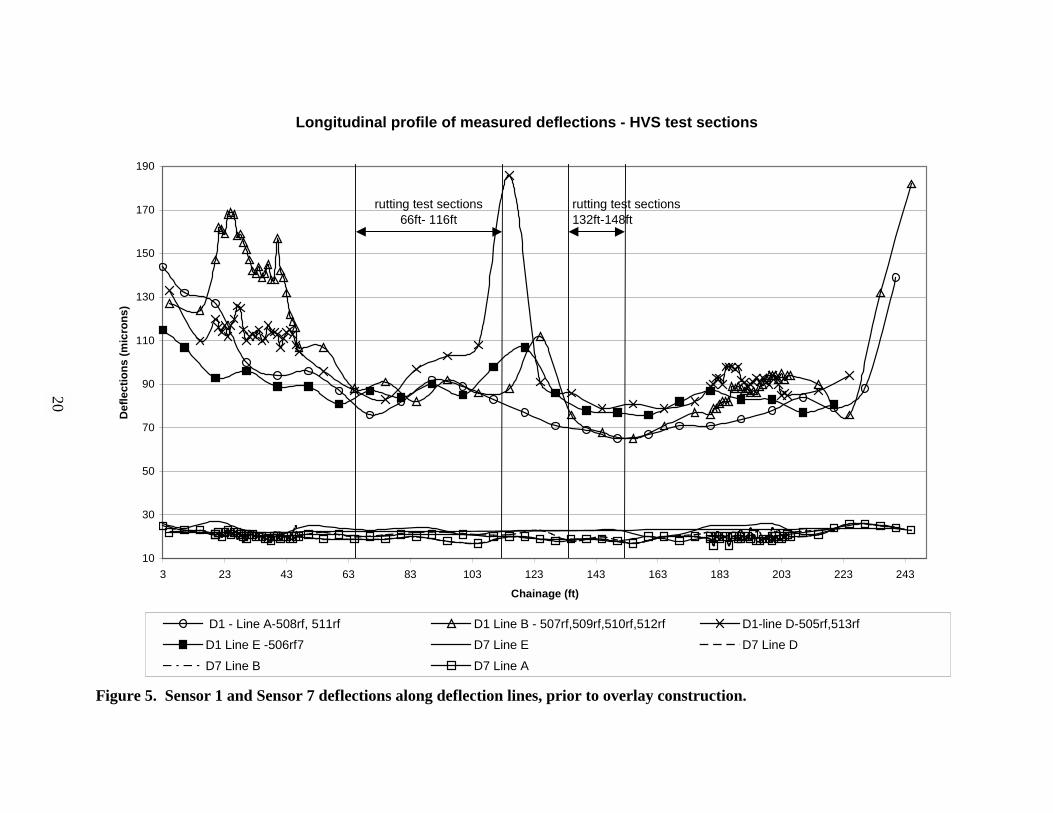
Figure 5. Sensor 1 and Sensor 7 deflections along
Longitudinal profil
10
30
50
70
90
110
130
150
170
190
3 23 43 63 83
Def
lect
ions
(mic
rons
)
D1 - Line A-508rf, 511rfD1 Line E -506rf7D7 Line B
rutting tes66ft-
20
deflection lines, prior to overlay construction.
e of measured deflections - HVS test sections
103 123 143 163 183 203 223 243
Chainage (ft)
D1 Line B - 507rf,509rf,510rf,512rf D1-line D-505rf,513rfD7 Line E D7 Line D D7 Line A
t sections116ft
rutting test sections132ft-148ft

21
The back-calculated subgrade moduli nearest each of the test sections prior to overlay
(Figure 6) are fairly consistent across all of the test sections. The granular layers have more
variability (Figure 6). This variability is typical of back-calculated moduli from field sites, and
includes variability in materials properties, construction quality, and differences between
assumed and actual layer thickness, as well as deflection measurement variability.
The back-calculated moduli of the granular layers did not appear to change much before
and after construction, and across the test sections averaged between 344 and 677 MPa (Figure
6). The back-calculated moduli of the subgrade were also fairly similar before and after
construction of the overlays, and averaged between 80 and 209 MPa.
The back-calculated moduli and deflection data indicate that the structures beneath the
asphalt concrete in the HVS test sections can be assumed to be fairly uniform. Details of the
deflection data are included in Appendix D.
2.1.3 Materials
The pavement materials in the rutting test sections are described in detail in previous
reports. The materials and construction of the pavement structure beneath the overlays is
described in Reference (5). The overlay materials and construction are described in Reference
(11). The materials properties important to understanding the rutting performance of the rutting
test sections are summarized in this report.

Figure 6. Back-calculated moduli for granular la
Backcalcula
0
100
200
300
400
500
600
700
800
900
1000
70 80 90 1
Mod
ulus
of e
last
icity
(MPa
)
E2, 508RF, ARHM
E2, 510 RF, ARHM
E2, 507RF, DGAC
E3, 508RF, ARHM
E3, 505RF, DGAC
E3, 513RF, DGAC
22
yers and subgrade before overlay.
ted moduli - Rutting test sections 3/1/97
00 110 120 130 140 150 160
Chainage (ft)
62mm E2, 509RF, ARHM 62mm E2, 511 RF, ARHM 38mm
38 mm E2, 505 Rf, DGAC E2, 506RF, DGAC
E2, 513RF, DGAC E2, 512RF, DGAC
62mm E3, 509RF, ARHM 62mm E3, 511RF, ARHM 38mm
E3, 506RF, DGAC E3, 507RF, DGAC
E3, 512RF, DGAC E3, 510RF, ARHM 38mm
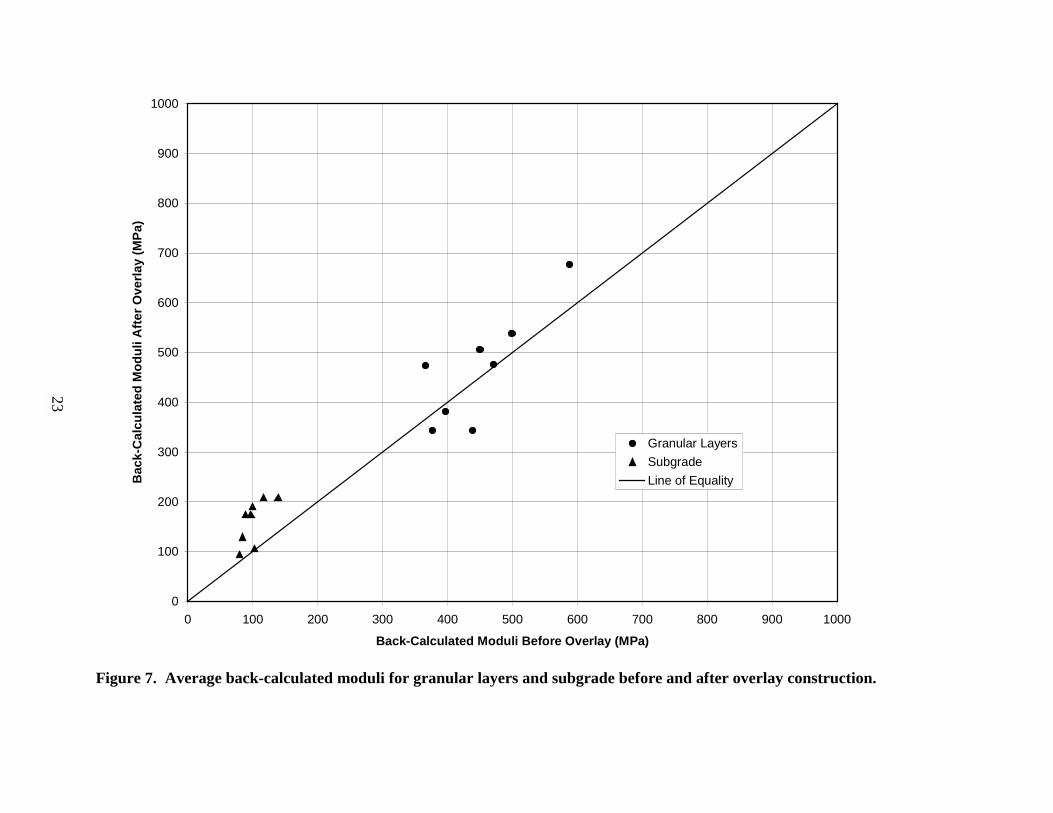
Figure 7. Average back-calculated moduli for gr
0
100
200
300
400
500
600
700
800
900
1000
0 100 200 300
Back-Cal
Bac
k-C
alcu
late
d M
odul
i Afte
r Ove
rlay
(MPa
)
23
anular layers and subgrade before and after overlay construction.
400 500 600 700 800 900 1000
culated Moduli Before Overlay (MPa)
Granular LayersSubgradeLine of Equality
24
2.1.3.1 Overlay Mixes
The ARHM-GG and DGAC materials were specified as follows in the bid documents for
the Goal 3 overlays:
DGAC shall meet Caltrans Standard Specifications for 19 mm (3/4 in.) Type A, coarsegradation asphalt concrete.
ARHM-GG shall meet Caltrans Standard Special Provisions for 12.5 mm (1/2 in.) Type2, gap-graded asphalt rubber hot mix. The mix design shall be based on a 4 percent air-void content.
The mix design aggregate gradations, contract compliance ranges determined following
Caltrans standard specifications, and results of extractions from belt samples taken at the plant
are shown in Tables 9 and 10. Both mix design gradations were within Caltrans specifications
for target limits.
The binder for the DGAC mix was an AR-4000 meeting Caltrans specifications,
manufactured by Huntway in Benicia. The PG classification for the DGAC binder is PG 64-16.
The binder formulation for the ARHM-GG mix included 76.5 percent (by mass) Shell AR-4000,
Table 9 Summary of extracted gradation and binder content for DGAC overlay mix.Percent PassingSieve Size (mm)
MixDesign
PermissibleOperating Range **
Extracted(average)
Extracted(Std. Dev.)
19 100 90-100 99.8 0.612.5 93 95.2 1.99.5 73 60-75 76.4 2.64.75 50 45-55 52.3 2.02.36 39 34-44 36.6 1.51.18 27 27.4 1.10.60 18 13-23 22.3 1.00.30 11 17.2 0.70.15 6 9.3 0.50.075 5 3-7 6.8 0.3Binder Content* (%) 5.0-5.3 5.1 0.1* Percent by mass of aggregate** Per Section 39 Caltrans Standard Specifications (5, 13).
25
Table 10 Summary of extracted gradation, binder content and rubber content forARHM-GG mix.
Percent PassingSieve Size (mm)
Mix Design PermissibleOperating Range ***
Extracted(average)
Extracted(Std. Dev.)
19 100 100 100.012.5 98 90-100 97.3 1.29.5 85 81-91 84.4 2.64.75 33 28-38 34.0 2.52.36 21 18-26 22.7 1.81.18 15 16.7 1.40.60 10 7-15 12.7 1.20.30 6 9.2 0.90.15 4 6.1 0.80.075 3 3-7 4.6 0.6Binder Content*(%)
7.6-7.9 6.9 0.5
RubberContent** (%)
21 15.9 3.3
* Percent by mass of aggregate** Percent by mass of binder*** Per applicable Caltrans Special Provisions (11)
2.5 percent Witco cutter oil, 15.75 percent 10 mesh crumb rubber, and 5.25 percent high natural
rubber. Both of the rubber components were manufactured by BAS. The binder was formulated
to meet the appropriate Caltrans special provisions at the time the mix design was performed.
The PG classification for the ARHM-GG binder is PG 82-28. (11)
The binder contents were selected following Caltrans standard procedures. The binder
content for the DGAC mix was selected based on the Caltrans “flushing” criterion. At the design
binder content of 5.3 percent (by mass of aggregate), the Hveem stabilometer value was 42; the
air-void content under standard kneading compaction was 5.5 percent. The Caltrans minimum
permissible Hveem stabilometer value is 37 for this mix. By Caltrans criteria, the DGAC
overlay mix should have a low probability of rutting in the field.

26
The binder content for the ARHM-GG mix was selected based on the Caltrans criterion
for air-void content under standard kneading compaction. At the design binder content of 7.9
percent (by mass of aggregate), the Hveem stabilometer value was 23; the air-void content under
standard kneading compaction was 4.0 percent. (11)
The extracted aggregate gradations indicate that the constructed gradations were within
nearly all of the Caltrans specification operating ranges (Tables 9 and 10). The DGAC mix was
somewhat coarser than the target gradations for the coarse sizes, and finer than the targets for the
fine sizes (Table 9). The ARHM-GG gradation nearly matched the target value for all sizes
(Table 10).
The extracted binder contents from the DGAC mix were within the mix design range.
The extracted binder contents from the ARHM-GG mix had much greater variability, and were
below the mix design range. Assuming that there were no difficulties with the extraction process
for asphalt-rubber binders, the average binder content was found to be 0.7 to 1.0 percent less
than the target range (by mass of aggregate).
It has been found that maximum density for an aggregate gradation can typically be
obtained when the gradation follows a line between the maximum aggregate size and the origin
on a plot of percent aggregate passing each sieve size by mass, and the sieve sizes raised to the
0.45 power.
Following the definition used by the Superpave specifications (14), the DGAC and
ARHM-GG overlay materials have a nominal maximum aggregate size of 19 mm and a
maximum aggregate size of 25 mm. When plotted on the 0.45 power curve, the DGAC overlay
gradation can be seen to follow the maximum density line except for the 19 mm sieve (Figure 8).
27
In particular, the DGAC overlay gradation follows the maximum density line between the 4.75
and 0.3 mm sieves and therefore passes through the “restricted zone” of the Superpave
specifications.
The gap graded ARHM-GG overlay material passes well above the maximum density
line for sieve sizes above 10 mm and below the line for the smaller sieves.
2.1.3.2 Goal 1 Asphalt Concrete Mix
The Goal 1 asphalt concrete mix designs and the results of previous laboratory tests on
field cores and laboratory compacted specimens are summarized in Reference (5). The same
asphalt concrete mix was used for the top and bottom lifts of the Goal 1 structures. It met all
Caltrans standard specifications for Type A, 19-mm maximum size, coarse gradation mix. The
aggregate sources and asphalt source were not the same as those used for the DGAC overlay
mix, and the two mixes were produced by different plants.
The asphalt binder met Caltrans requirements for AR-4000 and was produced by the
Shell refinery at Benicia. The binder content selected following Caltrans test methods was 4.9
percent by mass of aggregate, and the mix design recommended range was 4.6 to 4.9 percent.
The binder content was selected based on the Caltrans “flushing” criterion. The Hveem
stabilometer value at 4.9 percent asphalt content was 47, and the air-void content under standard
kneading compaction was 4.4 percent. Mix design target gradations, the Caltrans operating
ranges, and gradation analyses from extraction and plant belt samples are shown in Table 11.
It can be seen that the aggregate gradations obtained from the mix were all within the
permissible operating ranges. The asphalt contents found from extractions on the top lift of

Figure 8. Extracted aggregate gradations for DGmaximum density lines.
0
10
20
30
40
50
60
70
80
90
100
0 0.5 1 1.5
Perc
ent P
assi
ng
28
AC and ARHM-GG overlay mixes (sieve sizes to 0.45 power), and Superpave
2 2.5 3 3.5 4 4.5
Sieve^0.45 (mm)
DGAC Overlay Extracted
ARHM Overlay Extracted
Goal 1 Top Lift Extracted
Goal 1 Bottom Lift Extracted
Superpave Max Density Line for ARHM Overlayand DGAC OverlaySuperpave Max Density Line for Goal 1 AC

29
Table 11. Summary of extracted gradation and binder content for Goal 1 asphalt concretemix.
PercentPassing SieveSize (mm)
MixDesign
PermissibleOperatingRange ***
Top LiftExtracted(average)
Top LiftExtracted(Std. Dev.)
Bottom LiftExtracted*(average)
Top LiftExtracted(Std. Dev.)
25 100 100 100.0 0.0 100.0 0.019 99 90-100 92.0 7.1 93.0 1.412.5 80 76.0 8.5 74.5 0.79.5 67 60-75 65.5 4.9 64.0 2.84.75 49 45-55 48.5 4.9 49.0 2.82.36 33 29-39 33.5 3.5 33.5 2.11.18 22 23.5 2.1 23.0 1.40.60 14 10-20 17 1.4 16.0 1.40.30 9 13 1.4 11.5 0.70.15 6 8.5 0.7 8.0 0.00.075 3 3-7 5.1 0.1 4.4 0.6BinderContent** (%)
4.6-4.9 5.25 4.8
* Aggregate gradations include plant belt samples and extracted values** Percent by mass of aggregate*** Per Section 39 Caltrans Standard Specifications (5, 13)
asphalt concrete are somewhat higher than the recommended range from the mix design.
Despite the high asphalt contents, stabilometer tests on material collected from the top lift during
construction were found to have typical values between 46 and 48. The asphalt contents from
extractions on the bottom lift are within the recommended range. Stabilometer test values on site
samples of the bottom lift averaged 46. The minimum Hveem stabilometer value permitted by
Caltrans for this mix is 37. These results indicate that by Caltrans criteria the Goal 1 mix should
have a low probability of rutting in the field.
Although they meet the same Caltrans specifications, the Goal 1 asphalt concrete and the
DGAC overlay material have different nominal maximum aggregate sizes following the
Superpave specifications. The Goal 1 asphalt concrete is a 25-mm gradation following
Superpave specifications, while the DGAC overlay material is a 19-mm gradation. The Goal 1
30
asphalt concrete nearly exactly follows the 25-mm maximum density line as defined by
Superpave specifications (Figure 8). The Goal 1 gradation passes through the Superpave
“restricted zone,” as does the DGAC overlay.
2.1.3.3 Underlying Materials
The asphalt treated permeable base (ATPB) material under some of the HVS rutting
sections meets Caltrans standard specifications. Cores and slabs taken from the rutting test
sections showed no signs of stripping or other damage. The aggregate base (AB) material meets
all Caltrans standard specifications for Class 2 Aggregate Base. R-value tests of the AB had
values between 78 and 83. The aggregate base relative density at the time of compaction ranged
between 99 and 103 percent and the water contents were at or just below the optimum water
content. The Caltrans standard specification requires 95 percent relative compaction. (5)
The aggregate subbase (ASB) met all requirements for Caltrans Class 2 Aggregate
Subbase. R-value tests of five samples ranged between 55 and 82, averaging 70 with a standard
deviation of 10. The relative density of the ASB ranged between 95 and 100 percent. The
Caltrans standard specification requires 95 percent relative compaction. The upper two meters of
the subgrade soil are a high-plasticity clay, with a USCS classification of CH, and an AASHTO
classification of A-7-6. The liquid limit ranges between 39 and 55 and the plasticity index
between 27 and 41. R-value tests of the subgrade produced values between 4 and 30. The
relative compaction of the subgrade was between 91 and 98 percent, averaging about 95 percent.
Caltrans standard specifications require a minimum average relative compaction of 95 percent.
The groundwater table is at depths of about 3.5 to 4.8 m below the surface of the subbase. (5, 13)

31
2.2 HVS Test Conditions, Instrumentation and Data Collection
2.2.1 Trafficking
The HVS test sections were 8 m in length. Pavement performance in the 1.5-m lengths at
each end of the trafficked section (the “turnaround zone”) were not included in the performance
evaluations because the HVS wheel speed varies in these areas. All trafficking was channelized,
with no side shift permitted. The decision to channelize the traffic was based on the following
observations:
• Once a rut begins to develop, radial tires tend to track in the wheelpath with little or
no wander, and so forcing a wander pattern might be farther from actual conditions
than channelizing the traffic.
• Better control of high pavement temperatures could be obtained by channelizing the
traffic, which permitted the placement of the heaters at the edge of the wheelpath.
• Actual wander patterns once a rut has begun to develop have not been quantified for
most tires, and in particular for wide-based singles and dual radials.
• Rutting would develop faster with channelization, and could be compared to a forced
wander pattern with results from the Cal/APT Pilot Study in South Africa (15).
2.2.2 Tires and Wheels
Four types of tires and wheels were included in the study, divided between two types of
tires on dual wheels, and two types of tires on single wheels. Dual wheels are most commonly
used in the United States, accounting for about 97 to 99 percent of all commercial truck wheels,
32
excluding steering axles. A larger percentage of trucks use wide-base singles in Europe,
approaching 30 percent of all truck tires in France, and the majority of truck tires in Britain and
Germany. Factors associated with wide-base singles that are pushing their greater use in
Western Europe are larger payloads permitted by reduced vehicle weight, lower tire costs,
reduced rolling resistance leading to reduced fuel consumption, and high taxes on vehicle weight
and fuel. (16)
Prior to the development of modern radial tires in the 1960s, most trucks used bias-ply
tires. Currently, it has been estimated that more than 90 percent of dual tires used in the United
States are radials, and the remainder are bias-ply tires. A recent study of trucks entering Oregon
found that less than one percent of tires on commercial trucks were bias-ply (17).
2.2.2.1 Bias-ply Duals
Goodyear 10.00-20, Load Range G tires on 10-cm wide rims were used for this study.
The tire tread consists of six plies of nylon cord with a sidewall of 1 ply nylon cord. The
maximum dual load rating is 28.09 kN (6,300 lbs.) at 620 kPa (90 psi) cold inflation pressure.
The test load used for this study was 40 kN on the dual, which results in 20 kN (4,500 lbs.) on
each tire. The inflation pressure was 620 kPa. This tire/wheel was used on Section 505RF.
2.2.2.2 Radial Duals
Goodyear G159A, 11R22.5, Load Range G tires on 11-cm wide rims were used in this
study. The tire tread consists of six plies of steel cord with a sidewall of one ply steel cord. The
maximum dual load rating is 25.64 kN (5,750 lbs.) at a cold inflation pressure of 723 kPa (105

33
psi). The test load used for this study was 40 kN on the dual, or 20 kN on each tire, at the rated
inflation pressure. This tire/wheel was used on Sections 506RF, 509RF.
2.2.2.3 Wide-Base Single
The wide-base single used for this study was a Goodyear G286, 425/65R22.5, Load
Range J, which was mounted on a 33-cm wide rim. The tire tread consists of five plies of steel
cord, with a sidewall of one ply of steel cord. The maximum load rating is 46.82 kN (10,500
lbs.) at a cold inflation pressure of 758 kPa (110 psi). The test load for this study was 40 kN at
the rated inflation pressure. The wide-base single was used on Sections 504RF, 507RF, 508RF,
511RF and 512RF.
2.2.2.4 Aircraft Single
An aircraft wheel and tire was included in the study for two reasons:
• To obtain data of use in relating field observations of rutting performance between
highway and airfield locations, and
• To provide an upper bound for performance as truck tire/wheel technology continues
to move towards greater loads and inflation pressures.
The aircraft tire used in this study was a BF Goodrich TSO C62C, 46 × 16, tubeless,
reinforced thread, 0.42 skid. The maximum load rating is 199.8 kN (44,800 lbs.) at a cold
inflation pressure of 1,034 kPa (150 psi). The test load for this study was 100 kN (22,500 lbs.) at
the rated tire pressure. The aircraft tire was used on Section 513RF.
34
There are important differences between the four tire/wheel types included in the study
that should be expected to impact rutting performance. Assuming constant temperature, traffic
wander, and wheel speed, rutting would be expected to occur under conditions of larger inflation
pressures and larger loads. Larger inflation pressures and loads should be expected to increase
the shear stresses at the edges of the tire, which cause permanent deformation.
The ranking of inflation pressures from lowest to highest is: dual/bias-ply, dual/radial,
wide-base single, aircraft. Rutting performance would be expected to be worst for the aircraft
tire and best for the dual/bias-ply. With respect to load, the aircraft tire load of 100 kN would be
expected to produce ruts faster than the other three tires, all of which were trafficked at 40 kN.
2.2.3 Wheel Speed and Direction
All of the rutting test sections were trafficked in the unidirectional mode, except for
Section 513RF (aircraft tire) which was trafficked bi-directionally. In the unidirectional mode,
the HVS wheel travels the 8-m long section loaded in one direction. It rolls up a short ramp at
the end of the section, which locks it in a position in which the wheel is not in contact with the
pavement. The wheel is then pulled back to the beginning of the section, where it is placed in
contact with the pavement for the next cycle. In the bi-directional mode of loading, the wheel
travels loaded in both directions. The bi-directional mode was not used for the aircraft wheel
because the ramp did not work well with that wheel. Only loaded passes were counted as load
repetitions in the results presented in this report, regardless of whether the trafficking was
unidirectional or bi-directional.
35
The wheel speed in the loaded direction of the unidirectional mode was measured to be
between 7.0 and 7.8 km/hr (4.3 to 4.8 mph), averaging 7.5 km/hr (4.7 mph). In the bi-directional
mode the wheel speed in one direction is the same as that of the unidirectional mode, and
averaged 6.8 km/hr (4.2 mph) in the other direction.
The wheel speed of the HVS is much slower than typical, free flowing highway traffic.
Because slower speeds and the corresponding longer loading times result in more rutting than do
typical highway traffic conditions, the HVS testing was performed under more severe conditions
than would be expected on a free flowing highway. The HVS wheel speed is more typical of
traffic on traffic jam on an urban freeway, or congested traffic on a highway or city street.
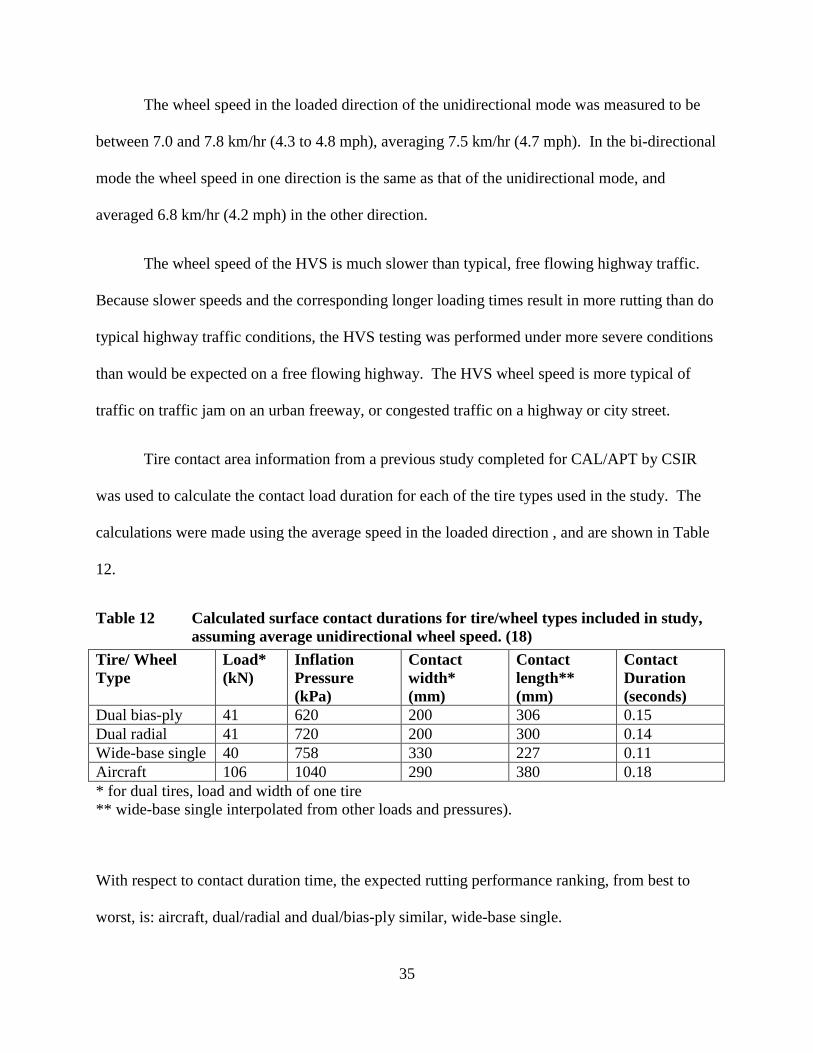
Tire contact area information from a previous study completed for CAL/APT by CSIR
was used to calculate the contact load duration for each of the tire types used in the study. The
calculations were made using the average speed in the loaded direction , and are shown in Table
12.
Table 12 Calculated surface contact durations for tire/wheel types included in study,assuming average unidirectional wheel speed. (18)
Tire/ WheelType
Load*(kN)
InflationPressure(kPa)
Contactwidth*(mm)
Contactlength**(mm)
ContactDuration(seconds)
Dual bias-ply 41 620 200 306 0.15Dual radial 41 720 200 300 0.14Wide-base single 40 758 330 227 0.11Aircraft 106 1040 290 380 0.18* for dual tires, load and width of one tire** wide-base single interpolated from other loads and pressures).
With respect to contact duration time, the expected rutting performance ranking, from best to
worst, is: aircraft, dual/radial and dual/bias-ply similar, wide-base single.

36
2.2.4 Instrumentation and Data Collection
Instrumentation of the test sections was minimal due to time constraints and the need to
minimize interference of instrumentation with the performance of the pavements.
Instrumentation and data collections consisted of thermocouples to measure and control
pavement temperatures, and laser profilometer readings to measure the surface profiles of the test
sections.
In the two years after HVS trafficking of the rutting test sections was completed, cores
were taken and trenches were dug to evaluate the performance of the test sections. The test
sections were not subjected to any traffic, high temperatures, or water between the time
trafficking was completed and coring and trenching were finished.
Locations of thermocouples, profilometer locations and trenching and coring locations
are shown in Figure 4.
2.2.4.1 Thermocouples
Sets of three to five Type K thermocouples were installed just outside of the wheelpath at
one or two locations on each side of the section. The locations were offset along the length of
the section (Figure 4). The thermocouples in each set were placed at different depths between
the surface and bottom of the asphalt treated layers, including the ATPB where applicable.
Thermocouple depths and temperature data are included in Appendix Temperature.
To install the thermocouples, a 10-mm diameter hole was drilled in the asphalt concrete.
The thermocouples were wrapped around a wooden dowel and taped in place. They were then
placed in the hole, and back filled with hot asphalt.

37
2.2.4.2 Profilometer and Straight Edge
The laser profilometer and data acquisition system developed by CSIR was used to
measure surface profile at various times as rutting developed. The laser profilometer is
described in detail in Reference (5).
Profiles were taken transverse to the wheelpath, at locations 0.5 m apart along the
wheelpath (Figure 4). Maximum rut depth from the profiles obtained from the laser profilometer
was defined as the difference between the highest point in the profile and lowest point. On all
sections, “humps” of material developed at the sides of the wheelpath as trafficking progressed.
On the sections tested with dual wheels, humps also developed between the tires.
A straight edge was used in the early stages of the experiment to measure maximum rut
depth, as an independent check of the laser profilometer. It was found that the maximum rut
depth found using both instruments was quite similar, and use of the straight edge was
abandoned.
2.2.4.3 Trenches and Cores
After completion of all of the HVS rutting tests on the overlays, a trench was dug across
the wheelpath at one location on each test section (Figure 4). The first stage of trenching was to
cut the trench edges using a water-cooled saw. The trenches were cut wide enough so that they
included sections of the pavement not influenced by the HVS loading, the humps at the sides of
the wheelpath, and the wheelpaths. After waiting several weeks to permit the sections to dry out,
the asphalt bound layers were removed in slabs. The slabs were saved to provide material for
additional cores if needed. The thickness of the asphalt bound layers, including the overlays and
38
both lifts of Goal 1 asphalt concrete, were measured on the cut face at the sides of the trench at
25-mm intervals.
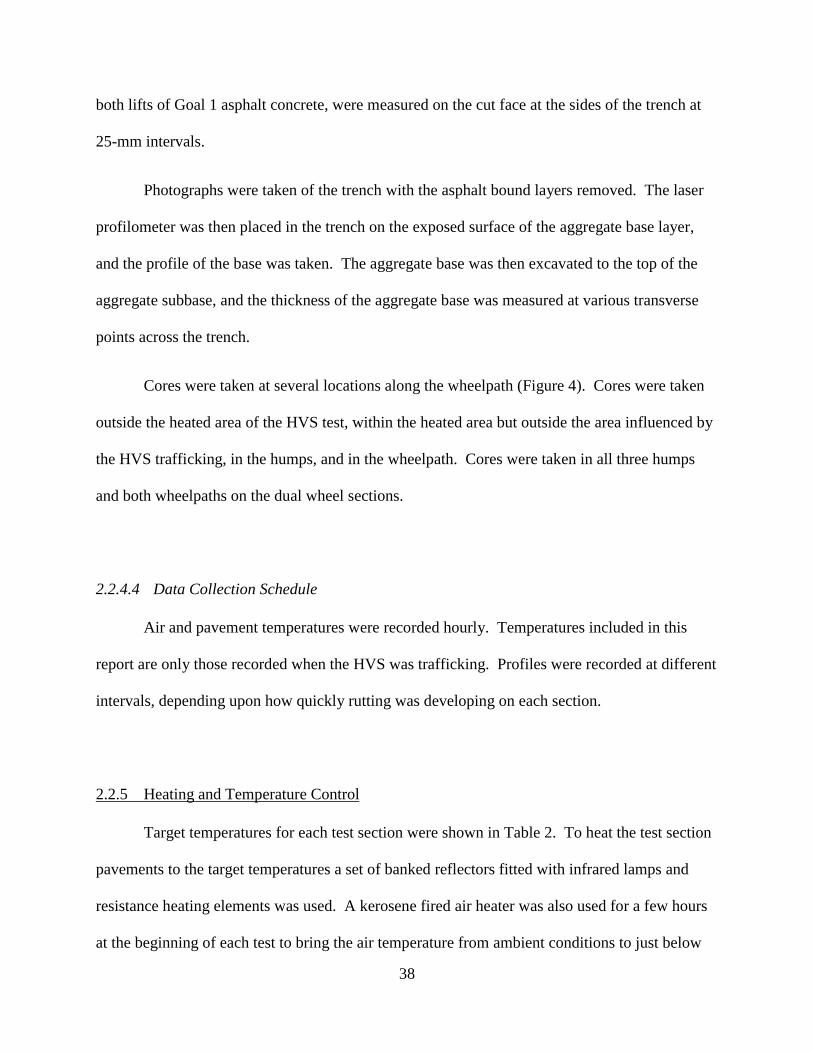
Photographs were taken of the trench with the asphalt bound layers removed. The laser
profilometer was then placed in the trench on the exposed surface of the aggregate base layer,
and the profile of the base was taken. The aggregate base was then excavated to the top of the
aggregate subbase, and the thickness of the aggregate base was measured at various transverse
points across the trench.
Cores were taken at several locations along the wheelpath (Figure 4). Cores were taken
outside the heated area of the HVS test, within the heated area but outside the area influenced by
the HVS trafficking, in the humps, and in the wheelpath. Cores were taken in all three humps
and both wheelpaths on the dual wheel sections.
2.2.4.4 Data Collection Schedule
Air and pavement temperatures were recorded hourly. Temperatures included in this
report are only those recorded when the HVS was trafficking. Profiles were recorded at different
intervals, depending upon how quickly rutting was developing on each section.
2.2.5 Heating and Temperature Control
Target temperatures for each test section were shown in Table 2. To heat the test section
pavements to the target temperatures a set of banked reflectors fitted with infrared lamps and
resistance heating elements was used. A kerosene fired air heater was also used for a few hours
at the beginning of each test to bring the air temperature from ambient conditions to just below
39
the target temperature. HVS trafficking was not begun until temperatures had stabilized
throughout the asphalt concrete layer, as determined from thermocouples. In some cases, heating
continued for more than 12 hours before trafficking was begun.
Once the target temperature was reached, it was maintained by a control system that
turned the lamps and heating elements on or off whenever the temperature measured by the
thermocouple at 50 mm depth was more than 2°C from the target. The curved shape of the
reflectors and channelized traffic pattern, which precluded side-shift movement of the beam,
created an enclosed space over the test section that helped to maintain heat in the pavement
(Figure 9).
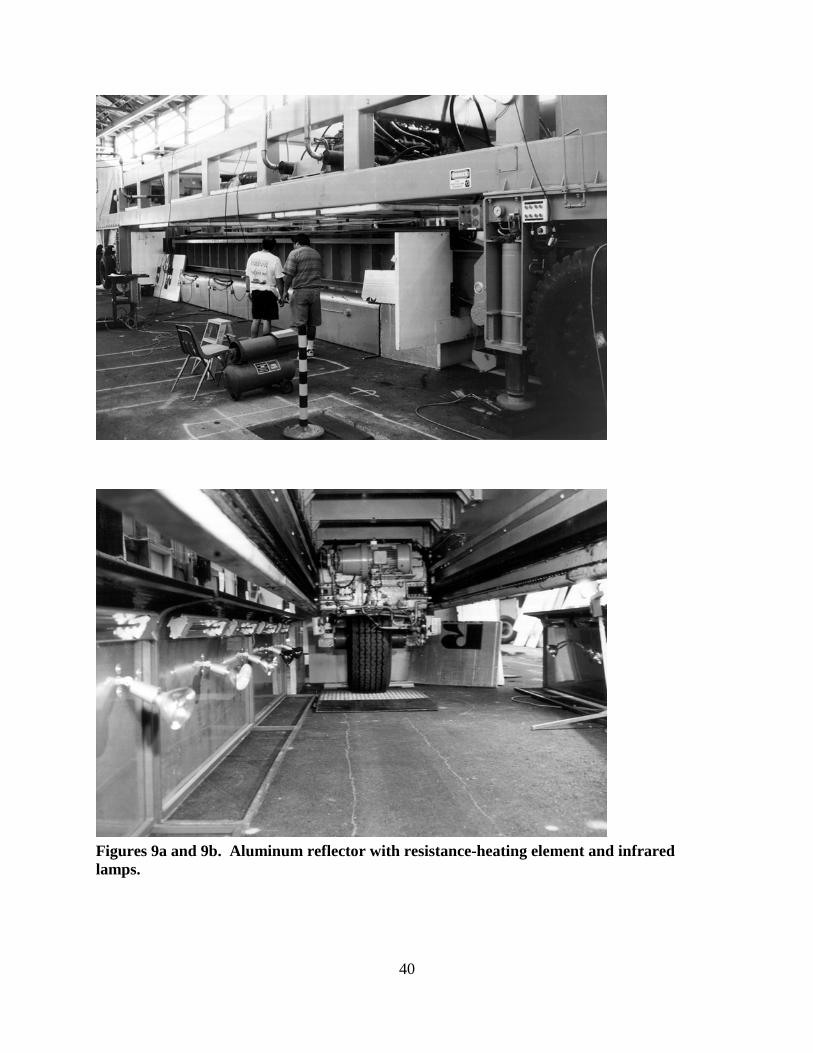
40
Figures 9a and 9b. Aluminum reflector with resistance-heating element and infraredlamps.

41
3.0 HEAVY VEHICLE SIMULATOR TEST RESULTS
Comparisons of rutting performance for single variables included in the experiment
design can be determined from comparison of HVS test section results as shown in Table 13.
Table 13. Comparison of single variables from HVS test section results.Variable Comparison HVS Test Sections (fixed variables)Overlay Type:DGAC, 38 mm ARHM-GG, 62 mmARHM-GG
510RF, 509RF, 506RF(radial tire/dual wheel, 50 C)
Overlay Type:DGAC, 38 mm ARHM-GG, 62 mmARHM-GG
511RF, 508RF, 507RF(wide-base single, 50 C)
Tire Type:Dual/Radial, Dual/Bias-Ply, Wide-baseSingle, Aircraft
507RF, 505RF, 507RF, 513RF(DGAC, 50 C)
Tire Type: Dual/Radial, Wide-base Single 510RF, 511RF (38 mm ARHM-GG, 50 C)Tire Type: Dual/Radial, Wide-base Single 509RF, 508RF (62 mm ARHM-GG, 50 C)Pavement Temperature: 40 C, 50 C 507RF, 512RF (DGAC, wide-base single)DGAC Type: Goal 1 mix, Goal 3 mix 504RF (Goal 1 mix, 45 C), 507RF (Goal 3
mix, 50 C), 512RF (Goal 3 mix, 40 C), allwide-base single
3.1 Pavement Temperatures
Temperature data for each test section are summarized in Table 14, including the average
temperature at each depth, the layer in which the thermocouples were located, and the average
standard deviation for each depth in each section.
The temperature data show that the target temperature of 50°C at 50 mm depth was
matched within ± 2 C by the average temperatures at that depth on Sections 505, 506, 507, 508,
509, 510, 511 and 513. The target temperature of 40°C at 50 mm depth was met on Section 512.
Average standard deviations of temperature at depths of less than 100 mm were typically less
than 3.0°C. Section 508 had much greater variability near the surface than the other sections.
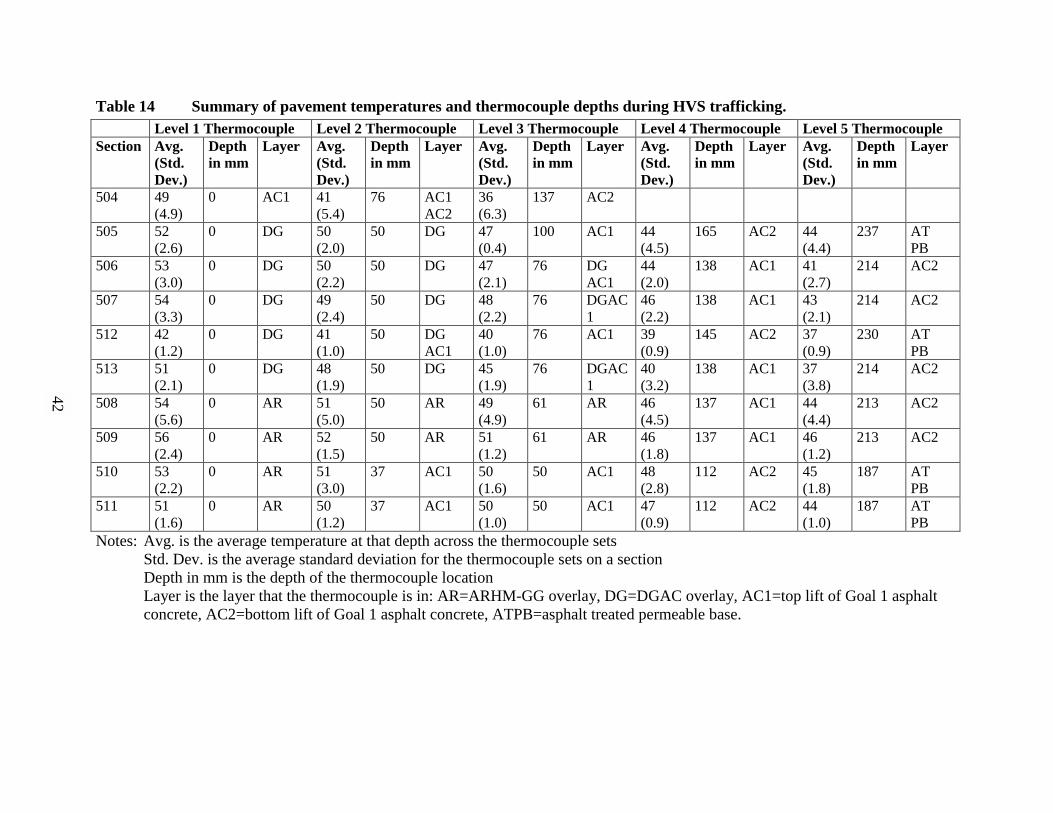
Table 14 Summary of pavement temperaturLevel 1 Thermocouple Level 2 Thermoco
Section Avg.(Std.Dev.)
Depthin mm
Layer Avg.(Std.Dev.)
Depthin mm
L
504 49(4.9)
0 AC1 41(5.4)
76 AA
505 52(2.6)
0 DG 50(2.0)
50 D
506 53(3.0)
0 DG 50(2.2)
50 D
507 54(3.3)
0 DG 49(2.4)
50 D
512 42(1.2)
0 DG 41(1.0)
50 DA
513 51(2.1)
0 DG 48(1.9)
50 D
508 54(5.6)
0 AR 51(5.0)
50 A
509 56(2.4)
0 AR 52(1.5)
50 A
510 53(2.2)
0 AR 51(3.0)
37 A
511 51(1.6)
0 AR 50(1.2)
37 A
Notes: Avg. is the average temperature at that depthStd. Dev. is the average standard deviation foDepth in mm is the depth of the thermocouplLayer is the layer that the thermocouple is inconcrete, AC2=bottom lift of Goal 1 asphalt
42
es and thermocouple depths during HVS trafficking.uple Level 3 Thermocouple Level 4 Thermocouple Level 5 Thermocoupleayer Avg.
(Std.Dev.)
Depthin mm
Layer Avg.(Std.Dev.)
Depthin mm
Layer Avg.(Std.Dev.)
Depthin mm
Layer
C1C2
36(6.3)
137 AC2
G 47(0.4)
100 AC1 44(4.5)
165 AC2 44(4.4)
237 ATPB
G 47(2.1)
76 DGAC1
44(2.0)
138 AC1 41(2.7)
214 AC2
G 48(2.2)
76 DGAC1
46(2.2)
138 AC1 43(2.1)
214 AC2
GC1
40(1.0)
76 AC1 39(0.9)
145 AC2 37(0.9)
230 ATPB
G 45(1.9)
76 DGAC1
40(3.2)
138 AC1 37(3.8)
214 AC2
R 49(4.9)
61 AR 46(4.5)
137 AC1 44(4.4)
213 AC2
R 51(1.2)
61 AR 46(1.8)
137 AC1 46(1.2)
213 AC2
C1 50(1.6)
50 AC1 48(2.8)
112 AC2 45(1.8)
187 ATPB
C1 50(1.0)
50 AC1 47(0.9)
112 AC2 44(1.0)
187 ATPB
across the thermocouple setsr the thermocouple sets on a sectione location: AR=ARHM-GG overlay, DG=DGAC overlay, AC1=top lift of Goal 1 asphaltconcrete, ATPB=asphalt treated permeable base.
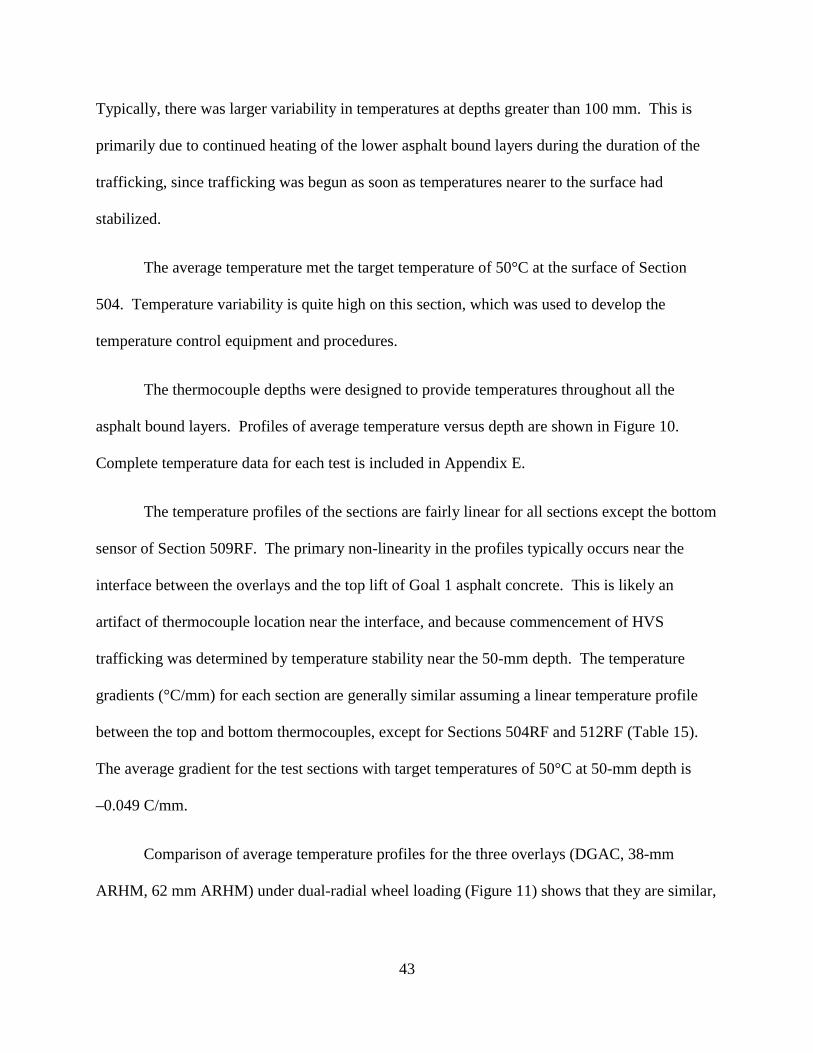
43
Typically, there was larger variability in temperatures at depths greater than 100 mm. This is
primarily due to continued heating of the lower asphalt bound layers during the duration of the
trafficking, since trafficking was begun as soon as temperatures nearer to the surface had
stabilized.
The average temperature met the target temperature of 50°C at the surface of Section
504. Temperature variability is quite high on this section, which was used to develop the
temperature control equipment and procedures.
The thermocouple depths were designed to provide temperatures throughout all the
asphalt bound layers. Profiles of average temperature versus depth are shown in Figure 10.
Complete temperature data for each test is included in Appendix E.
The temperature profiles of the sections are fairly linear for all sections except the bottom
sensor of Section 509RF. The primary non-linearity in the profiles typically occurs near the
interface between the overlays and the top lift of Goal 1 asphalt concrete. This is likely an
artifact of thermocouple location near the interface, and because commencement of HVS
trafficking was determined by temperature stability near the 50-mm depth. The temperature
gradients (°C/mm) for each section are generally similar assuming a linear temperature profile
between the top and bottom thermocouples, except for Sections 504RF and 512RF (Table 15).
The average gradient for the test sections with target temperatures of 50°C at 50-mm depth is
–0.049 C/mm.
Comparison of average temperature profiles for the three overlays (DGAC, 38-mm
ARHM, 62 mm ARHM) under dual-radial wheel loading (Figure 11) shows that they are similar,

Figure 10. Average pavement temperature profi
Variation of ave
0
50
100
150
200
250
30 35 40
Dep
th (m
m)44
les during HVS trafficking.
rage temp with depth - all rutting sections
45 50 55 60Average temp (C)
504RF 505RF
508RF 509RF
506RF 507RF
513RF 510RF
511RF 512RF
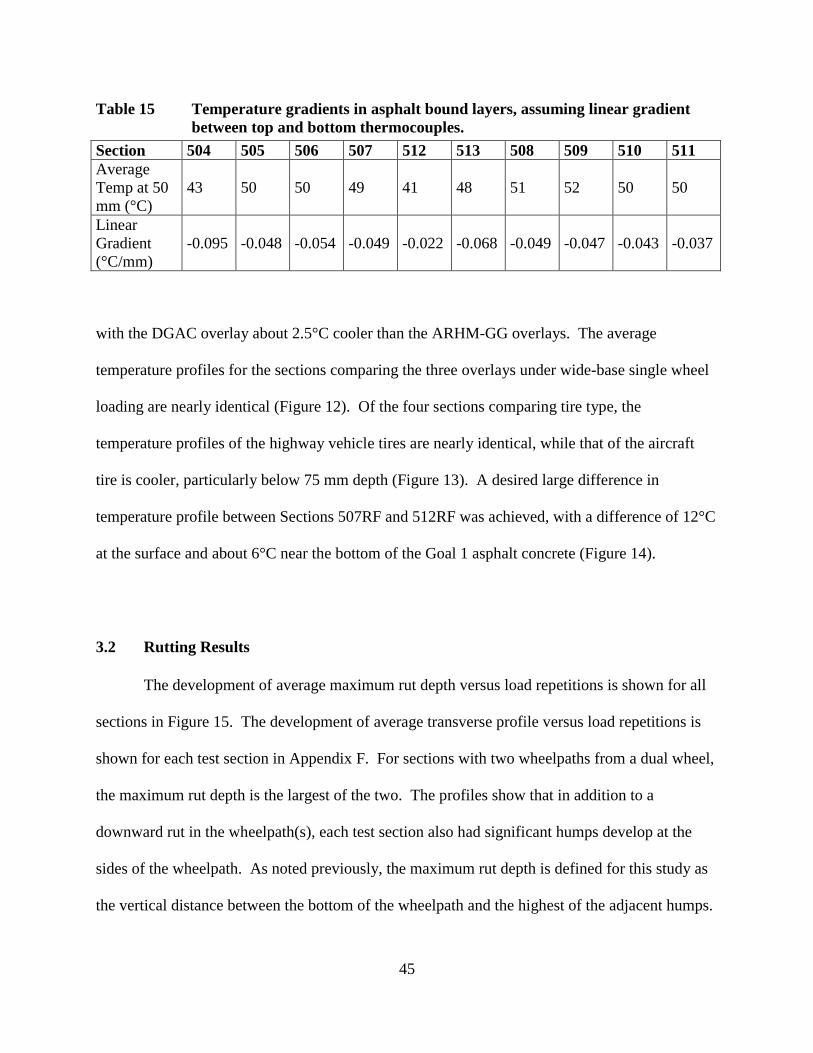
45
Table 15 Temperature gradients in asphalt bound layers, assuming linear gradientbetween top and bottom thermocouples.
Section 504 505 506 507 512 513 508 509 510 511AverageTemp at 50mm (°C)
43 50 50 49 41 48 51 52 50 50
LinearGradient(°C/mm)
-0.095 -0.048 -0.054 -0.049 -0.022 -0.068 -0.049 -0.047 -0.043 -0.037
with the DGAC overlay about 2.5°C cooler than the ARHM-GG overlays. The average
temperature profiles for the sections comparing the three overlays under wide-base single wheel
loading are nearly identical (Figure 12). Of the four sections comparing tire type, the
temperature profiles of the highway vehicle tires are nearly identical, while that of the aircraft
tire is cooler, particularly below 75 mm depth (Figure 13). A desired large difference in
temperature profile between Sections 507RF and 512RF was achieved, with a difference of 12°C
at the surface and about 6°C near the bottom of the Goal 1 asphalt concrete (Figure 14).
3.2 Rutting Results
The development of average maximum rut depth versus load repetitions is shown for all
sections in Figure 15. The development of average transverse profile versus load repetitions is
shown for each test section in Appendix F. For sections with two wheelpaths from a dual wheel,
the maximum rut depth is the largest of the two. The profiles show that in addition to a
downward rut in the wheelpath(s), each test section also had significant humps develop at the
sides of the wheelpath. As noted previously, the maximum rut depth is defined for this study as
the vertical distance between the bottom of the wheelpath and the highest of the adjacent humps.

VariationSection
0
50
100
150
200
250
30 35 40
Dep
th (m
m)
Figure 11. Average pavement temperature profil
46
of average temperature with depth s trafficced with dual radial tires
45 50 55 60Average temp (C)
510RF, ARHM 38mm
506RF, DGAC
509 RF, ARHM 62mm
es during HVS trafficking for three overlays under dual-radial wheel.
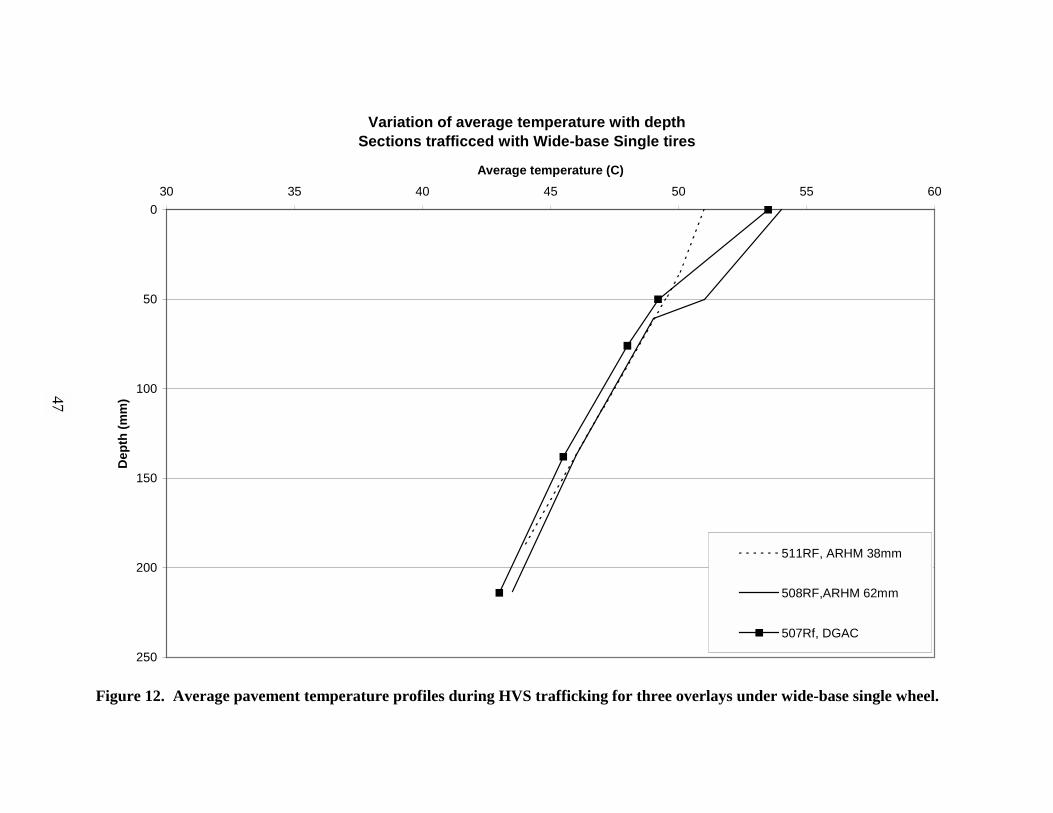
VariationSections tr
0
50
100
150
200
250
30 35 40
Dep
th (m
m)
Figure 12. Average pavement temperature profil
47
of average temperature with depth afficced with Wide-base Single tires
45 50 55 60Average temperature (C)
511RF, ARHM 38mm
508RF,ARHM 62mm
507Rf, DGAC
es during HVS trafficking for three overlays under wide-base single wheel.

Variation DGAC overla
0
50
100
150
200
250
30 35 40
Dep
th (m
m)
Figure 13. Average pavement temperature profil
48
of average temperature with depth y - constant temperature 50C at 50mm
45 50 55 60Average temperature (C)
513RF-Aircraft
505RF, dual-bias ply
506RF,dual radial
507Rf, wide base single
es during HVS trafficking for four tire types on DGAC overlay.

Variation DGAC
0
50
100
150
200
250
30 35 40
Dep
th (m
m)
DGAC at 40C
Figure 14. Average pavement temperature profilDGAC overlay.
49
of average temperature with depth overlay - 50C and 40C at 50mm
45 50 55 60Average temperature (C)
507RF, DGAC - 50C512RF, DGAC - 40C
DGAC at 50C
es during HVS trafficking for two temperatures, wide-base single wheel,

Rutting test sectio
3.50
5.50
7.50
9.50
11.50
13.50
15.50
17.50
19.50
21.50
23.50
25.50
10 50010 100010 150
Avr
g m
axim
um ru
t dep
th(m
m)
Failure c
Figure 15. Plot of average maximum rut depth ve
50
ns - profile of the average relative rut depth
010 200010 250010 300010 350010 400010
Repetitions
504 RF
505 RF
506 RF
507 RF
508 RF
509 RF
510 RF
511 RF
512 RF
513 RF
riteria=12.5mm rut depth
rsus load repetitions for all test sections.

51
On many of the test sections, HVS trafficking was continued well beyond the failure rut
depth of 12.5 mm. Final rut depths ranged between 15 and 24 mm (Table 16). Figure 15
indicates all of the sections subjected to trafficking by highway wheels/tires had an initial period
of rapid rut development, followed by a second period with a reduced rate of rutting that
continued until trafficking was stopped. The aircraft wheel test section (513RF) had a slight
reduction in rut rate as trafficking progressed, but much less than that of the other test sections.
None of the test sections showed any evidence of a “tertiary” period of rut development in which
the rate of rut development increases again after the second period of reduced rutting rate. The
lack of a tertiary rutting period, despite final ruts of 15 to 24 mm, suggests that this is either:
• A phenomenon that occurs only in the laboratory during triaxial repeated load testing,
• A phenomenon that occurs in the field when temperatures or loads exceed those
previously experienced by the mix, or
• A phenomenon that only occurs when rut depths have already exceeded 24 mm.
Table 16 Average maximum rut depth and load repetitions at completion of HVStrafficking.
Section Final Load Repetitions Final Average Maximum Rut Depth (mm)504 RF 85,043 14.9505 RF 172,529 15.3506 RF 165,734 18.9507 RF 113,176 21.7512 RF 341,976 13.4513 RF 3,033 21.2508 RF 123,426 19.2509 RF 187,478 18.1510 RF 186,308 17.6511 RF 72,837 23.8

52
Results of trenching and profilometer measurements at the top of the base indicate that
less than 5 mm of the final average maximum rut depth occurred at the surface of the aggregate
base on any of the test sections. The measurements are not precise because of noise caused by
individual particles at the surface of the base. Disturbance at the surface of the base was
minimized during sawing and slab removal, although some disturbance was inevitable due to
penetration of the prime coat into the base and adhesion of particles of the base to the asphalt
layers when the slabs were removed.
The number of load repetitions to reach the failure criterion of a maximum rut depth of
12.5 mm varied depending upon overlay type, tire type, and temperature. The number of
repetitions to reach an average maximum rut depth of 6.25 mm, and to failure (12.5 mm), for
each test section is shown in Table 17. The values shown are averages of the transverse profiles
taken at 0.5-m intervals along the middle 6 m of the 8-m long test sections. Also shown is the
standard deviation of the rut depth along the section at that number of load repetitions.
All of the test sections except 510RF have relatively uniform rut depths along the test
section, as can be seen from the standard deviations of maximum rut depth in Table 17.
The ranking of rutting performance based on load repetitions to the failure rut depth is as
follows:
1. DGAC overlay at target temperature of 40 C (Section 512RF),
2.a. 38 mm ARHM-GG overlay with dual radial tires (Section 510RF),
2.b. DGAC overlay with dual bias-ply tires (Section 505RF),
3.a. DGAC overlay with dual radial tires (Section 506RF),
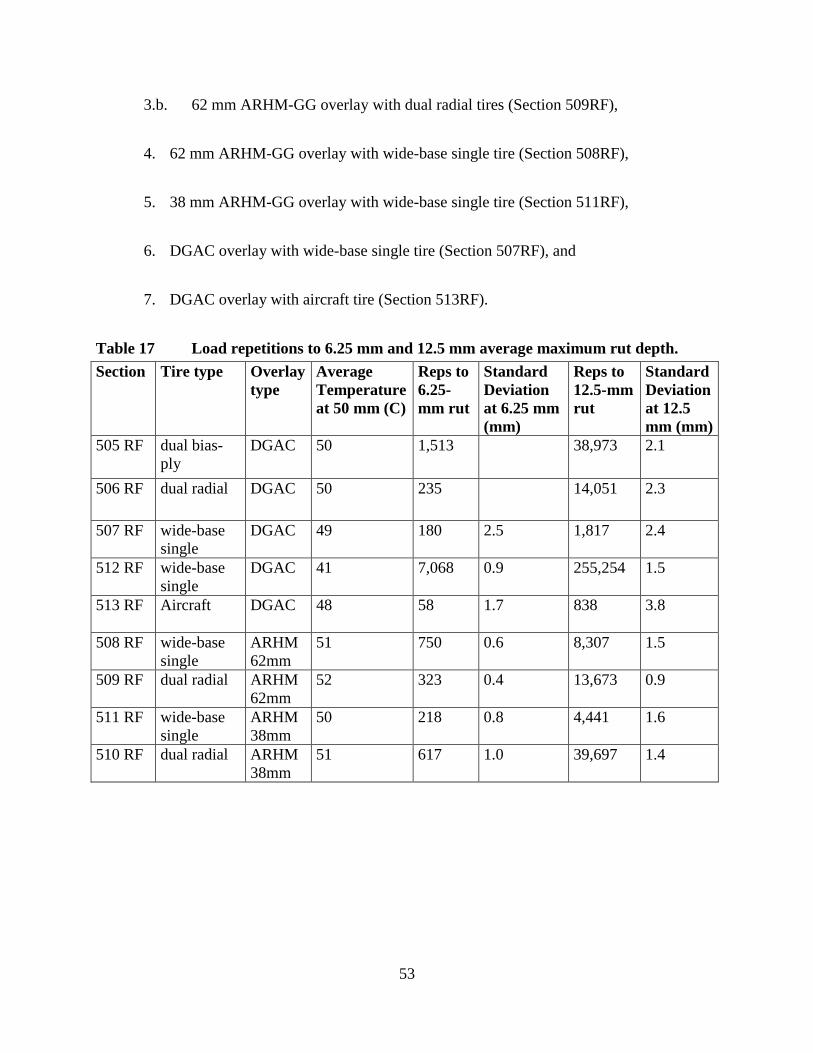
53
3.b. 62 mm ARHM-GG overlay with dual radial tires (Section 509RF),
4. 62 mm ARHM-GG overlay with wide-base single tire (Section 508RF),
5. 38 mm ARHM-GG overlay with wide-base single tire (Section 511RF),
6. DGAC overlay with wide-base single tire (Section 507RF), and
7. DGAC overlay with aircraft tire (Section 513RF).
Table 17 Load repetitions to 6.25 mm and 12.5 mm average maximum rut depth.Section Tire type Overlay
typeAverageTemperatureat 50 mm (C)
Reps to6.25-mm rut
StandardDeviationat 6.25 mm(mm)
Reps to12.5-mmrut
StandardDeviationat 12.5mm (mm)
505 RF dual bias-ply
DGAC 50 1,513 38,973 2.1
506 RF dual radial DGAC 50 235 14,051 2.3
507 RF wide-basesingle
DGAC 49 180 2.5 1,817 2.4
512 RF wide-basesingle
DGAC 41 7,068 0.9 255,254 1.5
513 RF Aircraft DGAC 48 58 1.7 838 3.8
508 RF wide-basesingle
ARHM62mm
51 750 0.6 8,307 1.5
509 RF dual radial ARHM62mm
52 323 0.4 13,673 0.9
511 RF wide-basesingle
ARHM38mm
50 218 0.8 4,441 1.6
510 RF dual radial ARHM38mm
51 617 1.0 39,697 1.4
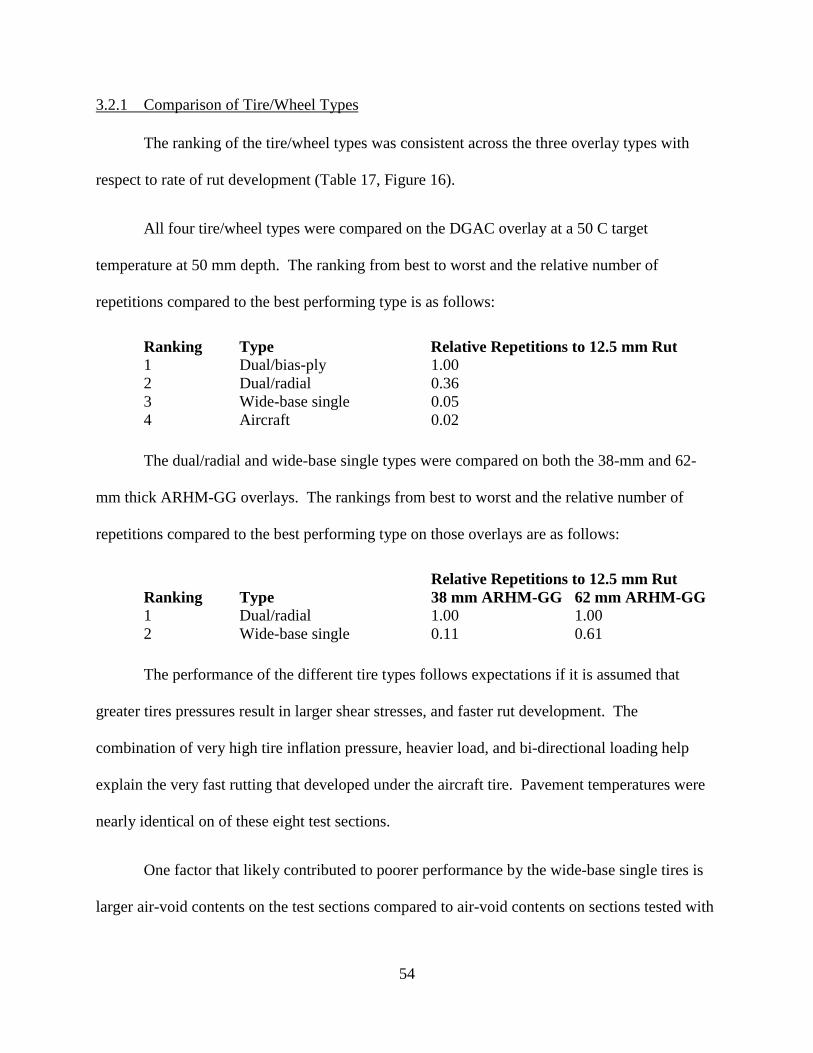
54
3.2.1 Comparison of Tire/Wheel Types
The ranking of the tire/wheel types was consistent across the three overlay types with
respect to rate of rut development (Table 17, Figure 16).
All four tire/wheel types were compared on the DGAC overlay at a 50 C target
temperature at 50 mm depth. The ranking from best to worst and the relative number of
repetitions compared to the best performing type is as follows:
Ranking Type Relative Repetitions to 12.5 mm Rut1 Dual/bias-ply 1.002 Dual/radial 0.363 Wide-base single 0.054 Aircraft 0.02
The dual/radial and wide-base single types were compared on both the 38-mm and 62-
mm thick ARHM-GG overlays. The rankings from best to worst and the relative number of
repetitions compared to the best performing type on those overlays are as follows:
Relative Repetitions to 12.5 mm RutRanking Type 38 mm ARHM-GG 62 mm ARHM-GG1 Dual/radial 1.00 1.002 Wide-base single 0.11 0.61
The performance of the different tire types follows expectations if it is assumed that
greater tires pressures result in larger shear stresses, and faster rut development. The
combination of very high tire inflation pressure, heavier load, and bi-directional loading help
explain the very fast rutting that developed under the aircraft tire. Pavement temperatures were
nearly identical on of these eight test sections.
One factor that likely contributed to poorer performance by the wide-base single tires is
larger air-void contents on the test sections compared to air-void contents on sections tested with

Rate of rutting on a D
0.00
5.00
10.00
15.00
20.00
25.00
10 20010 40010 60010
Avr
g R
elat
ive
Rut
Dep
th(m
m)
Figure 16. Plot of average maximum rut developm
55
GAC overlay trafficked under different tire types
80010 100010 120010 140010 160010 180010 200010
Repetitions
505 RF - dual bias-ply506 RF - dual radial507 RF - wide-base single513 RF - Aircraft
Failure criteria: 12.5 mm rut depth
ent versus load repetitions for four tire/wheel types on DGAC overlay.

56
other wheel/tire types. On the DGAC overlay, the average initial air-void content under the
wide-base single was 7.9 percent, compared to 5.8 and 4.7 percent under the dual/bias-ply and
dual/radial wheels, respectively. On the ARHM-GG overlays, the average air-void contents
under the wide-base single were 12.5 and 17.9 percent, compared to 9.9 and 15.2 percent under
the dual/radial. While the differences in air-void content are not so different that they would be
expected to reverse the rankings, they likely increased the rut development under the wide-base
single.
3.2.2 Comparison of Overlay Types
The ranking of the three overlay types/thicknesses was not consistent for the two types of
wheels they were tested with (Table 17, Figures 17,18).
The ranking of the overlays and the relative number of repetitions compared to the best
performing overlay under each wheel is as follows:
Dual/Radial Tires Wide-base Single TireRanking Overlay Relative Reps. Ranking Overlay Relative Reps.1 38 mm ARHM-GG 1.00 1 62 mm ARHM-GG 1.002a DGAC 0.35 2 38 mm ARHM-GG 0.532b 62 mm ARHM-GG 0.34 3 DGAC 0.22
Average pavement temperatures at 50 mm depth during each test were quite similar.
These results suggest that in general, the performance of both thicknesses of the ARHM-GG
overlay is not that different from that of the DGAC, and might be considered superior.
Two factors must be considered in evaluating this observation. First, the binder content
of the ARHM-GG overlay was on average one percent less than the target binder content, while
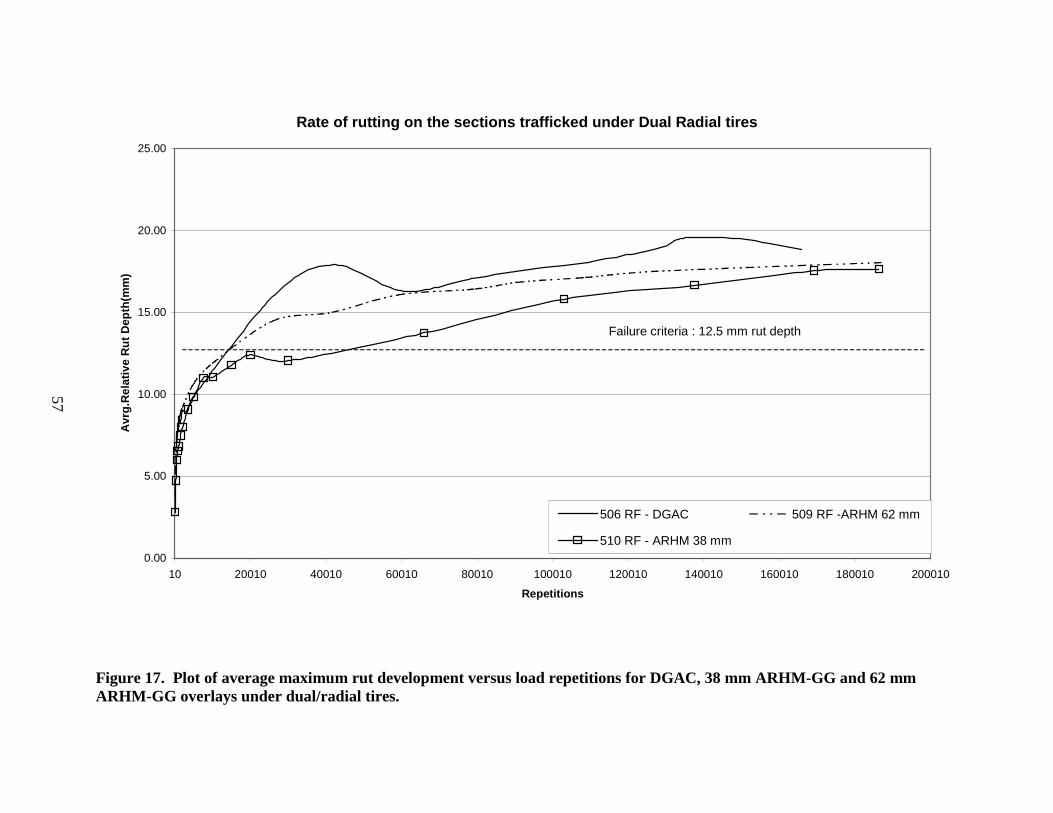
Rate of rutting on t
0.00
5.00
10.00
15.00
20.00
25.00
10 20010 40010 60010
Avr
g.R
elat
ive
Rut
Dep
th(m
m)
Figure 17. Plot of average maximum rut developmARHM-GG overlays under dual/radial tires.
57
he sections trafficked under Dual Radial tires
80010 100010 120010 140010 160010 180010 200010
Repetitions
506 RF - DGAC 509 RF -ARHM 62 mm
510 RF - ARHM 38 mm
Failure criteria : 12.5 mm rut depth
ent versus load repetitions for DGAC, 38 mm ARHM-GG and 62 mm
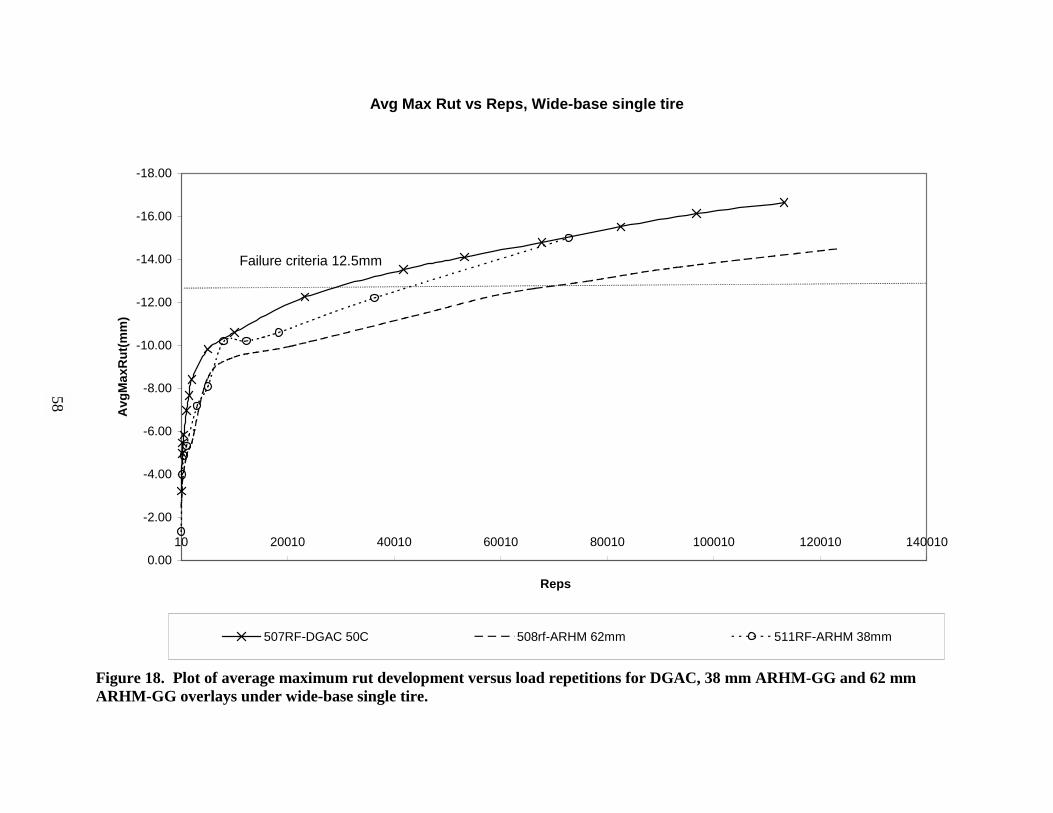
Avg Max
-18.00
-16.00
-14.00
-12.00
-10.00
-8.00
-6.00
-4.00
-2.00
0.0010 20010 40010
Avg
Max
Rut
(mm
)
507RF-DGAC 50C
Failure criteria 12.5mm
Figure 18. Plot of average maximum rut developmARHM-GG overlays under wide-base single tire.
58
Rut vs Reps, Wide-base single tire
60010 80010 100010 120010 140010
Reps
508rf-ARHM 62mm 511RF-ARHM 38mm
ent versus load repetitions for DGAC, 38 mm ARHM-GG and 62 mm
59
the binder content of the DGAC overlay was within the target range. This would tend to
improve the rutting performance of the ARHM-GG overlay compared to that of the DGAC. On
the other hand, the air-void contents of the ARHM-GG overlay are considerably greater than
those of the DGAC, particularly the sections with a 38-mm ARHM-GG thickness. The poorer
compaction of the ARHM-GG overlay would be expected to result in poorer rutting
performance. The net effect of these two differences from design targets on rutting performance
must be further evaluated through laboratory testing.
The fact that the performance of the overlaid structures is similar can be attributed in part
to the presence of the same Goal 1 dense graded asphalt concrete layers underlying each test
section. As will be seen, a portion of the rutting in each section occurred in the underlying
asphalt concrete layers, as well as in the overlays.
3.2.3 Comparison of Pavement Temperature
As would be expected, reducing pavement temperature significantly improves rutting
performance (Table 17, Figure 19). The difference of 8°C in average temperature between
Sections 507RF and 512RF resulted in a ratio of load repetitions to reach 12.5 mm rut depth of
140:1. These results strongly indicate that mix design procedures should account for expected
pavement temperatures at a project location when selecting binder content and evaluating the
expected rutting performance.
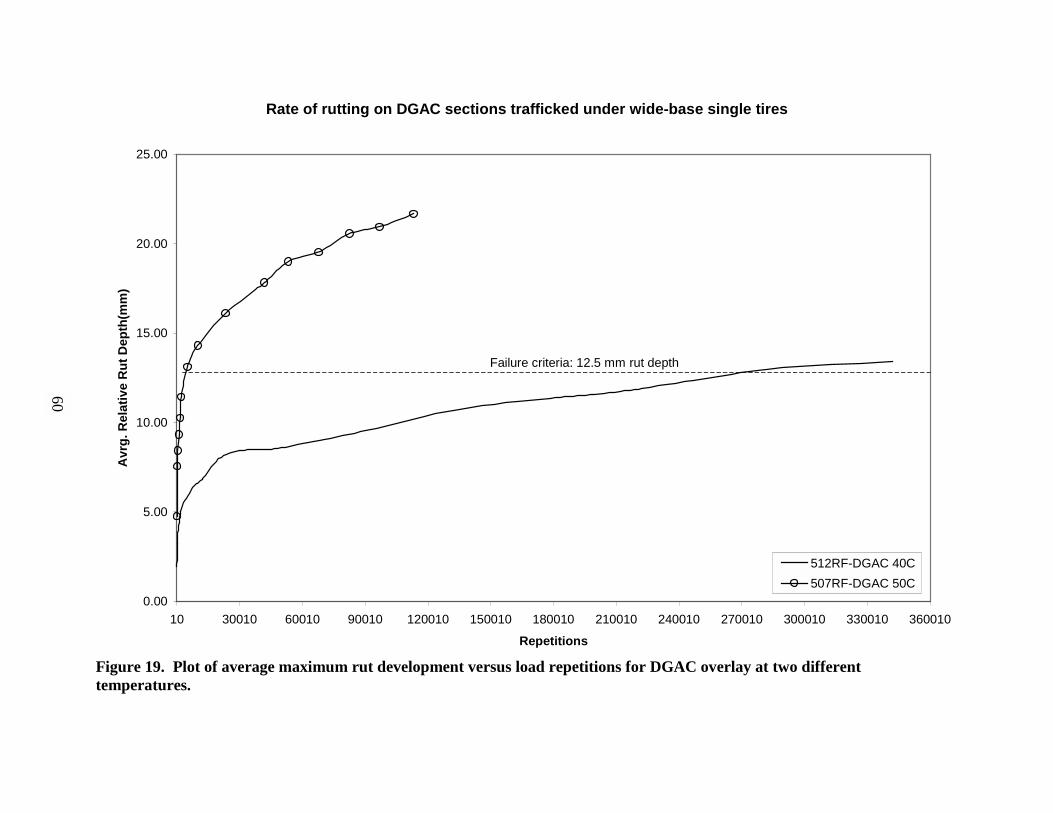
Rate of rutting on DGAC
0.00
5.00
10.00
15.00
20.00
25.00
10 30010 60010 90010 1200
Avr
g. R
elat
ive
Rut
Dep
th(m
m)
Figure 19. Plot of average maximum rut developmtemperatures.
60
sections trafficked under wide-base single tires
10 150010 180010 210010 240010 270010 300010 330010 360010
Repetitions
512RF-DGAC 40C507RF-DGAC 50C
Failure criteria: 12.5 mm rut depth
ent versus load repetitions for DGAC overlay at two different

61
3.3 Contribution to Rutting of Shear and Densification of Different Layers
Rutting occurred in all of the asphalt-bound layers. Rutting in each layer can be divided
between permanent reduction in volume (densification), permanent movement of material at
constant volume (shear or shape change), or a combination of both. The relative amounts of
rutting occurring in each layer, and the relative proportions of rut depth that can be attributed to
densification and shear were evaluated through analysis of:
• layer thicknesses from slabs taken in the trenches,
• layer thickness from cores,
• volumes of material in the humps and wheelpath measured from the transverse
profilometer profiles, and
• air-void contents of the cores.
It is important to measure and understand the relative contributions of densification and
shear in order to develop mix design methods that effectively reduce the risk of premature
rutting.
3.3.1 Profile changes
Humps would not appear at the edges of the wheelpath if rutting in asphalt concrete
layers was solely caused by densification (or reduction in air-void content) from compaction
under the repeated wheel loads. The development of upheavals of asphalt concrete is apparent in
the humps at the edge of the wheelpath seen in the surface profile plots from the laser
profilometer in Appendix F. The surface profiles also indicate a downward movement of the
62
surface in the wheelpaths, which is due to a combination of shear flow of material to the humps,
and densification of the material in the wheelpath.
The surface profiles indicate that the humps are sometimes equal on each side of the
wheelpath(s) and sometimes not. The humps are particularly large on the sections with 38-mm
ARHM-GG overlays (510RF, 511RF), and are small under the aircraft wheel (513RF).
The thicknesses of the asphalt concrete layers on transverse cross sections measured on
slabs taken during trenching are plotted in Appendix G. The plots assume no rutting of the base.
The plots indicate some development of humps in nearly all sections. Humps are particularly
noticeable between dual tires, and in the Goal layers under the 38-mm ARHM-GG overlay
sections.
The surface of the top lift of Goal 1 asphalt concrete typically shows some rutting, except
for the section tested at 40°C (512RF). The rutting at the top of the Goal 1 AC is typically less
than that at the surface, except under the 38-mm ARHM-GG overlays, which show considerable
rutting in the surface of both the top and bottom lifts of Goal 1 AC. The presence of large humps
at the surface and considerable rutting of the Goal 1 AC layers on the 38-mm ARHM-GG
sections indicates that shear movement can occur at the same time as densification, and in mixes
with high air-void contents. The average air-void content of those sections (510RF, 511RF)
prior to trafficking was 16.6 percent.
3.3.2 Air-void content changes
Average air-void contents in the wheelpath and humps from cores taken after trafficking
are shown for each test section in Table 18. There is inherent variability in the comparison of

63
cores from before traffic and after, since the two measurements must be taken on two cores from
different locations. As was seen in Figure 4, the cores were taken as near as possible at the same
transverse location along the wheelpath.
Table 18 Air-void contents before and after HVS trafficking, from cores.Average Air-Void Content (percent)SectionBeforeTraffic
First*Wheelpath
SecondWheelpath
Edge*Hump
MiddleHump**
504RF – Top Lift 5.2 4.5 6.0Bottom Lift 4.6 2.7 2.6505RF – DGAC Overlay 5.8 5.0 4.4 6.8Top Lift 5.5 4.7 4.0 4.5Bottom Lift 2.9 3.2 2.3 2.0506RF – DGAC Overlay 4.7 4.0 4.5 5.0 6.2Top Lift 4.6 3.7 3.3 3.5 3.2Bottom Lift 4.7 3.5 4.4 4.0 4.0507RF – DGAC Overlay 7.9 4.3 7.6Top Lift 4.1 3.0 4.4Bottom Lift 4.1 2.7 5.7512RF – DGAC Overlay 10.3 6.1 9.9Top Lift 6.7 5.6 8.7Bottom Lift 3.0 5.3 3.1513RF – DGAC Overlay 7.1 4.1Top Lift 6.2 5.0Bottom Lift 4.7 4.3508RF – ARHM 62 mm Overlay 12.5 8.3 10.3Top Lift 6.4 6.7 6.5Bottom Lift 3.5 2.5 3.2509RF – ARHM 62 mm Overlay 10.0 7.4 9.1 10.1Top Lift 8.7 5.0 6.0 8.1Bottom Lift 4.9 3.8 3.5 4.7510RF – ARHM 38 mm Overlay 15.2 9.7 11.9 11.6Top Lift 4.7 3.6 5.6 4.2Bottom Lift 6.5 2.7 4.3 2.4511RF – ARHM 38 mm Overlay 17.9 12.8 15.9Top Lift 6.4 3.0 5.4Bottom Lift 3.3 3.3 3.1

64
The results indicate that some densification occurred in the wheelpath of each section.
Larger changes in air-void content occurred in the overlays of sections that had larger air-void
contents to begin with (510RF, 511RF, 512RF), regardless of mix type. Greater densification
occurred in the top and bottom lifts of Goal 1 AC on sections where air-void contents before
trafficking were high, as well. None of the layers in any section had air-void contents in the
wheelpaths below 2.3 percent after trafficking, and that layer (bottom lift, Section 505RF) had an
air-void content of 2.9 percent before trafficking.
Air-void contents in the humps appear to typically fall between those of the untrafficked
areas and the wheelpaths, and show no other clear pattern across all sections. During trenching
in some sections, it was observed that the material in the top 10 mm of the hump appeared to
have a different gradation and air-void content compared to the material below it. There was no
method available to sample such a small volume for air-void content and gradation, and the air-
void contents measured from the hump cores are averages over the entire height of the overlay
layer.
Summary wheelpath air-void contents for each asphalt concrete layer are shown in Table
19, before and after trafficking. The results indicate that the mixes that were poorly compacted
to begin with, such as the ARHM-GG overlays, underwent the most densification. The dense
graded mixes (DGAC overlay and Goal 1 AC layers) which had good compaction during
construction, did not experience much densification despite the hot temperature conditions,
heavy loads, and channelized traffic of the HVS. This indicates that good construction
compaction helps reduce the amount of densification that occurs under trafficking and reduces
the amount of rutting caused by densification.
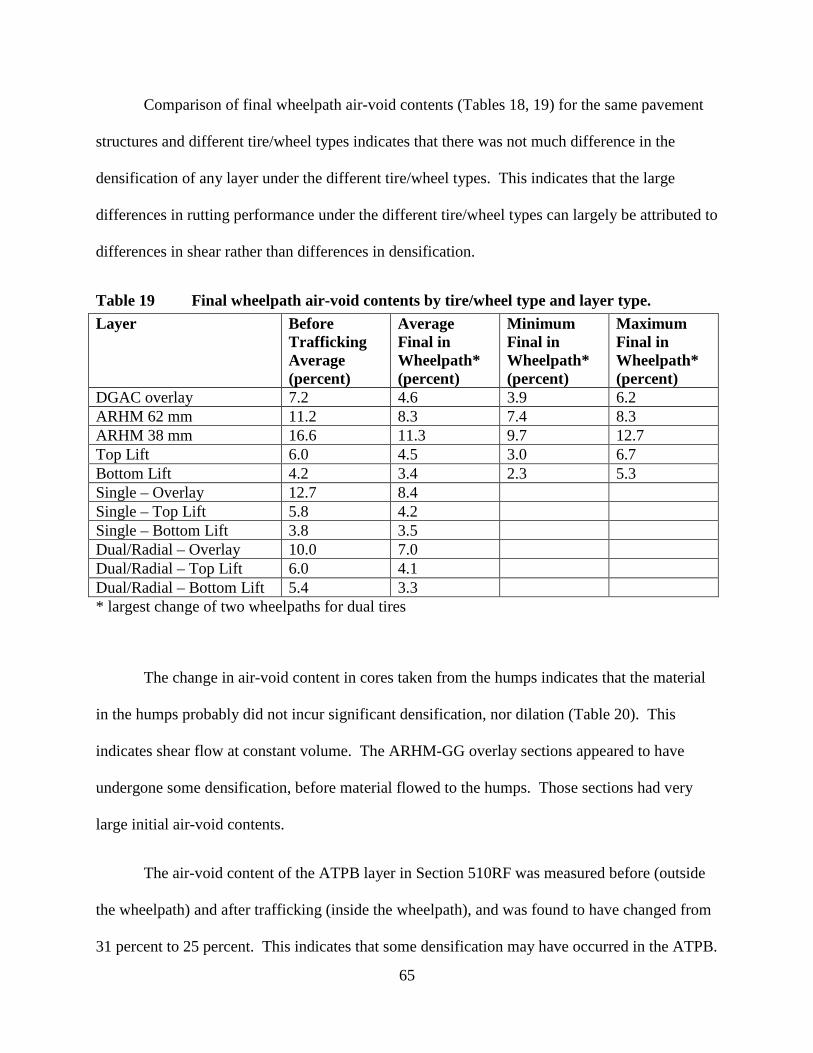
65
Comparison of final wheelpath air-void contents (Tables 18, 19) for the same pavement
structures and different tire/wheel types indicates that there was not much difference in the
densification of any layer under the different tire/wheel types. This indicates that the large
differences in rutting performance under the different tire/wheel types can largely be attributed to
differences in shear rather than differences in densification.
Table 19 Final wheelpath air-void contents by tire/wheel type and layer type.Layer Before
TraffickingAverage(percent)
AverageFinal inWheelpath*(percent)
MinimumFinal inWheelpath*(percent)
MaximumFinal inWheelpath*(percent)
DGAC overlay 7.2 4.6 3.9 6.2ARHM 62 mm 11.2 8.3 7.4 8.3ARHM 38 mm 16.6 11.3 9.7 12.7Top Lift 6.0 4.5 3.0 6.7Bottom Lift 4.2 3.4 2.3 5.3Single – Overlay 12.7 8.4Single – Top Lift 5.8 4.2Single – Bottom Lift 3.8 3.5Dual/Radial – Overlay 10.0 7.0Dual/Radial – Top Lift 6.0 4.1Dual/Radial – Bottom Lift 5.4 3.3* largest change of two wheelpaths for dual tires
The change in air-void content in cores taken from the humps indicates that the material
in the humps probably did not incur significant densification, nor dilation (Table 20). This
indicates shear flow at constant volume. The ARHM-GG overlay sections appeared to have
undergone some densification, before material flowed to the humps. Those sections had very
large initial air-void contents.
The air-void content of the ATPB layer in Section 510RF was measured before (outside
the wheelpath) and after trafficking (inside the wheelpath), and was found to have changed from
31 percent to 25 percent. This indicates that some densification may have occurred in the ATPB.
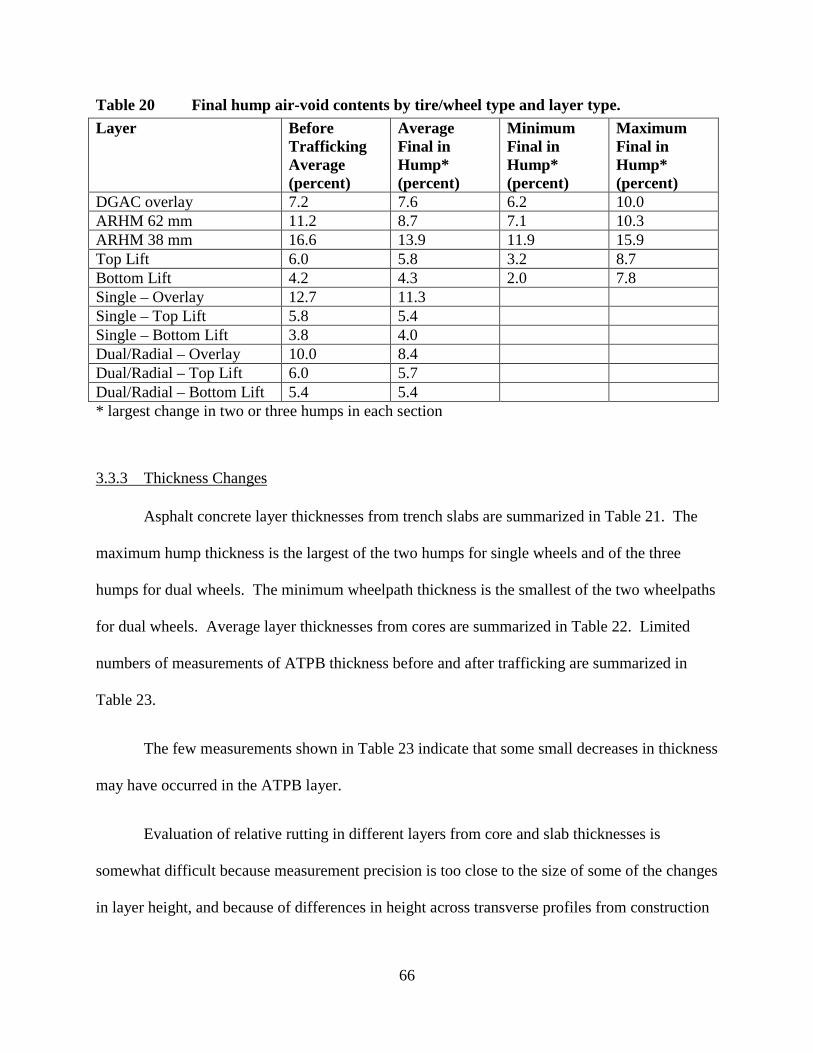
66
Table 20 Final hump air-void contents by tire/wheel type and layer type.Layer Before
TraffickingAverage(percent)
AverageFinal inHump*(percent)
MinimumFinal inHump*(percent)
MaximumFinal inHump*(percent)
DGAC overlay 7.2 7.6 6.2 10.0ARHM 62 mm 11.2 8.7 7.1 10.3ARHM 38 mm 16.6 13.9 11.9 15.9Top Lift 6.0 5.8 3.2 8.7Bottom Lift 4.2 4.3 2.0 7.8Single – Overlay 12.7 11.3Single – Top Lift 5.8 5.4Single – Bottom Lift 3.8 4.0Dual/Radial – Overlay 10.0 8.4Dual/Radial – Top Lift 6.0 5.7Dual/Radial – Bottom Lift 5.4 5.4* largest change in two or three humps in each section
3.3.3 Thickness Changes
Asphalt concrete layer thicknesses from trench slabs are summarized in Table 21. The
maximum hump thickness is the largest of the two humps for single wheels and of the three
humps for dual wheels. The minimum wheelpath thickness is the smallest of the two wheelpaths
for dual wheels. Average layer thicknesses from cores are summarized in Table 22. Limited
numbers of measurements of ATPB thickness before and after trafficking are summarized in
Table 23.
The few measurements shown in Table 23 indicate that some small decreases in thickness
may have occurred in the ATPB layer.
Evaluation of relative rutting in different layers from core and slab thicknesses is
somewhat difficult because measurement precision is too close to the size of some of the changes
in layer height, and because of differences in height across transverse profiles from construction
67
Table 21. Thicknesses before and after HVS trafficking, from slabs.Thickness (mm)SectionBefore Traffic Minimum
WheelpathMaximumHump
504RF – Top Lift 78 71 80Bottom Lift 81 74 81505RF - DGAC Overlay 54 55 62Top Lift 72 62 73Bottom Lift 77 82 83506RF – DGAC Overlay 78 71 83Top Lift 80 72 78Bottom Lift 81 74 76507RF – DGAC Overlay 76 62 77Top Lift 76 75 81Bottom Lift 74 71 77512RF – DGAC Overlay 49 43 54Top Lift 65 63 67Bottom Lift 77 80 76513RF – DGAC Overlay 80 69 81Top Lift 72 65 72Bottom Lift 78 81 82508RF – ARHM 62 mmOverlay
73 66 75
Top Lift 76 66 75Bottom Lift 75 72 76509RF – ARHM 62 mmOverlay
75 65 80
Top Lift 74 64 70Bottom Lift 72 73 74510RF – ARHM 38 mmOverlay
35 22 34
Top Lift 64 52 67Bottom Lift 83 80 81511RF – ARHM 38 mmOverlay
35 30 35
Top Lift 66 64 76Bottom Lift 77 74 88
68
Table 22 Thicknesses before and after HVS trafficking, from cores.Average Thickness (mm)SectionBeforeTraffic
First*Wheelpath
SecondWheelpath
Edge*Hump
MiddleHump**
504RF – Top Lift 76 66 76Bottom Lift 82 80 82505RF - DGAC Overlay 61 51 55 60 60Top Lift 75 68 68 74 74Bottom Lift 75 74 64 73 72506RF – DGAC Overlay 78 70 66 79 82Top Lift 79 72 72 75 74Bottom Lift 78 72 72 75 74507RF – DGAC Overlay 78 68 78Top Lift 76 73 78Bottom Lift 76 72 74512RF – DGAC Overlay 52 45 52Top Lift 69 64 69Bottom Lift 72 73 70513RF – DGAC Overlay 77Top Lift 67Bottom Lift 78508RF – ARHM 62 mm Overlay 66 64 70Top Lift 75 66 75Bottom Lift 82 73 77509RF – ARHM 62 mm Overlay 70 68 72 70Top Lift 70 67 71 71Bottom Lift 70 72 70 68510RF – ARHM 38 mm Overlay 34 30 38 37Top Lift 61 55 64 64Bottom Lift 74 78 76 79511RF – ARHM 38 mm Overlay 38 34 39Top Lift 69 62 69Bottom Lift 83 78 82
Table 23 Thickness of ATPB before and after HVS trafficking, from cores.Average ATPB Thickness (mm)SectionBeforeTraffic
First*Wheelpath
SecondWheelpath
Edge*Hump
MiddleHump**
505RF 73 66 77 71 70512RF 70 69 74510RF 75 68 72 62511RF 81 74
69
prior to HVS trafficking. However, some patterns can be discerned from the results of Tables 21
and 22, and averages taken across the different experiment variables and summed in Table 24.
Across all sections (Table 24), most of the change in layer thickness in the wheelpaths
occurred in the overlay and top lift of Goal 1 AC. Some reductions in thickness occurred in the
bottom lift of Goal 1 AC, however they were typically much less than those of the other two
layers. Similarly, most increase in thickness in the humps occurred in the overlays.
The DGAC and 62-mm ARHM-GG overlays were of similar thickness, and percentage
changes of thickness in these sections result in similar changes of rut depth (Table 24). In
general, both overlays show similar percentage decreases in thickness in the wheelpath in the
three layers. The percentage increases in thickness in the humps in the three layers are not clear
from the core and slab data, except to indicate that there was not much hump development in the
bottom lift of Goal 1 AC.
The 38-mm ARHM-GG overlay shows somewhat greater percentage decreases in
thickness in the wheelpaths compared to the other two overlays (Table 24). The 38-mm ARHM-
GG overlay had the poorest compaction, which should result in more densification and less shear
resistance. The small thickness of this layer would also result in a greater concentration of large
shear stresses and hotter temperatures in the overlay compared to the structures with thicker
overlays.
The dual/radial and wide-base single tires show similar trends with respect to the
percentage thickness changes in each layer (Table 24).
70
Table 24 Summary averages for percent change in thickness of asphalt concrete layersunder HVS trafficking.
Percent Change in Thickness(cores)
Percent Change in Thickness(slabs)
Location* OL TL BL OL TL BLAll wheelpath -9 -8 -5 -14 -9 -1
hump 3 1 -3 5 3 3DGAC wheelpath -11 -7 -7 -10 -7 0
hump 1 -2 -3 7 2 2ARHM 62 wheelpath -2 -7 -5 -11 -13 -1
hump 3 1 -4 5 -3 2ARHM 38 wheelpath -12 -10 0 -26 -11 -4
hump 5 4 1 -1 10 6Single wheelpath -8 -7 -7 -14 -6 -4
hump 1 2 -3 2 7 7Dual/radial wheelpath -9 -8 0 -20 -14 -3
hump 5 -1 -2 4 -1 -2* calculated from maximum hump thickness and minimum wheelpath thickness on each section;OL – overlay, TL – top lift Goal 1 AC, BL – bottom lift Goal 1 AC).
Section 504RF, in which trafficking occurred on the surface of the Goal 1 AC, indicated
rutting in both the top and bottom lifts, although core measurements indicate more in the top lift
than the bottom lift than do slab measurements (Tables 21, 22). The aircraft wheel (513RF)
results show that rutting occurred in the DGAC overlay and top lift of Goal 1 AC, and not in the
bottom lift of Goal 1 AC. The results of Sections 507RF and 512RF indicate that the 8°C
difference in temperature did not affect the locations where rutting occurred, although it
dramatically affected the rate at which it occurred. Most of the rutting and hump development in
both sections occurred in the overlay.
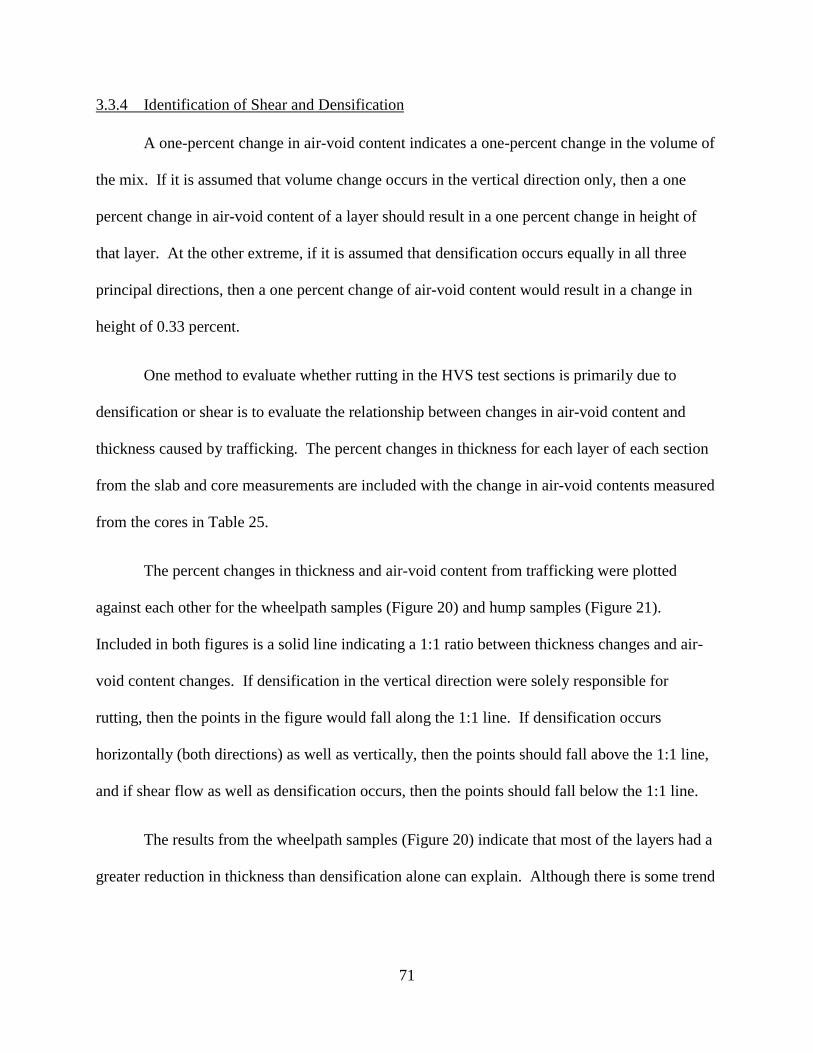
71
3.3.4 Identification of Shear and Densification
A one-percent change in air-void content indicates a one-percent change in the volume of
the mix. If it is assumed that volume change occurs in the vertical direction only, then a one
percent change in air-void content of a layer should result in a one percent change in height of
that layer. At the other extreme, if it is assumed that densification occurs equally in all three
principal directions, then a one percent change of air-void content would result in a change in
height of 0.33 percent.
One method to evaluate whether rutting in the HVS test sections is primarily due to
densification or shear is to evaluate the relationship between changes in air-void content and
thickness caused by trafficking. The percent changes in thickness for each layer of each section
from the slab and core measurements are included with the change in air-void contents measured
from the cores in Table 25.
The percent changes in thickness and air-void content from trafficking were plotted
against each other for the wheelpath samples (Figure 20) and hump samples (Figure 21).
Included in both figures is a solid line indicating a 1:1 ratio between thickness changes and air-
void content changes. If densification in the vertical direction were solely responsible for
rutting, then the points in the figure would fall along the 1:1 line. If densification occurs
horizontally (both directions) as well as vertically, then the points should fall above the 1:1 line,
and if shear flow as well as densification occurs, then the points should fall below the 1:1 line.
The results from the wheelpath samples (Figure 20) indicate that most of the layers had a
greater reduction in thickness than densification alone can explain. Although there is some trend
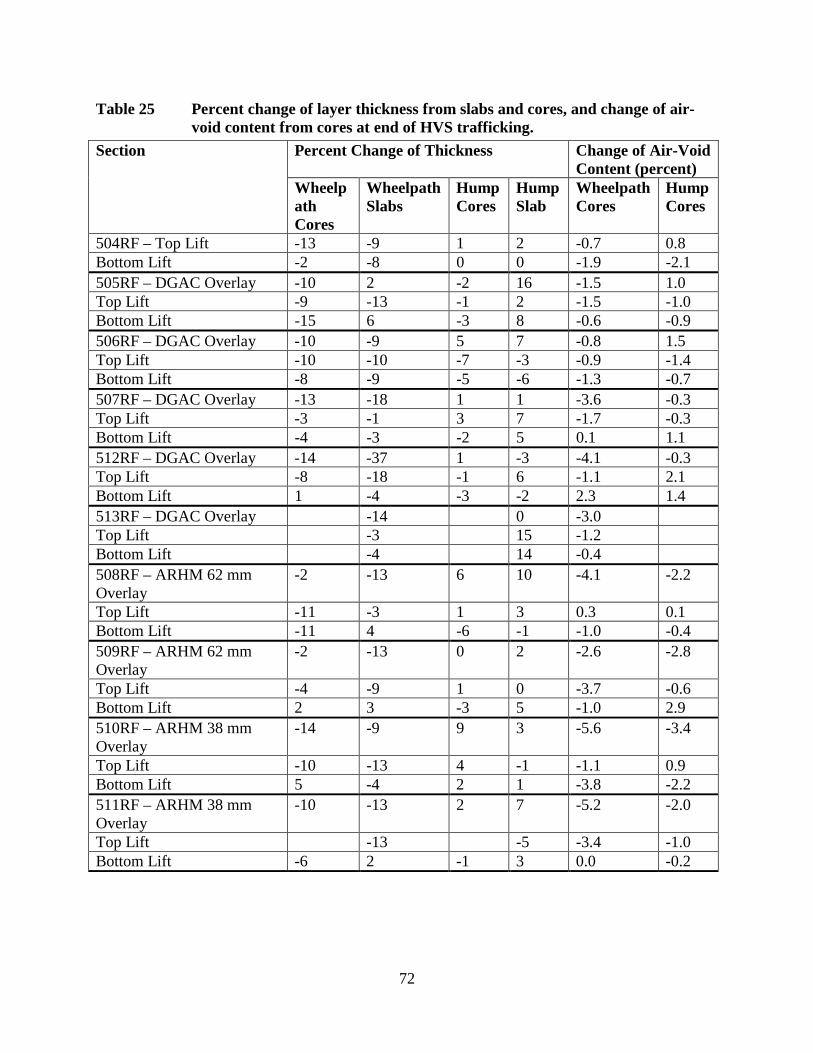
72
Table 25 Percent change of layer thickness from slabs and cores, and change of air-void content from cores at end of HVS trafficking.
Percent Change of Thickness Change of Air-VoidContent (percent)
Section
WheelpathCores
WheelpathSlabs
HumpCores
HumpSlab
WheelpathCores
HumpCores
504RF – Top Lift -13 -9 1 2 -0.7 0.8Bottom Lift -2 -8 0 0 -1.9 -2.1505RF – DGAC Overlay -10 2 -2 16 -1.5 1.0Top Lift -9 -13 -1 2 -1.5 -1.0Bottom Lift -15 6 -3 8 -0.6 -0.9506RF – DGAC Overlay -10 -9 5 7 -0.8 1.5Top Lift -10 -10 -7 -3 -0.9 -1.4Bottom Lift -8 -9 -5 -6 -1.3 -0.7507RF – DGAC Overlay -13 -18 1 1 -3.6 -0.3Top Lift -3 -1 3 7 -1.7 -0.3Bottom Lift -4 -3 -2 5 0.1 1.1512RF – DGAC Overlay -14 -37 1 -3 -4.1 -0.3Top Lift -8 -18 -1 6 -1.1 2.1Bottom Lift 1 -4 -3 -2 2.3 1.4513RF – DGAC Overlay -14 0 -3.0Top Lift -3 15 -1.2Bottom Lift -4 14 -0.4508RF – ARHM 62 mmOverlay
-2 -13 6 10 -4.1 -2.2
Top Lift -11 -3 1 3 0.3 0.1Bottom Lift -11 4 -6 -1 -1.0 -0.4509RF – ARHM 62 mmOverlay
-2 -13 0 2 -2.6 -2.8
Top Lift -4 -9 1 0 -3.7 -0.6Bottom Lift 2 3 -3 5 -1.0 2.9510RF – ARHM 38 mmOverlay
-14 -9 9 3 -5.6 -3.4
Top Lift -10 -13 4 -1 -1.1 0.9Bottom Lift 5 -4 2 1 -3.8 -2.2511RF – ARHM 38 mmOverlay
-10 -13 2 7 -5.2 -2.0
Top Lift -13 -5 -3.4 -1.0Bottom Lift -6 2 -1 3 0.0 -0.2

73
between decreases in air-void content and thickness, most of the data falls below the percent
change in thickness corresponding to a 1:1 ratio between densification and thickness change.
This indicates that shear flow must be responsible for movement of material out of the wheelpath
and into the humps at the sides of the wheelpath. Most of the points that fall above the 1:1 line
are for sample that had little change in air-void content or thickness.
The material moved by shear from the wheelpath to the humps appears to undergo the
potential for densification, dilation, and no change (Table 25, Figure 21). Air-void content in the
humps of all layers typically appears to be distributed within zero to three percent of air-void
contents taken in untrafficked areas, which would indicate that the shear flow occurs at close to
constant volume. The largest changes in air-void content in the humps occurred in the poorly
compacted ARHM-GG overlay layers, indicating that some densification and shear flow
occurred to the humps in those sections.
The volume of empty space in the rutted wheelpath below the original surface profile was
compared to the volume of material in the hump to evaluate the relative contributions of
densification and shear to rut development. The volume of space in the hump is attributable to
both reduced density of the material in the wheelpath, and removed volume of material pushed
out of the wheelpath and into the humps. Assuming that the material in the humps was moved at
constant volume (no densification) by shear, then the ratio of the volume of the humps to the
volume of space in the rutted wheelpath is the proportion of the rut attributable to shear. The
proportion of rut volume not attributable to shear is attributable to densification.
The calculations were performed using the surface profiles averaged across all data
acquisitions performed during HVS trafficking (Table 26), and at a 12.5-mm average maximum

-40
-35
-30
-25
-20
-15
-10
-5
0
5
10
-7 -6 -5 -4
Wheelp
Perc
ent C
hang
e in
Whe
elpa
th T
hick
ness
Figure 20. Percent change in layer thickness vers
74
-3 -2 -1 0 1 2 3
ath Air-Void Content Change (Percent)
Wheelpath core thickness percent change
Wheelpath slab thickness percent change
Line of equality
us air-void content change from HVS trafficking in the wheelpath.

-10
-5
0
5
10
15
20
-4 -3 -2 -
Hum
Perc
ent C
hang
e in
Hum
p Th
ickn
ess
Hump core thickness percent chang
Hump slab thickness percent chang
Figure 21. Percent change in layer thickness vers
75
1 0 1 2 3 4
p Air-Void Content Change (Percent)
e
e
us air-void content change from HVS trafficking in the wheelpath.
76
rut depth (Table 27) for each section, using the laser profilometer data. The results in Tables 26
and 27 indicate that the proportion of rut volume attributable to shear and densification at 12.5
mm is fairly typical of the proportion across all HVS trafficking.
Table 26 Volume of wheelpaths and humps, percent of rut volume attributed to shear(ratio of hump to wheelpath volume) and densification (1-shear), averageacross all data acquisitions during HVS trafficking.
Volume Change Along 5 m Section (m3) Percent ofWheelpath RutVolume
Section FinalRutDepth(mm) First
HumpFirstWheelpath
MiddleHump
SecondWheelpath
SecondHump
Shear Densification
505 RF 15.3 0.0016 0.0100 0.0006 0.0084 0.0014 19 81506 RF 18.9 0.0028 0.0081 0.0010 0.0061 0.0028 47 53507 RF 21.7 0.0027 0.0139 0.0025 38 62512 RF 13.4 0.0010 0.0081 0.0010 24 76513 RF 21.2 0.0012 0.0140 0.0022 24 76508 RF 19.2 0.0025 0.0098 0.0029 56 44509 RF 18.1 0.0014 0.0070 0.0008 0.0067 0.0025 34 66510 RF 17.6 0.0031 0.0051 0.0017 0.0042 0.0024 77 23511 RF 23.8 0.0053 0.0096 0.0043 100 0
Table 27 Volume of wheelpaths and humps, percent of rut volume attributed to shear(ratio of hump to wheelpath volume) and densification (1-shear), at 13 mmrut depth.
Volume Change Along 5 m Section (m3) Percent ofWheelpath RutVolume
Section Repsto 13-mmrutdepth
FirstHump
FirstWheelpath
MiddleHump
SecondWheelpath
SecondHump
Shear Densification
505 RF 47,450 0.0023 0.0122 0.0009 0.0105 0.0018 22 78506 RF 15,773 0.0057 0.0180 0.0020 0.0133 0.0069 47 53507 RF 1,965 0.0019 0.0132 0.0021 31 69512 RF 286,07
90.0020 0.0147 0.0019 26 74
513 RF 928 0.0015 0.0193 0.0030 23 77508 RF 10,498 0.0036 0.0132 0.0038 56 44509 RF 16,765 0.0030 0.0122 0.0018 0.0118 0.0055 42 58510 RF 50,239 0.0073 0.0112 0.0040 0.0091 0.0056 83 17511 RF 5,142 0.0066 0.0106 0.0054 114 -14
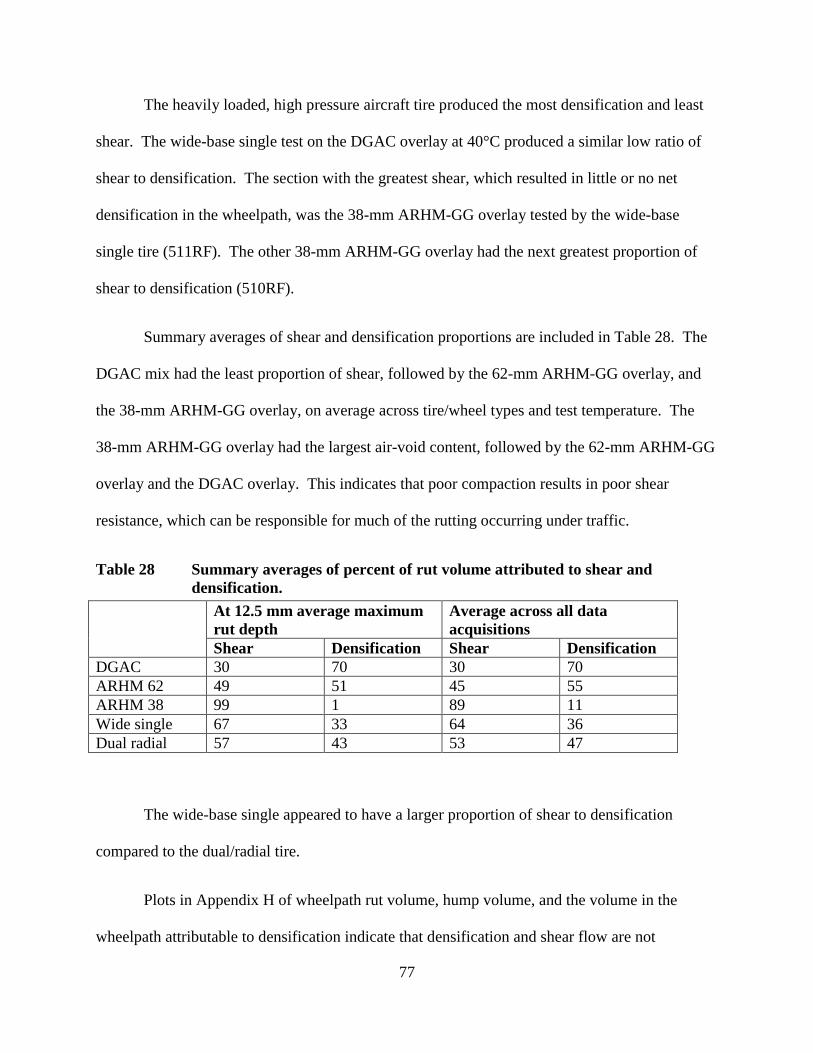
77
The heavily loaded, high pressure aircraft tire produced the most densification and least
shear. The wide-base single test on the DGAC overlay at 40°C produced a similar low ratio of
shear to densification. The section with the greatest shear, which resulted in little or no net
densification in the wheelpath, was the 38-mm ARHM-GG overlay tested by the wide-base
single tire (511RF). The other 38-mm ARHM-GG overlay had the next greatest proportion of
shear to densification (510RF).
Summary averages of shear and densification proportions are included in Table 28. The
DGAC mix had the least proportion of shear, followed by the 62-mm ARHM-GG overlay, and
the 38-mm ARHM-GG overlay, on average across tire/wheel types and test temperature. The
38-mm ARHM-GG overlay had the largest air-void content, followed by the 62-mm ARHM-GG
overlay and the DGAC overlay. This indicates that poor compaction results in poor shear
resistance, which can be responsible for much of the rutting occurring under traffic.
Table 28 Summary averages of percent of rut volume attributed to shear anddensification.
At 12.5 mm average maximumrut depth
Average across all dataacquisitions
Shear Densification Shear DensificationDGAC 30 70 30 70ARHM 62 49 51 45 55ARHM 38 99 1 89 11Wide single 67 33 64 36Dual radial 57 43 53 47
The wide-base single appeared to have a larger proportion of shear to densification
compared to the dual/radial tire.
Plots in Appendix H of wheelpath rut volume, hump volume, and the volume in the
wheelpath attributable to densification indicate that densification and shear flow are not
78
processes that continue simultaneously with a constant ratio between them. Instead, the plot
indicate that for nearly all tests there is an initial period of both densification and shearing,
followed by alternating periods where either densification or shearing is predominant. The
poorly compacted 38-mm ARHM-GG test sections (510RF and 511RF) showed initial
densification, followed by several periods of a net increase in volume (dilation).
3.4 Rutting in the Underlying Layers
Transverse profiles were taken on the surface of the aggregate base using the laser
profilometer after HVS trafficking was completed. The profiles were obtained by sawing and
removing transverse section of the asphalt bound layers, and placing the profilometer in the
resulting trench. The transverse profiles are included in Appendix I. The final profiles taken on
the surface of the asphalt bound layers are superimposed on the profiles of the aggregate base to
show the approximate width of the surface ruts, and therefore the locations in the aggregate base
where rutting of the underlying layers should have occurred.
It is difficult to make precise measurements of rutting in the underlying layers from the
aggregate base surface profiles because of irregularities in the profiles caused by adhesion of
aggregate base to the asphalt bound layers during removal of the slabs, due to the prime coat.
There also appear to be small differences in cross slope between the aggregate base and the
surface. However, some observations can be made regarding the assumption of the experiment
design that no rutting would occur in the aggregate base and below.
The sections with DGAC overlays trafficked at 50°C with the three tire/wheel types
appears to have no rutting in the unbound layers (505RF, 506RF, 507RF). The section overlaid
79
with DGAC and trafficked at 40°C (512RF) also appears to have no rutting in the unbound
layers. The section overlaid with DGAC and trafficked with the aircraft wheel appears to have
about 5 mm of rut at the top of the aggregate base. This indicates that the 200 mm of asphalt
concrete did not provide adequate protection from the high pressure, heavy load aircraft wheel at
50°C, and rutting occurred in the unbound layers after only 3,033 repetitions.
Of the four sections overlaid with ARHM-GG, the two sections trafficked with the dual
radial tire/wheel appear to have no rutting in the unbound layers (509RF, 510RF), regardless of
the thickness of the ARHM-GG overlay. The two sections trafficked with the wide-base single
tire/wheel appear to have some rutting in the unbound layers. The section with the 38-mm
ARHM-GG overlay (511RF) appears to have about 4 mm of rut at the top of the aggregate base,
and the section with the 62-mm ARHM-GG overlay (508RF) appears to have 1 to 2 mm of rut.
Fewer repetitions were placed with the wide-base single than with the dual radial on these
sections (Table 16).
The results indicate that at 50°C, the ARHM-GG overlays do not provide as much
protection to the unbound layers as do the thicker DGAC overlays for similar load repetitions
and the same load. This is to be expected since the ARHM-GG overlays are not as thick, nor as
stiff as the DGAC.
The results also indicate that the wide-base single may be more severe for rutting of the
unbound layers, as well as for the asphalt bound layers.

80
3.5 Late Bonding of Layers
As reported in References (5-9), the test pavement constructed at the Pavement Research
Center was observed to have no bond between asphalt concrete layers. The test pavement was
constructed following the Caltrans Method Specification, which does not require a tack coat
between lifts except under special circumstances or if the resident engineer requests it. The
conditions under which the HVS test sections were constructed were ideal for bonding between
lifts without the use of a tack coat – there was no exposure to dust or rain, and because the
sections were constructed inside a building, the lifts retained plenty of heat and should have
formed an excellent bond.
Cores taken from just outside the wheelpath of the rutting test sections showed no bond
between asphalt lifts. However, after HVS trafficking during rutting tests, some cores taken
from inside the wheelpath these sections showed that a bond between asphalt layers had indeed
been formed. This bond was likely due to the high temperature of the pavement, the stress under
the HVS wheel load, and possibly some “kneading” action caused by the permanent deformation
and material flow taking place during the test.
Caltrans field representatives have often reported observing a bond between asphalt lifts
even when no tack coat was used between successive lifts during their construction. This
observation has been suggested as a rationale for the Caltrans Method Specification, which in
most cases does not require a tack coat. Given that no such bond was observed on the
untrafficked HVS test sections, which were also constructed without use of a tack coat, but
which were constructed under ideal conditions to enable a bond to form (e.g., high temperature,
no wind, no exposure to dust or water), it is suggested that the bond observed in the field may
only form after exposure to traffic and high temperatures.

81
Before this bond between layers forms, a period may exist during which a bond is not
present and the bottom of the top lift experiences strains which may lead to preventable fatigue
cracking and which could be mitigated by the use of a tack coat between lifts. References (5-9)
provide an in-depth discussion of how a bond between layers can significantly increase the
fatigue life of asphalt pavements.

82
83
4.0 CONCLUSIONS AND RECOMMENDATIONS
4.1 Conclusions
The following conclusions were drawn from the results presented in this report:
1. ARHM-GG cools very quickly after placement, particularly when placed in 38-mm lifts, as
opposed to 62-mm lifts. Average air-void contents of 16.6 and 12.2 percent were found for
the thin and thick ARHM-GG overlays on this project prior to construction. Extra attention
must be placed on temperature control of this material during compaction to obtain good
compaction.
2. Overall, the 62-mm ARHM-GG and 50- to 75-mm DGAC overlays had similar performance,
and the 38-mm ARHM-GG overlay had superior performance, under dual/radial loading.
Both ARHM-GG overlays had better performance than the DGAC overlay under wide-base
single loading. The rutting performance of the ARHM-GG was therefore concluded to be
generally similar to that of the DGAC, after consideration of as-built binder contents and
compaction.
3. Low Hveem stabilometer values obtained for the ARHM-GG mix were not reflected by the
performance of the mix under HVS loading. Better methods of characterizing rutting
performance of ARHM-GG mixes are needed.
4. The ranking of repetitions to a 12.5-mm rut failure on the DGAC overlay was (best to worst):
dual/bias-ply, dual/radial, wide-base single, aircraft. The ranking on the ARHM overlays
was dual/radial, wide-base single. The wide-base single had 0.05 to 0.61 times the
repetitions to failure of the dual/radial, depending upon the overlay type and thickness.
84
These results indicate that rutting damage will increase if the use of wide-base single tires
becomes more widespread.
5. The temperature difference of 8°C at a 50-mm depth between two otherwise similar tests
resulted in 140 times more load repetitions being applied before rutting failure on the cooler
section compared to the hotter section. The results emphasize the need to account for local
project pavement temperatures in the mix design process.
6. Air-void contents of cores taken in the wheelpath after trafficking showed relatively little
densification, except when the overlays were poorly compacted, despite final rut depths of 15
to 24 mm. The average proportion of rut depth attributable to shear flow as opposed to
densification varied between 19 to 100 percent, depending on the overlay type. The greatest
shear flow occurred on the 38-mm ARHM-GG sections, and the least on the DGAC sections.
These results indicate that rutting did not consist of a process of densification to a very low
air-void content followed by rapid shear flow. Instead, it appears that rutting consists of
simultaneous densification and shear flow, with the rates of shearing and densification
varying at different periods of rut development. The performance of the poorly compacted
ARHM-GG mixes indicates that considerable shear flow occurs at high air-void contents.
7. The protection against rutting provided to the underlying layers at elevated temperatures by
the ARHM-GG overlays appears to be less than that provided by the DGAC overlays. This
is expected due to the greater thickness and stiffness of the DGAC overlays. The 2:1
structural equivalence ratio between ARHM-GG and DGAC for overlays should not be
extended to the unbound layers rutting distress mechanism.

85
4.2 Recommendations
The following recommendations are based on the results and conclusions presented in
this report:
1. The use of ARHM-GG overlays up to at least 62 mm thick does not appear to incur a greater
risk of rutting of the pavement surface at elevated temperatures. The limitation of use of
ARHM-GG in hot environments does not appear to be warranted, provided that the overlay is
designed to adequately resist rutting.
2. The implementation of a better method for mix design of ARHM-GG is warranted. The use
of the Repeated Simple Shear Test at Constant Height (RSST-CH) is being investigated as
part of this project. If those results indicate that the RSST-CH and the mechanistic-empirical
procedure used to predict rutting from its results are applicable for this project, its
implementation for ARHM-GG mix design should be considered.
3. Implementation of mechanistic-empirical mix design procedures that incorporate the effects
of project temperature should be implemented. A difference of only 8°C resulted in a
significant difference in rutting performance. Use of a single evaluation temperature in the
current Caltrans procedure is likely producing over-conservative mixes for cooler regions,
thus increasing the probability of cracking. The current criteria may not be adequate for very
hot desert regions of California.
4. The method specification for compaction of ARHM-GG can result in very high air-void
contents. Improvement of ARHM-GG compaction will result in better performance for both
rutting and cracking. Quality Control/Quality Assurance (QC/QA) procedures for ARHM-
86
GG should be implemented. As a preliminary step, use of end-result specifications for
ARHM-GG compaction should be implemented immediately.
5. Caltrans should closely monitor use of wide-base single tires on California highways.
Increased use poses a risk of increased rutting.
6. Caltrans should monitor tire pressures, as well as loads, on the truck fleet using California
highways. The increased rutting under the wide-base single and the aircraft wheel found in
this study indicate that increased tire pressures will increase the risk of rutting. Rational
adjustment of mix design criteria should be evaluated periodically as tire pressures continue
to increase.
7. The ARHM-GG structural equivalencies for fatigue and reflection cracking should not be
used for pavement design for the design criterion of rutting of the unbound layers.

87
5.0 REFERENCES
1. Shatnawi, S. 1999. Performance of Asphalt Rubber Mixes in California. Submitted to theInternational Journal of Pavement Engineering, July.
2. Maintenance Program, Pavement Management Information Branch. 1995 State of thePavement. California Department of Transportation, Sacramento, November.
3. Office of Office Engineer, Division of Construction. 1993 Contract Cost Data. CaliforniaDepartment of Transportation, Sacramento.
4. Standard Tests, California Department of Transportation, Sacramento, 1995.
5. Harvey, J., L. du Plessis, F. Long, S. Shatnawi, C. Scheffy, B. Tsai, I, Guada, D. Hung,N. Coetzee, M. Reimer, and C. L. Monismith, Initial CAL/APT Program: Site Information,Test Pavement Construction, Pavement Materials Characterizations, Initial CAL/HVS TestResults, and Performance Estimates, Pavement Research Center, CAL/APT Program,Institute of Transportation Studies, University of California, Berkeley, June 1996.
6. Harvey, J., L. du Plessis, F. Long, J. Deacon, I, Guada, D. Hung, and C. Scheffy, CAL/APTProgram: Test Results from Accelerated Test on Pavement Structure Containing AsphaltTreated Permeable Base (ATPB)—Section 500RF, Pavement Research Center, CAL/APTProgram, Institute of Transportation Studies, University of California, Berkeley, June 1997.
7. Harvey, J., J. Prozzi, J. Deacon, D. Hung, I. Guada, L. du Plessis, F. Long and C. Scheffy,CAL/APT Program: Test Results from Accelerated Pavement Test on Pavement StructureContaining Aggregate Base (AB) - Section 501RF, Report for the California Department ofTransportation, Institute of Transportation Studies, University of California, Berkeley, April,1999 (Draft submitted September, 1997).
8. Harvey, J., I, Guada, C. Scheffy, L. Louw, J. Prozzi, and D. Hung, CAL/APT Program: TestResults from Accelerated Pavement Test on Pavement Structure Containing Asphalt TreatedPermeable Base—Section 502CT, Draft Report, Pavement Research Center, CAL/APTProgram, Institute of Transportation Studies, University of California, Berkeley, February1998.
9. Harvey, J., D. Hung, J. Prozzi, L. Louw, C. Scheffy, and I. Guada, CAL/APT Program: TestResults from Accelerated Pavement Test on Pavement Structure Containing UntreatedAggregate Base—Section 503RF, Draft Report, Pavement Research Center, CAL/APTProgram, Institute of Transportation Studies, University of California, Berkeley, December1997.
10. University of California Berkeley Pavement Research Center; Dynatest Consulting, Inc.;Division of Roads and Transport Technology, CSIR. 1997. Test Plan for CAL/APT Goal 3.Test Plan prepared for the California Department of Transportation, 1997.

88
11. Harvey, J., N. Coetzee and L. Louw, Design and Construction of CAL/APT Goal 3 DGACand ARHM-GG Overlays, and Review of Caltrans Design and Construction Methods, DraftReport prepared for California Department of Transportation. CAL/APT Program, PavementResearch Center, Institute of Transportation Studies, University of California, Berkeley,December, 1999.
12. Dynatest Consulting, Inc. ELMOD Version 3.0 1988, Version 4.0 1999, Ojai, California.
13. Standard Specifications, California Department of Transportation, Sacramento, July, 1995.
14. Asphalt Institute Research Center, Superpave Asphalt Mixture Analysis, Advanced CourseText for the National Asphalt Training Center II, Prepared for Federal HighwayAdministration Office of Technology Applications, Washington, D. C., January, 1996.
15. Rust, F., L. Du Plessis, B. Verhaeghe, and J. Grobler. “Heavy Vehicle Simulator Testing ofTrial Sections for Caltrans,” Report prepared for Caltrans, DPVT C/255, CSIR, Pretoria,South Africa, October 1993.
16. Ardila-Coulson, M., D. Coulson, and P. Sebaaly, Extent of Use and Performance Traits ofSuper-Single Tires, Draft report prepared for National Cooperative Highway ResearchProgram, University of Nevada, Reno, February, 1998.
17. Bell, C. and S. Randhawa, Truck Tire Issues: Evaluation of Impacts of High Pressure Tiresand Single-Tired Axles in Oregon, Transportation Research Report 92-17, TransportationResearch Institute, Oregon State University, Corvallis, November, 1992.
18. de Beer, M. and C. Fisher, Contact Stresses of Pneumatic Tires Measured with theVehicle-Road Surface Pressure Transducer Army (VRSPTA) System for the University ofCalifornia at Berkeley (UCB) and The Nevada Automotive Test Center (NATC). Vols. 1and 2., Transportek, CSIR, South Africa, June 1997.
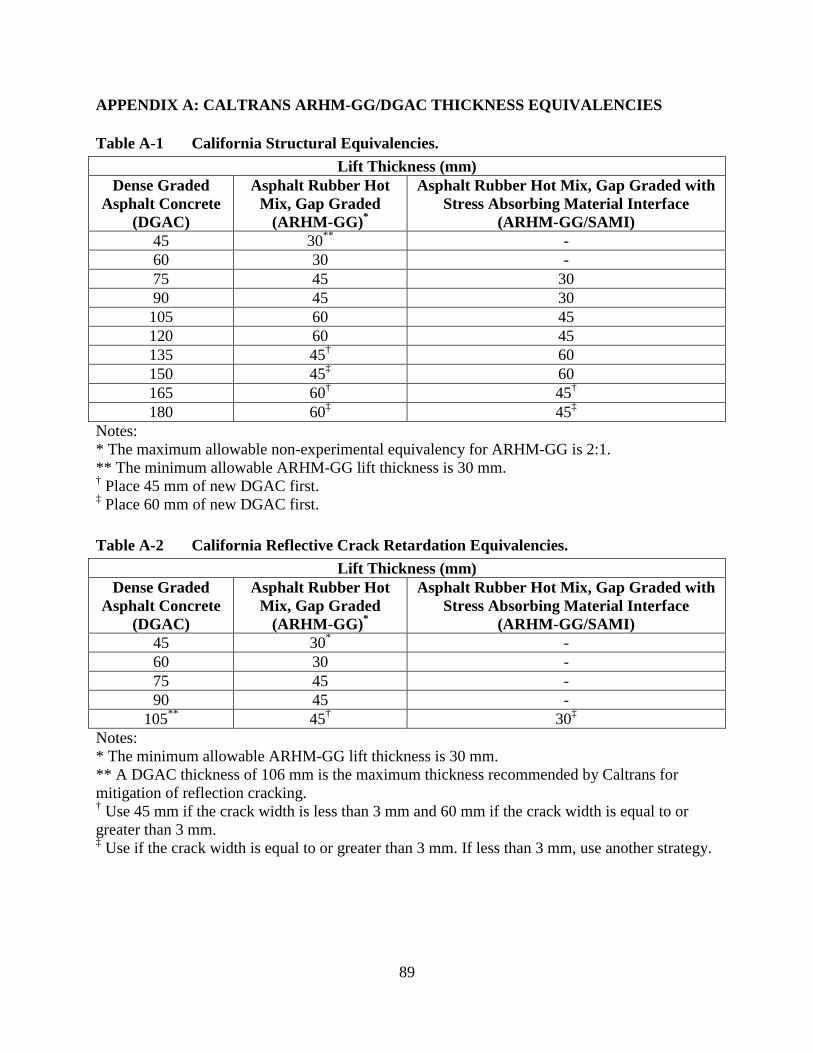
89
APPENDIX A: CALTRANS ARHM-GG/DGAC THICKNESS EQUIVALENCIES
Table A-1 California Structural Equivalencies.Lift Thickness (mm)
Dense GradedAsphalt Concrete
(DGAC)
Asphalt Rubber HotMix, Gap Graded
(ARHM-GG)*
Asphalt Rubber Hot Mix, Gap Graded withStress Absorbing Material Interface
(ARHM-GG/SAMI)45 30** -60 30 -75 45 3090 45 30105 60 45120 60 45135 45† 60150 45‡ 60165 60† 45†
180 60‡ 45‡
Notes:* The maximum allowable non-experimental equivalency for ARHM-GG is 2:1.** The minimum allowable ARHM-GG lift thickness is 30 mm.† Place 45 mm of new DGAC first.‡ Place 60 mm of new DGAC first.
Table A-2 California Reflective Crack Retardation Equivalencies.Lift Thickness (mm)
Dense GradedAsphalt Concrete
(DGAC)
Asphalt Rubber HotMix, Gap Graded
(ARHM-GG)*
Asphalt Rubber Hot Mix, Gap Graded withStress Absorbing Material Interface
(ARHM-GG/SAMI)45 30* -60 30 -75 45 -90 45 -
105** 45† 30‡
Notes:* The minimum allowable ARHM-GG lift thickness is 30 mm.** A DGAC thickness of 106 mm is the maximum thickness recommended by Caltrans formitigation of reflection cracking.† Use 45 mm if the crack width is less than 3 mm and 60 mm if the crack width is equal to orgreater than 3 mm.‡ Use if the crack width is equal to or greater than 3 mm. If less than 3 mm, use another strategy.

90
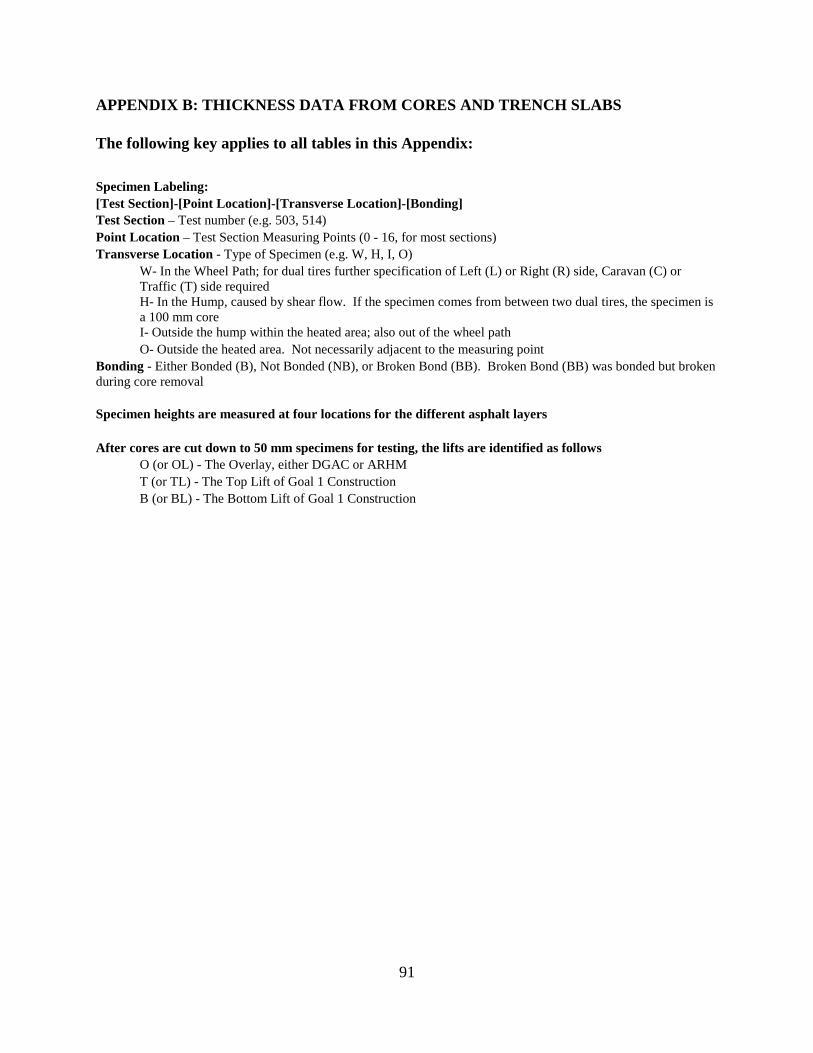
91
APPENDIX B: THICKNESS DATA FROM CORES AND TRENCH SLABS
The following key applies to all tables in this Appendix:
Specimen Labeling:[Test Section]-[Point Location]-[Transverse Location]-[Bonding]Test Section – Test number (e.g. 503, 514)Point Location – Test Section Measuring Points (0 - 16, for most sections)Transverse Location - Type of Specimen (e.g. W, H, I, O)
W- In the Wheel Path; for dual tires further specification of Left (L) or Right (R) side, Caravan (C) orTraffic (T) side requiredH- In the Hump, caused by shear flow. If the specimen comes from between two dual tires, the specimen isa 100 mm coreI- Outside the hump within the heated area; also out of the wheel pathO- Outside the heated area. Not necessarily adjacent to the measuring point
Bonding - Either Bonded (B), Not Bonded (NB), or Broken Bond (BB). Broken Bond (BB) was bonded but brokenduring core removal
Specimen heights are measured at four locations for the different asphalt layers
After cores are cut down to 50 mm specimens for testing, the lifts are identified as followsO (or OL) - The Overlay, either DGAC or ARHMT (or TL) - The Top Lift of Goal 1 ConstructionB (or BL) - The Bottom Lift of Goal 1 Construction

92
Table B-1 Thickness Data from Before Trafficking.Section Point Loc. Transverse Loc. Layer Thickness (mm) Section Layer Average Std. Dev.504 504-TL-L2 Outside Top Lift 75504 504-TL-L1 Outside TL 76
504 TL 76 1
504 504-BL-L1 Outside BL 81504 504-BL-L2 Outside BL 83
504 BL 82 2
505 12 I ATPB 70505 6 I ATPB 76
505 ATPB 73 4
505 6 I BL 75505 12 I Bottom Lift 75
505 BL 75 0
505 12 I OL 59505 6 I OL 63
505 OL 61 3
505 6 I TL 75505 12 I TL 75
505 TL 75 0
506 6 I BL 73506 10 I BL 76506 3 I BL 76506 10 O BL 78506 6 O BL 83506 3 O BL 84
506 BL 78 4
506 10 I OL 76506 6 I OL 77506 10 O OL 77506 6 O OL 78506 3 O OL 81506 3 I OL 82
506 OL 78 3
506 10 I TL 75506 3 I TL 78506 6 I TL 78506 10 O TL 81506 6 O TL 82506 3 O TL 84
506 TL 79 3
507 Outside in box BL 76507 Outside in box BL 75
507 BL 76 1
507 Outside in box OL 78507 Outside in box OL 77
507 OL 78 1
507 Outside in box TL 77507 Outside in box TL 74
507 TL 76 2
508 8 I BL 76508 5 I BL 78508 11 I BL 80508 8 O BL 84508 5 O BL 87508 11 O BL 88
508 BL 82 5
508 5 O OL 64508 8 O OL 64508 11 O OL 65508 5 I OL 66
508 OL 66 2

93
Section Point Loc. Transverse Loc. Layer Thickness (mm) Section Layer Average Std. Dev.508 8 I OL 67508 11 I OL 69508 5 I TL 72508 11 I TL 73508 8 I TL 74508 11 O TL 75508 5 O TL 76508 8 O TL 77
508 TL 75 2
509 8 I BL 67509 11 I BL 68509 5 O BL 68509 11 O BL 72509 8 O BL 72509 5 I BL 74
509 BL 70 3
509 8 O OL 68509 5 O OL 70509 11 O OL 71
509 OL 70 1
509 8 I TL 65509 5 O TL 67509 5 I TL 72509 11 O TL 72509 8 O TL 75
509 TL 70 4
510 5.2 I ATPB 69510 8 I ATPB 75510 5 I ATPB 76510 5.2 I ATPB 80
510 ATPB 75 4
510 5 I BL 70510 5.2 I BL 71510 8 I BL 78510 5.2 I BL 79
510 BL 74 5
510 5.2 I OL 26510 5 I OL 37510 5.2 I OL 37510 8 I OL 38
510 OL 34 6
510 5.2 I TL 58510 5 I TL 61510 5.2 I TL 61510 8 I TL 65
510 TL 61 3
511 11 I ATPB 76511 8 I ATPB 81511 5 I ATPB 85
511 ATPB 81 5
511 8 I BL 81511 5 I BL 82511 11 I BL 86
511 BL 83 3
511 5 I OL 36511 8 I OL 38511 11 I OL 40
511 OL 38 2

94
Section Point Loc. Transverse Loc. Layer Thickness (mm) Section Layer Average Std. Dev.511 5 I TL 65511 11 I TL 70511 8 I TL 71
511 TL 69 3
512 12 I ATPB 70512 9 I ATPB 71
512 ATPB 70 1
512 12 I BL 72512 9 I BL 73
512 BL 72 0
512 9 I OL 51512 12 I OL 52
512 OL 52 1
512 9 I TL 67512 12 I TL 71
512 TL 69 3
513 12 O BL 75513 5 O BL 80513 5 I BL 80
513 BL 78 3
513 5 O OL 76513 5 I OL 77513 12 O OL 79
513 OL 77 1
513 5 I TL 63513 5 O TL 69513 12 O TL 69
513 TL 67 3

95
Table B-2 Thickness in the Wheelpaths after Trafficking.Section Point Loc. Transverse Loc. Layer Thickness (mm) Section layer location average Std. Dev.504 504-TL-W2 Wheel TL 62504 504-TL-W1 Wheel TL 70
504 TL W 66 5.8
504 504-BL-W2 Wheel BL 85504 504-BL-W1 Wheel BL 76
504 BL 80 6.2
505 9 WC TL 66505 12 WC TL 67505 6 WC TL 72
505 TL W1 68 3.0
505 9 WT TL 67505 12 WT TL 68505 6 WT TL 69
505 TL W2 68 0.9
505 12 WC OL 50505 6 WC OL 51505 9 WC OL 51
505 OL W1 51 0.5
505 12 WT OL 54505 9 WT OL 55505 6 WT OL 56
505 OL W2 55 0.8
505 9 WC BL 68505 6 WC BL 74505 12 WC BL 79
505 BL W1 74 5.2
505 9 WT BL 61505 12 WT BL 63505 6 WT BL 66
505 BL W2 64 2.4
505 12 WC ATPB 62505 6 WC ATPB 66505 9 WC ATPB 72
505 ATPB W1 66 5.2
505 6 WT ATPB 73505 9 WT ATPB 79505 12 WT ATPB 81
505 ATPB W2 77 4.2
506 10 LW TL 69506 3 LW TL 72506 6 LW TL 75
506 TL W1 72 2.9
506 10 RW TL 68506 3 RW TL 73506 6 RW TL 74
506 TL W2 72 3.2
506 10 LW OL 66506 6 LW OL 71506 3 LW OL 75
506 OL W1 70 4.9
506 10 RW OL 60506 6 RW OL 66506 3 RW OL 73
506 OL W2 66 6.5
506 3 LW BL 71506 6 LW BL 72506 10 LW BL 74
506 BL W1 72 1.2
506 6 RW BL 71506 3 RW BL 73506 10 RW BL 74
506 BL W2 72 1.3
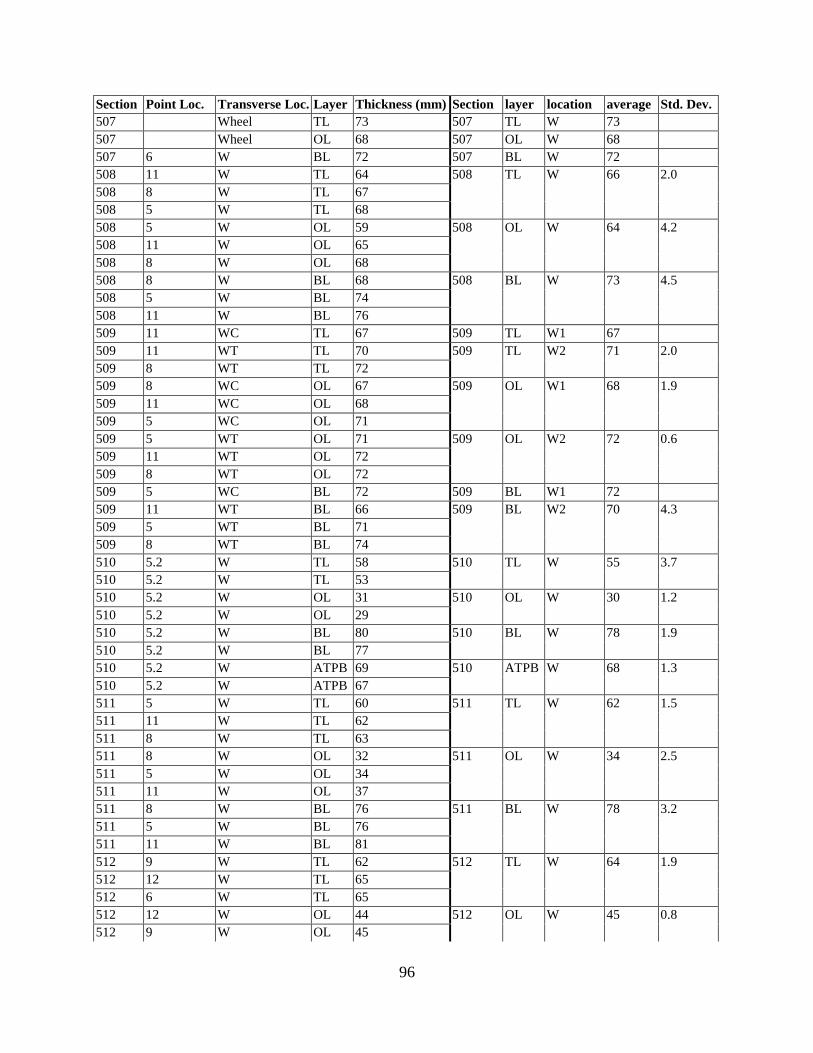
96
Section Point Loc. Transverse Loc. Layer Thickness (mm) Section layer location average Std. Dev.507 Wheel TL 73 507 TL W 73507 Wheel OL 68 507 OL W 68507 6 W BL 72 507 BL W 72508 11 W TL 64508 8 W TL 67508 5 W TL 68
508 TL W 66 2.0
508 5 W OL 59508 11 W OL 65508 8 W OL 68
508 OL W 64 4.2
508 8 W BL 68508 5 W BL 74508 11 W BL 76
508 BL W 73 4.5
509 11 WC TL 67 509 TL W1 67509 11 WT TL 70509 8 WT TL 72
509 TL W2 71 2.0
509 8 WC OL 67509 11 WC OL 68509 5 WC OL 71
509 OL W1 68 1.9
509 5 WT OL 71509 11 WT OL 72509 8 WT OL 72
509 OL W2 72 0.6
509 5 WC BL 72 509 BL W1 72509 11 WT BL 66509 5 WT BL 71509 8 WT BL 74
509 BL W2 70 4.3
510 5.2 W TL 58510 5.2 W TL 53
510 TL W 55 3.7
510 5.2 W OL 31510 5.2 W OL 29
510 OL W 30 1.2
510 5.2 W BL 80510 5.2 W BL 77
510 BL W 78 1.9
510 5.2 W ATPB 69510 5.2 W ATPB 67
510 ATPB W 68 1.3
511 5 W TL 60511 11 W TL 62511 8 W TL 63
511 TL W 62 1.5
511 8 W OL 32511 5 W OL 34511 11 W OL 37
511 OL W 34 2.5
511 8 W BL 76511 5 W BL 76511 11 W BL 81
511 BL W 78 3.2
512 9 W TL 62512 12 W TL 65512 6 W TL 65
512 TL W 64 1.9
512 12 W OL 44512 9 W OL 45
512 OL W 45 0.8
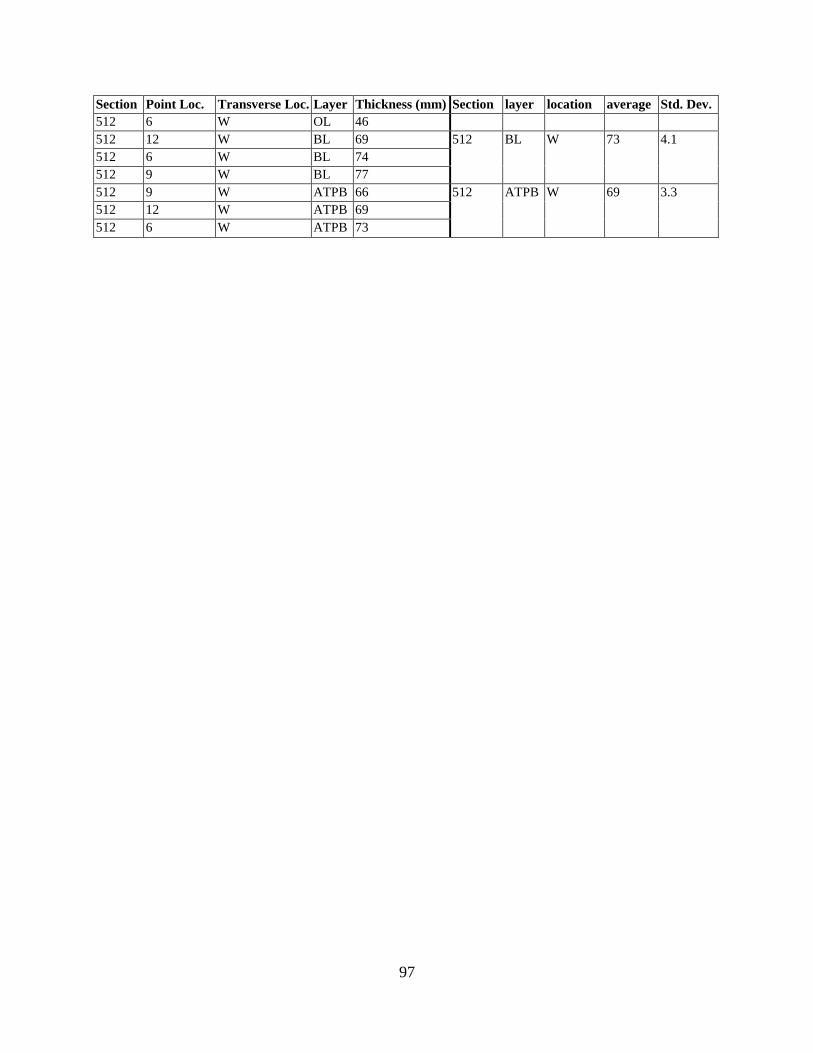
97
Section Point Loc. Transverse Loc. Layer Thickness (mm) Section layer location average Std. Dev.512 6 W OL 46512 12 W BL 69512 6 W BL 74512 9 W BL 77
512 BL W 73 4.1
512 9 W ATPB 66512 12 W ATPB 69512 6 W ATPB 73
512 ATPB W 69 3.3

98
Table B-3 Thickness of the Humps After Trafficking.Section Point Loc. Transverse Loc. Layer Thickness (mm) Section layer location average Std. Dev.504 504-TL-H1 Hump TL 77504 504-TL-H2 Hump TL 76
504 TL H 76 0.9
504 504-BL-H2 Hump BL 83504 504-BL-H1 Hump BL 81
504 BL H 82 1.2
505 9 Hump TL 72505 6 Hump TL 74505 12 Hump TL 75
505 TL H 74 1.7
505 9 MH TL 71505 6 MH TL 77
505 TL Hm 74 4.2
505 12 Hump OL 58505 9 Hump OL 60505 6 Hump OL 61
505 OL H 60 1.6
505 9 MH OL 59505 6 MH OL 61
505 OL Hm 60 1.6
505 9 Hump BL 71505 6 Hump BL 72505 12 Hump BL 76
505 BL H 73 2.7
505 9 MH BL 69505 6 MH BL 76
505 BL Hm 72 4.7
505 12 Hump ATPB 68505 9 Hump ATPB 72505 6 Hump ATPB 74
505 ATPB H 71 3.0
505 9 MH ATPB 64505 6 MH ATPB 76
505 ATPB Hm 70 8.7
506 10 Hump TL 74506 3 Hump TL 76
506 TL H 75 1.4
506 3 MH TL 73506 10 MH TL 74
506 TL Hm 74 0.4
506 10 Hump OL 76506 3 Hump OL 83
506 OL H 79 4.9
506 10 MH OL 79506 3 MH OL 85
506 OL Hm 82 4.6
506 3 Hump BL 74506 10 Hump BL 76
506 BL H 75 1.1
506 3 MH BL 72506 10 MH BL 77
506 BL Hm 74 3.0
507 507-TL-HW Hump TL 77507 507-TL-HE Hump TL 79
507 TL H 78 0.9
507 507-OL-HW Hump OL 78507 507-OL-HE Hump OL 79
507 OL H 78 0.1
507 507-BL-HE Hump BL 74507 507-BL-HW Hump BL 74
507 BL H 74 0.6
508 11 Hump TL 73508 5 Hump TL 74508 8 Hump TL 78
508 TL H 75 2.6
508 5 Hump OL 69 508 OL H 70 0.7

99
Section Point Loc. Transverse Loc. Layer Thickness (mm) Section layer location average Std. Dev.508 8 Hump OL 70508 11 Hump OL 70508 8 Hump BL 76508 5 Hump BL 77508 11 Hump BL 78
508 BL H 77 0.9
509 11 Hump TL 70509 8 Hump TL 70509 5 Hump TL 72
509 TL H 71 1.4
509 5 Hump OL 64509 8 Hump OL 72509 11 Hump OL 73
509 OL H 70 5.0
509 11 Hump BL 62509 5 Hump BL 70509 8 Hump BL 73
509 BL H 68 5.9
510 5 Hump TL 63510 11 Hump TL 63510 8 Hump TL 65
510 TL H 64 1.4
510 5.2 Hump-middle TL 64 510 TL Hm 64510 8 Hump OL 36510 5 Hump OL 36510 11 Hump OL 41
510 OL H 38 2.7
510 5.2 Hump-middle OL 37 510 OL Hm 37510 5 Hump BL 66510 11 Hump BL 79510 8 Hump BL 83
510 BL H 76 8.7
510 5.2 Hump-middle BL 79 510 BL Hm 79510 8 Hump ATPB 67510 11 Hump ATPB 71510 5 Hump ATPB 79
510 ATPB H 72 6.1
510 5.2 Hump-middle ATPB 62 510 ATPB Hm 62511 5 Hump TL 66511 11 Hump TL 69511 8 Hump TL 71
511 TL H 69 2.5
511 5 Hump OL 37511 8 Hump OL 39511 11 Hump OL 40
511 OL H 39 1.4
511 8 Hump BL 80511 5 Hump BL 82511 11 Hump BL 84
511 BL H 82 1.6
511 11 Hump ATPB 78511 5 Hump ATPB 79511 8 Hump ATPB 80
511 ATPB H 79 0.8
512 9 Hump TL 66512 6 Hump TL 70512 12 Hump TL 70
512 TL H 69 2.7
512 9 Hump OL 51512 12 Hump OL 51
512 OL H 52 2.1

100
Section Point Loc. Transverse Loc. Layer Thickness (mm) Section layer location average Std. Dev.512 6 Hump OL 55512 12 Hump BL 63512 9 Hump BL 68512 6 Hump BL 80
512 BL H 70 8.8
512 6 Hump ATPB 70512 9 Hump ATPB 74512 12 Hump ATPB 77
512 ATPB H 74 3.2
101
APPENDIX C: AIR-VOID CONTENT DATA
The following key applies to all tables in this Appendix.
Specimen Labeling:[Test Section]-[Point Location]-[Transverse Location]-[Bonding]Test Section - Test number (e.g. 503, 514)Point Location - Test Section Measuring Points (0 - 16, for most sections)Transverse Location - Type of Specimen (e.g. W, H, I, O)
W- In the Wheel Path; for dual tires further specification of Left (L) or Right (R) side, Caravan (C) orTraffic (T) side requiredH- In the Hump, caused by shear flow. If the specimen comes from between two dual tires, the specimen isa 100 mm coreI- Outside the hump within the heated area; also out of the wheel pathO- Outside the heated area. Not necessarily adjacent to the measuring point
Bonding - Either Bonded (B), Not Bonded (NB), or Broken Bond (BB). Broken Bond (BB) was bonded but brokenduring core removal
Specimen heights are measured at four locations for the different asphalt layers
After cores are cut down to 50 mm specimens for testing, the lifts are identified as followsO (or OL) - The Overlay, either DGAC or ARHMT (or TL) - The Top Lift of Goal 1 ConstructionB (or BL) - The Bottom Lift of Goal 1 Construction
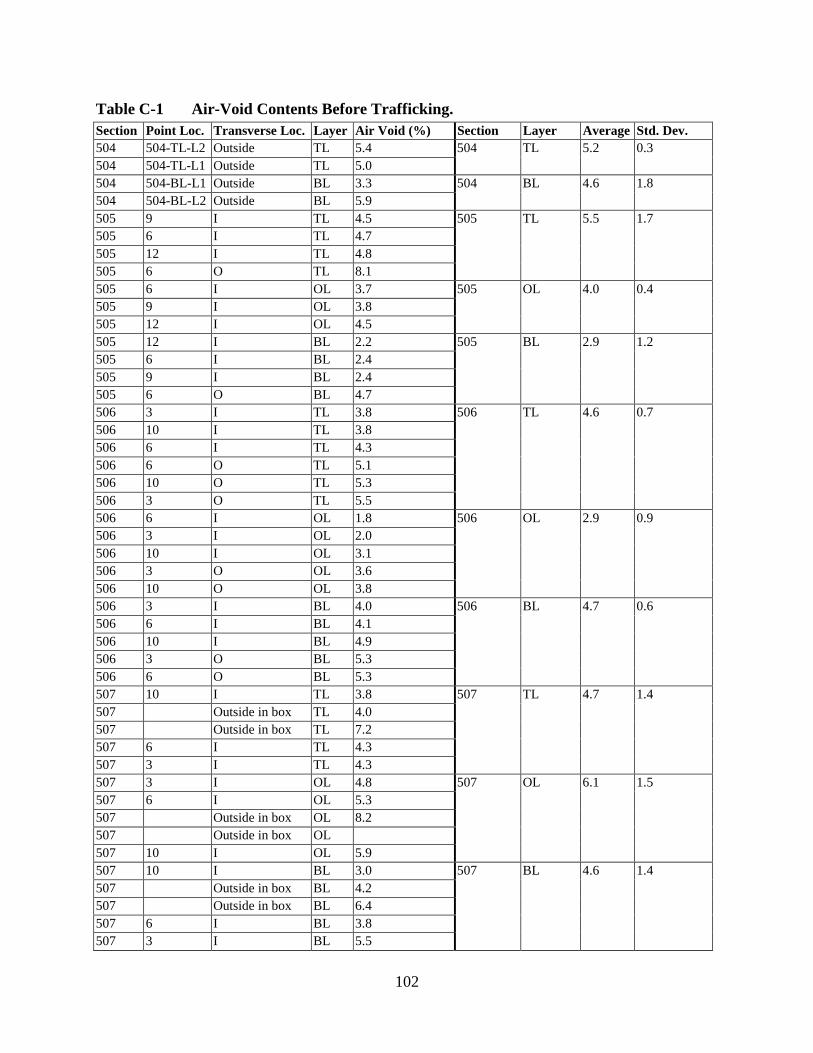
102
Table C-1 Air-Void Contents Before Trafficking.Section Point Loc. Transverse Loc. Layer Air Void (%) Section Layer Average Std. Dev.504 504-TL-L2 Outside TL 5.4504 504-TL-L1 Outside TL 5.0
504 TL 5.2 0.3
504 504-BL-L1 Outside BL 3.3504 504-BL-L2 Outside BL 5.9
504 BL 4.6 1.8
505 9 I TL 4.5505 6 I TL 4.7505 12 I TL 4.8505 6 O TL 8.1
505 TL 5.5 1.7
505 6 I OL 3.7505 9 I OL 3.8505 12 I OL 4.5
505 OL 4.0 0.4
505 12 I BL 2.2505 6 I BL 2.4505 9 I BL 2.4505 6 O BL 4.7
505 BL 2.9 1.2
506 3 I TL 3.8506 10 I TL 3.8506 6 I TL 4.3506 6 O TL 5.1506 10 O TL 5.3506 3 O TL 5.5
506 TL 4.6 0.7
506 6 I OL 1.8506 3 I OL 2.0506 10 I OL 3.1506 3 O OL 3.6506 10 O OL 3.8
506 OL 2.9 0.9
506 3 I BL 4.0506 6 I BL 4.1506 10 I BL 4.9506 3 O BL 5.3506 6 O BL 5.3
506 BL 4.7 0.6
507 10 I TL 3.8507 Outside in box TL 4.0507 Outside in box TL 7.2507 6 I TL 4.3507 3 I TL 4.3
507 TL 4.7 1.4
507 3 I OL 4.8507 6 I OL 5.3507 Outside in box OL 8.2507 Outside in box OL507 10 I OL 5.9
507 OL 6.1 1.5
507 10 I BL 3.0507 Outside in box BL 4.2507 Outside in box BL 6.4507 6 I BL 3.8507 3 I BL 5.5
507 BL 4.6 1.4
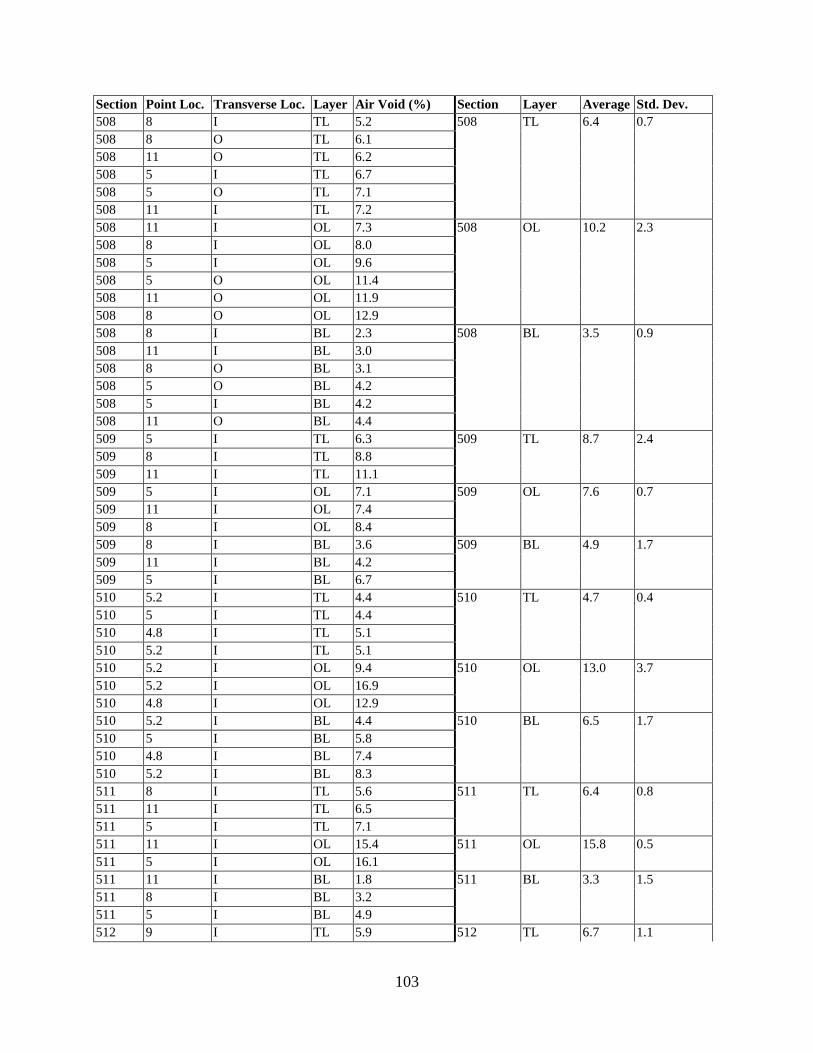
103
Section Point Loc. Transverse Loc. Layer Air Void (%) Section Layer Average Std. Dev.508 8 I TL 5.2508 8 O TL 6.1508 11 O TL 6.2508 5 I TL 6.7508 5 O TL 7.1508 11 I TL 7.2
508 TL 6.4 0.7
508 11 I OL 7.3508 8 I OL 8.0508 5 I OL 9.6508 5 O OL 11.4508 11 O OL 11.9508 8 O OL 12.9
508 OL 10.2 2.3
508 8 I BL 2.3508 11 I BL 3.0508 8 O BL 3.1508 5 O BL 4.2508 5 I BL 4.2508 11 O BL 4.4
508 BL 3.5 0.9
509 5 I TL 6.3509 8 I TL 8.8509 11 I TL 11.1
509 TL 8.7 2.4
509 5 I OL 7.1509 11 I OL 7.4509 8 I OL 8.4
509 OL 7.6 0.7
509 8 I BL 3.6509 11 I BL 4.2509 5 I BL 6.7
509 BL 4.9 1.7
510 5.2 I TL 4.4510 5 I TL 4.4510 4.8 I TL 5.1510 5.2 I TL 5.1
510 TL 4.7 0.4
510 5.2 I OL 9.4510 5.2 I OL 16.9510 4.8 I OL 12.9
510 OL 13.0 3.7
510 5.2 I BL 4.4510 5 I BL 5.8510 4.8 I BL 7.4510 5.2 I BL 8.3
510 BL 6.5 1.7
511 8 I TL 5.6511 11 I TL 6.5511 5 I TL 7.1
511 TL 6.4 0.8
511 11 I OL 15.4511 5 I OL 16.1
511 OL 15.8 0.5
511 11 I BL 1.8511 8 I BL 3.2511 5 I BL 4.9
511 BL 3.3 1.5
512 9 I TL 5.9 512 TL 6.7 1.1
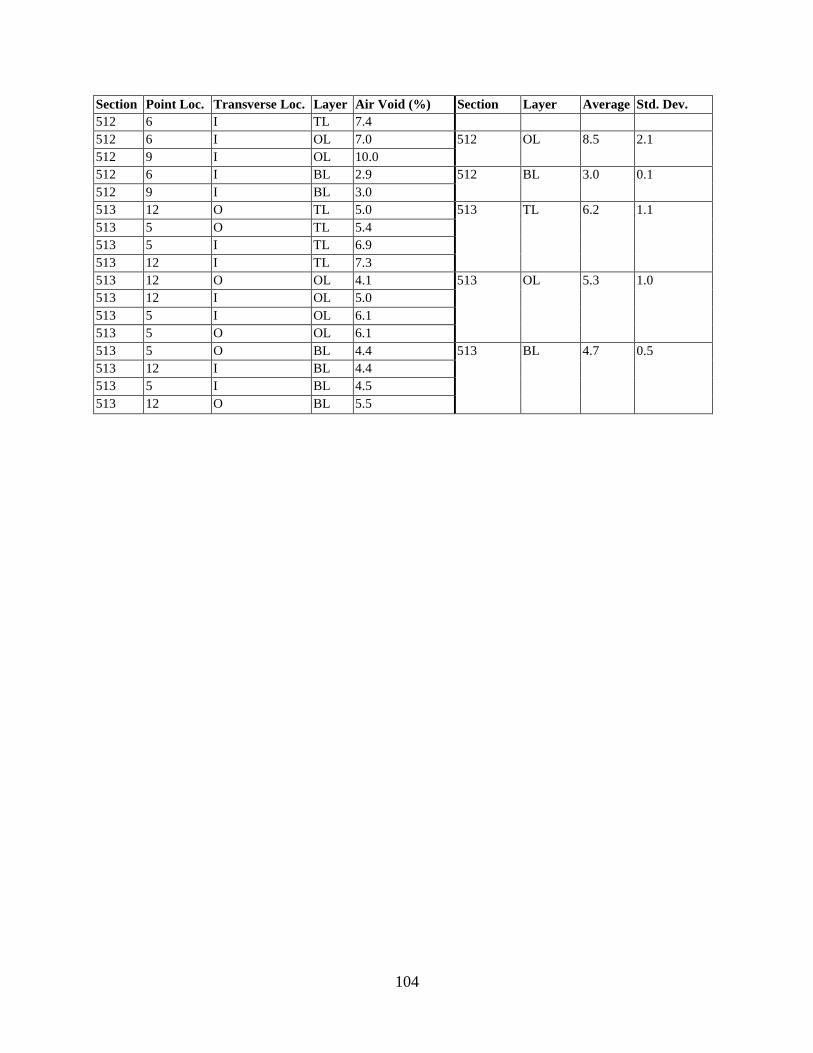
104
Section Point Loc. Transverse Loc. Layer Air Void (%) Section Layer Average Std. Dev.512 6 I TL 7.4512 6 I OL 7.0512 9 I OL 10.0
512 OL 8.5 2.1
512 6 I BL 2.9512 9 I BL 3.0
512 BL 3.0 0.1
513 12 O TL 5.0513 5 O TL 5.4513 5 I TL 6.9513 12 I TL 7.3
513 TL 6.2 1.1
513 12 O OL 4.1513 12 I OL 5.0513 5 I OL 6.1513 5 O OL 6.1
513 OL 5.3 1.0
513 5 O BL 4.4513 12 I BL 4.4513 5 I BL 4.5513 12 O BL 5.5
513 BL 4.7 0.5

105
Table C-2 Air-Void Contents in Wheelpaths After Trafficking.Section Point Loc. Transverse Loc. Layer Air Void (%) Section Layer Location Average Std. Dev.504 504-TL-W1 Wheel TL 5.0504 504-TL-W2 Wheel TL 4.1
504 TL W 4.5 0.7
504 504-BL-W1 Wheel BL 3.3504 504-BL-W2 Wheel BL 2.2
504 BL 2.7 0.7
505 9 WC TL 5.3505 6 WC TL 4.8505 12 WC TL 4.0
505 TL W1 4.7 0.7
505 9 WT TL 4.3505 12 WT TL 3.9505 6 WT TL 3.7
505 TL W2 4.0 0.3
505 9 WC OL 3.5505 6 WC OL 3.5505 12 WC OL 2.7
505 OL W1 3.2 0.5
505 9 WT OL 2.8505 12 WT OL 2.6505 6 WT OL 2.2
505 OL W2 2.5 0.3
505 9 WC BL 3.9505 12 WC BL 3.3505 6 WC BL 2.5
505 BL W1 3.2 0.7
505 12 WT BL 2.5505 6 WT BL 2.3505 9 WT BL 2.1
505 BL W2 2.3 0.2
506 3 LW TL 4.1506 6 LW TL 3.6506 10 LW TL 3.4
506 TL W1 3.7 0.3
506 10 RW TL 3.3506 6 RW TL 3.3506 3 RW TL 3.2
506 TL W2 3.3 0.1
506 3 LW OL 2.3506 10 LW OL 2.2506 6 LW OL 1.7
506 OL W1 2.1 0.3
506 3 RW OL 3.1506 6 RW OL 2.9506 10 RW OL 1.8
506 OL W2 2.6 0.7
506 10 LW BL 4.0506 6 LW BL 3.4506 3 LW BL 3.0
506 BL W1 3.5 0.5
506 10 RW BL 4.7506 6 RW BL 4.4506 3 RW BL 4.2
506 BL W2 4.4 0.2
507 3 W TL 3.5507 6 W TL 2.3507 10 W TL 2.3507 Wheel TL 3.3507 507-TL-W Wheel TL 3.335341
507 TL W 3.0 0.6
507 10 W OL 2.6507 3 W OL 2.3507 6 W OL 2.2507 Wheel OL 2.4507 507-OV-W Wheel OL 2.4
507 OL W 2.4 0.2
507 10 W BL 4.7 507 BL W 4.7 0.5

106
Section Point Loc. Transverse Loc. Layer Air Void (%) Section Layer Location Average Std. Dev.507 3 W BL 4.5507 6 W BL 4.1507 Wheel BL 5.2507 507-BL-W Wheel BL 5.15224508 11 W TL 7.6508 8 W TL 7.5508 5 W TL 5.1
508 TL W 6.7 1.4
508 5 W OL 6.7508 11 W OL 5.7508 8 W OL 5.5
508 OL W 5.9 0.6
508 5 W BL 3.0508 8 W BL 2.7508 11 W BL 1.9
508 BL W1 2.5 0.5
509 11 WC TL 5.3509 5 WC TL 4.8509 8 WC TL 4.8
509 TL W1 5.0 0.3
509 11 WT TL 7.7509 8 WT TL 5.1509 5 WT TL 5.1
509 TL W2 6.0 1.5
509 11 WC OL 7.4509 5 WC OL 7.4509 8 WC OL 6.9
509 OL W1 5.0 0.3
509 11 WT OL 6.9509 8 WT OL 6.6509 5 WT OL 6.5
509 OL W2 6.7 0.2
509 8 WC BL 4.8509 11 WC BL 4.4509 5 WC BL 2.3
509 BL W1 3.8 1.3
509 8 WT BL 4.3509 5 WT BL 3.8509 11 WT BL 2.4
509 BL W2 3.5 1.0
510 4.8 W TL 4.2510 5.2 W TL 3.8510 5.2 W TL 3.3510 4.8 W TL 3.2
510 TL W 3.6 0.4
510 5.2 W OL 7.8510 5.2 W OL 6.9
510 OL W 7.4 0.6
510 4.8 W BL 3.9510 4.8 W BL 2.6510 5.2 W BL 2.2510 5.2 W BL 2.0
510 BL W 2.7 0.8
510 5.2 W ATPB 26.4510 5.2 W ATPB 24.1
510 ATPB W 25.2 1.7
511 11 W TL 3.2511 5 W TL 3.1511 8 W TL 2.8
511 TL W 3.0 0.2
511 8 W OL 10.7511 11 W OL 10.2
511 OL W 10.5 0.4
511 8 W BL 3.9511 5 W BL 3.8511 11 W BL 2.3
511 BL W 3.3 0.9
512 6 W TL 5.3 512 TL W 5.6 0.3
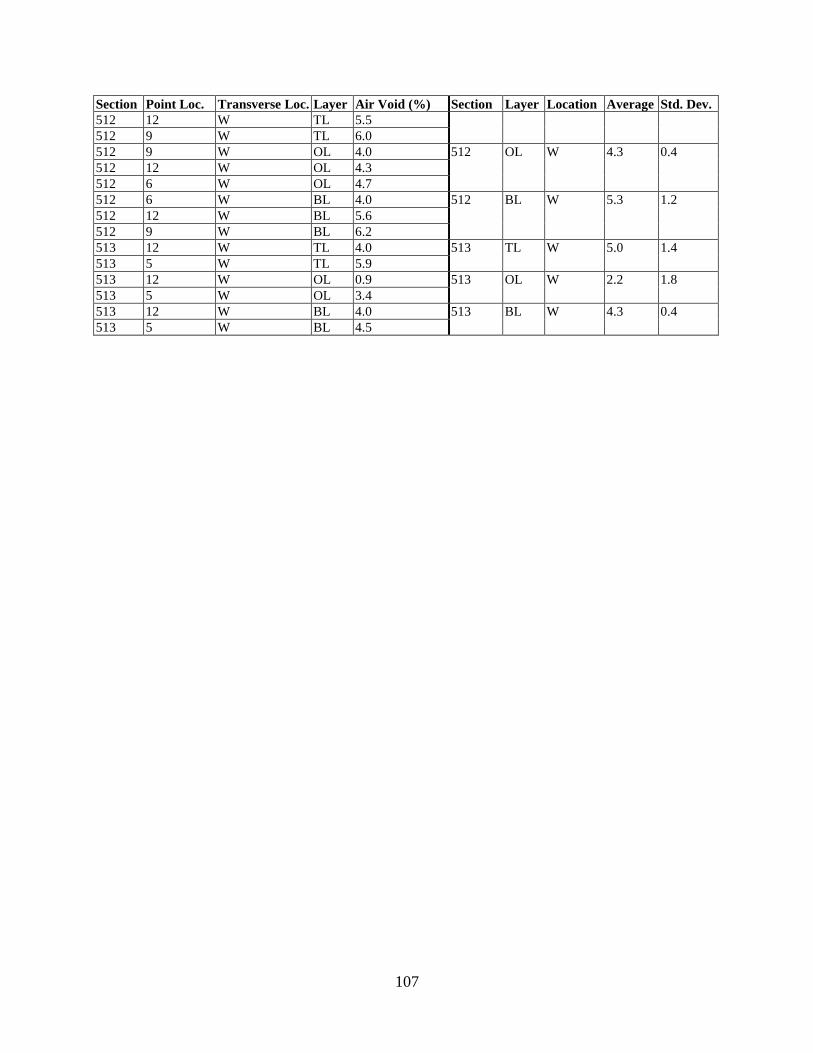
107
Section Point Loc. Transverse Loc. Layer Air Void (%) Section Layer Location Average Std. Dev.512 12 W TL 5.5512 9 W TL 6.0512 9 W OL 4.0512 12 W OL 4.3512 6 W OL 4.7
512 OL W 4.3 0.4
512 6 W BL 4.0512 12 W BL 5.6512 9 W BL 6.2
512 BL W 5.3 1.2
513 12 W TL 4.0513 5 W TL 5.9
513 TL W 5.0 1.4
513 12 W OL 0.9513 5 W OL 3.4
513 OL W 2.2 1.8
513 12 W BL 4.0513 5 W BL 4.5
513 BL W 4.3 0.4

108
Table C-3 Air-Void Contents in Humps after Trafficking.Section Point Loc. Transverse Loc. Layer Air Void (%) Section Layer Location Average Std. Dev.504 504-TL-H2 Hump TL 6.595215504 504-TL-H1 Hump TL 5.411217
504 TL H 6.0 0.8
504 504-BL-H1 Hump BL 3.374314504 504-BL-H2 Hump BL 1.761895
504 BL H 2.6 1.1
505 6 Hump TL 4.7956505 12 Hump TL 4.697859505 9 Hump TL 4.151217
505 TL H 4.5 0.3
505 12 Hump OL 5.412369505 6 Hump OL 4.929212505 9 Hump OL 4.536608
505 OL H 5.0 0.4
505 9 Hump BL 2.035635505 12 Hump BL 2.005376505 6 Hump BL 1.964992
505 BL H 2.0 0.0
506 10 Hump TL 4.005226506 3 Hump TL 3.504346
506 TL H 3.5 0.3
506 10 MH TL 3.3506 6 MH TL 3.2506 6 Hump TL 3.316946
506 TL Hm 3.2 0.0
506 10 Hump OL 3.545935506 6 Hump OL 3.335505506 3 Hump OL 2.778296
506 OL H 3.2 0.4
506 10 MH OL 5.2506 3 MH OL 4.2506 6 MH OL 3.8
506 OL Hm 4.4 0.7
506 10 Hump BL 4.380079506 6 Hump BL 4.227752506 3 Hump BL 3.323451
506 BL H 4.0 0.6
506 6 MH BL 4.1506 10 MH BL 4.0
506 BL Hm 4.0 0.0
507 Hump TL 4.985507 Hump TL 4.889507 3 Hump TL 4.388507 10 Hump TL 4.081507 6 Hump TL 3.810
507 TL H 4.4 2.5
507 10 Hump OL 6.515761507 3 Hump OL 6.195682507 Hump OL 5.508499507 Hump OL 5.399265507 6 Hump OL 5.318382
507 OL H 5.8 0.5
507 3 Hump BL 6.145356507 10 Hump BL 5.884026507 Hump BL 5.643258507 6 Hump BL 5.55096507 Hump BL 5.407404
507 BL H 5.7 0.3
508 11 Hump TL 7.781578508 5 Hump TL 6.302929
508 TL H 6.5 1.2

109
Section Point Loc. Transverse Loc. Layer Air Void (%) Section Layer Location Average Std. Dev.508 8 Hump TL 5.373724508 11 Hump OL 8.53632508 8 Hump OL 7.796665508 5 Hump OL 7.648231
508 OL H 8.0 0.5
508 5 Hump BL 3.741143508 8 Hump BL 2.971602508 11 Hump BL 2.764736
508 BL H 3.2 0.5
509 11 Hump TL 10.45499509 8 Hump TL 7.016738509 5 Hump TL 6.850026
509 TL H 8.1 2.0
509 8 Hump OL 8.092719509 5 Hump OL 7.441045
509 OL H 7.8 0.5
509 5 Hump BL 6.474399509 11 Hump BL 3.84963509 8 Hump BL 3.756175
509 BL H 4.7 1.5
510 5.2 H TL 6.61476510 5.2 H TL 3.295898510 5 Hump TL 6.640371510 8 Hump TL 6.033182
510 TL H 5.6 1.6
510 5.2 Hump-middle TL 4.152405 510 TL Hm 4.2510 5.2 H OL 11.71392510 5.2 H OL 8.466188510 5 Hump OL 9.746918510 8 Hump OL 8.389841
510 OL H 9.6 1.6
510 5.2 Hump-middle OL 9.300275 510 OL Hm 9.3510 5.2 H BL 6.141637510 5.2 H BL 2.790537510 5 Hump BL 3.888655
510 BL H 4.3 1.7
510 5.2 Hump-middle BL 2.441123 510 BL Hm 2.4510 5.2 H ATPB 27.43923510 5.2 H ATPB 26.99787
510 ATPB H 27.2 0.3
510 5.2 Hump-middle ATPB 14.54426 510 ATPB Hm 14.5511 11 Hump TL 6.451608511 8 Hump TL 6.062247511 5 Hump TL 3.738789
511 TL H 5.4 1.5
511 11 Hump OL 14.0263511 8 Hump OL 13.70538511 5 Hump OL 13.47509
511 OL H 13.7 0.3
511 5 Hump BL 4.420391511 8 Hump BL 2.917772511 11 Hump BL 1.857105
511 BL H 3.1 1.3
512 9 Hump TL 7.119397512 12 Hump TL 8.710821512 6 Hump TL 10.3202
512 TL H 8.7 1.6
512 9 Hump OL 7.445052512 6 Hump OL 9.027715
512 OL H 8.2 1.1
512 6 Hump BL 2.92595 512 BL H 4.4 2.5

110
Section Point Loc. Transverse Loc. Layer Air Void (%) Section Layer Location Average Std. Dev.512 9 Hump BL 3.057596512 12 Hump BL 7.331451

111
APPENDIX D: DEFLECTIONS AND BACK-CALCULATED MODULI
Table D-1 Deflection data on rutting test sections (3/1/1997).Section Line Chainage (ft.) D1 D7 Experiment type504 RF A 60 87 21504 RF A 70 76 20504 RF A 80 82 21508 RF A 90 92 21508 RF A 100 89 21 ARHM-GG 62 mm508 RF A 110 83 20511 RF A 130 73.5 18.5511 RF A 140 68.5 19 ARHM-GG 38 mm511 RF A 150 65 17.5507 RF B 75 87 20507 RF B 85 89.5 21 DGAC507 RF B 95 97.5 20509 RF B 85 82 20509 RF B 95 92 18 ARHM-GG 62 mm509 RF B 105 86 17513 RF D 95 97.5 20513 RF D 105 97 19 DGAC513 RF D 115 137 20.5510 RF B 135 76 19510 RF B 145 68 19 ARHM-GG 38 mm510 RF B 155 65 17512 RF D 135 81 18.5512 RF D 145 73.5 19.5 DGAC512 RF D 155 73 17506 RF E 75 85 22506 RF E 85 90.5 23 DGAC506 RF E 95 96.5 23505 RF D 135 86 18505 RF D 145 79 20 DGAC505 RF D 155 81 17

112
Table D-2 Deflection data on rutting test section after construction (4/1/1997).Section Line Chainage D1 D7 Experiment type504 RF A 60 75 20504 RF A 70 72 21504 RF A 80 77 20508 RF A 90 84 21508 RF A 100 82 20 ARHM 62mm508 RF A 110 72 20511 RF A 130 70 20511 RF A 140 63 17.5 ARHM 38mm511 RF A 150 64 17.5507 RF B 75 75 20507 RF B 85 76 20 DGAC507 RF B 95 82 20509 RF B 85 76 20509 RF B 95 82 20 ARHM 62mm509 RF B 105 78 20513 RF D 95 82 20513 RF D 105 78 20 DGAC513 RF D 115 75 19512 RF D 135 72 20512 RF D 145 65 18 DGAC512 RF D 155 64 18510 RF B 135 72 20510 RF B 145 65 18 ARHM 38mm510 RF B 155 64 18
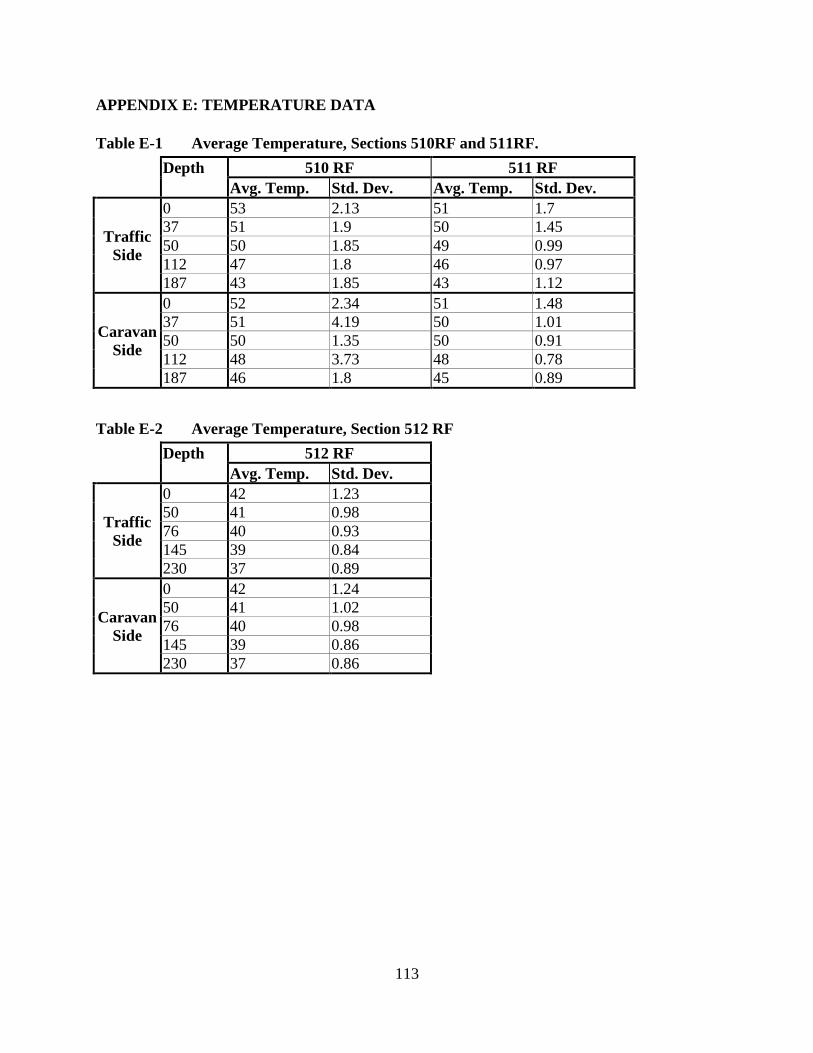
113
APPENDIX E: TEMPERATURE DATA
Table E-1 Average Temperature, Sections 510RF and 511RF.510 RF 511 RFDepth
Avg. Temp. Std. Dev. Avg. Temp. Std. Dev.0 53 2.13 51 1.737 51 1.9 50 1.4550 50 1.85 49 0.99112 47 1.8 46 0.97
TrafficSide
187 43 1.85 43 1.120 52 2.34 51 1.4837 51 4.19 50 1.0150 50 1.35 50 0.91112 48 3.73 48 0.78
CaravanSide
187 46 1.8 45 0.89
Table E-2 Average Temperature, Section 512 RF512 RFDepth
Avg. Temp. Std. Dev.0 42 1.2350 41 0.9876 40 0.93145 39 0.84
TrafficSide
230 37 0.890 42 1.2450 41 1.0276 40 0.98145 39 0.86
CaravanSide
230 37 0.86

114

115
APPENDIX F: AVERAGE TRANSVERSE SURFACE PROFILES VERSUS LOADREPETITIONS
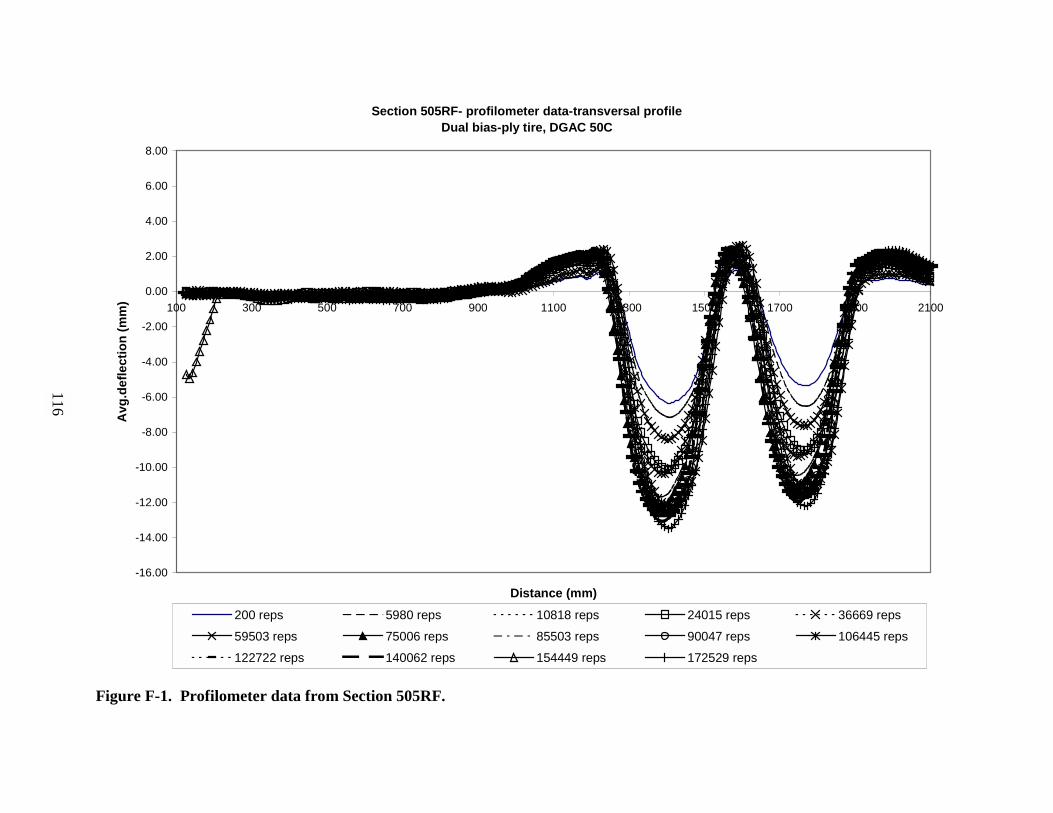
Section 505
-16.00
-14.00
-12.00
-10.00
-8.00
-6.00
-4.00
-2.00
0.00
2.00
4.00
6.00
8.00
100 300 500 700
Avg
.def
lect
ion
(mm
)
200 reps 5980 rep59503 reps 75006 re122722 reps 140062 r
Figure F-1. Profilometer data from Section 505RF
116
RF- profilometer data-transversal profileDual bias-ply tire, DGAC 50C
900 1100 1300 1500 1700 1900 2100
Distance (mm)s 10818 reps 24015 reps 36669 repsps 85503 reps 90047 reps 106445 repseps 154449 reps 172529 reps
.
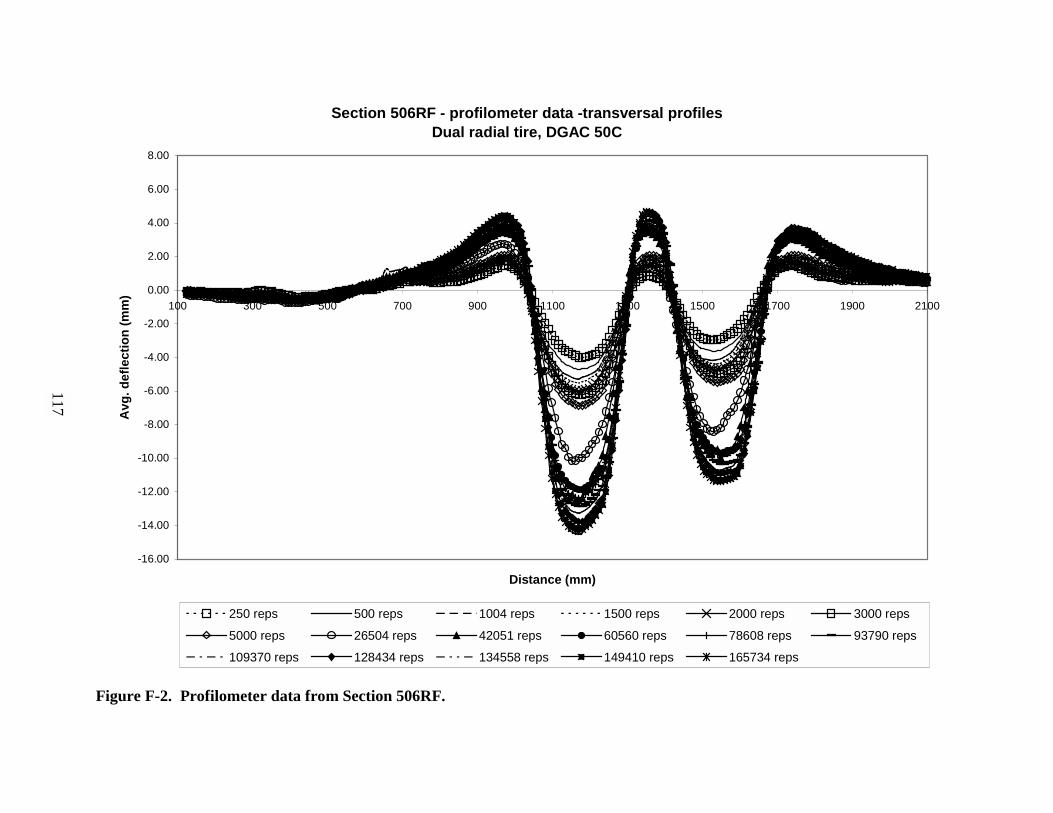
Section 506RF
-16.00
-14.00
-12.00
-10.00
-8.00
-6.00
-4.00
-2.00
0.00
2.00
4.00
6.00
8.00
100 300 500 700
Avg
. def
lect
ion
(mm
)
250 reps 500 reps
5000 reps 26504 reps
109370 reps 128434 reps
Figure F-2. Profilometer data from Section 506R
117
- profilometer data -transversal profilesDual radial tire, DGAC 50C
900 1100 1300 1500 1700 1900 2100
Distance (mm)
1004 reps 1500 reps 2000 reps 3000 reps
42051 reps 60560 reps 78608 reps 93790 reps
134558 reps 149410 reps 165734 reps
F.

Section 507RFWid
-18.00
-16.00
-14.00
-12.00
-10.00
-8.00
-6.00
-4.00
-2.00
0.00
2.00
4.00
6.00
8.00
100 300 500 700
Avg
. def
lect
ion
(mm
) 100 reps250 reps500 reps1002 reps1499 reps2001 reps5002 reps10000 reps23223 reps41784 reps53183 reps67698 reps82540 reps96761 reps113176 reps
Figure F-3. Profilometer data from Section 507R
118
- profilometer data-transversal profilese-base single tire, DGAC 50C
900 1100 1300 1500 1700 1900 2100
Distance (mm)
F.

Section 508RFWide
-16.00
-14.00
-12.00
-10.00
-8.00
-6.00
-4.00
-2.00
0.00
2.00
4.00
6.00
8.00
100 300 500 700
Avg
. def
lect
ion
(mm
)
50 reps 100 reps1500 reps 2000 reps60497 reps 76063 reps
Figure F-4. Profilometer data from Section 508R
119
- profilometer data - transversal profiles-base single tire, ARHM 62mm
900 1100 1300 1500 1700 1900 2100
Distance (mm)
150 reps 250 reps 500 reps 1000 reps5010 reps 10000 reps 20419 reps 43367 reps92997 reps 123426 reps
F.
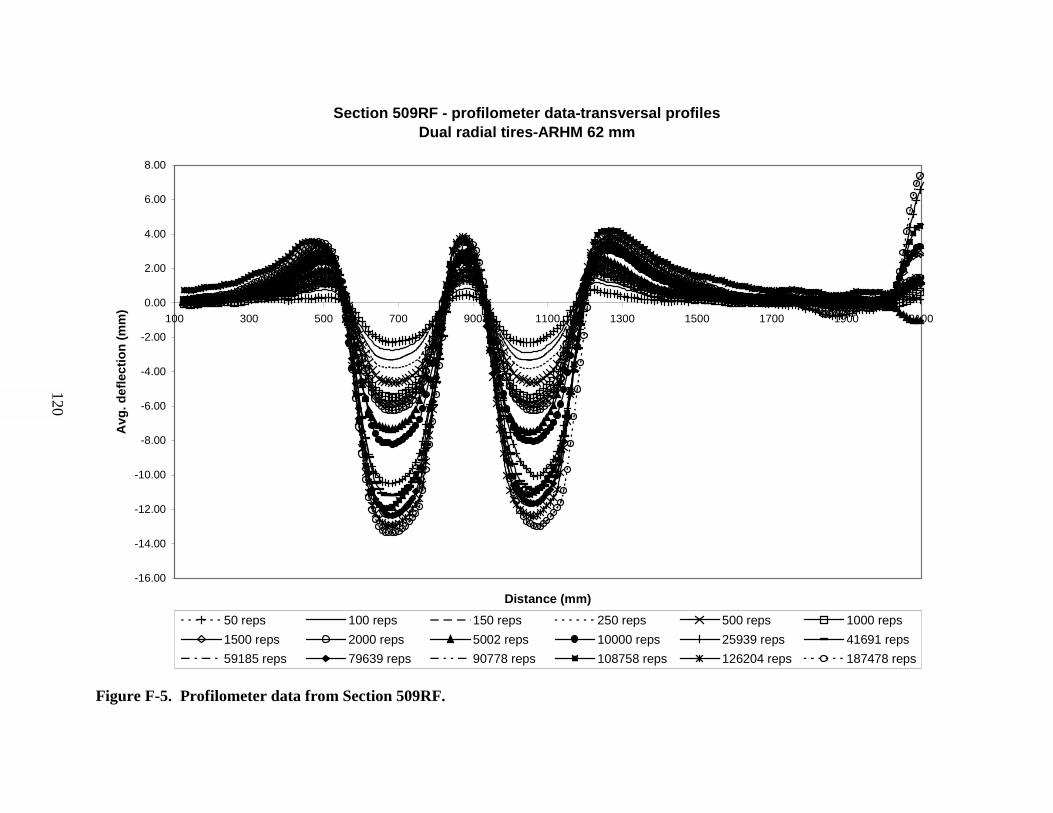
Section 509RFDu
-16.00
-14.00
-12.00
-10.00
-8.00
-6.00
-4.00
-2.00
0.00
2.00
4.00
6.00
8.00
100 300 500 700
Avg
. def
lect
ion
(mm
)
50 reps 100 reps1500 reps 2000 reps59185 reps 79639 reps
Figure F-5. Profilometer data from Section 509R
120
- profilometer data-transversal profilesal radial tires-ARHM 62 mm
900 1100 1300 1500 1700 1900 2100
Distance (mm)150 reps 250 reps 500 reps 1000 reps5002 reps 10000 reps 25939 reps 41691 reps90778 reps 108758 reps 126204 reps 187478 reps
F.

Section 510RFDu
-16.00
-14.00
-12.00
-10.00
-8.00
-6.00
-4.00
-2.00
0.00
2.00
4.00
6.00
8.00
100 300 500 700
Avg
. def
lect
ion
(mm
)
50 reps 250 reps1500 reps 2000 rep10028 reps 15000 re102988 reps 137557
Figure F-6. Profilometer data from Section 510R
121
- profilometer data - transversal profilesal radial tires - ARHM 38 mm
900 1100 1300 1500 1700 1900 2100
Distance (mm)500 reps 750 reps 1000 reps
s 3500 reps 5000 reps 7500 repsps 20000 reps 30000 reps 65873 reps
reps 169205 reps 186308 reps
F.
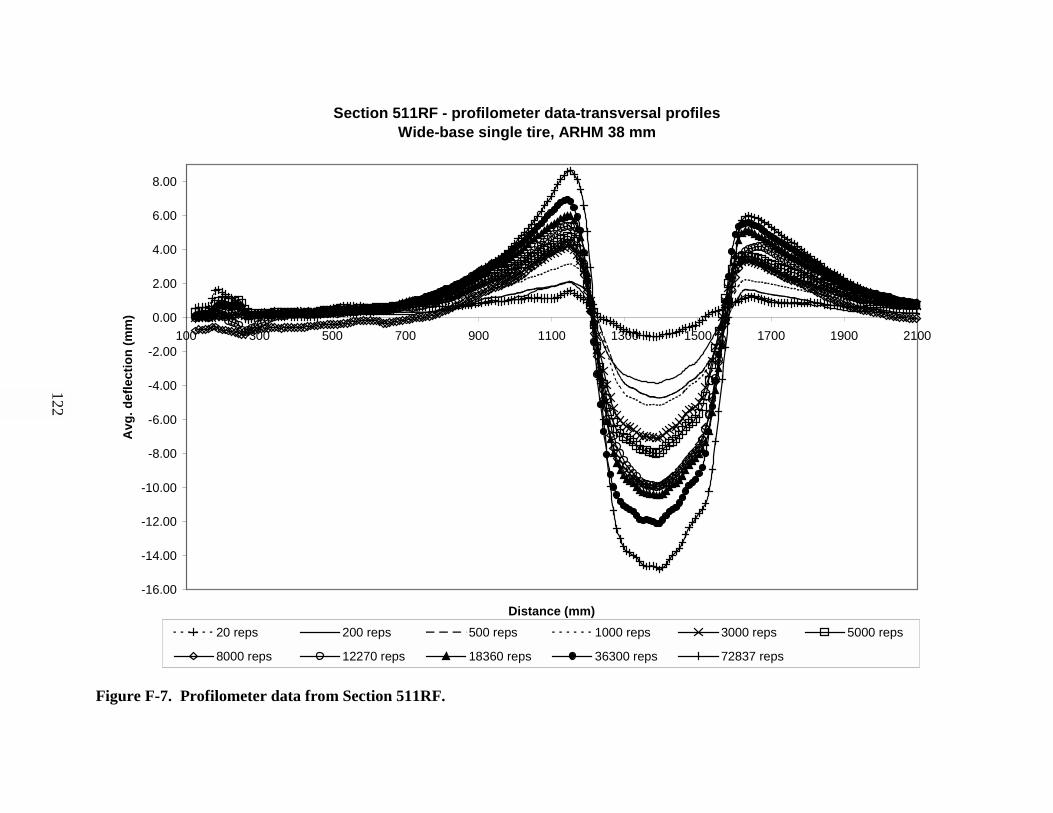
Section 511RFWide
-16.00
-14.00
-12.00
-10.00
-8.00
-6.00
-4.00
-2.00
0.00
2.00
4.00
6.00
8.00
100 300 500 700
Avg
. def
lect
ion
(mm
)
20 reps 200 reps
8000 reps 12270 reps
Figure F-7. Profilometer data from Section 511R
122
- profilometer data-transversal profiles-base single tire, ARHM 38 mm
900 1100 1300 1500 1700 1900 2100
Distance (mm)500 reps 1000 reps 3000 reps 5000 reps
18360 reps 36300 reps 72837 reps
F.

Section 512RFWid
-16.00
-14.00
-12.00
-10.00
-8.00
-6.00
-4.00
-2.00
0.00
2.00
4.00
6.00
8.00
100 300 500 700
Avg
. def
lect
ion
(mm
)
20 reps 200 reps8000 reps 12000 reps90191 reps 134924 reps
Figure F-8. Profilometer data from Section 512R
123
- profilometer data - transversal profilese-base single tire, DGAC, 40C
900 1100 1300 1500 1700 1900 2100
Distance (mm)500 reps 1000 reps 2000 reps 4000 reps20000 reps 30000 reps 40000 reps 50000 reps178446 reps 215300 reps 281765 reps 341976 reps
F.
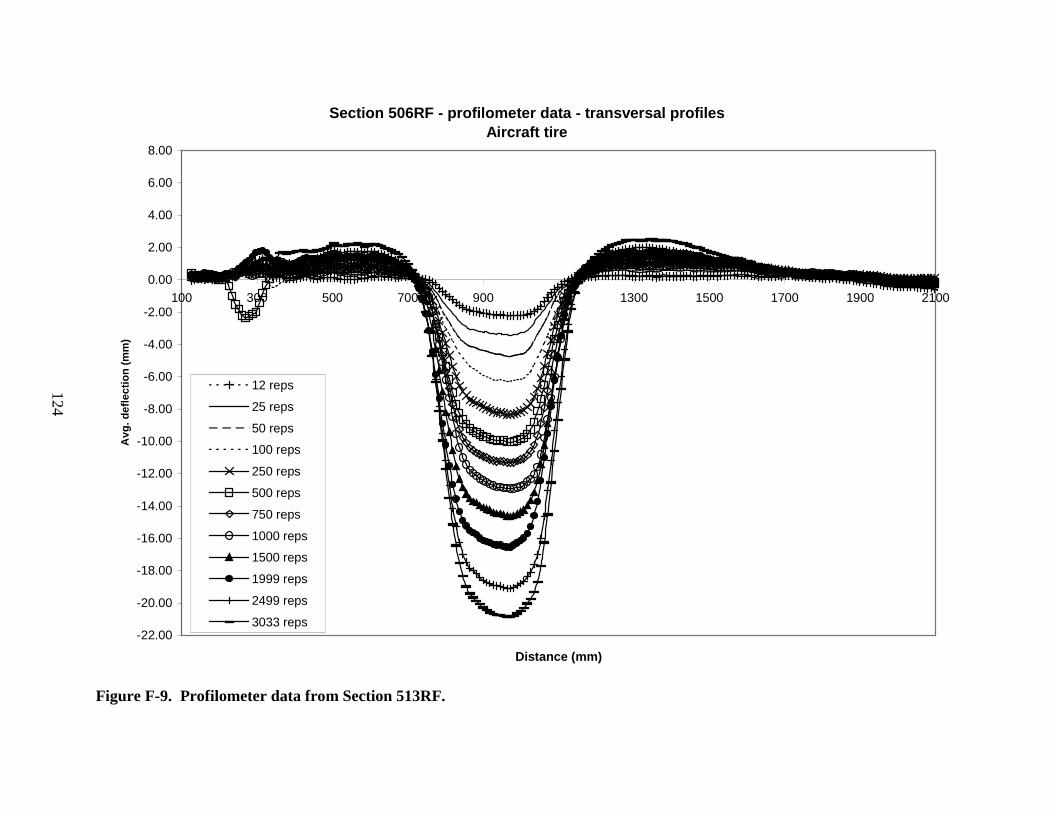
Section 506RF
-22.00
-20.00
-18.00
-16.00
-14.00
-12.00
-10.00
-8.00
-6.00
-4.00
-2.00
0.00
2.00
4.00
6.00
8.00
100 300 500 700
Avg
. def
lect
ion
(mm
)
12 reps
25 reps
50 reps100 reps
250 reps
500 reps
750 reps
1000 reps1500 reps
1999 reps
2499 reps
3033 reps
Figure F-9. Profilometer data from Section 513R
124
- profilometer data - transversal profilesAircraft tire
900 1100 1300 1500 1700 1900 2100
Distance (mm)
F.

125
APPENDIX G TRANSVERSE PROFILES FROM AC SLABS FROM TRENCHES

0
50
100
150
200
250
300
-1000 -800 -600 -400
Thic
knes
s af
ter T
raffi
ckin
g (m
m))
Bottom lift Goal 1 ACTop lift Goal 1 AC
Figure G-1. Transverse profile of trenched AC sl
126
-200 0 200 400 600 800 1000
Cross-section distance (mm)
ab from Section 504RF.
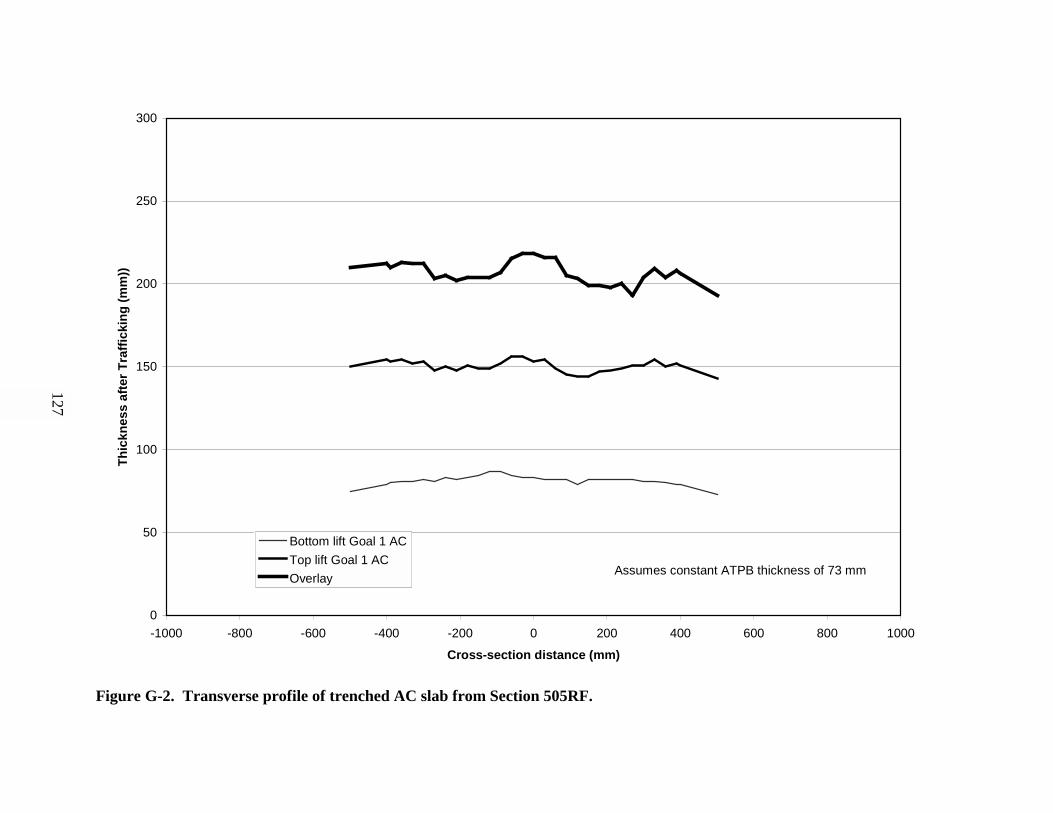
0
50
100
150
200
250
300
-1000 -800 -600 -400
Thic
knes
s af
ter T
raffi
ckin
g (m
m))
Bottom lift Goal 1 ACTop lift Goal 1 ACOverlay
Figure G-2. Transverse profile of trenched AC sl
127
-200 0 200 400 600 800 1000
Cross-section distance (mm)
Assumes constant ATPB thickness of 73 mm
ab from Section 505RF.

0
50
100
150
200
250
300
-1000 -800 -600 -400
Thic
knes
s af
ter T
raffi
ckin
g (m
m)
Bottom lift Goal 1 ACTop lift Goal 1 ACOverlay
Figure G-3. Transverse profile of trenched AC sl
128
-200 0 200 400 600 800 1000
Cross-section point (mm)
ab from Section 506RF.

0
50
100
150
200
250
300
-1000 -800 -600 -400
Thic
knes
s af
ter T
raffi
ckin
g (m
m)
Bottom lift Goal 1 ACTop lift Goal 1 ACOverlay
Figure G-4. Transverse profile of trenched AC sl
129
-200 0 200 400 600 800 1000
Cross-section point (mm)
ab from Section 507RF.
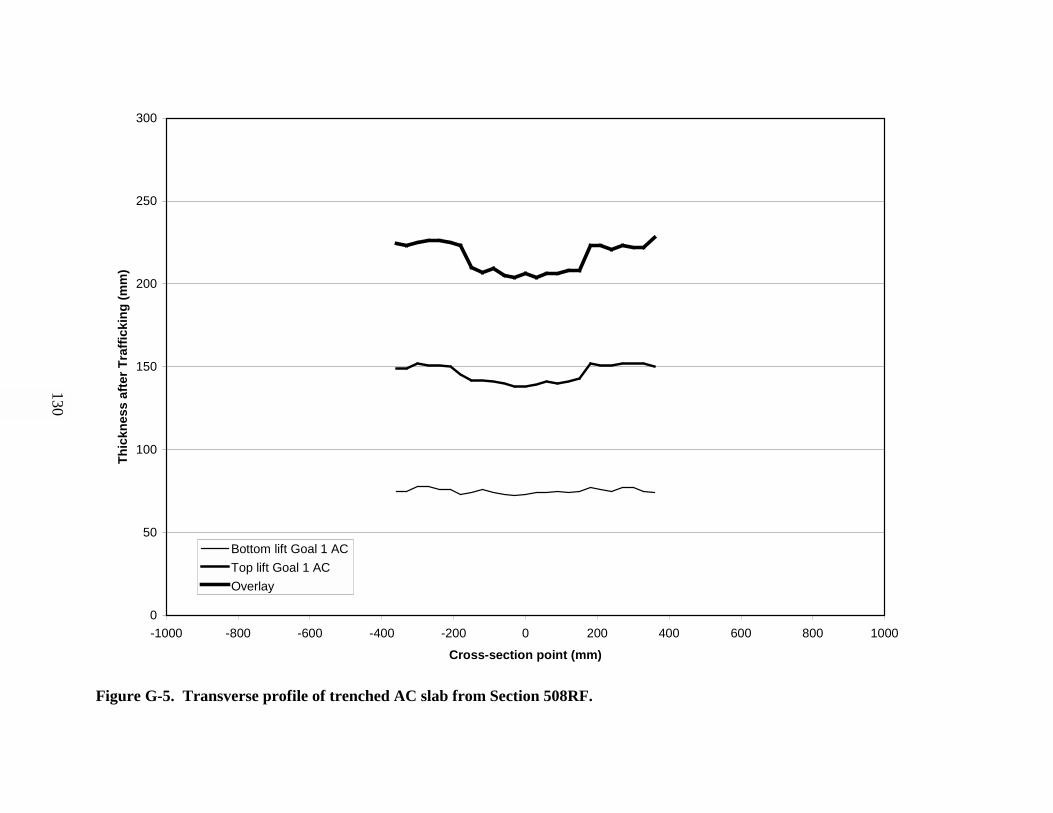
0
50
100
150
200
250
300
-1000 -800 -600 -400
Thic
knes
s af
ter T
raffi
ckin
g (m
m)
Bottom lift Goal 1 ACTop lift Goal 1 ACOverlay
Figure G-5. Transverse profile of trenched AC sl
130
-200 0 200 400 600 800 1000
Cross-section point (mm)
ab from Section 508RF.
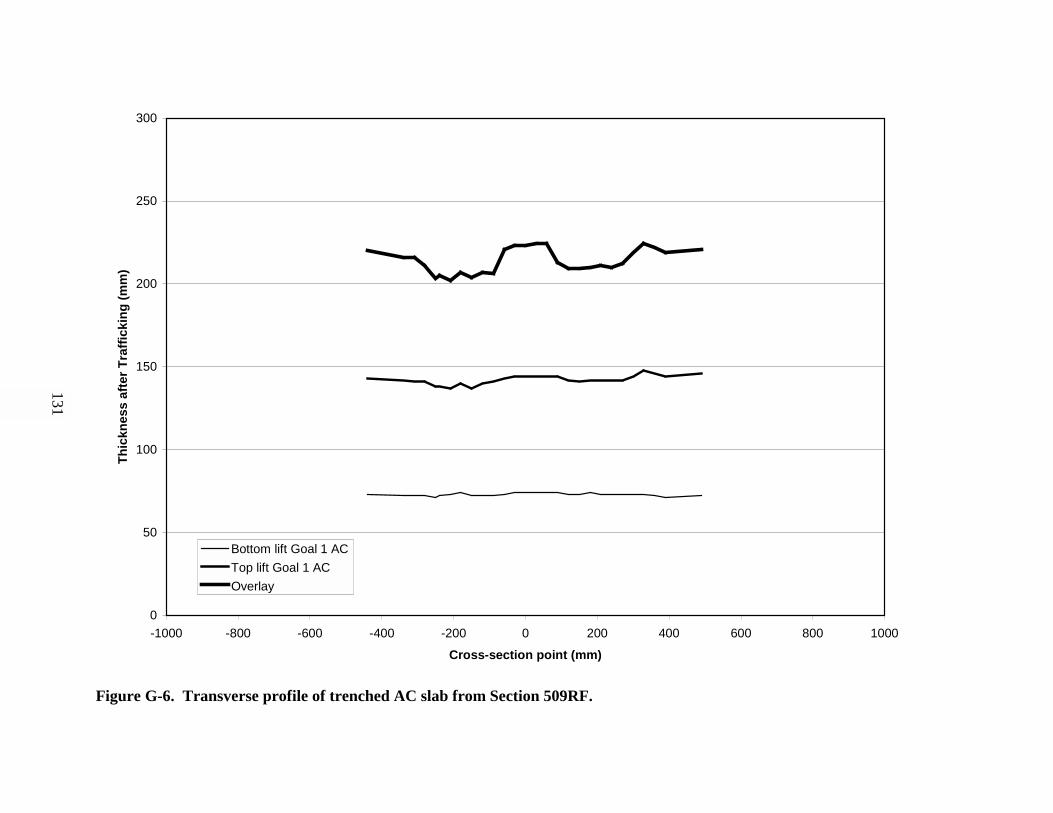
0
50
100
150
200
250
300
-1000 -800 -600 -400
Thic
knes
s af
ter T
raffi
ckin
g (m
m)
Bottom lift Goal 1 ACTop lift Goal 1 ACOverlay
Figure G-6. Transverse profile of trenched AC sl
131
-200 0 200 400 600 800 1000
Cross-section point (mm)
ab from Section 509RF.
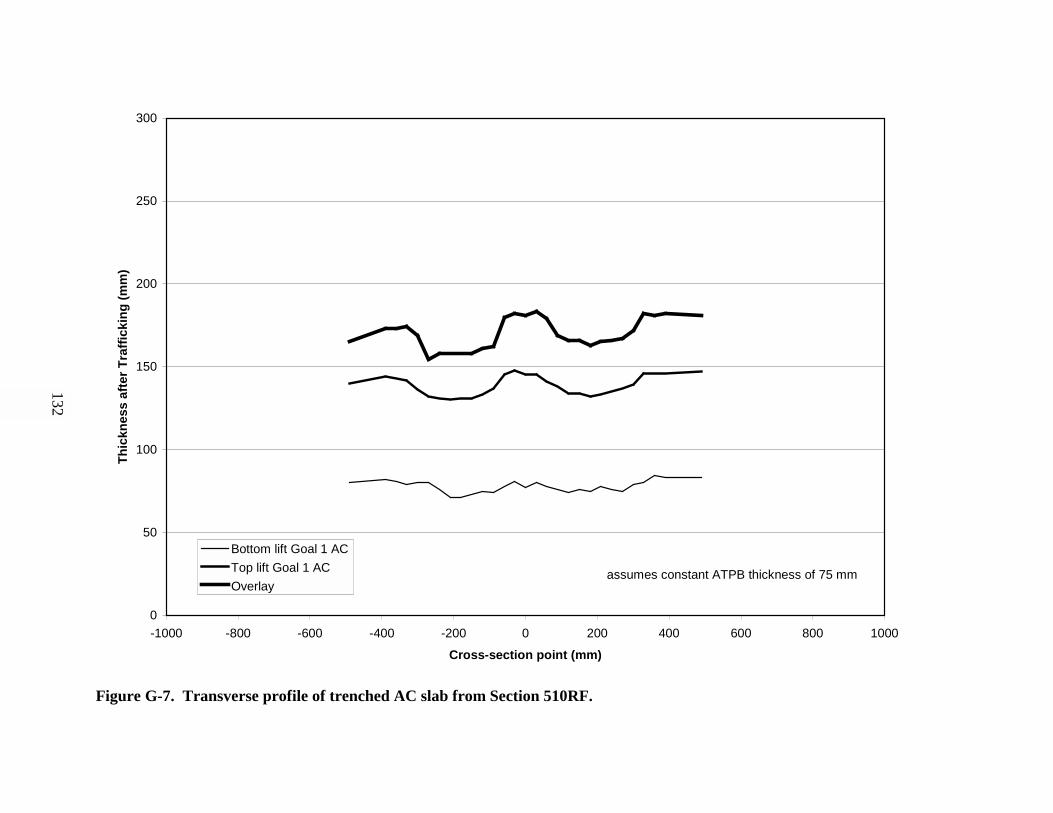
0
50
100
150
200
250
300
-1000 -800 -600 -400
Thic
knes
s af
ter T
raffi
ckin
g (m
m)
Bottom lift Goal 1 ACTop lift Goal 1 ACOverlay
Figure G-7. Transverse profile of trenched AC sl
132
-200 0 200 400 600 800 1000
Cross-section point (mm)
assumes constant ATPB thickness of 75 mm
ab from Section 510RF.
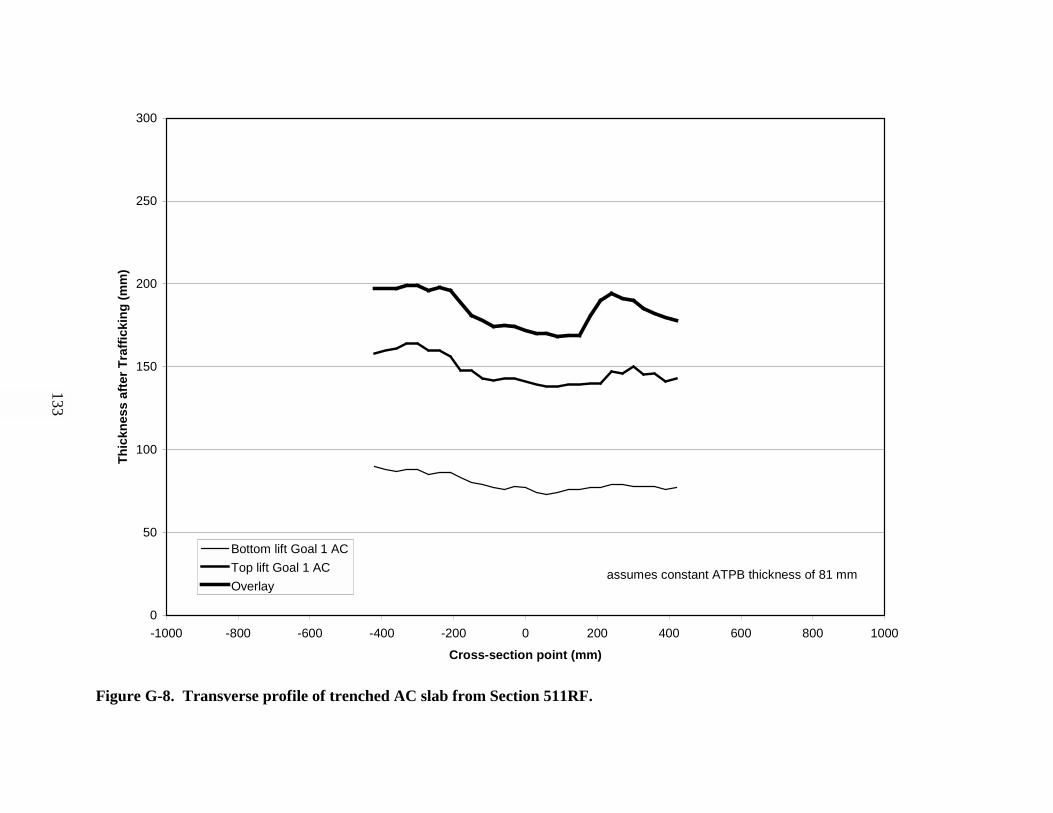
0
50
100
150
200
250
300
-1000 -800 -600 -400
Thic
knes
s af
ter T
raffi
ckin
g (m
m)
Bottom lift Goal 1 ACTop lift Goal 1 ACOverlay
Figure G-8. Transverse profile of trenched AC sl
133
-200 0 200 400 600 800 1000
Cross-section point (mm)
assumes constant ATPB thickness of 81 mm
ab from Section 511RF.

0
50
100
150
200
250
300
-1000 -800 -600 -400
Thic
knes
s af
ter T
raffi
ckin
g (m
m)
Bottom lift Goal 1 ACTop lift Goal 1 ACOverlay
Figure G-9. Transverse profile of trenched AC sl
134
-200 0 200 400 600 800 1000
Cross-section point (mm)
assumes constant ATPB thickness of 70 mm
ab from Section 512RF.

0
50
100
150
200
250
300
-1000 -800 -600 -400
Thic
knes
s af
ter T
raffi
ckin
g (m
m)
Bottom lift Goal 1 ACTop lift Goal 1 ACOverlay
Figure G-10. Transverse profile of trenched AC s
135
-200 0 200 400 600 800 1000
Cross-section point (mm)
lab from Section 513RF.

136

137
APPENDIX H DEVELOPMENT OF RUT AND HUMP VOLUME UNDERTRAFFICKING FROM TRANSVERSE SURFACE PROFILES

Distribution of tire on DG
0.0E+00
2.0E+06
4.0E+06
6.0E+06
8.0E+06
1.0E+07
1.2E+07
1.4E+07
1.6E+07
1.8E+07
2.0E+07
0 20000 40000 60000
Vol o
f mat
eria
l(mm
3)
Vol Left Hump
Vol wheel path Right
Figure H-1. Development of Rut and Hump Volu
138
material under traffic with a dual bias-plyAC overlay at 50C - Section 505RF
80000 100000 120000 140000 160000 180000 200000
Repetitions
Vol wheel path Left Vol Middle Hump
Vol Right Hump Densification volume
me Under Trafficking from Transverse Surface Profiles, Section 505RF.

Distribution of material unde
0.0E+00
2.0E+06
4.0E+06
6.0E+06
8.0E+06
1.0E+07
1.2E+07
1.4E+07
0 20000 40000 60
Vol o
f mat
eria
l(mm
3)
Vol Left Hump
Vol Wheel Path Right
Figure H-2. Development of Rut and Hump Volu
139
r traffic with a dual radial tire on DGAC overlay at 50CSection 506RF
000 80000 100000 120000 140000 160000 180000
Repetitions
Vol Wheel Path Leftt Vol Middle Hump
Vol Right Hump Densification volume
me Under Trafficking from Transverse Surface Profiles, Section 506RF.
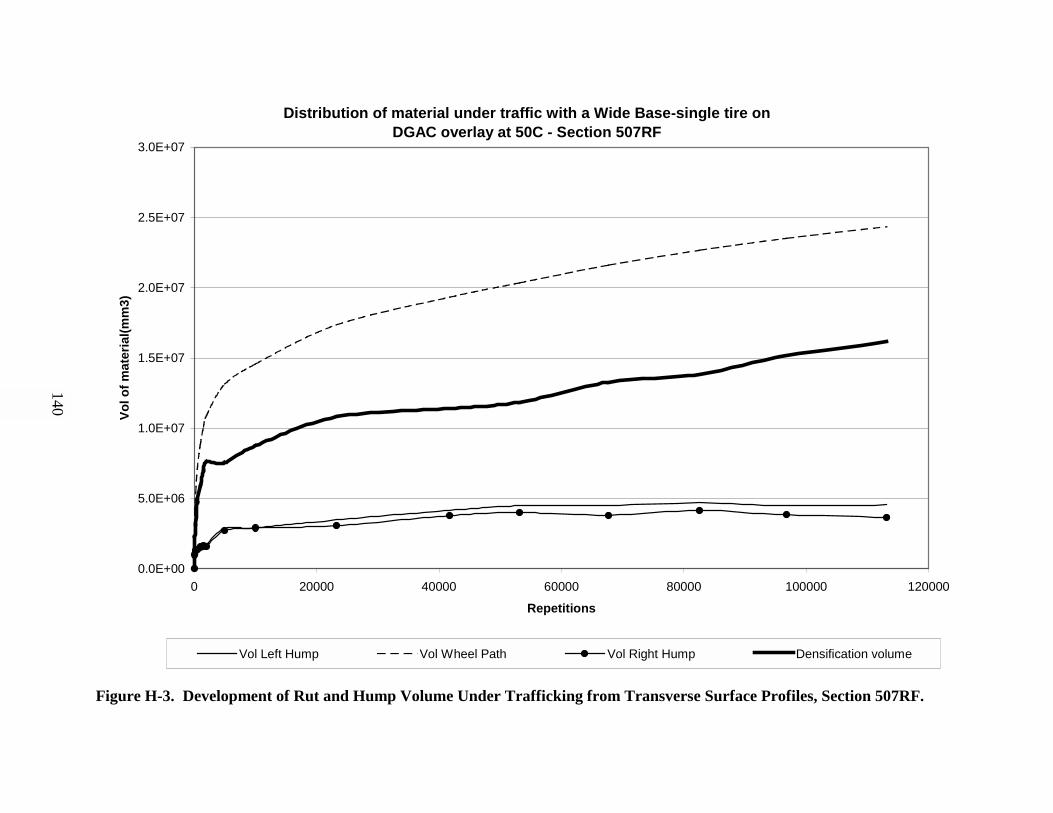
Distribution of materDGAC
0.0E+00
5.0E+06
1.0E+07
1.5E+07
2.0E+07
2.5E+07
3.0E+07
0 20000 40
Vol o
f mat
eria
l(mm
3)
Vol Left Hump Vo
Figure H-3. Development of Rut and Hump Volu
140
ial under traffic with a Wide Base-single tire on overlay at 50C - Section 507RF
000 60000 80000 100000 120000
Repetitions
l Wheel Path Vol Right Hump Densification volume
me Under Trafficking from Transverse Surface Profiles, Section 507RF.

Distribution of materARHM-G
0.0E+00
5.0E+06
1.0E+07
1.5E+07
2.0E+07
2.5E+07
0 20000 40000
Vol o
f mat
eria
l(mm
3)
Vol Left Hump V
Figure H-4. Development of Rut and Hump Volu
141
ial under traffic with a Wide Base-single tire on G 62mm overlay - Section 508RF
60000 80000 100000 120000 140000
Repetitions
ol Wheel Path Vol Right Hump Densification volume
me Under Trafficking from Transverse Surface Profiles, Section 508RF.

Distribution of material under t
0.0E+00
2.0E+06
4.0E+06
6.0E+06
8.0E+06
1.0E+07
1.2E+07
1.4E+07
1.6E+07
1.8E+07
2.0E+07
0 20000 40000 60000
Vol o
f mat
eria
l(mm
3)
Vol Left Hump
Vol Wheel Path Right
Figure H-5. Development of Rut and Hump Volu
142
raffic with a dual radial tire on ARHM-GG 62mm overlay - Section 509RF
80000 100000 120000 140000 160000 180000 200000
Repetitions
Vol Wheel Path Left Vol Middle Hump
Vol Right Hump Densification volume
me Under Trafficking from Transverse Surface Profiles, Section 509RF.
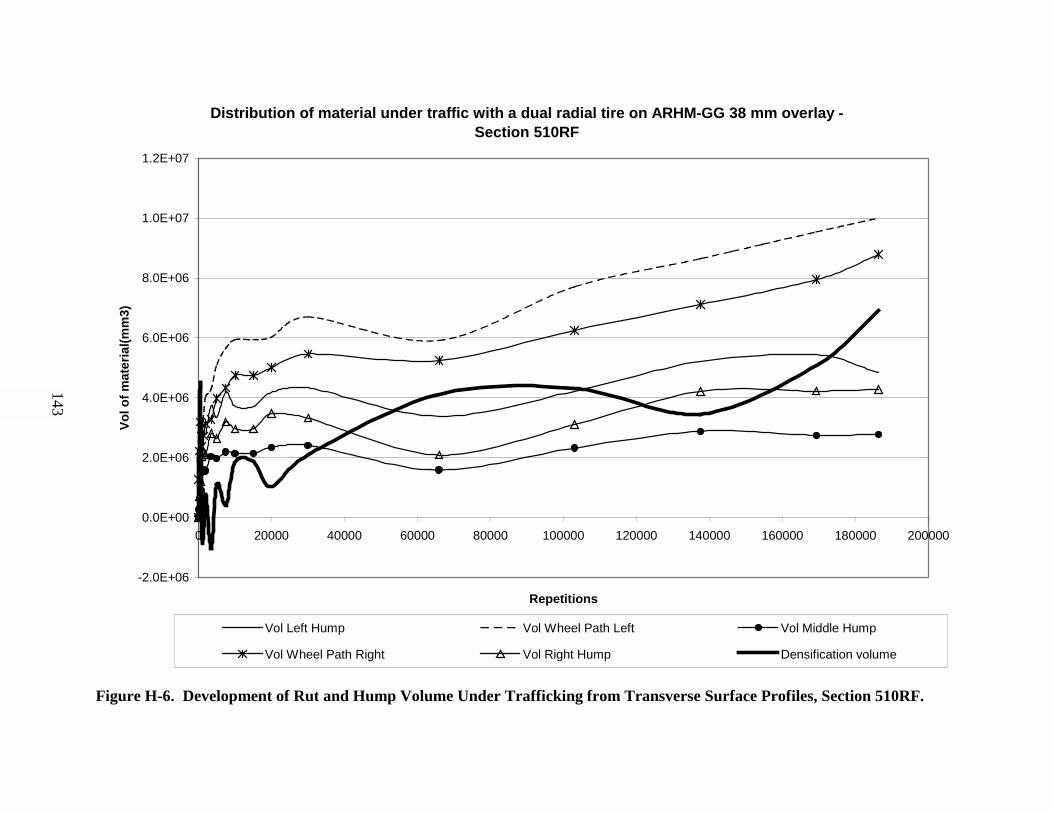
Distribution of material under t
-2.0E+06
0.0E+00
2.0E+06
4.0E+06
6.0E+06
8.0E+06
1.0E+07
1.2E+07
0 20000 40000 60000
Vol o
f mat
eria
l(mm
3)
Vol Left Hump
Vol Wheel Path Right
Figure H-6. Development of Rut and Hump Volu
143
raffic with a dual radial tire on ARHM-GG 38 mm overlay - Section 510RF
80000 100000 120000 140000 160000 180000 200000
Repetitions
Vol Wheel Path Left Vol Middle Hump
Vol Right Hump Densification volume
me Under Trafficking from Transverse Surface Profiles, Section 510RF.

Distribution of materARHM-G
-5.0E+06
0.0E+00
5.0E+06
1.0E+07
1.5E+07
2.0E+07
2.5E+07
0 10000 20000
Vol o
f mat
eria
l(mm
3)
Vol Left Hump V
Figure H-7. Development of Rut and Hump Volu
144
ial under traffic with a Wide Base-single tire on G 38mm overlay - Section 511RF
30000 40000 50000 60000 70000 80000
Repetitions
ol Rut Wheel Path Vol Right Hump Densification volume
me Under Trafficking from Transverse Surface Profiles, Section 511RF.

Distribution of materDGAC
-2.0E+06
0.0E+00
2.0E+06
4.0E+06
6.0E+06
8.0E+06
1.0E+07
1.2E+07
1.4E+07
1.6E+07
0 50000 100000
Vol o
f mat
eria
l(mm
3)
Vol Left Hump Vo
Figure H-8. Development of Rut and Hump Volu
145
ial under traffic with a Wide Base-single tire on overlay @ 40C- Section 512RF
150000 200000 250000 300000 350000 400000
Repetitions
l Rut Wheel Path Vol Right Hump Densification volume
me Under Trafficking from Transverse Surface Profiles, Section 512RF.
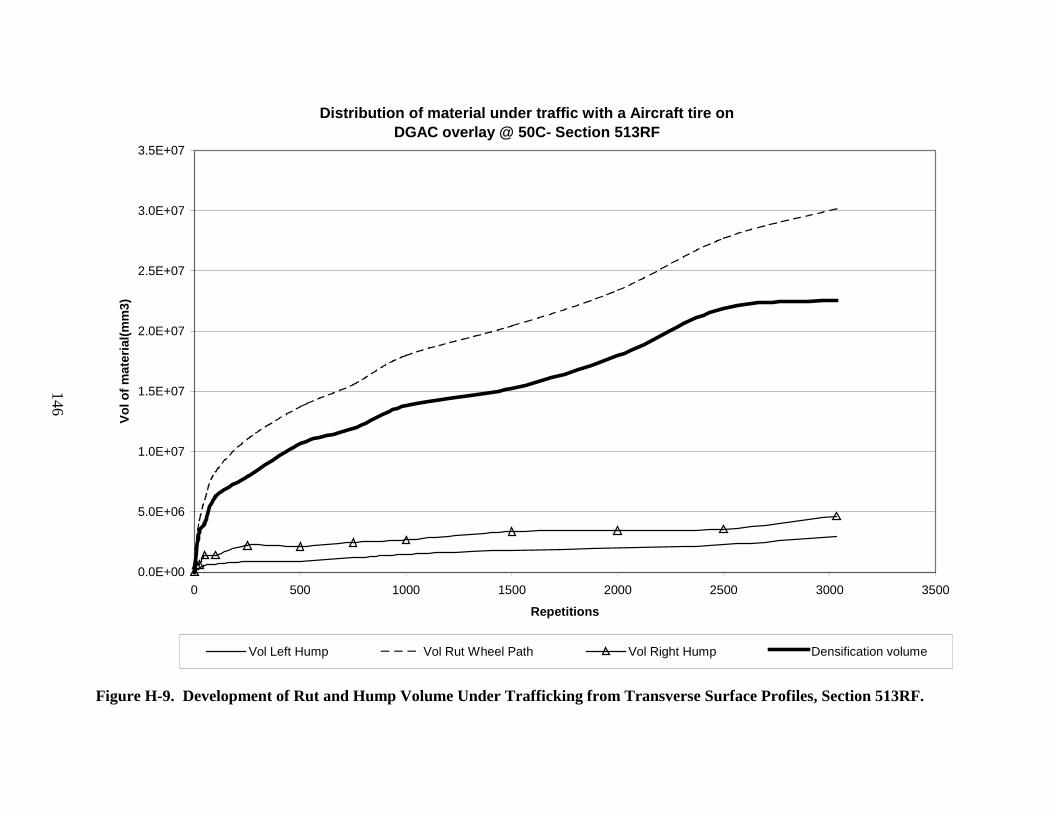
Distribution of mDGAC
0.0E+00
5.0E+06
1.0E+07
1.5E+07
2.0E+07
2.5E+07
3.0E+07
3.5E+07
0 500 1000
Vol o
f mat
eria
l(mm
3)
Vol Left Hump V
Figure H-9. Development of Rut and Hump Volu
146
aterial under traffic with a Aircraft tire on overlay @ 50C- Section 513RF
1500 2000 2500 3000 3500
Repetitions
ol Rut Wheel Path Vol Right Hump Densification volume
me Under Trafficking from Transverse Surface Profiles, Section 513RF.

147
APPENDIX I TRANSVERSE AGGREGATE BASE SURFACE PROFILES ATTERMINATION OF TRAFFICKING

DG
-15.00
-10.00
-5.00
0.00
5.00
10.00
15.00
700 900 1100
AB
per
m d
efor
m (m
m)
505RF-last rep S
Figure I-1. Transverse Aggregate Base Surface P
148
AB profile - Section 505RFAC @ 50C, dual bias-ply tire
1300 1500 1700 1900 2100
Distance (mm)
eries3 AB profile point 8 AB profile, point 7
Approx/ location of the rutting zone on top of AB layer
rofile at Termination of Trafficking, Section 505RF.

D
-20
-15
-10
-5
0
5
10
15
500 700 900
AB
per
m d
efor
m (m
m)
AB profile, point8
AC layer, last rep
Series3
AB profile, point 9
Figure I-2. Transverse Aggregate Base Surface P
149
AB profile - Section 506RFGAC @ 50C, dual radial tire
1100 1300 1500 1700 1900 2100
Distance(mm)
Approx. position of the rutting zone on top of AB layer
rofile at Termination of Trafficking, Section 506RF.

DGA
-20
-15
-10
-5
0
5
10
15
1000 1200 1
AB
per
m d
efor
m (m
m)
Approx. p
Figure I-3. Transverse Aggregate Base Surface P
150
AB profile - Section 507RFC @ 50C, wide-base single tire
400 1600 1800 2000
Distance(mm)
AB profile, point 8
AC layer, last repetition
AB profile, point 9
osition of the rutting zone on top of AB
layer
rofile at Termination of Trafficking, Section 507RF.

ARHM o
-20
-15
-10
-5
0
5
10
900 1100 1300
AB
per
m. d
efor
m. (
mm
)
Figure I-4. Transverse Aggregate Base Surface P
151
AB profile, Section 508 RFverlay 62mm, wide-base single tire
1500 1700 1900 2100
Distance (mm)
AB profile point 7AC layer, last repetitionAB profile, pont 6
Approx. position of the rutting zone on top of AB layer
rofile at Termination of Trafficking, Section 508RF.

ARHM
-16
-14
-12
-10
-8
-6
-4
-2
0
2
4
6
200 400 600
AB
per
m. d
efor
m. (
mm
)
Appruttin
Figure I-5. Transverse Aggregate Base Surface P
152
AB profile, Section 509RF overlay, 62mm, dual radial tire
800 1000 1200 1400 1600 1800
Distance (mm)
AB profile, point 7AC layer, last repetitionAb profile, point 6
rox. position of the g zone on top of AB
layer
rofile at Termination of Trafficking, Section 509RF.
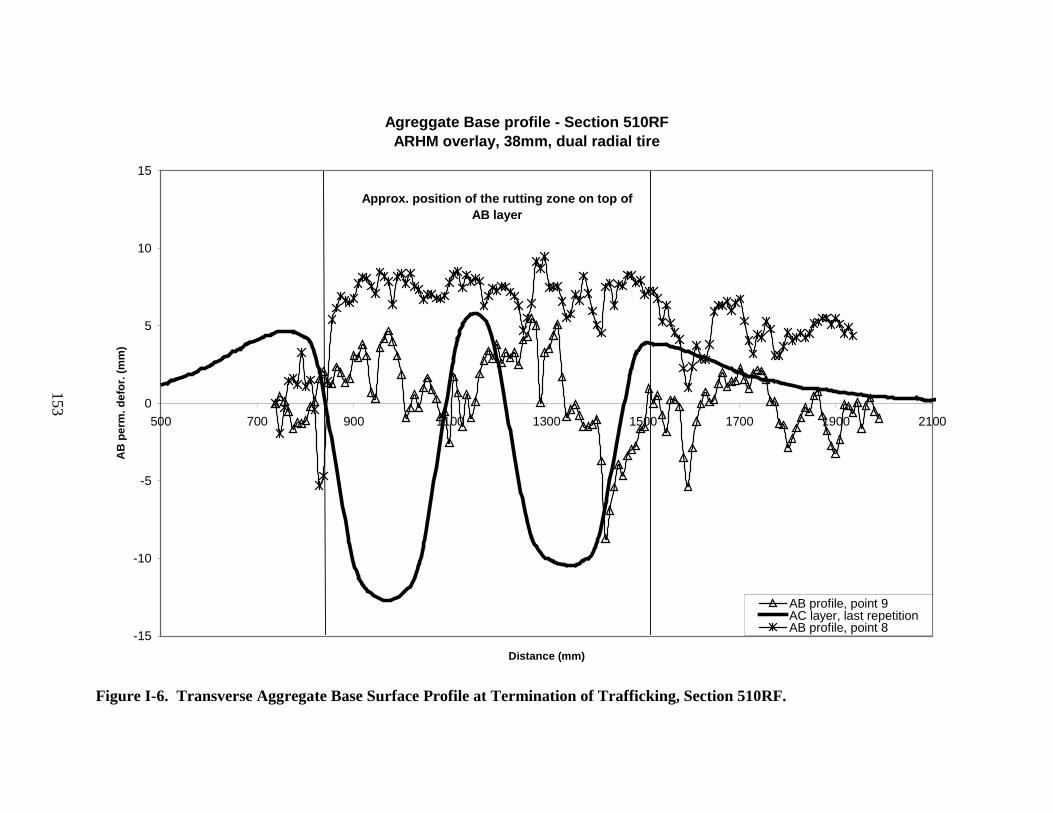
AgreggARHM
-15
-10
-5
0
5
10
15
500 700 900
AB
per
m. d
efor
. (m
m)
Approx. pos
Figure I-6. Transverse Aggregate Base Surface P
153
ate Base profile - Section 510RF overlay, 38mm, dual radial tire
1100 1300 1500 1700 1900 2100
Distance (mm)
AB profile, point 9AC layer, last repetitionAB profile, point 8
ition of the rutting zone on top of AB layer
rofile at Termination of Trafficking, Section 510RF.
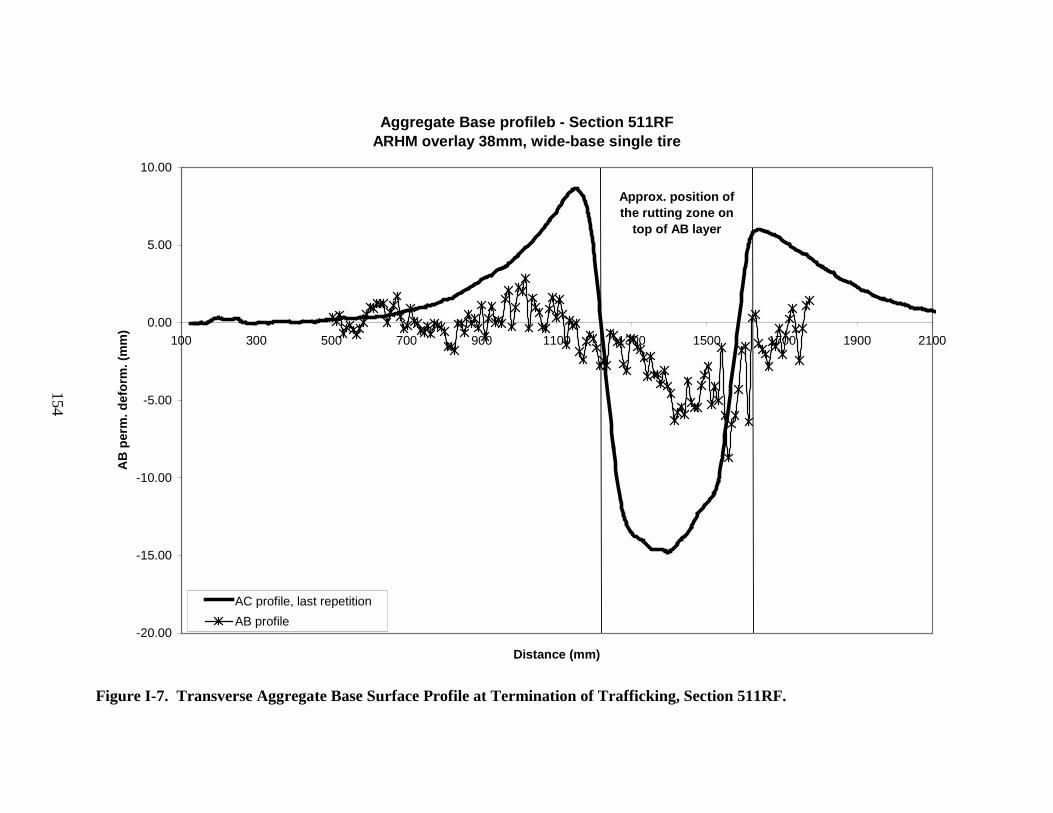
AggregARHM o
-20.00
-15.00
-10.00
-5.00
0.00
5.00
10.00
100 300 500 700
AB
per
m. d
efor
m. (
mm
)
AC profile, last repetitionAB profile
Figure I-7. Transverse Aggregate Base Surface P
154
ate Base profileb - Section 511RFverlay 38mm, wide-base single tire
900 1100 1300 1500 1700 1900 2100
Distance (mm)
Approx. position of the rutting zone on
top of AB layer
rofile at Termination of Trafficking, Section 511RF.

AggregDGA
-15.00
-10.00
-5.00
0.00
5.00
10.00
15.00
100 300 500
AB
per
m. d
efor
m. (
mm
)
Approrutting
Figure I-8. Transverse Aggregate Base Surface P
155
ate Base profile - Section 512RFC @ 40C, wide-base single tire
700 900 1100 1300 1500 1700
Distance (mm)
AC layer, last repetitionAB profile, point 7AB profile, point 8
x. position of the zone on top of AB
layer
rofile at Termination of Trafficking, Section 512RF.

Aggreg
-25.00
-20.00
-15.00
-10.00
-5.00
0.00
5.00
100 300 500 700
AB
per
m. d
efor
m. (
mm
)
Figure I-9. Transverse Aggregate Base Surface P
156
ate Base profile - Section 513RF
900 1100 1300 1500 1700 1900 2100
Distance (mm)AC profile - last repetitionSeries2
Approx. position of the rutting
zone on top of AB layer
rofile at Termination of Trafficking, Section 513RF.

157