
Rust Preventative Spray Varnish Verification and Nozzle ...
72
The University of Akron The University of Akron IdeaExchange@UAkron IdeaExchange@UAkron Williams Honors College, Honors Research Projects The Dr. Gary B. and Pamela S. Williams Honors College Winter 2021 Rust Preventative Spray Varnish Verification and Nozzle Rust Preventative Spray Varnish Verification and Nozzle Development Development Dakota Snyder The University of Akron, [email protected] Collin Whitely The University of Akron, [email protected] Stephen Patrick The University of Akron, [email protected] William McCullough The University of Akron, [email protected] Follow this and additional works at: https://ideaexchange.uakron.edu/honors_research_projects Part of the Electro-Mechanical Systems Commons, and the Manufacturing Commons Please take a moment to share how this work helps you through this survey. Your feedback will be important as we plan further development of our repository. Recommended Citation Recommended Citation Snyder, Dakota; Whitely, Collin; Patrick, Stephen; and McCullough, William, "Rust Preventative Spray Varnish Verification and Nozzle Development" (2021). Williams Honors College, Honors Research Projects. 1447. https://ideaexchange.uakron.edu/honors_research_projects/1447 This Dissertation/Thesis is brought to you for free and open access by The Dr. Gary B. and Pamela S. Williams Honors College at IdeaExchange@UAkron, the institutional repository of The University of Akron in Akron, Ohio, USA. It has been accepted for inclusion in Williams Honors College, Honors Research Projects by an authorized administrator of IdeaExchange@UAkron. For more information, please contact [email protected], [email protected].
Transcript of Rust Preventative Spray Varnish Verification and Nozzle ...
The University of Akron The University of Akron
IdeaExchange@UAkron IdeaExchange@UAkron
Williams Honors College, Honors Research Projects
The Dr. Gary B. and Pamela S. Williams Honors College
Winter 2021
Rust Preventative Spray Varnish Verification and Nozzle Rust Preventative Spray Varnish Verification and Nozzle
Development Development
Dakota Snyder The University of Akron, [email protected]
Collin Whitely The University of Akron, [email protected]
Stephen Patrick The University of Akron, [email protected]
William McCullough The University of Akron, [email protected]
Follow this and additional works at: https://ideaexchange.uakron.edu/honors_research_projects
Part of the Electro-Mechanical Systems Commons, and the Manufacturing Commons
Please take a moment to share how this work helps you through this survey. Your feedback will
be important as we plan further development of our repository.
Recommended Citation Recommended Citation Snyder, Dakota; Whitely, Collin; Patrick, Stephen; and McCullough, William, "Rust Preventative Spray Varnish Verification and Nozzle Development" (2021). Williams Honors College, Honors Research Projects. 1447. https://ideaexchange.uakron.edu/honors_research_projects/1447
This Dissertation/Thesis is brought to you for free and open access by The Dr. Gary B. and Pamela S. Williams Honors College at IdeaExchange@UAkron, the institutional repository of The University of Akron in Akron, Ohio, USA. It has been accepted for inclusion in Williams Honors College, Honors Research Projects by an authorized administrator of IdeaExchange@UAkron. For more information, please contact [email protected], [email protected].
SENIOR DESIGN FINAL REPORT: RUST
PREVENTATIVE SPRAY VARNISH
3 December 2021
Collin Whitely
Dakota Snyder
Stephen Patrick
William McCullough
SD2 Final Report for 4600:471 Senior/Honor Design, Summer 2021
Honors Reader: Dr. Gopal Nadkarni
Honors Faculty Advisor: Dr. Yalin Dong
Honors Reader: Dr. Jennifer Lillard
Industrial Project Sponsor: Jeremy Silvidi
By

ii
Abstract
This report details the testing of five different corrosion preventatives to be used in an e-motor product
as well as the design of a self-contained, automated spray varnishing unit for Schaeffler Transmission.
Results from material testing showed that DEI HI-TEMP Silicone Coating deteriorated rapidly and did not
provide adequate corrosion resistance. The Seymour 620-1525 Tool Crib Red Insulating Varnish did not
show any visible deterioration; however, it is out of safe operating temperature and therefore was not
selected as a viable option. The MG Chemicals 4228-55ML Red Insulating Varnish performed better than
both DEI and Anti-Seize during testing, but due to being a brush-on only application, was not chosen as
the best option for this application. The results show that two of the five coatings tested had acceptable
performance; both the Seymour 620-1525 Tool Crib Red Insulating Varnish and the Sprayon EL609
Green Insulating Varnish performed adequately. Further testing and analysis should be completed prior
to any final decisions on the best varnish for the application.
After this material selection occurred, the team started to focus on sprayer design. Due to
circumstances surrounding communication between the team and Schaeffler, the team decided to focus
specifically on designing a new nozzle on a off-the-shelf ready spray can for Sprayon to better optimize
material use and to try to improve upon the application of the material to a sample stator lamination.
The team researched and designed several iterations of nozzles and analyzed them by applying the
material to stator samples and analyzing them under three major criteria; application, coating thickness,
and the provided Saltwater Test from the material testing. Based on these criteria the team was able to
design 4 nozzles that passed testing, nozzles #2 (a replica of the manufacturer’s nozzle), #8 (a converging
elongated head nozzle with a circular exit), #10 (a continuously converging nozzle with an oval exit), and
#13 (a 15-degree flat fan nozzle). We also recommend these four nozzles to be considered as candidates
for future testing and further development to better improve coating quality and uniformity.

iii
Contents
1. Introduction ........................................................................................................................................ 1
2. Material Selection................................................................................................................................ 2
2.1 Material Analysis ........................................................................................................................... 2
2.1.1 MG Chemicals 4228-55ML Red Insulating Varnish4 .................................................................. 2
2.1.2 Seymour 620-1525 Tool Crib Red Insulating Varnish6............................................................... 2
2.1.3 Anti-Seize Technology Red Insulating Varnish8 ........................................................................ 3
2.1.4 Sprayon EL609 Green Insulating Varnish10 ............................................................................... 3
2.1.5 DEI HI-TEMP Silicone Coating12 ................................................................................................ 3
2.2 Testing Procedure .......................................................................................................................... 4
2.2.1 Sample Preparation ................................................................................................................. 4
2.2.2 Test Procedure ........................................................................................................................ 5
2.2.3 Deviations ............................................................................................................................... 6
2.2.4 Materials Used in Saltwater Corrosion Test ............................................................................. 6
3. Material Testing Results....................................................................................................................... 7
3.1 Preliminary Test Results ................................................................................................................. 7
3.2 Research and Ranking Considerations ............................................................................................ 8
3.2.1 Coating Research .................................................................................................................... 8
3.2.2 Coating Adhesion .................................................................................................................... 9
3.2.3 Coating Corrosion Performance ............................................................................................ 10
3.3 Additional Analysis and Observations ........................................................................................... 11
4. Material Selection Recommendations................................................................................................ 13
5. Nozzle Research and Design............................................................................................................... 14
5.1 Nozzle Design Research ............................................................................................................... 16
5.1.1 Flat Fan Shaped Orifice - Deflection ....................................................................................... 18
5.1.2 Flat Fan Shaped Orifice - Standard ......................................................................................... 18
5.1.3 Impingement Orifice – Mist/Fog Fan ..................................................................................... 18
5.1.4 Spiral Orifice- Hollow/Full Cone ............................................................................................. 19
5.1.5 Whirl – Axial .......................................................................................................................... 19
5.1.6 Whirl Tangential .................................................................................................................... 20
5.1.7 Siphon Fed ............................................................................................................................ 20
iv
5.1.8 External Mix .......................................................................................................................... 20
5.1.9 Internal Mix .......................................................................................................................... 21
5.2 Manufacturing Process Selection ................................................................................................. 21
5.2.1 Printer................................................................................................................................... 21
5.3 Design .......................................................................................................................................... 22
5.3.1 Design Verification ................................................................................................................ 23
5.3.2 Iteration 1 Design Theory ...................................................................................................... 23
5.3.3 Iteration 1 Design Application ............................................................................................... 23
5.3.4 Iteration 2 Design Theory ...................................................................................................... 24
5.3.5 Iteration 2 Design Application ............................................................................................... 25
5.3.6 Iteration 3 Design Theory ...................................................................................................... 27
5.3.7 Iteration 3 Design Application ............................................................................................... 27
6. Nozzle Testing Procedure .................................................................................................................. 29
6.1 Material Application .................................................................................................................... 29
6.2 Saltwater Corrosion Testing ......................................................................................................... 30
6.3 Material Layer Thickness Testing* ................................................................................................ 31
6.4 Deviations .................................................................................................................................... 32
6.5 Materials Used for Nozzle Testing ................................................................................................ 32
6.5.1 Material Application .............................................................................................................. 32
6.5.2 Saltwater Corrosion Testing .................................................................................................. 32
6.5.3 Material Layer Thickness Testing ........................................................................................... 32
7. Nozzle Testing Results ....................................................................................................................... 33
7.1 Application .................................................................................................................................. 33
7.2 Thickness ..................................................................................................................................... 35
7.2.1 Baking Samples ......................................................................................................................... 37
7.3 Saltwater ..................................................................................................................................... 38
8. Discussion and Nozzle Selection Recommendations ........................................................................... 41
8.1 Nozzle Design Discussions ............................................................................................................ 41
8.2 Nozzle Application Discussion ...................................................................................................... 42
8.3 Nozzle Recommendations ............................................................................................................ 43
8.3.1 Nozzle Recommendation Explanations ...................................................................................... 43
9. Conclusions ....................................................................................................................................... 45

v
9.1 Accomplishments......................................................................................................................... 45
9.2 Uncertainties ............................................................................................................................... 45
9.2.1 Material Selection and Testing .............................................................................................. 46
9.2.2 Nozzle Selection and Testing ................................................................................................. 46
9.3 Ethical Considerations .................................................................................................................. 47
9.4 Future Work ................................................................................................................................ 47
References ............................................................................................................................................ 48
Appendix A: Coating Thickness Instrument Information Sheet ............................................................... 51
Appendix B: Material Technical Data Sheets .......................................................................................... 52
MG Chemicals 4228-55ML Red Insulating Varnish5 ........................................................................... 52
Seymour 620-1525 Tool Crib Red Insulating Varnish7 ......................................................................... 54
Anti-Seize Technology Red Insulating Varnish9 ................................................................................... 55
Sprayon EL609 Green Insulating Varnish11 ......................................................................................... 56
DEI HI-TEMP Silicone Coating13 .......................................................................................................... 58
Appendix C: Pictures of Sprayon Samples: Olympus Stereo Microscope ................................................. 59
Appendix D: Pictures of Material Testing Samples: ................................................................................ 64

1
1. Introduction Our team conducted research on rust preventative spray varnish for Schaeffler Transmission in Wooster.
Five materials were selected for this rust preventative analysis. The project is based on the concept of
varnishing electric steel stator lamination stack; they constitute a stator for an electric motor, known as
an e-motor, as shown in Figure 1. To maintain the safety of all end-users, e-motors have international
standards that they must meet. These standards are ISO 12103-11 and ISO 206532. The first pertains to
the Arizona Dust Test1 and the second defines the degree of
protection that the motors must have. The spec that
Schaeffler must meet is IP6K72. This means that the internal
protection must be dust tight and that the system must be
able to survive temporary immersion.
These stacks are epoxied together along all of the external
edges. These stacks must be varnished along the inside
diameter because they are exposed to the elements. They
cannot be epoxied as the electrical current needs a
medium(air) to travel through. The varnishes need to be of
the NEMA class F spec3. Class F means that the stacks will
have a maximum temperature of 155 ℃. In addition, the
maximum temperature rise is 105 ℃.
This problem brings about two significant questions:
1. What varnish is the best?
2. What is the best way to varnish the steel?
To better address these questions, our group decided to follow guidance from Schaeffler and conduct
testing on samples of the lamination stacks. Information on the rationale behind material choices as well
as testing procedure and processes will be explained in detail under section 2: Material Selection.
Figure 1: Example of Lamination Stacks Used in e-motors

2
2. Material Selection After months of preparation for testing, our group was finally able to gather all of the resources needed
to conduct testing. These would range from gathering the needed materials and samples, finding much
technical and field expertise in the forms of advising, and a proper physical testing location. Even though
Schaeffler recommended using home ovens to complete the testing portion of this project, our group
and the many advisors that have contributed to this project could not stress enough the importance of
proper use and following best practice procedures when conducting research on these products.
Therefore, all testing and analysis was conducted in a supervised laboratory setting. All information on
materials and laboratory procedure will be explained in sections 2.1 and 2.2.
2.1 Material Analysis This section contains information for the materials used during the rust preventative spray varnish
verification. The reasons for the selection of each product, product descriptions, price of each material,
operating temperatures, and other important information are described below.
2.1.1 MG Chemicals 4228-55ML Red Insulating Varnish4
The MG Chemical varnish (Figure 2) is a highly insulating coating with
low viscosity. It’s mainly used to protect industrial and electrical parts
against arc, corona, corrosion, and moisture. This material is applied by
brush and is not a spray varnish.
• Operating Temperature: 180 ℃ (Above Class F)
• Price/bottle: $14.52 (2 oz)
• Price/oz: $7.26
This material was selected because it is a brush-on varnish with an
operating temperature above the testing procedure requirement. This
material will provide a better understanding of the difference between
brush-on and spray-on applications of varnishes.
2.1.2 Seymour 620-1525 Tool Crib Red Insulating Varnish6
The Seymour varnish (Figure 3) is an insulating material that is designed to protect against
deterioration caused by exposure to oil, moisture, acid, and alkali. This product is a spray-
on varnish.
• Operating Temperature: 155 ℃ (Class F)
• Price/can: $8.23 (16 oz)
• Price/oz: $0.51
This product was selected because its application is spray on and its operating
temperature is above the testing procedure requirement. We expect this
material to not deteriorate under our testing conditions and have little
corrosion form during the experiment.
Figure 2: MG Chemicals 4228-55ML Red Insulating Varnish5
Figure 3: Seymour 620-1525 Tool Crib Red Insulating Varnish7

3
2.1.3 Anti-Seize Technology Red Insulating Varnish8
Anti-Seize Red insulating varnish (Figure 4 ) strongly adheres to metal and
other insulating components. The protective coating is used for many
different electrical and industrial applications. This product is a spray-on
varnish.
• Operating Temperature: 121 ℃
• Price/can: $15.80 (16 oz)
• Price/oz: $0.99
This product is a spray-on varnish with an operating temperature that is
below our testing procedure requirement. This material will provide a
better understanding of how the operating temperature of a varnish
affects the results.
2.1.4 Sprayon EL609 Green Insulating Varnish10
Sprayon (Figure 5) is an insulating varnish that creates a hard, tough surface that is oil
resistant and waterproof. The product is used to insulate motor windings and electrical
components. This product is a spray-on varnish.
• Operating Temperature: 155 ℃ (Class F)
• Price/can: $12.27 (15.25 oz)
• Price/oz: $0.80
This product was selected because its application is spray-on and its operating
temperature is above the testing procedure requirement. We expect this
material to not deteriorate under our testing conditions and have little
corrosion form during the experiment.
2.1.5 DEI HI-TEMP Silicone Coating12
The High-Temp silicone coating (Figure 6) is used to protect hot surfaces from
abrasion, oil, and grime. This product is a spray-on silicone coating.
• Operating Temperature: 815 ℃
• Price/can: $11.27 (12 oz)
• Price/oz: $0.94
This is the only silicone coating that was selected. It will give us a better
understanding of the difference between varnishes and silicone coating.
Silicone coatings are used to withstand high temperatures, but not repetitive
immersion.
Figure 4: Anti-Seize Technology Red Insulating Varnish9
Figure 5: Sprayon EL609 Green Insulating Varnish11
Figure 6: DEI HI-TEMP Silicone Coating13
4
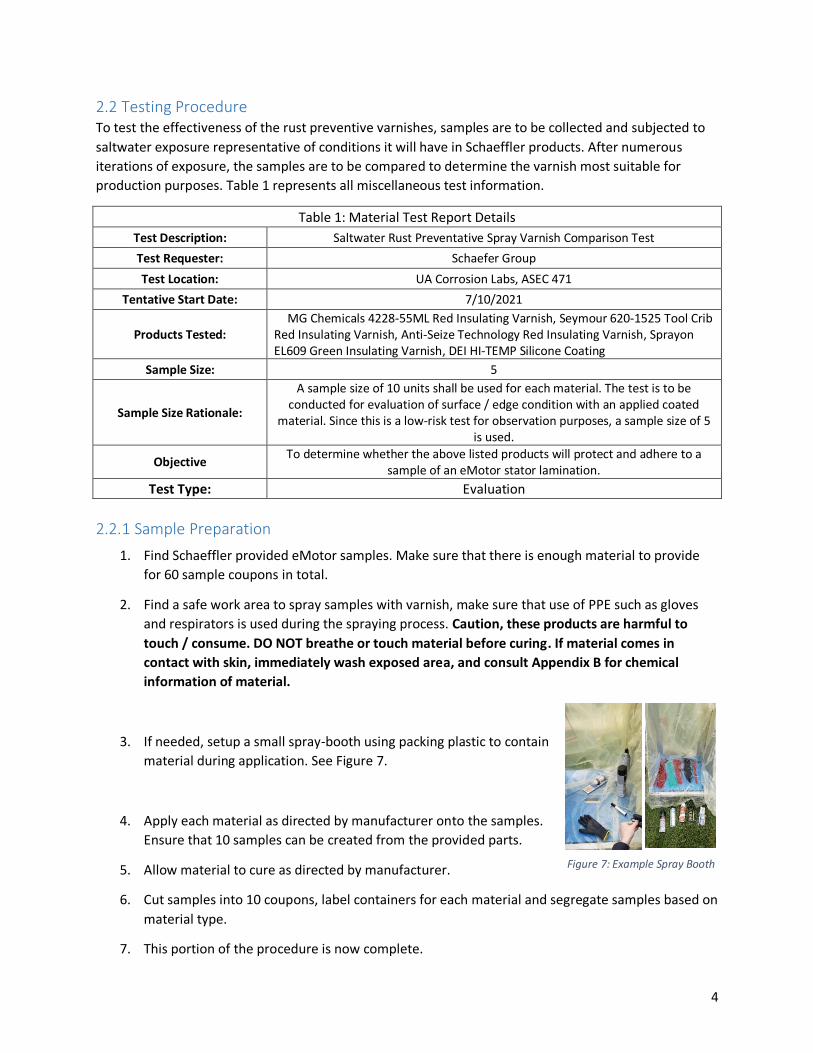
2.2 Testing Procedure To test the effectiveness of the rust preventive varnishes, samples are to be collected and subjected to
saltwater exposure representative of conditions it will have in Schaeffler products. After numerous
iterations of exposure, the samples are to be compared to determine the varnish most suitable for
production purposes. Table 1 represents all miscellaneous test information.
Table 1: Material Test Report Details
Test Description: Saltwater Rust Preventative Spray Varnish Comparison Test
Test Requester: Schaefer Group
Test Location: UA Corrosion Labs, ASEC 471
Tentative Start Date: 7/10/2021
Products Tested: MG Chemicals 4228-55ML Red Insulating Varnish, Seymour 620-1525 Tool Crib
Red Insulating Varnish, Anti-Seize Technology Red Insulating Varnish, Sprayon EL609 Green Insulating Varnish, DEI HI-TEMP Silicone Coating
Sample Size: 5
Sample Size Rationale:
A sample size of 10 units shall be used for each material. The test is to be conducted for evaluation of surface / edge condition with an applied coated
material. Since this is a low-risk test for observation purposes, a sample size of 5 is used.
Objective To determine whether the above listed products will protect and adhere to a
sample of an eMotor stator lamination.
Test Type: Evaluation
2.2.1 Sample Preparation
1. Find Schaeffler provided eMotor samples. Make sure that there is enough material to provide
for 60 sample coupons in total.
2. Find a safe work area to spray samples with varnish, make sure that use of PPE such as gloves
and respirators is used during the spraying process. Caution, these products are harmful to
touch / consume. DO NOT breathe or touch material before curing. If material comes in
contact with skin, immediately wash exposed area, and consult Appendix B for chemical
information of material.
3. If needed, setup a small spray-booth using packing plastic to contain
material during application. See Figure 7.
4. Apply each material as directed by manufacturer onto the samples.
Ensure that 10 samples can be created from the provided parts.
5. Allow material to cure as directed by manufacturer.
6. Cut samples into 10 coupons, label containers for each material and segregate samples based on
material type.
7. This portion of the procedure is now complete.
Figure 7: Example Spray Booth
5
2.2.2 Test Procedure
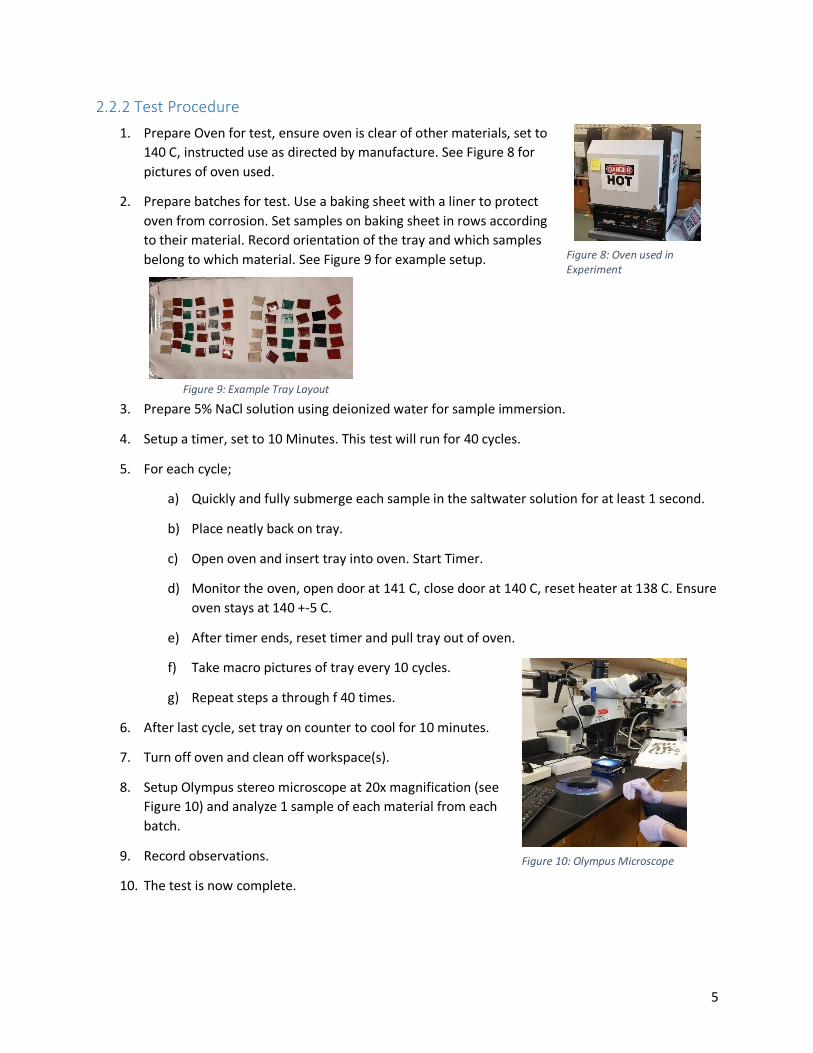
1. Prepare Oven for test, ensure oven is clear of other materials, set to
140 C, instructed use as directed by manufacture. See Figure 8 for
pictures of oven used.
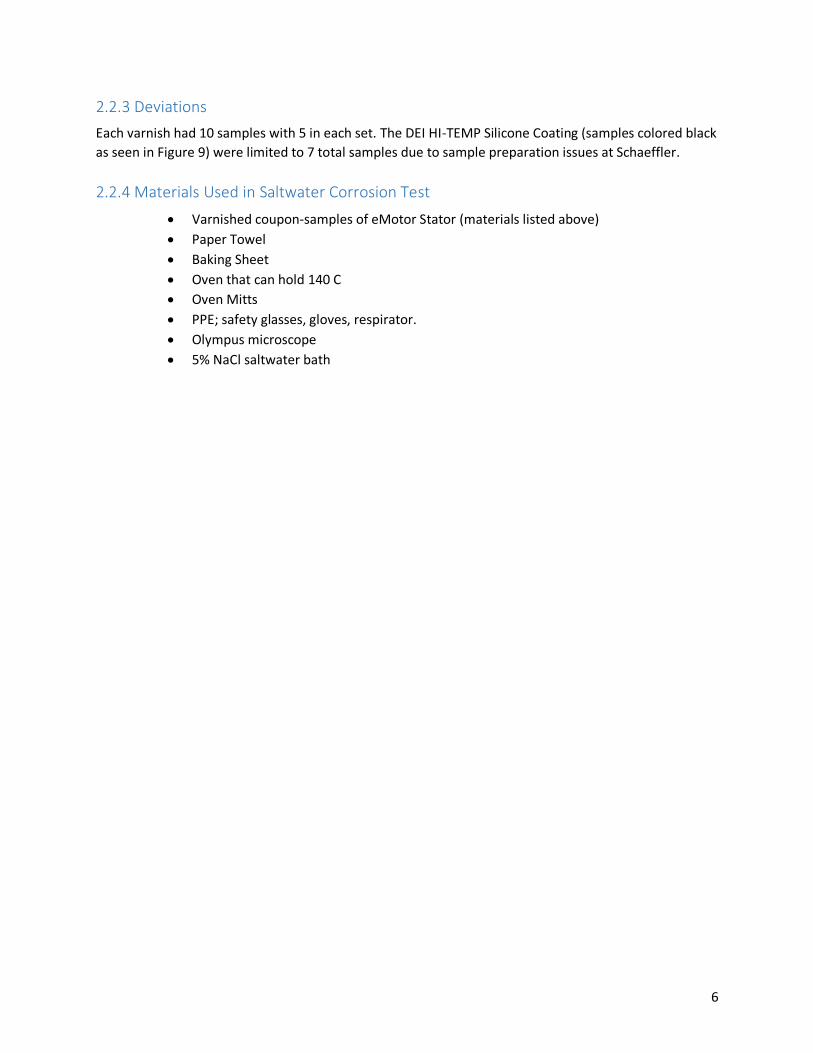
2. Prepare batches for test. Use a baking sheet with a liner to protect
oven from corrosion. Set samples on baking sheet in rows according
to their material. Record orientation of the tray and which samples
belong to which material. See Figure 9 for example setup.
3. Prepare 5% NaCl solution using deionized water for sample immersion.
4. Setup a timer, set to 10 Minutes. This test will run for 40 cycles.
5. For each cycle;
a) Quickly and fully submerge each sample in the saltwater solution for at least 1 second.
b) Place neatly back on tray.
c) Open oven and insert tray into oven. Start Timer.
d) Monitor the oven, open door at 141 C, close door at 140 C, reset heater at 138 C. Ensure
oven stays at 140 +-5 C.
e) After timer ends, reset timer and pull tray out of oven.
f) Take macro pictures of tray every 10 cycles.
g) Repeat steps a through f 40 times.
6. After last cycle, set tray on counter to cool for 10 minutes.
7. Turn off oven and clean off workspace(s).
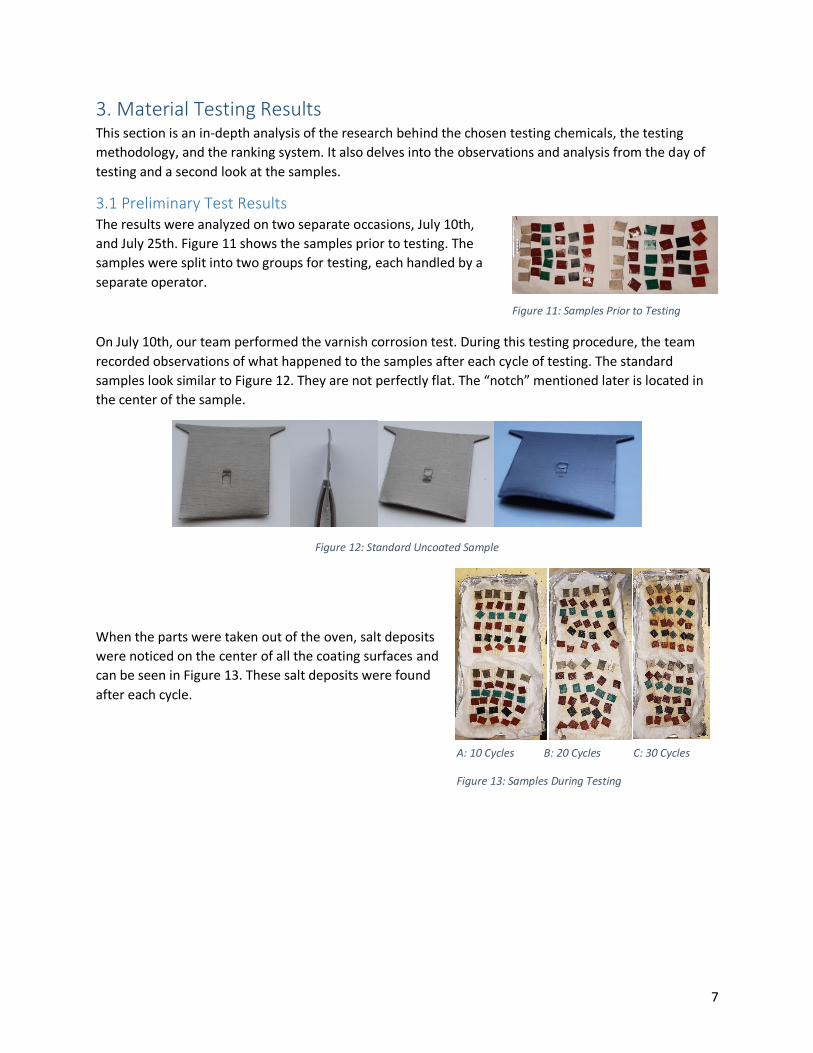
8. Setup Olympus stereo microscope at 20x magnification (see
Figure 10) and analyze 1 sample of each material from each
batch.
9. Record observations.
10. The test is now complete.
Figure 8: Oven used in Experiment
Figure 9: Example Tray Layout
Figure 10: Olympus Microscope
6
2.2.3 Deviations
Each varnish had 10 samples with 5 in each set. The DEI HI-TEMP Silicone Coating (samples colored black
as seen in Figure 9) were limited to 7 total samples due to sample preparation issues at Schaeffler.
2.2.4 Materials Used in Saltwater Corrosion Test
• Varnished coupon-samples of eMotor Stator (materials listed above)
• Paper Towel
• Baking Sheet
• Oven that can hold 140 C
• Oven Mitts
• PPE; safety glasses, gloves, respirator.
• Olympus microscope
• 5% NaCl saltwater bath
7
3. Material Testing Results This section is an in-depth analysis of the research behind the chosen testing chemicals, the testing
methodology, and the ranking system. It also delves into the observations and analysis from the day of
testing and a second look at the samples.
3.1 Preliminary Test Results The results were analyzed on two separate occasions, July 10th,
and July 25th. Figure 11 shows the samples prior to testing. The
samples were split into two groups for testing, each handled by a
separate operator.
On July 10th, our team performed the varnish corrosion test. During this testing procedure, the team
recorded observations of what happened to the samples after each cycle of testing. The standard
samples look similar to Figure 12. They are not perfectly flat. The “notch” mentioned later is located in
the center of the sample.
Figure 12: Standard Uncoated Sample
When the parts were taken out of the oven, salt deposits
were noticed on the center of all the coating surfaces and
can be seen in Figure 13. These salt deposits were found
after each cycle.
Figure 11: Samples Prior to Testing
A: 10 Cycles B: 20 Cycles C: 30 Cycles
Figure 13: Samples During Testing

8
The first amount of visible rust was noticed on the
notches of the control samples, and this was
recorded after the 7th cycle. Degradation of the DEI
silicone coating was noticed throughout the testing,
as seen in Figure 14. The fibers seen are most likely
insulation from the furnace.
The anti-seize red insulating varnish (Figure 15),
which was the material that was above its operating
temperature, showed no visible breakdown during
testing.
The team performed an analysis of the samples on the day
of testing and the observations were recorded. Visible rust
was observed on the edges of all the samples. Coating loss
was evident on all the samples, as was the glossy sheen
finish. Overspray wasn’t noted prior to testing, but after
testing it was clearly visible that the samples had overspray.
A common observation was that most if not all the samples
had some level of visible corrosion on the center notches. The DEI silicone coating samples (Figure 14)
shared one characteristic, unlike the other varnishes. Their coating degraded significantly more than
others, and fibers from the oven seemed to have embedded themselves into the coating.
3.2 Research and Ranking Considerations To properly assess the sprays’ efficacy, we needed to narrow down the criteria upon which we were
going to judge them. After extensive research, the team determined that the two best criteria to use
were coating adhesion and the amount of corrosion found on the samples after the test. We used
objective methods to quantify and qualify coating performance in terms of adhesion and amount of
corrosion.
3.2.1 Coating Research
The following explains what constitutes effective rust preventatives as well as effective coatings.
Schaeffler needs the coating to be affordable and durable as it is a one-time application that cannot be
replaced. In addition, the coating needs to provide chemical resistance, heat resistance, close to zero
moisture permeability, and significant adhesion as it will be constantly attacked. Coatings protect
substrates through three basic mechanisms: barrier protection, chemical inhibition, and galvanic
(sacrificial) protection.14
Figure 14: Center and Edge images of two samples of DEI Silicone (x20 zoom)
Figure 15: Center and Edge images of two samples of Anti Seize (x20 zoom)
9
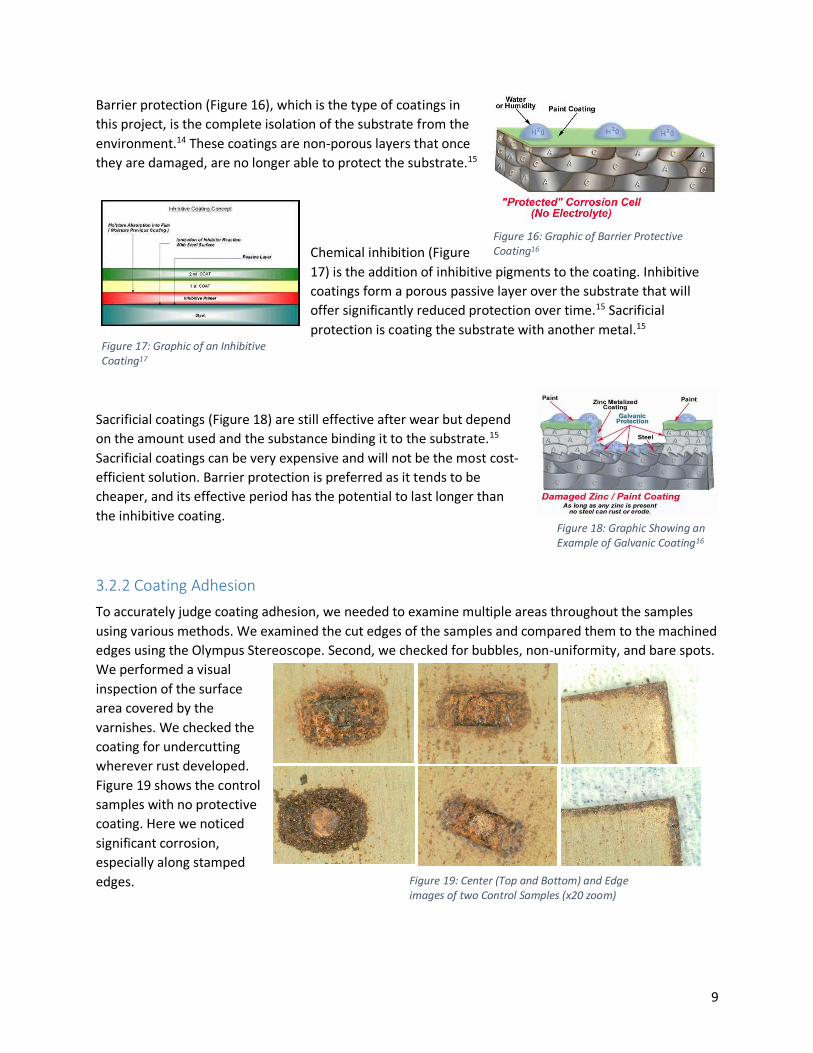
Barrier protection (Figure 16), which is the type of coatings in
this project, is the complete isolation of the substrate from the
environment.14 These coatings are non-porous layers that once
they are damaged, are no longer able to protect the substrate.15
Chemical inhibition (Figure
17) is the addition of inhibitive pigments to the coating. Inhibitive
coatings form a porous passive layer over the substrate that will
offer significantly reduced protection over time.15 Sacrificial
protection is coating the substrate with another metal.15
Sacrificial coatings (Figure 18) are still effective after wear but depend
on the amount used and the substance binding it to the substrate.15
Sacrificial coatings can be very expensive and will not be the most cost-
efficient solution. Barrier protection is preferred as it tends to be
cheaper, and its effective period has the potential to last longer than
the inhibitive coating.
3.2.2 Coating Adhesion
To accurately judge coating adhesion, we needed to examine multiple areas throughout the samples
using various methods. We examined the cut edges of the samples and compared them to the machined
edges using the Olympus Stereoscope. Second, we checked for bubbles, non-uniformity, and bare spots.
We performed a visual
inspection of the surface
area covered by the
varnishes. We checked the
coating for undercutting
wherever rust developed.
Figure 19 shows the control
samples with no protective
coating. Here we noticed
significant corrosion,
especially along stamped
edges.
Figure 19: Center (Top and Bottom) and Edge images of two Control Samples (x20 zoom)
Figure 18: Graphic Showing an Example of Galvanic Coating16
Figure 16: Graphic of Barrier Protective Coating16
Figure 17: Graphic of an Inhibitive Coating17

10
One of the most definitive methods of testing the coating
adhesion was through a knife test. The test is usually
performed by cutting two lines in an “x” shape at a 30-45
degree angle and then the coating is lifted away.18 A
standardized version of this test can be found in ASTM
D6677.19 During this test, we attempted to lift the
coating away from the substrate on multiple locations:
bare spots, rust developments, edges, and on the
unaffected varnish. It should be noted that this test is
extremely subjective and its value is directly related to
the operator’s experience. These results are all relative to
each other and have no baseline to compare to.
With that said, the DEI silicone coating performed the worst. The Anti-Seize coating performed the
worst out of all of the varnishes, but better than DEI. Seymour and MG Chemicals performed very
similarly during the knife test; however, the Seymour coating was more difficult to lift off which
indicates better adhesive strength (Figure 20). The Sprayon varnish performed the best (Figure 21).
3.2.3 Coating Corrosion Performance
After seeing the results of the adhesion test, the
team decided to move forward in the analysis
with the top three samples: Sprayon, Seymour,
and MG Chemicals. The other two coatings were
still inspected, just not considered as contenders.
We decided the best way to assess the coating
performance was through the center notch of the
samples, as they all seemed to be completely
coated. This area of the sample is more subjected
to rust because of cold working. It deforms the
grains and elongates them. Cold working creates
residual stress in the sample at this location,
making it more susceptible to stress-corrosion
cracking.14 We took one sample of each coating
from each testing group and examined the center
notches under the Olympus Stereoscope.
A base 20X magnification was used initially to
perform a visual inspection, but on the Sprayon and
Anti-Seize samples, there was some heterogeneity
noticed in the surface finish. To study this further, A
40X magnification was used to analyze this further.
Small corrosion “volcanoes” (Figure 22a) were seen
at this level on the Anti-Seize samples, and an
extremely rough surface was found on the Sprayon
samples (Figure 22b).
Figure 20: Center and Edge images of two samples of Seymour (x20 zoom)
Figure 21: Center and Edge images of two samples of Sprayon (x20 zoom)
Figure 22: x40 Zoom images of: A. Anti-Seize (red) and B. Sprayon (green)
11
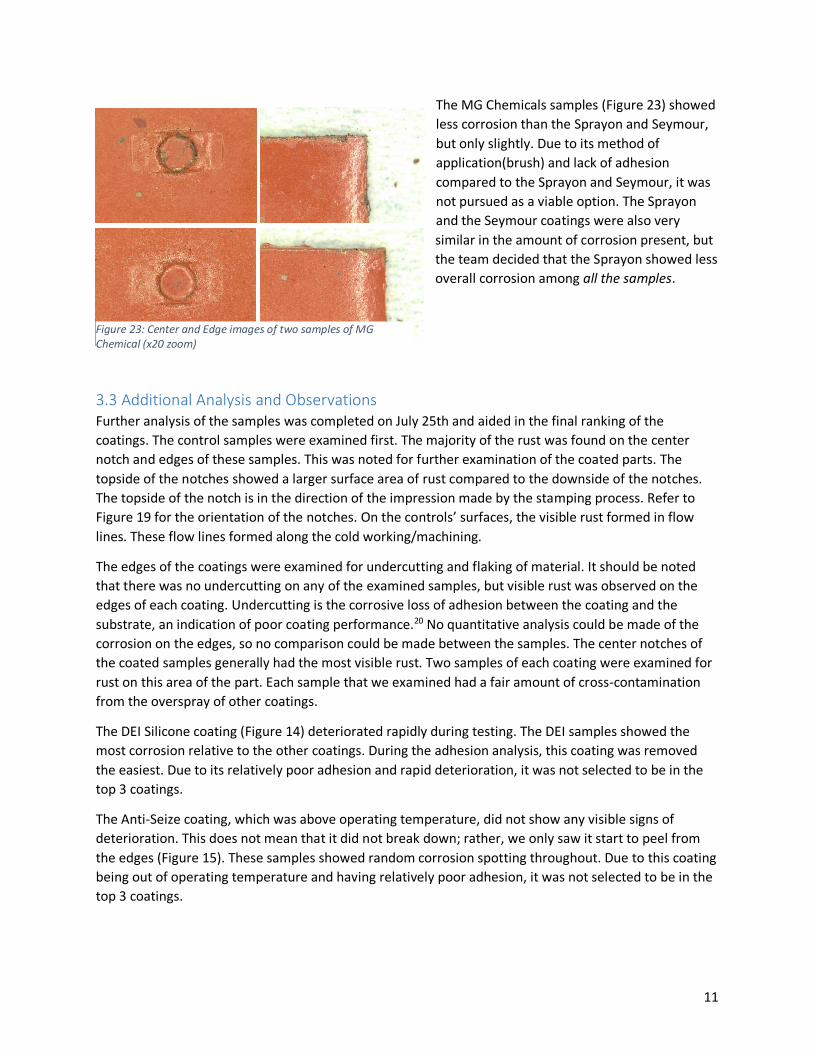
The MG Chemicals samples (Figure 23) showed
less corrosion than the Sprayon and Seymour,
but only slightly. Due to its method of
application(brush) and lack of adhesion
compared to the Sprayon and Seymour, it was
not pursued as a viable option. The Sprayon
and the Seymour coatings were also very
similar in the amount of corrosion present, but
the team decided that the Sprayon showed less
overall corrosion among all the samples.
3.3 Additional Analysis and Observations Further analysis of the samples was completed on July 25th and aided in the final ranking of the
coatings. The control samples were examined first. The majority of the rust was found on the center
notch and edges of these samples. This was noted for further examination of the coated parts. The
topside of the notches showed a larger surface area of rust compared to the downside of the notches.
The topside of the notch is in the direction of the impression made by the stamping process. Refer to
Figure 19 for the orientation of the notches. On the controls’ surfaces, the visible rust formed in flow
lines. These flow lines formed along the cold working/machining.
The edges of the coatings were examined for undercutting and flaking of material. It should be noted
that there was no undercutting on any of the examined samples, but visible rust was observed on the
edges of each coating. Undercutting is the corrosive loss of adhesion between the coating and the
substrate, an indication of poor coating performance.20 No quantitative analysis could be made of the
corrosion on the edges, so no comparison could be made between the samples. The center notches of
the coated samples generally had the most visible rust. Two samples of each coating were examined for
rust on this area of the part. Each sample that we examined had a fair amount of cross-contamination
from the overspray of other coatings.
The DEI Silicone coating (Figure 14) deteriorated rapidly during testing. The DEI samples showed the
most corrosion relative to the other coatings. During the adhesion analysis, this coating was removed
the easiest. Due to its relatively poor adhesion and rapid deterioration, it was not selected to be in the
top 3 coatings.
The Anti-Seize coating, which was above operating temperature, did not show any visible signs of
deterioration. This does not mean that it did not break down; rather, we only saw it start to peel from
the edges (Figure 15). These samples showed random corrosion spotting throughout. Due to this coating
being out of operating temperature and having relatively poor adhesion, it was not selected to be in the
top 3 coatings.
Figure 23: Center and Edge images of two samples of MG Chemical (x20 zoom)

12
The MG Chemicals (Figure 23) coating displayed flaking around the edges, specifically on the corners.
This coating had the worst flaking out of all the coatings, but it was not as easily removed as the DEI or
the Anti-Seize during the adhesion test, granting it a spot in the top three.
The Seymour (Figure 20) and the Sprayon (Figure 21) coating samples seemed to be relatively similar in
their corrosion levels. However, the Sprayon coating was harder to remove during the adhesion test.
However, the Sprayon coating showed more overspray than other samples, as shown in Figure 21.
These two were selected to be in the top three, above the performance of the MG chemicals.
13
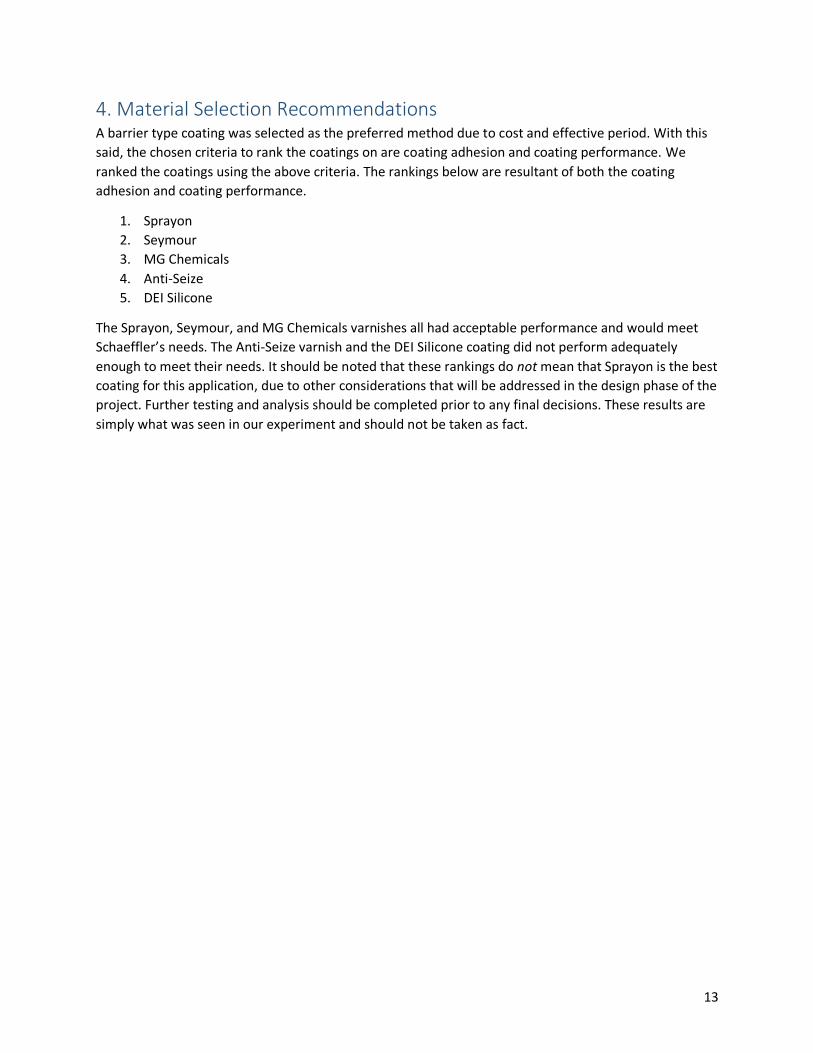
4. Material Selection Recommendations A barrier type coating was selected as the preferred method due to cost and effective period. With this
said, the chosen criteria to rank the coatings on are coating adhesion and coating performance. We
ranked the coatings using the above criteria. The rankings below are resultant of both the coating
adhesion and coating performance.
1. Sprayon
2. Seymour
3. MG Chemicals
4. Anti-Seize
5. DEI Silicone
The Sprayon, Seymour, and MG Chemicals varnishes all had acceptable performance and would meet
Schaeffler’s needs. The Anti-Seize varnish and the DEI Silicone coating did not perform adequately
enough to meet their needs. It should be noted that these rankings do not mean that Sprayon is the best
coating for this application, due to other considerations that will be addressed in the design phase of the
project. Further testing and analysis should be completed prior to any final decisions. These results are
simply what was seen in our experiment and should not be taken as fact.

14
5. Nozzle Research and Design
The outcome the design portion of the project is to
produce well-protected parts for Schaeffler motors. The
team has broken down this design into four categories: an
effective coating, an effective application system, quality
control, and project uncertainties. These have been
expanded upon in a visual mind map seen in Figures 24
through 28. The effective coating has already been
discussed. The rest of this report will focus on the effective
application system, specifically, an ideal nozzle design.
An effective coating needs to consider the application the coating is needed for, the coating type used,
the resulting coating characteristics, and the substrate characteristics. The application for Schaeffler is
corrosion prevention. The coating type for this project is a varnish (a form of barrier protection) as
opposed to silicone or paint. The varnish needs to be adhesive to perform adequately, as well as durable
to meet Schaeffler’s needs. The substrate is an E-Steel with the characteristics according to material NO
27-15 (DIN EN 10303: 2016-02).21
Figure 25: Mind Map – Effective Coating
Figure 24: Mind Map
15
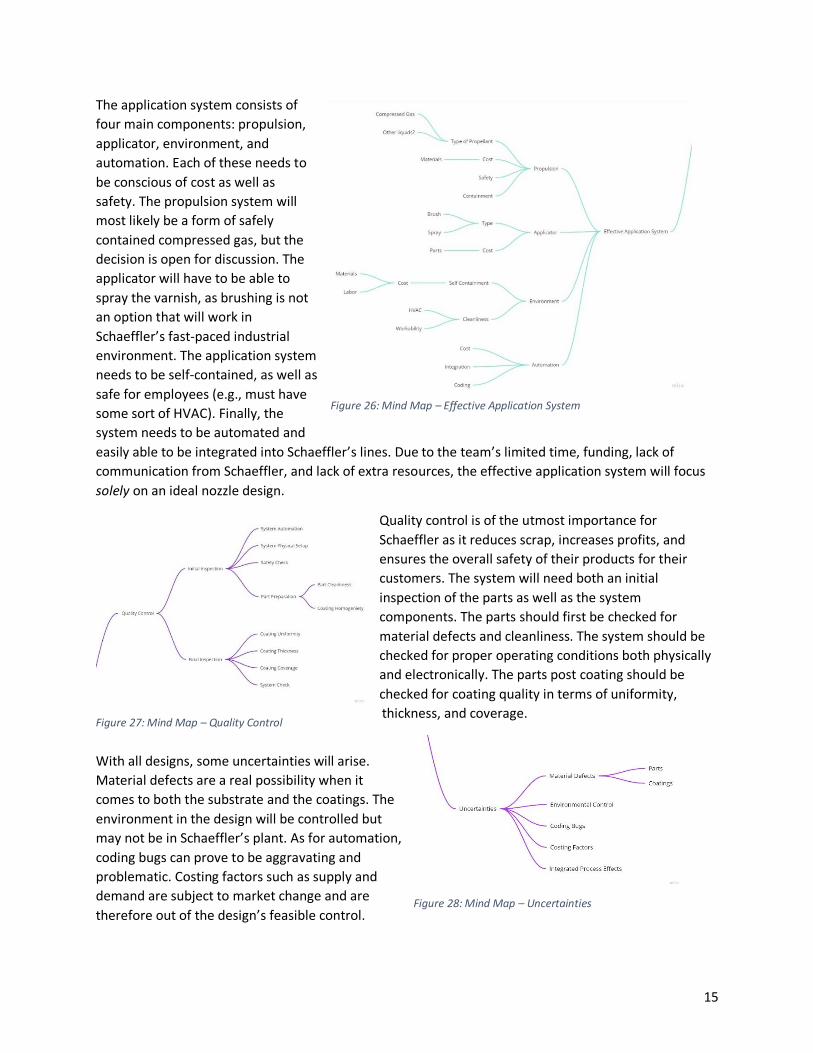
The application system consists of
four main components: propulsion,
applicator, environment, and
automation. Each of these needs to
be conscious of cost as well as
safety. The propulsion system will
most likely be a form of safely
contained compressed gas, but the
decision is open for discussion. The
applicator will have to be able to
spray the varnish, as brushing is not
an option that will work in
Schaeffler’s fast-paced industrial
environment. The application system
needs to be self-contained, as well as
safe for employees (e.g., must have
some sort of HVAC). Finally, the
system needs to be automated and
easily able to be integrated into Schaeffler’s lines. Due to the team’s limited time, funding, lack of
communication from Schaeffler, and lack of extra resources, the effective application system will focus
solely on an ideal nozzle design.
Quality control is of the utmost importance for
Schaeffler as it reduces scrap, increases profits, and
ensures the overall safety of their products for their
customers. The system will need both an initial
inspection of the parts as well as the system
components. The parts should first be checked for
material defects and cleanliness. The system should be
checked for proper operating conditions both physically
and electronically. The parts post coating should be
checked for coating quality in terms of uniformity,
thickness, and coverage.
With all designs, some uncertainties will arise.
Material defects are a real possibility when it
comes to both the substrate and the coatings. The
environment in the design will be controlled but
may not be in Schaeffler’s plant. As for automation,
coding bugs can prove to be aggravating and
problematic. Costing factors such as supply and
demand are subject to market change and are
therefore out of the design’s feasible control.
Figure 26: Mind Map – Effective Application System
Figure 28: Mind Map – Uncertainties
Figure 27: Mind Map – Quality Control
16
Due to a lack of input and communication from the Schaeffler team, we were unable to coordinate the
development of a final assembly system. Instead of developing a system that might not work in
Schaeffler’s setting, our team decided to focus on a key aspect of manufacturing the final product: The
application of the rust preventative to the stator surface. This mainly entails the ability of an operator to
use the shelf-available spray can versions of the material product. Our team decided to pursue a design
application that will work homogeneously within the constraints of the available spray can product.
After studying the available spray can products, specifically, Sprayon, we found that the spray nozzle
could be easily removed from the propellant assembly. This would allow our team to begin research on
and designing new nozzles to better optimize the end result of applying the material to the available
stator samples.
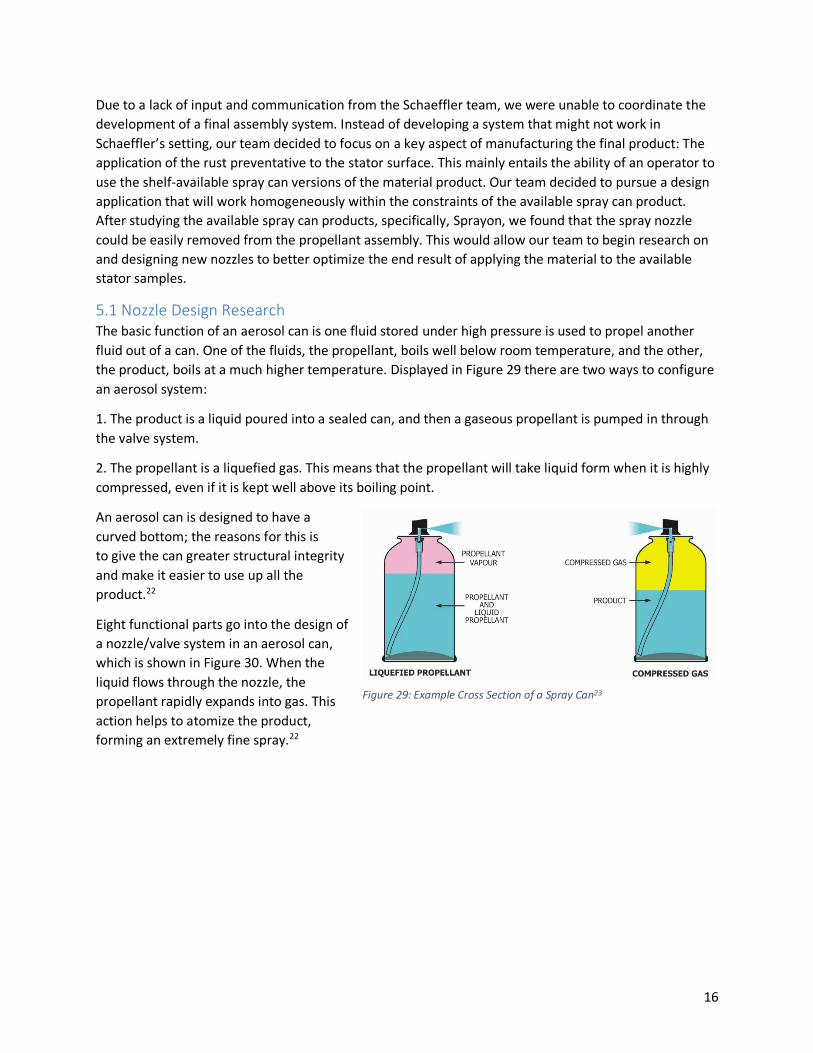
5.1 Nozzle Design Research The basic function of an aerosol can is one fluid stored under high pressure is used to propel another
fluid out of a can. One of the fluids, the propellant, boils well below room temperature, and the other,
the product, boils at a much higher temperature. Displayed in Figure 29 there are two ways to configure
an aerosol system:
1. The product is a liquid poured into a sealed can, and then a gaseous propellant is pumped in through
the valve system.
2. The propellant is a liquefied gas. This means that the propellant will take liquid form when it is highly
compressed, even if it is kept well above its boiling point.
An aerosol can is designed to have a
curved bottom; the reasons for this is
to give the can greater structural integrity
and make it easier to use up all the
product.22
Eight functional parts go into the design of
a nozzle/valve system in an aerosol can,
which is shown in Figure 30. When the
liquid flows through the nozzle, the
propellant rapidly expands into gas. This
action helps to atomize the product,
forming an extremely fine spray.22
Figure 29: Example Cross Section of a Spray Can23

17
The valve system in an aerosol can operates
on the principle of applying a pressure
difference to the environment; a visual
representation can be seen in Figure 31.
When the actuator is pressed, it depresses
the stem. This interrupts the sealing action of
the gasket and exposes the stem orifice to
the pressurized flow of product, thus opening
the valve. When the actuator is released, the
spring returns the stem to the sealed
position, closing the valve.24
These systems revolve around the fundamental
theories of fluid mechanics. The team researched
Bernoulli’s equation (Figure 32), the continuity equation
(𝐴1𝑉1 = 𝐴2𝑉2), and one-dimensional incompressible
flow to better understand how fluid flow is affected in
this system. Bernoulli’s equation demonstrates how the
velocity, area, and pressure of the system are related.
The necessary assumptions are steady 1D flow,
constant density, and no loss to friction.25 The
continuity equation is represented by the conservation
of mass with a constant density for incompressible, one-dimensional flow.
The team researched spray patterns to better understand how nozzle design affects them. There are
two main categories of nozzle designs: hydraulic nozzles and air atomizing nozzles
Within those two categories you can find the following spray patterns shown in Figure 33:
Figure 33: Spray Patterns: Flat Fan, Mist/Fog Fan, Full Cone, Hollow Cone, Straight Jet27
Figure 30: Example Spray Can Nozzle Assembly24
Figure 31: Actuation of a Spray Can Nozzle26
Figure 32: Bernoulli's Equation25
18
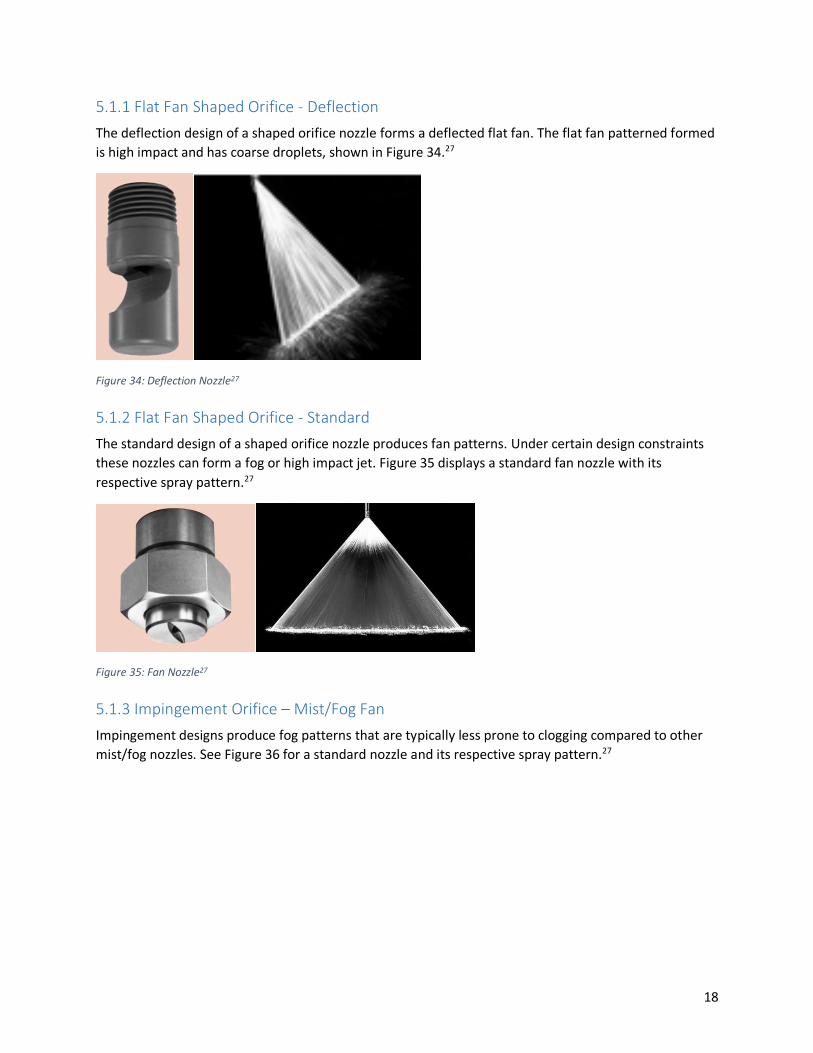
5.1.1 Flat Fan Shaped Orifice - Deflection
The deflection design of a shaped orifice nozzle forms a deflected flat fan. The flat fan patterned formed
is high impact and has coarse droplets, shown in Figure 34.27
Figure 34: Deflection Nozzle27
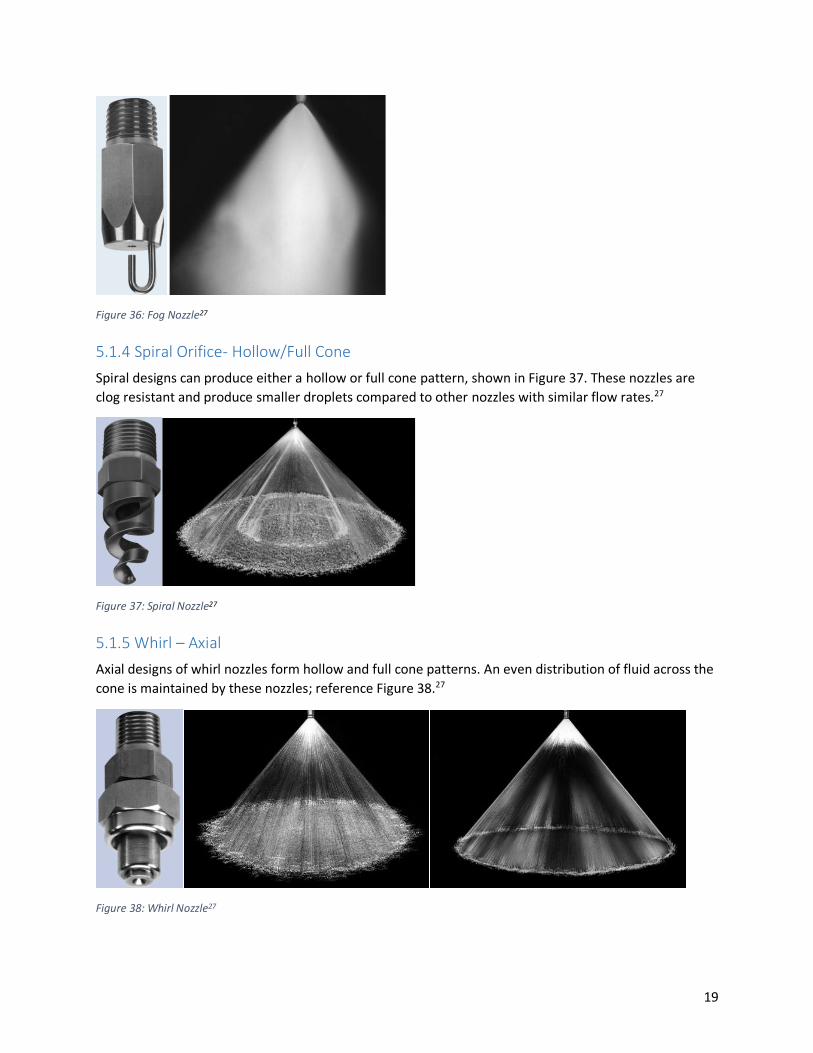
5.1.2 Flat Fan Shaped Orifice - Standard
The standard design of a shaped orifice nozzle produces fan patterns. Under certain design constraints
these nozzles can form a fog or high impact jet. Figure 35 displays a standard fan nozzle with its
respective spray pattern.27
Figure 35: Fan Nozzle27
5.1.3 Impingement Orifice – Mist/Fog Fan
Impingement designs produce fog patterns that are typically less prone to clogging compared to other
mist/fog nozzles. See Figure 36 for a standard nozzle and its respective spray pattern.27
19
Figure 36: Fog Nozzle27
5.1.4 Spiral Orifice- Hollow/Full Cone
Spiral designs can produce either a hollow or full cone pattern, shown in Figure 37. These nozzles are
clog resistant and produce smaller droplets compared to other nozzles with similar flow rates.27
Figure 37: Spiral Nozzle27
5.1.5 Whirl – Axial
Axial designs of whirl nozzles form hollow and full cone patterns. An even distribution of fluid across the
cone is maintained by these nozzles; reference Figure 38.27
Figure 38: Whirl Nozzle27
20
5.1.6 Whirl Tangential
A tangential design of a whirl nozzle produces both hollow and full cone patterns (Figure 39). The spray
pattern is at a 90⁰ to the original fluid flow.27
Figure 39: Whirl Tangential Nozzle27
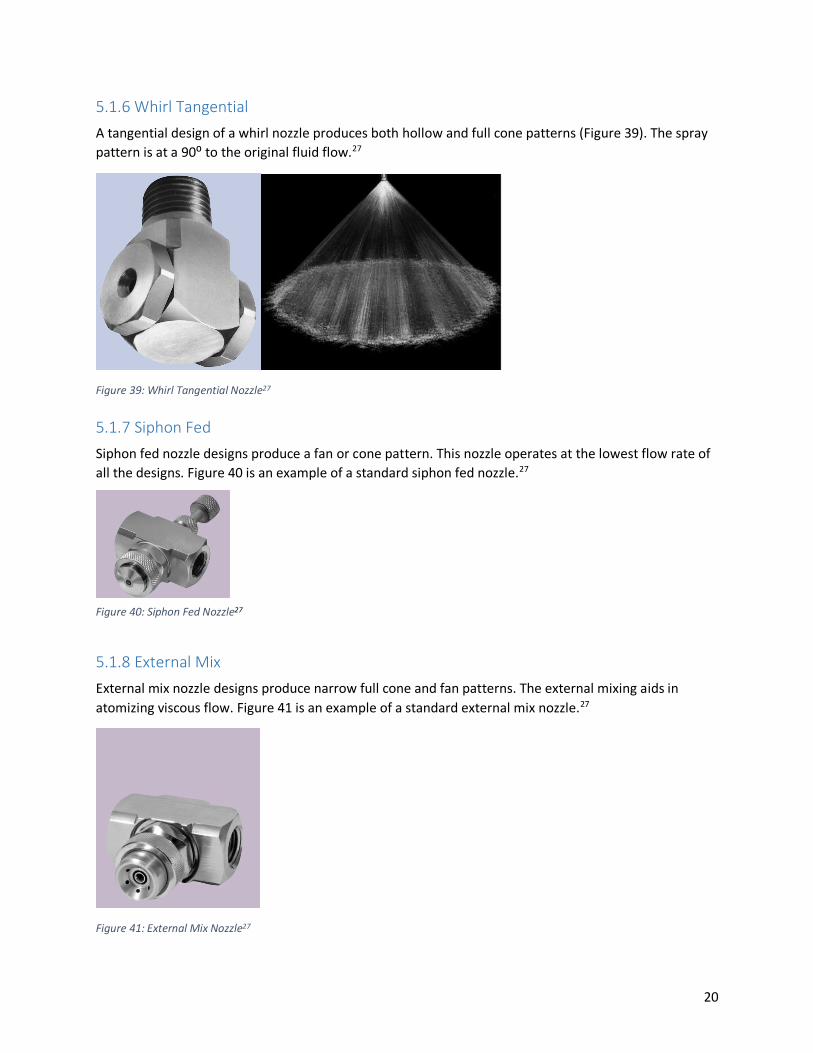
5.1.7 Siphon Fed
Siphon fed nozzle designs produce a fan or cone pattern. This nozzle operates at the lowest flow rate of
all the designs. Figure 40 is an example of a standard siphon fed nozzle.27
5.1.8 External Mix
External mix nozzle designs produce narrow full cone and fan patterns. The external mixing aids in
atomizing viscous flow. Figure 41 is an example of a standard external mix nozzle.27
Figure 41: External Mix Nozzle27
Figure 40: Siphon Fed Nozzle27

21
5.1.9 Internal Mix
Internal mix nozzle designs produce hollow cone, narrow and wide full cone, fan and deflect fan
patterns. This design in the most common and versatile air atomizing nozzle. Reference Figure 42 for
two different standard internal mix nozzles.27
Figure 42: Internal Mix Nozzle27
5.2 Manufacturing Process Selection As the team moved to the manufacturing phase of the project, we were faced with one daunting issue.
How were we going to properly fabricate such small, intricate parts? The team decided on additive
manufacturing as subtractive manufacturing methods would not be able to meet the size specifications
needed for the proper construction of the nozzles. There are seven 3D printing methods defined by
ASTM F2792-12A under Committee 42: Vat Photopolymerization (VPP), Powder Bed Fusion (PBF),
Material Jetting (MJ), Binder Jetting (BJ), Sheet Lamination (SL), Material Extrusion (MEX), and Directed
Energy Deposition (DED).28 VPP is the process of curing photopolymer-based resins using UV light. There
are two methods of curing, projection and scanning. Projection is curing an entire layer at a time by
shining the pattern on the resin at once. Scanning is tracing the pattern in each layer. The VPP printing
method provides the ability to print in micrometers and nanometers while maintaining structural
integrity and high-quality surface finish. Stereolithography (SLA) is the term for the scanning form of VPP
printing. SLA prints require post-processing measures to ensure the quality of the prints. The first step is
to rinse and soak the print in a solvent (isopropyl alcohol is commonly used) to remove any extra
uncured resin. Following the cleaning, the supports will need to be snipped away from the main print.
Lastly, the print can be cured in a UV light chamber to fully harden the finalized print. The team chose to
3D print the nozzle designs using the Form 2 Desktop 3D Stereolithography Printer.
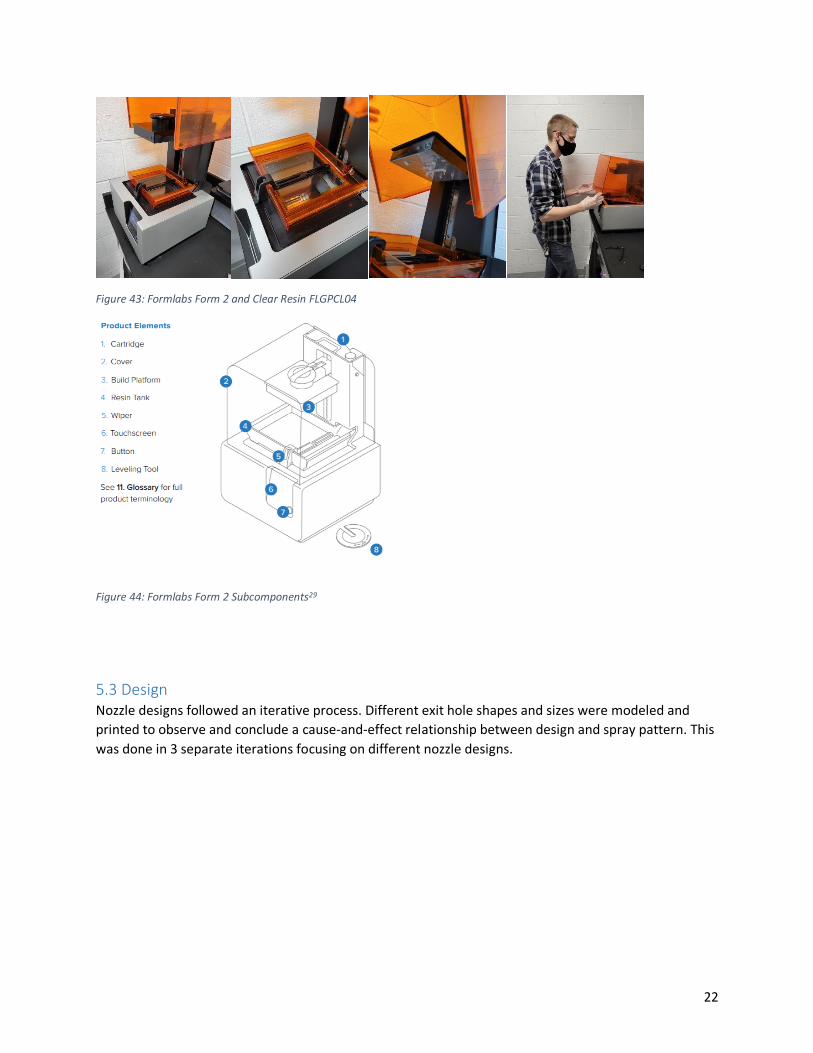
5.2.1 Printer
The Form 2 is a stereolithography printer that uses a 250 mW power, 140 micron spotsize, 405 nm
wavelength violet laser to cure photopolymer-based resins. It is capable of printing in 25, 50, and 100
microns for its layer thickness (axial resolution). The Form 2 uses a sliding peel process with a wiper to
level the resin in between layer printing.29 The resin used was the Formlabs Clear Resin FLGPCL04.30,31
Figure 43 shows the Form 2 printer used as well as one of the team members removing the printed
nozzles from the substrate. For a physical visualization of the Form 2, see Figure 44.
22
Figure 43: Formlabs Form 2 and Clear Resin FLGPCL04
5.3 Design Nozzle designs followed an iterative process. Different exit hole shapes and sizes were modeled and
printed to observe and conclude a cause-and-effect relationship between design and spray pattern. This
was done in 3 separate iterations focusing on different nozzle designs.
Figure 44: Formlabs Form 2 Subcomponents29

23
5.3.1 Design Verification
To legitimatize the team’s findings,
we needed to verify their
manufacturing method. The best way
to prove that the nozzle designs were
comparable was to reproduce
Sprayon’s stock nozzle. The team
used a software that measures
microscopic images based on known
distances. After obtaining the
measurements (Figure 45), the team
modeled the stock nozzle replica and
printed it using the Form 2. Both the
stock nozzle and the replica were
tested during each set of testing to
establish a control.
5.3.2 Iteration 1 Design Theory
The first iteration of nozzle design attempted various sizes and shapes of exit holes. These designs
include one nozzle intended to copy the manufacturer’s nozzle dimensions, two rectangular openings
intended to spray a flat pattern, two circular openings intended to spray a cone pattern, and a spiral
opening intended to spray a spiral pattern.
5.3.3 Iteration 1 Design Application
The spray used in application was Sprayon EL
601. This red colored spray is not seen in later
tests as it was ordered incorrectly but was the
only available spray at the time. The correct
spray, Sprayon EL 609, was used for following
iterations. All spraying was done 6 to 8 inches
away from the cardboard as specified in
application by Sprayon.
The results can be seen in Figure 46. The
pattern labeled yellow tip in all iterations
refers to the pattern made by the nozzle
provided by the manufacturer. Images of the
Figure 45: Measurements of the Sprayon Nozzle
Figure 46: Iteration 1 Results
24
nozzle tip models can be seen in Table 2. Cone #1 and Cone #2 with a circular exit hole resulted in cone
spray patterns. Larger exit holes as seen with Cone #2 atomize less and drip significantly. Cone #1 had
slight dripping. Flat #1 and Flat #2 with rectangular openings both clogged when used and sprayed in
sporadic spurts. The spiral nozzle tip sprayed in two directions. To the right it sprayed onto the carboard
in an elongated pattern. To the left it sprayed in a fine mist at a right angle away from the cardboard.
Lastly, the nozzle intended to be a copy of the yellow nozzle failed to print correctly and would be
attempted again in Iteration 2. All but three nozzles were clogged after use and needed to be cleaned to
be used again.
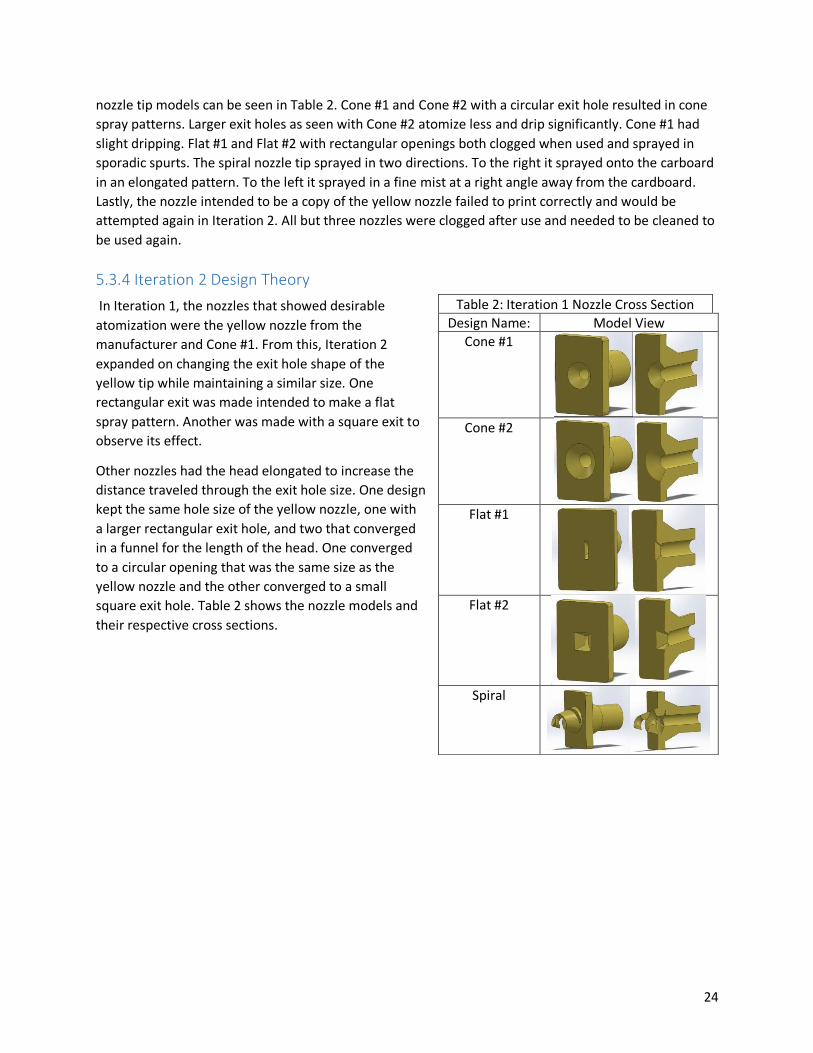
5.3.4 Iteration 2 Design Theory
In Iteration 1, the nozzles that showed desirable
atomization were the yellow nozzle from the
manufacturer and Cone #1. From this, Iteration 2
expanded on changing the exit hole shape of the
yellow tip while maintaining a similar size. One
rectangular exit was made intended to make a flat
spray pattern. Another was made with a square exit to
observe its effect.
Other nozzles had the head elongated to increase the
distance traveled through the exit hole size. One design
kept the same hole size of the yellow nozzle, one with
a larger rectangular exit hole, and two that converged
in a funnel for the length of the head. One converged
to a circular opening that was the same size as the
yellow nozzle and the other converged to a small
square exit hole. Table 2 shows the nozzle models and
their respective cross sections.
Table 2: Iteration 1 Nozzle Cross Section
Design Name: Model View
Cone #1
Cone #2
Flat #1
Flat #2
Spiral

25
5.3.5 Iteration 2 Design Application
Figure 47: Iteration 2 Results
Sprayon EL 609 was used during application. Spraying was performed at both between 6 to 8 inches
away and 10 to 12 inches away in each pattern grouping. This was done to check for differences when
using nozzles with elongated heads.
All nozzles sprayed cone shaped patterns with variations, shown in Figure 47. The copy of the yellow tip
performed similarly, as expected. The rectangular exit hole sprayed a cone shaped pattern with a tail
end pointing downward. Most of the spray exited the end with no influence from the tip. This would
indicate that nozzles intending to spray a flat pattern would need to be redesigned in Iteration 3. The
square spray tip resulted in a cone pattern with distinct rounded corners.
The elongated heads were sprayed from 10 to 12 inches away and 6 to 8 inches away in each grouping.
Those that were sprayed closer showed visual dripping. All patterns sprayed in a cone pattern with no
notable variation. Converging the exit hole through the elongated head did not produce a visually
different result when compared to nozzles that did not converge. Figure 48 shows the nozzles after
testing; Table 3 displays the nozzle models and their cross sections.
Figure 48: No Clogging Iteration 2
26
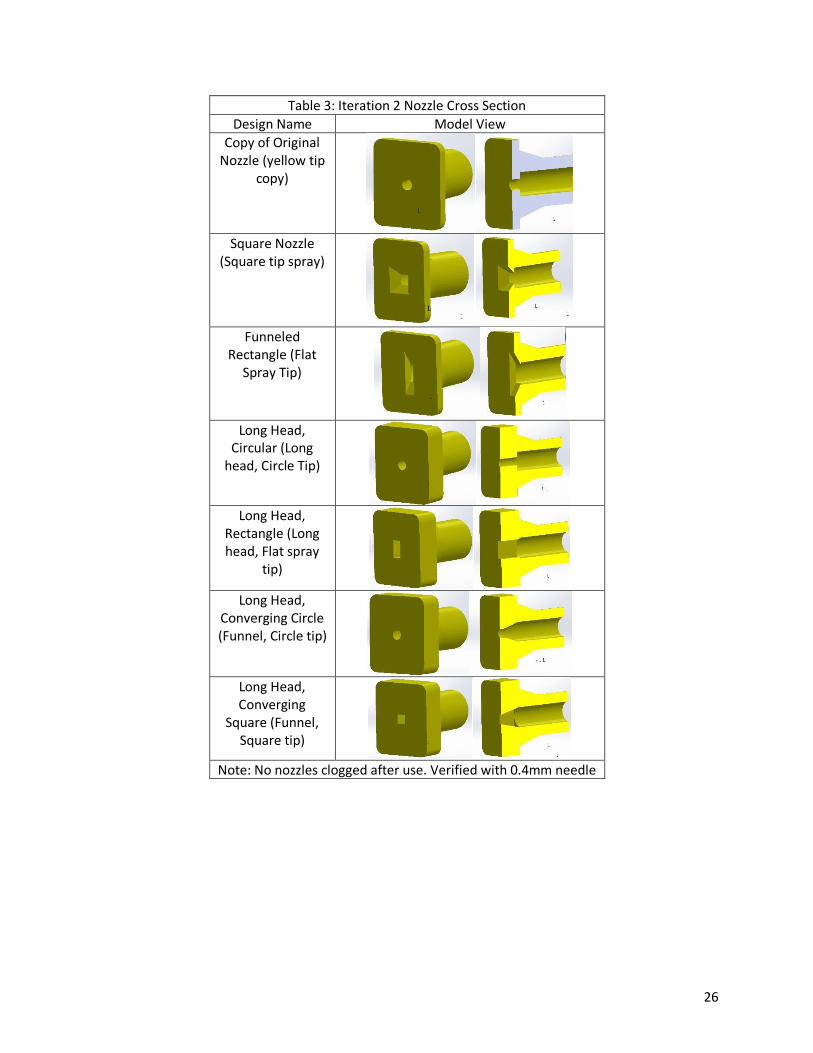
Table 3: Iteration 2 Nozzle Cross Section
Design Name Model View
Copy of Original Nozzle (yellow tip
copy)
Square Nozzle
(Square tip spray)
Funneled
Rectangle (Flat Spray Tip)
Long Head,
Circular (Long head, Circle Tip)
Long Head,
Rectangle (Long head, Flat spray
tip)
Long Head, Converging Circle (Funnel, Circle tip)
Long Head, Converging
Square (Funnel, Square tip)
Note: No nozzles clogged after use. Verified with 0.4mm needle

27
5.3.6 Iteration 3 Design Theory
Design for Iteration 3 focused on creating a flat spray pattern and a deflection nozzle design. Converging
the exit hole was also attempted for a circular and oval shaped exit. Adjustments to the flat spray
nozzles were done in different angle increments for the angled cut in the nozzle head. This cut caused
the spray to hit its slope and deflect in a manner to create a flat spray pattern. Similarly, deflection
nozzles were designed with a sloped surface for the spray to deflect in a desired direction.
5.3.7 Iteration 3 Design Application
Sprayon EL 609 was used during application. Spraying
was done 6 to 8 inches away from the cardboard.
deflection nozzles were oriented so that they spray to
the left of where the can is aimed. These spots ae
shown in Figure 49.
The continuously converging circle nozzle tip and the
oval counterpart both resulted in a cone spray
pattern. The oval nozzle applied thicker and had small
amounts of dripping.
The 45-degree, 20-degree, and 15-degree flats all
made a flat spray pattern as intended. The 45-degree
pattern was the widest and the 15 degree was the
thinnest.
The results for Iteration 3 are shown in Figure 51.
Deflection nozzles deflected as intended. The short
and long tips sprayed in a crescent shape to the left
of the position sprayed. The short nozzle with a
concave surface formed a wider crescent shape with
a mirrored orientation compared to the other
deflection tips. None of the nozzles in Iteration 3
clogged after initial testing, proved in Figure 50. Table
4 contains images of the nozzle models and their
cross sections.
Figure 51: Iteration 3 Results
Figure 49: Iteration 3 Deflection Nozzles
Figure 50: Iteration 3 No Clogging
28
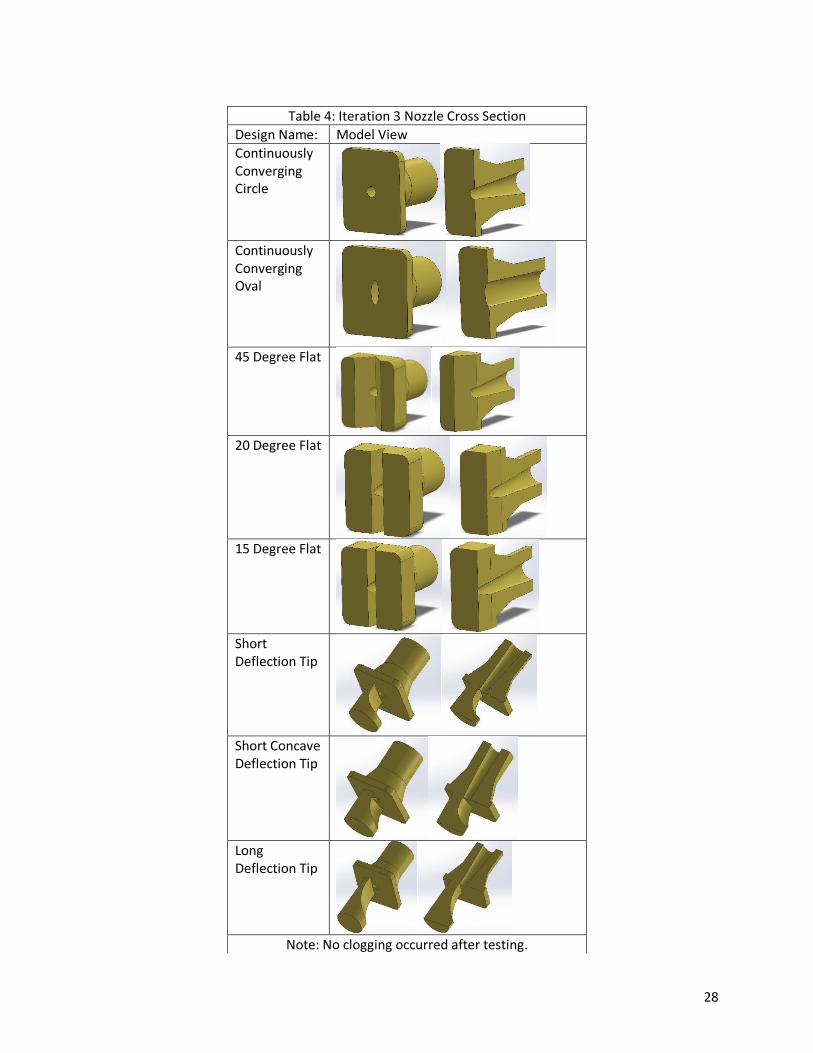
Table 4: Iteration 3 Nozzle Cross Section
Design Name: Model View
Continuously Converging Circle
Continuously Converging Oval
45 Degree Flat
20 Degree Flat
15 Degree Flat
Short Deflection Tip
Short Concave Deflection Tip
Long Deflection Tip
Note: No clogging occurred after testing.
29
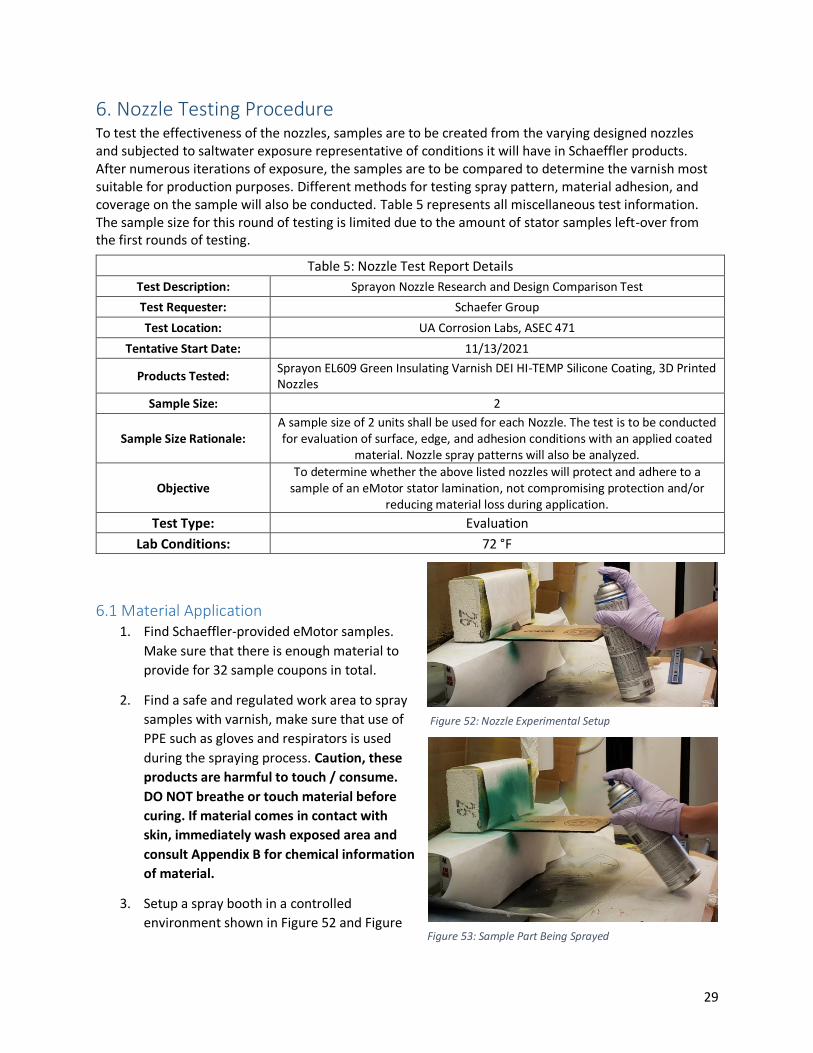
6. Nozzle Testing Procedure To test the effectiveness of the nozzles, samples are to be created from the varying designed nozzles and subjected to saltwater exposure representative of conditions it will have in Schaeffler products. After numerous iterations of exposure, the samples are to be compared to determine the varnish most suitable for production purposes. Different methods for testing spray pattern, material adhesion, and coverage on the sample will also be conducted. Table 5 represents all miscellaneous test information. The sample size for this round of testing is limited due to the amount of stator samples left-over from the first rounds of testing.
6.1 Material Application 1. Find Schaeffler-provided eMotor samples.
Make sure that there is enough material to
provide for 32 sample coupons in total.
2. Find a safe and regulated work area to spray
samples with varnish, make sure that use of
PPE such as gloves and respirators is used
during the spraying process. Caution, these
products are harmful to touch / consume.
DO NOT breathe or touch material before
curing. If material comes in contact with
skin, immediately wash exposed area and
consult Appendix B for chemical information
of material.
3. Setup a spray booth in a controlled
environment shown in Figure 52 and Figure
Table 5: Nozzle Test Report Details
Test Description: Sprayon Nozzle Research and Design Comparison Test
Test Requester: Schaefer Group
Test Location: UA Corrosion Labs, ASEC 471
Tentative Start Date: 11/13/2021
Products Tested: Sprayon EL609 Green Insulating Varnish DEI HI-TEMP Silicone Coating, 3D Printed Nozzles
Sample Size: 2
Sample Size Rationale: A sample size of 2 units shall be used for each Nozzle. The test is to be conducted for evaluation of surface, edge, and adhesion conditions with an applied coated
material. Nozzle spray patterns will also be analyzed.
Objective To determine whether the above listed nozzles will protect and adhere to a
sample of an eMotor stator lamination, not compromising protection and/or reducing material loss during application.
Test Type: Evaluation
Lab Conditions: 72 °F
Figure 52: Nozzle Experimental Setup
Figure 53: Sample Part Being Sprayed

30
53; in this case, a fume hood was used. Ensure that the Sprayon material is applied within a
range of 70°F-90°F10.
Refer to Appendix B for further manufacturer information.
4. Degrease and clean intended samples. Ensure samples are dried before material application.
5. For each Nozzle, spray material onto two sample coupons.
Ensure a distance of 8-in is used between the part and the spray
can. Ensure that all parts are oriented in a similar fashion when
material is applied. Figure 53 is an example of coating
application.
6. Label nozzles (Figure 54) and take note of spray pattern,
amount of spray passes used, and any unusual events. Separate
parts based off of the nozzle used to apply material. See Table 6
for nozzle identification.
7. Allow material to dry on sample for 15 seconds before handling.
8. Analyze samples under a microscope once the material has
cured.
9. This portion of the procedure is now complete.
6.2 Saltwater Corrosion Testing Refer to the test procedure in section 2.2.2. Use same experimental setup to test stator samples with
Sprayon material. Make note to capture surface images of samples under a microscope before and after
testing them.
Table 6: Nozzle Identification and Description
ID # Description ID # Description
1 Original Nozzle 9 Continuously Converging Circle
2 Copy of Original Nozzle 10 Continuously Converging Oval
3 Square Nozzle 11 45 Degree Flat
4 Funneled Rectangle 12 20 Degree Flat
5 Long Head, Circular 13 15 Degree Flat
6 Long Head, Rectangle 14 Short Deflection Tip
7 Long Head, Converging Square 15 Short Concave Deflecting Tip
8 Long Head, Converging Circle 16 Long Deflection Tip
Figure 54: Nozzle Identification
31
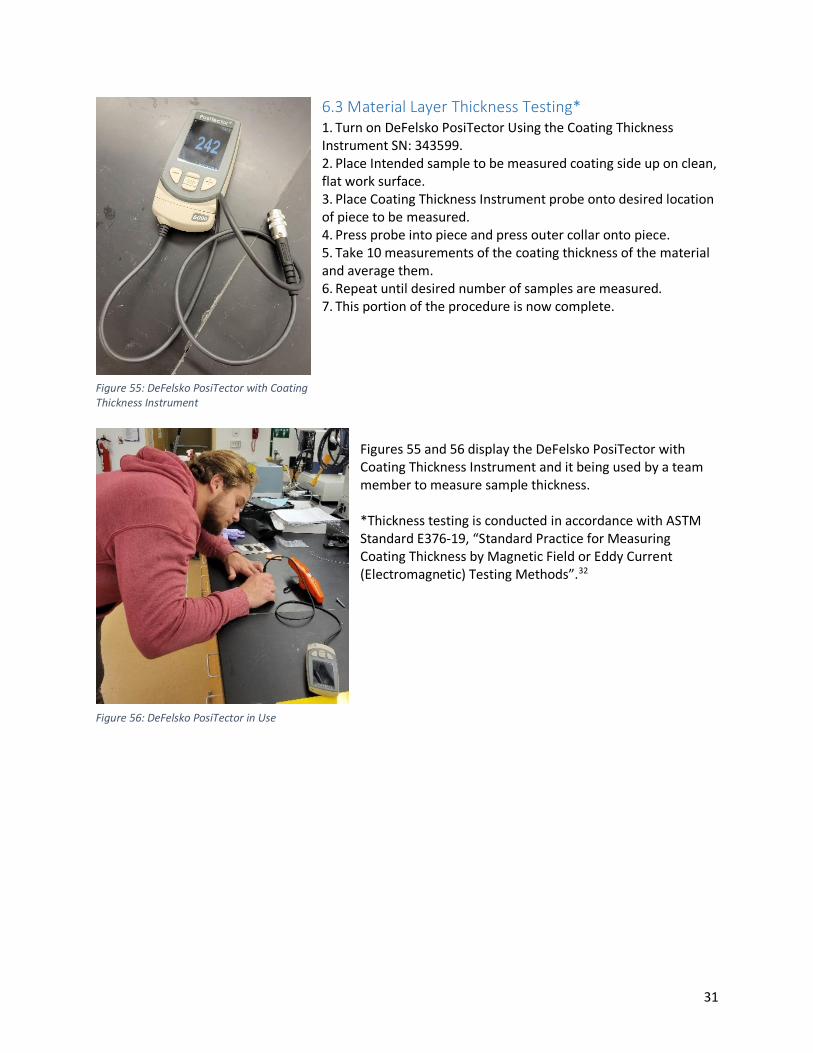
6.3 Material Layer Thickness Testing* 1. Turn on DeFelsko PosiTector Using the Coating Thickness Instrument SN: 343599. 2. Place Intended sample to be measured coating side up on clean, flat work surface. 3. Place Coating Thickness Instrument probe onto desired location of piece to be measured. 4. Press probe into piece and press outer collar onto piece. 5. Take 10 measurements of the coating thickness of the material and average them. 6. Repeat until desired number of samples are measured. 7. This portion of the procedure is now complete.
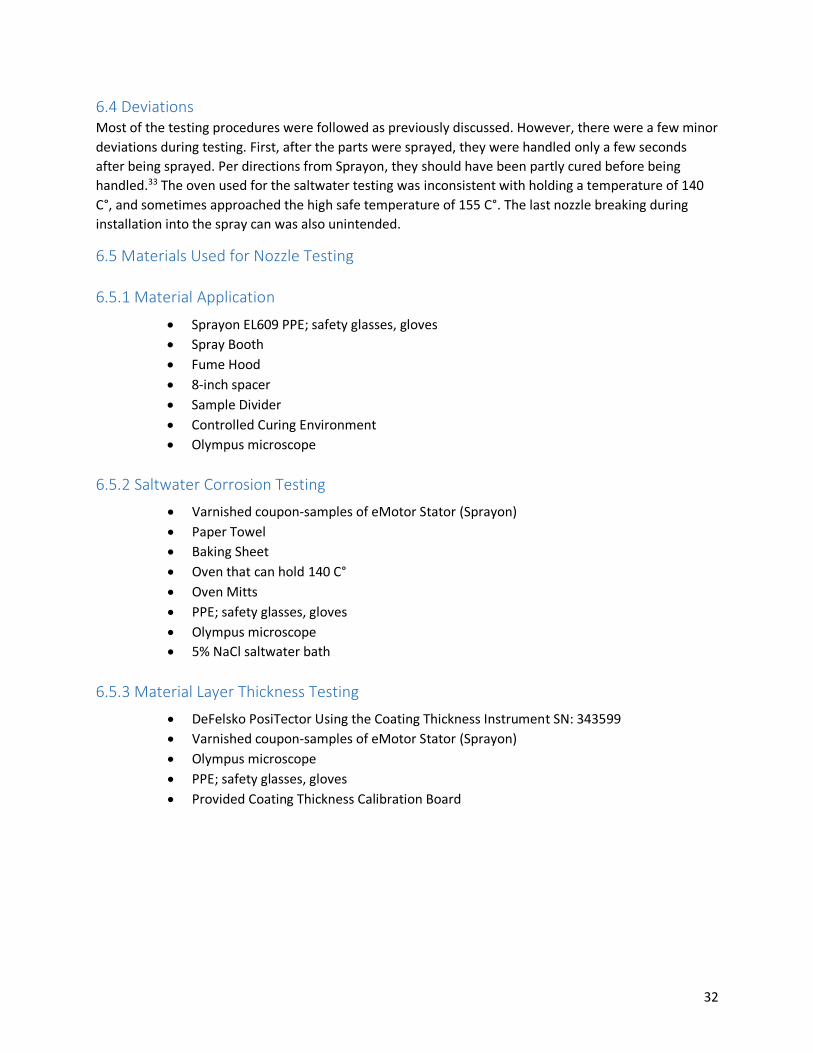
Figures 55 and 56 display the DeFelsko PosiTector with Coating Thickness Instrument and it being used by a team member to measure sample thickness. *Thickness testing is conducted in accordance with ASTM Standard E376-19, “Standard Practice for Measuring Coating Thickness by Magnetic Field or Eddy Current (Electromagnetic) Testing Methods”.32
Figure 55: DeFelsko PosiTector with Coating Thickness Instrument
Figure 56: DeFelsko PosiTector in Use
32
6.4 Deviations Most of the testing procedures were followed as previously discussed. However, there were a few minor
deviations during testing. First, after the parts were sprayed, they were handled only a few seconds
after being sprayed. Per directions from Sprayon, they should have been partly cured before being
handled.33 The oven used for the saltwater testing was inconsistent with holding a temperature of 140
C°, and sometimes approached the high safe temperature of 155 C°. The last nozzle breaking during
installation into the spray can was also unintended.
6.5 Materials Used for Nozzle Testing
6.5.1 Material Application
• Sprayon EL609 PPE; safety glasses, gloves
• Spray Booth
• Fume Hood
• 8-inch spacer
• Sample Divider
• Controlled Curing Environment
• Olympus microscope
6.5.2 Saltwater Corrosion Testing
• Varnished coupon-samples of eMotor Stator (Sprayon)
• Paper Towel
• Baking Sheet
• Oven that can hold 140 C°
• Oven Mitts
• PPE; safety glasses, gloves
• Olympus microscope
• 5% NaCl saltwater bath
6.5.3 Material Layer Thickness Testing
• DeFelsko PosiTector Using the Coating Thickness Instrument SN: 343599
• Varnished coupon-samples of eMotor Stator (Sprayon)
• Olympus microscope
• PPE; safety glasses, gloves
• Provided Coating Thickness Calibration Board
33
7. Nozzle Testing Results After running multiple tests, the team started a discussion on how to interpret the results of the
experiment. In total, the team had three major concerns to analyze. These include nozzle performance
during application, material coating thickness, and the comparative saltwater test. To better narrow
down the results, the application performance, and coating thickness will be examined.
The results of each test will be explained in the further detailing sections, along with an interesting phenomenon observed during the thickness testing.
7.1 Application The criteria for a nozzle to have unacceptable application testing is if it clogs, has a non-uniform spray
pattern, or is not optimized for an 8-in spray distance. If any of these occur, it would interfere with the
application of material. Clogging directly inhibits spray from leaving the nozzle. Non-uniformity in spray
pattern is when portions of the pattern have material apply much thicker than other sections. This
usually causes dripping in sections of the pattern that receive more particles and other sections receive
less. Nozzles are acceptable if they can coat the sample at a distance of 8 inches optimally which means
that a few passes of the spraying should be sufficient. All nozzles are acceptable in this regard except for
Nozzles #3, 4, 14, and 16. A visual assessment of these nozzle application can be seen below in Table 7.
Nozzles #3 and 4 were considered unacceptable due to non-uniform spray patterns. Nozzle #3 had an
irregular cone pattern with rounded corners forming a square like shape. Spray applied thicker near
these rounded corners and caused dripping. Unless the object being sprayed was within the center of
the square shape, it would receive an uneven amount of material. Nozzle #4 sprayed a cone pattern
with a tail. The tail is a vertical line extending below the circle formed from the cone pattern due to the
rectangular exit hole shape.
Nozzle #14 was the short deflection tip. It deflected material away from the direction the can was aimed
as intended, however it creates a large spray pattern. At 8 inches from the part, only a small portion of
particles applied to the surface. 7 passes of the can were needed to apply enough material to cover the
part while other nozzles only needed 2 to 3 passes. This nozzle was considered unacceptable because it
is not optimized for an 8-in spray distance.
Nozzle #16 was considered unacceptable due to clogging. After attempting to make it functional, parts
of the nozzle broke off making it non-functional. All nozzles should be considered when analyzing data
with the other testing results.

34
Table 7: Nozzle Application Observations
Sample Description Number of Passes
Intended Spray Pattern
Actual Spray Pattern
Clogging Uniform
Spray Pattern
1 Original Nozzle
2 Cone Cone No Yes
2 Copy of Original Nozzle
2 Cone Cone No Yes
3 Square Nozzle
2 Experimental Irregular
Cone No No
4 Funneled Rectangle
2 Flat Cone with tail No No
5 Long Head,
Circular 2 Cone Cone No Yes
6 Long Head, Rectangle
2 Cone Cone No Yes
7 Long Head, Converging
Square 2 Experimental Cone No Yes
8 Long Head, Converging
Circle 2 Cone Cone No Yes
9 Continuously Converging
Circle 2 Cone Cone No Yes
10 Continuously Converging
Oval 2 Experimental Cone No Yes
11 45 Degree Flat 2 Flat Flat No Yes
12 20 Degree Flat 3 Flat Flat No Yes
13 15 Degree Flat 3 Flat Flat No Yes
14 Short
Deflection Tip 7 Deflection Deflection No Yes
15 Short Concave Deflecting Tip
2 Deflection Deflection No Yes
16 Long
Deflection Tip N/A Deflection N/A Yes N/A
35
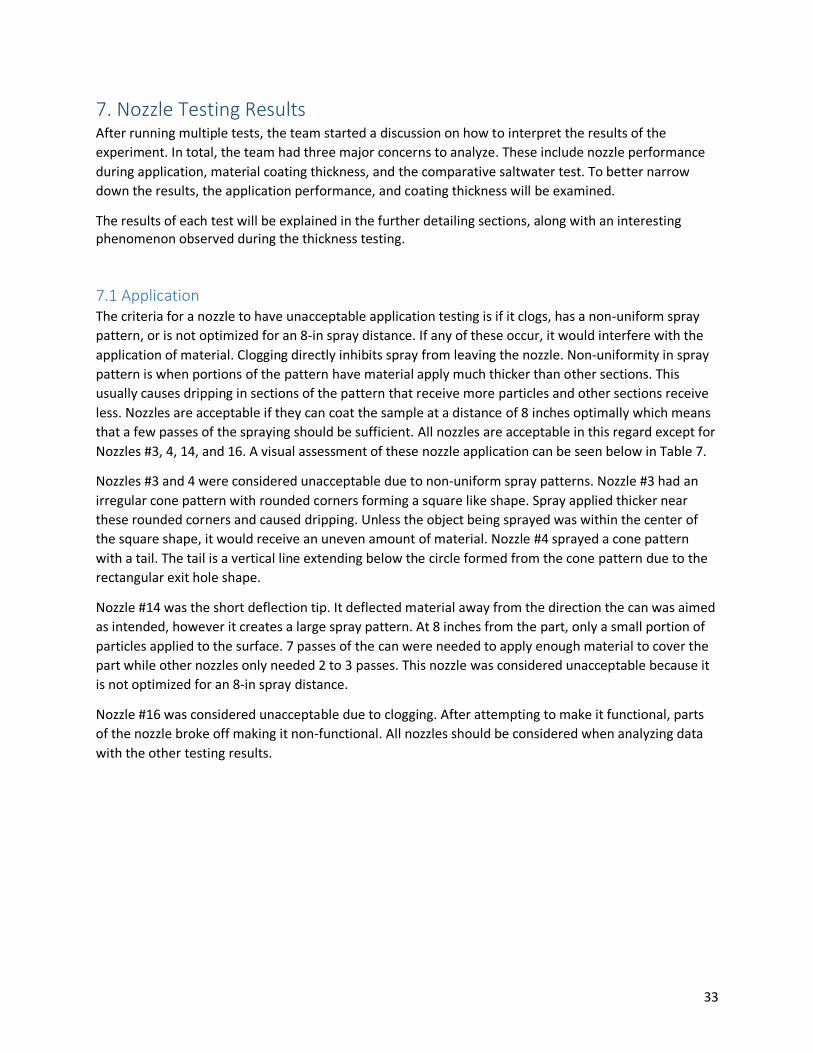
7.2 Thickness To ensure DeFelsko PosiTector’s accuracy, the team used a calibration board of various materials with
predefined thicknesses (shown in Figure 57). This calibration board came from the manufacturer. The
instrument seemed to be reading a bit low compared to the calibrated thicknesses. Table 8 shows the
expected calibration values and the measured values. Due to the consistently low readings during the
calibration, the team decided to correct the values. These corrected values were determined by adding
the average percent error (3.2%) to every measured value.
Figure 57: Calibration Card for DeFelsko PosiTector
Table 8: DeFelsko PosiTector Calibration
Expected (μm)
Measurement 1 (μm)
Measurement 2 (μm)
Measurement 3 (μm)
Measurement 4 (μm)
Average (μm)
125 118 120 122 118 119.5
250 240 240 240 240 240
500 496 492 494 494 494
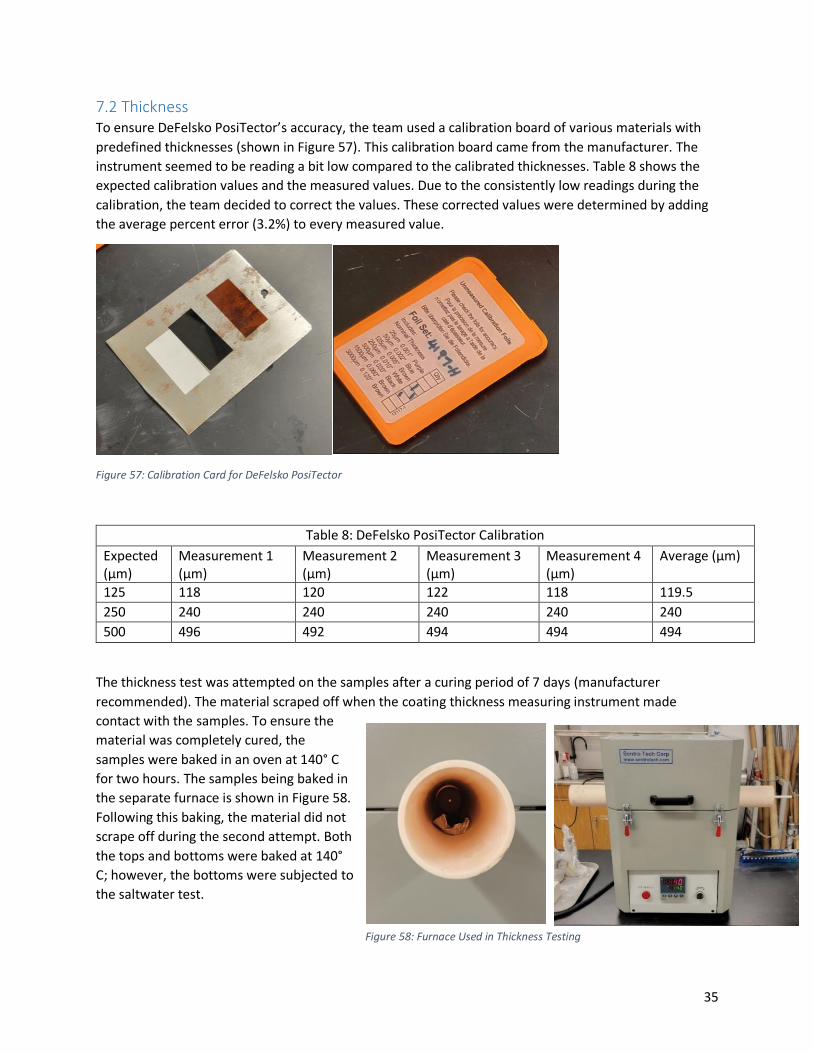
The thickness test was attempted on the samples after a curing period of 7 days (manufacturer
recommended). The material scraped off when the coating thickness measuring instrument made
contact with the samples. To ensure the
material was completely cured, the
samples were baked in an oven at 140° C
for two hours. The samples being baked in
the separate furnace is shown in Figure 58.
Following this baking, the material did not
scrape off during the second attempt. Both
the tops and bottoms were baked at 140°
C; however, the bottoms were subjected to
the saltwater test.
Figure 58: Furnace Used in Thickness Testing
36
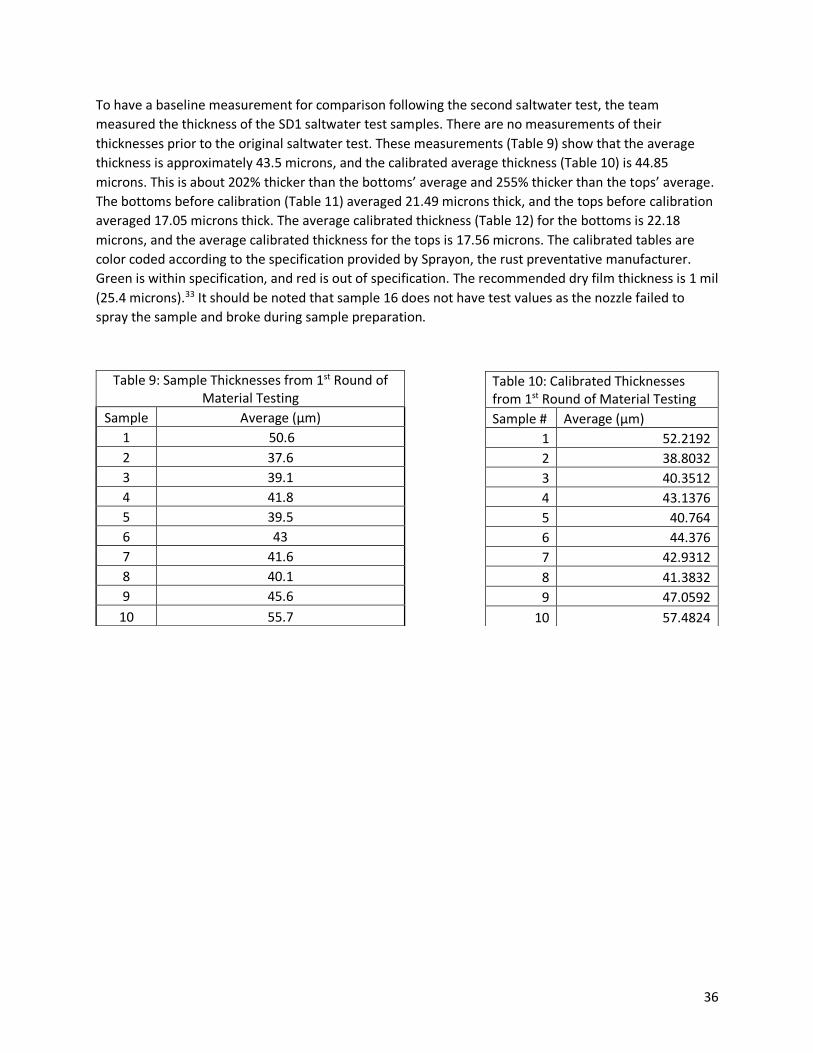
To have a baseline measurement for comparison following the second saltwater test, the team
measured the thickness of the SD1 saltwater test samples. There are no measurements of their
thicknesses prior to the original saltwater test. These measurements (Table 9) show that the average
thickness is approximately 43.5 microns, and the calibrated average thickness (Table 10) is 44.85
microns. This is about 202% thicker than the bottoms’ average and 255% thicker than the tops’ average.
The bottoms before calibration (Table 11) averaged 21.49 microns thick, and the tops before calibration
averaged 17.05 microns thick. The average calibrated thickness (Table 12) for the bottoms is 22.18
microns, and the average calibrated thickness for the tops is 17.56 microns. The calibrated tables are
color coded according to the specification provided by Sprayon, the rust preventative manufacturer.
Green is within specification, and red is out of specification. The recommended dry film thickness is 1 mil
(25.4 microns).33 It should be noted that sample 16 does not have test values as the nozzle failed to
spray the sample and broke during sample preparation.
Table 10: Calibrated Thicknesses from 1st Round of Material Testing
Sample # Average (μm)
1 52.2192
2 38.8032
3 40.3512
4 43.1376
5 40.764
6 44.376
7 42.9312
8 41.3832
9 47.0592
10 57.4824
Table 9: Sample Thicknesses from 1st Round of Material Testing
Sample Average (μm)
1 50.6
2 37.6
3 39.1
4 41.8
5 39.5
6 43
7 41.6
8 40.1
9 45.6
10 55.7
37
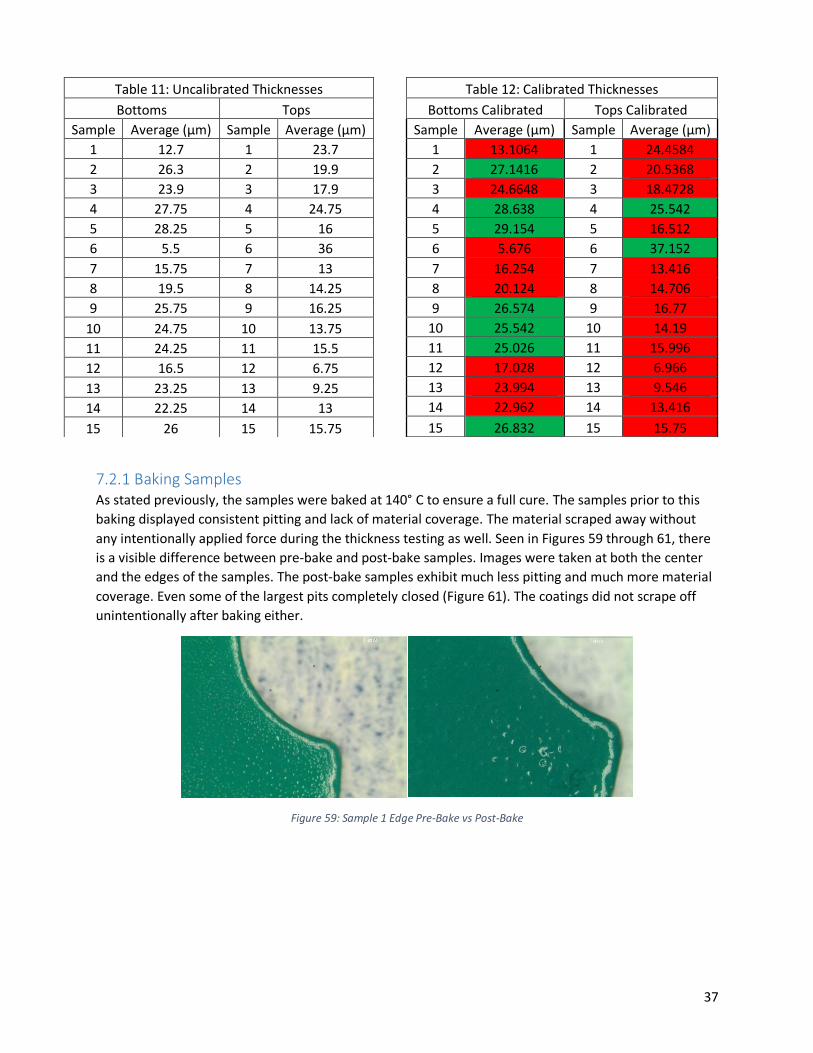
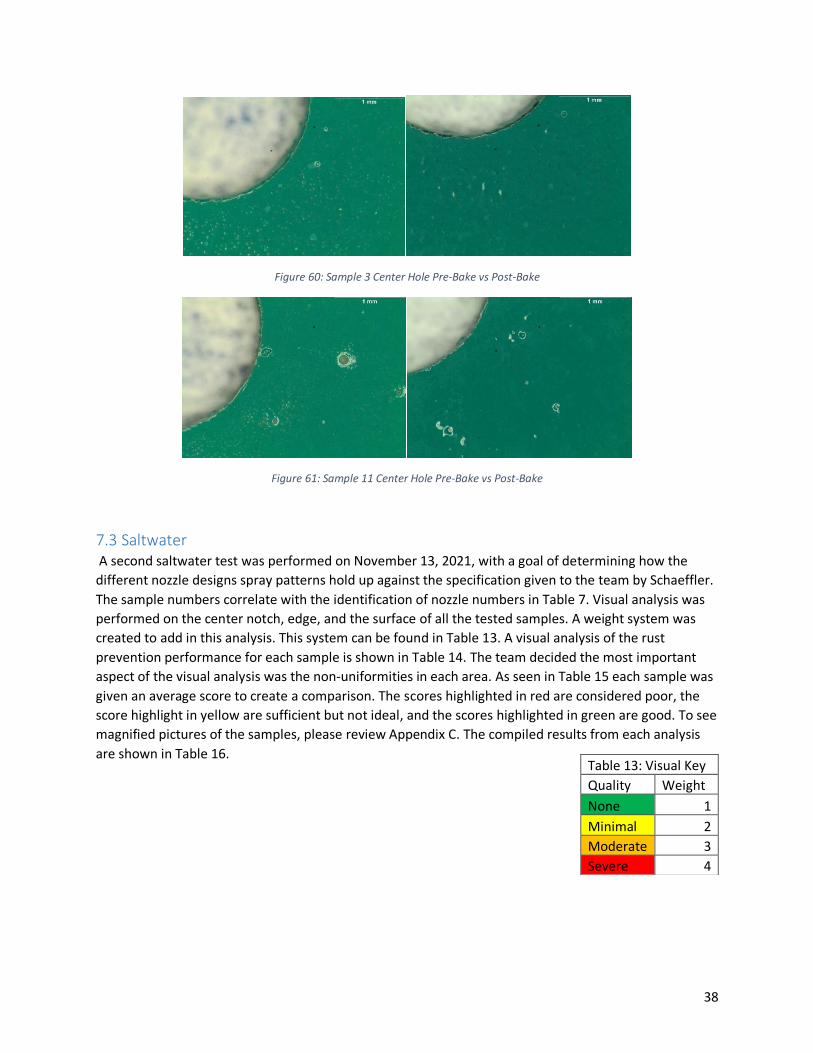
7.2.1 Baking Samples As stated previously, the samples were baked at 140° C to ensure a full cure. The samples prior to this
baking displayed consistent pitting and lack of material coverage. The material scraped away without
any intentionally applied force during the thickness testing as well. Seen in Figures 59 through 61, there
is a visible difference between pre-bake and post-bake samples. Images were taken at both the center
and the edges of the samples. The post-bake samples exhibit much less pitting and much more material
coverage. Even some of the largest pits completely closed (Figure 61). The coatings did not scrape off
unintentionally after baking either.
Figure 59: Sample 1 Edge Pre-Bake vs Post-Bake
Table 11: Uncalibrated Thicknesses
Bottoms Tops
Sample Average (μm) Sample Average (μm)
1 12.7 1 23.7
2 26.3 2 19.9
3 23.9 3 17.9
4 27.75 4 24.75
5 28.25 5 16
6 5.5 6 36
7 15.75 7 13
8 19.5 8 14.25
9 25.75 9 16.25
10 24.75 10 13.75
11 24.25 11 15.5
12 16.5 12 6.75
13 23.25 13 9.25
14 22.25 14 13
15 26 15 15.75
Table 12: Calibrated Thicknesses
Bottoms Calibrated Tops Calibrated
Sample Average (μm) Sample Average (μm)
1 13.1064 1 24.4584
2 27.1416 2 20.5368
3 24.6648 3 18.4728
4 28.638 4 25.542
5 29.154 5 16.512
6 5.676 6 37.152
7 16.254 7 13.416
8 20.124 8 14.706
9 26.574 9 16.77
10 25.542 10 14.19
11 25.026 11 15.996
12 17.028 12 6.966
13 23.994 13 9.546
14 22.962 14 13.416
15 26.832 15 15.75
38
Figure 60: Sample 3 Center Hole Pre-Bake vs Post-Bake
Figure 61: Sample 11 Center Hole Pre-Bake vs Post-Bake
7.3 Saltwater A second saltwater test was performed on November 13, 2021, with a goal of determining how the
different nozzle designs spray patterns hold up against the specification given to the team by Schaeffler.
The sample numbers correlate with the identification of nozzle numbers in Table 7. Visual analysis was
performed on the center notch, edge, and the surface of all the tested samples. A weight system was
created to add in this analysis. This system can be found in Table 13. A visual analysis of the rust
prevention performance for each sample is shown in Table 14. The team decided the most important
aspect of the visual analysis was the non-uniformities in each area. As seen in Table 15 each sample was
given an average score to create a comparison. The scores highlighted in red are considered poor, the
score highlight in yellow are sufficient but not ideal, and the scores highlighted in green are good. To see
magnified pictures of the samples, please review Appendix C. The compiled results from each analysis
are shown in Table 16.
Table 13: Visual Key
Quality Weight
None 1
Minimal 2
Moderate 3
Severe 4

39
Table 14: Saltwater Test Visual Analysis
Sample Center Notch Edge
Flaking/Peeling Rust Undercut Rust Undercut
1 Moderate Minimal None Moderate Minimal
2 Minimal Minimal None Moderate None
3 Minimal Minimal None Minimal None
4 Moderate Moderate None Minimal None
5 Severe Severe None Minimal Moderate
6 Moderate None None None None
7 Severe Severe None Minimal None
8 Severe Severe None None None
9 Minimal Moderate Severe None None
10 Minimal Minimal None None None
11 Minimal Moderate None Minimal None
12 Severe Severe Moderate Minimal None
13 Severe Severe None None None
14 Severe Severe Severe Minimal Minimal
15 Moderate Severe None None None
Table 15: Non-Uniformity Visual Analysis Post-Saltwater Test
Sample Center Notch Edge Surface Scores
Non-Uniformity Non-Uniformity Non-Uniformity Total Average
1 Minimal Lack of Material Severe Lack of Material Severe Lack of Material 10 3.33
2 Minimal Pitting Minimal Pitting Minimal Pitting 6 2
3 Minimal Lack of Material None Moderate Cracking 6 2
4 Moderate Cracking None Moderate Pitting 7 2.33
5 Minimal Lack of Material Severe Pitting Moderate Cracking 9 3
6 Severe Globbing/Lack of
Material Minimal Pitting Severe Cracking/Pitting 10 3.33
7 Minimal Lack of Material Moderate Lack of
Material Moderate Cracking 8 2.67
8 Minimal Lack of Material None Minimal Globbing 5 1.67
9 Minimal Lack of Material Moderate Pitting Moderate Cracking 8 2.67
10 None None Moderate Cracking 5 1.67
11 None None Severe Cracking 6 2
12 Moderate lack of Material Minimal Pitting Moderate Cracking 8 2.67
13 Moderate Cracking None Minimal Lack of
Material 6 2
14 Severe Lack of Material Minimal Lack of Material Minimal Cracking 8 2.67
15 Moderate Lack of Material Severe Pitting Minimal lack of Material 9 3
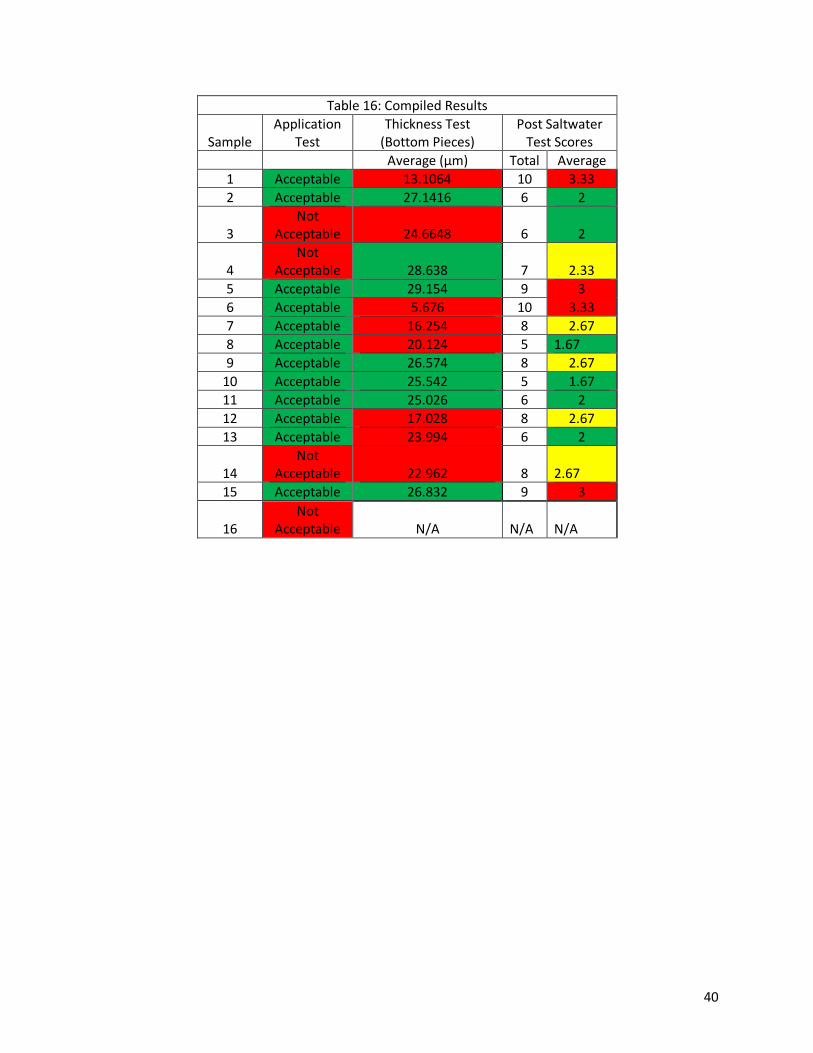
40
Table 16: Compiled Results
Sample Application
Test Thickness Test
(Bottom Pieces) Post Saltwater
Test Scores
Average (μm) Total Average
1 Acceptable 13.1064 10 3.33
2 Acceptable 27.1416 6 2
3 Not
Acceptable 24.6648 6 2
4 Not
Acceptable 28.638 7 2.33
5 Acceptable 29.154 9 3
6 Acceptable 5.676 10 3.33
7 Acceptable 16.254 8 2.67
8 Acceptable 20.124 5 1.67
9 Acceptable 26.574 8 2.67
10 Acceptable 25.542 5 1.67
11 Acceptable 25.026 6 2
12 Acceptable 17.028 8 2.67
13 Acceptable 23.994 6 2
14 Not
Acceptable 22.962 8 2.67
15 Acceptable 26.832 9 3
16 Not
Acceptable N/A N/A N/A
41
8. Discussion and Nozzle Selection Recommendations
8.1 Nozzle Design Discussions Cone spray patterns are the most common type of nozzles tested in the team’s experiment. A cone
pattern is caused be a small opening that is large enough to allow spray consistently through and
atomizes particles, but not too large as to cause a failure in atomization. Iteration 1 is a decent example
of nozzles failing to atomize the spray. Nozzle “Cone #2” from Iteration 1 had a circular exit hole too
large to atomize and resulted in thick dripping. The nozzles “Flat #1” and “Flat #2” from Iteration 1,
although originally intended to spray a flat pattern, clogged due to the exit hole being too small. The
best atomization occurred with the original yellow nozzle provided with the can with an exit diameter of
300 µm. “Cone #1” with a diameter of 500µm performed like the yellow nozzle with slight dripping,
indicating the original had an optimized size for atomization.
In Iteration 2, the team saw more influence on the cone patterns, stemming from the nozzle design.
Nozzle #3 created a cone pattern with rounded corners that appear to form a square. This occurred due
to the nozzle end limiting the full cone pattern by the right corners of the square deflecting small
amounts of particles, causing the crude square shape. The crude corners tend to drip and glob as they
are receiving more material than the center of the spray pattern. This does not happen to all square
shaped exit holes as also seen in the Nozzle #7 in Iteration 2. The team believes that Nozzle #7 does not
follow the square spray trend as it is essentially the same size as the yellow tip exit. The only difference
is the nozzle is squared off; however, the exit is so small that it overcomes the increased drag. Sharp
edges seen in the square/rectangular nozzles increase drag on the fluid, thus decreasing exit velocity.
This decrease in exit velocity lowers the pressure and results in a poorly atomized spray.
Converging nozzles would ideally cause a more concentrated spray compared to those that are not
converging. Spray patterns of converging nozzles in Iterations 2 and 3 did not appear different to the
naked eye. The differences were made clear upon microscopic inspection. This will be elaborated on in
Section 8.2.
Flat spray patterns occur when particles exiting the nozzle are deflected from two slopes that redirect
the spray to contact the desired surface in a line. Iterations 1 and 2 did not contain a nozzle of this
design and the fan attempts failed to produce a flat spray pattern. In Iteration 3, the nozzle heads were
elongated to allow enough room for an angled cut. This created two slopes for the spray to deflect
against. Results from the iteration show that smaller angles cause tighter flat patterns and larger angles
cause wider flat patterns. The 45-degree nozzle produced a wide spray pattern, and the 15-degree
produced a long thin spray pattern.
Deflection sprays occur when particles contact a sloped surface and divert from the original direction.
This happens when a sloped surface is added to the end of a nozzle. Flat slopes and concave deflection
surfaces were compared. Increasing the length of the slope creates a smaller pattern but maintains the
crescent shape. The increased length makes the smaller pattern because the spray deflects at a distance
further from the exit hole. The shape and size of the pattern is determined by the slope of deflection
and how the particles exiting the nozzle interact with it.

42
8.2 Nozzle Application Discussion The team performed a microscopic inspection of the test samples at both their center notches and their
edges. These images are in Appendix C. These images were scrutinized by the entire team and ranked in
accordance with the previously used system from Section 7.3. Their observations are recorded in Table
17. Pitting was the only condition considered as these images were taken pre-saltwater testing and the
team felt that it was the best indication of nozzle performance. It should be noted that the pitting is
believed to stem from both a chemical issue with the propellant/solvent mix and the atomization of the
spray from the nozzle. Rectangular nozzles (#4,6) performed insufficiently in terms of coating uniformity.
The deflections (#14,15) performed better than the rectangular nozzle but were still not ideal.
Converging nozzles (#7,8,9,10) performed sufficiently in terms of uniformity. Nozzles #11 through 13
were sufficient but not preferred based on uniformity. Nozzles #1 through 3 and Nozzle #5 performed
sufficiently, but not ideally. This analysis is based on the sample pieces as wholes, instead of just at their
centers or edges.
Table 17: Nozzle Application Analysis
Sample Observation Pre-Bake Observation Post-Bake
1 Moderate Pitting Minimal Pitting
2 Moderate Pitting Minimal Pitting
3 Moderate Pitting Minimal Pitting
4 Severe Pitting Severe Pitting
5 Moderate Pitting None
6 Severe Pitting Severe Pitting
7 None None
8 Minimal Pitting None
9 Minimal Pitting None
10 Minimal Pitting Minimal Pitting
11 Severe Pitting Minimal Pitting
12 Minimal Pitting Minimal Pitting
13 Minimal Pitting None
14 Moderate Pitting Moderate Pitting
15 Moderate Pitting Minimal Pitting
16 N/A N/A

43
8.3 Nozzle Recommendations The team combined all the analysis preformed to decide how to rank these nozzles. Three categories
were made to rank all the nozzles tested. The results from these rankings can be found in Table 18. The
nozzles highlighted in red are insufficient, the nozzles highlighted in yellow are sufficient but not ideal,
and the nozzles highlighted in green are recommended.
Table 18: Nozzle Final Assessment
ID # Description ID # Description
1 Original Nozzle 9 Continuously Converging Circle
2 Copy of Original Nozzle 10 Continuously Converging Oval
3 Square Nozzle 11 45 Degree Flat
4 Funneled Rectangle 12 20 Degree Flat
5 Long Head, Circular 13 15 Degree Flat
6 Long Head, Rectangle 14 Short Deflection Tip
7 Long Head, Converging Square 15 Short Concave Deflecting Tip
8 Long Head, Converging Circle 16 Long Deflection Tip
8.3.1 Nozzle Recommendation Explanations Below are the explanations behind each nozzle rating based on the team’s myriad of scoring techniques
as well as previously unsaid reasons.
Nozzles #1, 3, 4, 5, 6, 14, 15, and 16 are labeled as “insufficient”. Despite Nozzle #1 being the yellow
stock nozzle that came from the manufacturer, it did not perform adequately. This is believed to be the
case since it was used for all nozzle testing, from design phase to the final saltwater sample application.
The team believes that it accumulated residual material buildup and wore the nozzle material down
from being loaded and unloaded into the housing unit. Nozzle #3, despite performing adequately in the
Non-Uniformity Visual Analysis Post-Saltwater Test (Table 15), it is labeled insufficient as the spray
uniformity during design phase proved to be unfit as previously stated in Section 8.1. Nozzles #4 and 6
are insufficient due to their extreme surface non-uniformity (Table 17). Nozzle #5 is insufficient due to
scoring a 3 in the Non-Uniformity Visual Analysis Post-Saltwater Test (Table 15). Nozzles #14, and 15 are
insufficient as they did not perform adequately during application testing nor the non-uniformity
analysis (Table 16). Nozzle #16 failed from the start as it clogged, thus proving the nozzle to be
insufficient.
Nozzles #7, 9, 11, and 12 are labeled as “sufficient but not recommended for this application”. As stated
in Section 8.1, Nozzle #7 is a square exit. It meets the criteria to make the sufficient label, but due to its
shape, is not ideal for this application. Any possible excess dripping and rounded corners are not
acceptable, which are both possible outcomes of a square exit. Nozzle #9 falls under this category as it
scored a 2.67 (Table 15) which means it trends towards moderate/severe non-uniformities. Nozzle #11
exhibited severe pitting, seen during the Nozzle Application Analysis (Table 17). Nozzle 12 scored 2.67
during the Non-Uniformity Visual Analysis Post-Saltwater Test (Table 15), which is not ideal.
Nozzles #2, 8, 10, and 13 were ranked “recommended” by the team. These nozzles were put into this
category based off their quality performances in all the analyses performed by the team. The nozzles
performed well under the Nozzle Observation Assessment (Table 7) and showed no irregularities during

44
the application process. The nozzles scored 2, 1.67, 1.67, and 2 respectively for the Non-Uniformity
Visual Analysis Post-Saltwater Test (Table 15), which were determined by the team to be high-quality
scores. These nozzles also showed sufficient results during the Nozzle Application Analysis (Table 17).
The team did more visual comparisons between these four nozzles and decided that #8 and #10
performed the best out of all the nozzles selected. It is interesting that Nozzle #2 performed so well
compared to Nozzle #1. This nozzle was supposed to be an exact replica of #1, so based off the
assumption stated previously #1 would be labeled as recommended if it hadn’t been used so much prior
to these analyses.

45
9. Conclusions
9.1 Accomplishments After two semesters, more than 400 collective hours per member, the team delivered a detailed report
and presentation regarding the best rust preventative varnish for Schaeffler’s E-motor stator lamination
stack and an ideal nozzle design to be used with Sprayon’s aerosol can. The team tested 5 different
varnishes: MG Chemicals 4228-55ML Red Insulating Varnish, Seymour 620-1525 Tool Crib Red Insulating
Varnish, Anti-Seize Technology Red Insulating Varnish, Sprayon EL609 Green Insulating Varnish, and DEI
HI-TEMP Silicone Coating. A saltwater test was conducted according to Schaeffler’s guidelines to test
each coating. They were ranked according to coating adhesion and performance. A knife test was used
for ranking adhesion and a thorough microscopic analysis was conducted for rust prevention. Out of
these coatings, Sprayon El609 Green Insulating Varnish ranked the best and was used in further testing.
Moving forward with this varnish, the team set out to design an ideal nozzle for Schaeffler’s application
needs. They ran through three iterations of various nozzle types, all manufactured using additive
manufacturing methods. They 3D printed the nozzles using the Form 2, an SLA printer. The team had to
refresh themselves on fluid dynamics and learn corrosion science as well during this project. At first,
nozzle design was trial and error, but over the iterations, the team came to understand the relationships
presented to them through Bernoulli’s equation, the continuity equation, and other fluid dynamic
concepts. Once the team tested all the nozzles, they performed extensive visual analysis and another
saltwater test to validate their findings. The team ranked their nozzle designs and narrowed down their
findings to four final nozzles. The team deepened their understanding of the fluid dynamics, corrosion
prevention, and additive manufacturing methods. Most importantly, they created a start for future
students to use in the field of ideal nozzle design and rust prevention.
9.2 Uncertainties After all experimentation was done, there were a few observations made that could help improve the
experimental design of the tests, and the evidence of the results. First observation was majorly
constricted by access to materials. The second round of tests only used a sample size of 2. In most cases
this is unacceptable, but in regard to the constraints of resources and time that the team had, it was the
only sample size that was available. It would be highly recommended to increase the sample size for
each nozzle to 10 to provide for a better analysis and avoid any extreme deviant behavior during testing.
Other uncontrolled variables include the angle at which the spray can was held at during application.
Although the distance from the component was controlled in the second experiment, the angle in
regard to the position of the part was not controlled. The furnace used in both saltwater experiments
was also unideal for the application, as it was not intended to hold a low operational temperature
around 140 degrees Celsius. These uncertainties combined with human error could cause deviations in
the experimental results.
46
9.2.1 Material Selection and Testing
After finishing our testing, we realized that many things could have been done in a more consistent,
cleaner fashion. These changes would have provided a more academically suited testing environment.
Starting with our test samples, at the time of application we had sprayed the metal outside. We did not
provide ample space for individual sample spraying, instead, sprayed in batches. In addition, there was
cross-contamination between the sample coatings, and the metal laminations could have been cleaned
before spraying. Our champion, Jeremy Silvidi, led the team during the sample preparation, not allowing
for much room to converse. Following the coating application, he took the samples and cut them in
order to protect company knowledge -- another issue. Samples should have been cut prior to coating
application to ensure proper edge coating. The samples need to have a controlled environment for
future coating applications to ensure correct adhesion. The samples in this test did not have a humidity
controller or even a temperature controller, possibly preventing proper curing of the coatings.
Furthermore, there was no “proper coating” guideline. Simply, we sprayed the samples without concern
for even application. For future testing, we would need to develop an agreed-upon, design-tested
application method. With our current testing method, the samples are being coated on the flat side
rather than the edge, per Jeremy’s instructions. The real laminations will be stacked, and the ID will be
coated. We cannot assume that the same results seen on the flat will apply to what we will see on the ID
edges. Individual sample identification could have also been useful during testing, instead of keeping the
same order as a quasi-identity. An etching of sorts might have worked for our needs. Beyond our sample
preparation, we did not have a controlled furnace. The furnace used for testing was designed for
metallurgical work and thus fluctuated in temperature by +/- 5°C.
9.2.2 Nozzle Selection and Testing
During the CAD design and 3D printing phase, uncertainties arose from the measurements of the
manufacturer nozzle. This is due to both human error and inaccuracy/imprecision of the instruments
used. The possibility of error during the SLA printing should also be considered. The test samples were
not sprayed at the exact same angle every time, providing another source of uncertainty towards the
nozzle testing results. The samples did not have enough time to cure prior to moving them out of the
spraying booth, possibly skewing the results. The oven used in the second saltwater test is the same as
the first, providing the same temperature regulation issue. The instrument used in the thickness test did
not read 100% accurately, providing another source of uncertainty towards the results. The sample size
of the nozzle testing was limited to 2 samples per nozzle, and only 1 per nozzle for the second saltwater
test. Ideally, the sample size would exceed 30 per nozzle as to be able to use a Z distribution instead of a
T distribution.

47
9.3 Ethical Considerations Prior to any scientific progress, the health of the individual and the land must be considered. These tests
require any operator to wear the correct PPE: goggles, latex/nitrile gloves, a mask, or possibly a
respirator if within a confined space during coating application. These chemicals listed, or others chosen
for this corrosion prevention cause are carcinogenic and hazardous to one’s health. Safety data sheets
for all chemicals should be read and complied with. In addition to personal hazards, these chemicals
pose a risk to the health of the nearby environment if not disposed of properly. All hazardous wastes
should be handled and disposed of properly according to the local/state/federal regulations. For this
test, the Ohio Revised Code Chapter 373434 and the Electronic Code of Federal Regulations Title 40 -
Chapter 1 -Subchapter 1 - Part 26135 should be followed.
9.4 Future Work If students were to continue work from the conclusion provided in this report, a few subjects should be
investigated further. These subjects include conducting a similar test that accounts for the listed
uncertainties and has a larger sample size. Students could create experiments to measure the flow rate
of the particles exiting the nozzle based on nozzle design that could increase the understanding of the
nozzle designs influence in application. Another is to conduct tests on other rust preventatives and how
their coatings are affected by post-baking and attempt the baking process at various temperatures to
find potential optimization for post-bake coatings.

48
References
1. ISO. “ISO 12103-1:2016(En) Road Vehicles — Test Contaminants for Filter Evaluation — Part 1:
Arizona Test Dust.” ISO, 2016, www.iso.org/obp/ui/#!iso:std:63386:en.
2. ISO. “ISO 20653:2013.” ISO, 13 June 2018, www.iso.org/standard/58048.html.
3. “NEMA Insulation Classes.” Engineering ToolBox, www.engineeringtoolbox.com/nema-insulation-
classes-d_734.html.
4. MG Chemicals. 4228 Red Insulating Varnish Safety Data Sheet, MG Chemicals, 2020.
5. “Red Insulating Varnish.” One Company...Many Solutions, 28 June 2021,
www.mgchemicals.com/products/conformal-coating/varnish-for-electronics/red-insulating-
varnish/.
6. Seymour of Sycamore. Red Insulating Varnish Safety Data Sheet, Seymour of Sycamore, 2021.
7. “TOOL CRIB® RED INSULATING VARNISH.” Seymour of Sycamore, 22 Apr. 2020,
www.seymourpaint.com/product/tool-crib-red-insulating-varnish/.
8. A.S.T. Industries, Inc. Red Insulating Varnish Safety Data Sheet, A.S.T. Industries, 2017.
9. “17214, RED INSULATING VARNISH - AEROSOL.” RED INSULATING VARNISH Anti-Seize Technology,
www.antiseize.com/17214-2.
10. Sprayon Products Group. Safety Data Sheet SC0609000, Sprayon Products Group, 2021.
11. “EL609 Green Insulating Varnish.” Sprayon, 21 July 2018, www.sprayon.com/product/el609-green-
insulating-varnish/.
12. Design Engineering, Inc. HT-Silicone-Coating-Black SDS, Design Engineering, Inc., 2015.
13. “Hi-Temp Silicone Coating Spray - Black.” Design Engineering, Inc, www.designengineering.com/hi-
temp-silicone-coating-spray-black/.
14. Corrosion: Understanding the Basics, edited by J. R. Davis, and JR, Davis, A S M International, 2000.
ProQuest Ebook Central,
https://ebookcentral.proquest.com/lib/uakron/detail.action?docID=3002408.
15. “Anti-Corrosion Coatings Explained: Surface Technology Uk Blog.” Surface Technology, Surface
Technology, 4 July 2018, www.surfacetechnology.co.uk/blog-18-the-three-types-of-anti-corrosion
coatings-explained/.
16. “Explanation of Metallizing`s Galvanic Protection.” ZincNation, Inc.,
www.zincnation.com/itWorks.html.

49
17. “Coating Principles.” Coating Principles,
faculty.kfupm.edu.sa/me/hussaini/corrosion%20engineering/06.03.01.htm.
18. “Test Methods for Coating Adhesion: Resources: DeFelsko.” DeFelsko Inspection Instruments,
www.defelsko.com/resources/test-methods-for-coating-adhesion.
19. ASTM D6677-18, Standard Test Method for Evaluating Adhesion by Knife, ASTM International, West
Conshohocken, PA, 2018, www.astm.org
20. “Corrosion Undercutting.” Corrosion Undercutting, corrosion-doctors.org/PaintCoatings/
undercutting.htm.
21. “DIN En 10303:2016-02, Dünnes Elektroband Und -Blech Aus Stahl Zur Verwendung Bei Mittleren
FREQUENZEN; Deutsche FASSUNG EN_10303:2015.” DIN EN 10303:2016-02, Feb. 2016,
doi:10.31030/2315580.
22. Harris, Tom. “How Aerosol Cans Work.” HowStuffWorks Science, HowStuffWorks, 27 Jan. 2020,
https://science.howstuffworks.com/innovation/everyday-innovations/aerosol-can2.htm.
23. Mosil. “Aerosols- Principle, Techniques & Applications: Overview of Aerosol Spray.” Mosil
Lubricants, 2 July 2021, https://www.mosil.com/blog/technical-concept-aerosols-principle-
techniques-and-application/.
24. “Aerosol Technology.” The Aerosol Can – How an Aerosol Can Works,
http://www.threecell.com/client_archives/capco/technology.php?thepage=media.
25. Munson, Bruce R. Fundamentals of Fluid Mechanics. Wiley, 2013.
26. www.mosil.com/blog/technical-concept-aerosols-principle-techniques-and-application.
27. “Spray Nozzles.” Spray Nozzles for All Industries and Applications, https://www.spray-
nozzle.co.uk/spray-nozzles.
28. “ASTM Standard F2792 - 12A, Standard Terminology for Additive Manufacturing Technologies.”
ASTM International - Standards Worldwide, http://www.astm.org/Standards/F2792.
29. “Form 2 Desktop Stereolithography 3D Printer.” FormLabs,
https://media.formlabs.com/m/7253926716b40054/original/-ENUS-Form-2-Manual.pdf.
30. “Clear Resin TDS.” FormLabs, https://formlabs
media.formlabs.com/datasheets/Clear_Resin_Technical.pdf.
31. “Clear Resin SDS.” FormLabs, https://formlabs-media.formlabs.com/datasheets/1801037-SDS-ENUS-
0.pdf.

50
32. Standard E376-19, Standard Practice for Measuring Coating Thickness by Magnetic-Field or Eddy
Current (Electromagnetic) Testing Methods.” ASTM International - Standards Worldwide,
https://www.astm.org/Standards/E376.htm.
33. EL609 Product Data Sheet. 2010,
https://paintdocs.com/docs/webPDF.jsp?SITEID=SO&doctype=PDS&prodno=SC0603000&
amp;lang=2.
34. “Rules and Laws Governing Hazardous Waste.” Resource Conservation and Recovery Act Rules,
epa.ohio.gov/derr/derrrules/rcra#176626480-chapter-3745-270-land-disposal-restrictions-
standards.
35. “Electronic Code of Federal Regulations.” Electronic Code of Federal Regulations (ECFR),
www.ecfr.gov/cgi-bin/text-idx?node=pt40.28.261&rgn=div5.
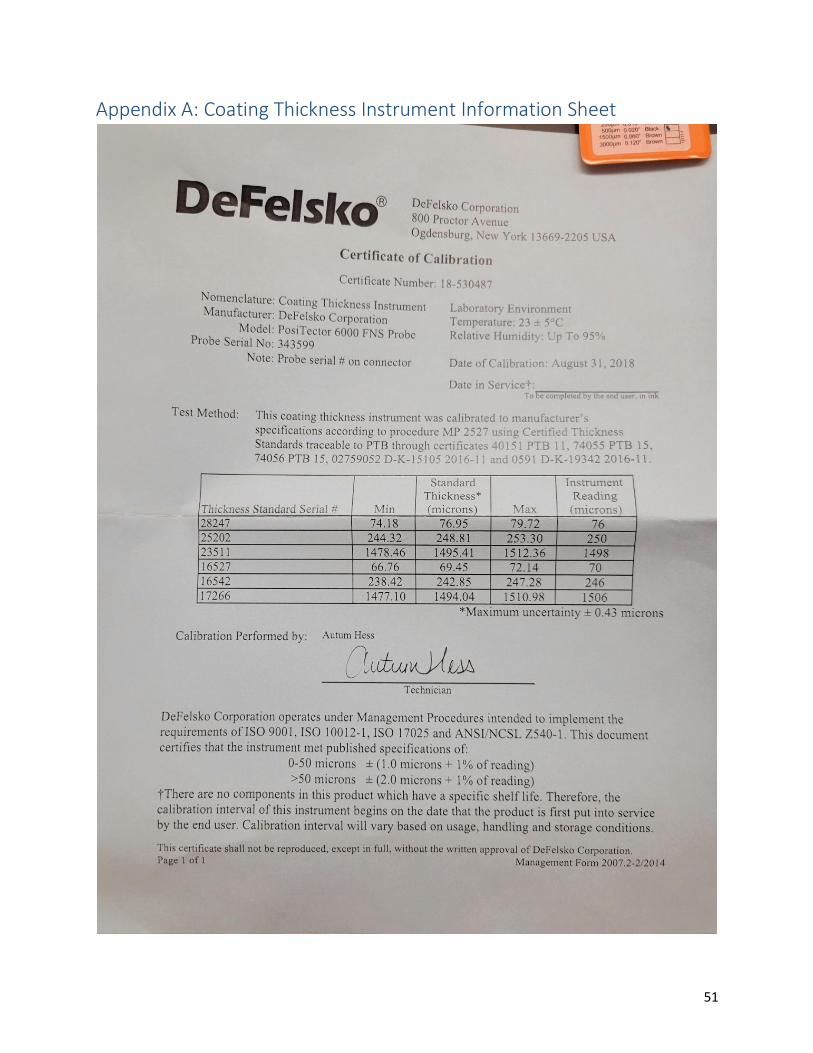
51
Appendix A: Coating Thickness Instrument Information Sheet

52
Appendix B: Material Technical Data Sheets
MG Chemicals 4228-55ML Red Insulating Varnish5

53
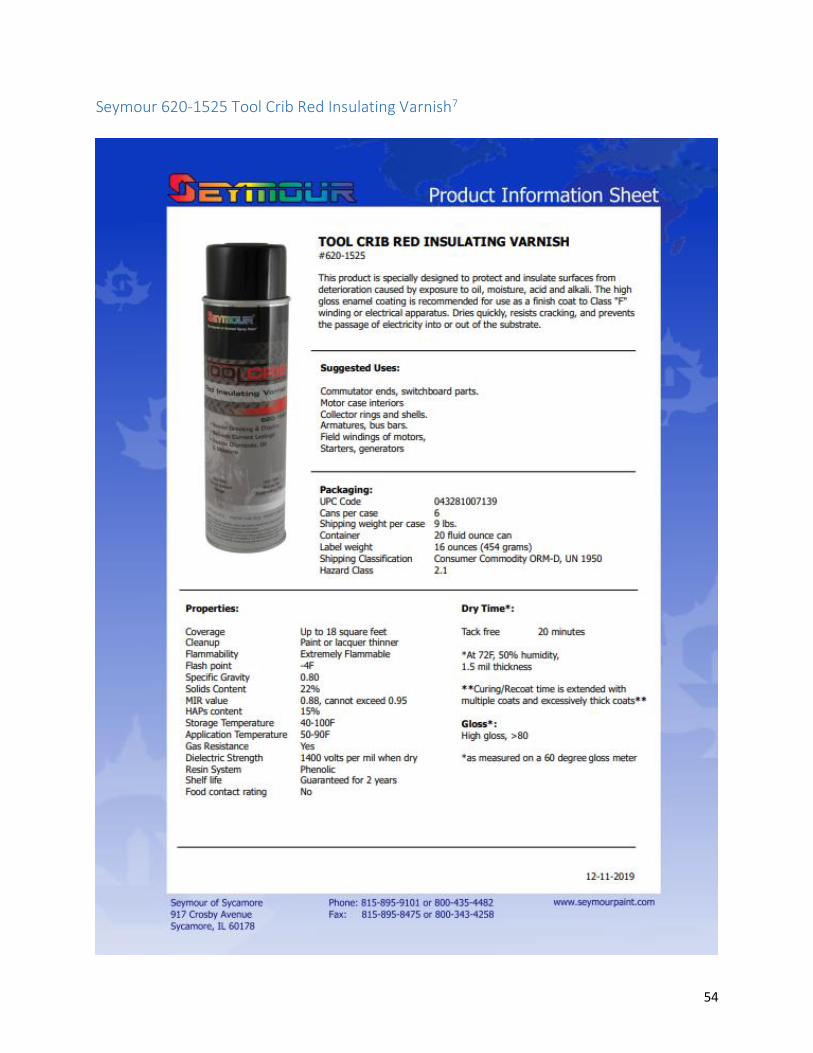
54
Seymour 620-1525 Tool Crib Red Insulating Varnish7

55
Anti-Seize Technology Red Insulating Varnish9

56
Sprayon EL609 Green Insulating Varnish11
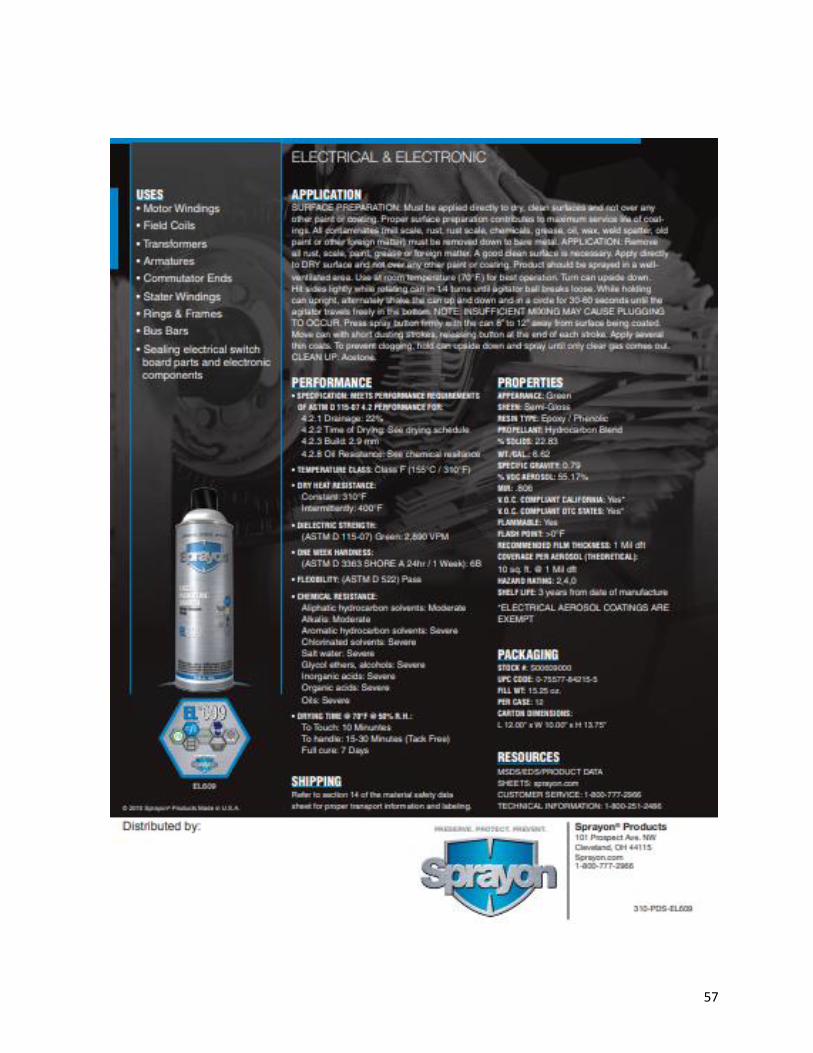
57

58
DEI HI-TEMP Silicone Coating13

59
Appendix C: Pictures of Sprayon Samples: Olympus Stereo Microscope Sample Pre-Bake Post-Bake Post-Saltwater Test Saltwater Test
Surface
1
2
3
4

60
5
6
7

61
8
9
10
11
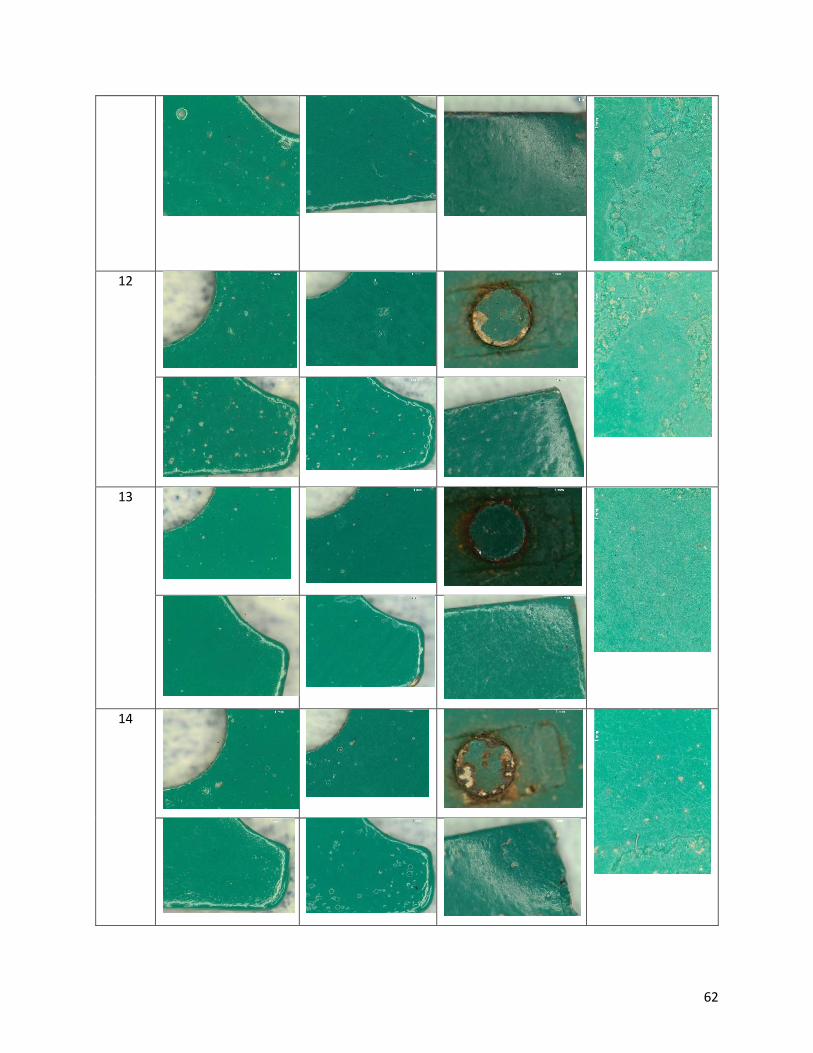
62
12
13
14

63
15
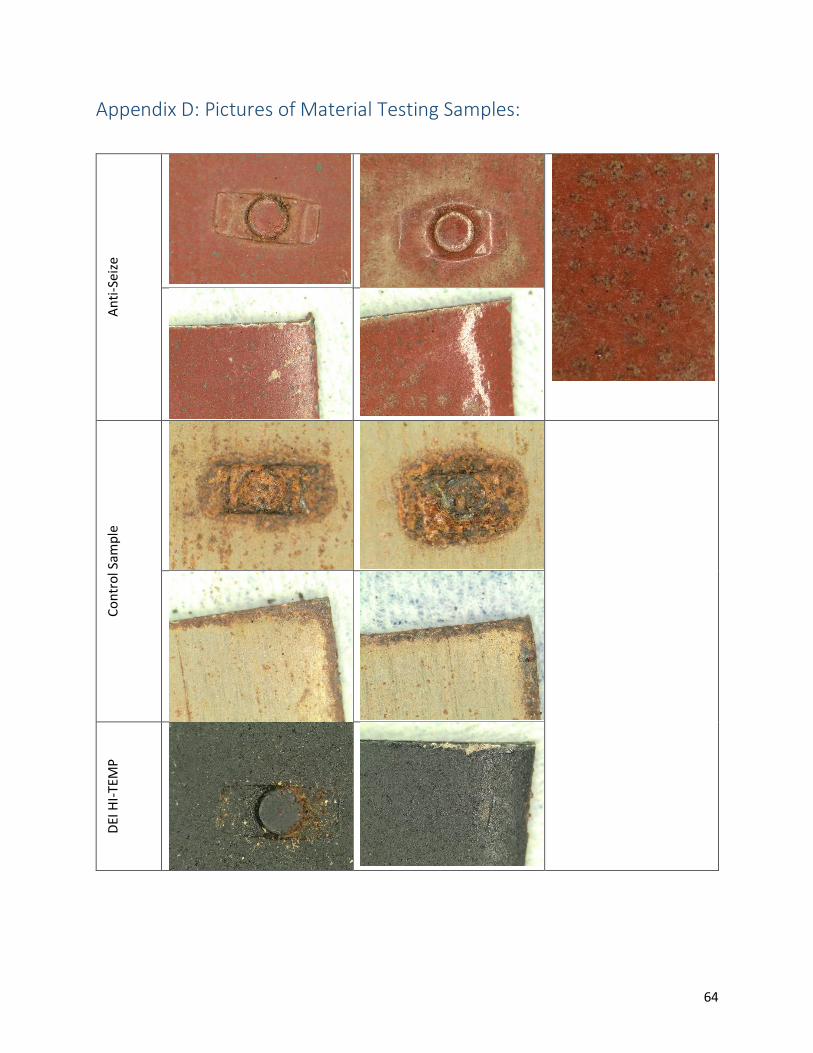
64
Appendix D: Pictures of Material Testing Samples:
An
ti-S
eize
Co
ntr
ol S
amp
le
DEI
HI-
TEM
P

65
MG
Ch
emic
als
422
8-5
5ML
Seym
ou
r 62
0-1
525
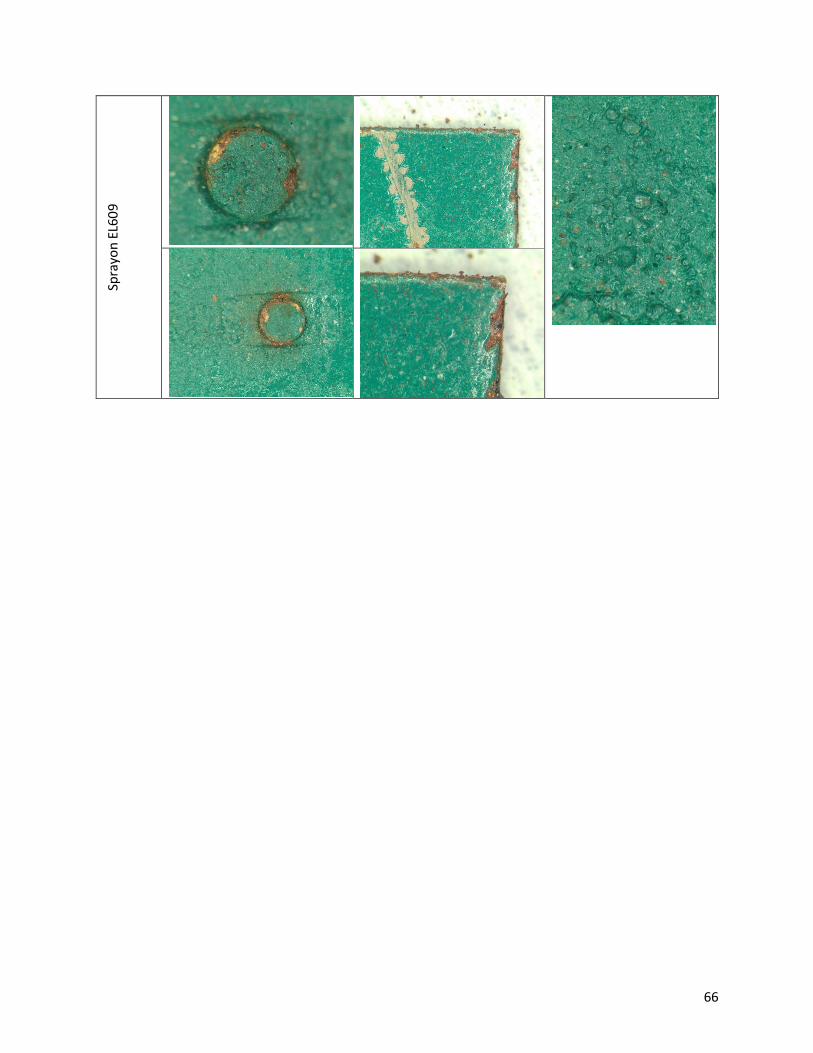
66
Spra
yon
EL6
09