Russian Federation Poultry and Products Annual 2017 ... · 8/18/2017 · pork. Competition between...
23
THIS REPORT CONTAINS ASSESSMENTS OF COMMODITY AND TRADE ISSUES MADE BY USDA STAFF AND NOT NECESSARILY STATEMENTS OF OFFICIAL U.S. GOVERNMENT POLICY Date: GAIN Report Number: Approved By: Prepared By: Report Highlights: Demand for broiler meat from national retail networks and major fast food restaurants expanding to eastern regions offsets the pressure of oversupply in the European Russia. Favorable prices, good crops and weather encourage industry leaders to accelerate output, but bigger growth is limited by domestic demand as exports remain low. Broiler meat production in 2018 is forecasted at 3.91 MMT; the annual growth will slow to one percent from 3.75 percent in 2017. Consolidation of production at large “integrators” will continue as the output of smaller factories will shrink. Consumption and exports are expected to grow 1.4 and 4.3 percent, while imports from non-banned suppliers stabilize at the 2017 level, 225,000 MT. Moscow Staff Rachel Vanderberg 2017 Poultry and Products: Growth through Integration Poultry and Products Annual Russian Federation RS1747 8/18/2017 Required Report - public distribution
Transcript of Russian Federation Poultry and Products Annual 2017 ... · 8/18/2017 · pork. Competition between...

THIS REPORT CONTAINS ASSESSMENTS OF COMMODITY AND TRADE ISSUES MADE BY
USDA STAFF AND NOT NECESSARILY STATEMENTS OF OFFICIAL U.S. GOVERNMENT
POLICY
Date:
GAIN Report Number:
Approved By:
Prepared By:
Report Highlights:
Demand for broiler meat from national retail networks and major fast food restaurants expanding to
eastern regions offsets the pressure of oversupply in the European Russia. Favorable prices, good crops
and weather encourage industry leaders to accelerate output, but bigger growth is limited by domestic
demand as exports remain low. Broiler meat production in 2018 is forecasted at 3.91 MMT; the annual
growth will slow to one percent from 3.75 percent in 2017. Consolidation of production at large
“integrators” will continue as the output of smaller factories will shrink. Consumption and exports are
expected to grow 1.4 and 4.3 percent, while imports from non-banned suppliers stabilize at the 2017
level, 225,000 MT.
Moscow Staff
Rachel Vanderberg
2017 Poultry and Products: Growth through Integration
Poultry and Products Annual
Russian Federation
RS1747
8/18/2017
Required Report - public distribution

2
General Information
NOTE: USDA unofficial data excludes Crimean production and exports. However, as of June 2014, the
Russian Federal State Statistics Service (Rosstat) began incorporating Crimean production and trade
data into their official estimates. Where possible, data reported by FAS/Moscow is exclusive of
information attributable to Crimea.
Executive Summary
FAS/Moscow forecasts one percent annual growth of broiler meat production in 2018, to 3.91 MMT
(Ready-to-cook weight). Because of the current favorable market conditions, industry leaders have
accelerated output. The cool and comfortable summer has also aided broiler population growth. The
production forecast for 2017 increased to 3.87 MMT, 3.75 percent annual growth from the previous 0.5
percent. Leading producers are earning better profits in 2017 than last year due to the record low prices
for forage wheat, and a relatively strong and stable ruble. Finally, national retail chains and fast food
restaurants have grown further into the Ural, Sibir, and Far Eastern regions, which is a new market
expansion.
Production growth is anticipated to slow in 2018 because it depends heavily on the stability of the ruble
exchange rate, domestic consumer purchasing power, and progress of export sales. Dozens of small and
medium-sized broiler companies closed or changed owners in 2016; businesses with non-diversified
value chains and limited access to refinancing are struggling, while most of top-10 companies are
increasing the production of feeds, enhancing operations, and purchasing strategic assets for regional
expansion. Consolidation of production at large “integrators” will continue in 2018 as the output of
smaller factories will be shrinking. Key constrains for bigger production growth are slow recovery of
consumer purchasing power, and slow growth of export sales. However, a weaker ruble may stimulate
shipments to recently opened and traditional export markets. The positives that will likely persist in
2018 are feed availability due to expected good crop, and availability of capital for innovative
agricultural projects of industry leaders due to lack of potential in other sectors.
FAS/Moscow forecasts 4.02 MMT broiler meat consumption in 2018, which is 1.64 percent annual
growth from 3.96 MMT new estimates for 2017. The eastern expansion of leading national retail
networks and major fast food restaurants offsets the pressure of oversupply in the European part of
Russia, where demand for broiler meat is soft in retail mostly due to recovered consumer interest in
pork. Competition between pork and poultry will increase in the midterm in western Russia: the broiler
market will be very sensitive to any changes in pork prices in the Central Federal District. Leading
broiler producers will continue to increase sales in the eastern regions as they grow together with their
partner retail and restaurant chains.
The broiler industry remains oriented to domestic markets in 2018. FAS/Moscow has increased broiler
imports forecast in 2017 to 225,000 MT, which is 5,000 MT growth year-on-year, because currency
exchange rates and broiler prices have been favorable for imports in the first half of 2017. Imports are
expected to remain at the same level in 2018. Brazil and Belarus will remain the main exporters because
the food embargo restricts trade with other key broiler suppliers until the end of 2018. Russian industry
has the potential to increase exports to targeted Asian markets by 70,000-100,000 MT per year;
however, 2018 exports are forecasted at 120,000 MT because shipments to new markets will most likely
grow slowly in the short term.

3
Broiler Meat Production
Table 1. Russia: Broiler Production, Supply and Demand, 1,000 MT (Ready-to-cook), Million head
Poultry, Meat,
Broiler 2016 2017 2018
Market Begin Year Jan 2016 Jan 2017 Jan 2018
Russia USDA
Official
New
Post
USDA
Official
New
Post
USDA
Official
New
Post
Inventory
(Reference)
0 416 0 430 0 0
Slaughter
(Reference)
0 0 0 0 0 0
Beginning Stocks 35 35 30 30 0 50
Production 3,720 3,730 3,750 3,870 0 3,910
Total Imports 215 220 200 225 0 225
Total Supply 3,970 3,985 3,980 4,125 0 4,185
Total Exports 104 105 115 115 0 120
Human
Consumption
3,836 3,850 3,835 3,960 0 4,015
Other Use, Losses 0 0 0 0 0 0
Total Dom.
Consumption
3,836 3,850 3,835 3,960 0 4,015
Total Use 3,940 3,955 3,950 4,075 0 4,135
Ending Stocks 30 30 30 50 0 50
Total Distribution 3,970 3,985 3,980 4,125 0 4,185
(MIL HEAD) ,(1000 MT)
NOTE: Not Official USDA Data.
Official USDA data is available at http://apps.fas.usda.gov/psdonline
FAS/Moscow forecasts one percent annual growth of broiler meat production in 2018, to 3.91 MMT
(Ready-to-cook weight)1. Because current market conditions are favorable, industry leaders accelerated
output in the first half of 2017, but the sustainability of this growth depends heavily on the stability of
the ruble exchange rate, domestic consumer purchasing power, and growth of export sales. The
favorable prices and margins in the broiler sector are expected to worsen in the second part of 2017,
mostly based on consensus expectations of a weaker ruble. Additionally, flat domestic retail sales and
increased imports in January-June 2017 resulted in accumulation of large stocks of frozen broiler meat
by the end of the second quarter. Stocks will most likely remain high throughout the year, which will
press down prices and constrain the pace of production growth in 2018.
1 Ready-to-cook (RTC) weight equivalent includes dressed poultry, without feathers, head, feet, and most internal organs.
Includes neck and giblets. Source: https://www.ers.usda.gov/data-products/food-availability-per-capita-data-system/glossary/

4
The prices for forage grains will likely remain low in 2018 on the expectation of a good wheat crop 2.
Soy, corn, and other crops grown for forage will likely be bigger than last year, in particular at big
agricultural holdings growing soy and corn for their broilers. Leading broiler companies, called in
Russia “integrators”3 because they have implemented vertically integrated business models, have
planted and will likely harvest and process more forage grains than in 2016. According to recent Rosstat
data, the total area planted with soy increased 19 percent in 2017, the area planted with corn increased
7.4 percent, and the total area of winter wheat in good condition following winter is 6.5 percent bigger
than in 2016. Key agricultural producers in the European part of Russia are expecting improved yields
per hectare.4
Except for feed availability, the persistence of positive production factors remains uncertain in 2018.
The influence of the exchange rate remains the main variable in the market because Russia’s currency
and the economic recovery still strongly depend on world crude oil prices. The FAS/Moscow
production forecast is based on the assumptions that the ruble to dollar exchange rate will remain below
70 rubles per US dollar, and that the economy rebounds to 1.5 percent GDP growth in 2018, as
forecasted by Russia’s Ministry of Economic Development in April 20175.
Leading broiler companies, mainly in the European Russia, will account for most of the anticipated
growth in the midterm. These companies now benefit from their integrated supply chains, enhanced
operational efficiency, and experience working with large national retailers and restaurant chains.
Integrators will likely increase their presence in the regional markets along with their partner retail
chains. The expansion of big retail in the regions contributed much of the growth of broiler meat sales
in 2014-2017, and the development of distribution channels is anticipated to continue in 2018 at a
slower pace.
Fast-food restaurant chains tend to use mostly local ingredients (approximately 70-85 percent) and
create additional demand for broiler meat. Several fast-food chains have created fully integrated local
supply chains. McDonald’s, which operates 574 restaurants throughout the country, gets 85 percent of
its menu items from domestic suppliers. Subway sources all its chicken from local suppliers. Leading
broiler meat producers are increasing production as responding to growing demand from restaurant
chains. For example, ABH “Miratorg” has signed a 5-year supply contract with Burger King, which
2 RS1738 Grain and Feed Update and RS1735 Russian Feed Sector Update
3 Top Ten Broiler “Integrators” (# in rating, company name; production in 2016; annual growth/decline in 2016): #1
“Prioskolye” 627,300 MT live weight; -1.7%; #2 “Cherkizovo” 500,321 MT product weight; + 6% ; #3 GAP “Resurs”
343,000 MT live weight +14%, company plans to produce 500,000 MT of broiler meat (live weight) in 2017; #4 “BEZRK-
Belgrankorm” 206,000 MT product weight – 6.7%; #5 “Charoen Pokpand Foods” (“Severnaya” poultry farm) production
capacity approximately 200,000 MT, 2016: n/a; #6 “Belaya Ptitsa, approx. 220,000 MT live weight n/a; #7 Agrokomplex
N. Tkachyova / Akashevskaya production capacity approximately 280,000 MT live weight 2016: n/a ; # 8
“Prodo”production capacity 192,000 MT, 2016: n/a ; #9 (?) “Miratorg”: production capacity in 2017 more than 100,000
MT; #10 “ Zdorovaya Ferma”/former ”Ural broiler” production capacity in 2016 more than 100,000 MT; n/a. For additional
relevant information refer to Argoinvestor Magazin article (in Russian) “Top 20 Feed producers in 2016 increased
compound feed production by 49 percent”. Published in #5(9912), May 2017
http://www.agroinvestor.ru/analytics/article/27290-top-20-po-kormam/ 4 Cherkizovo: “While the harvesting period began two weeks later than the average start date, the forecast for early grain
crops remains positive. Wheat, corn, peas and soy will make up the backbone of the 2017 harvest. Cherkizovo Group will
also harvest rye and flax for the first time this year. The Group expects significant improvements in yields this year thanks to
highly intensive technologies, use of manure and non-organic fertilisers, as well as high-yielding market and hybrid seeds. In
2017, the harvest volume is expected to increase by 61% year-on-year.” http://cherkizovo.com/en/press/company-news/8594/ 5 Source: Ministry of Economic Development of the Russian Federation
http://economy.gov.ru/minec/press/news/2017060401

5
operates over 400 restaurants in the contry.. As a result, “Miratorg-Zapad” in Kaliningrad plans to
increase its annual output of processed products for HoReCa by 12 percent to 48, 000 MT in 2017.
Belgorod broiler producer “Belaya Ptitsa” also invested 700 million rubles in a project targeting
HoReCa6.
FAS/Moscow has changed the production forecast for 2017 year to 3.87 MMT anticipating 3.75 percent
annual growth from 3.73 MMT produced in 2016.7 The record low prices for forage wheat, relatively
strong and stable ruble, development of modern distribution channels in the regions and cool summer
weather8 comfortable for broilers are the positive factors that stimulated growth of broiler production in
the first half of 2017. In addition, the domestic supply of pork and turkey was slightly less than had
been expected because some volumes were removed from the market due to Highly Pathogenic Avian
Influenza (HPAI) and African Swine Fever (ASF) outbreaks, disease eradication and prevention
measures. That created some additional demand for broiler meat in the market in spring 20179 while
consumers faced limited supplies of turkey and pork.
Despite the stagnation of ruble prices in retail, the profitability of broiler production businesses in the
first half of 2017 has recovered compared to weak performance of the first half of 2016. Producers’
margins improved in the course 2017 compared to the previous year because of the strong ruble and
lower costs of feeds and imported components. Russia’s average consumer price for a whole chicken in
May 2017 was 131.1 Rub, which is 1.7 percent higher than 128.9 rub in May 2016, CPI year-on-year in
June 2017 is 4.4 percent10
. Meanwhile, the average retail price for chicken meat if calculated in US
dollars increased 16.7 percent from May 2016 to May 2017, as the ruble appreciated to dollar by 12
percent year on year11
. At the same time, average wholesale prices declined by approximately 3 to 5
percent in rubles, possibly as a result of implementation of the new trade regulations in 201712
.
However, in spite of the decline of wholesale prices in rubles, in dollar terms producers still are earning
more than in 2016.
Prices for chicken meat in the mid-term will be shaped by currency rates, inflation, and changes in
consumer purchasing power. If no unpredicted financial or veterinary shocks occur in 2018, broiler
prices are expected to remain relatively stable because the industry now has additional capacity and
flexibility to adjust supply to demand.
Ruble price trends reflect the balance of supply and demand in the market, while dollar prices indicate
fluctuations of profitability.
Chart 1: Comparison of Broiler Meat Prices in Russia in Rubles and US Dollars in 2015-May 2017
6 Article in Russian: http://www.agroinvestor.ru/investments/news/26381-belaya-ptitsa-zapuskaet-kompleks-dlya-horeca/
7 2016 production data has been changed based on final Rosstat data .
8 Average summer temperatures in the major broiler producing regions of Russia in June and July were 2-5 degrees Celsius
lower than the seasonal norm . Source: Federal Service for Hydrometeorology and Environmental Monitoring
http://www.meteoinfo.ru/agro-review 9 More information on the topic is provided in the “Consumption” part of the Report.
10 Source: Rosstat
11 Official Rub to Dollar Exchange rate peaked in January 22, 2016 at 83.59 Rub per USD. Official exchange rate as of
January 1, 2017 was 60.66 Rub per USD, as of August 15, 2017 the rate is 59.79 Rub per USD 12
The new trade law limits bonuses to the retailers, which were previously charged to suppliers for various services. In
reality retail made suppliers to set lower prices in 2017 supply contracts. More information on the topic is provided in the
“Consumption” part of the Report.

6
Source: Rosstat; CBR
Rosstat reports 5.4 percent growth of poultry meat production in January-June 2017. Based on
publically available data FAS/Moscow estimates that additional production of broiler meat accounted
for approximately 4 percent of that number, and turkey meat for approximately 1.4 percent of the
increase.13
The biggest growth, 122,627 MT live weight, was in the Central Federal District that
accounts for roughly 50 percent of the total increase. This year to date, the Northwestern, North
Caucasian, and Volga Federal Districts each added 11,000-12,000 MT of poultry meat. In particular,
poultry production increased in regions where large broiler plants owned by the so-called “integrators”
are located. 45 regions continued to increase output, producing 215,000 thousand MT more poultry
meat than in January-June 2016. Twenty five regions increased poultry production by more than 1,000
MT. The best of these, Tambov oblast increased production by 40,803 MT live weight, Belgorod oblast
by 21,585 MT, Tula by 18,172 MT, Republic of Bashkortostan by 15,529 MT, Kursk oblast by 13,500,
and Stavropolskiy Kray by 10,428 MT.
13
Top turkey producers. (# in rating, company name; production in 2016; projected annual growth/decline in 2017; region):
#1“Damate”65,000 MT slaughter weight, Penza oblast, +7%; #2 Eurodon 59,900 MT slaughter weight, approx. 60,000MT
lower than planned due to HPAI; Rostov oblast; # 3 Gafuri Poultry Complex 23,500MT slaughter weight, +6 percent,
Republic of Bashkortostan; #4 Krasnobor 22,000 MT -9 percent, Tulskaya oblast; #5 Tambiv Turkey (Cherkizovo), 2.400
MT + 1100% to 30,000 MT in 2017, Tambovskaya oblast : Sources: “Agrifood strategies”, and other publically available
companies data and information, ,
7
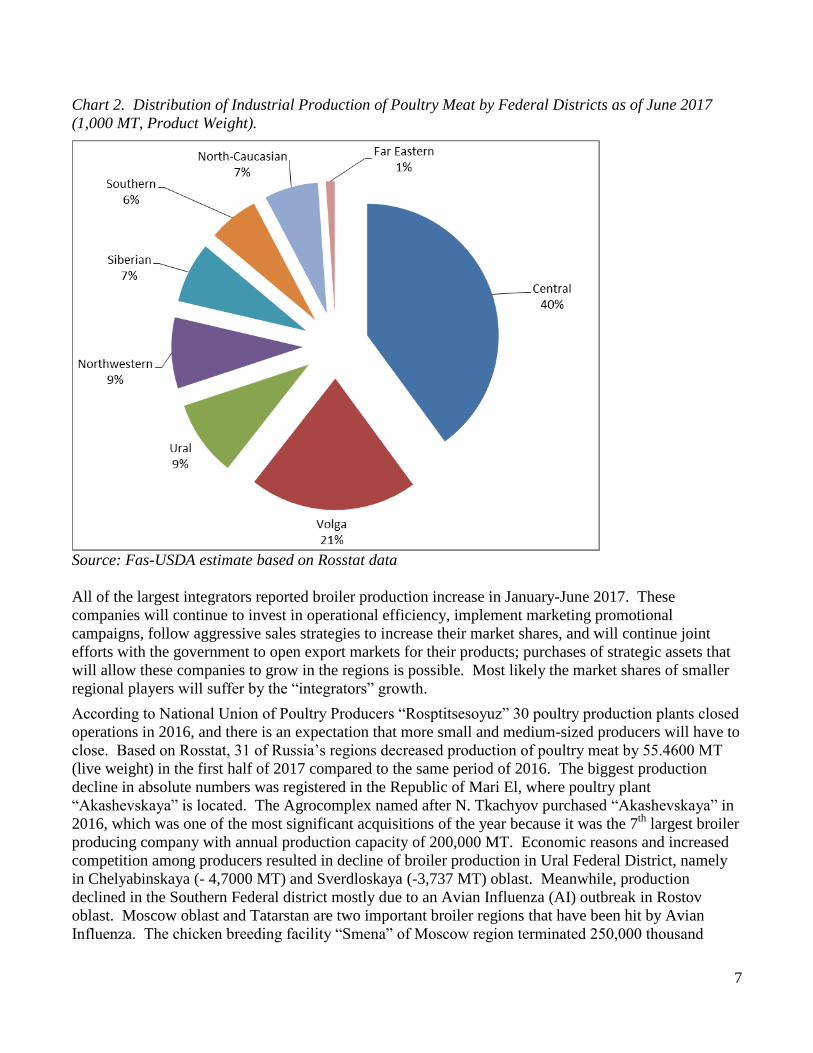
Chart 2. Distribution of Industrial Production of Poultry Meat by Federal Districts as of June 2017
(1,000 MT, Product Weight).
Source: Fas-USDA estimate based on Rosstat data
All of the largest integrators reported broiler production increase in January-June 2017. These
companies will continue to invest in operational efficiency, implement marketing promotional
campaigns, follow aggressive sales strategies to increase their market shares, and will continue joint
efforts with the government to open export markets for their products; purchases of strategic assets that
will allow these companies to grow in the regions is possible. Most likely the market shares of smaller
regional players will suffer by the “integrators” growth.
According to National Union of Poultry Producers “Rosptitsesoyuz” 30 poultry production plants closed
operations in 2016, and there is an expectation that more small and medium-sized producers will have to
close. Based on Rosstat, 31 of Russia’s regions decreased production of poultry meat by 55.4600 MT
(live weight) in the first half of 2017 compared to the same period of 2016. The biggest production
decline in absolute numbers was registered in the Republic of Mari El, where poultry plant
“Akashevskaya” is located. The Agrocomplex named after N. Tkachyov purchased “Akashevskaya” in
2016, which was one of the most significant acquisitions of the year because it was the 7th
largest broiler
producing company with annual production capacity of 200,000 MT. Economic reasons and increased
competition among producers resulted in decline of broiler production in Ural Federal District, namely
in Chelyabinskaya (- 4,7000 MT) and Sverdloskaya (-3,737 MT) oblast. Meanwhile, production
declined in the Southern Federal district mostly due to an Avian Influenza (AI) outbreak in Rostov
oblast. Moscow oblast and Tatarstan are two important broiler regions that have been hit by Avian
Influenza. The chicken breeding facility “Smena” of Moscow region terminated 250,000 thousand

8
breeder birds in March 2017. 14
Avian Influenza had a negative impact on some producers located in
the regions free from the disease, as some companies experienced difficulties with restocking their
parent herds or supply of hatching eggs due to trade and movement restrictions related to AI outbreak in
Europe and Russia15
. http://www.fsvps.ru/fsvps/print/press/432385.html
Chart 3. Russia’s Top 20 Poultry Producing Regions in 2016. (Production of poultry meat in January-
June 2017: broilers spent hens, turkey, other (1,000 MT, live weight); change year-to-date 2017/2016
(%); largest companies located in the region: AI Outbreaks in 2017)
Sources: Rosstat; Russian Federal Service for Veterinary and Phytosanitary Surveillance
1. Belgorod Region (425,059 MT; +5.4% “Prioskolye”; “Belgrankorm”; “Belaya Ptitsa”) 2.
Chelyabinsk Region (176,627 MT -2.592% Group of Companies “Zdorovaya Ferma”/ “Ural Broiler”);
“Sitno”; “Ravis - Sosnovskaya Poultry Factory”; “Chebarkulskaya Ptitsa”) 3. Leningrad
Region (157,226 MT + 6.21% “Severnaya” Poultry Factory (CPF PCL); five major Egg producing
companies) 4. Stavropolsky Krai (151,609 MT; +7.4 % Group of Agricultural Companies “Resurs”).
5. .Brianskaya Oblast (136.525 MT; +7.5%; “Cherkizovo”; “Miratorg”) 6. Penza region
(108.672 MT; +1.6%; “Cherkizovo”; “Damate” {turkey meat}) 7. Moscow Region (107.508; +12.23
%; “Cherkizovo”; “Elinar Broiler”); 8. Krasnodarskiy Krai (106,225 MT; +6.60%
“Agrokomplex Tkachova”; Group of Aricultural Companies "Resurs" ); 9. The Republic of Mordovia
(104,671 MT; +8.2% "Agricultural Company Oktyabrskaya”; "Poultry Factory Chamzinskaya), 10.
Tambov Region (100,512 +68.3% Group of Agricultural Companies “Resurs”; “Prioskolye”,
“Cherkizovo” {turkey meat}), 11. Tatsarstan (94,000 MT; - 0.42% "Chelny-Broiler"; “Ak Bars”).
12. Lipetsk region (91,600 MT +0.2% “Cherkizovo”), 13. the Republic of Mari El (91,480
MT; -12.73%; “Akashevskaya”) 14. Kursk Region (84,443 MT; +19 %; “Belaya Ptitsa”) 15.
14
Article in Russian “Breeding Facsility “Smena” will terminate its broiler herd”.
”http://www.agroinvestor.ru/regions/news/26318-na-plemzavode-smena-obnaruzhen-ptichiy-gripp 15
http://www.agroinvestor.ru/markets/news/27035-ptichiy-gripp-vyzval-pereboi-v-postavkakh-plemennogo-materiala/

9
Sverdlovsk Region (66,425 MT; - 5.32%; "Reftinskaya Poultry Factory" ) 16. Novgorod Region
(59,201 MT; +2.2%) 17. Voronezh Region* (57,900 MT; -1.79%; "Cherkizovo") 18. Rostov Region*
(51,324 MT; - 15.24%; “Prodo”, “Eurodon” {turkey meat}) 19. Tula Region (43,000, + 73%
“Volovskiy Broiler”; “Cherkizovo”) 20. Volgograd Region (40,000 MT 31.4 %);
* 31Registered Case of H5 Avian Influenza (AI) between January 2017 and July 2017 (Wild birds and
poultry) in 11 regions
An important change for the market of products of animal origin is the upcoming obligatory transition to
the system of electronic veterinary certification for the products of animal origin on January 1, 2018.
Veterinary supporting documents will be issued for each shipment free of charge and the information on
each lot of broiler meat will be registered and stored in in the state information system "Mercury”,
which is operated by the Russian Veterinary Phytosanitary Surveillance Service (VPSS). Detailed up-to
date information on the electronic veterinary certification requirements is available at the VPSS web-
site: http://www.fsvps.ru/fsvps/mercury.
To reduce budget spending and respond to the declining profitability of several agricultural sectors due
to oversupply of some agricultural commodities, the government of Russia significantly amended the
State Program for the Development of Agriculture and Regulation of Agricultural Commodities Markets
in 2013-2020. By the resolution of March 31, 2017, GOR defined new priorities for agricultural
development. The sub-programs in the previous edition of the program were designed to encourage
investments in additional production capacity and increase crops and output of livestock and poultry
products. The Federal Ministry of Agriculture has played the key role in the distribution of the funds
among different sectors in the past. The new edition of the program is designed to support the financial
system of agro-industrial complex and give provinces more flexibility in using federal funds according
to the needs of the particular region. An important addition to the program is a new subprogram to
support development of Russian agricultural exports. For detailed information, please refer to RS1736
Agricultural State Program 2013-2020 Amended in 2017. According to industry experts, the changes in
subsidy distribution will not influence the leading producers of broiler meat because most of them have
completed or are about to complete their investment projects. Modernized poultry factories now depend
largely on the consumer market, rather than on state subsidies. The big “integrators” are also in a good
position to get loans, as banks in Russia are currently seeking agricultural projects due to stagnation in
other industries. The changes will likely have negative impact on the mid-size and small factories, in
particular in the regions where broiler production is not a priority for the regional authorities.
Amendments to the program worsened unequal access to credit at preferential rate for smaller
companies with less vertical integration. The new state agricultural policy will likely accelerate the
consolidation of the broiler production within the largest companies and, in the long term, will result in
the concentration of broiler production in a few geographical clusters.

10
Broiler Meat Consumption
The consumption forecast is based on the assumption that the macroeconomic situation will develop
according to the basic scenario forecast of Russia’s Ministry of Economic Development: stable domestic
production of broilers and no political shocks related to the 2018 presidential elections in Russia.
FAS/Moscow forecasts 4.02 MMT broiler meat consumption in 2018, which is 1.64 percent growth
from the revised estimate for 2017 of 3.96 MMT. Moderate growth of demand for broiler meat in 2018
is anticipated as the major trends of 2017 meat market will likely continue next year. There are four
important consumption trends that shape the current market: (1) the growth of broiler share in retail
stagnates after decades of growth; (2) demand for chicken grows in the economy segment of HoReCa;
(3) total broiler consumption grows along with geographical expansion of so called “federal networks”16
in the regions; and (4) sales of chilled poultry via modern retail channels are growing. Chilled and
packed fresh broiler meat under brand names and new branded, value-added products such as marinated
or half-cooked chicken will continue to replace frozen meat and processed meat products such as
sausages and salami.
Complex relations between retail outlets17
and their suppliers became even more complicated as a result
of changes in trade legislation. Regular disputes about fair prices between producers and sellers
intensified after the latest amendments to Russian Trade Law entered into force. Food producers and
retailers had to sign new contracts before January 2017 to comply with the new trade regulations that
initially aimed at reducing the market powers of better consolidated retail sector. The maximum period
for deferred payments for goods was reduced to eight days; for the products with shelf life up to one
month the time limit is reduced from 25 days; for the goods with shelf life exceeding one month – the
time lag reduced to 40 days. The change is a very significant achievement of the food lobby.
The new contracts also have to comply with the requirement of an aggregate cap of 5 percent of the
purchase price for both volume bonus payments and service fees payable by food suppliers to resellers.
The service fees for all services rendered to food supplier by retail chains related to market research,
advertising, merchandising, or other "promotional services", logistics, services related to preparing,
processing and packaging of goods must not exceed the above mentioned five percent of the purchase
price. The provision of such services may not be included into a supply contract and may only be
rendered under a separate service contract. This change resulted in the decline of producer sales prices
because retail tried to reimburse the lost income by lower price in the invoices they get from their
suppliers. According to half-year operational report of Cherkizovo: “the implementation of a new trade
law limiting retroactive bonuses also had an impact on the first half average price. On a quarter-on-
quarter basis, the average price decreased by 3 percent to 89.93 ruble per kg, due to the decrease in
bonuses to retail chains, resulting in a negative impact on average prices.”18
Despite the on-going disputes on prices, the development of the modern retail sector had a significant
positive influence on consumption, quality, and producer management practices. Suppliers who
16
The Russian idiomatic term for large national retail chains translates literally as “federal networks”. These include: 1.
“Magnit” market share in 2016 6.8 percent; 2. “X5 Retail Group” 6.4 percent, 3. “Auchan” 2.7 percent, 4.”Dixy” 2.2
percent; 5. “Lenta” 1.9%; 6. “Metro Group” 1.6 percent; 7. Group of companies O’Key 1.2 percent. Source: InfoLine
Market Research Agency http://infoline.spb.ru/infoline-retailer-russia-top-100/index.php 17
The top 10 largest grocery retailers’ account for approximately 20 percent of the Russian broiler meat retail market
(RSATO036 Retail Sector Impacted by Slowing Economy and Inflation) 18
Source: http://cherkizovo.com/en/press/company-news/8571/

11
successfully work with federal retail chains are winning market share in the regions where new stores
are opening. New retail chain shops are bringing fresh chicken meat to distant locations, where mostly
frozen or canned meat had been available. The economic crisis of 2014-2016 resulted in intensification
of consolidation in the retail sector. The share of top seven largest retail chains grew 3.1 percent to 25.7
percent, while smaller regional chains declined 0.5 percent to 27.9 in 2016. Experts anticipate the share
of top-ten leading retailers will continue expansion up to 40 percent of the market19
, regional expansion
will continue in 2018, but most likely at a slower pace. According to a Presidential request, the
government must provide a rationale for restriction of the expansion of the retail chains in the regions,
where the aggregate share of such chains exceeds 50 percent of the market. The response must be given
by August 20, 2017 20
.
Consumer meat prices on retail shelves have being driven by the positive influence of the recovered
demand for pork in the first half of 2017. The general market outlook improved from the last quarter of
2016, when the decline of wholesale pork prices21
coincided with transition of the popular chicken
brands to the maturity/saturation stage of the product life cycle (PLC).
Most of the leading pork producers introduced high quality branded pork products later than chicken and
supported sales by remarkable marketing campaigns. While the product life cycle of the most broiler
brands moved to the maturity stage of PLC, the new pork brands came to the growth stage. Most of the
federal retail chains identified the growing taste for pork and encouraged sales by aggressive promos, in
particular of their private labels. These marketing events coincided with the momentum of the
improving economy and increasing demand for pork after the lingering crisis of 2015-2016. Consumers
are improving their menus by replacing broiler with premium pork products for discounted price; thus
pork became the product of choice for consumers slowly recovering from recession.
Chicken remains the most popular type of meat; according to a July 2017 Retail Audit 22
chicken
accounts for 83.2 percent of sales in absolute numbers in the fresh unpacked meat category, which
accounts for 65 percent of all meat sales in retail. At the same time, experts report a decline of broiler
sales; for example, a GFK consumer panel marked a 4.3 percent decline of poultry meat sales in
absolute numbers in March 2017, compared to March 2016, and sales of poultry in money terms reduced
by one percent in March 2017 23
GFK research showed that all consumer groups are reducing purchases
of chicken meat and increasing purchases of pork. Consumer demand for pork remains strong and
supports pork prices, so the pressure on broiler prices has been naturally reduced.
Chart 4. Comparison of average producer prices for pork (half –carcasses, Central Federal District)
and whole broilers (average , Russia) in 2014-July 2017
19
Five out of seven largest retail chains selling meat and poultry increased number of stores in 2016 : «Magnit» 9,955
convenience stores, 230 hypermarkets, 174 "Family Magnit" supermarkets (approximately 1,130 new grocery stores in
2016); X5 Retail Group total more than 9,000 stores (appox. 2,000 new stores in 2016) ; Group of companies «Dixy» total
2,634 (80 new stores); «Auchan» total 301 stores (37 new stores in 2016); “Lenta” total 190 hyper markets in 77 cities and
50 supermarkets in Moscow , Saint-Petersburg, and Central Federal District (51 new hypermarket and 18 new supermarkets). 20
Article in Russian: “Putin: the Cabinet must decide whether it is necessary to limit the growth of the share of retail chains
in the regions“. TASS, June 9th
2017 http://tass.ru/ekonomika/4326761 21
According to analysis of the National Union of Pork Producers average wholesale pork price was 101.91 Ruble per kg. in
2016 which is 9.6 percent lower than 101.91 Ruble average wholesale price in 2015. Low prices were the main reason for
growth of pork sales in 2016 , beginning of 2017. 22
Source: Nielsen, “Outlook and trends: Russian Meat Market” http://www.nielsen.com/ru/ru/insights/news/2017/meat-
category-retail-audit.html 23
Source:.GfK Rus Presentation “Consumer Trends in the market of meat and meat products” May, 25 2017
(www.gfk.com)

12
Source
: E-Meat
Development of the fast food segment has contributed to growth in broiler consumption in 2015-2016
and will contribute to anticipated future growth along with the geographical expansion of leading
restaurant chains to the Asian part of Russia.24
The fast food sector has been the best performing among foodservice subsectors since the beginning of
the economic crisis in 2014. Chicken is the least expensive meat compared to pork, beef, turkey, and
fish, which makes it the most popular meat ingredient consumed by the fast food sector. Most popular
chains, including Subway, McDonalds, Burger King, KFC, and Russian restaurants Kroshka-Kartoshka
and Teremok currently operate in the largest Russian cities and open new outlets in the regions every
year. Further, the geographical expansion of modern non-food retail indirectly encourages consumption
of chicken meat because fast food chains often open outlets in shopping malls and hypermarkets.
According to RosBusinessConsulting (RBC) research25
of the fast food segment, the food service sector
fared better than other fast-moving consumer goods (FMCG) during the recent crisis: food retail sales
fell 14 percent in 2015-2016 and non-food retail dropped 15 percent, while food service sales declined
only 9 percent. Food service managed through the crisis of 2015-2016 better than in 2008, which
experts explain by new Russian eating habits. Modern Russians eat out more frequently than a decade
ago. Eating out has become a new habit, a new part of the culture. RBC’s research shows that 70
percent of the residents of the major Russian cities have visited fast-food outlets several times a month
spending on average 150-300 Rubles per visit. Eating out is the third most popular paid leisure-time
24
Burger King opened 100 new restaurants in 2016. KFC plans to open 100 new restaurants in 2017 , Mc Donald’s plans to
expand in Ural and Sibir. 25
Source: marketing.rbc.ru “Points of Growth – Trends in Foodservice Market” presentation based on market research
“Russian Restaurant Chains in 2016”.

13
activity, following going to movie theaters and shopping. Despite the recent economic turbulence, the
share of those who frequently eat out increased from 41 percent in 2013 to 50 percent in 2016. RBC
estimated that 5-6 percent of consumers switched to fast food restaurants from more expensive
restaurant options during the crisis. The number of fast food outlets increased 11 percent in 2014, 3
percent in 2015, and was anticipated to grow one percent in 2016. Although RBC experts anticipate a
0.5-1.5 percent reduction of the total number of fast food outlets in 2017, those that opened in 2016 will
continue to create additional demand for chicken meat.

14
Broiler Meat Trade
FAS Moscow anticipates 225,000 MT of broiler imports in 2018 unchanged from the updated 2017
estimate, which was increased by 25,000 MT to show 2 percent annual growth. Broiler meat imports
increased 15 percent in January-May 2017 year-on-year compared to the same months of 2016. Market
was favorable for the imports mostly due to strong ruble and stable demand for frozen chicken meat
from the plants supplying chicken products to fast food restaurant chains. Also, the AI outbreak that hit
the Russian market in winter 2016-spring 2017 created additional opportunities for imports of frozen
chicken meat. The market conditions in the second part of the year most likely will be less favorable for
imports, based on the expectations of boosted domestic broiler meat production and a weaker Ruble in
the second half of the year.
Chart 5. Imports of Broiler Meat and Ruble Exchange Rate to US Dollar in 2014-May 2017 (1,000 MT)
Source: Federal Customs Service
Belarus, Brazil and Argentina together accounted for 99 percent of Russia’s broiler meat imports and
will remain the main exporters in 2018. The counter-sanctions import restrictions will continue to
influence broiler meat trade26
with a number of western countries, including the United States, through
December 31, 2018. On June 30, 2017, President Putin signed decree No. 293 extending Russia’s ban
26
Not all PSD reportable poultry products are banned, for example Commodity HS Code 160232 “Prepared or Preserved
Chiken Meat, Meat Offal or Blood, N.E.S.O.I.” is not included to the list of banned products. Some products, including 10
MT of HS Code 0207141009, “Meat of chicken, frozen, boneless, and organic” intended for the production of baby food
were excluded from the ban in 2016. The decision was taken to support the operations of the large baby food production
plant in Kalinigrad region. (Please refer to RS1628 Organic Baby Food Inputs Excluded from Russian Food Ban,

15
on the import of agricultural products from the countries that applied economic sanctions against Russia.
(Please refer to GAIN reports RS1741 for detailed information).
Despite the turbulence in the market after the Brazilian “meat scandal” and the exclusion of nine
Brazilian poultry exporters from the VPSS eligible suppliers list in June 2017, the market remains open
for Brazilian poultry. Exports of frozen chicken from Brazil actually increased 6 percent in absolute
numbers in January-June 2017 to 50,014 MT compared to the same months of 2016. The total value of
this trade increased by approximately 44 percent, as the ruble appreciated against the US dollar and the
Brazilian Real. Brazil will likely remain the main supplier of imported frozen chicken cuts (HS Code
020714) in 2018. Russia also increased shipments of frozen chicken cuts (HS 020714) from Argentina.
Argentina exported 8,389 MT of frozen chicken to Russia in January-May 2017, a 264.5 percent growth
year-to date. Imported frozen chicken mainly goes to processing plants and good demand from growing
fast food chains contributed to growth of imports.
In-quota imports accounted for approximately 56 percent of broiler meat shipments from Latin America.
According to estimates from the meat market information agency E-meat, importers shipped 30.2
thousand MT of broiler meat under TRQ27
in the first half of 2017, while total shipments of products
under HS code 0207 was 52,100 MT. The in-quota imports increased by approximately 35 percent
compared to in the first half of 2016, while the out of quota imports decreased 12 percent. The
distribution of quotas within TRQs on poultry (as well as on pork and beef) is based on the 3-year
historical shares of the importers. Those importers who got a license and shipped more products in and
out of quota in 2015-2017 will receive a bigger in-quota volume in 201828
and 2019. The assumption is
that those companies that now import products out of quota at the 80 percent rate will more likely utilize
quotas the next year. The trend will continue in 2018, and most of the imported poultry will be shipped
to Russia by companies eligible to import meat at a reduced tariff rate.
Belarus, the largest chicken meat exporter to Russia, is a member of the Eurasian Economic Union
(EAEU), Products from Belarus are shipped at zero custom tariffs but are subject to veterinary and
quality control on the border. VPSS detections of food safety noncompliance of products imported from
within the EAEU frequently result in interruptions of trade and add uncertainty to the market. However,
despite the continual conflicts between Belarus exporters and Russia’s veterinarians and temporary
suspensions on imports from certain plants, Belarus has increased its broiler exports and its market share
in Russia since August 2014. The share increased from 21 percent in 2014 to 51 percent in 2016, the
annual shipments grew from 94,144 MT in 2014 to 112,545 MT in 2016. According to statistical data
of the Federal Customs Service of Russia, imports from Belarus increased 18 percent in January-May
2017, but the volume of imports will likely decline in the second part of the year to stabilize at 100,000
27
Russia’s WTO commitments allow importers to ship 250,000 MT of HS codes 0207142001 and 0207146001 “Frozen
bone-in chicken halves or quarters and frozen bone-in chicken legs and cuts” under 25% in-quota tariff rate (compare to 80%
out of quota tariff). Poultry trade within the Eurasian Economic Union 28
On December 08, 2016 the Russian Government issued a decree No. 1322 on the distribution of Russia’s 2017 tariff-rate
quotas (TRQs) for beef, pork, and poultry. The TRQ allocations and the mechanism of their distribution as established in the
decree above appear to be consistent with Russia’s WTO commitments. The total amount of “Meat and edible byproducts of
poultry under heading 0105, fresh, chilled, or frozen (EAEU HS Code 0207) is 364,000 MT including: 100,000 MT of
“Frozen deboned chicken meat (EAEU HS Code 0207 14 1001)” and 250,000 MT of “Frozen bone-in chicken halves or
quarters and frozen bone-in chicken legs and cuts thereof (EAEU HS Codes 0207 14 200 1 and 0207 14 600 1)”. Link to the
Decree in Russian: http://pravo.gov.ru/laws/acts/94/49515050.html

16
/110,000 MT of annual imports in 2017/2018. The agricultural forecast29
of the Eurasian Economic
Commission anticipates the decline of broiler meat imports into Russia from all EAEU suppliers in 2017
compared to 2016 and an annual 2.8 percent decline of broiler meat production in Belarus due to the
reduced demand from Russia.
Chart 6. Russia: Broiler Meat Imports in 2013-2016 and in Jan-May 2017
(1,000 MT, Product Weight)
Source: Federal Customs Service of Russia
FAS/USDA estimates the share of local chicken products in total consumption at 97-98 percent, and
anticipates it to remain stable in the midterm. For several years the Government of the Russian
Federation has pursued a policy to minimize the share of imported food consumed by Russians. The
January 2010 “Doctrine on food security” set production goals for eight sensitive commodities: grain,
sugar, vegetable oil, meat and meat products, milk and dairy products, fish products, potatoes, and salt.
The target for domestically produced meat in total consumption had been set at 85 percent, without
specification of the share of broiler meat. Russia’s Ministry of Agriculture announced that the broiler
industry reached the capacity required by the food security doctrine in 2016 and declared new goal for
broiler producers – the development of exports. As mentioned above the state agricultural policy was
amended in March 2017 to add a new priority project for export support. The goal of the priority project
is to create a system for promotion of agricultural exports from Russia and ensure product compliance
with the requirements of the importing countries.
Chart 7 . Russia: Broiler Meat Exports in 2013-2016 and in Jan-May 2017 (1,000 MT, Product Weight)
29
Source: EEC Draft “Joint Forecast of Agricultural Production, Supply and Demand Balances … in 2017-2018”
https://docs.eaeunion.org/pd/ru-ru/0101889/pd_17072017

17
Source: Federal Customs Service of Russia
Includes data attributable to some products which are not reported in the PSD
The Presidential Council for Strategic Development and Priority Projects released the Passport for
Priority Project 'Export of Agricultural Production' on November 30, 2016: the Project objective is to
increase total value of the Russian agriculture export from the current $16.9 billion in 2016 to $19
billion in 2018, to $21.4 billion in 2020 and up to projected $30 billion in 2025. The total budget for the
project in is 2,408.45 million rubles ($40.13 million) between 2016 and 2020, with 728.43 million rubles
($12.14 million) in 2017.30
2017 broiler export forecast remains unchanged at 115,000 MT despite the weak start of the year for
Russian exporters. Avian Influenza and the strong ruble constrained the growth of exports in the first
half of 2017. Russia decreased PSD reportable broiler exports by 8 percent in January-May 2017, to
42,710 MT. FAS/Moscow anticipates the exports improvement in the second part of the year, based on
the expectations of softer Ruble and the high probability of the opening of new markets for Russia’s
broiler meat. FAS/Moscow’s conservative forecast increases broiler exports from Russia by 5,000 MT
to 120,000 MT in 2018, as key markets remain closed.
In January-May 2017 Russia exported 19,804 MT of broiler meat to two Eastern regions of Ukraine, an
increase of 20 percent compared to 2016. The Donetsk and Luhansk regions of Ukraine became the
major destination of broiler exports from Russia accounting for 33 percent of total exports. Kazakhstan
and Vietnam, the traditional key export markets, accounted for 30 and 20 percent respectively. Russia
significantly increased exports of frozen chicken, mostly chicken paws, to Vietnam to 18,194 MT for the
five months of the current year, 854 percent growth year-to-date.
30
Official Information in Russian on the implementation of the program: http://mcx.ru/press-service/news/aleksandr-
tkachev-realizatsiya-proekta-eksport-produktsii-apk-idet-po-grafiku/ ; http://government.ru/govworks/557/events/

18
Russian industry has the potential to increase exports by an additional 70,000-100,000 MT in 2018 in
case of demand from international buyers. In 2015-2016, Rosselkhoznadzor started negotiations with
many potential buyers and hosted veterinary inspectors from several countries including Azerbaijan,
Vietnam, China, UAE, Egypt, Iran, Tanzania, and Japan. As a result of the joint efforts by business and
government Russia started exports to UAE and Egypt in 2016.

19
Production Tables
Table 2. Russia: Poultry Production by Region, 1,000 MT, Live Weight, Agricultural organizations
Regions Jan-Jun
2016
Jan-Jun
2017
Ratio of 2017 to
2016 (%, YTD)
RUSSIAN FEDERATION* 2838.8 2993.4 105.4
CENTRAL DISTRICT 1062.0 1184.6 111.5
Belgorod region 403.5 425.1 105.4
Bryansk region 127.0 136.5 107.5
Vladimir region 13.7 13.5 98.9
Voronezh region 59.0 57.9 98.2
Ivanovo region 10.4 11.7 112.3
Kaluga region 32.4 35.6 109.8
Kostroma region 3.2 3.1 96.7
Kursk region 70.9 84.4 119.0
Lipetsk region 91.5 91.6 100.2
Moscow region 95.8 107.5 112.2
Orel region 7.7 8.4 108.1
Ryazan region 1.8 1.8 97.5
Smolensk region 0.1 0.2 113.3
Tambov region 59.7 100.5 168.3
Tver region 32.0 32.0 100.1
Tula region 24.9 43.0 173.0
Yaroslavl region 28.4 31.8 111.8
Moscow
NORTHWEST DISTRICT 251.3 263.1 104.7
The Republic of Karelia 2.4
The Republic of Komi 10.6 10.4 98.6
Arkhangelsk region 1.1 1.0 94.8
Arkhangelsk region (excluding Nenets Autonomous
District)
1.1 1.0 94.8
Vologda region 7.3 8.4 114.5
Kaliningrad region 12.5 14.5 115.4
Leningrad Region 148.0 157.2 106.2
Murmansk region 0.04 …
Novgorod region 57.9 59.2 102.2
Pskov region 11.4 12.4 108.3
SOUTHERN DISTRICT 227.4 223.5 98.3
The Republic of Adygea 5.6 1.1 20.4
The Republic of Kalmykia
Krasnodar Krai 99.6 106.2 106.6
Astrakhan region 3.4 0.4 11.6
Volgograd region 30.4 40.0 131.4

20
Rostov region 60.6 51.3 84.8
NORTH-CAUCASIAN FEDERAL DISTRICT 172.6 184.4 106.9
The Republic of Dagestan 10.4 10.9 105.4
The Republic of Ingushetia 0.01
Kabardino-Balkaria 13.2 13.2 99.4
Karachay-Cherkessia 6.4 7.2 112.5
Republic of North Ossetia-Alania 1.0 1.3 128.8
The Chechen Republic 0.3 0.1 43.2
Stavropol Krai 141.2 151.6 107.4
THE VOLGA FEDERAL DISTRICT 606.8 618.0 101.8
The Republic of Bashkortostan 24.7 39.2 158.9
The Republic of Mari El 104.9 91.5 87.2
The Republic of Mordovia 96.7 104.7 108.2
The Republic of Tatarstan 94.4 94.0 99.6
Udmurt Republic 24.8 26.9 108.4
Chuvash Republic 30.9 27.6 89.3
Perm Krai 24.3 24.7 101.6
Kirov region 0.8 0.8 94.9
Nizhny Novgorod region 34.4 37.0 107.5
Orenburg region 23.2 22.8 98.4
Penza region 107.0 108.7 101.6
Samara region 26.8 26.5 98.9
Saratov region 13.3 13.4 100.8
Ulyanovsk region 0.7 0.3 49.0
URAL FEDERAL DISTRICT 280.5 274.6 97.9
Kurgan region 6.0 7.1 117.4
Sverdlovsk region 70.2 66.4 94.7
Tyumen region (including Khanty-Mansi Autonomous
District Yugra and Yamal-Nenets Autonomous
District)Tyumen Region
23.0 24.5 106.2
Chelyabinsk region 181.3 176.6 97.4
SIBERIAN FEDERAL DISTRICT 208.9 212.6 101.8
The Republic of Altay
The Republic of Buryatia 0.03 0.02 79.9
The Republic of Tyva 0.04
The Republic of Khakassia
Altay Krai 40.1 37.7 94.2
Trans-Baikal Krai
Krasnoyarsk Krai 5.9 12.0 202.9
Irkutsk Region 29.2 29.9 102.3
Kemerovo region 21.6 20.6 95.4
Novosibirsk region 40.4 39.8 98.4
Omsk Region 33.5 33.5 99.8

21
Tomsk region 38.1 39.1 102.5
FAR EASTERN FEDERAL DISTRICT 29.4 32.6 110.8
The Republic of Sakha (Yakutia) 1.4 1.3 92.4
Kamchatka 0.2 0.3 150.4
Primorsky Krai 11.5 17.6 153.7
Khabarovsk Krai 3.9 0.5 12.1
Amur Region 12.0 11.8 98.0
Magadan Region 0.2 0.2 75.7
Sakhalin Region 0.3 1.0 355.3
Note: Includes data attributable to some products which are not reported in the PSD
Source: Rosstat; Agricultural Production *Preliminary 2016 data, Excluding Crimean Production
Table 4. Russia: Monthly Industrial Production of Poultry Meat and Sub-products
2013 2014 2015 2016 2017*
Jan 291,755 304,336 347,493 361,652 381,121
Feb 278,558 295,619 335,032 365,496 366,733
March 298,192 318,354 369,696 390,465 414,754
April 301,791 337,239 365,415 386,165 404,462
May 294,987 327,616 359,096 377,498 392,331
June 276,173 306,967 340,366 364,698 367,866
July 293,795 316,318 350,135 351,939
Aug 281,769 316,412 347,639 352,447
Sept 289,114 325,619 357,192 357,952
Oct 304,823 338,530 379,225 374,361
Nov 296,723 336,464 370,168 374,910
Dec 332,032 361,474 390,481 399,578
Note: Includes data attributable to some products which are not reported in the PSD
Source: Rosstat; “Processing Industry” data
* starting January 2017, the National Product Classification System, OKPD 2 is used (All-Russian
Classification of Products by Economic Activities) For detailed information please refer to
https://www.fedstat.ru/indicator/57783 and https://www.fedstat.ru/indicator/40636

22
Table 5. Poultry Producers – Operational and Finical Indicators
2015 2016 2016/2015
FCR (kg. feed per one kg weight gain ) 1.87 1.85 -1.07%
Feed price, Rub/kg 17.56 20.2 15.03%
Share of feed cost in total operating cost (%) 43.78 47.65 8.84%
Operating cost (Ruble per 1 kg. of live weight) 52.28 56.65 8.36%
Operating cost (ruble per 1 kg. of slaughter weight) 79.52 85.32 7.29%
Producer’ sale price (ruble per 1 kg.) 96.55 96.73 0.19%
Net Profit per 1 kg (ruble) 17.03 11.41 -33.00%
Net Profit Margin (%) 10.4 3.1 -70.19%
Source: Agro Investor Magazine N2 (9909) February 2017, Rospitsesoyuz
Trade Tables
Table 6. Russia: Import Volume of Broiler Meat, 2013 – 2016 & Year To Date: 05/2016 &05/2017, MT
(020711, 020712, 020713, 020714, 160232)
2013 2014 2015 2016 Jan-May
2016
Jan-May
2017
% Change
YTD 2017/16
World 511,718 443,652 249,100 219,892 74,441 85,602 14.99%
Brazil 48,367 117,785 92,977 90,543 31,655 31,317 -1.07%
Belarus 82,501 94,058 120,478 112,545 40,264 47,572 18.15%
United States 266,236 137,713 0 0 0 0 0.00%
Argentina 8,221 21,699 8,659 13,124 1,767 5,993 239.16%
Turkey 0 16,040 21,152 1 1 0 -100.00%
EU-28 64,946 45,437 201 174 92 41 -55.43%
Kazakhstan 147 2,893 3,729 2,277 597 463 -22.45%
Ukraine 39,691 7,036 1,488 197 0 60 N/A
Paraguay 0 0 0 881 0 25 N/A
All Others 1,609 991 416 150 65 131 101.54%
Source: Federal Customs Service of Russia

23
Table 7. Russia: Export Volume of Broiler Meat, 2011 – 2016 & Year to Date: 05/2016 & 05/2017, MT
(020711, 020712, 020713, 020714, 160232)
2013 2014 2015 2016 Jan-May
2016
Jan-May
2017
% Change Jan-
May 2017/16
World 55,631 63,192 75,914 118,611 48,466 60,904 25.66%
Ukraine 14 2 16,697 36,143 16,560 19,804 19.59%
Vietnam 1,421 5,216 3,206 13,120 1,905 18,194 855.07%
Kazakhstan 30,218 23,660 35,676 33,388 16,514 12,165 -26.34%
Kyrgyzstan 371 1,135 6,780 8,675 3,806 4,772 25.38%
Armenia 329 387 667 1,781 705 1,157 64.11%
Tajikistan 11 30 720 2,986 1,836 980 -46.62%
UAE 21 0 0 1,738 325 939 188.92%
Belarus 658 3,009 2,389 1,895 738 614 -16.80%
Abkhazia 1,256 1,341 1,335 1,698 531 536 0.94%
Azerbaijan 151 241 125 586 265 413 55.85%
Egypt 0 0 0 1,754 0 270 N/A
Thailand 2,447 1,834 405 113 56 247 341.07%
Hong
Kong 14,683 24,236 5,405 10,425 3,536 153 -95.67%
Mongolia 23 62 376 1378 581 79 -86.40%
Liberia 1,459 946 1,412 130 130 0 -100%
All Others 2,569 1,093 721 2,801 978 581 -40.59%
Source: Federal Customs Service of Russia; Includes data attributable to some products which are not
reported in the PSD