Russian defense industry and arms trade: facts and figures
22
Russian defense industry and arms trade: facts and figures prepared by the Centre for Analysis of Strategies and Technologies Contents 1. Russian arms exports 2. Russian defense budget and procurement 3. Key current contracts for Russian arms exports 4. Ranking of the top Russian defense companies More detailed information can be found in the Eksport Vooruzheniy or Moscow Defense Brief journals published by CAST. For subscription, please visit http://cast.ru/eng/.
Transcript of Russian defense industry and arms trade: facts and figures
Russian defense industry and arms trade: facts and figures prepared by the Centre for Analysis of Strategies and Technologies Contents 1. Russian arms exports 2. Russian defense budget and procurement 3. Key current contracts for Russian arms exports 4. Ranking of the top Russian defense companies More detailed information can be found in the Eksport Vooruzheniy or Moscow Defense Brief journals published by CAST. For subscription, please visit http://cast.ru/eng/.
© 1997-2012 Centre for Analysis of Strategies & Technologies (www.cast.ru) 2
1. Russian arms exports The key indicators used to quantify Russian arms exports include: • value of deliveries made over the reported year (i.e. the worth of the arms and
military equipment already delivered); • revenue (money received under arms contracts); • accumulated value of arms contracts signed during the year; and • accumulated portfolio of contracts by the year's end.
The headline figure for arms exports is usually the value of deliveries made. But in any event, a distinction must be made between the four key indicators listed above, as they are sometimes confused by journalists, who unwittingly misinterpret the source figures and draw the wrong conclusions. Starting from 2007, Rosoboronexport, a state-owned company, has been the only Russian entity that holds the full license to export arms and military equipment. Previously, similar licenses were also held by RSK MiG aircraft corporation (Moscow), KBP instrument design bureau (Tula), KBM machine-building design bureau (Kolomna, Moscow region) and NPOmash research and production company (Reutov, Moscow region). Now defense companies (only 22 of them) can export only spare parts and components for weapons systems exported via Rosoboronexport. It is therefore useful to make a distinction between:
• total Russian arms exports; • exports via Rosoboronexport (ROE); and • exports of independent spare parts suppliers.
It must be taken into account that total exports do not equal ROE exports plus direct spare parts contracts signed by independent supplies. The difference is made of deliveries still being made under weapons system contracts signed by MiG, KBP, KBM and NPOmash prior to 2007, when ROE became the sole authorized Russian arms exporter. Also, as far as we know, NPOmash has the right to extend previously signed supply contracts with India under the BrahMos Aerospace, a 50-50 joint venture between Russia and India. Essentially that means that NPOmash has partially retained its status as an independent arms exporter1.
1 BrahMos is NPOmash's main export project. The joint venture develops and manufactures various versions of the eponymous anti-ship missile.
© 1997-2012 Centre for Analysis of Strategies & Technologies (www.cast.ru) 3
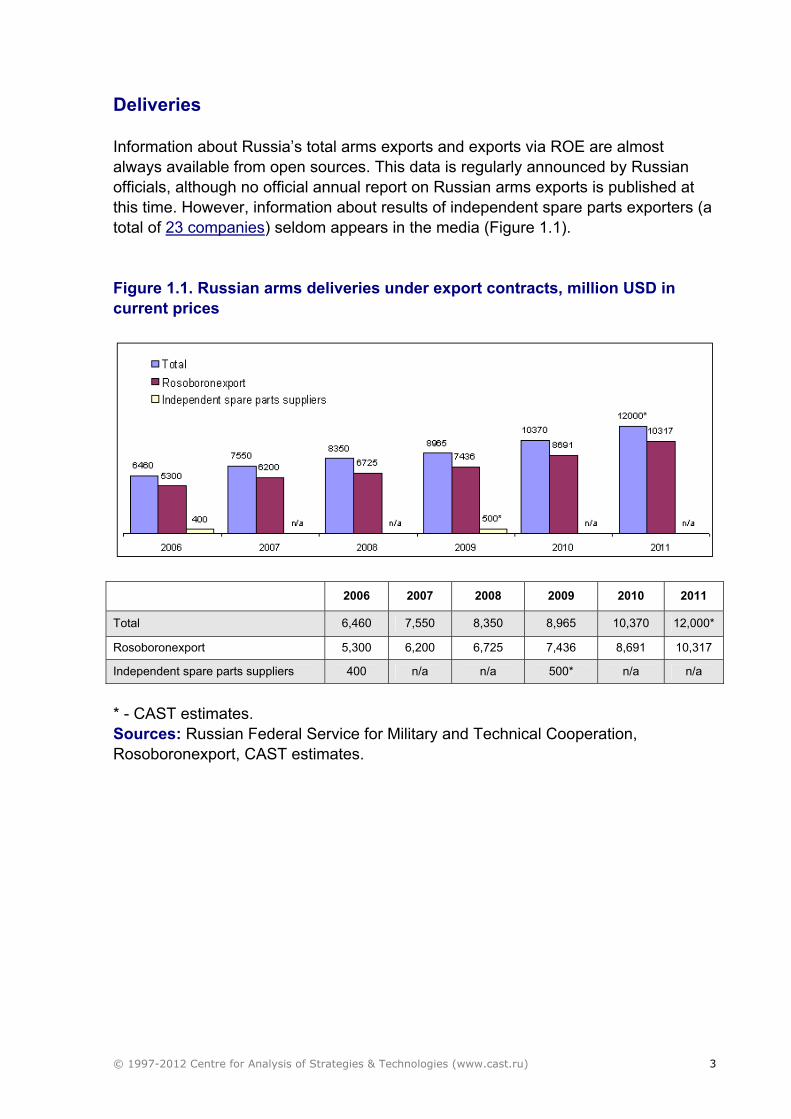
Deliveries Information about Russia’s total arms exports and exports via ROE are almost always available from open sources. This data is regularly announced by Russian officials, although no official annual report on Russian arms exports is published at this time. However, information about results of independent spare parts exporters (a total of 23 companies) seldom appears in the media (Figure 1.1). Figure 1.1. Russian arms deliveries under export contracts, million USD in current prices
2006 2007 2008 2009 2010 2011
Total 6,460 7,550 8,350 8,965 10,370 12,000*
Rosoboronexport 5,300 6,200 6,725 7,436 8,691 10,317
Independent spare parts suppliers 400 n/a n/a 500* n/a n/a
* - CAST estimates. Sources: Russian Federal Service for Military and Technical Cooperation, Rosoboronexport, CAST estimates.
© 1997-2012 Centre for Analysis of Strategies & Technologies (www.cast.ru) 4
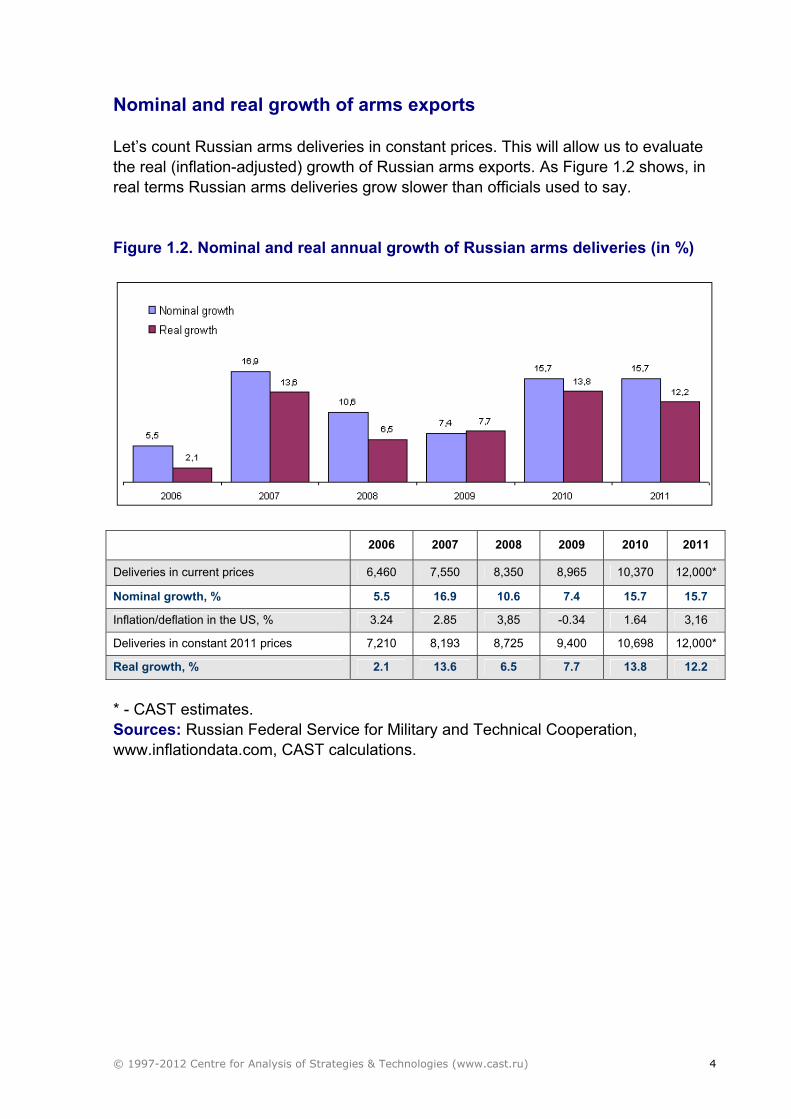
Nominal and real growth of arms exports Let’s count Russian arms deliveries in constant prices. This will allow us to evaluate the real (inflation-adjusted) growth of Russian arms exports. As Figure 1.2 shows, in real terms Russian arms deliveries grow slower than officials used to say. Figure 1.2. Nominal and real annual growth of Russian arms deliveries (in %)
2006 2007 2008 2009 2010 2011
Deliveries in current prices 6,460 7,550 8,350 8,965 10,370 12,000*
Nominal growth, % 5.5 16.9 10.6 7.4 15.7 15.7
Inflation/deflation in the US, % 3.24 2.85 3,85 -0.34 1.64 3,16
Deliveries in constant 2011 prices 7,210 8,193 8,725 9,400 10,698 12,000*
Real growth, % 2.1 13.6 6.5 7.7 13.8 12.2
* - CAST estimates. Sources: Russian Federal Service for Military and Technical Cooperation, www.inflationdata.com, CAST calculations.
© 1997-2012 Centre for Analysis of Strategies & Technologies (www.cast.ru) 5
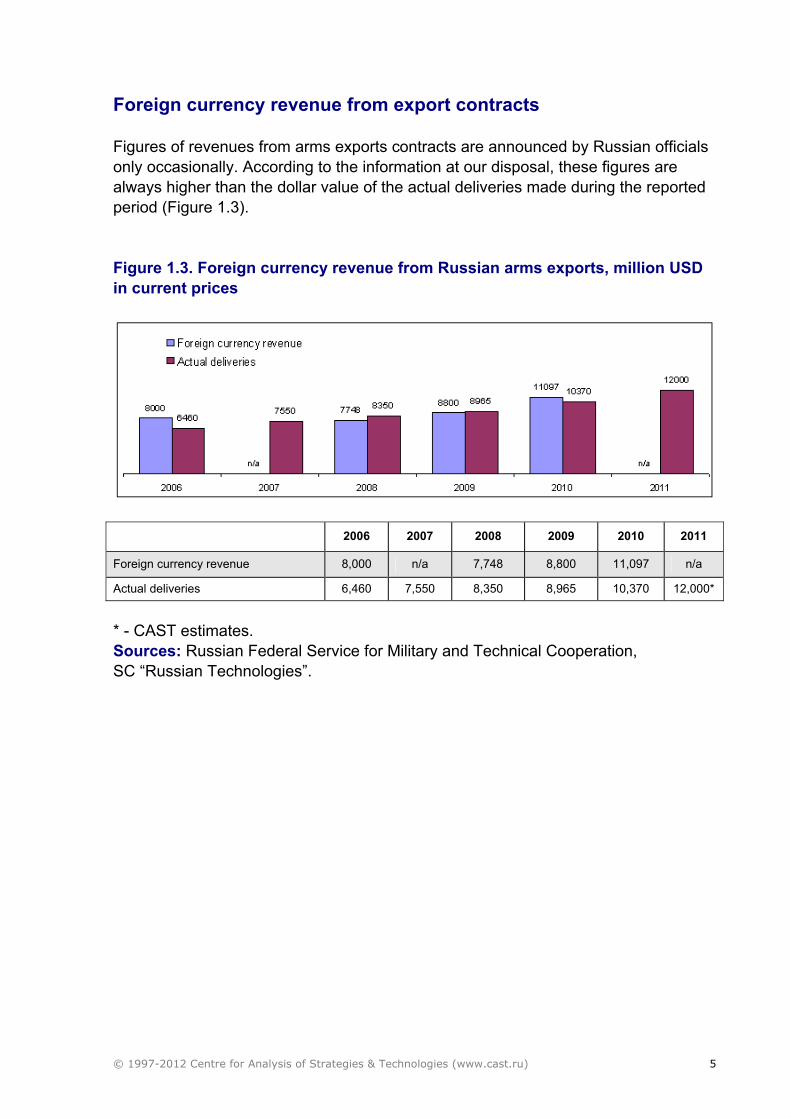
Foreign currency revenue from export contracts Figures of revenues from arms exports contracts are announced by Russian officials only occasionally. According to the information at our disposal, these figures are always higher than the dollar value of the actual deliveries made during the reported period (Figure 1.3). Figure 1.3. Foreign currency revenue from Russian arms exports, million USD in current prices
2006 2007 2008 2009 2010 2011
Foreign currency revenue 8,000 n/a 7,748 8,800 11,097 n/a
Actual deliveries 6,460 7,550 8,350 8,965 10,370 12,000*
* - CAST estimates. Sources: Russian Federal Service for Military and Technical Cooperation, SC “Russian Technologies”.
© 1997-2012 Centre for Analysis of Strategies & Technologies (www.cast.ru) 6
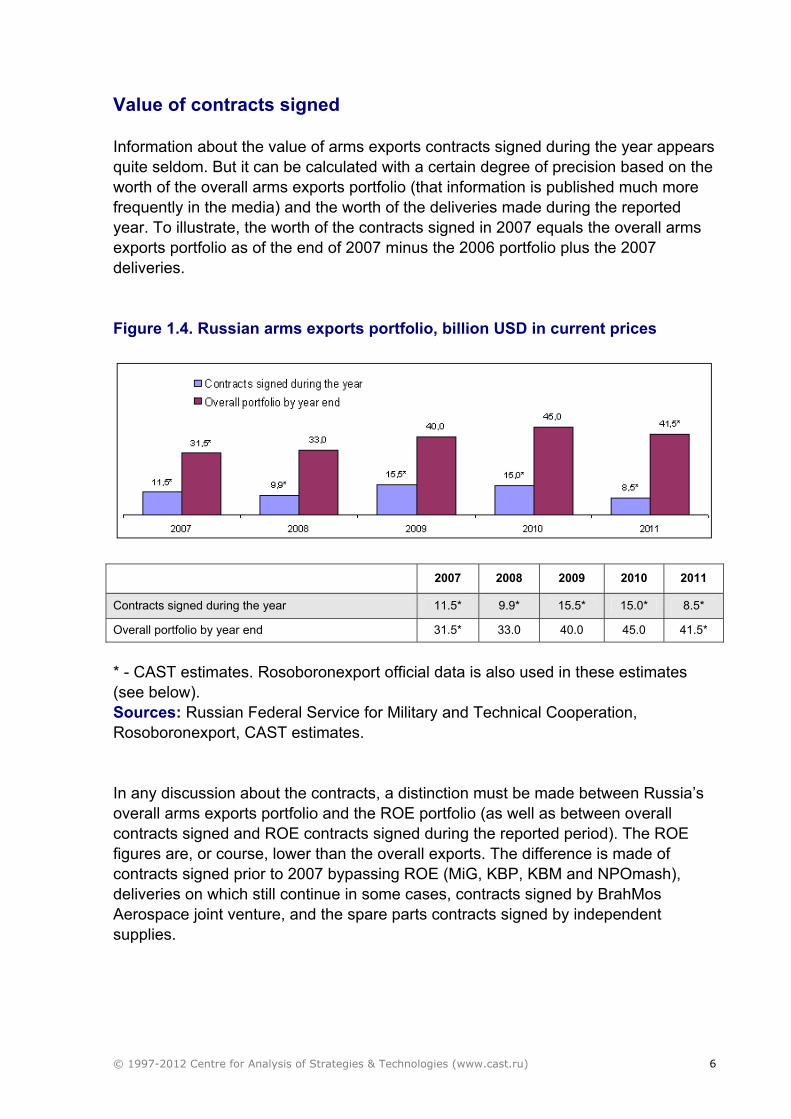
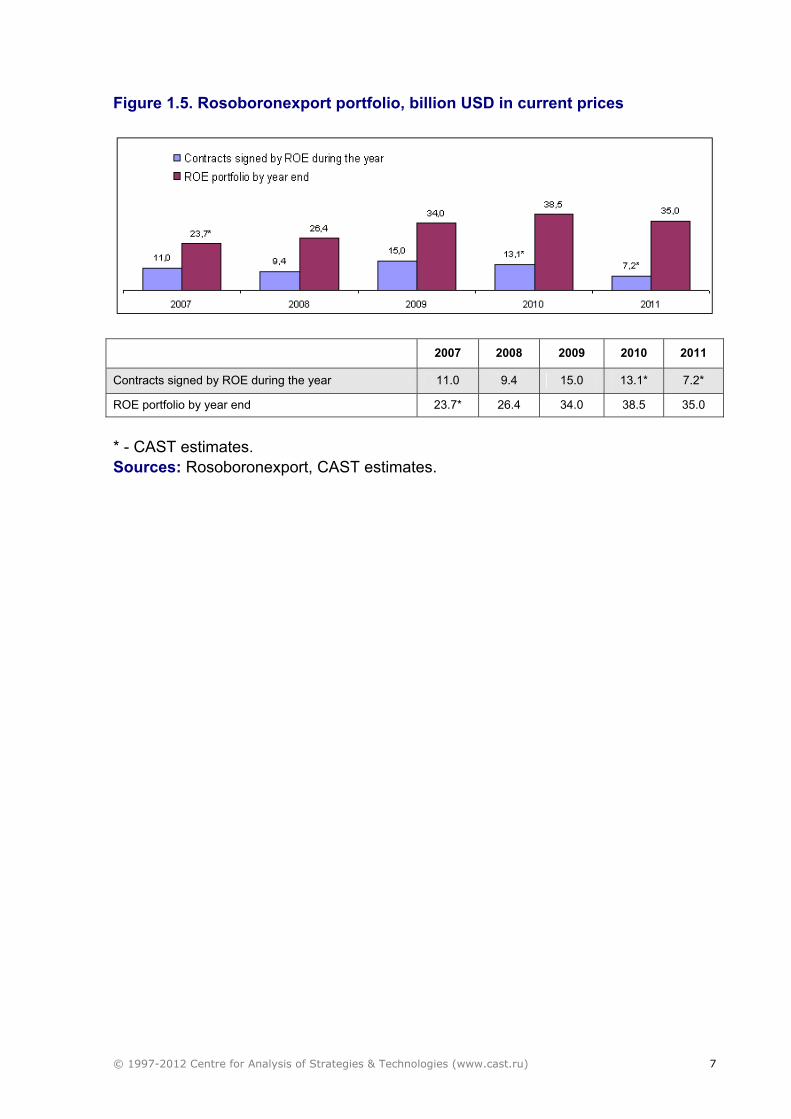
Value of contracts signed Information about the value of arms exports contracts signed during the year appears quite seldom. But it can be calculated with a certain degree of precision based on the worth of the overall arms exports portfolio (that information is published much more frequently in the media) and the worth of the deliveries made during the reported year. To illustrate, the worth of the contracts signed in 2007 equals the overall arms exports portfolio as of the end of 2007 minus the 2006 portfolio plus the 2007 deliveries. Figure 1.4. Russian arms exports portfolio, billion USD in current prices
2007 2008 2009 2010 2011
Contracts signed during the year 11.5* 9.9* 15.5* 15.0* 8.5*
Overall portfolio by year end 31.5* 33.0 40.0 45.0 41.5*
* - CAST estimates. Rosoboronexport official data is also used in these estimates (see below). Sources: Russian Federal Service for Military and Technical Cooperation, Rosoboronexport, CAST estimates. In any discussion about the contracts, a distinction must be made between Russia’s overall arms exports portfolio and the ROE portfolio (as well as between overall contracts signed and ROE contracts signed during the reported period). The ROE figures are, or course, lower than the overall exports. The difference is made of contracts signed prior to 2007 bypassing ROE (MiG, KBP, KBM and NPOmash), deliveries on which still continue in some cases, contracts signed by BrahMos Aerospace joint venture, and the spare parts contracts signed by independent supplies.
© 1997-2012 Centre for Analysis of Strategies & Technologies (www.cast.ru) 7
Figure 1.5. Rosoboronexport portfolio, billion USD in current prices
2007 2008 2009 2010 2011
Contracts signed by ROE during the year 11.0 9.4 15.0 13.1* 7.2*
ROE portfolio by year end 23.7* 26.4 34.0 38.5 35.0
* - CAST estimates. Sources: Rosoboronexport, CAST estimates.
© 1997-2012 Centre for Analysis of Strategies & Technologies (www.cast.ru) 8
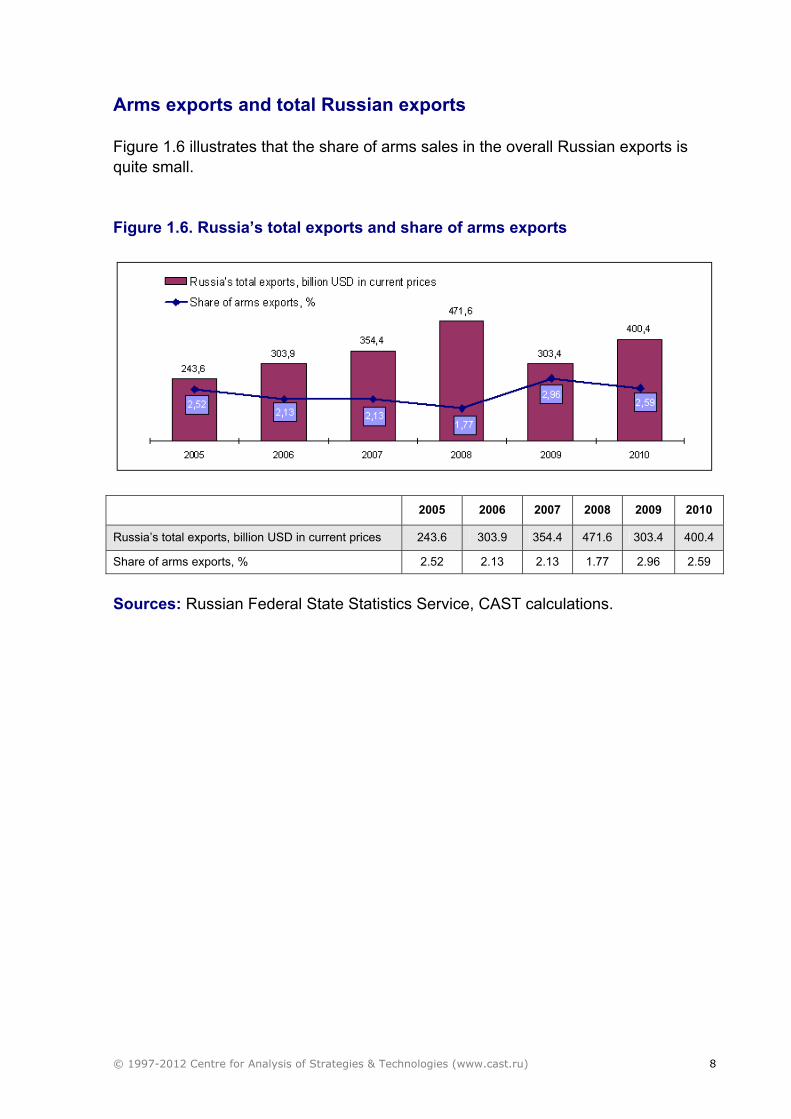
Arms exports and total Russian exports Figure 1.6 illustrates that the share of arms sales in the overall Russian exports is quite small. Figure 1.6. Russia’s total exports and share of arms exports
2005 2006 2007 2008 2009 2010
Russia’s total exports, billion USD in current prices 243.6 303.9 354.4 471.6 303.4 400.4
Share of arms exports, % 2.52 2.13 2.13 1.77 2.96 2.59
Sources: Russian Federal State Statistics Service, CAST calculations.
© 1997-2012 Centre for Analysis of Strategies & Technologies (www.cast.ru) 9
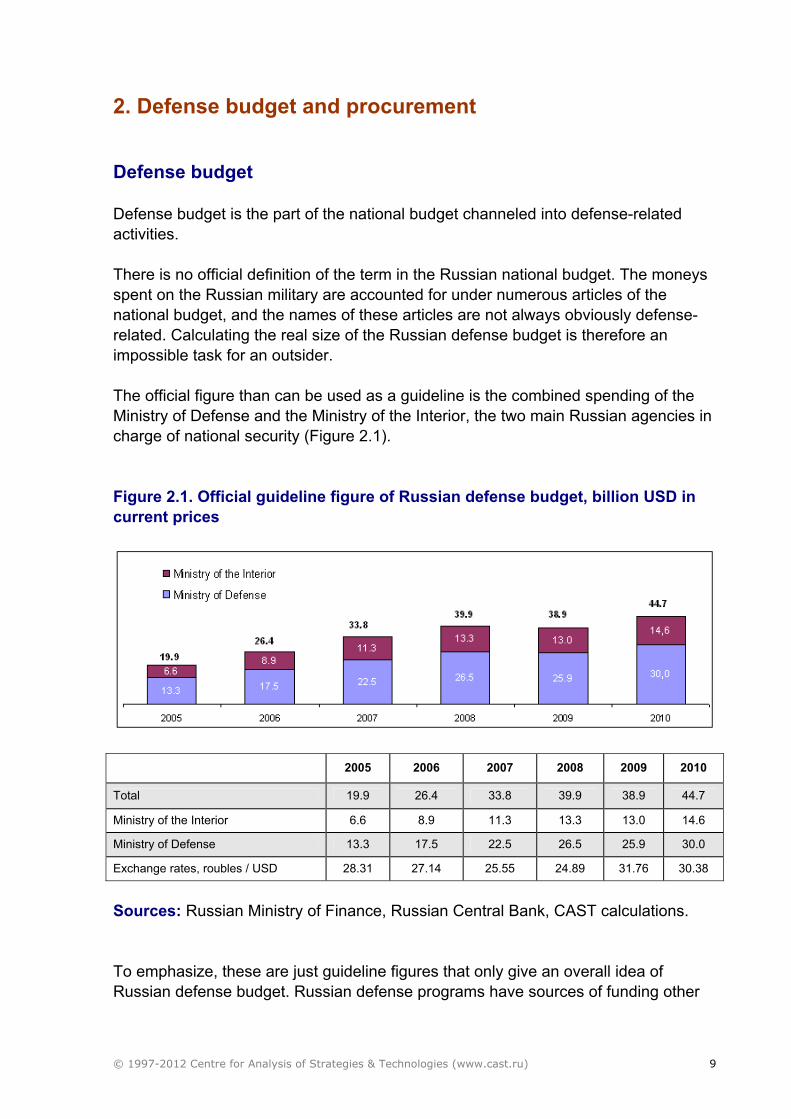
2. Defense budget and procurement Defense budget Defense budget is the part of the national budget channeled into defense-related activities. There is no official definition of the term in the Russian national budget. The moneys spent on the Russian military are accounted for under numerous articles of the national budget, and the names of these articles are not always obviously defense-related. Calculating the real size of the Russian defense budget is therefore an impossible task for an outsider. The official figure than can be used as a guideline is the combined spending of the Ministry of Defense and the Ministry of the Interior, the two main Russian agencies in charge of national security (Figure 2.1). Figure 2.1. Official guideline figure of Russian defense budget, billion USD in current prices
2005 2006 2007 2008 2009 2010
Total 19.9 26.4 33.8 39.9 38.9 44.7
Ministry of the Interior 6.6 8.9 11.3 13.3 13.0 14.6
Ministry of Defense 13.3 17.5 22.5 26.5 25.9 30.0
Exchange rates, roubles / USD 28.31 27.14 25.55 24.89 31.76 30.38
Sources: Russian Ministry of Finance, Russian Central Bank, CAST calculations. To emphasize, these are just guideline figures that only give an overall idea of Russian defense budget. Russian defense programs have sources of funding other
© 1997-2012 Centre for Analysis of Strategies & Technologies (www.cast.ru) 10
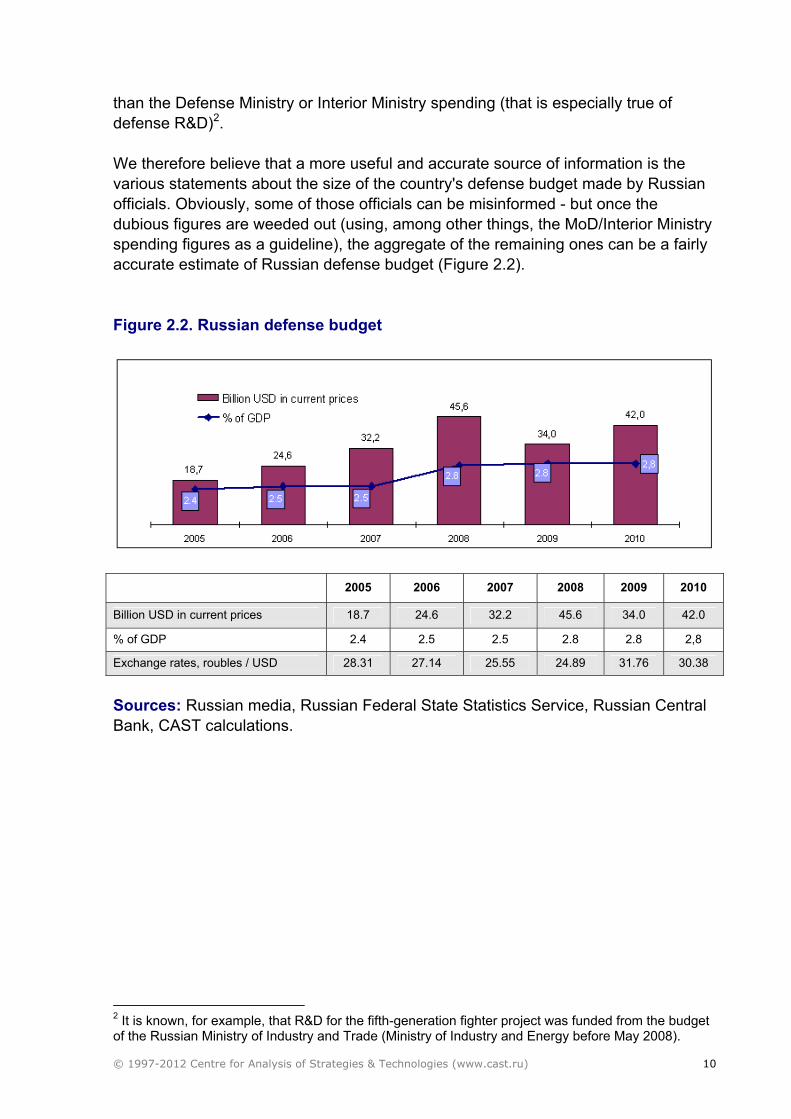
than the Defense Ministry or Interior Ministry spending (that is especially true of defense R&D)2. We therefore believe that a more useful and accurate source of information is the various statements about the size of the country's defense budget made by Russian officials. Obviously, some of those officials can be misinformed - but once the dubious figures are weeded out (using, among other things, the MoD/Interior Ministry spending figures as a guideline), the aggregate of the remaining ones can be a fairly accurate estimate of Russian defense budget (Figure 2.2). Figure 2.2. Russian defense budget
2005 2006 2007 2008 2009 2010
Billion USD in current prices 18.7 24.6 32.2 45.6 34.0 42.0
% of GDP 2.4 2.5 2.5 2.8 2.8 2,8
Exchange rates, roubles / USD 28.31 27.14 25.55 24.89 31.76 30.38
Sources: Russian media, Russian Federal State Statistics Service, Russian Central Bank, CAST calculations.
2 It is known, for example, that R&D for the fifth-generation fighter project was funded from the budget of the Russian Ministry of Industry and Trade (Ministry of Industry and Energy before May 2008).
© 1997-2012 Centre for Analysis of Strategies & Technologies (www.cast.ru) 11
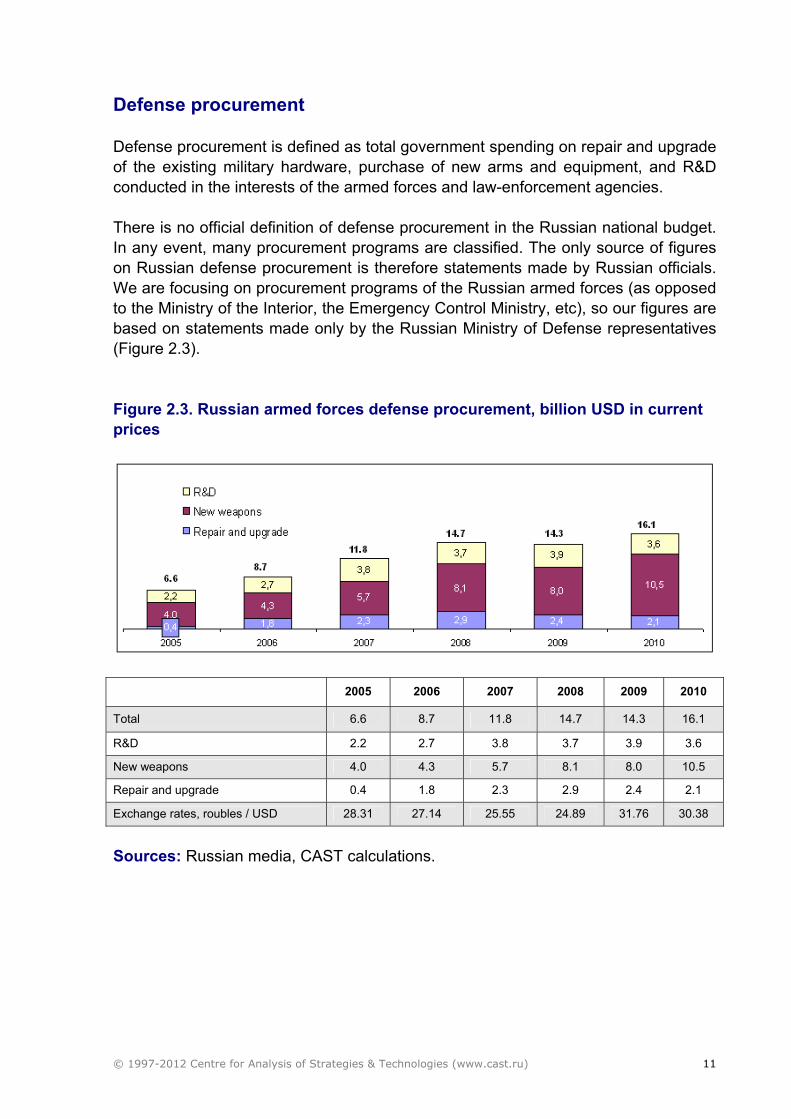
Defense procurement Defense procurement is defined as total government spending on repair and upgrade of the existing military hardware, purchase of new arms and equipment, and R&D conducted in the interests of the armed forces and law-enforcement agencies. There is no official definition of defense procurement in the Russian national budget. In any event, many procurement programs are classified. The only source of figures on Russian defense procurement is therefore statements made by Russian officials. We are focusing on procurement programs of the Russian armed forces (as opposed to the Ministry of the Interior, the Emergency Control Ministry, etc), so our figures are based on statements made only by the Russian Ministry of Defense representatives (Figure 2.3). Figure 2.3. Russian armed forces defense procurement, billion USD in current prices
2005 2006 2007 2008 2009 2010
Total 6.6 8.7 11.8 14.7 14.3 16.1
R&D 2.2 2.7 3.8 3.7 3.9 3.6
New weapons 4.0 4.3 5.7 8.1 8.0 10.5
Repair and upgrade 0.4 1.8 2.3 2.9 2.4 2.1
Exchange rates, roubles / USD 28.31 27.14 25.55 24.89 31.76 30.38
Sources: Russian media, CAST calculations.
© 1997-2012 Centre for Analysis of Strategies & Technologies (www.cast.ru) 12
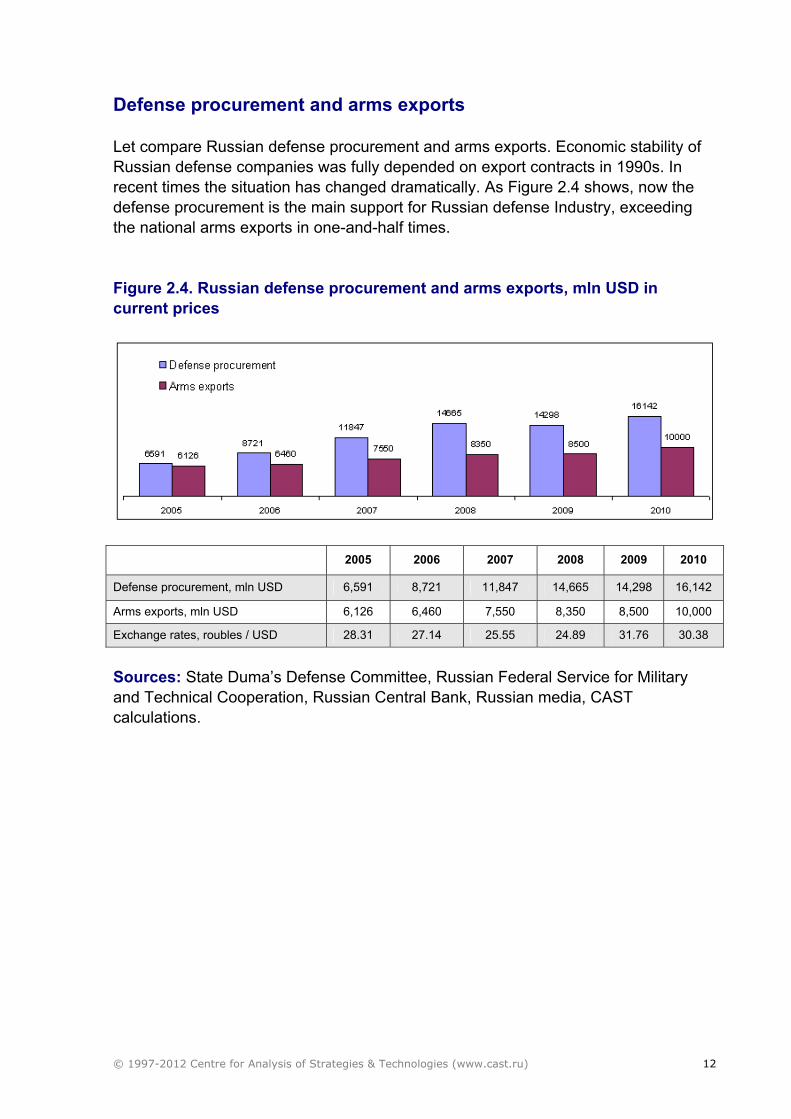
Defense procurement and arms exports Let compare Russian defense procurement and arms exports. Economic stability of Russian defense companies was fully depended on export contracts in 1990s. In recent times the situation has changed dramatically. As Figure 2.4 shows, now the defense procurement is the main support for Russian defense Industry, exceeding the national arms exports in one-and-half times. Figure 2.4. Russian defense procurement and arms exports, mln USD in current prices
2005 2006 2007 2008 2009 2010
Defense procurement, mln USD 6,591 8,721 11,847 14,665 14,298 16,142
Arms exports, mln USD 6,126 6,460 7,550 8,350 8,500 10,000
Exchange rates, roubles / USD 28.31 27.14 25.55 24.89 31.76 30.38
Sources: State Duma’s Defense Committee, Russian Federal Service for Military and Technical Cooperation, Russian Central Bank, Russian media, CAST calculations.
© 1997-2011 Centre for Analysis of Strategies and Technologies (www.cast.ru) 13
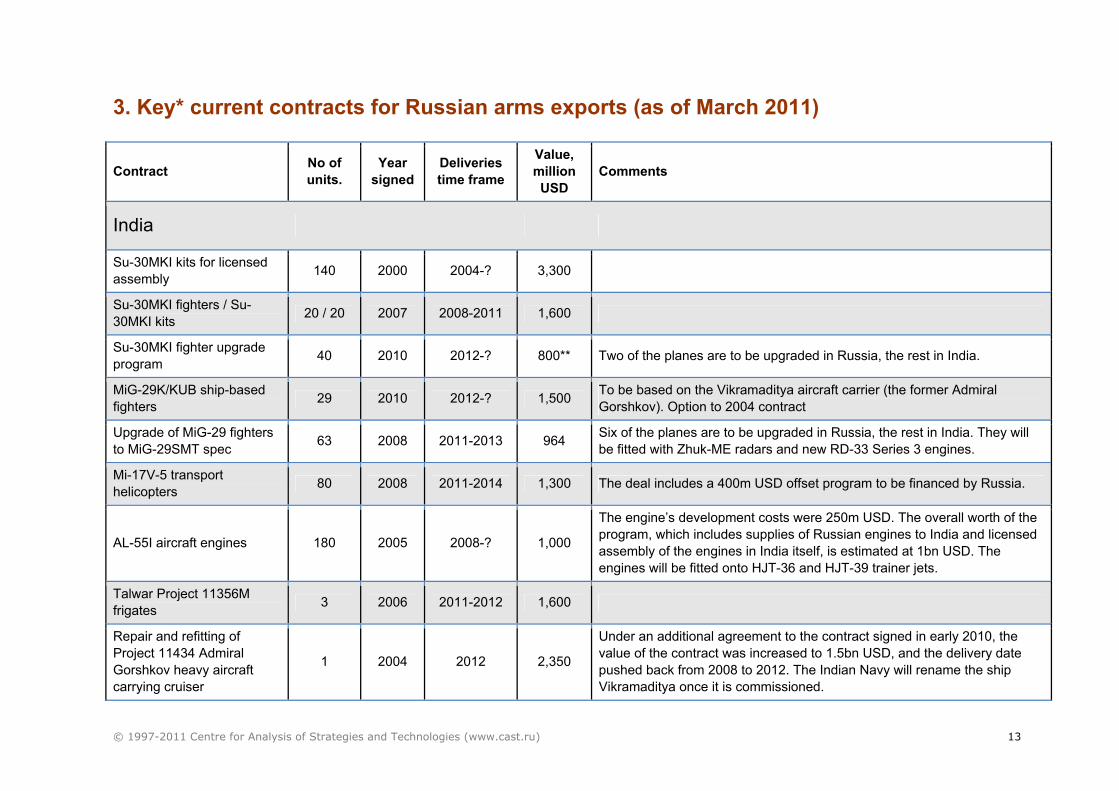
3. Key* current contracts for Russian arms exports (as of March 2011)
Contract No of units.
Year signed
Deliveries time frame
Value, million USD
Comments
India
Su-30MKI kits for licensed assembly 140 2000 2004-? 3,300
Su-30MKI fighters / Su-30MKI kits 20 / 20 2007 2008-2011 1,600
Su-30MKI fighter upgrade program 40 2010 2012-? 800** Two of the planes are to be upgraded in Russia, the rest in India.
MiG-29K/KUB ship-based fighters 29 2010 2012-? 1,500 To be based on the Vikramaditya aircraft carrier (the former Admiral
Gorshkov). Option to 2004 contract
Upgrade of MiG-29 fighters to MiG-29SMT spec 63 2008 2011-2013 964 Six of the planes are to be upgraded in Russia, the rest in India. They will
be fitted with Zhuk-ME radars and new RD-33 Series 3 engines.
Mi-17V-5 transport helicopters 80 2008 2011-2014 1,300 The deal includes a 400m USD offset program to be financed by Russia.
AL-55I aircraft engines 180 2005 2008-? 1,000
The engine’s development costs were 250m USD. The overall worth of the program, which includes supplies of Russian engines to India and licensed assembly of the engines in India itself, is estimated at 1bn USD. The engines will be fitted onto HJT-36 and HJT-39 trainer jets.
Talwar Project 11356M frigates 3 2006 2011-2012 1,600
Repair and refitting of Project 11434 Admiral Gorshkov heavy aircraft carrying cruiser
1 2004 2012 2,350
Under an additional agreement to the contract signed in early 2010, the value of the contract was increased to 1.5bn USD, and the delivery date pushed back from 2008 to 2012. The Indian Navy will rename the ship Vikramaditya once it is commissioned.
© 1997-2011 Centre for Analysis of Strategies and Technologies (www.cast.ru) 14
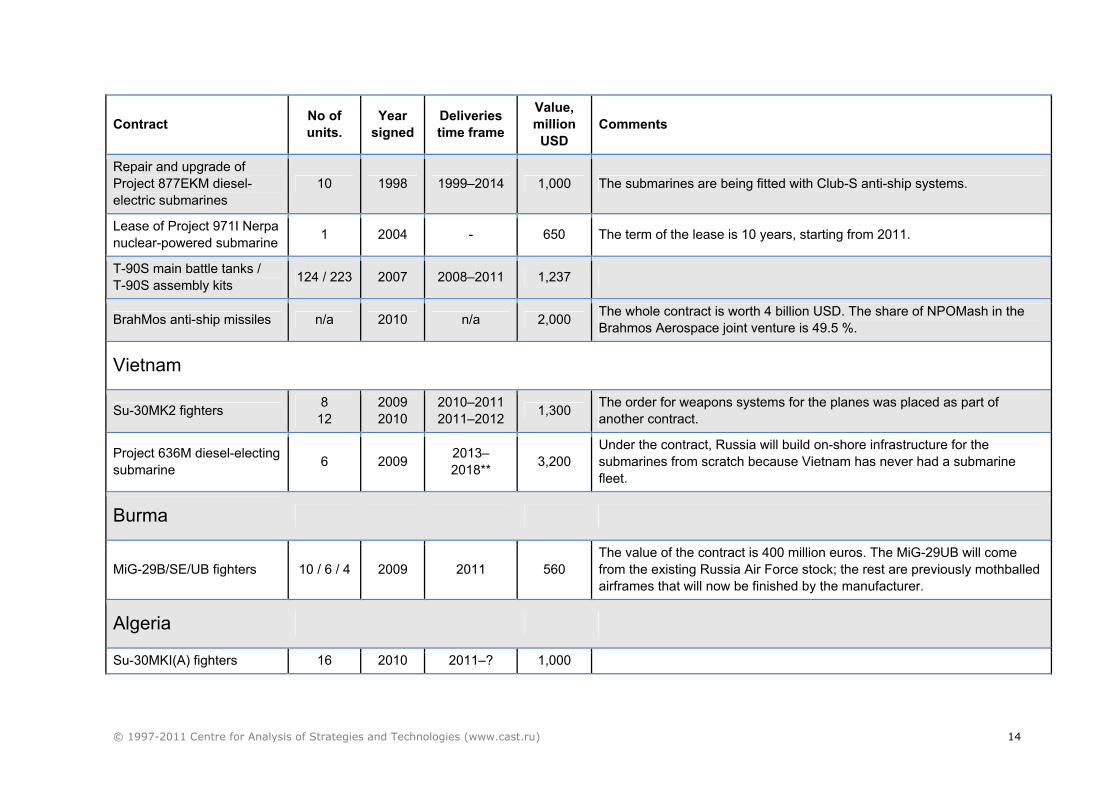
Contract No of units.
Year signed
Deliveries time frame
Value, million USD
Comments
Repair and upgrade of Project 877EKM diesel-electric submarines
10 1998 1999–2014 1,000 The submarines are being fitted with Club-S anti-ship systems.
Lease of Project 971I Nerpa nuclear-powered submarine 1 2004 - 650 The term of the lease is 10 years, starting from 2011.
T-90S main battle tanks / T-90S assembly kits 124 / 223 2007 2008–2011 1,237
BrahMos anti-ship missiles n/a 2010 n/a 2,000 The whole contract is worth 4 billion USD. The share of NPOMash in the Brahmos Aerospace joint venture is 49.5 %.
Vietnam
Su-30MK2 fighters 8 12
2009 2010
2010–2011 2011–2012 1,300 The order for weapons systems for the planes was placed as part of
another contract.
Project 636M diesel-electing submarine 6 2009 2013–
2018** 3,200 Under the contract, Russia will build on-shore infrastructure for the submarines from scratch because Vietnam has never had a submarine fleet.
Burma
MiG-29B/SE/UB fighters 10 / 6 / 4 2009 2011 560 The value of the contract is 400 million euros. The MiG-29UB will come from the existing Russia Air Force stock; the rest are previously mothballed airframes that will now be finished by the manufacturer.
Algeria
Su-30MKI(A) fighters 16 2010 2011–? 1,000
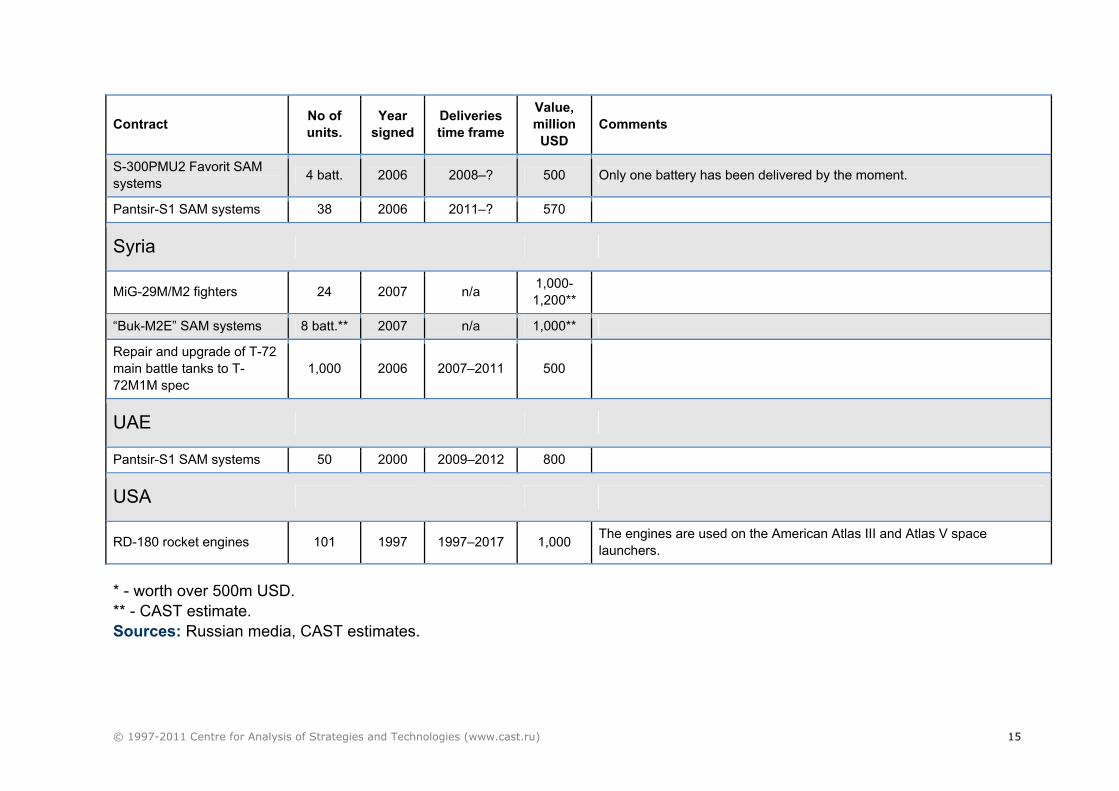
© 1997-2011 Centre for Analysis of Strategies and Technologies (www.cast.ru) 15
Contract No of units.
Year signed
Deliveries time frame
Value, million USD
Comments
S-300PMU2 Favorit SAM systems 4 batt. 2006 2008–? 500 Only one battery has been delivered by the moment.
Pantsir-S1 SAM systems 38 2006 2011–? 570
Syria
MiG-29M/M2 fighters 24 2007 n/a 1,000-1,200**
“Buk-M2E” SAM systems 8 batt.** 2007 n/a 1,000**
Repair and upgrade of T-72 main battle tanks to T-72M1M spec
1,000 2006 2007–2011 500
UAE
Pantsir-S1 SAM systems 50 2000 2009–2012 800
USA
RD-180 rocket engines 101 1997 1997–2017 1,000 The engines are used on the American Atlas III and Atlas V space launchers.
* - worth over 500m USD. ** - CAST estimate. Sources: Russian media, CAST estimates.
© 1997-2011 Centre for Analysis of Strategies and Technologies (www.cast.ru) 16
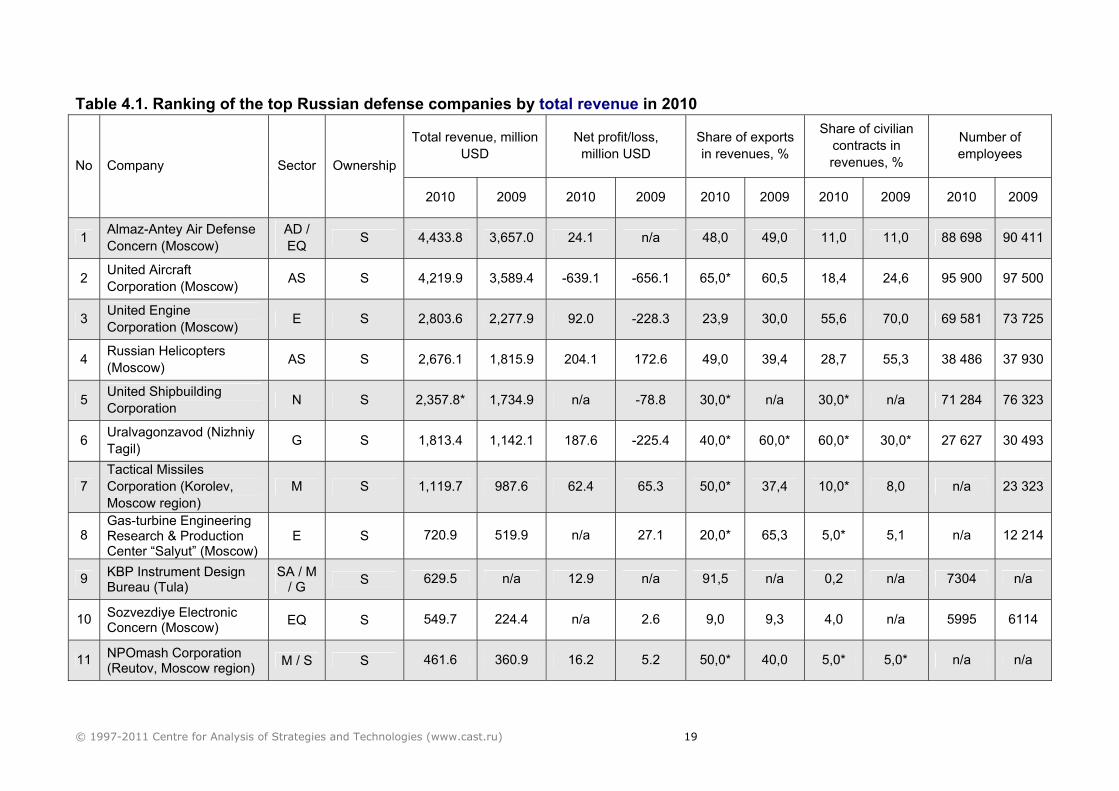
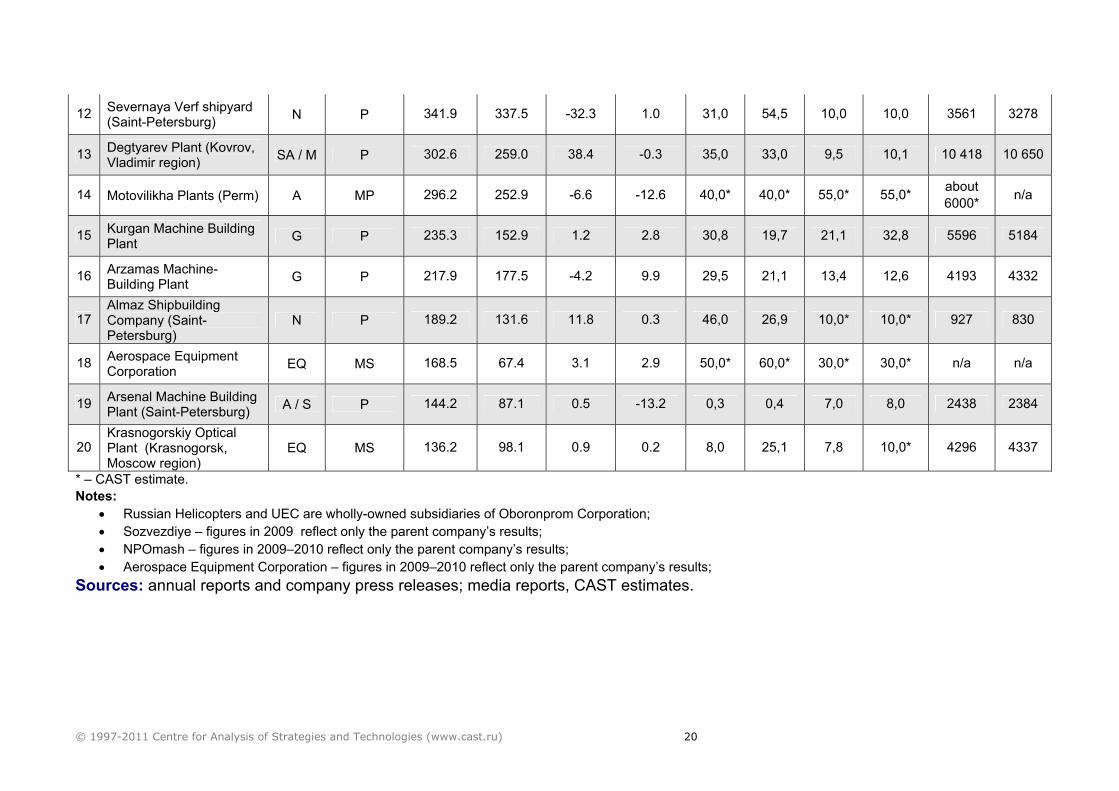
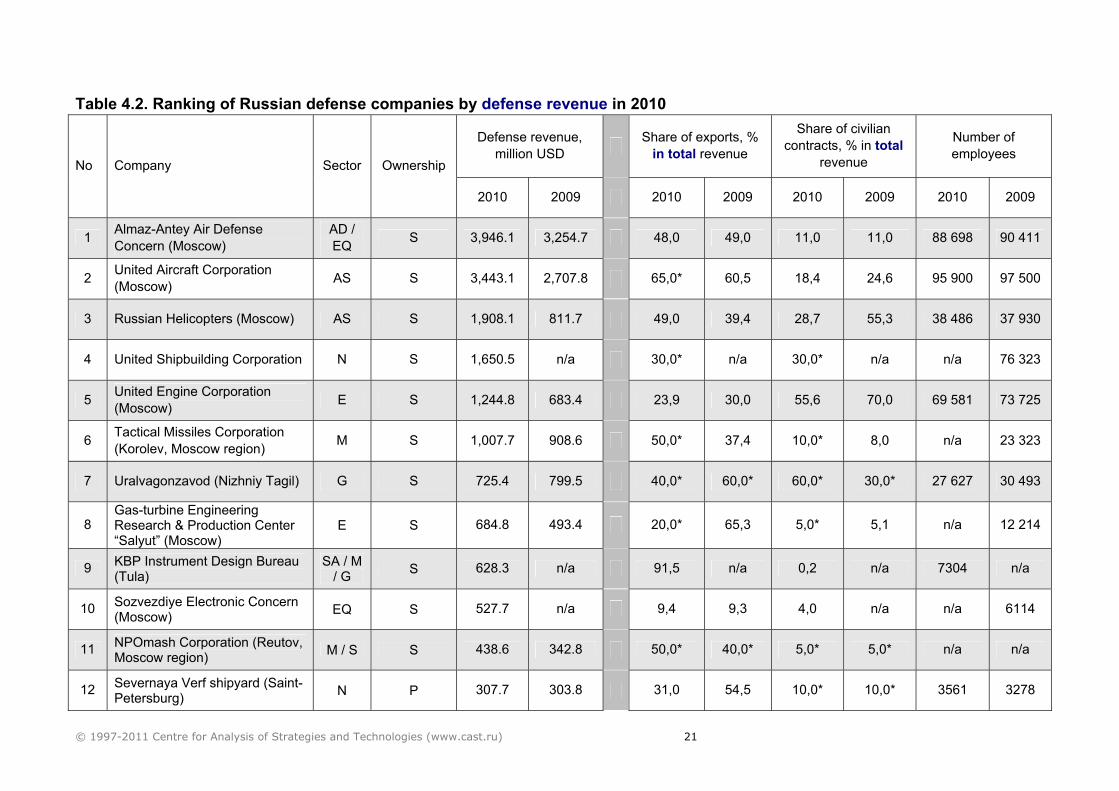
4. Ranking of the top Russian defense companies in 2010 Key operational results Total revenue (Table 4.1 at the bottom of the section) The combined total revenue of the Top-20 Russian defense contractors rose to 23.82bn USD3 in 2010, up 37.1 per cent from 17.37bn USD the previous year. Adjusted for the US dollar inflation figure of 1.64 per cent4, the real increase is a record 35.5 per cent. It is therefore safe to say that the Russian defense industry has recovered from the effects of the world economic crisis. Among the large holding companies the biggest increase in revenues was reported by Uralvagonzavod (UVZ), thanks mostly to the resumption of regular contracts for railway carriages from Russian Railways. Russian Helicopters, which is probably the most successful Russian defense contractor, and most well-balanced in terms of revenue sources, reported the second-biggest increase. The company saw growth even in 2009, when the rest of the industry was still reeling from the world economic crisis. Its success is underpinned by the hugely popular Mi-8/17 series and the launch of mass production of the Mi-28N and Ka-52 attack helicopters for the Russian armed forces. The United Aircraft Corporation (UAC), the United Engine Corporation (UEC) and the Almaz-Antey Air Defense Concern reported moderate growth in 2010. Almaz-Antey seems to have more or less reaches its maximum capacity, whereas UAC and UEC can expect another spurt of growth from civilian contracts (SSJ-100, An-148). UEC will also receive a boost from the program to replace imports of Ukrainian helicopter engines with Russian product. State-owned companies accounted for 91.5 per cent of the Top-20 aggregate revenue in 2010. This is comparable to previous years' figures. But the share of civilian contracts shrank to 25.1 per cent from 29.5 per cent the previous year, while the share of export revenues rose from 39.6 per cent to 44.1 per cent of the total figure Defense revenues (Table 4.2 at the bottom of this section) Defense revenues of the Top-20 defense contractors rose by an impressive 44 per cent (adjusted to inflation) to 17.84bn USD. In fact, defense revenues, especially those earned by Russian Helicopters and UEC, were the main driver of the overall growth.
3 Conversion from roubles into dollars based on average yearly exchange rates: 30.38 roubles to the dollar in 2010 and 31.76 roubles to the dollar in 2009. Data by the Russian Central Bank. 4 http://www.inflationdata.com/inflation/inflation_rate/currentinflation.asp.
© 1997-2011 Centre for Analysis of Strategies and Technologies (www.cast.ru) 17
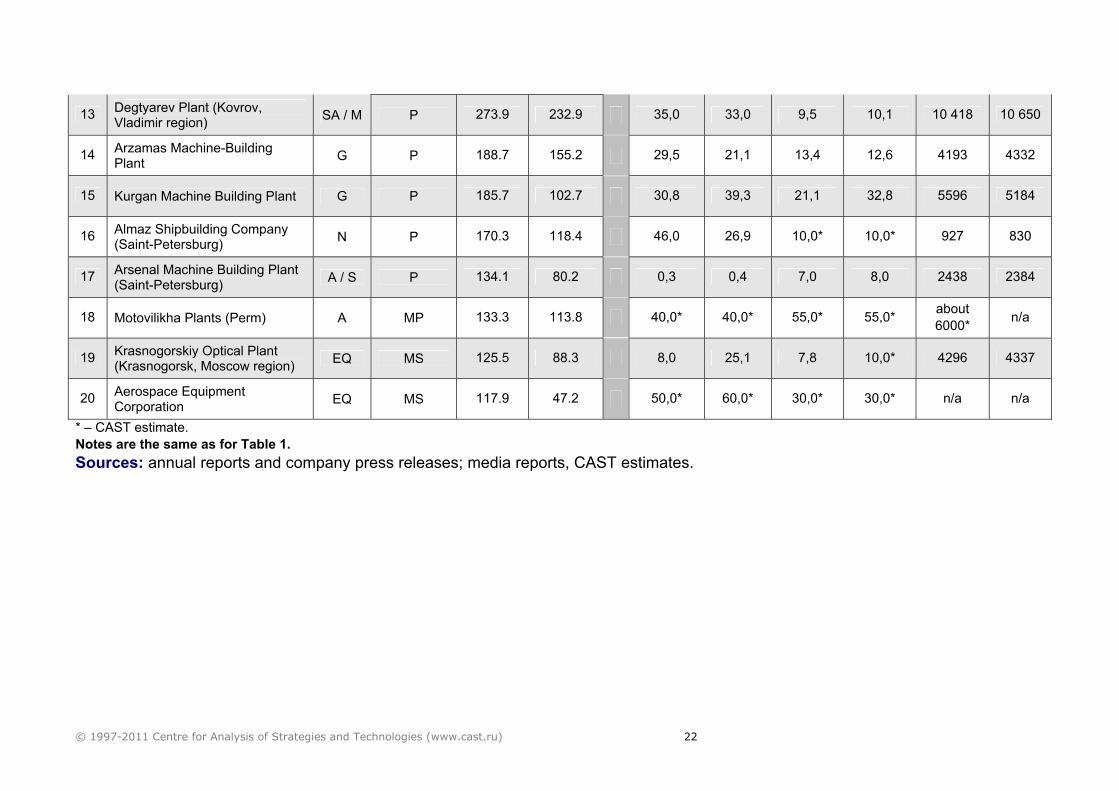
Almaz-Antey remains an undisputed leader by defense sales volume for several years in a row. It is followed by UAC for the second year running; the rest of the pack are far behind. Almaz-Antey’s revenue structure has long been well-balanced between exports and the domestic market. To Russia’s own armed forces the company sells the S-400 SAM system; exports include the S-300PMU2, “Buk” and “Pechora” systems. A similar balance was achieved in 2010 by Russian Helicopters, NPOmash and the Tactical Missiles Corporation (TMC). Russian Helicopters looks set to retain this revenue structure in 2011, but NPOmash will probably become more dependent on domestic contracts once deliveries of its Bastion anti-ship missile system to Syria and Vietnam have been completed. The situation at TMC will largely depend on UAC’s fortunes. UAC itself, meanwhile, depends on exports for most of its revenues, and that is unlikely to change in the medium time frame (until 2020). Deliveries to the Russian MoD are on the rise, but the corporation is planning an even greater increase in exports of its military and civilian aircraft. As for the United Shipbuilding Corporation (USC), the company will remain dependent on the domestic market because its key product is nuclear submarines. But the share of civilian contracts in its revenue structure may increase if it lands large new orders for transport ships from the Russian oil and gas industry. As expected, UVZ saw a big shift towards domestic civilian contracts in 2010. The reason for that was not the completion of the Indian contract for the T-90S tanks (last deliveries were made only in 2011), but a manyfold rise in deliveries of carriages to Russian Railways. Production of light armor and artillery is a much smaller business in dollar terms than the making of aircraft, ships and tanks. If the Russian light armor and artillery producers (Arzamas and Kurgan machine-building plants, and Motovilikha Plants) were to be merged into a single holding company, it would come 11th in the ranking, relegating NPOmash to No 12. Russian MoD contracts account for the bulk of Arzamas and Kurgan plants’ business, although the two companies sharply increased weapons exports in 2010. Motovilikha Plants’ military output is mostly export-oriented for now. Sources and structure of the ranking The ranking was compiled based mostly on official annual reports and press releases of the Russian defense contractors, as well as reports in the leading Russian media. The ranking also made use of information provided directly by the companies themselves. In a number of cases where official figures were not available, CAST used its own estimates.
© 1997-2011 Centre for Analysis of Strategies and Technologies (www.cast.ru) 18
The structure of the ranking includes the following operational indicators: • revenues; • net profit (net loss) • share of exports in overall revenues; • share of civilian contracts in overall revenues; • number of employees; • sector: aerospace (AS), naval (N), ground vehicles (G), equipment and
electronics (EQ), artillery (A), small arms (SA), munitions (M), engines (E), air defense systems (AD); space systems (S);
• ownership: private (P – state-owned stake less than 25 %), majority private-owned (MP – state-owned stake between 25 % and 50 %), majority state-owned (MS – state-owned stake between 50 % and 75 %) and state-owned (S – companies with a state-owned stake of over 75%).
The ranking does not include: • companies working only for the Russian nuclear forces or space forces (for
example, Votkinsk Plant); • companies which derive over 80 per cent of their revenues from civilian
contracts (for example, GAZ, KAMAZ); and • companies whose operational figures are not available and there is not enough
information to make an accurate estimate.
© 1997-2011 Centre for Analysis of Strategies and Technologies (www.cast.ru) 19
Table 4.1. Ranking of the top Russian defense companies by total revenue in 2010
Total revenue, million USD
Net profit/loss, million USD
Share of exports in revenues, %
Share of civilian contracts in revenues, %
Number of employees
No Company Sector Ownership
2010 2009 2010 2009 2010 2009 2010 2009 2010 2009
1 Almaz-Antey Air Defense Concern (Moscow)
AD / EQ S 4,433.8 3,657.0 24.1 n/a 48,0 49,0 11,0 11,0 88 698 90 411
2 United Aircraft Corporation (Moscow) AS S 4,219.9 3,589.4 -639.1 -656.1 65,0* 60,5 18,4 24,6 95 900 97 500
3 United Engine Corporation (Moscow) E S 2,803.6 2,277.9 92.0 -228.3 23,9 30,0 55,6 70,0 69 581 73 725
4 Russian Helicopters (Moscow) AS S 2,676.1 1,815.9 204.1 172.6 49,0 39,4 28,7 55,3 38 486 37 930
5 United Shipbuilding Corporation N S 2,357.8* 1,734.9 n/a -78.8 30,0* n/a 30,0* n/a 71 284 76 323
6 Uralvagonzavod (Nizhniy Tagil) G S 1,813.4 1,142.1 187.6 -225.4 40,0* 60,0* 60,0* 30,0* 27 627 30 493
7 Tactical Missiles Corporation (Korolev, Moscow region)
M S 1,119.7 987.6 62.4 65.3 50,0* 37,4 10,0* 8,0 n/a 23 323
8 Gas-turbine Engineering Research & Production Center “Salyut” (Moscow)
E S 720.9 519.9 n/a 27.1 20,0* 65,3 5,0* 5,1 n/a 12 214
9 KBP Instrument Design Bureau (Tula)
SA / M / G S 629.5 n/a 12.9 n/a 91,5 n/a 0,2 n/a 7304 n/a
10 Sozvezdiye Electronic Concern (Moscow) EQ S 549.7 224.4 n/a 2.6 9,0 9,3 4,0 n/a 5995 6114
11 NPOmash Corporation (Reutov, Moscow region) M / S S 461.6 360.9 16.2 5.2 50,0* 40,0 5,0* 5,0* n/a n/a
© 1997-2011 Centre for Analysis of Strategies and Technologies (www.cast.ru) 20
12 Severnaya Verf shipyard (Saint-Petersburg) N P 341.9 337.5 -32.3 1.0 31,0 54,5 10,0 10,0 3561 3278
13 Degtyarev Plant (Kovrov, Vladimir region) SA / M P 302.6 259.0 38.4 -0.3 35,0 33,0 9,5 10,1 10 418 10 650
14 Motovilikha Plants (Perm) A MP 296.2 252.9 -6.6 -12.6 40,0* 40,0* 55,0* 55,0* about 6000* n/a
15 Kurgan Machine Building Plant G P 235.3 152.9 1.2 2.8 30,8 19,7 21,1 32,8 5596 5184
16 Arzamas Machine-Building Plant G P 217.9 177.5 -4.2 9.9 29,5 21,1 13,4 12,6 4193 4332
17 Almaz Shipbuilding Company (Saint-Petersburg)
N P 189.2 131.6 11.8 0.3 46,0 26,9 10,0* 10,0* 927 830
18 Aerospace Equipment Corporation EQ MS 168.5 67.4 3.1 2.9 50,0* 60,0* 30,0* 30,0* n/a n/a
19 Arsenal Machine Building Plant (Saint-Petersburg) A / S P 144.2 87.1 0.5 -13.2 0,3 0,4 7,0 8,0 2438 2384
20 Krasnogorskiy Optical Plant (Krasnogorsk, Moscow region)
EQ MS 136.2 98.1 0.9 0.2 8,0 25,1 7,8 10,0* 4296 4337
* – CAST estimate. Notes:
• Russian Helicopters and UEC are wholly-owned subsidiaries of Oboronprom Corporation; • Sozvezdiye – figures in 2009 reflect only the parent company’s results; • NPOmash – figures in 2009–2010 reflect only the parent company’s results; • Aerospace Equipment Corporation – figures in 2009–2010 reflect only the parent company’s results;
Sources: annual reports and company press releases; media reports, CAST estimates.
© 1997-2011 Centre for Analysis of Strategies and Technologies (www.cast.ru) 21
Table 4.2. Ranking of Russian defense companies by defense revenue in 2010
Defense revenue, million USD Share of exports, %
in total revenue
Share of civilian contracts, % in total
revenue
Number of employees
No Company Sector Ownership
2010 2009 2010 2009 2010 2009 2010 2009
1 Almaz-Antey Air Defense Concern (Moscow)
AD / EQ S 3,946.1 3,254.7 48,0 49,0 11,0 11,0 88 698 90 411
2 United Aircraft Corporation (Moscow) AS S 3,443.1 2,707.8 65,0* 60,5 18,4 24,6 95 900 97 500
3 Russian Helicopters (Moscow) AS S 1,908.1 811.7 49,0 39,4 28,7 55,3 38 486 37 930
4 United Shipbuilding Corporation N S 1,650.5 n/a 30,0* n/a 30,0* n/a n/a 76 323
5 United Engine Corporation (Moscow) E S 1,244.8 683.4 23,9 30,0 55,6 70,0 69 581 73 725
6 Tactical Missiles Corporation (Korolev, Moscow region) M S 1,007.7 908.6 50,0* 37,4 10,0* 8,0 n/a 23 323
7 Uralvagonzavod (Nizhniy Tagil) G S 725.4 799.5 40,0* 60,0* 60,0* 30,0* 27 627 30 493
8 Gas-turbine Engineering Research & Production Center “Salyut” (Moscow)
E S 684.8 493.4 20,0* 65,3 5,0* 5,1 n/a 12 214
9 KBP Instrument Design Bureau (Tula)
SA / M / G S 628.3 n/a 91,5 n/a 0,2 n/a 7304 n/a
10 Sozvezdiye Electronic Concern (Moscow) EQ S 527.7 n/a 9,4 9,3 4,0 n/a n/a 6114
11 NPOmash Corporation (Reutov, Moscow region) M / S S 438.6 342.8 50,0* 40,0* 5,0* 5,0* n/a n/a
12 Severnaya Verf shipyard (Saint-Petersburg) N P 307.7 303.8 31,0 54,5 10,0* 10,0* 3561 3278
© 1997-2011 Centre for Analysis of Strategies and Technologies (www.cast.ru) 22
13 Degtyarev Plant (Kovrov, Vladimir region) SA / M P 273.9 232.9 35,0 33,0 9,5 10,1 10 418 10 650
14 Arzamas Machine-Building Plant G P 188.7 155.2 29,5 21,1 13,4 12,6 4193 4332
15 Kurgan Machine Building Plant G P 185.7 102.7 30,8 39,3 21,1 32,8 5596 5184
16 Almaz Shipbuilding Company (Saint-Petersburg) N P 170.3 118.4 46,0 26,9 10,0* 10,0* 927 830
17 Arsenal Machine Building Plant (Saint-Petersburg) A / S P 134.1 80.2 0,3 0,4 7,0 8,0 2438 2384
18 Motovilikha Plants (Perm) A MP 133.3 113.8 40,0* 40,0* 55,0* 55,0* about 6000* n/a
19 Krasnogorskiy Optical Plant (Krasnogorsk, Moscow region) EQ MS 125.5 88.3 8,0 25,1 7,8 10,0* 4296 4337
20 Aerospace Equipment Corporation EQ MS 117.9 47.2 50,0* 60,0* 30,0* 30,0* n/a n/a
* – CAST estimate. Notes are the same as for Table 1. Sources: annual reports and company press releases; media reports, CAST estimates.