Russia – Europe's Most Attractive Future Market? · Russia – Europe's Most Attractive Future...
39
Russia – Europe's Most Attractive Future Market? Tim Armstrong Director, Emerging Markets
Transcript of Russia – Europe's Most Attractive Future Market? · Russia – Europe's Most Attractive Future...
Russia – Europe's Most Attractive Future Market?
Tim Armstrong
Director, Emerging Markets
Copyright © 2007 Global Insight, Inc.2007 GLOBAL AUTOMOTIVE CONFERENCE 2
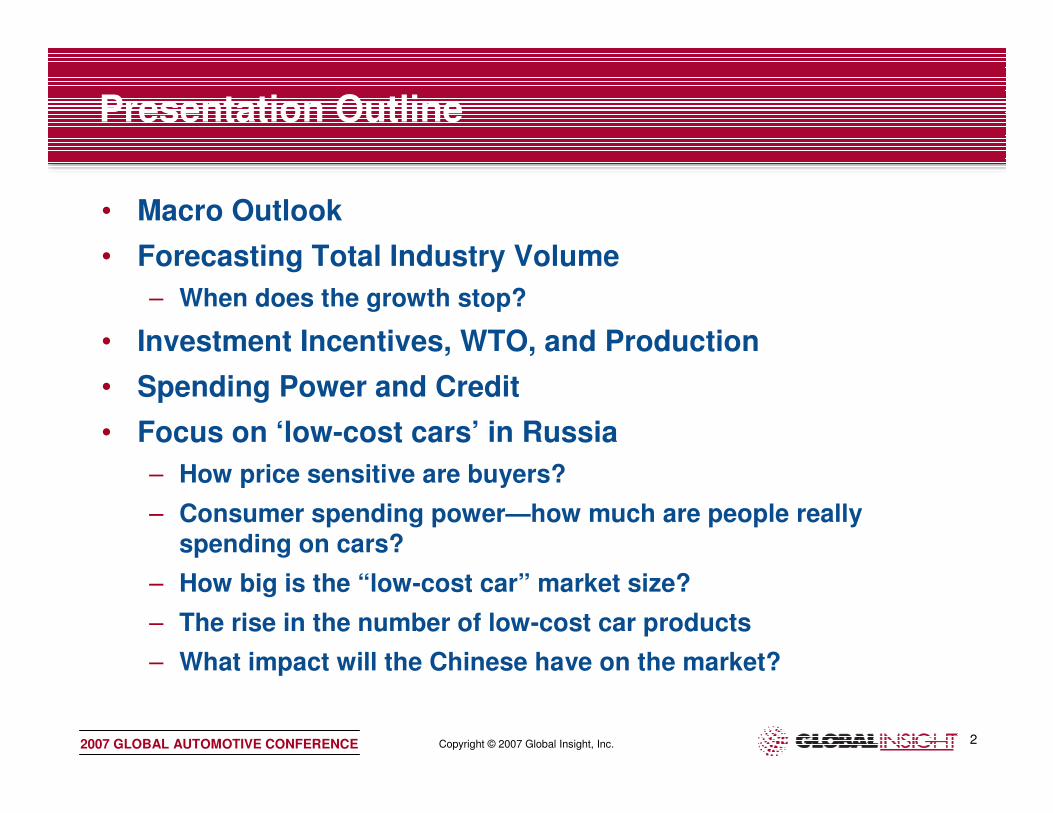
Presentation Outline
• Macro Outlook
• Forecasting Total Industry Volume
– When does the growth stop?
• Investment Incentives, WTO, and Production
• Spending Power and Credit
• Focus on ‘low-cost cars’ in Russia
– How price sensitive are buyers?
– Consumer spending power—how much are people really spending on cars?
– How big is the “low-cost car” market size?
– The rise in the number of low-cost car products
– What impact will the Chinese have on the market?

Copyright © 2007 Global Insight, Inc.2007 GLOBAL AUTOMOTIVE CONFERENCE 3
Russia Is the Best Performing Market in the World…Almost
635
419
130
127
78
69
47
35
-59
-76
-150
-230
-239
1320
412
226
255
100
69
59
31
108
30
-201
-7
-92
147
-129
-401
132
1,166
59
-600 -400 -200 0 200 400 600 800 1000 1200 1400 1600
CHINA
RUSSIA
BRAZIL
INDIA
ITALY
IRAN
ARGENTINA
CANADA
UKRAINE
KOREA
INDONESIA
SPAIN
TURKEY
GERMANY
JAPAN
USA
ThousandsIncremental Change in Vehicle Demand
Change in LV Sales 2005-06
and 2006-07 ranked by 2007
20062007
Copyright © 2007 Global Insight, Inc.2007 GLOBAL AUTOMOTIVE CONFERENCE 4
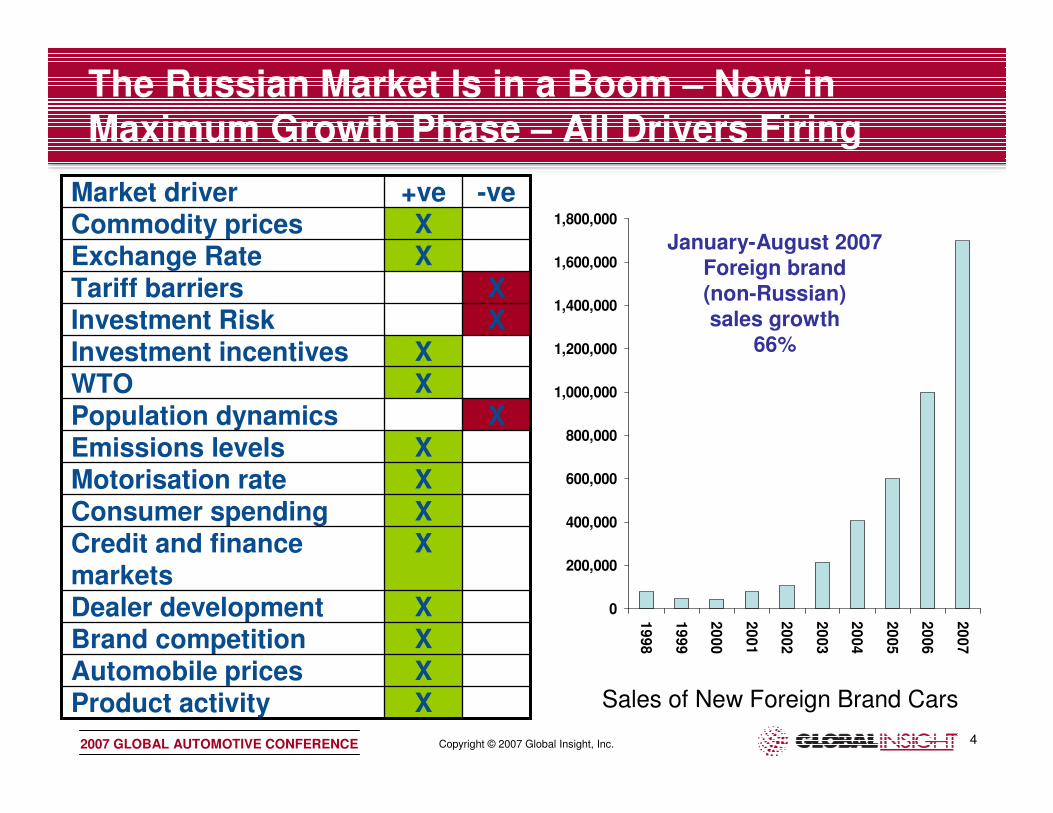
The Russian Market Is in a Boom – Now in Maximum Growth Phase – All Drivers Firing
XPopulation dynamics
XProduct activityXAutomobile pricesXBrand competitionXDealer development
XCredit and finance markets
XConsumer spendingXMotorisation rateXEmissions levels
XWTOXInvestment incentives
XInvestment RiskXTariff barriers
XExchange RateXCommodity prices
-ve+veMarket driver
0
200,000
400,000
600,000
800,000
1,000,000
1,200,000
1,400,000
1,600,000
1,800,000
19
98
19
99
20
00
20
01
20
02
20
03
20
04
20
05
20
06
20
07
Sales of New Foreign Brand Cars
January-August 2007Foreign brand (non-Russian)sales growth
66%

Copyright © 2007 Global Insight, Inc.2007 GLOBAL AUTOMOTIVE CONFERENCE 5
Russia: From Crisis To Boom – Key Indicators
32.636.858.4Total External Debt (as % of GDP)
394.8237.1111.7Average Wage (US$)
7.52.12.3Fiscal Balance (% of GDP)
303.7124.540.3Forex Reserves (US$ bn)
304.5183.5105.3Total Exports (bop US$ bn)
27.228.828.8RBL/US$ exchange rate (avg.)
9.721.638.1CPI (annual average in %)
6,9254,1242,068Per Capita GDP (market rates in US$)
6.77.21.6GDP Growth (annual in %)
20062004Avg.
1996-2000

Copyright © 2007 Global Insight, Inc.2007 GLOBAL AUTOMOTIVE CONFERENCE 6
0
2
4
6
8
10
12
14
16
18
20
2000 2002 2004 2006
GDP Consumption Investment
(Annual growth in percent)
• 2006 growth bettered 2005 performance at 6.7%. Pace to moderate in 2007 to 6.5% as sliding net exports drag on growth. Domestic demand continues to surge
• Enterprise profits up strongly, sustaining capital spending boom; rapidly rising real incomes boosting private consumption
• Aggregate demand has a very substantial import component; Imports outpace exports which face capacity constraints, moderating prices, and a strengthening ruble
Domestic Demand Drives Growth, Aided by High Energy Prices

Copyright © 2007 Global Insight, Inc.2007 GLOBAL AUTOMOTIVE CONFERENCE 7
Higher Base Oil Price Forecast
0
10
20
30
40
50
60
70
80
90
1996 1999 2002 2005 2008 2011 2014 2017
Mar-07 Sep-07
• Oil is $15 higher long term than last forecast or around 25%
• Stronger economic outlook
• Greater capacity for government fiscal support and wealth diversification
• Pump prices low in Russia with low taxation rates—little impact at the pump
• No significant negative shift in segmentation—income effects could move segmentation upwards
Brent, US$ per barrel
Copyright © 2007 Global Insight, Inc.2007 GLOBAL AUTOMOTIVE CONFERENCE 8
Per capita income
Incom
e e
lasticity
of
ow
ne
rsh
ip
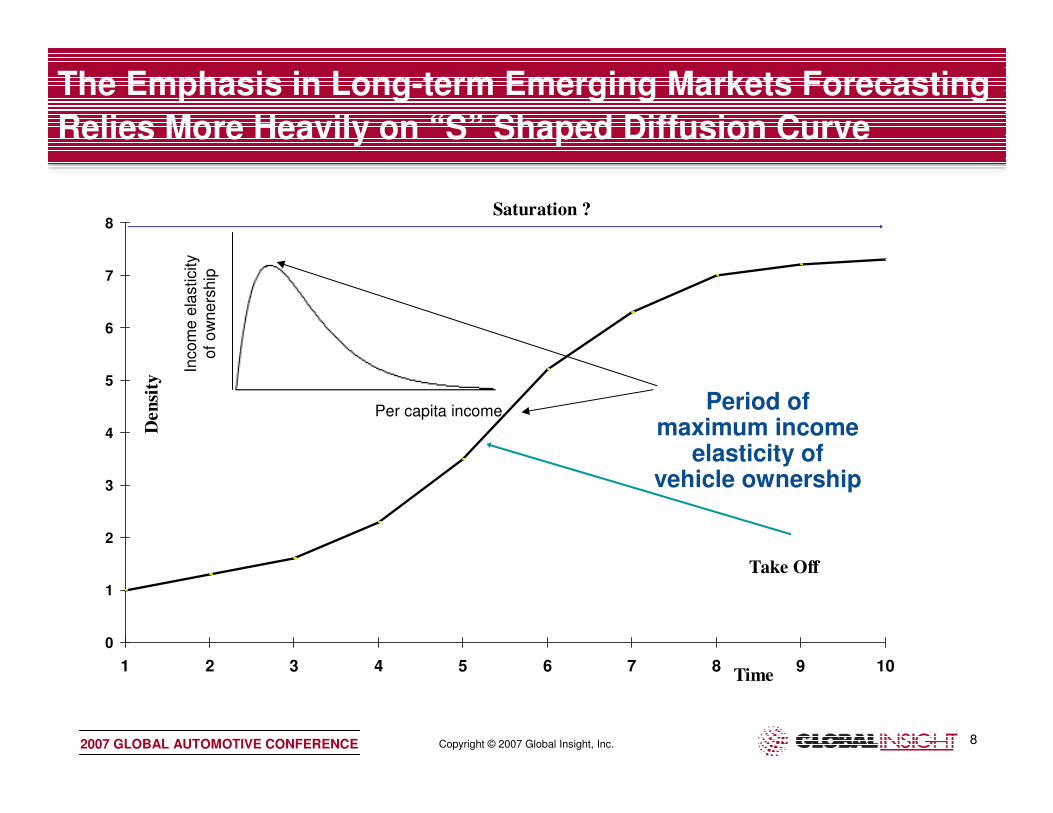
The Emphasis in Long-term Emerging Markets Forecasting
Relies More Heavily on “S” Shaped Diffusion Curve
0
1
2
3
4
5
6
7
8
1 2 3 4 5 6 7 8 9 10
Den
sity
Take Off
Saturation ?
Time
Period of maximum income
elasticity of vehicle ownership

Copyright © 2007 Global Insight, Inc.2007 GLOBAL AUTOMOTIVE CONFERENCE 9
There are Similarities in S-Curve Development Across Emerging Markets - Stages of Industry Growth
• Pre take-off: Incomes under c. $3000–$5000
– Low incomes, closed financial markets, poor road conditions, low local model quality, public transport system, imports restricted, structural under-supply resolved by waiting lists
• Take off: commonly around income of $6000 pa
– Restructuring well underway, incomes rise, access to credit, open to imports, tariff barriers decline, interest rates fall and exchange rates stabilize, investment in road infrastructure, product mix
• Maturity: can be around $13,000–30,000 pa
– Market reaching long-term equilibrium as determined by geographical, political, social factors
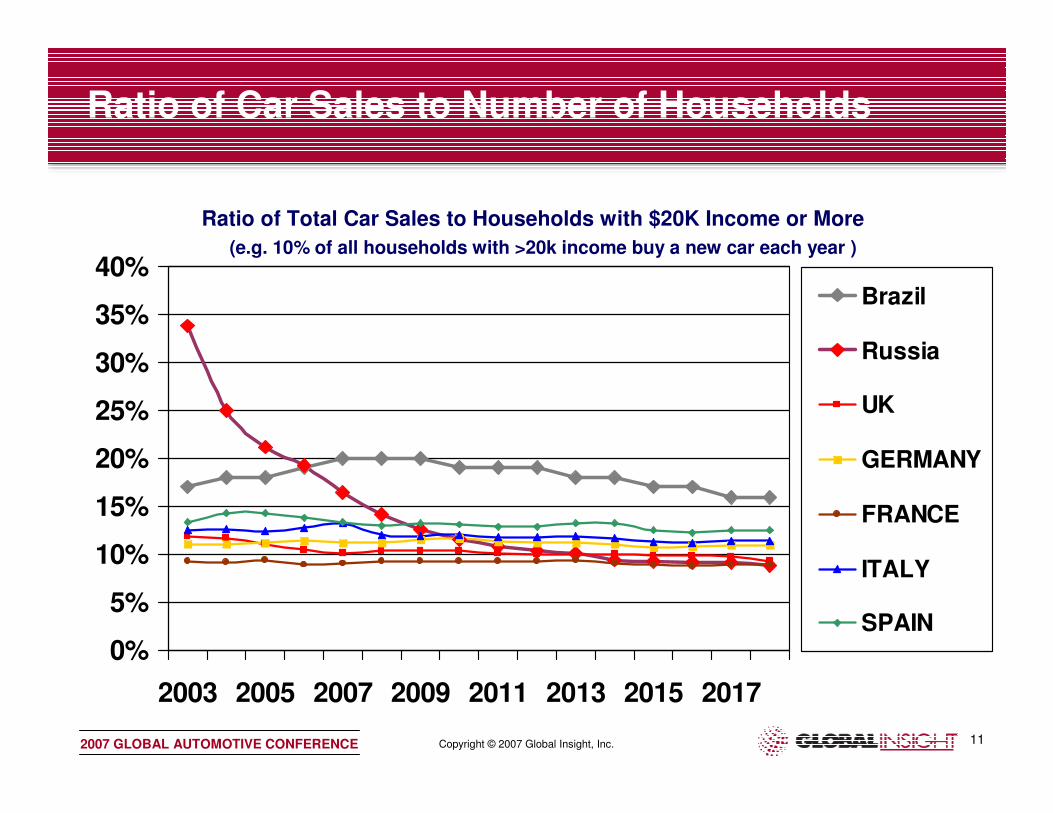
• Income Distribution Analysis: Stability Ratio Method e.g. Car sales per household with >$20,000 income, current or ppp adjusted
– This requires forecasts of number of households by income bands for all emerging markets over the forecast horizon
(Source: Global Insight, Consumer Markets Forecast databases)

Copyright © 2007 Global Insight, Inc.2007 GLOBAL AUTOMOTIVE CONFERENCE 10
Income Take-off Started in 2003 (Number of Households by $US Nominal Income Bracket)
0
10
20
30
40
50
60
1990
1991
1992
1993
1994
1995
1996
1997
1998
1999
2000
2001
2002
2003
2004
2005
2006
2007
2008
2009
2010
2011
2012
2013
2014
2015
2016
2017
2018
2019
2020
H'holds w / Income $150K and over
H'holds w / Income $100 to 150K
H'holds w / Income $90 to 100K
H'holds w / Income $80 to 90KH'holds w / Income $70 to 80K
H'holds w / Income $60 to 70K
H'holds w / Income $50 to 60K
H'holds w / Income $40 to 50K
H'holds w / Income $30 to 40K
H'holds w / Income $20 to 30KH'holds w / Income $15 to 20K
H'holds w / Income $10 to 15K
H'holds w / Income $0- to $10k
Millions of Households
Copyright © 2007 Global Insight, Inc.2007 GLOBAL AUTOMOTIVE CONFERENCE 11
Ratio of Car Sales to Number of Households
0%
5%
10%
15%
20%
25%
30%
35%
40%
2003 2005 2007 2009 2011 2013 2015 2017
Brazil
Russia
UK
GERMANY
FRANCE
ITALY
SPAIN
Ratio of Total Car Sales to Households with $20K Income or More
(e.g. 10% of all households with >20k income buy a new car each year )

Copyright © 2007 Global Insight, Inc.2007 GLOBAL AUTOMOTIVE CONFERENCE 12
Russia Is Fast Becoming the Most Attractive Market in Europe – Light Vehicle Sales
0
500
1000
1500
2000
2500
3000
3500
4000
2001 2002 2003 2004 2005 2006 2007 2008 2009 2010 2011 2012
Th
ou
sa
nd
s
DEU ITA GBR FRA ESP RUS
Copyright © 2007 Global Insight, Inc.2007 GLOBAL AUTOMOTIVE CONFERENCE 13
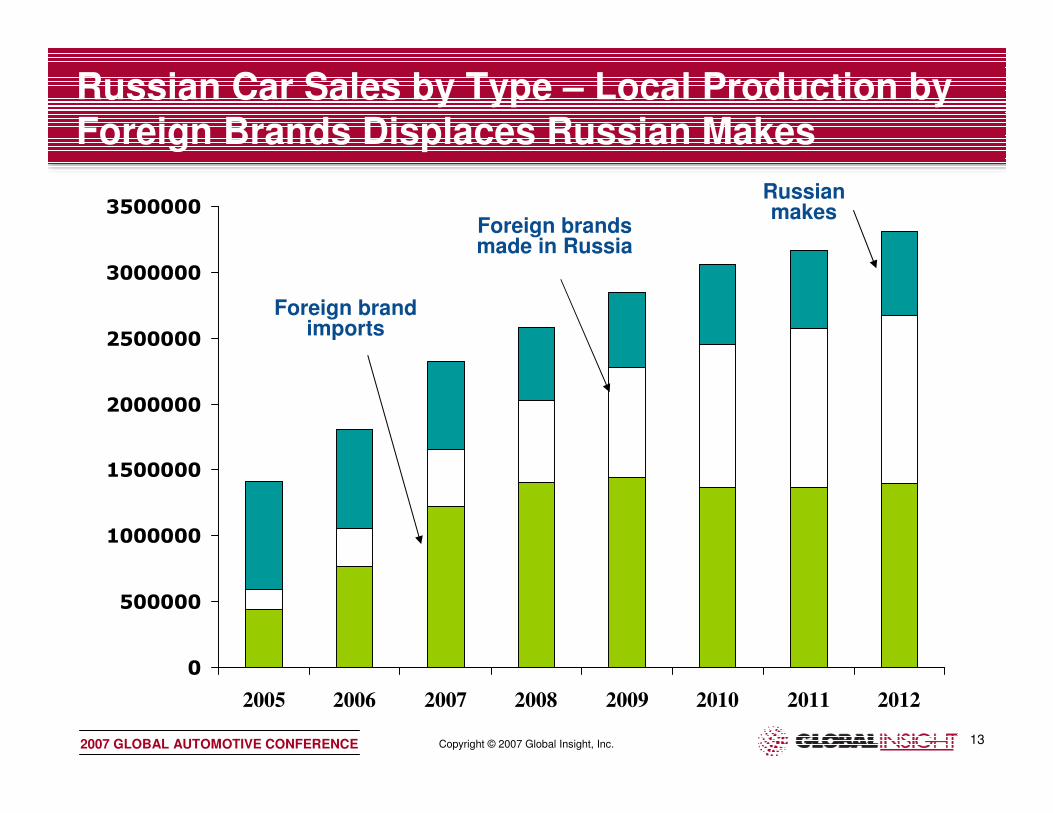
Russian Car Sales by Type – Local Production by Foreign Brands Displaces Russian Makes
0
500000
1000000
1500000
2000000
2500000
3000000
3500000
2005 2006 2007 2008 2009 2010 2011 2012
Russian makes
Foreign brands made in Russia
Foreign brand imports
Copyright © 2007 Global Insight, Inc.2007 GLOBAL AUTOMOTIVE CONFERENCE 14
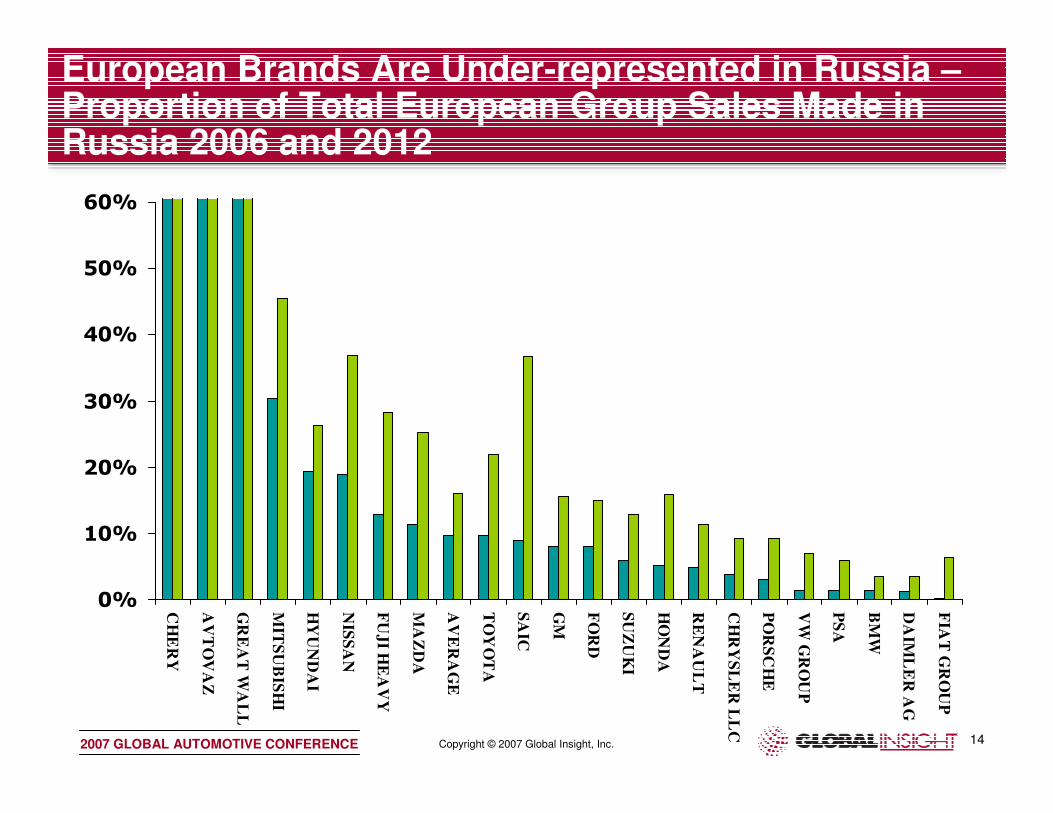
European Brands Are Under-represented in Russia –Proportion of Total European Group Sales Made in Russia 2006 and 2012
0%
10%
20%
30%
40%
50%
60%
CH
ER
Y
AV
TO
VA
Z
GR
EA
T W
AL
L
MIT
SU
BIS
HI
HY
UN
DA
I
NIS
SA
N
FU
JI H
EA
VY
MA
ZD
A
AV
ER
AG
E
TO
YO
TA
SA
IC
GM
FO
RD
SU
ZU
KI
HO
ND
A
RE
NA
UL
T
CH
RY
SL
ER
LL
C
PO
RS
CH
E
VW
GR
OU
P
PS
A
BM
W
DA
IML
ER
AG
FIA
T G
RO
UP

Copyright © 2007 Global Insight, Inc.2007 GLOBAL AUTOMOTIVE CONFERENCE 15
Decree 135 (since 1998) or similar
• Failed to attract widespread investment
• Too hard to achieve localisation levels
Decree 166 Was the Turning Point in Investment Legislation
Decree 166 (since 2005)
• Everybody joins or switches to Decree 166 by 2006
• But applications closed on 15 September 2007
• Not applicable to suppliers
New entrants/adopters
Switchers

Copyright © 2007 Global Insight, Inc.2007 GLOBAL AUTOMOTIVE CONFERENCE 16
Moscow
Izhevsk
Togliatti
Nab. Chelny
Elabuga
Kaluga
St. Petersburg
Kaliningrad
Taganrog
OEMs Are Rushing to Invest in Russia—in Special Economic Zones
Novouralsk
Copyright © 2007 Global Insight, Inc.2007 GLOBAL AUTOMOTIVE CONFERENCE 17
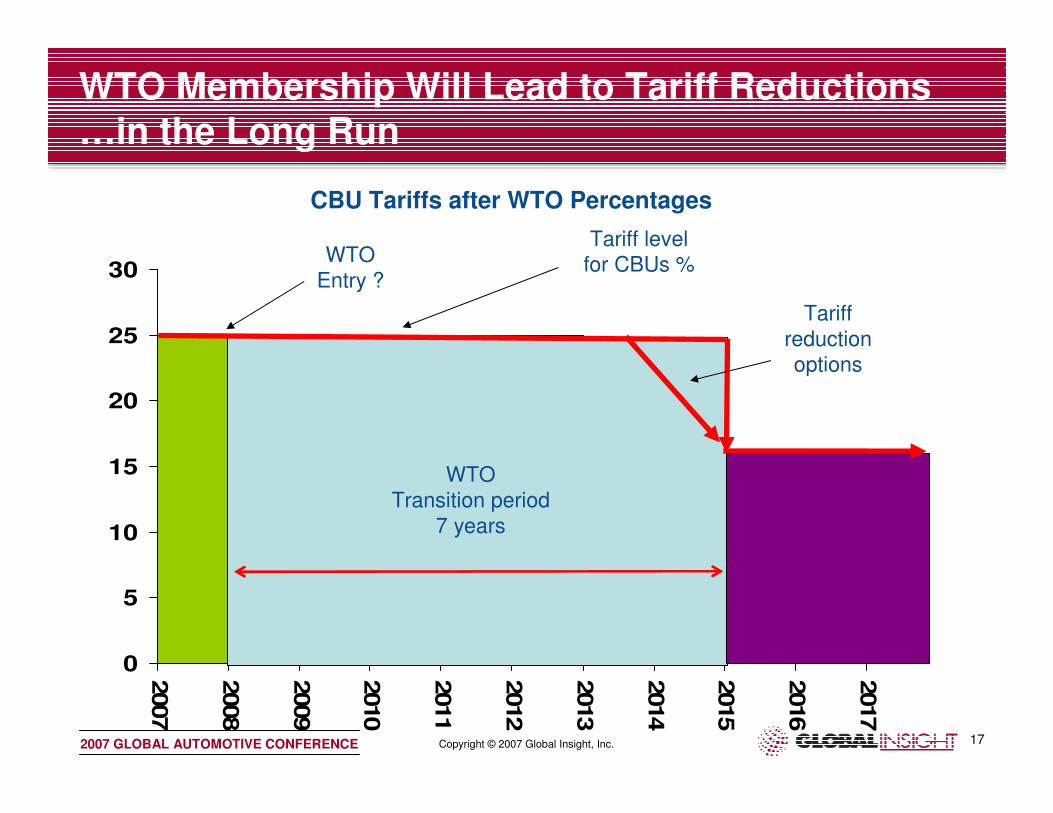
0
5
10
15
20
25
30
2007
2008
2009
2010
2011
2012
2013
2014
2015
2016
2017
WTO Transition period
7 years
WTO Membership Will Lead to Tariff Reductions …in the Long Run
Tariff level for CBUs %WTO
Entry ?
Tariff reduction options
CBU Tariffs after WTO Percentages
Copyright © 2007 Global Insight, Inc.2007 GLOBAL AUTOMOTIVE CONFERENCE 18
0
200
400
600
800
1000
1200
1400
1600
2004
2005
2006
2007
2008
2009
2010
2011
2012
Thousands
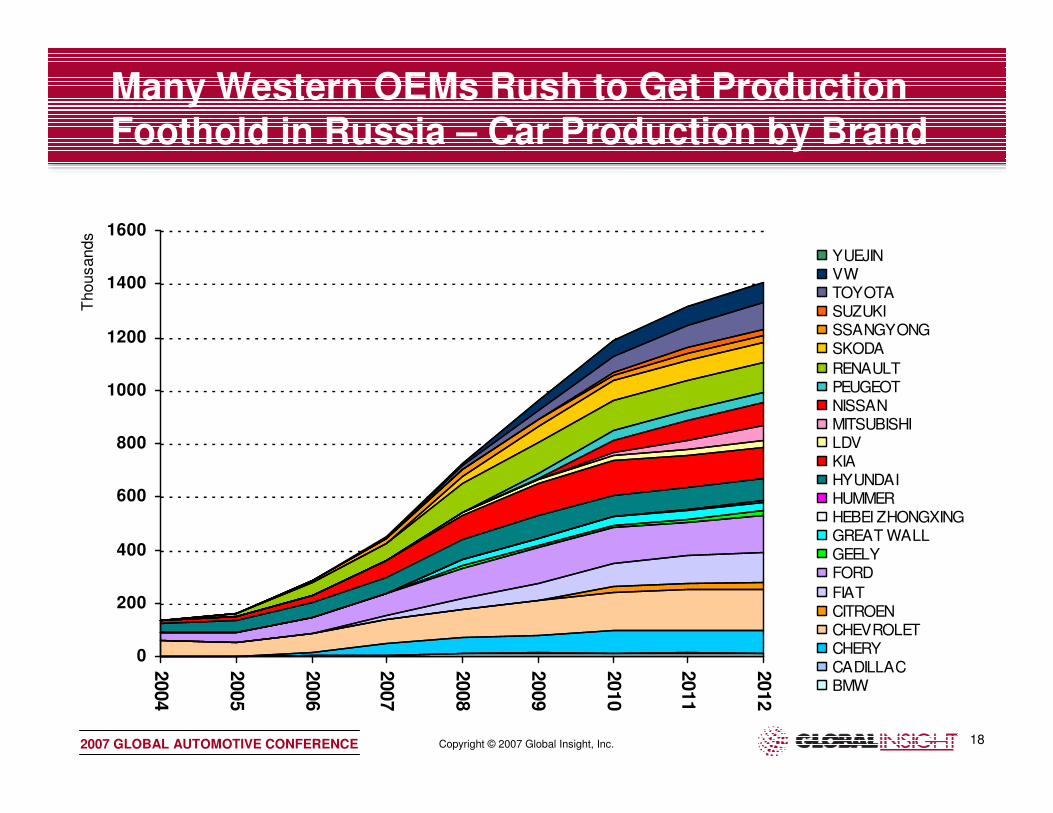
YUEJINVWTOYOTASUZUKISSANGYONGSKODA
RENAULTPEUGEOTNISSANMITSUBISHILDVKIAHYUNDAIHUMMERHEBEI ZHONGXINGGREAT WALLGEELYFORD
FIATCITROENCHEVROLETCHERYCADILLACBMW
Many Western OEMs Rush to Get Production Foothold in Russia – Car Production by Brand
Copyright © 2007 Global Insight, Inc.2007 GLOBAL AUTOMOTIVE CONFERENCE 19
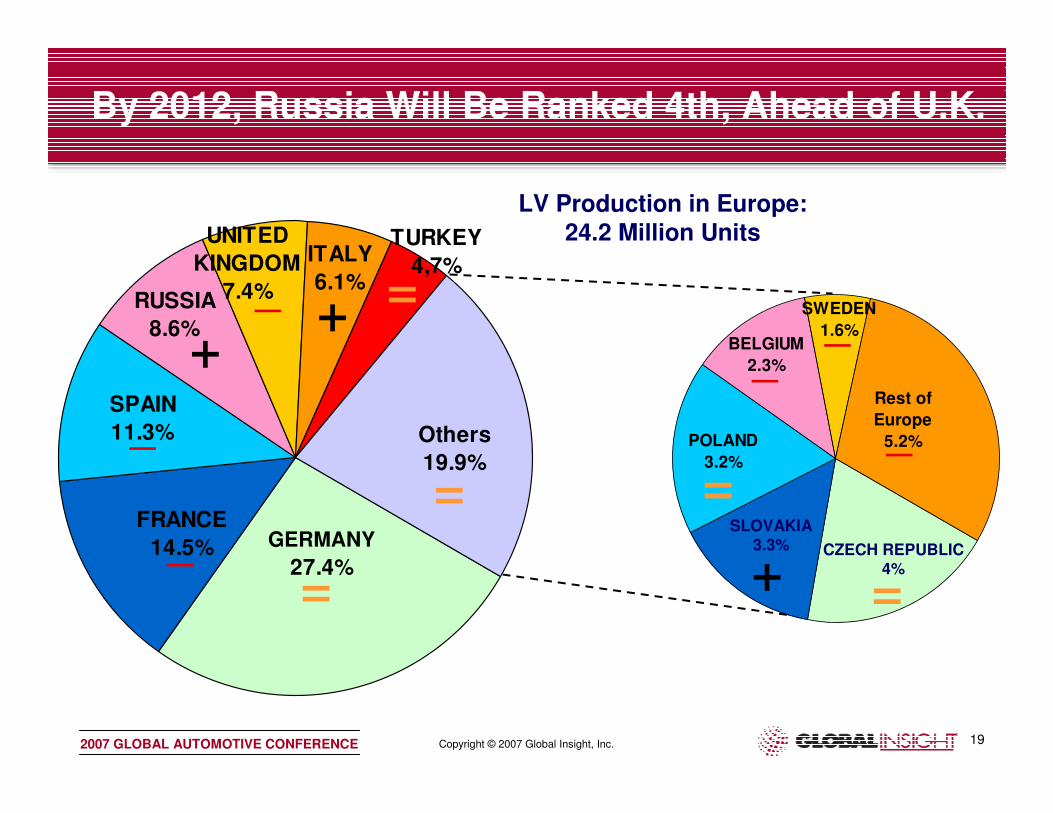
By 2012, Russia Will Be Ranked 4th, Ahead of U.K.
SPAIN
11.3%
GERMANY
27.4%
FRANCE
14.5%
Others
19.9%
TURKEY
4,7%ITALY
6.1%
UNITED
KINGDOM
7.4%RUSSIA
8.6%
POLAND
3.2%
Rest of
Europe
5.2%
SWEDEN
1.6%BELGIUM
2.3%
SLOVAKIA3.3% CZECH REPUBLIC
4%
=
= =
=+
__
_
_
+
_+
_
LV Production in Europe:24.2 Million Units
=

Copyright © 2007 Global Insight, Inc.2007 GLOBAL AUTOMOTIVE CONFERENCE 20
0 50 100 150 200 250 300 350 400 450 500
AB
C1C2
CDV
D1D2
E1E2
MPV-C
MPV-DSUV-B
SUV-CSUV-DSUV-E
Thousands
Russia Car Production by Segment 2007 and 2012
Toyota Small CarLogan, Nissan 1 litre
Focus, Linea, Spectra, Accent
Jetta & OctaviaDoblo
Mondeo, Sonata, Epica
Camry, 3 Series
5- Series, Teana
Rezzo
Rodius, CowrySX4
Chevy Niva, Captiva, Sportage, Tiggo
Rexton, Sorento, Santa Fe, Kyron
Escalade, H2

Copyright © 2007 Global Insight, Inc.2007 GLOBAL AUTOMOTIVE CONFERENCE 21
Spending Power and Credit
Copyright © 2007 Global Insight, Inc.2007 GLOBAL AUTOMOTIVE CONFERENCE 22
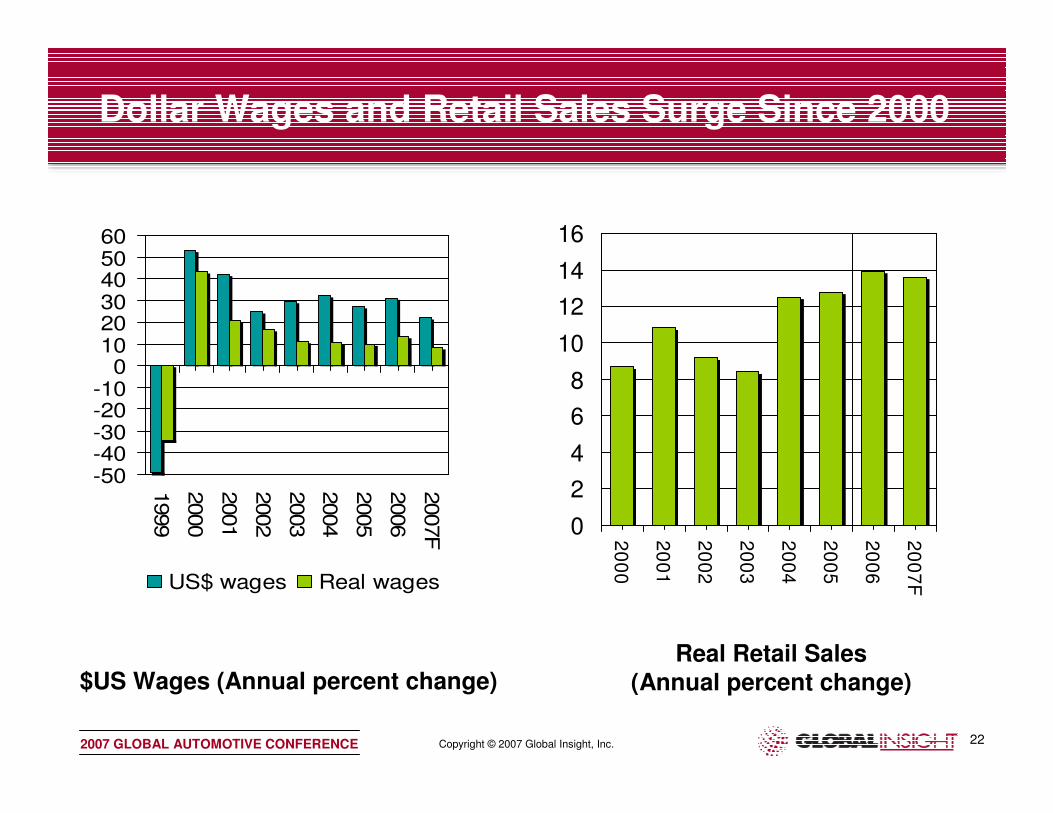
Dollar Wages and Retail Sales Surge Since 2000
-50-40-30-20-10
0102030405060
1999
2000
2001
2002
2003
2004
2005
2006
2007F
US$ wages Real wages
$US Wages (Annual percent change)
0
2
4
6
8
10
12
14
16
20
00
20
01
20
02
20
03
20
04
20
05
20
06
20
07
F
Real Retail Sales(Annual percent change)
Copyright © 2007 Global Insight, Inc.2007 GLOBAL AUTOMOTIVE CONFERENCE 23
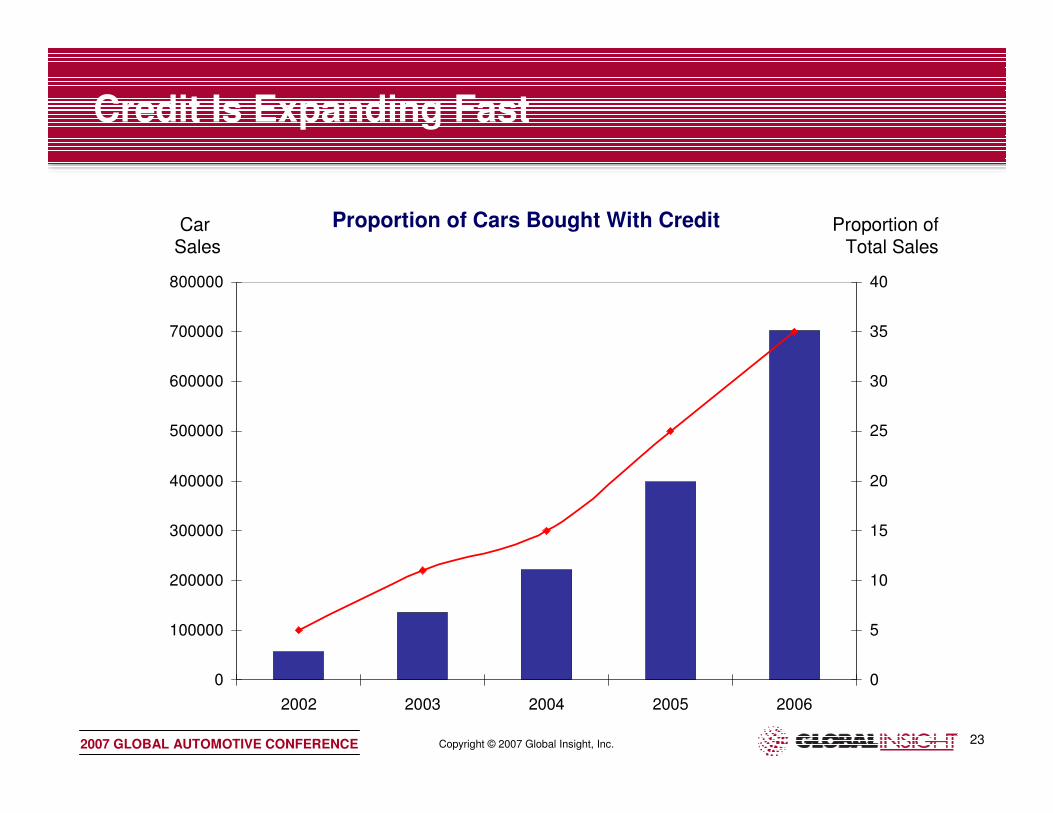
Credit Is Expanding Fast
0
100000
200000
300000
400000
500000
600000
700000
800000
2002 2003 2004 2005 2006
0
5
10
15
20
25
30
35
40
Proportion of Cars Bought With CreditCarSales
Proportion of Total Sales

Copyright © 2007 Global Insight, Inc.2007 GLOBAL AUTOMOTIVE CONFERENCE 24
Features of Credit in Russia
• Credit is dominated by banks rather than specialised consumer lending institutions
– Banks have developed direct ties with importers, dealers, and insurance companies
• Most car loan business occurs around Moscow and St Petersburg
– Strong potential to unlock credit in the regions
• Most loans are still denominated in hard currency
– This will shift towards rouble denominated credit as the importance of the regions increases
• Terms are getting easier
– The minimum acceptable salary was reduced in November 2006 to 100,000 roubles
– 70% of households could potentially qualify
– Average loan value rose from $10k in 2005 to $12.4k in 2006
• Foreign OEMs are moving to set up their own financing arms
– GM, Ford, Toyota, Nissan, Renault, BMW, and Mercedes Benz are all looking into setting up their own finance networks
– Mercedes-Benz and BMW will set up their own banking by late 2007 and early 2008 respectively
• Corporate and fleet sales are growing
– Influx of foreign companies who prefer foreign brands
– Ford sold 25% of its cars to corporate buyers in 2005
• Risks of a credit crisis are building
– Fast lending and lack of credit history
– Risk controls are still to be put in place
– Exchange rate risk probably not factored in by consumers
– A credit crunch already occurred during the Russian mini banking crisis in the summer of 2004

Copyr
ight
©200
7 G
lob
al In
sig
ht,
Inc.
2007 G
LO
BA
L A
UT
OM
OT
IVE
CO
NF
ER
EN
CE
25
Gro
wth
in
Fo
reig
n C
ar
Pa
rc,
To
p 1
5 R
eg
ion
s i
n
20
06
(%
Gro
wth
on
20
05
)
0%
10%
20%
30%
40%
50%
60%
70%
80%
90%
100%
Moscow
Moscow Oblast
St Petersburg
Primorsky Krai
Kalinningrad Oblast
Krasnodarsk Krai
Svedlovsok Oblast
Krasnoyarsk Krai
Irkutsk Oblast
Novosibirsk Oblast
Rostov Oblast
Cheliabink Oblast
Kemrovsky Oblast
Kanti-Mansi AO
Copyright © 2007 Global Insight, Inc.2007 GLOBAL AUTOMOTIVE CONFERENCE 26
Low-Cost Cars in Russia:Is the Market Evolving Too Fast?
Copyright © 2007 Global Insight, Inc.2007 GLOBAL AUTOMOTIVE CONFERENCE 27
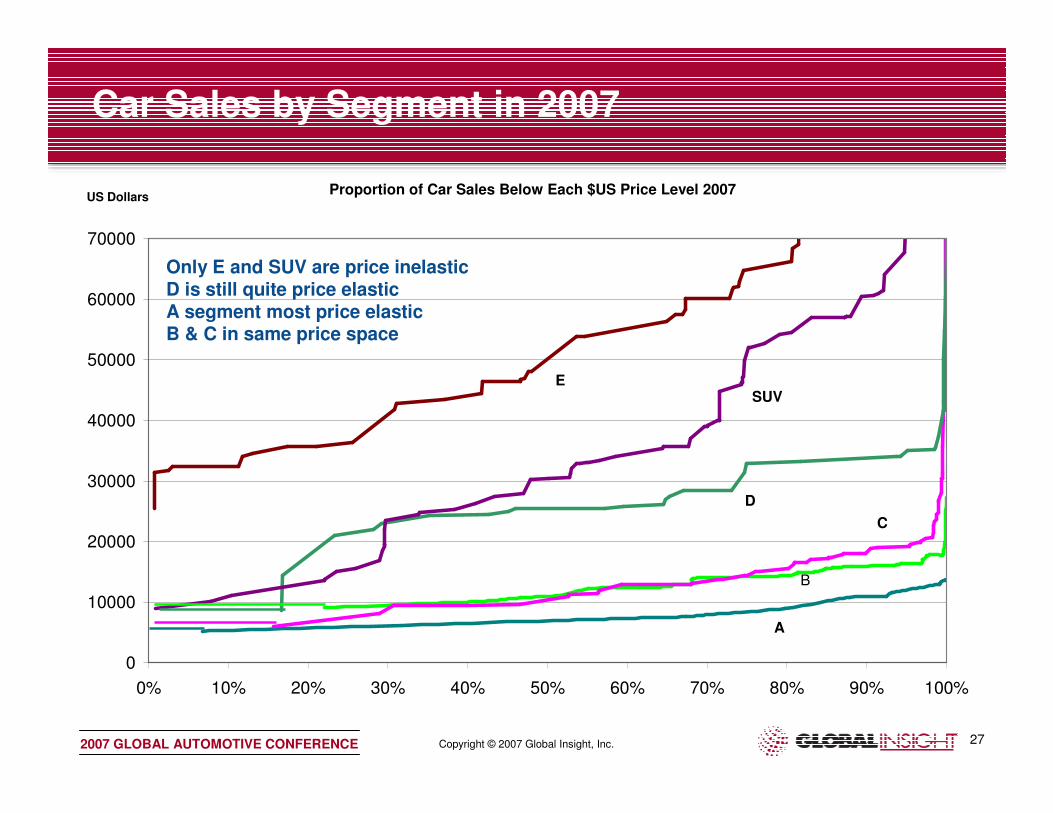
Car Sales by Segment in 2007
Proportion of Car Sales Below Each $US Price Level 2007
0
10000
20000
30000
40000
50000
60000
70000
0% 10% 20% 30% 40% 50% 60% 70% 80% 90% 100%
US Dollars
A
B
C
D
SUVE
Only E and SUV are price inelasticD is still quite price elasticA segment most price elasticB & C in same price space
Copyright © 2007 Global Insight, Inc.2007 GLOBAL AUTOMOTIVE CONFERENCE 28
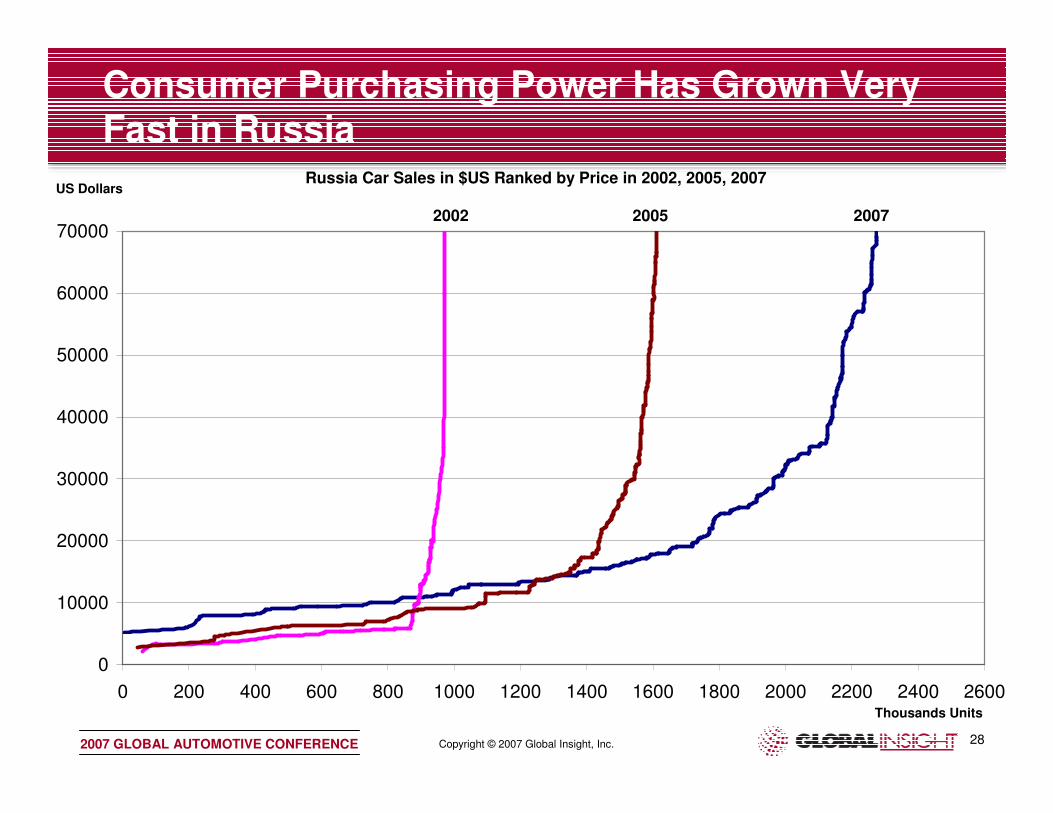
Consumer Purchasing Power Has Grown Very Fast in Russia
Russia Car Sales in $US Ranked by Price in 2002, 2005, 2007
0
10000
20000
30000
40000
50000
60000
70000
0 200 400 600 800 1000 1200 1400 1600 1800 2000 2200 2400 2600Thousands Units
US Dollars
2002 2005 2007

Copyright © 2007 Global Insight, Inc.2007 GLOBAL AUTOMOTIVE CONFERENCE 29
0
500
1000
1500
2000
2500
2002 2005 2007
The Proportion of Low Price Cars Is Falling
0%
10%
20%
30%
40%
50%
60%
70%
80%
90%
100%
2002 2005 2007
Proportion of Sales
$11–20k
$11k & under
Over $20k
Car Sales Volume 000s
Copyright © 2007 Global Insight, Inc.2007 GLOBAL AUTOMOTIVE CONFERENCE 30
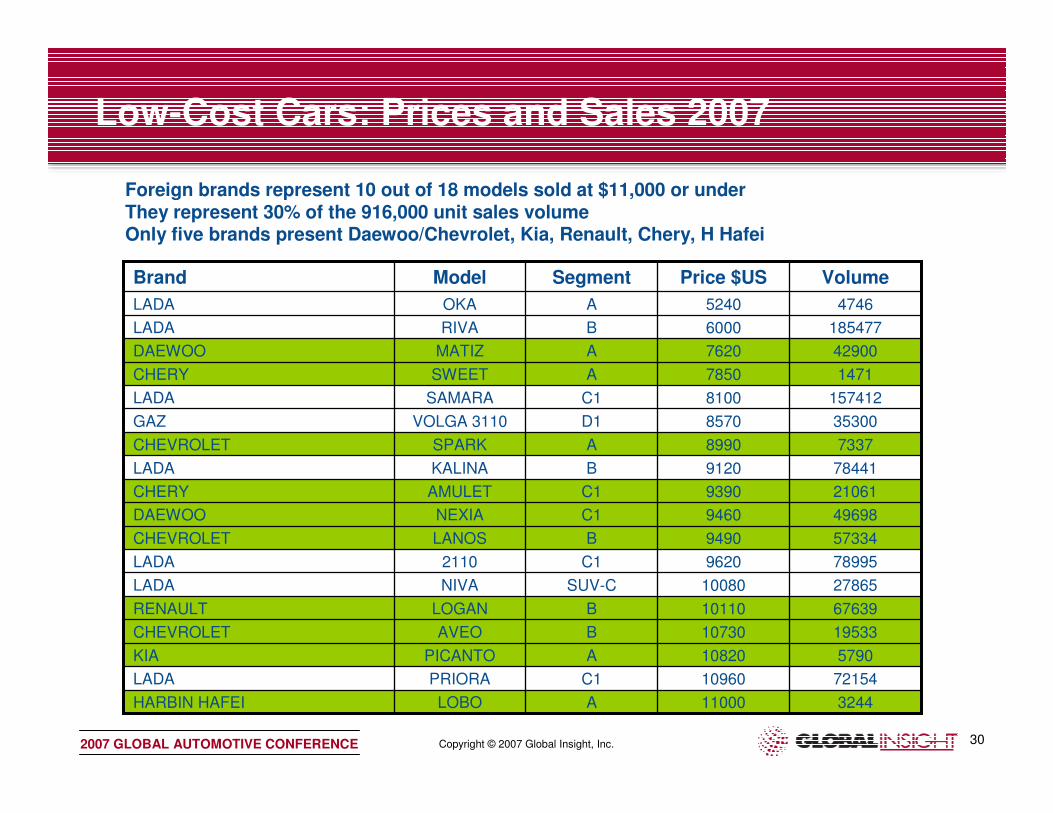
Low-Cost Cars: Prices and Sales 2007
324411000ALOBOHARBIN HAFEI
7215410960C1PRIORALADA
PICANTO
AVEO
LOGAN
NIVA
2110
LANOS
NEXIA
AMULET
KALINA
SPARK
VOLGA 3110
SAMARA
SWEET
MATIZ
RIVA
OKA
Model
A
B
B
SUV-C
C1
B
C1
C1
B
A
D1
C1
A
A
B
A
Segment
579010820KIA
1953310730CHEVROLET
6763910110RENAULT
2786510080LADA
789959620LADA
573349490CHEVROLET
496989460DAEWOO
210619390CHERY
784419120LADA
73378990CHEVROLET
353008570GAZ
1574128100LADA
14717850CHERY
429007620DAEWOO
1854776000LADA
47465240LADA
VolumePrice $USBrand
Foreign brands represent 10 out of 18 models sold at $11,000 or underThey represent 30% of the 916,000 unit sales volume Only five brands present Daewoo/Chevrolet, Kia, Renault, Chery, H Hafei
Copyright © 2007 Global Insight, Inc.2007 GLOBAL AUTOMOTIVE CONFERENCE 31
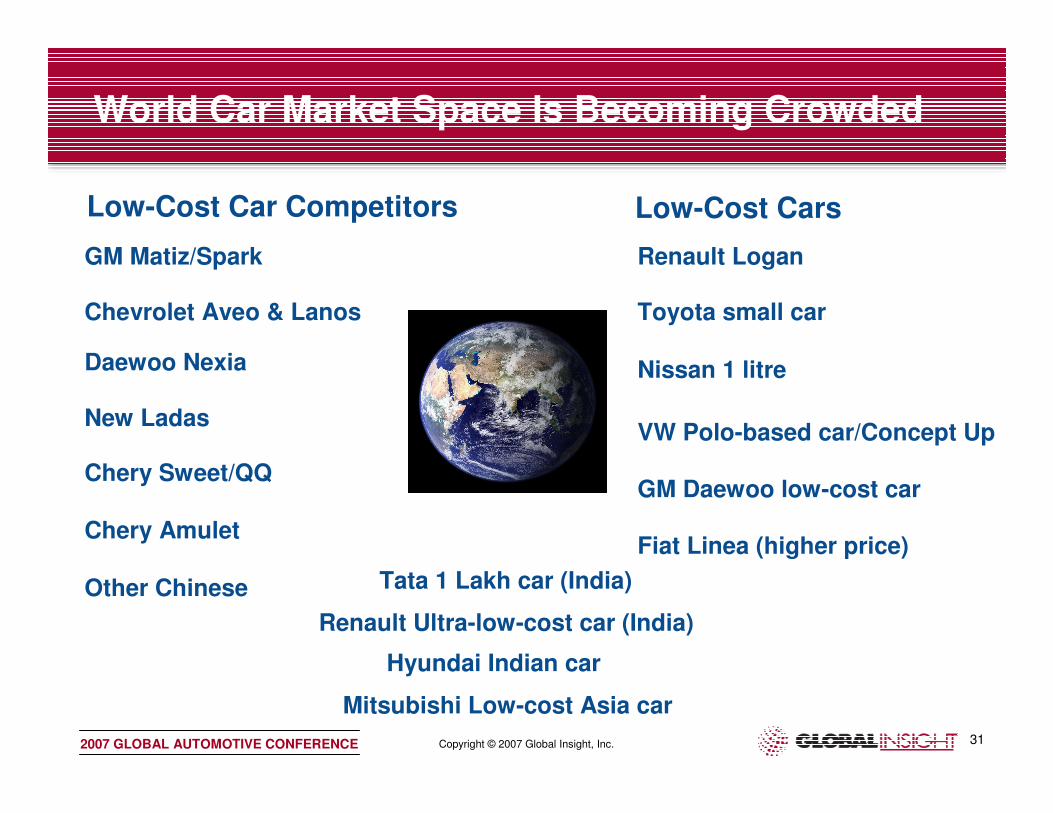
World Car Market Space Is Becoming Crowded
GM Matiz/Spark
Chevrolet Aveo & Lanos
Daewoo Nexia
New Ladas
Renault Logan
Toyota small car
Nissan 1 litre
VW Polo-based car/Concept Up
Mitsubishi Low-cost Asia car
Tata 1 Lakh car (India)
Renault Ultra-low-cost car (India)
Hyundai Indian car
GM Daewoo low-cost car
Fiat Linea (higher price)
Low-Cost CarsLow-Cost Car Competitors
Chery Sweet/QQ
Chery Amulet
Other Chinese

Copyright © 2007 Global Insight, Inc.2007 GLOBAL AUTOMOTIVE CONFERENCE 32
• One bodystyle available: sedan
• Three trim levels
• Two petrol powertrains – Euro 2 emissions standards
• Prices stretch well above base model
• 1.4 Authentique $10,200
• 1.4 Expression $10,900
• 1.6 Expression $11,800
• 1.6 Privilege $12,700
• 1.6 Prestige $13,700
The Logan in Russia
• Renault brought production at its AvtoFramos plant to full capacity during 2006, when a third shift was added. Production rose to 48,545 units in 2006
• In 2007, output will be extended to 80,000 units. In February, it announced a further investment of US$150 million to expand the facility to 160,000 units. This will take place by the middle of 2009
• In addition, a second model based on the Logan platform is likely to be launched
• Local content levels are being increased. In 2006, local content stood at 30%. In 2008, local content will increase to 40% and to 50% by 2009 by expanding the number of local suppliers from 18 to 30
• Renault will add 30 dealers to its network during 2008 and 2009. In 2007, it had 71 dealers operating 91 outlets

Copyright © 2007 Global Insight, Inc.2007 GLOBAL AUTOMOTIVE CONFERENCE 33
0
50
100
150
200
250
2005
2006
2007
2008
2009
2010
2011
2012
HEBEI
ZHONGXING
BYD
NANJING-MG
HARBIN HAFEI
GEELY
FAW
GREAT WALL
CHERY
Here Come the Chinese—Chinese Brand Car Sales in Russia
Positive Drivers
• Price competitive
• Quality rivals or beats Russian brands
• Explicit export mandate from Chinese government
• Meet Russian Euro 2 emissions levels
• Fewer safety requirements in Russia
Negative Factors
• Russian government reluctant to grant industrial assembly status under Decree 166
• Piecemeal dealer networks with dealers representing several brands
• Incomes rising rapidly and low-cost cars coming from Western OEMS
• Lack of brand and residual value could be issue in future

Copyright © 2007 Global Insight, Inc.2007 GLOBAL AUTOMOTIVE CONFERENCE 34
Chery
• Currently producing at Avtotor in Kalinningrad
– 18,600 units made in H1 2007
– Amulet (A15/Flagcloud)
– Tiggo
– Fora (A21)
– QQ and Kima A1 cars coming by end of 2007
• Expansion plans include large scale production with Avtotor
Amulet (Cowin/ A15)$9,390
Tiggo 3$16,950
Sweet (QQ3)$7850
Oriental Son (Eastar B11)
$21,700
Kimo A1
Fora (A5)$14,390
Copyright © 2007 Global Insight, Inc.2007 GLOBAL AUTOMOTIVE CONFERENCE 35
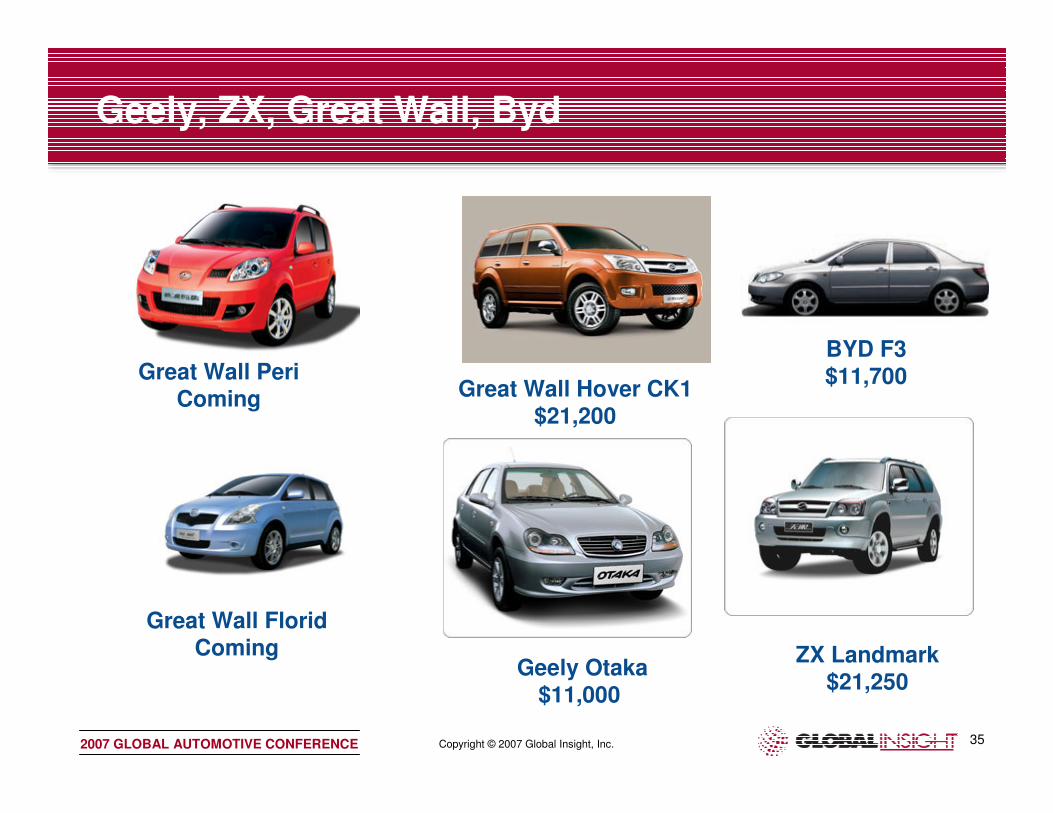
Geely, ZX, Great Wall, Byd
Great Wall Hover CK1$21,200
Great Wall FloridComing
Geely Otaka$11,000
ZX Landmark$21,250
BYD F3$11,700Great Wall Peri
Coming
Copyright © 2007 Global Insight, Inc.2007 GLOBAL AUTOMOTIVE CONFERENCE 36
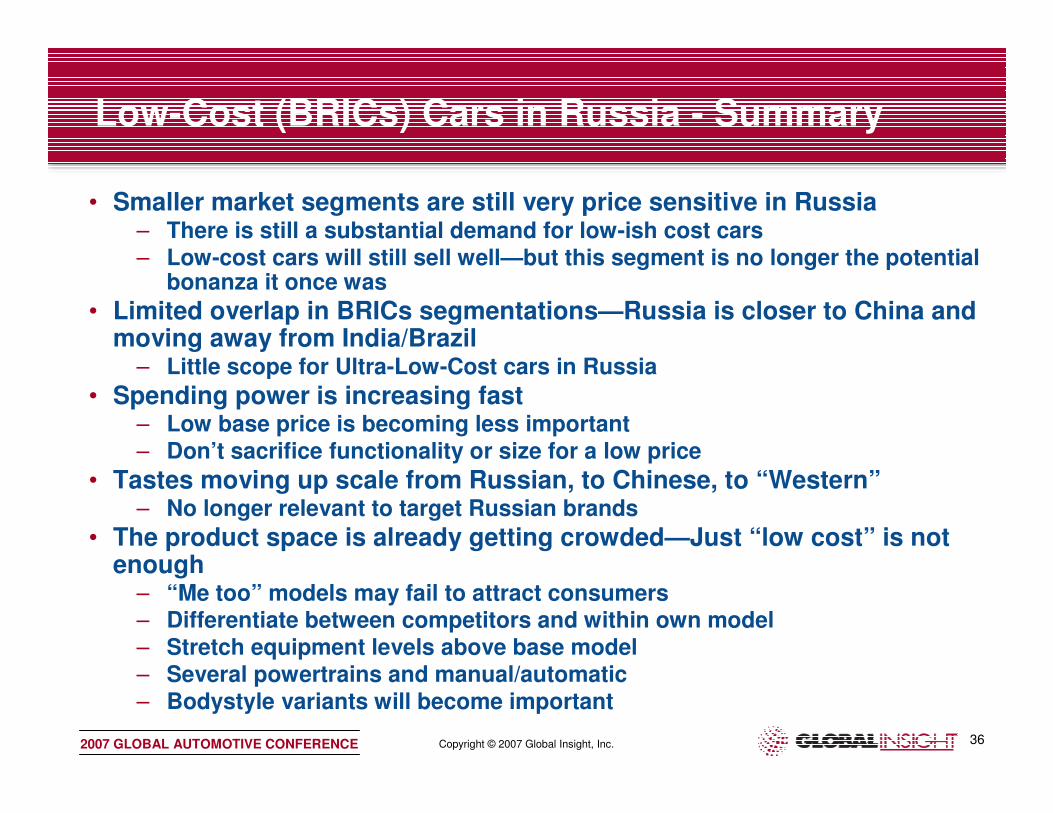
Low-Cost (BRICs) Cars in Russia - Summary
• Smaller market segments are still very price sensitive in Russia– There is still a substantial demand for low-ish cost cars– Low-cost cars will still sell well—but this segment is no longer the potential
bonanza it once was
• Limited overlap in BRICs segmentations—Russia is closer to China and moving away from India/Brazil
– Little scope for Ultra-Low-Cost cars in Russia
• Spending power is increasing fast– Low base price is becoming less important– Don’t sacrifice functionality or size for a low price
• Tastes moving up scale from Russian, to Chinese, to “Western”– No longer relevant to target Russian brands
• The product space is already getting crowded—Just “low cost” is not enough
– “Me too” models may fail to attract consumers– Differentiate between competitors and within own model– Stretch equipment levels above base model– Several powertrains and manual/automatic– Bodystyle variants will become important

Copyright © 2007 Global Insight, Inc.2007 GLOBAL AUTOMOTIVE CONFERENCE 37
0
100,000
200,000
300,000
400,000
500,000
600,000
700,000
800,000
20
05
20
06
20
07
20
08
20
09
20
10
20
11
20
12
LADA CHEVROLET FORD TOYOTANISSAN HYUNDAI RENAULT DAEWOOMITSUBISHI KIA OPEL
Car Sales Volumes by BrandThose Offering Low-Cost Cars Will Do Better
Copyright © 2007 Global Insight, Inc.2007 GLOBAL AUTOMOTIVE CONFERENCE 38
Summary
• Russia is in maximum growth phase now
• Sales “should” stabilise around 3.5 million units
• Investment and wage growth have driven demand
• OEMs not producing in Russia will lose market share
• Europeans will remain under-represented
• Credit expansion has lots more potential—but with risks
• ‘Low-cost cars’ are still attractive, but will not unlock another explosion in market growth