
Ruskin Elementary School School Accountability Report Card ... · Ruskin has 655 students, the...
12
2015-16 School Accountability Report Card for Ruskin Elementary School Page 1 of 12 Ruskin Elementary School School Accountability Report Card Reported Using Data from the 2015-16 School Year Published During 2016-17 By February 1 of each year, every school in California is required by state law to publish a School Accountability Report Card (SARC). The SARC contains information about the condition and performance of each California public school. Under the Local Control Funding Formula (LCFF) all local educational agencies (LEAs) are required to prepare a Local Control and Accountability Plan (LCAP), which describes how they intend to meet annual school-specific goals for all pupils, with specific activities to address state and local priorities. Additionally, data reported in an LCAP is to be consistent with data reported in the SARC. • For more information about SARC requirements, see the California Department of Education (CDE) SARC Web page at http://www.cde.ca.gov/ta/ac/sa/. • For more information about the LCFF or LCAP, see the CDE LCFF Web page at http://www.cde.ca.gov/fg/aa/lc/. • For additional information about the school, parents/guardians and community members should contact the school principal or the district office. DataQuest DataQuest is an online data tool located on the CDE DataQuest Web page at http://dq.cde.ca.gov/dataquest/ that contains additional information about this school and comparisons of the school to the district and the county. Specifically, DataQuest is a dynamic system that provides reports for accountability (e.g., test data, enrollment, high school graduates, dropouts, course enrollments, staffing, and data regarding English learners). Internet Access Internet access is available at public libraries and other locations that are publicly accessible (e.g., the California State Library). Access to the Internet at libraries and public locations is generally provided on a first-come, first-served basis. Other use restrictions may include the hours of operation, the length of time that a workstation may be used (depending on availability), the types of software programs available on a workstation, and the ability to print documents. About This School Contact Information (School Year 2016-17) School Contact Information School Name------- Ruskin Elementary School Street------- 1401 Turlock Lane City, State, Zip------- San Jose CA 95131 Phone Number------- 408-923-1950 Principal------- Virginia Pender E-mail Address------- [email protected] Web Site------- http://ruskin.berryessa.k12.ca.us/ CDS Code 43 69377 6067177
Transcript of Ruskin Elementary School School Accountability Report Card ... · Ruskin has 655 students, the...

2015-16 School Accountability Report Card for Ruskin Elementary School Page 1 of 12
Ruskin Elementary School
School Accountability Report Card
Reported Using Data from the 2015-16 School Year
Published During 2016-17
By February 1 of each year, every school in California is required by state law to publish a School Accountability Report Card (SARC). The SARC contains information about the condition and performance of each California public school. Under the Local Control Funding Formula (LCFF) all local educational agencies (LEAs) are required to prepare a Local Control and Accountability Plan (LCAP), which describes how they intend to meet annual school-specific goals for all pupils, with specific activities to address state and local priorities. Additionally, data reported in an LCAP is to be consistent with data reported in the SARC. • For more information about SARC requirements, see the California Department of Education (CDE) SARC Web page at
http://www.cde.ca.gov/ta/ac/sa/. • For more information about the LCFF or LCAP, see the CDE LCFF Web page at http://www.cde.ca.gov/fg/aa/lc/. • For additional information about the school, parents/guardians and community members should contact the school principal or
the district office. DataQuest DataQuest is an online data tool located on the CDE DataQuest Web page at http://dq.cde.ca.gov/dataquest/ that contains additional information about this school and comparisons of the school to the district and the county. Specifically, DataQuest is a dynamic system that provides reports for accountability (e.g., test data, enrollment, high school graduates, dropouts, course enrollments, staffing, and data regarding English learners). Internet Access Internet access is available at public libraries and other locations that are publicly accessible (e.g., the California State Library). Access to the Internet at libraries and public locations is generally provided on a first-come, first-served basis. Other use restrictions may include the hours of operation, the length of time that a workstation may be used (depending on availability), the types of software programs available on a workstation, and the ability to print documents.
About This School Contact Information (School Year 2016-17)
School Contact Information
School Name------- Ruskin Elementary School
Street------- 1401 Turlock Lane
City, State, Zip------- San Jose CA 95131
Phone Number------- 408-923-1950
Principal------- Virginia Pender
E-mail Address------- [email protected]
Web Site------- http://ruskin.berryessa.k12.ca.us/
CDS Code 43 69377 6067177

2015-16 School Accountability Report Card for Ruskin Elementary School Page 2 of 12
District Contact Information
District Name------- Berryessa Union Elementary School District
Phone Number------- 408.923.1880
Superintendent-------
Mr. Will Ector
E-mail Address------- [email protected]
Web Site------- www.berryessa.k12.ca.us
School Description and Mission Statement (School Year 2016-17)
Ruskin is nestled in the heart of Silicon Valley, our community and teachers, work together everyday with a common passion—the passion to take diverse children of varying abilities and transform then into extraordinary students with unlimited potential. Ruskin has 655 students, the Ruskin Roadrunners. The students come from many places representing cultures of our diverse world and bringing with them, unique life experiences. However, their vision for a quality education is the same. Berryessa Union School District provides all students the skills to become lifelong learners and successful 21st century global citizens. Ruskin School Together with students, parents, and community members, will strive to ensure that all students have the skills necessary to reach high level of academic achievement, respect self and others, and become lifelong learners as successful, productive and responsible citizens. Student Enrollment by Grade Level (School Year 2015-16)
Grade Number of
Level Students
Kindergarten 85
Grade 1 92
Grade 2 101
Grade 3 113
Grade 4 120
Grade 5 121
Total Enrollment 632
Student Enrollment by Group (School Year 2015-16)
Student Percent of
Group Total Enrollment
Black or African American 0.6
American Indian or Alaska Native 0
Asian 68
Filipino 7.8
Hispanic or Latino 13.3
Native Hawaiian or Pacific Islander 1.1
White 4
Two or More Races 5.2
Socioeconomically Disadvantaged 18.8
English Learners 40
Students with Disabilities 6.2
Foster Youth 0.2
2015-16 School Accountability Report Card for Ruskin Elementary School Page 3 of 12
A. Conditions of Learning
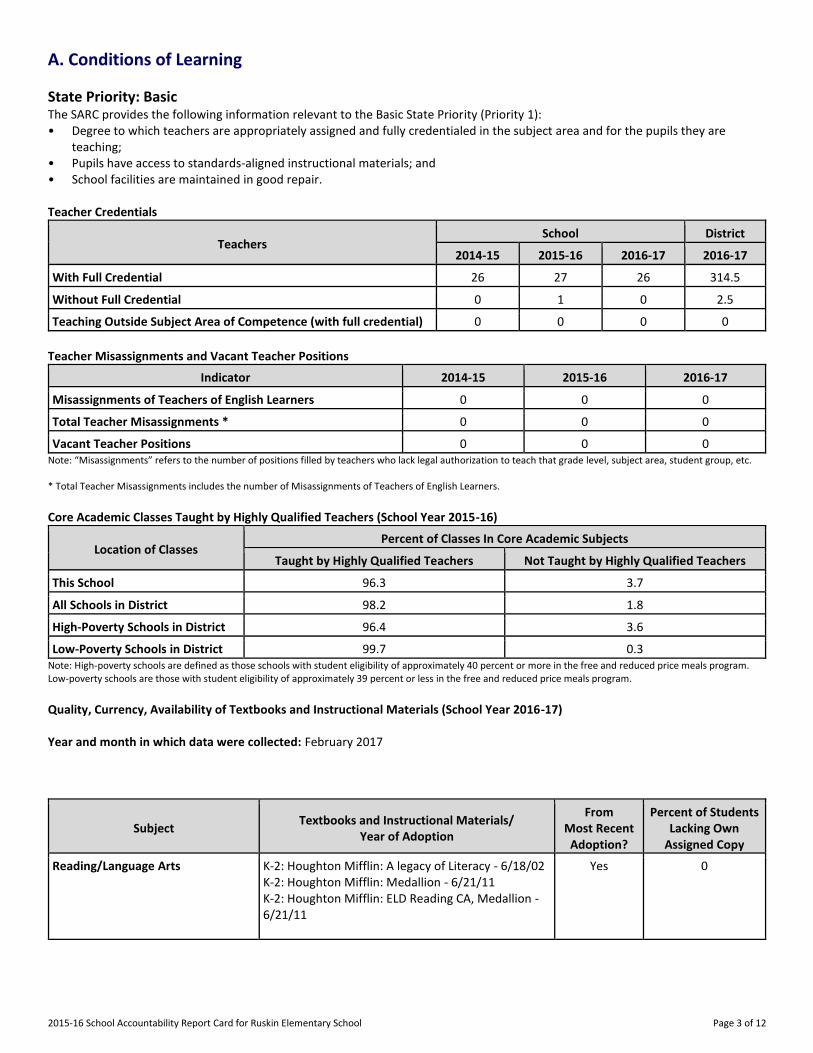
State Priority: Basic The SARC provides the following information relevant to the Basic State Priority (Priority 1): • Degree to which teachers are appropriately assigned and fully credentialed in the subject area and for the pupils they are
teaching; • Pupils have access to standards-aligned instructional materials; and • School facilities are maintained in good repair. Teacher Credentials
Teachers School District
2014-15 2015-16 2016-17 2016-17
With Full Credential 26 27 26 314.5
Without Full Credential 0 1 0 2.5
Teaching Outside Subject Area of Competence (with full credential) 0 0 0 0
Teacher Misassignments and Vacant Teacher Positions
Indicator 2014-15 2015-16 2016-17
Misassignments of Teachers of English Learners 0 0 0
Total Teacher Misassignments * 0 0 0
Vacant Teacher Positions 0 0 0 Note: “Misassignments” refers to the number of positions filled by teachers who lack legal authorization to teach that grade level, subject area, student group, etc. * Total Teacher Misassignments includes the number of Misassignments of Teachers of English Learners. Core Academic Classes Taught by Highly Qualified Teachers (School Year 2015-16)
Location of Classes Percent of Classes In Core Academic Subjects
Taught by Highly Qualified Teachers Not Taught by Highly Qualified Teachers
This School 96.3 3.7
All Schools in District 98.2 1.8
High-Poverty Schools in District 96.4 3.6
Low-Poverty Schools in District 99.7 0.3 Note: High-poverty schools are defined as those schools with student eligibility of approximately 40 percent or more in the free and reduced price meals program. Low-poverty schools are those with student eligibility of approximately 39 percent or less in the free and reduced price meals program. Quality, Currency, Availability of Textbooks and Instructional Materials (School Year 2016-17) Year and month in which data were collected: February 2017
Subject Textbooks and Instructional Materials/
Year of Adoption
From Most Recent
Adoption?
Percent of Students Lacking Own
Assigned Copy
Reading/Language Arts K-2: Houghton Mifflin: A legacy of Literacy - 6/18/02
K-2: Houghton Mifflin: Medallion - 6/21/11
K-2: Houghton Mifflin: ELD Reading CA, Medallion - 6/21/11
Yes 0

2015-16 School Accountability Report Card for Ruskin Elementary School Page 4 of 12
Subject Textbooks and Instructional Materials/
Year of Adoption
From Most Recent
Adoption?
Percent of Students Lacking Own
Assigned Copy
Mathematics K-2: Houghton Mifflin: Go Math Common Core Hybrid - 3/27/15
3-5: Pearson: envision Math CA Common Core - 3/30/15
Yes 0
Science K-5: Houghton Mifflin: California Science - 5/15/07 Yes 0
History-Social Science K-5: Pearson Scott Foresman - 6/13/06 Yes 0
School Facility Conditions and Planned Improvements (Most Recent Year)
General: The district places a strong emphasis on ensuring that all schools are safe, clean, environmentally friendly, mechanically functional and inviting for students, staff members, and the community. To assist in this effort, the district utilizes Facility Inspection Tool (FIT) developed by the State of California OPSC and local operations department developed inspection survey methods to keep facilities in compliance with all federal and state health and safety regulations. The district regularly inspects and reviews the condition of the school facilities and surrounding grounds. The district places the highest priority on those safeguards that impact the fire, life and safety protection of the students, staff, and school buildings. Below is more specific information on the condition of the school and the efforts made to ensure that students are provided with a clean, safe, and functional learning environment. Age of School Buildings: Ruskin was opened in 1969. This school has 28 regular classrooms, a multipurpose room, a library, and an administration building. In addition to the main building, there are four portable classrooms that have been added to accommodate class size reduction, provide music instruction classes, and a science and computer lab. Maintenance and Repair: District maintenance staff ensures that the repairs necessary to keep the school in good repair and working order are completed in a timely manner. A work order system process is used to ensure efficient service and highest priority is given to emergency repairs. At the time of publication, 100% of the school’s restrooms on campus were in good working order. Cleaning Process and Schedule: The district has developed cleaning standards and schedules for all schools in the district. A summary of these standards and schedules is available at the school or the Maintenance & Operations office. The principal, with the guidance of the maintenance supervisor works daily with the custodial team to ensure that the cleaning standards are met, and that classrooms, restrooms, and campus grounds are kept clean, safe, and well-maintained. Modernization Projects: During the 2016-17 school years, local bond funds (Measure L) will be used to upgrade exterior paint, flooring and classroom furniture. Also, scheduled is the upgrade of IT cabling that includes exterior wireless access points. The work is expected to be completed prior to the start of the 2017-18 school year. School Facility Good Repair Status (Most Recent Year)
School Facility Good Repair Status (Most Recent Year) Year and month of the most recent FIT report: July 2016
System Inspected Repair Status Repair Needed and
Action Taken or Planned Good Fair Poor
Systems: Gas Leaks, Mechanical/HVAC, Sewer
X
Interior: Interior Surfaces X Modernization 2016-17
Cleanliness: Overall Cleanliness, Pest/ Vermin Infestation
X Modernization 2016-17
Electrical: Electrical X

2015-16 School Accountability Report Card for Ruskin Elementary School Page 5 of 12
School Facility Good Repair Status (Most Recent Year) Year and month of the most recent FIT report: July 2016
System Inspected Repair Status Repair Needed and
Action Taken or Planned Good Fair Poor
Restrooms/Fountains: Restrooms, Sinks/ Fountains
X Modernization 2016-17
Safety: Fire Safety, Hazardous Materials X
Structural: Structural Damage, Roofs X Modernization 2016-17
External: Playground/School Grounds, Windows/ Doors/Gates/Fences
X
Overall Facility Rating (Most Recent Year)
Year and month of the most recent FIT report: July 2016
Overall Rating Exemplary Good Fair Poor
X
B. Pupil Outcomes
State Priority: Pupil Achievement The SARC provides the following information relevant to the State priority: Pupil Achievement (Priority 4): • Statewide assessments (i.e., California Assessment of Student Performance and Progress [CAASPP] System, which includes the
Smarter Balanced Summative Assessments for students in the general education population and the California Alternate Assessments [CAAs] for English language arts/literacy [ELA] and mathematics given in grades three through eight and grade eleven. The CAAs have replaced the California Alternate Performance Assessment [CAPA] for ELA and mathematics, which were eliminated in 2015. Only eligible students may participate in the administration of the CAAs. CAA items are aligned with alternate achievement standards, which are linked with the Common Core State Standards [CCSS] for students with significant cognitive disabilities); and
• The percentage of students who have successfully completed courses that satisfy the requirements for entrance to the University of California and the California State University, or career technical education sequences or programs of study
CAASPP Test Results in English Language Arts/Literacy (ELA) and Mathematics for All Students
Subject
Percent of Students Meeting or Exceeding the State Standards (grades 3-8 and 11)
School District State
2014-15 2015-16 2014-15 2015-16 2014-15 2015-16
English Language Arts/Literacy 69 71 56 59 44 48
Mathematics 67 68 50 54 34 36 Note: Percentages are not calculated when the number of students tested is ten or less, either because the number of students in this category is too small for statistical accuracy or to protect student privacy.

2015-16 School Accountability Report Card for Ruskin Elementary School Page 6 of 12
CAASPP Test Results in ELA by Student Group Grades Three through Eight and Grade Eleven (School Year 2015-16)
Student Group Grade
Number of Students Percent of Students
Enrolled Tested Tested Standard Met or
Exceeded
All Students 3 119 116 97.5 69.0
4 126 125 99.2 69.3
5 121 117 96.7 76.1
Male 3 57 55 96.5 63.6
4 56 56 100.0 56.4
5 61 59 96.7 72.9
Female 3 62 61 98.4 73.8
4 70 69 98.6 79.7
5 60 58 96.7 79.3
Black or African American 3 -- -- -- --
5 -- -- -- --
Asian 3 75 74 98.7 89.2
4 81 80 98.8 80.0
5 84 82 97.6 79.3
Filipino 3 -- -- -- --
4 17 17 100.0 58.8
5 -- -- -- --
Hispanic or Latino 3 23 22 95.7 27.3
4 18 18 100.0 27.8
5 13 13 100.0 61.5
Native Hawaiian or Pacific Islander
3 -- -- -- --
4 -- -- -- --
5 -- -- -- --
White 3 -- -- -- --
4 -- -- -- --
5 -- -- -- --
Two or More Races 3 -- -- -- --
4 -- -- -- --
5 -- -- -- --
Socioeconomically Disadvantaged 3 38 38 100.0 50.0
4 23 23 100.0 36.4
5 26 26 100.0 65.4
English Learners 3 54 53 98.2 75.5
4 31 30 96.8 48.3
5 20 19 95.0 31.6

2015-16 School Accountability Report Card for Ruskin Elementary School Page 7 of 12
Student Group Grade
Number of Students Percent of Students
Enrolled Tested Tested Standard Met or
Exceeded
Students with Disabilities 3 12 11 91.7 18.2
4 -- -- -- --
5 13 13 100.0 23.1
Foster Youth 3 -- -- -- --
4 -- -- -- --
5 -- -- -- --
Note: ELA test results include the Smarter Balanced Summative Assessment and the CAA. The “Percent Met or Exceeded” is calculated by taking the total number of students who met or exceeded the standard on the Smarter Balanced Summative Assessment plus the total number of students who met the standard on the CAAs divided by the total number of students who participated in both assessments. Double dashes (--) appear in the table when the number of students is ten or less, either because the number of students in this category is too small for statistical accuracy or to protect student privacy. Note: The number of students tested includes all students who participated in the test whether they received a score or not; however, the number of students tested is not the number that was used to calculate the achievement level percentages. The achievement level percentages are calculated using only students who received scores.
CAASPP Test Results in Mathematics by Student Group Grades Three through Eight and Grade Eleven (School Year 2015-16)
Student Group Grade
Number of Students Percent of Students
Enrolled Tested Tested Standard Met or
Exceeded
All Students 3 119 117 98.3 79.5
4 127 127 100.0 60.6
5 121 119 98.3 63.9
Male 3 57 55 96.5 81.8
4 56 56 100.0 57.1
5 61 60 98.4 58.3
Female 3 62 62 100.0 77.4
4 71 71 100.0 63.4
5 60 59 98.3 69.5
Black or African American 3 -- -- -- --
5 -- -- -- --
Asian 3 75 75 100.0 94.7
4 82 82 100.0 70.7
5 84 83 98.8 74.7
Filipino 3 -- -- -- --
4 17 17 100.0 58.8
5 -- -- -- --
Hispanic or Latino 3 23 22 95.7 36.4
4 18 18 100.0 16.7
5 13 13 100.0 23.1

2015-16 School Accountability Report Card for Ruskin Elementary School Page 8 of 12
Student Group Grade
Number of Students Percent of Students
Enrolled Tested Tested Standard Met or
Exceeded
Native Hawaiian or Pacific Islander
3 -- -- -- --
4 -- -- -- --
5 -- -- -- --
White 3 -- -- -- --
4 -- -- -- --
5 -- -- -- --
Two or More Races 3 -- -- -- --
4 -- -- -- --
5 -- -- -- --
Socioeconomically Disadvantaged 3 38 38 100.0 60.5
4 23 23 100.0 34.8
5 26 26 100.0 42.3
English Learners 3 54 54 100.0 81.5
4 31 31 100.0 32.3
5 20 20 100.0 35.0
Students with Disabilities 3 12 11 91.7 36.4
4 -- -- -- --
5 13 13 100.0 7.7
Foster Youth 3 -- -- -- --
4 -- -- -- --
5 -- -- -- --
Note: Mathematics test results include the Smarter Balanced Summative Assessment and the CAA. The “Percent Met or Exceeded” is calculated by taking the total number of students who met or exceeded the standard on the Smarter Balanced Summative Assessment plus the total number of students who met the standard on the CAAs divided by the total number of students who participated in both assessments. Double dashes (--) appear in the table when the number of students is ten or less, either because the number of students in this category is too small for statistical accuracy or to protect student privacy. Note: The number of students tested includes all students who participated in the test whether they received a score or not; however, the number of students tested is not the number that was used to calculate the achievement level percentages. The achievement level percentages are calculated using only students who received scores.
CAASPP Test Results in Science for All Students
Subject
Percent of Students Scoring at Proficient or Advanced (meeting or exceeding the state standards)
School District State
2013-14 2014-15 2015-16 2013-14 2014-15 2015-16 2013-14 2014-15 2015-16
Science (grades 5, 8, and 10) 87 83 83 77 73 76 60 56 54 Note: Science test results include California Standards Tests (CSTs), California Modified Assessment (CMA), and California Alternate Performance Assessment (CAPA) in grades five, eight, and ten. Note: Scores are not shown when the number of students tested is ten or less, either because the number of students in this category is too small for statistical accuracy or to protect student privacy.

2015-16 School Accountability Report Card for Ruskin Elementary School Page 9 of 12
CAASPP Test Results in Science by Student Group Grades Five, Eight, and Ten (School Year 2015-16)
Student Group
Total Enrollment
# of Students with Valid Scores
% of Students with Valid Scores
% of Students Proficient or
Advanced
All Students 121 118 97.5 83.1
Male 61 59 96.7 89.8
Female 60 59 98.3 76.3
Asian 84 82 97.6 87.8
Hispanic or Latino 13 13 100.0 61.5
Socioeconomically Disadvantaged 26 26 100.0 65.4
English Learners 20 20 100.0 50.0
Students with Disabilities 13 13 100.0 61.5 Note: Science test results include CSTs, CMA, and CAPA in grades five, eight, and ten. The “Proficient or Advanced” is calculated by taking the total number of students who scored at Proficient or Advanced on the science assessment divided by the total number of students with valid scores. Note: Scores are not shown when the number of students tested is ten or less, either because the number of students in this category is too small for statistical accuracy or to protect student privacy.
State Priority: Other Pupil Outcomes The SARC provides the following information relevant to the Other Pupil Outcomes State Priority (Priority 8): • Pupil outcomes in the subject areas of physical education. California Physical Fitness Test Results (School Year 2015-16)
Grade Level
Percent of Students Meeting Fitness Standards
Four of Six Standards Five of Six Standards Six of Six Standards
---5--- 23.7 32.2 38.1 Note: Percentages are not calculated when the number of students tested is ten or less, either because the number of students in this category is too small for statistical accuracy or to protect student privacy.
C. Engagement
State Priority: Parental Involvement The SARC provides the following information relevant to the Parental Involvement State Priority (Priority 3): • Efforts the school district makes to seek parent input in making decisions for the school district and each schoolsite. Opportunities for Parental Involvement (School Year 2016-17)
The Ruskin School culture is deeply embedded in a tradition of community involvement that draws all of its citizens into the educational process. This is evidenced through the combined efforts of the school community towards meeting and exceeding the expectations of standards aligned programs. Community members serve as parent volunteers in the classroom, Book fair helpers, PTA officers, Walk-a-Thon helpers, Project Cornerstone’s volunteers, and School Site Council members.

2015-16 School Accountability Report Card for Ruskin Elementary School Page 10 of 12
State Priority: School Climate The SARC provides the following information relevant to the School Climate State Priority (Priority 6): • Pupil suspension rates; • Pupil expulsion rates; and • Other local measures on the sense of safety. Suspensions and Expulsions
Rate School District State
2013-14 2014-15 2015-16 2013-14 2014-15 2015-16 2013-14 2014-15 2015-16
Suspensions------- 1.3 1.0 0.5 3.0 3.8 3.1 4.4 3.8 3.7
Expulsions------- 0.0 0.0 0.0 0.2 0.2 0.1 0.1 0.1 0.1
School Safety Plan (School Year 2016-17)
Campus supervision starts 10 minutes before the beginning of school and continues during the entire school day. Students are supervised by classroom teachers before and after school, during recesses, and by noon duty supervisors at lunch. We have student crossing guards and staff, who help children cross the streets near our school every morning and afternoon. We hold fire/earthquake drills monthly and disaster drills twice a year. Our School Safety Plan is updated yearly, and every staff member has a hard copy. This year, we will update our phone tree and a command station for emergencies.
D. Other SARC Information
The information in this section is required to be in the SARC but is not included in the state priorities for LCFF. Federal Intervention Program (School Year 2016-17)
Indicator School District
Program Improvement Status In PI
First Year of Program Improvement 2010-2011
Year in Program Improvement* Year 3
Number of Schools Currently in Program Improvement N/A 6
Percent of Schools Currently in Program Improvement N/A 85.7 Note: Cells with N/A values do not require data.
Average Class Size and Class Size Distribution (Elementary)
Grade Level
2013-14 2014-15 2015-16
Avg. Class Size
Number of Classes Avg. Class Size
Number of Classes Avg. Class Size
Number of Classes
1-20 21-32 33+ 1-20 21-32 33+ 1-20 21-32 33+
K
24 4 24 4 21 3
1
24 4 24 4 23 3
2
24 5 23 5 26 3
3
24 5 23 5 22 4
4
31 3 28 4 29 3
5
27 1 4 26 1 4 29 3
Other
12 1 Number of classes indicates how many classes fall into each size category (a range of total students per class).

2015-16 School Accountability Report Card for Ruskin Elementary School Page 11 of 12
Academic Counselors and Other Support Staff (School Year 2015-16)
Title Number of FTE
Assigned to School Average Number of Students per
Academic Counselor
Academic Counselor------- .07 0
Counselor (Social/Behavioral or Career Development) 0 N/A
Library Media Teacher (Librarian) .07 N/A
Library Media Services Staff (Paraprofessional) 1 N/A
Psychologist------- .38 N/A
Social Worker------- .61 N/A
Nurse------- .11 N/A
Speech/Language/Hearing Specialist .12 N/A
Resource Specialist------- 1 N/A
Other------- 0 N/A Note: Cells with N/A values do not require data. *One Full Time Equivalent (FTE) equals one staff member working full time; one FTE could also represent two staff members who each work 50 percent of full time.
Expenditures per Pupil and School Site Teacher Salaries (Fiscal Year 2014-15)
Level
Expenditures Per Pupil Average Teacher Salary Total
Supplemental/ Restricted
Basic/ Unrestricted
School Site------- $4546.9 $354.9 $4192.0 $72206.1
District------- N/A N/A $4295.0 $73,023
Percent Difference: School Site and District N/A N/A
State------- N/A N/A $5,677 $75,137
Percent Difference: School Site and State N/A N/A Note: Cells with N/A values do not require data.
Types of Services Funded (Fiscal Year 2015-16)
Individual school sites offer Supplemental Instruction (SI) to students who are below grade level. It is up to each individual school sit e to identify the students who need extra support based upon district benchmarks or teacher recommendations. Each school site selects certificated and classified staff to teach these SI classes, usually after school (1 – 3 days a week). Each school also identifies the curriculum that will be used. The majority of the school sites select computer- based programs w here students can work independently at their current academic level. Some schools provide this time to receive help on their homework. Schools that are identified as Program Improvement Year 2 schools offer Supplemental Education Services (SES). Students in the 3rd – 8th grade are identified at the district level based on their SBAC and benchmark tests. Letters are sent out to students who qualify for the program. The district contracts out through SES providers to offer the extra tutoring assistance.

2015-16 School Accountability Report Card for Ruskin Elementary School Page 12 of 12
Teacher and Administrative Salaries (Fiscal Year 2014-15)
Category District Amount State Average for Districts In Same Category
Beginning Teacher Salary $51,000 $44,573
Mid-Range Teacher Salary $74,677 $72,868
Highest Teacher Salary $94,735 $92,972
Average Principal Salary (Elementary) $133,919 $116,229
Average Principal Salary (Middle) $137,651 $119,596
Average Principal Salary (High) $121,883
Superintendent Salary $206,785 $201,784
Percent of Budget for Teacher Salaries 40% 39%
Percent of Budget for Administrative Salaries 7% 5% For detailed information on salaries, see the CDE Certificated Salaries & Benefits Web page at http://www.cde.ca.gov/ds/fd/cs/. Professional Development (Most Recent Three Years)
Professional Development this school year occurred on many different levels – before school started (Summer of 2016) and ongoing throughout the 2016 – 2017 school year. The district office working with our site principals worked on the scope/sequence of the professional development sessions. The work was also based on student data produced from benchmark tests, CELDT, and SBAC data, as well as teacher feedback. At the beginning of the school year, all certificated staff participated in two days of professional development aligned with the subjects they teach. K-2 teachers received training on the Benchmark Assessment System and the Heinemann Writing Units of Study. Grade 3-5 teachers received training on the Heinemann Writing Units of study. Special Education staff and middle school teachers received specialized training related to new curriculum and teachers needs in the area of their specialty. During the school year teachers were provided with additional release days to receive training on newly adopted ELA materials (up to 3 times during the year). Each release day provided collaborative planning time during which teachers prepared to teach a writing unit. Middle School science teachers were released three times during the school year to develop the integrated approach to teaching science in 6th and 7th grade. They also received training on 3 programs that were piloted in order to provide NGSS align materials. 3 Curriculum Leadership Teams were released 3-5 days during the school year to receive professional development, created resources such as curriculum maps and benchmarks, and prepare site professional development in math, science, and ELA/ELD. Throughout the school year, we offered monthly professional development sessions in which all the teachers participated (1.5 hours on early release Thursday afternoons). The topics were chosen by principals and district office administrators. The focus was on building teachers’ capacity for shared leadership to improve teaching and learning in math, NGSS, Technology and ELA/ELD. Teacher leaders from each site provided the professional development which was developed collaboratively with Curriculum and Instruction staff and focused on understanding the new California frameworks. The Sobrato Early Academic Language (SEAL) program was implemented at six of our ten elementary schools in grades TK-3. The schools included Cherrywood, Laneview, and Summerdale where TK-3 teachers were trained; and Brooktree, Toyon, and Vinci Park, where kindergarten and first grade teachers were trained. Teachers received initial training in August 2016. They also received 3 2-day Professional Development sessions throughout the school year. Each grade level also received planning time after each 2-day PD session. The PD sessions were delivered by a contract through SEAL. Our three SEAL coaches provided the follow up planning PD sessions. Teachers were released from their classrooms for all of these PD days.


![T-76.115 Project Review RoadRunners [IM1] Iteration 02.12.2003.](https://static.fdocuments.in/doc/165x107/56649f3e5503460f94c5e794/t-76115-project-review-roadrunners-im1-iteration-02122003.jpg)


![T-76.115 Project Review RoadRunners [IM3] Iteration 18.03.2004.](https://static.fdocuments.in/doc/165x107/5697bfb71a28abf838c9ea51/t-76115-project-review-roadrunners-im3-iteration-18032004.jpg)

![T-76.115 Project Review RoadRunners [PP] Iteration 30.10.2003.](https://static.fdocuments.in/doc/165x107/56649e435503460f94b36dc0/t-76115-project-review-roadrunners-pp-iteration-30102003.jpg)