Rus Telecoms Report 2012 Otkritiye
26
Important disclosures are found at the Disclosures Appendix. This investment research is produced by Otkritie S ecurities Ltd, authorised and regulated by the Financial Services Authority (FSA), and has been prepared by non-US research analysts who are not FINRA registered/qual ified as research analysts. UPDATE Russian Telecoms 2012 Expecting recovery Sector ratings Company Rating TP upside/ downside MTS BUY $22.8 36% VimpelCom BUY $14 33% Rostelecom SELL RUB117 -21% Sistema BUY $33.9 74% Sources: Bloomberg, Otkritie Capital estimates Telecoms 2011 performance -40% -30% -20% -10% 0% Rostelecom RTS Index MTS Sistema VimpelCom Sources: Otkritie Capital estimates Telecoms YtD performance 0% 5% 10% 15% 20% Sistema MTS RTS Index VimpelCom Rostelecom Sources: Otkritie Capital estimates We expect the Russian telecom sector to rebound in 2012. This follows in the wake of its underperformance of all major indices in 2011, mainly due to margins erosion and questionable M&A activity. This year we are very positive on mobile telecoms (MTS and VimpelCom), where we expect margins to start recovering, and we still dislike Rostelecom, which should continue facing sluggish top-line growth. MTS is our top pick among Russian telecoms, which also benefits Sistema, a direct exposure to MTS. Sistema core assets growth is also expected to be combined with further value accretive acquisitions of assets in agriculture and petrochemic als. Data services to drive top-line growth. We expect Russia‘s telecom sector to benefit from data services growth in 2012. We believe that a significant portion of the investment that is considered prerequisite to capture this growth has already been made, hence going forward the operators will need to invest less in the development of 3G data networks. Margins turnaround for mobile operators. We expect a reversal of the negative trends of declining EBITDA margins among the Russian mobile operators. Margin growth should be fuelled by an increasing share of data revenue, completion of the rollout of monobrand retail networks, and a focus on a strategy of increasing ARPU from existing customers rather than acquiring new ones. Dividend stories to remain the same. Mobile operators remain high dividend payers. We expect MTS and VimpelCom to pay out dividend yield s of 6% and 8% in 2012, respectively, while Rostelecom is expected to spend most of its operating cash flow on capex and M&A. We anticipate Rostelecom‘s dividend yield at 1.8%. Sistema‘s dividend yield is expected to be limited by extensive M&A activity, we project only 1% dividend yield for the company. MTS is our top pick amongst Russian telecoms, while Rostelecom is our least preferred stock in the sector. We continue to prefer MTS thanks to its high dividend yield, low leverage, and clear growth story. Sistema should also benefit as a direct exposure to MTS. We still like VimpelCom, but the stock has high leverage, lacks short-term positive triggers, and consists of too many moving parts that could limit its short-term upside. Rostelecom‘s major revenue source is fixed-line voice, which is projected to decrease at 2% CAGR in the next 5 years. The acquisition of Skylink provides the necessary 3G licenses for development of mobile business, though we think the major risks lie in its execution strategy. The ‗new‘ Rostelecom was recently combined from 9 separate companies and we think that in 2012 its management will struggle to effect significant changes within the company. Figure 1. Valuation table P/E EV/EBITDA EV/Sales Name 2011E 2012E 2013E 2011E 2012E 2013E 2011E 2012E 2013E MTS 11.0 8.9 7.5 4.6 4.3 3.8 1.9 1.7 1.6 VimpelCom 7.7 6.4 5.8 4.3 3.7 3.4 1.7 1.5 1.3 Rostelecom 11.8 11.7 10.9 5.1 4.5 4.6 2.0 1.8 1.7 Sistema 9.3 17.9 13.2 1.9 1.9 1.5 0.3 0.3 0.2 Sources: Bloomberg, Otkritie Capital estimates EQUITY | Russia Telecom 1 February 2011 Research analysts Alexander Vengranovich [email protected]+ 7 (495) 2131830
-
Upload
victor-funkin -
Category
Documents
-
view
220 -
download
0
Transcript of Rus Telecoms Report 2012 Otkritiye

8/3/2019 Rus Telecoms Report 2012 Otkritiye
http://slidepdf.com/reader/full/rus-telecoms-report-2012-otkritiye 1/26
Important disclosures are found at the Disclosures Appendix.This investment research is produced by Otkritie Securities Ltd, authorised and regulated by the Financial Services Authority (FSA),
and has been prepared by non-US research analysts who are not FINRA registered/qualified as research analysts.
UPDATE
Russian Telecoms 2012Expecting recovery
Sector ratings
Company Rating TPupside/
downside
MTS BUY $22.8 36%
VimpelCom BUY $14 33%
Rostelecom SELL RUB117 -21%
Sistema BUY $33.9 74%
Sources: Bloomberg, Otkritie Capital estimates
Telecoms 2011 performance
-40% -30% -20% -10% 0%
Rostelecom
RTS Index
MTS
Sistema
VimpelCom
Sources: Otkritie Capital estimates
Telecoms YtD performance
0% 5% 10% 15% 20%
Sistema
MTS
RTS Index
VimpelCom
Rostelecom
Sources: Otkritie Capital estimates
We expect the Russian telecom sector to rebound in 2012. Thisfollows in the wake of its underperformance of all major indicesin 2011, mainly due to margins erosion and questionable M&Aactivity. This year we are very positive on mobile telecoms (MTSand VimpelCom), where we expect margins to start recovering,and we still dislike Rostelecom, which should continue facingsluggish top-line growth. MTS is our top pick among Russian
telecoms, which also benefits Sistema, a direct exposure toMTS. Sistema core assets growth is also expected to becombined with further value accretive acquisitions of assets inagriculture and petrochemicals.
Data services to drive top-line growth. We expect Russia‘s telecom sector tobenefit from data services growth in 2012. We believe that a significant portion ofthe investment that is considered prerequisite to capture this growth has alreadybeen made, hence going forward the operators will need to invest less in thedevelopment of 3G data networks.
Margins turnaround for mobile operators. We expect a reversal of thenegative trends of declining EBITDA margins among the Russian mobileoperators. Margin growth should be fuelled by an increasing share of datarevenue, completion of the rollout of monobrand retail networks, and a focus on
a strategy of increasing ARPU from existing customers rather than acquiring newones.
Dividend stories to remain the same. Mobile operators remain high dividendpayers. We expect MTS and VimpelCom to pay out dividend yields of 6% and8% in 2012, respectively, while Rostelecom is expected to spend most of itsoperating cash flow on capex and M&A. We anticipate Rostelecom‘s dividendyield at 1.8%. Sistema‘s dividend yield is expected to be limited by extensiveM&A activity, we project only 1% dividend yield for the company.
MTS is our top pick amongst Russian telecoms, while Rostelecom is ourleast preferred stock in the sector. We continue to prefer MTS thanks to itshigh dividend yield, low leverage, and clear growth story. Sistema should alsobenefit as a direct exposure to MTS. We still like VimpelCom, but the stock hashigh leverage, lacks short-term positive triggers, and consists of too manymoving parts that could limit its short-term upside. Rostelecom ‘s major revenuesource is fixed-line voice, which is projected to decrease at 2% CAGR in the next5 years. The acquisition of Skylink provides the necessary 3G licenses fordevelopment of mobile business, though we think the major risks lie in itsexecution strategy. The ‗new‘ Rostelecom was recently combined from 9separate companies and we think that in 2012 its management will struggle toeffect significant changes within the company.
Figure 1. Valuation table
P/E EV/EBITDA EV/Sales
Name 2011E 2012E 2013E 2011E 2012E 2013E 2011E 2012E 2013E
MTS 11.0 8.9 7.5 4.6 4.3 3.8 1.9 1.7 1.6
VimpelCom 7.7 6.4 5.8 4.3 3.7 3.4 1.7 1.5 1.3
Rostelecom 11.8 11.7 10.9 5.1 4.5 4.6 2.0 1.8 1.7
Sistema 9.3 17.9 13.2 1.9 1.9 1.5 0.3 0.3 0.2
Sources: Bloomberg, Otkritie Capital estimates
EQUITY | Russia
Telecom
1 February 2011
Research analysts
Alexander [email protected]+7 (495) 2131830

8/3/2019 Rus Telecoms Report 2012 Otkritiye
http://slidepdf.com/reader/full/rus-telecoms-report-2012-otkritiye 2/26
Russian telecoms 2012 | UPDATE | Russia | 1 February 2011
Otkritie Capital 2
Table of Contents
Russian Telecoms peer comparison .......................................................... 3
Russian telecom market update ................................................................. 4 Mobile communications .................................................................................. 4 Broadband Internet ......................................................................................... 6 Capex ............................................................................................................. 8 Retail chains ................................................................................................... 9
MTS .............................................................................................................. 11 Valuation ....................................................................................................... 12 Appendix: Financial forecasts ....................................................................... 13
Sistema ........................................................................................................ 14 Valuation ....................................................................................................... 15
Appendix: Financial forecasts ....................................................................... 17
Rostelecom ................................................................................................. 18 Valuation ....................................................................................................... 19 Appendix: Financial forecasts ....................................................................... 20
VimpelCom .................................................................................................. 21 Valuation ....................................................................................................... 22 Appendix: Financial forecasts ....................................................................... 23
Disclosures appendix ................................................................................ 24

8/3/2019 Rus Telecoms Report 2012 Otkritiye
http://slidepdf.com/reader/full/rus-telecoms-report-2012-otkritiye 3/26
Russian telecoms 2012 | UPDATE | Russia | 1 February 2011
Otkritie Capital 3
Russian Telecomspeer comparison
Figure 2. Peers valuation
P/E EV/EBITDA EV/Sales
Ticker Name 2011E 2012E 2013E 2011E 2012E 2013E 2011E 2012E 2013E
Eastern Europe peers 14.9 15.9 14.2 4.9 5.3 5.1 1.9 1.9 2.0
SPTT CP Equity TELEFONICA CZECH REPUBLIC AS 15.1 14.8 14.7 5.7 6.3 5.9 2.3 2.4 2.4
MTEL HB Equity MAGYAR TELEKOM TELECOMMUNICA 13.4 11.9 9.7 4.4 4.4 4.3 1.5 1.5 1.6
TPS PW Equity TELEKOMUNIKACJA POLSKA SA 16.3 20.9 18.3 4.6 5.2 5.2 1.8 1.9 1.9
South East Asia 29.3 19.1 14.5 7.0 6.6 6.2 2.5 2.3 2.2
941 hk Equity CHINA MOBILE 12.7 12.4 11.9 5.4 5.2 5.0 2.6 2.4 2.3
762 HK Equity CHINA UNICOM HONG KONG 62.1 32.8 20.5 6.2 5.4 4.6 2.0 1.7 1.5
ST SP Equity SINGAPORE TELECOM 13.0 12.0 11.0 9.4 9.2 9.2 2.9 2.9 2.8
AXIATA MK Equity AXIATA GROUP BERHAD 14.9 13.4 12.2 6.1 5.8 5.5 2.8 2.6 2.4
BHARTI IN Equity BHARTI AIRTEL 21.4 14.9 11.5 8.4 6.9 6.0 2.9 2.6 2.3
RCOM IN Equity RELIANCE COMMUNICATIONS 15.3 10.4 8.0 6.8 6.1 5.6 2.2 2.0 1.9
South Africa 11.9 10.5 9.6 4.7 4.4 4.1 1.7 1.6 1.5
TKG SJ Equity TELKOM 10.0 8.8 7.6 2.6 2.5 2.4 0.7 0.7 0.7MTN SJ Equity MTN GROUP 12.0 10.5 9.6 4.6 4.2 4.0 2.1 1.8 1.7
VOD SJ Equity VODACOM GROUP 13.7 12.4 11.5 6.9 6.4 6.0 2.4 2.2 2.1
Middle East 9.8 8.2 8.1 4.3 4.3 4.2 1.4 1.4 1.3
CEL IT Equity CELLCOM ISRAEL 5.9 7.1 7.4 3.0 3.2 3.3 1.0 1.0 1.0
PTNR IT Equity PARTNER COMMUNICATIONS 5.8 6.4 6.6 3.7 4.1 4.0 1.1 1.2 1.2
Tcell ti Equity TURKCELL ILETISIM HIZMET 17.6 11.0 10.3 6.2 5.6 5.3 2.0 1.8 1.7
orte ey Equity ORASCOM TELECOM HOLDING 7.0 8.0 6.5 4.2 4.2 4.1 1.9 1.9 1.8
ETISALAT UH Equity EMIRATES TELECOM CORPORATION 10.7 10.1 9.3 4.3 4.1 3.9 2.1 2.0 1.9
TTKOM TI Equity TURK TELEKOMUNIKASYON 13.2 10.2 9.8 6.1 5.9 5.6 2.6 2.5 2.4
QTEL QD Equity QATAR TELECOM 9.6 8.8 8.4 3.3 3.2 3.1 1.6 1.5 1.4
EM peers 15.2 12.5 10.8 5.4 5.1 4.9 2.0 1.9 1.8
TEF SM Equity Telefonica 9.7 8.6 8.3 5.4 5.0 4.9 1.8 1.8 1.8
Tel2b ss Equity TELE 2 12.1 10.7 9.5 5.6 5.0 4.6 1.5 1.4 1.4
DTE GR Equity DEUTSCHE TELEKOM 11.3 12.4 11.5 4.3 4.5 4.5 1.4 1.4 1.4
FTE FP Equity FRANCE TELECOM 7.3 7.7 7.9 4.1 4.3 4.4 1.4 1.4 1.4
BT/A LN Equity BT 9.1 8.5 8.1 4.2 4.1 4.1 1.3 1.3 1.3
VOD LN equity VODAFONE 10.8 10.4 10.0 8.0 8.1 7.9 2.5 2.5 2.5
TIT IM Equity TELECOM ITALIA 5.9 6.0 5.9 3.9 3.9 3.9 1.6 1.6 1.6
TEL NO Equity TELENOR 13.6 11.3 9.4 5.8 5.3 4.9 1.8 1.7 1.6
BELG BB Equity BELGACOM 10.5 11.1 11.4 5.0 5.1 5.2 1.5 1.5 1.5
PTC PL Equity PORTUGAL TELECOM 7.3 7.1 6.5 2.4 2.2 2.2 0.9 0.8 0.8
T US Equity AT&T 12.4 11.7 11.3 5.5 5.3 5.2 1.8 1.8 1.8
VZ US Equity VERIZON COMMUNICATIONS 15.0 13.4 12.1 4.0 3.7 3.6 1.3 1.3 1.2
DM peers 10.4 9.9 9.3 4.8 4.7 4.6 1.6 1.5 1.5
Sources: Otkritie Capital estimates, Bloomberg
Figure 3. Russian Telecoms valuation comparison
P/E EV/EBITDA EV/Sales
Name 2011E 2012E 2013E 2011E 2012E 2013E 2011E 2012E 2013E
MBT US Equity MTS
Current multiples 11.0 8.9 7.5 4.6 4.3 3.8 1.9 1.7 1.6
vs EM Peers -28% -29% -31% -14% -17% -21% -8% -9% -15%
vs DM Peers 6% -10% -20% -5% -9% -17% 19% 14% 4%
vs VimpelCom 43% 38% 30% 7% 15% 14% 9% 18% 18%
vs Rostelecom -6% -24% -31% -9% -6% -17% -7% -2% -7%
VIP US Equity VimpelCom
Current multiples 7.7 6.4 5.8 4.3 3.7 3.4 1.7 1.5 1.3
vs EM Peers -50% -48% -47% -20% -27% -31% -16% -23% -28%
vs DM Peers -26% -35% -38% -11% -21% -27% 9% -4% -12%
vs MTS -30% -28% -23% -6% -13% -12% -8% -16% -16%
vs Rostelecom -35% -45% -47% -15% -18% -27% -14% -17% -22%
RTKM rx equity Rostelecom
Current multiples 11.8 11.7 10.9 5.1 4.5 4.6 2.0 1.8 1.7
vs EM Peers -23% -6% 1% -6% -12% -5% -1% -7% -8%
vs DM Peers 13% 18% 17% 5% -4% 0% 28% 16% 12%
vs MTS 6% 32% 46% 10% 6% 20% 7% 2% 8%
vs VimpelCom 53% 82% 89% 18% 21% 37% 17% 21% 28%
Sources: Otkritie Capital estimates, Bloomberg

8/3/2019 Rus Telecoms Report 2012 Otkritiye
http://slidepdf.com/reader/full/rus-telecoms-report-2012-otkritiye 4/26
Russian telecoms 2012 | UPDATE | Russia | 1 February 2011
Otkritie Capital 4
Russian telecom marketupdate
Mobile communicationsCompetition to diminish further. Both MTS and VimpelCom have moved theirfocus away from the acquisition of new subscribers, while Megafon continues toconcentrate on bolstering its leadership in the acquisition of new subscribers forthe past 4 months. We expect the competition to diminish further in 2012,especially since in 3Q11 both VimpelCom and MTS began to focus onincreasing ARPUs from existing subscribers.
Figure 4. Russia mobile subscribers, mn Figure 5. Russia mobile subscribers QoQdynamics, %
50
55
60
65
70
75
1Q10 2Q10 3Q10 4Q10 1Q11 2Q11 3Q11 Nov-11
MTS VimpelCom MegaFon
-4%
-2%
0%
2%
4%
6%
8%
10%
1Q10 2Q10 3Q10 4Q10 1Q11 2Q11 3Q11 Nov-11
MTS VimpelCom MegaFon
Sources: AC&M Sources: AC&M
EBITDA margins for mobile operators to see slow recovery in 2012.Competition had a negative effect on EBITDA margins in 2011, and itsdeceleration in terms of the rational behaviour of market players shouldpositively affect the EBITDA margins of mobile operators in 2012. The initialimpact was already seen in the 3Q11 financials of MTS.
Figure 6. Russia mobile EBITDA margin quarterlydynamics
Figure 7. Russia mobile EBITDA margin annualforecast
30%
35%
40%
45%
50%
55%
1Q10 2Q10 3Q10 4Q10 1Q11 2Q11 3Q11
MTS VimpelCom Megafon
40%
42%
44%
46%
48%
50%
52%
54%
2008 2009 2010 2011E 2012E
MTS VimpelCom Megafon
Sources: Otkritie Capital estimates Sources: Otkritie Capital estimates

8/3/2019 Rus Telecoms Report 2012 Otkritiye
http://slidepdf.com/reader/full/rus-telecoms-report-2012-otkritiye 5/26
Russian telecoms 2012 | UPDATE | Russia | 1 February 2011
Otkritie Capital 5
We believe that the increase in EBITDA margins will come from 2 factors:
1. Selling expenses. As the EBITDA margin is substantially driven by theoperator activity designed to acquire new subscribers, we expect that thetrend of shifting focus away from the acquisition of new subscribers shouldpositively impact EBITDA margins. Moreover, during 2011 mobileoperators moved to deferred dealer compensation schemes as another
way to decrease marketing expenses (based on the principle of revenue-sharing). This implies no upfront payment for the acquisition ofsubscribers. In addition, in order to decrease subscriber acquisition coststhe operators developed their own retail networks in 2011.
2. Value-added services (VAS) share in revenues. The share of VAS inmobile revenues is the major driver of improving profitability for mobileoperators. Value-added services have EBITDA margins in the 70-80%range, so the operators are focusing on increasing its share in revenues.
Data usage growth is the primary driver of the VAS share increase. The marketgrew 50% YoY in 2011, though we think that growth will decelerate to singledigits in 2012 according to MTS management guidance. Meanwhile, messagingrevenue is sliding on the back of user migration to Internet messengers such as
Skype, ICQ, and Mail Agent. We expect this trend to continue, but do not thinkthis will lead to substantial decrease in messaging revenues and will becompensated by accelerated growth in other VAS. Content revenue is alsofalling due to the improved popularity of mobile internet, which is a cheaperoption for customers vis-a-vis other multimedia content.
Figure 8. Russia VAS revenues by segment, RUBmn
0
5,000
10,000
15,000
20,000
25,000
1Q10 2Q10 3Q10 4Q10 1Q11 2Q11 3Q11Messaging Content Data Other
Sources: AC&M, Otkritie Capital estimates
VAS revenue is highly dependent upon the capacity of the 3G network. Megafon, which invested heavily in 3G rollout in 2010, is the leader in terms ofVAS share. In 2011 Megafon continued to be the leader in the number of 3Gbase stations in Russia, while MTS made substantial progress in 2011 by nearlyquadrupling the number of its base stations in operation. VimpelCom is growingslower in this respect, which is confirmed by the lower proportion of VAS sharein revenues. We expect that this year Big3 operators will reduce their activity inexpansion of 3G networks, the additions of new base stations will be morefocused on big cities, where most high-ARPU clients are located.

8/3/2019 Rus Telecoms Report 2012 Otkritiye
http://slidepdf.com/reader/full/rus-telecoms-report-2012-otkritiye 6/26
Russian telecoms 2012 | UPDATE | Russia | 1 February 2011
Otkritie Capital 6
Figure 9. VAS share in mobile revenues, % Figure 10. 3G base stations in Russia
0%
5%
10%
15%
20%
25%
30%
35%
1Q10 2Q10 3Q10 4Q10 1Q11 2Q11 3Q11
MTS Vimpelcom Megafon
0
5,000
10,000
15,000
20,000
25,000
30,000
MTS VimpelCom Megafon
2010 2011E
Sources: Otkritie Capital estimates, AC&M, Company data Sources: Otkritie Capital estimates, Company data
Broadband InternetThe number of broadband Internet users in Russia has increased 13%YtDin June 2011 and 51% since the beginning of 2010. The growth came mostlyfrom regions other than Moscow and St. Petersburg, where marketing activitiesand increased spending on building fiber lines attracted stimulated a shift awayfrom dial-up internet usage to broadband connections.
Figure 11. Russia Broadband users monthly dynamics, mnhouseholds
0
2
4
6
8
10
12
14
16
18
20
Russia Moscow St Petersburg
Sources: Otkritie Capital estimates, AC&M
Competition on the broadband market across almost Russia’s major citiesis becoming ever more severe as internet penetration increases. Althoughthere are still areas within Russia with unsaturated demand, the big playersfocus on the cities with populations exceeding 100,000, which is moreeconomically efficient. The competition in big cities is already tough, whichmakes it difficult to grow market share without acquiring local competitors.
The Russian broadband market is still dominated by Rostelecom, which hasmore than 7mn households using its services. While MTS and VimpelCom aremuch smaller, they are rapidly growing their subscriber bases via M&A activityand greenfield projects. There is still a large share of independent providers on
the market, the biggest of which is ER-Telecom, which operates in 42 cities inCentral, Northwest, Urals, South, and Siberia regions.
MTS has the biggest share of the lucrative Moscow market with over 900,000households subscribed, although VimpelCom and Akado have both been

8/3/2019 Rus Telecoms Report 2012 Otkritiye
http://slidepdf.com/reader/full/rus-telecoms-report-2012-otkritiye 7/26
Russian telecoms 2012 | UPDATE | Russia | 1 February 2011
Otkritie Capital 7
present on the market for a long time and have solid portions of it. By contrast,Rostelecom and Megafon entered the market Moscow only in 2011 viaacquisitions of NTK and NetbyNet, respectively.
The share of local players on St. Petersburg market is almost 44%. The marketis dominated by Rostelecom —VimpelCom and Megafon have only limitedmarket shares while Megafon has presence at all.
Figure 12. Russia broadbandmarket breakdown by users,1H11
Figure 13. Moscow broadbandmarket breakdown by users,1H11
Figure 14. St. Petersburgbroadband market breakdownby users, 1H11
Rostelecom41%
MTS11%
VimpelCom
9%
ER-Telecom
9%
AKADO4%
Other26%
MTS28%
VimpelCom20%
AKADO20%
Megafon11%
Rostelecom7%
Other14%
Rostelecom
45%
InterZet17%
P&NTelecom
12%
VimpelCom9%
Skynet7%
MTS2%
Other8%
Sources: Otkritie Capital estimates, AC&M Sources: Otkritie Capital estimates, AC&M Sources: Otkritie Capital estimates, AC&M
We expect M&A activity to remain the main theme for the broadbandinternet access market in Russia in 2012. We expect Rostelecom‘s marketshare to decline over the time since most of the Rostelecom lines are copperlines — such lines enable users to have only a limited-speed Internet access.Meanwhile, MTS, VimpelCom, Megafon, and often local providers offer opticfiber lines, which are able to ensure higher speeds. As a measure to stem themigration in that direction Rostelecom needs to acquire local providers in theregions or build new fiber lines. According to the new Rostelecom strategy, thecompany considers M&A as a preferred path to increase market share in the big
cities. But as the Big-3 operators are also highly engaged in competition forregional players, this has effectively increased valuations for the targetcompanies, a process that we already observed in 2011.
Figure 15. Selected deals on the Russian broadband market, 2011
Byuer Target Stake price Valuation multiple Subscribers Region Date
Rostelecom NTK 71.8% $1,325mn 8.7x 2010 EV/EBITDA 215,000 broadband. 3.2mn Pay-TV Moscow Feb-11
Megafon NetByNet 100% $270mn 6.8x 2010 EV/EBITDA 245,000 Moscow Jun-11
MTS Altair 100% $23mn 9.3x 2010 EV/EBITDA 20,000 Tula Aug-11
MTS TVT 100% $162.9mn 10.5x 2010 EV/EBITDA 600,000 broadband, 500,000 Pay-TV Tatarstan Oct-11
Sources: Otkritie Capital estimates, Company data
Some potential deals were already discussed in the media. Kommersantreported in October 2011 that CNT, which has approximately 200,000broadband subscribers in Moscow (6% share) and operates under the Qwertybrand, could be acquired by Rostelecom. CNT is 51% owned by Svyazinvest.The media has also reported that Rostelecom is in negotiations to acquireGorcom, another Moscow broadband provider. According to AC&M consulting,Gorcom has 78,000 subscribers and 2% of Moscow‘s broadband market. 100%of the company is owned by Oleg Zaporozhec. If Rostelecom manages to closethese 2 deals its share of the Moscow market could reach 15%. Considering theprice per subscriber paid by Megafon for the same size business of NetbyNet,together Qwerty and Gorcom could be valued at around $300mn.
Megafon‘s attempt to acquire Akado (20% of the Moscow market, 686,000subscribers) continues. The shareholders of both companies are still in theprocess of negotiating a final deal parameters. Meanwhile, FAS has approved arequest by MTS to acquire 100% of Skynet (7% market share in St. Petersburg,75,000 subscribers).

8/3/2019 Rus Telecoms Report 2012 Otkritiye
http://slidepdf.com/reader/full/rus-telecoms-report-2012-otkritiye 8/26
Russian telecoms 2012 | UPDATE | Russia | 1 February 2011
Otkritie Capital 8
CapexWe expect a gradual decrease in the capex/revenue ratio for mobileoperators in 2012. We use the ratio of capex to revenue in order to comparecapex efficiency and the activity of operators. After high spending on 3G basestations for mobile operators in 4Q10, we observed more balanced capex
during 9M11, as the bulk of the increase in the number of 3G base stations isover, we expect a gradual decrease in the capex/revenue ratio for operators in2012.
Both MTS and VimpelCom guide for a gradual decrease in the capex/revenueratio in 2012. VimpelCom targets for that ratio to drop to 15% by 2014.
Megafon expects some slowdown of the capex/revenue ratio in 2012, fromalready the highest level of more than 30% in 2011. Megafon‘s Board ofDirectors has approved RUB64bn of spending in 2012, which represents 27%of its RUB237bn 2012 revenue guidance.
For Rostelecom we expect a substantial increase in capex in 2012 on the backof its newly-acquired elections broadcasting project (to be finished by March2012). We4 estimated this project to bear an equipment cost of around
RUB20bn (a figure that comprises 6% of Rostelecom 2012E revenue).
Figure 16. Capex/revenue quarterly dynamics, % Figure 17. Capex/revenue annual dynamics, %
0%
10%
20%
30%
40%
50%
60%
70%
1Q10 2Q10 3Q10 4Q10 1Q11 2Q11 3Q11 4Q11E
MTS VimpelCom Megafon Rostelecom
0%
5%
10%
15%
20%
25%
30%
35%
2008 2009 2010 2011E 2012E
MTS VimpelCom Megafon Rostelecom
Sources: Otkritie Capital estimates Sources: Otkritie Capital estimates
We do not incorporate 4G network rollout expenditures in our models dueto the lack of clarity regarding the timing and cost of the 4G licenses. Weexpect that auctions for 4G frequencies could be delayed beyond the initially settime horizon of 1Q12. As the March 2012 presidential elections approach, theprobability of a delay rises owing to uncertainty surrounding the identity of apossible new Minister of Telecommunications in the event that Igor Schegolev
is replaced in the new Cabinet. The current state position assumes that as a result of the auctions theBig-4 operators should obtain equal parts of the spectrum suitable for 4Grollout in Russia. This is based on a September 2011 decision of the StateComission on Wireless Frequences to distribute 4 equal parts of the spectrum.The Commission fixed the range of 791-862MHz, 2.5-2.7GHz and 2.3-2.4GHzas available for 4G rollout. According to the Commission‘s resolution the first 4parts of 791-862MHz frequency range will be distributed at the 1
ststage of the
auction, while in the future the winners of the 1st
stage will get frequencies in2.5-2.7GHz range for free. The main difficulty is that the range of frequenciesdesignated for the auctions is currently occupied by the Ministry of Defense,which requires additional conversion costs to be incurred by the winners. Thecost estimates of the conversion of the full range of the spectrum vary from$2bn to $3bn.

8/3/2019 Rus Telecoms Report 2012 Otkritiye
http://slidepdf.com/reader/full/rus-telecoms-report-2012-otkritiye 9/26
Russian telecoms 2012 | UPDATE | Russia | 1 February 2011
Otkritie Capital 9
Rostelecom could benefit if the auctions are delayed. Before the auctionsare held, some operators could already start providing 4G services since theyalready have the necessary licenses. Skartel (Yota brand) has a part of the 2.5-2.7GHz range, while Osnova Telecom and Rostelecom have the right to build a4G network based on 2.3-2.4GHz frequencies (Rostelecom has licenses for 39regions).
Another option to avoid total frequency conversion is the introduction oftechnological neutrality which could bolster faster 4G rollout and enableoperators to create network unions. Technological neutrality is the ability to useany frequencies that are suitable for the provision of telecom services. This isthe chief prerequisite for joint use of base stations by operators, as it wouldallow a base station to operate using different frequencies simultaneously.Technological neutrality is mainly supported by Tele2 and regional players,since it would enable them to build 4G networks on existing frequencies. Untilnow, the Ministry of Telecommunications has been reluctant to consider anyproposals in this respect.
Retail chains
In 2011 mobile operators took a big step forward in rolling out brandedretail chains. Owning a retail chain is another way to increase margins, as thisdecreases dealer and payment commissions and allows better access toclients, which helps to hasten the impact of marketing initiatives.
MTS has the biggest operational retail chain, which comprises more than 2,200stores. Theoretically Rostelecom has the biggest chain (3,000 stores), but manyare old-fashioned and inefficient (only selling 2-3 mobile phones a month insome stores). The fact that the stores are not separated from the core businessmakes it almost impossible for management to track their performance. Onlyonce they are transformed into a special subsidiary is it clear which negativeeffect on the financials they may have.
Figure 18. Russia mobile retail networks, # of stores
0
1,000
2,000
3,000
4,000
5,000
6,000
Euroset MTS Megafon Rostelecom VimpelCom Svyaznoy
Own Franchise
Sources: Otkritie Capital estimates, company data, Kommersant
The higher number of monobrand stores leads to a higher proportion of MTSsales generated through its own network.

8/3/2019 Rus Telecoms Report 2012 Otkritiye
http://slidepdf.com/reader/full/rus-telecoms-report-2012-otkritiye 10/26
Russian telecoms 2012 | UPDATE | Russia | 1 February 2011
Otkritie Capital 10
Figure 19. New revenue generation breakdown by type of distributionchannel
50%
30%
20%
32%
30%38%
0%
20%
40%
60%
80%
100%
120%
MTS VimpelCom
Own network National dealers Regional dealers & street retail
Sources: Otkritie Capital estimates, company data
We expect to see some increase for MTS and VimpelCom in terms of thenumber of monobrand stores in 2012. These operators will focus more onimproving existing networks, which we think should have a minor positive effecton their financials. Rostelecom is expected to modernize its retail network,which could mean some additional SG&A expenses that are currently notincluded in our model.
8/3/2019 Rus Telecoms Report 2012 Otkritiye
http://slidepdf.com/reader/full/rus-telecoms-report-2012-otkritiye 11/26
Otkritie Capital 11
UPDATE
MTSTop pick among Russian telecoms
BUYTicker MBT US
Target price, $ 22.8
Last price of ADRs, $ 16.7
Upside 36%
Number of ADRs, mn 1,008.5
Market cap, $mn 16,882
Net debt, $mn 6,360EV, $mn 23,243
Free float 47%
52-week min, $ 11.9
52-week max, $ 21.5
Sources: Bloomberg, Otkritie Capital estimates
Share price performance
60
70
80
90
100
110
120
J a n - 1 1
F e b - 1 1
M a r - 1 1
A p r - 1 1
M a y - 1 1
J u n - 1 1
J u l - 1 1
A u g - 1 1
S e p - 1 1
O c t - 1 1
N o v - 1 1
D e c - 1 1
MT S (Rebased) R TS (R ebased )
Sources: Bloomberg
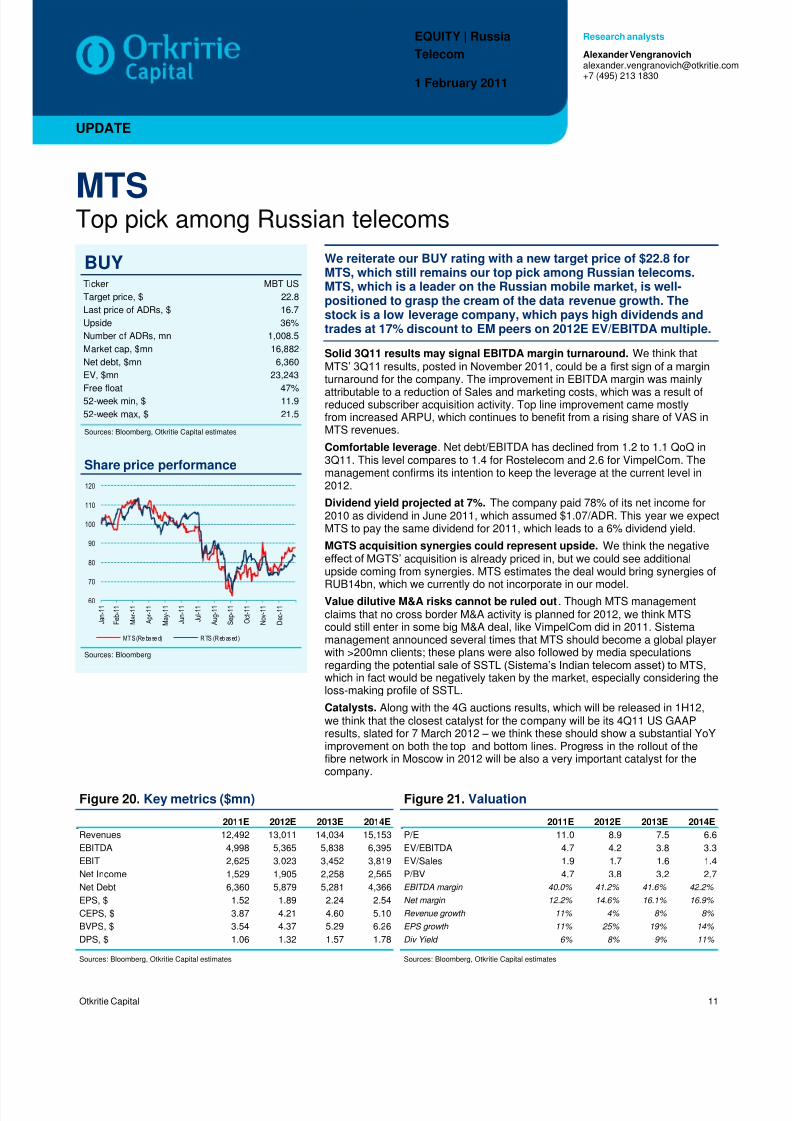
We reiterate our BUY rating with a new target price of $22.8 forMTS, which still remains our top pick among Russian telecoms.MTS, which is a leader on the Russian mobile market, is well-positioned to grasp the cream of the data revenue growth. Thestock is a low leverage company, which pays high dividends andtrades at 17% discount to EM peers on 2012E EV/EBITDA multiple.
Solid 3Q11 results may signal EBITDA margin turnaround. We think that
MTS‘ 3Q11 results, posted in November 2011, could be a first sign of a marginturnaround for the company. The improvement in EBITDA margin was mainlyattributable to a reduction of Sales and marketing costs, which was a result ofreduced subscriber acquisition activity. Top line improvement came mostlyfrom increased ARPU, which continues to benefit from a rising share of VAS inMTS revenues.
Comfortable leverage. Net debt/EBITDA has declined from 1.2 to 1.1 QoQ in3Q11. This level compares to 1.4 for Rostelecom and 2.6 for VimpelCom. Themanagement confirms its intention to keep the leverage at the current level in2012.
Dividend yield projected at 7%. The company paid 78% of its net income for2010 as dividend in June 2011, which assumed $1.07/ADR. This year we expectMTS to pay the same dividend for 2011, which leads to a 6% dividend yield.
MGTS acquisition synergies could represent upside. We think the negativeeffect of MGTS‘ acquisition is already priced in, but we could see additionalupside coming from synergies. MTS estimates the deal would bring synergies ofRUB14bn, which we currently do not incorporate in our model.
Value dilutive M&A risks cannot be ruled out. Though MTS managementclaims that no cross border M&A activity is planned for 2012, we think MTScould still enter in some big M&A deal, like VimpelCom did in 2011. Sistemamanagement announced several times that MTS should become a global playerwith >200mn clients; these plans were also followed by media speculationsregarding the potential sale of SSTL (Sistema‘s Indian telecom asset) to MTS,which in fact would be negatively taken by the market, especially considering theloss-making profile of SSTL.
Catalysts. Along with the 4G auctions results, which will be released in 1H12,we think that the closest catalyst for the company will be its 4Q11 US GAAPresults, slated for 7 March 2012 – we think these should show a substantial YoYimprovement on both the top and bottom lines. Progress in the rollout of thefibre network in Moscow in 2012 will be also a very important catalyst for thecompany.
Figure 20. Key metrics ($mn) Figure 21. Valuation
2011E 2012E 2013E 2014E
Revenues 12,492 13,011 14,034 15,153
EBITDA 4,998 5,365 5,838 6,395
EBIT 2,625 3,023 3,452 3,819
Net Income 1,529 1,905 2,258 2,565
Net Debt 6,360 5,879 5,281 4,366
EPS, $ 1.52 1.89 2.24 2.54
CEPS, $ 3.87 4.21 4.60 5.10
BVPS, $ 3.54 4.37 5.29 6.26
DPS, $ 1.06 1.32 1.57 1.78
2011E 2012E 2013E 2014E
P/E 11.0 8.9 7.5 6.6
EV/EBITDA 4.7 4.2 3.8 3.3
EV/Sales 1.9 1.7 1.6 1.4
P/BV 4.7 3.8 3.2 2.7
EBITDA margin 40.0% 41.2% 41.6% 42.2%
Net margin 12.2% 14.6% 16.1% 16.9%
Revenue growth 11% 4% 8% 8%
EPS growth 11% 25% 19% 14%
Div Yield 6% 8% 9% 11%
Sources: Bloomberg, Otkritie Capital estimates Sources: Bloomberg, Otkritie Capital estimates
EQUITY | Russia
Telecom
1 February 2011
Research analysts
Alexander [email protected]+7 (495) 213 1830

8/3/2019 Rus Telecoms Report 2012 Otkritiye
http://slidepdf.com/reader/full/rus-telecoms-report-2012-otkritiye 12/26
MTS | UPDATE | Russia | 1 February 2011
Otkritie Capital 12
Valuation
Figure 22. MTS DCF Valuation, $mn
2011E 2012E 2013E 2014E 2015E 2016E 2017E 2018E 2019E
Revenue 12,492 13,011 14,034 15,153 16,245 17,293 18,309 19,407 20,506
EBITDA 4,998 5,365 5,838 6,395 7,050 7,527 7,983 8,479 8,971EBITDA Margin 40.0% 41.2% 41.6% 42.2% 43.4% 43.5% 43.6% 43.7% 43.8%
EBIT 2,625 3,023 3,452 3,819 4,288 4,587 4,871 5,180 5,485
EBIT Margin 21.0% 23.2% 24.6% 25.2% 26.4% 26.5% 26.6% 26.7% 26.8%
Unlevered PBT 2,625 3,023 3,452 3,819 4,288 4,587 4,871 5,180 5,485
* Tax Rate effective cash basis 26% 26% 26% 26% 26% 26% 26% 26% 26%
Unlevered Tax -671 -773 -882 -976 -1,096 -1,172 -1,245 -1,324 -1,402
Investment CF -3,362 -2,602 -2,666 -2,576 -2,437 -2,075 -2,197 -2,329 -2,461
(Capex)/Sales 26.9% 20.0% 19.0% 17.0% 15.0% 12.0% 12.0% 12.0% 12.0%
Other Cash Adj. (inc. Working Capital) 53 -108 -61 -84 -130 -91 -100 -113 -124
Unlevered, Adj. Free Cash Flow 1,018 1,883 2,228 2,759 3,387 4,189 4,441 4,714 4,985
Discount Factor 0.00 0.88 0.78 0.69 0.61 0.54 0.48 0.42 0.37
Present Value of FCF 0 1,664 1,740 1,904 2,066 2,257 2,115 1,984 1,854
$mn $/share
Value of Cash Flows 15,584 15.5
Value from Perpetuity 13,970 13.9
Adjustments -6,549 -6.5
Implied Equity Value 23,004 22.8
Current Market Value 16882 16.7
Upside 36.3%
Sources: Otkritie Capital estimates
Figure 23. MTS peers comparison
P/E EV/EBITDA EV/Sales
Name 2011E 2012E 2013E 2011E 2012E 2013E 2011E 2012E 2013E
MBT US Equity MTS
Current multiples 11.0 8.9 7.5 4.6 4.3 3.8 1.9 1.7 1.6
vs EM Peers -28% -29% -31% -14% -17% -21% -8% -9% -15%
vs DM Peers 6% -10% -20% -5% -9% -17% 19% 14% 4%
vs VimpelCom 43% 38% 30% 7% 15% 14% 9% 18% 18%
vs Rostelecom -6% -24% -31% -9% -6% -17% -7% -2% -7%
Sources: Otkritie Capital estimates, Bloomberg

8/3/2019 Rus Telecoms Report 2012 Otkritiye
http://slidepdf.com/reader/full/rus-telecoms-report-2012-otkritiye 13/26
MTS | UPDATE | Russia | 1 February 2011
Otkritie Capital 13
Appendix: Financial forecasts
Profitability
4,400
4,600
4,800
5,000
5,200
5,400
5,600
5,800
6,0006,200
6,400
36%
38%
40%
42%
44%
46%
48%
50%
52%54%
56%
2008 2009 2010E 2011E 2012E 2013E 2014E
EBITDA margin (LHS) EBITDA,$m
Cash flows, $m
(4,000)
(3,000)
(2,000)
(1,000)
0
1,000
2,000
3,000
4,000
5,000
6,000
2008 2009 2010E 2011E 2012E 2013E 2014E
Operating cash flow Investing cash flow
Momentum, %
0.50
0.40
0.30
0.20
0.10
0%
10%
20%
30%
2008 2009 2010E 2011E 2012E 2013E 2014E
Revenue g rowt h E PS g rowt h
Valuation
0
2
4
68
10
12
14
2008 2009 2010E 2011E 2012E 2013E 2014E
P/E EV/EBITDA
$mn unless otherwise stated
2009 2010E 2011E 2012E 2013E 2014E
Income Statement
Revenues 9,867 11,293 12,492 13,011 14,034 15,153
Depreciation 1,844 2,000 2,374 2,342 2,386 2,576EBITDA 4,491 4,873 4,998 5,365 5,838 6,395
Operating profit (EBIT) 2,647 2,872 2,625 3,023 3,452 3,819
Net Interest expense 467 693 551 444 399 354
Non-op. expenses (589) 24 0 0 0 0
Pretax Profit 1,504 2,066 2,074 2,579 3,053 3,465
Taxes 505 517 530 659 780 885
Minority interest (20) 168 15 15 15 15
Net Profit 1,019 1,381 1,529 1,905 2,258 2,565
Cash Flow Statement
Net Change in work. cap. (397) (48) 53 (108) (61) (84)
Provisions and write-offs 589 (24) 0 0 0 0
Other - - - - - -
Operating cashflow 3,035 3,477 3,970 4,154 4,598 5,072
Capex (1,800) (2,647) (2,998) (2,602) (2,666) (2,576)
Disposals (Acquisitions) (56) 465 (364) 0 0 0
Investing cashflow (1,856) (2,182) (3,362) (2,602) (2,666) (2,576)
Equity - - - - - -Debt 131 (3,036) 280 (3,270) (1,833) (1,681)
Financing cashflow 131 (3,036) 280 (3,270) (1,833) (1,681)
Net Change in Cash 1,310 (1,741) 888 (1,718) 98 815
Balance sheet
Cash & equivalents 2,736 1,261 2,149 431 529 1,344
Current Assets 1,666 1,463 1,571 1,568 1,646 1,737
PP&E 11,057 11,361 12,350 12,610 12,891 12,891
Goodwill and other 306 392 481 569 660 752
Total Assets 15,764 14,478 16,552 15,179 15,725 16,724
Current Liabilities 2,257 2,398 2,648 2,625 2,732 2,832
S-T Debt 0 0 0 0 0 0
L-T Debt 6,327 7,150 8,510 6,310 5,810 5,710
Other L-T Liabilities 1,103 1,119 1,134 1,149 1,164 1,179
Shareholders Funds 3,345 3,125 3,574 4,408 5,333 6,317
Total L iabilities & Equity 13,031 13,792 15,865 14,492 15,039 16,038
Net Debt 3,591 5,888 6,360 5,879 5,281 4,366
Margins and profitability
EBIT Margin 26.8% 25.4% 21.0% 23.2% 24.6% 25.2%
EBITDA Margin 45.5% 43.1% 40.0% 41.2% 41.6% 42.2%
Net Margin 10.3% 12.2% 12.2% 14.6% 16.1% 16.9%
ROE 30.5% 44.2% 42.8% 43.2% 42.3% 40.6%
ROA 6.5% 9.5% 9.2% 12.6% 14.4% 15.3%
ROIC 19.7% 21.2% 17.9% 20.0% 22.2% 24.3%
Momentum
Revenue growth -4% 14% 11% 4% 8% 8%
EBITDA growth -13% 9% 3% 7% 9% 10%
EPS growth -47% -48% 11% 25% 19% 14%
Liquidity and solvency
Cash Ratio 1.2 0.5 0.8 0.2 0.2 0.5
Current Ratio 0.7 0.6 0.6 0.6 0.6 0.6
Interest Coverage 5.7 4.1 4.8 6.8 8.7 10.8
Debt/Equity 1.9 2.3 2.4 1.4 1.1 0.9
Debt/Total assets 0.4 0.5 0.5 0.4 0.4 0.3
Net debt / EBITDA 0.8 1.2 1.3 1.1 0.9 0.7
ValuationP/E 6.3 12.2 11.0 8.9 7.5 6.6
P/CE 2.2 5.0 4.3 4.0 3.6 3.3
P/BV 1.9 5.4 4.7 3.8 3.2 2.7
EV/Sales 2.1 2.0 1.9 1.7 1.6 1.4
EV/EBITDA 4.6 4.7 4.7 4.2 3.8 3.3
Dividend yield, (ords) 15.5% 6.4% 6.3% 7.9% 9.4% 10.6%
Dividend yield, (prefs) - - - - - -
Per Share Data
EPS - stock 1 2.65 1.37 1.52 1.89 2.24 2.54
DPS, ords 2.60 1.07 1.06 1.32 1.57 1.78
DPS, prefs - - - - - -
BVPS - stock 1 8.70 3.10 3.54 4.37 5.29 6.26
Source: Company data, Otkritie Capital estimates
8/3/2019 Rus Telecoms Report 2012 Otkritiye
http://slidepdf.com/reader/full/rus-telecoms-report-2012-otkritiye 14/26
Otkritie Capital 14
UPDATE
SistemaBetter upside from MTS and Bashneft
BUYTicker SSA LI
Target price, $ 33.9
Last price of GDRs, $ 19.5
Upside 74%
Number of GDRs, mn 482.5
Market cap, $mn 9,414
Net debt, $mn 11,014EV, $mn 14,094
Free float 24%
52-week min, $ 13.0
52-week max, $ 30.4
Sources: Bloomberg, Otkritie Capital estimates
Share price performance
50
60
70
80
90
100
110
120
130
140
J a n - 1 1
F e b - 1 1
M a r - 1 1
A p r - 1 1
M a y - 1 1
J u n - 1 1
J u l - 1 1
A u g - 1 1
S e p - 1 1
O c t - 1 1
N o v - 1 1
D e c - 1 1
Sistema (Rebased) RTS (Rebased)
Sources: Bloomberg
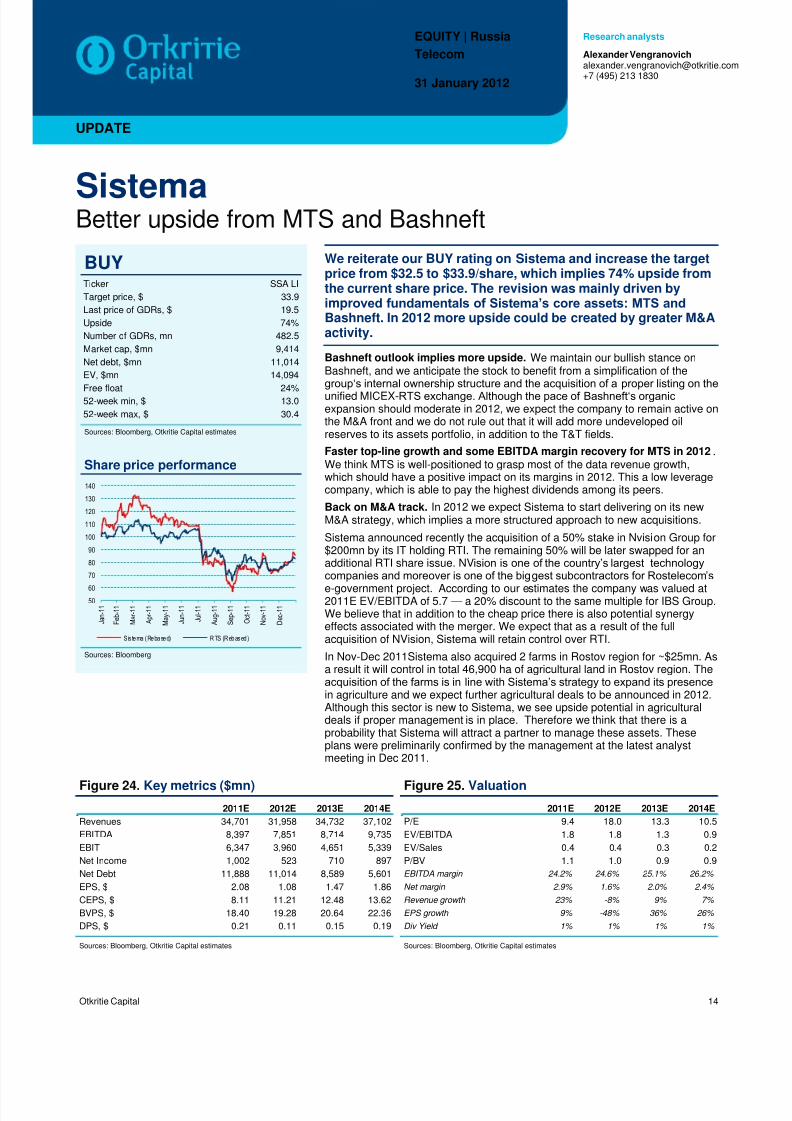
We reiterate our BUY rating on Sistema and increase the targetprice from $32.5 to $33.9/share, which implies 74% upside fromthe current share price. The revision was mainly driven byimproved fundamentals of Sistema’s core assets: MTS andBashneft. In 2012 more upside could be created by greater M&Aactivity.
Bashneft outlook implies more upside. We maintain our bullish stance onBashneft, and we anticipate the stock to benefit from a simplification of thegroup‗s internal ownership structure and the acquisition of a proper listing on theunified MICEX-RTS exchange. Although the pace of Bashneft‗s organicexpansion should moderate in 2012, we expect the company to remain active onthe M&A front and we do not rule out that it will add more undeveloped oilreserves to its assets portfolio, in addition to the T&T fields.
Faster top-line growth and some EBITDA margin recovery for MTS in 2012.We think MTS is well-positioned to grasp most of the data revenue growth,which should have a positive impact on its margins in 2012. This a low leveragecompany, which is able to pay the highest dividends among its peers.
Back on M&A track. In 2012 we expect Sistema to start delivering on its newM&A strategy, which implies a more structured approach to new acquisitions.
Sistema announced recently the acquisition of a 50% stake in Nvision Group for$200mn by its IT holding RTI. The remaining 50% will be later swapped for anadditional RTI share issue. NVision is one of the country‘s largest technologycompanies and moreover is one of the biggest subcontractors for Rostelecom‘se-government project. According to our estimates the company was valued at2011E EV/EBITDA of 5.7 — a 20% discount to the same multiple for IBS Group.We believe that in addition to the cheap price there is also potential synergyeffects associated with the merger. We expect that as a result of the fullacquisition of NVision, Sistema will retain control over RTI. In Nov-Dec 2011Sistema also acquired 2 farms in Rostov region for ~$25mn. Asa result it will control in total 46,900 ha of agricultural land in Rostov region. Theacquisition of the farms is in line with Sistema‘s strategy to expand its presencein agriculture and we expect further agricultural deals to be announced in 2012.Although this sector is new to Sistema, we see upside potential in agriculturaldeals if proper management is in place. Therefore we think that there is aprobability that Sistema will attract a partner to manage these assets. Theseplans were preliminarily confirmed by the management at the latest analystmeeting in Dec 2011.
Figure 24. Key metrics ($mn) Figure 25. Valuation
2011E 2012E 2013E 2014E
Revenues 34,701 31,958 34,732 37,102
EBITDA 8,397 7,851 8,714 9,735
EBIT 6,347 3,960 4,651 5,339
Net Income 1,002 523 710 897
Net Debt 11,888 11,014 8,589 5,601
EPS, $ 2.08 1.08 1.47 1.86
CEPS, $ 8.11 11.21 12.48 13.62
BVPS, $ 18.40 19.28 20.64 22.36
DPS, $ 0.21 0.11 0.15 0.19
2011E 2012E 2013E 2014E
P/E 9.4 18.0 13.3 10.5
EV/EBITDA 1.8 1.8 1.3 0.9
EV/Sales 0.4 0.4 0.3 0.2
P/BV 1.1 1.0 0.9 0.9
EBITDA margin 24.2% 24.6% 25.1% 26.2%
Net margin 2.9% 1.6% 2.0% 2.4%
Revenue growth 23% -8% 9% 7%
EPS growth 9% -48% 36% 26%
Div Yield 1% 1% 1% 1%
Sources: Bloomberg, Otkritie Capital estimates Sources: Bloomberg, Otkritie Capital estimates
EQUITY | Russia
Telecom
31 January 2012
Research analysts
Alexander [email protected]+7 (495) 213 1830

8/3/2019 Rus Telecoms Report 2012 Otkritiye
http://slidepdf.com/reader/full/rus-telecoms-report-2012-otkritiye 15/26
Sistema | UPDATE | Russia | 1 February 2011
Otkritie Capital 15
Valuation
Figure 26. Sistema SOTP valuation
Company OwnershipTarget Enterprise
value, $mnAdjustments
(Net debt+associates), $mnTarget Value
Of Sistema's Stake, $mnPer Share
of Sistema, $
Telecoms
MTS 53% 29,553 6,549 12,192 25.3
SSTL 57% 653 653 0 0.0
Oil & Energy
Bashneft 63% 12,019 2,420 7,352 15.2
Bashkiria Oil & Energy assets 17-50% 809 42 767 1.6
Russneft 49% 6,090 5,366 724 1.5
Technology
Sitronics 62% 756 641 71 0.1
RTI 82% 589 370 179 0.4
NVision 50% 400 0 200 0.4
Binnopharm 100% 63 63 0 0.0
Consumer
Detskiy Mir 75% 303 0 227 0.5
MBRD 99% 544 539 1.1
Medsi 100% 203 76 127 0.3
Intourist 66% 179 120 59 0.1
SMM 75% 333 89 183 0.4
Agriculture 100% 25 0 25 0.1
Sum Of The Parts Valuation
Gross SOTP value 22,645 46.9
Intercompany transactions, PV as 2% of Gross SOTP value (453) (0.9)
Net SOTP value 22,192 46.0
Discount due to Sistema's holding structure 20.0%
Discounted Net SOTP value 17,754 36.8
Corporate debt (1,416) (2.9)
Sistema's SOTP value, adjusted to net corporate debt 16,338
Target Price/GDR 33.9
Sources: Otkritie Capital estimates, Bloomberg
Figure 27. Sistema upside breakdown by drivers, $/share
19.4
6.3
5.9
2.5
2.2 2.9
0.9
33.9
0
5
1015
20
25
30
35
40
C u r r e n t p r i c e
M T S u p s i d e
D i s c o u n t c o n t r a c t i o n
B a s h n e f t u p s i d e
D e v e l o p i n g a s s e t s u p s i d e
C o r p o r a t e d e b t
I n t e r c o m p a n y t r a n s a c t i o n s
T a r g e t p r i c e
Sources: Otkritie Capital Estimates

8/3/2019 Rus Telecoms Report 2012 Otkritiye
http://slidepdf.com/reader/full/rus-telecoms-report-2012-otkritiye 16/26
Sistema | UPDATE | Russia | 1 February 2011
Otkritie Capital 16
Figure 28. Sistema discount to market NAV, %
-10%
0%
10%
20%
30%
40%
50%
A
p r - 0 9
M
a y - 0 9
J
u n - 0 9
J u l - 0 9
A
u g - 0 9
S
e p - 0 9
O
c t - 0 9
N
o v - 0 9
D
e c - 0 9
J
a n - 1 0
F
e b - 1 0
M
a r - 1 0
A
p r - 1 0
M
a y - 1 0
J
u n - 1 0
J u l - 1 0
A
u g - 1 0
S
e p - 1 0
O
c t - 1 0
N
o v - 1 0
D
e c - 1 0
J
a n - 1 1
F
e b - 1 1
M
a r - 1 1
A
p r - 1 1
M
a y - 1 1
J
u n - 1 1
J u l - 1 1
A
u g - 1 1
S
e p - 1 1
O
c t - 1 1
N
o v - 1 1
D
e c - 1 1
J
a n - 1 2
Average discount
Sources: Otkritie Capital estimates, Bloomberg

8/3/2019 Rus Telecoms Report 2012 Otkritiye
http://slidepdf.com/reader/full/rus-telecoms-report-2012-otkritiye 17/26
Sistema | UPDATE | Russia | 1 February 2011
Otkritie Capital 17
Appendix: Financial forecasts
Profitability
5,000
5,500
6,000
6,500
7,000
7,500
8,000
8,500
9,0009,500
10,000
20%
22%
24%
26%
28%
30%
32%
34%
36%38%
40%
2008 2009 2010 2011E 2012E 2013E 2014E
EBITDA margin (LHS) EBITDA,$m
Cash flows, $m
(8,000)
(6,000)
(4,000)
(2,000)
0
2,0004,000
6,000
8,000
2008 2009 2010 2011E 2012E 2013E 2014E
Operating cash flow Investing cash flow
Momentum, %
5
0%
500%
1,000%
1,500%
2,000%
2,500%
3,000%
2008 2009 2010 2011E 2012E 2013E 2014E
Revenue g rowt h E PS g rowt h
Valuation
0
20
40
60
80
100
120
140
160
2008 2009 2010 2011E 2012E 2013E 2014E
P/E EV/EBITDA
$mn unless otherwise stated
2009 2010 2011E 2012E 2013E 2014E
Income Statement
Revenues 18,750 28,098 34,701 31,958 34,732 37,102
Depreciation 2,491 2,946 2,912 4,887 5,311 5,674EBITDA 6,727 7,309 8,397 7,851 8,714 9,735
Operating profit (EBIT) 4,237 4,362 6,347 3,960 4,651 5,339
Net Interest expense 1,054 1,466 1,516 1,437 1,227 1,016
Non-op. expenses (128) 24 0 0 0 0
Pretax Profit 3,055 2,921 4,831 2,522 3,424 4,323
Taxes 747 1,089 1,932 1,009 1,369 1,729
Minority interest 643 1,199 1,896 990 1,344 1,697
Net Profit 1,643 919 1,002 523 710 897
Cash Flow Statement
Net Change in work. cap. (1,947) (474) 894 (468) 473 404
Provisions and write-offs - - - - - -
Other 261 147 181 167 181 194
Operating cashflow 3,090 4,736 4,989 5,110 6,676 7,168
Capex (3,434) (4,180) (4,531) (4,135) (4,199) (4,109)
Disposals (Acquisitions) (2,636) (410) 0 0 0 0
Investing cashflow (6,071) (4,590) (4,531) (4,135) (4,199) (4,109)
Equity 1,215 280 0 0 0 0Debt 7,248 157 500 (2,000) (2,000) (2,000)
Financing cashflow 4,380 (1,015) 500 (2,000) (2,000) (2,000)
Net Change in Cash 1,400 (868) 869 (1,125) 425 988
Balance sheet
Cash & equivalents 4,013 3,145 4,014 2,889 3,313 4,302
Current Assets 13,678 14,576 17,073 15,367 16,378 17,868
PP&E 19,267 19,040 20,659 19,906 18,794 17,228
Goodwill and other 9,066 10,494 10,313 10,146 9,965 9,771
Total Assets 42,011 44,109 48,044 45,420 45,137 44,868
Current Liabilities 13,178 13,928 16,500 15,353 16,312 17,117
S-T Debt 3,737 3,196 3,246 3,146 3,046 2,946
L-T Debt 11,204 12,207 12,657 10,757 8,857 6,957
Other L-T Liabilities - - - - - -
Shareholders Funds 6,793 7,967 8,880 9,303 9,961 10,786
Total L iabilities & Equity 42,011 44,109 48,044 45,420 45,137 44,868
Net Debt 10,928 12,258 11,888 11,014 8,589 5,601
Margins and profitability
EBIT Margin 22.6% 15.5% 18.3% 12.4% 13.4% 14.4%
EBITDA Margin 35.9% 26.0% 24.2% 24.6% 25.1% 26.2%
Net Margin 8.8% 3.3% 2.9% 1.6% 2.0% 2.4%
ROE 24.2% 11.5% 11.3% 5.6% 7.1% 8.3%
ROA 3.9% 2.1% 2.1% 1.2% 1.6% 2.0%
ROIC 13.7% 12.9% 18.4% 11.7% 14.6% 18.2%
Momentum
Revenue growth 17% 50% 23% -8% 9% 7%
EBITDA growth 23% 9% 15% -6% 11% 12%
EPS growth 2,553% -44% 9% -48% 36% 26%
Liquidity and solvency
Cash Ratio 0.3 0.2 0.2 0.2 0.2 0.3
Current Ratio 1.0 1.0 1.0 1.0 1.0 1.0
Interest Coverage 4.0 3.0 4.2 2.8 3.8 5.3
Debt/Equity 2.2 1.9 1.8 1.5 1.2 0.9
Debt/Total assets 0.4 0.3 0.3 0.3 0.3 0.2
Net debt / EBITDA 1.6 1.7 1.4 1.4 1.0 0.6
ValuationP/E 5.7 10.2 9.4 18.0 13.3 10.5
P/CE 2.3 2.4 2.4 1.7 1.6 1.4
P/BV 1.4 1.2 1.1 1.0 0.9 0.9
EV/Sales 0.8 0.5 0.4 0.4 0.3 0.2
EV/EBITDA 2.2 2.1 1.8 1.8 1.3 0.9
Dividend yield, (ords) - - 1.1% 0.6% 0.8% 1.0%
Dividend yield, (prefs) - - - - - -
Per Share Data
EPS - stock 1 3.41 1.90 2.08 1.08 1.47 1.86
DPS, ords - - 0.21 0.11 0.15 0.19
DPS, prefs - - - - - -
BVPS - stock 1 14.08 16.51 18.40 19.28 20.64 22.36
Source: Company data, Otkritie Capital estimates

8/3/2019 Rus Telecoms Report 2012 Otkritiye
http://slidepdf.com/reader/full/rus-telecoms-report-2012-otkritiye 18/26
Otkritie Capital 18
UPDATE
RostelecomTimes are changing, but our view remains the same
SELLTicker RTKM RX
Target price, RUB 117
Last price of common shares, RUB 146
Upside -20%
Number of common shares, mn 2,943.3
Market cap, $mn 14,833
Net debt, $mn 3,991EV, $mn 18,823
Free float 31%
52-week min, RUB 127
52-week max, RUB 221
Sources: Bloomberg, Otkritie Capital estimates
Share price performance
70
80
90
100
110
120
130
140
J a n - 1 1
F e b - 1 1
M a r - 1 1
A p r - 1 1
M a y - 1 1
J u n - 1 1
J u l - 1 1
A u g - 1 1
S e p - 1 1
O c t - 1 1
N o v - 1 1
D e c - 1 1
Roste lecom (Rebased) RTS (Rebased)
Sources: Bloomberg
We increase our target price for Rostelecom from RUB110 toRUB117/ordinary share, but still reiterate SELL rating for the stock.Rostelecom is the least preferred stock in our universe. We expectnegative dynamics in the company’s fixed line business, which islosing customers, who are shifting to mobile communications.We’ve seen little progress in Rostelecom mobile operations in 2011and do not expect a breakthrough in 2012. The company remains alow-dividend payer with 1.7% dividend yield on ordinary shares.
Skylink acquisition provides 3G licenses. Rostelecom has acquired a 100% stakein Skylink in December 2011 for RUB 9.4bn. We expect the company to use Skylink3G licenses in the regions to enter new regions and attract new customers, thoughthe major risks of that strategy lie on the execution side. As the mobile market issaturated
Joint 4G rollout with Skartel – not a game changer. Skartel (Yota brand) has only150 base stations and network rollout implies substantial investments, which are stillnot included in Rostelecom financial model, therefore we do not expect substantialupside from earlier 4G rollout.
B2G services revenue could surprise on the both sides. Rostelecom‘s project for online broadcasting from election sites will only be partially financed by the state,which is ready to pay only RUB13bn, while the cost of the project is estimated ashigh as RUB20-30bn. We doubt that the company could find additional uses for
infrastructure created, otherwise it would need to recognize a loss of as much asRUB17bn (impairment on the equipment). That could amount to as much as 40% ofthe company‘s FY12 net income under US GAAP
Svyazinvest-Rostelecom restructuring details to be announced in 2012. In 2012the decision regarding the second stage of Svyazinvest-Rostelecom restructuringshould be announced. While we do not think the deal terms would be beneficial forthe minorities, there is still potential upside from that. Overall we do not expect therestructuring to be finished before 2013.
Dividend yield is expected to be the lowest among Russian peers. Rostelecom‘snew dividend policy assumes payment of minimum 20% of net income under USGAAP as dividend for ordinary shares, that means RUB 8.5bn to be paid in 2012,which assumes RUB2.9/share or only 1.7% dividend yield. We estimate preferredshares to earn a 4% dividend yield in 2012.
LSE listing could create additional share overhang. The company is expected to
obtain LSE listing in February 2012 and we expect that some minority shareholders(e.g. Nafta Moskva) could decide to sell their shares, which could create additionalshare overhang risk.
Figure 29. Key metrics (RUBmn) Figure 30. Valuation
2011E 2012E 2013E 2014E
Revenues 292,108 320,568 325,219 342,938
EBITDA 114,738 126,283 119,534 124,913
EBIT 60,021 58,565 64,816 70,195
Net Income 38,841 37,177 41,911 45,985
Net Debt 135,639 121,263 98,625 74,663
EPS, RUB 12.67 12.13 13.67 15.00
CEPS, RUB 30.52 34.21 31.52 32.85
BVPS, RUB 82.18 91.46 102.34 114.18DPS, RUB 2.64 2.53 2.85 3.12
2011E 2012E 2013E 2014E
P/E 11.5 12.0 10.7 9.7
EV/EBITDA 5.1 4.5 4.6 4.2
EV/Sales 2.0 1.8 1.7 1.5
P/BV 1.8 1.6 1.4 1.3
EBITDA margin 39.3% 39.4% 36.8% 36.4%
Net margin 13.3% 11.6% 12.9% 13.4%
Revenue growth 6% 10% 1% 5%
EPS growth 24% -4% 13% 10% Div Yield 2% 2% 2% 2%
сизифов трудSources: Bloomberg, Otkritie Capital estimates Sources: Bloomberg, Otkritie Capital estimates
EQUITY | Russia
Telecom
1 February 2011
Research analysts
Alexander [email protected]+7 (495) 213 1830

8/3/2019 Rus Telecoms Report 2012 Otkritiye
http://slidepdf.com/reader/full/rus-telecoms-report-2012-otkritiye 19/26
VimpelCom | UPDATE | Russia | 1 February 2011
Otkritie Capital 19
Valuation
Figure 31. Rostelecom DCF Valuation
DCF 2011E 2012E 2013E 2014E 2015E 2016E 2017E 2018E 2019E
Revenue 292,108 320,568 325,219 342,938 358,172 373,136 388,284 405,088 423,802
EBITDA 114,738 126,283 119,534 124,913 128,903 132,990 137,791 144,136 151,847EBITDA Margin 39.3% 39.4% 36.8% 36.4% 36.0% 35.6% 35.5% 35.6% 35.8%
EBIT 60,021 58,565 64,816 70,195 74,185 78,272 83,073 89,418 97,129
EBIT Margin 20.5% 18.3% 19.9% 20.5% 20.7% 21.0% 21.4% 22.1% 22.9%
tax on EBIT (14,565) (14,211) (15,728) (17,033) (18,002) (18,993) (20,158) (21,698) (23,569)
depreciation 54,718 67,718 54,718 54,718 54,718 54,718 54,718 54,718 54,718
CAPEX+ Acquisitions (92,029) (83,348) (68,296) (68,588) (68,053) (67,164) (66,008) (68,865) (72,046)
Changes in WC (530) 3,684 4,030 3,011 2,841 2,724 2,494 2,362 2,375
FCF 7,615 32,408 39,539 42,303 45,690 49,556 54,118 55,935 58,606
discount factor 0.89 0.79 0.70 0.62 0.56 0.49 0.44 0.39
Discounted cash flow 28,809 31,245 29,716 28,531 27,508 26,704 24,536 22,852
RUBmn RUB/share
PV of CF unitl 2020 219,900 74.7PV of terminal value 222,131 75.5
Enterprise value 442,032 150.2
Less net debt (116,764) -39.7
Less minorities (11,870) -4.0
Add associates 30,848 10.5
Equity fair value 344,246 117.0
Current market cap 434,984 148
downside -20.9%
Sources: Otkritie Capital Estimates
Figure 32. Rostelecom peers comparison
P/E EV/EBITDA EV/SalesName 2011E 2012E 2013E 2011E 2012E 2013E 2011E 2012E 2013E
RTKM rx equity Rostelecom
Current multiples 11.8 11.7 10.9 5.1 4.5 4.6 2.0 1.8 1.7
vs EM Peers -23% -6% 1% -6% -12% -5% -1% -7% -8%
vs DM Peers 13% 18% 17% 5% -4% 0% 28% 16% 12%
vs MTS 6% 32% 46% 10% 6% 20% 7% 2% 8%
vs VimpelCom 53% 82% 89% 18% 21% 37% 17% 21% 28%
Sources: Otkritie Capital Estimates, Bloomberg

8/3/2019 Rus Telecoms Report 2012 Otkritiye
http://slidepdf.com/reader/full/rus-telecoms-report-2012-otkritiye 20/26
VimpelCom | UPDATE | Russia | 1 February 2011
Otkritie Capital 20
Appendix: Financial forecasts
Profitability
85,000
95,000
105,000
115,000
125,000
135,000
145,000
155,000
30%
32%
34%
36%
38%
40%
42%
44%
2008 2009 2010 2011E 2012E 2013E 2014E
EBITDA margin (LHS) EBITDA,RUBm
Cash flows, RUBm
(100,000)
(50,000)
0
50,000
100,000
150,000
2008 2009 2010 2011E 2012E 2013E 2014E
Operating cash flow Investing cash flow
Momentum, %
0.05
0%
5%
10%
15%
20%
25%
2008 2009 2010 2011E 2012E 2013E 2014E
Revenue g rowt h E PS g rowt h
Valuation
0
2
4
6
810
12
14
16
18
2008 2009 2010 2011E 2012E 2013E 2014E
P/E EV/EBITDA
RUBmn unless otherwise stated
2009 2010 2011E 2012E 2013E 2014E
Income Statement
Revenues 264,645 275,731 292,108 320,568 325,219 342,938
Depreciation 51,517 51,138 54,718 67,718 54,718 54,718EBITDA 101,570 101,419 114,738 126,283 119,534 124,913
Operating profit (EBIT) 50,053 50,281 60,021 58,565 64,816 70,195
Net Interest expense 13,389 9,033 12,572 12,572 12,572 12,572
Non-op. expenses - - - - - -
Pretax Profit 36,664 41,248 47,448 45,993 52,244 57,622
Taxes 8,074 10,041 12,445 11,912 13,429 14,734
Minority interest - - - - - -
Net Profit 26,263 31,338 38,841 37,177 41,911 45,985
Cash Flow Statement
Net Change in work. cap. (1,435) 2,393 (530) 3,684 4,030 3,011
Provisions and write-offs - - - - - -
Other - - - - - -
Operating cashflow 86,255 85,042 93,128 108,679 100,759 103,814
Capex (45,352) (51,845) (58,422) (83,348) (68,296) (68,588)
Disposals (Acquisitions) (1,816) (30,470) (33,607) 0 0 0
Investing cashflow (47,168) (82,315) (92,029) (83,348) (68,296) (68,588)
Equity - - - - - -Debt - - - - - -
Financing cashflow (35,985) (18,763) (428) (9,383) (8,765) (10,118)
Net Change in Cash 3,102 (16,036) 672 15,948 23,698 25,109
Balance sheet
Cash & equivalents 34,243 18,207 18,879 34,827 58,525 83,633
Current Assets 65,958 53,082 55,825 75,373 99,659 127,009
PP&E 293,497 301,068 338,379 354,009 367,587 381,457
Goodwill and other 5,831 4,531 4,531 4,531 4,531 4,531
Total Assets 404,752 435,253 434,773 429,976 427,231 424,839
Current Liabilities 90,165 95,509 96,192 99,970 102,517 105,273
S-T Debt 49,104 50,096 50,096 50,096 50,096 50,096
L-T Debt 67,092 87,941 87,941 87,941 87,941 87,941
Other L-T Liabilities - - - - - -
Shareholders Funds 217,411 213,107 251,948 280,411 313,750 350,072
Total Liabilities & Equity 403,180 426,811 466,865 502,043 539,908 581,127
Net Debt 97,531 136,027 135,639 121,263 98,625 74,663
Margins and profitability
EBIT Margin 18.9% 18.2% 20.5% 18.3% 19.9% 20.5%
EBITDA Margin 38.4% 36.8% 39.3% 39.4% 36.8% 36.4%
Net Margin 9.9% 11.4% 13.3% 11.6% 12.9% 13.4%
ROE 12.1% 14.7% 15.4% 13.3% 13.4% 13.1%
ROA 6.5% 7.2% 8.9% 8.6% 9.8% 10.8%
ROIC 14.3% 12.5% 15.0% 15.9% 19.5% 23.8%
Momentum
Revenue growth 2% 4% 6% 10% 1% 5%
EBITDA growth 14% -0% 13% 10% -5% 4%
EPS growth -3% 19% 24% -4% 13% 10%
Liquidity and solvency
Cash Ratio 0.4 0.2 0.2 0.3 0.6 0.8
Current Ratio 0.7 0.6 0.6 0.8 1.0 1.2
Interest Coverage 3.7 5.6 4.8 4.7 5.2 5.6
Debt/Equity 0.5 0.6 0.5 0.5 0.4 0.4
Debt/Total assets 0.3 0.3 0.3 0.3 0.3 0.3
Net debt / EBITDA 1.0 1.3 1.2 1.0 0.8 0.6
ValuationP/E 17.0 14.3 11.5 12.0 10.7 9.7
P/CE 5.7 5.4 4.8 4.3 4.6 4.4
P/BV 2.1 2.1 1.8 1.6 1.4 1.3
EV/Sales 2.1 2.1 2.0 1.8 1.7 1.5
EV/EBITDA 5.4 5.8 5.1 4.5 4.6 4.2
Dividend yield, (ords) - - 1.8% 1.7% 2.0% 2.1%
Dividend yield, (prefs) - 0.5% - - - -
Per Share Data
EPS - stock 1 8.57 10.22 12.67 12.13 13.67 15.00
DPS, ords - - 2.64 2.53 2.85 3.12
DPS, prefs - 0.43 - - - -
BVPS - stock 1 70.91 69.51 82.18 91.46 102.34 114.18
Source: Company data, Otkritie Capital estimates

8/3/2019 Rus Telecoms Report 2012 Otkritiye
http://slidepdf.com/reader/full/rus-telecoms-report-2012-otkritiye 21/26
Otkritie Capital 21
UPDATE
VimpelComGood prospects, but too many moving parts
BUYTicker VIP US
Target price, $ 14
Last price of common shares, $ 10.5
Upside 33%
Number of common shares, mn 1,628.2
Market cap, $mn 17,129
Net debt, $mn 22,103
EV, $mn 39,232
Free float 17%52-week min, $ 9.16
52-week max, $ 14.7
Sources: Bloomberg, Otkritie Capital estimates
Share price performance
65
70
7580
85
90
95
100
105
110
115
J a n - 1 1
F e b - 1 1
M a r - 1 1
A p r - 1 1
M a y - 1 1
J u n - 1 1
J u l - 1 1
A u g - 1 1
S e p - 1 1
O c t - 1 1
N o v - 1 1
D e c - 1 1
VimpelCom (Rebased) RTS (Rebased)
Sources: Bloomberg
We reiterate our BUY rating but decrease our target price forVimpelCom from $22 to $14/share. We see a long-term fundamentalupside in VimpelCom stock, though it lacks positive short-termcatalysts. Although we like the new strategy, which is focused onbalanced growth and improved efficiency, ongoing uncertaintyregarding the fate of the shareholder agreement and Djezzynationalization price could limit growth opportunities for now.VimpelCom is expected to remain a high dividend payer (with adividend yield of 7.5%) as the company is not planning fast
deleveraging in 2012. The stock is cheap trading on 27% discountto EM peers.
We expect the top-line to grow by 4.5% in 2012, while the EBITDA marginshould go up to 42%. We expect some margins improvement in Russia operations,mainly on the back of decreasing selling expenses. Most of the top-line growth isexpected to come from Asia, Africa and CIS.
Dispute between Altimo and Telenor likely to continue in 2012 after the recentacquisition of a 6% voting stake in VimpelCom from Oleg Kiselev by EastOne, whichis an investment fund of Viktor Pinchuk. Because EastOne is an independentinvestment company, the announcement increases Altimo‘s chances of prevailing inits court case against Telenor. Altimo currently holds less than 25% of VimpelCom'svoting rights, which effectively means that the VimpelCom shareholder agreementshould be terminated if Telenor cannot prove direct links between Altimo andEastOne. After termination of the agreement Altimo will likely initiate elections for anew VimpelCom Board of Directors, which could be done in 6 months after thetermination of the shareholders agreement. A new Board of Directors would mostlikely comprise 3 members each from Altimo, Telenor, and Weather Investments, aswell as 3 independent directors (one of who would probably represent EastOne). Thenew BoD combination implies that Altimo and Weather could jointly have 7 places outof 12 in the BoD, which could make their life easier to push any further M&A dealthrough.
Djezzy valuation would be the key stock driver in 1H12. VimpelCom has enteredinto a non-binding memorandum regarding the possible sale to the Algerian State ofa majority stake in its subsidiary Orascom Telecom Algerie (OTA), which operatesunder the Djezzy brand. Following signing of the memorandum, the Algerian Ministryof Finance and VimpelCom will undertake a process to agree on the valuation ofDjezzy. We expect OTA (Djezzy) valuation range to be announced in Spring 2012,which would be followed by the final price negotiation period, therefore we expect thedeal to be closed in late 2012. As a result of the transaction VimpelCom will continueto consolidate OTA in its financial results, but we think the sale could l imit OTA‘sability to upstream dividends to VimpelCom, which could have a negative effect onthe dividend yield after 2012.
Dividend yield for 2012 likely to exceed 7.5%. The management guides for anannual dividend of $0.8/ADR for 2011-2014, which translates into a 7.5% dividendyield. The interim dividend for 2011 is expected to be announced in 2Q12.
Figure 33. Key metrics ($mn) Figure 34. Valuation
2011E 2012E 2013E 2014E
Revenues 22,996 24,022 25,351 26,860
EBITDA 9,437 10,098 10,657 11,426
EBIT 4,773 5,346 5,768 6,380
Net Income 2,042 2,534 2,950 3,553
Net Debt 23,700 22,103 19,868 16,593
EPS, $ 1.25 1.56 1.81 2.18
CEPS, $ 4.12 4.48 4.81 5.28
BVPS, $ 7.11 7.86 8.73 10.19
DPS, $ 0.82 0.93 0.72 0.76
2011E 2012E 2013E 2014E
P/E 8.4 6.8 5.8 4.8
EV/EBITDA 4.3 3.9 3.5 3.0
EV/Sales 1.8 1.6 1.5 1.3
P/BV 1.5 1.3 1.2 1.0
EBITDA margin 41.0% 42.0% 42.0% 42.5%
Net margin 8.9% 10.5% 11.6% 13.2%
Revenue growth 119% 4% 6% 6%
EPS growth -7% 24% 16% 20%
Div Yield 8% 9% 7% 7%
Sources: Bloomberg, Otkritie Capital estimates Sources: Bloomberg, Otkritie Capital estimates
EQUITY | Russia
Telecom
1 February 2011
Research analysts
Alexander [email protected]+7 (495) 213 1830

8/3/2019 Rus Telecoms Report 2012 Otkritiye
http://slidepdf.com/reader/full/rus-telecoms-report-2012-otkritiye 22/26
VimpelCom | UPDATE | Russia | 1 February 2011
Otkritie Capital 22
Valuation
Figure 35. VimpelCom DCF Valuation
2011E 2012E 2013E 2014E 2015E 2016E 2017E 2018E 2019E
Revenue 22,996 24,022 25,351 26,860 28,370 29,706 30,980 32,289 33,429
EBITDA 9,437 10,098 10,657 11,426 12,068 12,785 13,333 13,897 14,387EBITDA Margin 41.0% 42.0% 42.0% 42.5% 42.5% 43.0% 43.0% 43.0% 43.0%
EBIT 4,773 5,346 5,768 6,380 6,881 7,502 7,979 8,477 8,944
EBIT Margin 20.8% 22.3% 22.8% 23.8% 24.3% 25.3% 25.8% 26.3% 26.8%
Unlevered PBT 4,773 5,346 5,768 6,380 6,881 7,502 7,979 8,477 8,944
Tax Rate effective cash basis 28% 28% 28% 28% 28% 28%
Unlevered Tax -1,336 -1,497 -1,615 -1,787 -1,927 -2,101 -2,234 -2,374 -2,504
Investment CF -5,769 -4,374 -4,056 -4,029 -4,255 -4,456 -4,647 -4,843 -5,014
(Capex)/Sales 25.1% 18.2% 16.0% 15.0% 15.0% 15.0% 15.0% 15.0% 15.0%
Other Cash Adj. (inc. Working Capital) -265 40 -74 -23 -34 -66
Unlevered, Adj. Free Cash Flow 5,346 5,926 6,154 6,429 6,646 6,802
Discount Factor 0.00 0.89 0.79 0.70 0.62 0.55 0.43 0.30 0.19
Present Value of FCF 0 3,582 3,782 3,728 3,665 3,376 2,773 2,000 1,266
$mn $/share
Value of Cash Flows 24,172 14.85
Value from Perpetuity 23,053 14.16
Adjustments -24,472 -15.03
Implied Equity Value 22,754 14.0
Adjsted MCAp 17,129 10.5
Upside 32.8%
ources: Otkritie Capital estimates, Bloomberg
Figure 36. VimpelCom peers comparison
P/E EV/EBITDA EV/Sales
Name 2011E 2012E 2013E 2011E 2012E 2013E 2011E 2012E 2013E
VIP US Equity VimpelCom
Current multiples 7.7 6.4 5.8 4.3 3.7 3.4 1.7 1.5 1.3
vs EM Peers -50% -48% -47% -20% -27% -31% -16% -23% -28%
vs DM Peers -26% -35% -38% -11% -21% -27% 9% -4% -12%
vs MTS -30% -28% -23% -6% -13% -12% -8% -16% -16%
vs Rostelecom -35% -45% -47% -15% -18% -27% -14% -17% -22%
Sources: Otkritie Capital estimates, Bloomberg

8/3/2019 Rus Telecoms Report 2012 Otkritiye
http://slidepdf.com/reader/full/rus-telecoms-report-2012-otkritiye 23/26
VimpelCom | UPDATE | Russia | 1 February 2011
Otkritie Capital 23
Appendix: Financial forecasts
Profitability
4,000
5,000
6,000
7,000
8,000
9,000
10,000
11,00012,000
13,000
36%
38%
40%
42%
44%
46%
48%
50%52%
54%
2008 2009 2010 2011E 2012E 2013E 2014E
EBITDA margin (LHS) EBITDA,$m
Cash flows, $m
(10,000)
(8,000)
(6,000)
(4,000)
(2,000)
0
2,000
4,000
6,000
8,000
10,000
2008 2009 2010 2011E 2012E 2013E 2014E
Operating cash flow Investing cash flow
Momentum, %
0.8
0.6
0.4
0.2
0%
20%
40%
60%
80%
100%
120%
2008 2009 2010 2011E 2012E 2013E 2014E
Revenue g rowt h E PS g rowt h
Valuation
0
5
10
15
20
25
2008 2009 2010 2011E 2012E 2013E 2014E
P/E EV/EBITDA
$mn unless otherwise stated
2009 2010 2011E 2012E 2013E 2014E
Income Statement
Revenues 8,711 10,513 22,996 24,022 25,351 26,860
Depreciation 1,694 2,080 4,664 4,752 4,888 5,045EBITDA 4,273 4,932 9,437 10,098 10,657 11,426
Operating profit (EBIT) 2,578 2,852 4,773 5,346 5,768 6,380
Net Interest expense 547 484 1,659 1,549 1,394 1,168
Non-op. expenses 479 (42) 0 0 0 0
Pretax Profit 1,552 2,410 3,114 3,797 4,374 5,213
Taxes 435 606 872 1,063 1,225 1,460
Minority interest (4) 48 200 200 200 200
Net Profit 1,122 1,757 2,042 2,534 2,950 3,553
Cash Flow Statement
Net Change in work. cap. (332) 1,700 2,462 (189) (176) (265)
Provisions and write-offs (345) (31) 0 0 0 0
Other - - - - - -
Operating cashflow 2,135 5,553 9,368 7,298 7,862 8,534
Capex (892) (1,757) (4,369) (4,324) (4,056) (4,029)
Disposals (Acquisitions) (542) 410 (1,400) (50) (50) (50)
Investing cashflow (1,433) (1,347) (5,769) (4,374) (4,106) (4,079)
Equity (1,272) 368 6,162 912 1,207 1,429Debt (1,857) (1,692) 18,339 (1,597) (2,235) (3,275)
Financing cashflow (3,129) (1,323) 24,501 (684) (1,028) (1,846)
Net Change in Cash (2,427) 2,882 28,100 2,240 2,727 2,609
Balance sheet
Cash & equivalents 1,447 885 300 300 300 300
Current Assets 1,520 1,440 3,449 3,603 4,056 4,566
PP&E 4,121 10,599 12,928 12,550 11,767 10,801
Goodwill and other 4,361 7,004 7,004 7,004 7,004 7,004
Total Assets 14,733 19,928 23,681 23,457 23,127 22,671
Current Liabilities 1,601 3,222 7,693 7,658 7,935 8,180
S-T Debt 0 0 0 0 0 0
L-T Debt 7,353 5,661 24,000 22,403 20,168 16,893
Other L-T Liabilities 509 522 722 922 1,122 1,322
Shareholders Funds 4,509 10,671 11,583 12,790 14,219 16,592
Total L iabilities & Equity 14,733 20,076 43,998 43,773 43,444 42,988
Net Debt 5,906 4,776 23,700 22,103 19,868 16,593
Margins and profitability
EBIT Margin 29.6% 27.1% 20.8% 22.3% 22.8% 23.8%
EBITDA Margin 49.0% 46.9% 41.0% 42.0% 42.0% 42.5%
Net Margin 12.9% 16.7% 8.9% 10.5% 11.6% 13.2%
ROE 24.9% 16.5% 17.6% 19.8% 20.7% 21.4%
ROA 7.6% 8.8% 8.6% 10.8% 12.8% 15.7%
ROIC 17.7% 14.4% 24.3% 27.6% 31.0% 36.0%
Momentum
Revenue growth -14% 21% 119% 4% 6% 6%
EBITDA growth -3% 15% 91% 7% 6% 7%
EPS growth 114% 23% -7% 24% 16% 20%
Liquidity and solvency
Cash Ratio 0.9 0.3 0.0 0.0 0.0 0.0
Current Ratio 0.9 0.4 0.4 0.5 0.5 0.6
Interest Coverage 4.7 5.9 2.9 3.5 4.1 5.5
Debt/Equity 1.6 0.5 2.1 1.8 1.4 1.0
Debt/Total assets 0.5 0.3 1.0 1.0 0.9 0.7
Net debt / EBITDA 1.4 1.0 2.5 2.2 1.9 1.5
ValuationP/E 9.6 7.8 8.4 6.8 5.8 4.8
P/CE 3.8 3.6 2.6 2.4 2.2 2.0
P/BV 2.4 1.3 1.5 1.3 1.2 1.0
EV/Sales 2.6 2.1 1.8 1.6 1.5 1.3
EV/EBITDA 5.4 4.4 4.3 3.9 3.5 3.0
Dividend yield, (ords) 5.2% 8.2% 7.7% 8.9% 6.9% 7.3%
Dividend yield, (prefs) - - - - - -
Per Share Data
EPS - stock 1 1.09 1.35 1.25 1.56 1.81 2.18
DPS, ords 0.55 0.87 0.82 0.93 0.72 0.76
DPS, prefs - - - - - -
BVPS - stock 1 4.40 8.19 7.11 7.86 8.73 10.19
Source: Company data, Otkritie Capital estimates

8/3/2019 Rus Telecoms Report 2012 Otkritiye
http://slidepdf.com/reader/full/rus-telecoms-report-2012-otkritiye 24/26
Russian telecoms 2012 | UPDATE | Russia | 1 February 2011
Otkritie Capital 24
Disclosures appendix
Analyst certificationThe estimates analysts whose names appear on the front cover of investment research reports produced by Otkritie Securities Ltd (the ―Otkritie Capitalresearch‖) certify that: i) all of the views expressed in the Otkritie Capital research accurately reflect their personal views about the subject security or issuer,and ii) no part of the research analysts‘ compensation was, is, or will be directly or indirectly related to the specific opinions or views expressed by theresearch analysts in the Otkritie Capital research. Research analysts‘ compensation is based upon various factors including the total revenues of the group ofcompanies operating under the Otkritie Capital brand name, a portion of which are generated by investment banking activities. If the date of the OtkritieCapital research is not current, the views and contents may not reflect the research analysts‘ current thinking.
Important issuer disclosuresImportant issuer disclosures outline currently known conflicts of interest that may unknowingly bias or affect the objectivity of the analyst(s) with respect to anissuer that is the subject matter of this report.
Disclosures information is available at http://www.otkritie.com/en/about/terms_of_business/ or for a complete set of disclosures associated with the issuersdiscussed in Otkritie Capital research may be obtained by telephoning +44 20 7826 8283 or writing to: Compliance Department, Otkritie Securities Ltd, 12thFloor, 88 Wood Street, London, EC2V 7RS, UK.
Meaning of target prices and ratingsTarget prices represent the research analyst‘s expectation of absolute return on equity (forecast price appreciation derived by the valuation methodologystated at initial time of publication, and dividend yield) within 12 months.
A three-tier rating system is used for stocks under coverage, set for each stock at the initial date of publication:
Buy: target price exceeds the market price by 15%Hold: target price is within the range from -15% to +15% of the market priceSell: target price exceeds the market price by -15%.
Coverage Policy: Coverage of an issuer is updated as deemed appropriate based on developments with the subject company, sector, and/or market thatmay have a material impact on the analyst‘s published views or opinions. At times, the expected absolute returns may fall outside of the range used at thetime of setting a rating because of price movement and/or volatility. Such interim deviations are permitted and are subject to review by Otkritie Capital‘sResearch Management.
Your decision to buy or sell a security should be based upon your personal investment objectives and should be made only after evaluating the security‘sexpected performance and risk.
8/3/2019 Rus Telecoms Report 2012 Otkritiye
http://slidepdf.com/reader/full/rus-telecoms-report-2012-otkritiye 25/26
Russian telecoms 2012 | UPDATE | Russia | 1 February 2011
Otkritie Capital 25
Important noticesThis report has been produced by Otkritie Securities Limited (―OSL‖), member of the London Stock Exchange and authorised and regulated by the FinancialServices Authority (―FSA‖) in relation to designated investment business as listed under licensed permissions on the FSA‘s website. OSL is a subsidiary ofOtkritie Financial Corporation JSC, which together with other subsidiaries specialising in a full range of investment banking and prime services products, usethe brand name Otkritie Capital. These subsidiaries are not credit institutions licensed to accept deposits or other repayable funds from the public or toengage in any other business classified as banking under Russian law. Where referenced, the Otkritie-GIEP Index of financial stability was developed by andis the exclusive property of Otkritie Capital and the Gaidar Institute for Economic Policy (e-mail: [email protected]), and does not assign ratings or views to a
security or issuer. This report is for distribution only under such circumstances as may be permitted by applicable law. Additional information and supportingdocumentation is available upon request.Scope of the investment research - This report is published solely for information purposes, it does not constitute an advertisement and is not to beconstrued as a solicitation or an offer to buy or sell any securities or related financial instruments in any jurisdiction. Nothing in this report constitutes arepresentation that any investment strategy or recommendation contained herein is suitable or appropriate to a recipient‘s individual circumstances orotherwise constitutes a personal recommendation. The information presented herein does not form a fiduciary relationship or constitute advice or comprise aprospectus of securities for the purposes of EU Directive 2003/71/EC or Federal Law No. 39-FZ of 22 April 1994 (as amended) of the Russian Federation "Onthe Securities Market". Any decision to purchase securities in any proposed offering should be made solely on the basis of the information to be contained inthe final prospectus published in relation to such offering. Otkritie Capital does and seeks to do business with companies covered in its investment research.As a result, investors should be aware that Otkritie Capital may have a conflict of interest that could affect the objectivity of this report. Investors shouldconsider this report as only a single factor in making their investment decision. Otkritie Capital‘s policy for managing conflicts of interest in relation toinvestment research is published on its research portal (http://research.otkritie.com).Non-reliance disclosure - No representation or warranty, express or implied, is provided in relation to the accuracy, completeness or reliability of theinformation contained herein, except with respect to information concerning Otkritie Financial Corporation JSC, its subsidiaries and affiliates, nor is it intendedto be a complete statement or summary of the companies, issuers, securities, markets or developments referred to in the report. Otkritie Capital is under noobligation to update or keep current the information contained herein. Any opinions expressed in this report are subject to change without notice and maydiffer or be contrary to opinions expressed by other business areas or groups of Otkritie Capital as a result of using different assumptions and criteria. Theanalysis contained herein is based on numerous assumptions. Different assumptions could result in materially different results. There is no representation that
any transaction can or could have been effected at stated prices and any prices do not necessarily reflect Otkritie Capital‘s internal books and records or theoretical model-based valuations and may be based on certain assumptions. Different assumptions, by Otkritie Capital or any other source, may yieldsubstantially different results. The analyst(s) responsible for the preparation of this report may interact with trading desk personnel, sales personnel and otherconstituencies for the purpose of gathering, synthesising and interpreting market information. Otkritie Capital relies on information barriers to control the flowof information contained in one or more areas within Otkritie Capital, into other areas, units, groups or affiliates of Otkritie Financial Corporation JSC. Analystcompensation is not based on investment banking revenues, however, compensation may relate to the revenues generated by the investment bankingbusiness of Otkritie Capital as a whole, of which investment banking, sales and trading are a part.Risk warnings - Investments involve risks and investors should exercise prudence in making their investment decisions. Otkritie Capital does not undertakethat investors will obtain profits, nor will it share with investors any investment profits nor accept any liability for any investment losses. The securitiesdescribed herein may not be eligible for sale in all jurisdictions or to certain categories of investors. Options, derivative products and futures are not suitablefor all investors, and trading in these instruments is considered risky. Investments in illiquid securities involve a high degree of risk and are suitable only forsophisticated investors who can tolerate such risk and do not require an investment easily and quickly converted into cash. Foreign currency rates ofexchange may adversely affect the value, price or income of any security or related instrument mentioned in this report. The application of taxation lawsdepends on an investor‘s individual circumstances and, accordingly, each investor should seek independent professional advice on taxation implicationsbefore making any investment decision. Past performance is not necessarily indicative of future results. The value of any investment or income may go downas well as up and you may not get back the full amount invested.Disclaimer of risks associated with emerging markets - Investing in emerging markets such as Russia, other CIS countries and emerging marketssecurities involves a high degree of risk and investors should perform their own due diligence before investing. Special risks may be associated with
transactions and investments in securities and other financial products of, or related or linked to, issuers and obligors established under the laws of, orprincipally engaged in business in emerging markets countries (―Emerging Market Instruments‖). Many Emerging Markets Instruments are either unrated orare rated below investment grade. Even where rated, investments in Emerging Markets Instruments are significantly riskier than investment in othercomparably rated assets. Emerging Markets Instruments are generally subject to more economic, political, monetary, cultural and other risks, including therisk of nationalisation, exchange or capital controls, wars, acts of God and other force majeure and other events or crises that could yield a total or near-totalloss on investments.Transactions and investments in Emerging Markets Instruments should be made only by investors with sufficient ability to appreciate the special risks, and theresources bear any losses that may be incurred in such markets. Before making any investment in an Emerging Markets Instrument, investors shouldindependently satisfy themselves that they understand and appreciate the significance of the relevant risks, and that such an investment is appropriate andsuitable for the investor in light of their objectives, experience, financial and operational resources, and other relevant circumstances. The investor shouldalso ensure that they fully understand the nature of the transaction and contractual relationship into which they are entering and the nature and extent of theirexposure to risk of loss.Limitation of liabilities - Neither Otkritie Capital nor any of its affiliates, nor their directors, employees or agents accepts any liability for any loss or damagearising out of the use of all or any part of this report. Unless specifically disclosed where Otkritie Capital has expressed a commitment to provide continuousresearch coverage in relation to an issuer or an issuer‘s securities, Otkritie Capital (excluding Otkritie Inc.) may act or have acted as a market maker orliquidity provider in the financial instruments of the issuer or issuers described in this report. Excluding significant beneficial ownership of securities whereOtkritie Capital has expressed a commitment to provide continuous research coverage in relation to an issuer or an issuer‘s securities, Otkritie Capital and itsaffiliates and employees may have long or short positions, trade as principal or as agents and buy and/or sell, or offer to buy and/or sell, instruments or
derivatives identified herein.Restrictions on reproduction and re-distribution - Otkritie Capital specifically prohibits the redistribution of this material in whole or in part without thewritten permission of Otkritie Capital and accepts no liability whatsoever for the actions of third parties in this respect. Images may depict objects or elementsthat are protected by third party copyright, trademarks and other intellectual property rights. © Otkritie Securities Limited 2012. All rights reserved.Disseminating legal entitiesEEA States including United Kingdom: Except as otherwise specified herein, this material is communicated by Otkritie Securities Limited, authorised andregulated by the Financial Services Authority, to persons who are eligible counterparties or professional clients and is only available to such persons. Thismaterial is not intended to be distributed or passed on, directly or indirectly, to any other class of persons. The information contained herein does not apply to,and should not be relied upon by, retail clients as that term is defined under MiFID Directive 2004/39/EC.Russia: Distributed by the Moscow representative office of Otkritie Securities Limited.United States: Initial distribution by Otkritie Securities Limited (―OSL‖), a “non-US affiliate” of Otkritie Inc., under Rule 15a-6 promulgated under the USSecurities Exchange Act of 1934, to major US institutional investors only, where OSL believes the recipient may have an interest in the information containedherein. Such distribution is not an inducement to purchase or sale any security with Otkritie Inc. or its non-US affiliates. Any subsequent re-distribution byOtkritie Inc., a US broker-dealer regulated by the US Securities and Exchange Commission and a member of FINRA, to US persons. When re-distributed byOtkritie Inc., Otkritie Inc. accepts responsibility for the content of this report prepared by the non-US affiliate although Otkritie Inc. did not contribute to thepreparation of this report and research analysts contributing to this report are not employed by, and are not associated persons of, Otkritie Inc. and are notregistered/qualified as research analysts with FINRA and therefore are not subject to the restrictions contained in the FINRA rules on communications with a
subject company, public appearances, and trading securities held by a research analyst account. Among other things, this means that the non-US affiliateproducing this report and the analysts authoring this report are not subject to all the disclosures and other US regulatory requirements to which Otkritie Inc.and its employees and associated persons are subject. All transactions by a US person in the securities mentioned in this report must be effectedthrough Otkritie Inc. and not through a non-US affiliate. Contact: Otkritie Inc., 1350 Avenue of the Americas, New York, NY 10019,telephone: +1 (212) 796 1550.

8/3/2019 Rus Telecoms Report 2012 Otkritiye
http://slidepdf.com/reader/full/rus-telecoms-report-2012-otkritiye 26/26
www.otkritie.comBloomberg: OTKR
RESEARCH
Alexander BurganskyHead of [email protected] +7 (495) 213 1825
Equity Research Fixed Income Research
Vladimir SavovHead of Equity [email protected]+7 (495) 213 1826
Vadim SobolevskiHead of Fixed Income [email protected]+44 (20) 7826 8211
Strategy
Tom [email protected]+7 (495) 213 1833
Taryn [email protected]+7 (495) 777 5656 (x4307) Economics
Vladimir [email protected]+7 (495) 213 1829
Polina [email protected]+7 (495) 777 5656 (x4663)
Oil & Gas
Alexander Burgansky
[email protected] +7 (495) 213 1825
Vadim [email protected]+7 (495) 213 1828
Tatyana [email protected]+7 (495) 777 5656 (x4717)
Roman [email protected]+7 (495) 777 5656 (x4487)
Financial Services
Vladimir [email protected]+7 (495) 213 1826
Olga [email protected]+7 (495) 777 5656 (x4395)
Metals & Mining
Robert [email protected]+7 (495) 213 1832
Denis [email protected]+7 (495) 213 1831
Utilities
Sergey [email protected]+7 (495) 213 1835
Telecommunications, Media,Technology
Alexander [email protected] +7 (495) 213 1830
Consumer, Real Estate
Mikhail [email protected]+7 (495) 213 1834
Yury [email protected]+7 (495) 777 5656 (x4486)
Transportation
Irina [email protected]+7 (495) 777 5656 (x4294)
Chemicals, Industrials,Infrastructure
Alexander Churikov
[email protected]+7 (495) 777 5656 (x4435)
Fixed Income Strategy
Vadim [email protected]+44 (20) 7826 8211
Evgeniy [email protected]+7 (495) 777 5656 (x4331)
Credit Research
Corporate CreditDmitry [email protected]+44 (20) 7826 8205
Nargiz [email protected]+7 (495) 777 5656 (x4397)
Sovereign CreditMaxim [email protected]+7 (495) 777 5656 (x4340)
Quantitative Research
Gareth [email protected]+44 (20) 7826 8255


![Q1 2012 MARKETBEAT REPORT | ОТЧЕТ ЗА 1 КВАРТАЛ 2012 [ENG/RUS]](https://static.fdocuments.in/doc/165x107/5480509bb4af9faa158b5cba/q1-2012-marketbeat-report-1-2012-engrus.jpg)
![Q4 2012 Marketbeat [ENG/RUS]](https://static.fdocuments.in/doc/165x107/545ba19ab1af9f7d298b4574/q4-2012-marketbeat-engrus.jpg)


![Philippines Telecoms and CATV Industry Overview for 2012 [Compatibility Mode]](https://static.fdocuments.in/doc/165x107/55c35f91bb61eb686f8b4894/philippines-telecoms-and-catv-industry-overview-for-2012-compatibility-mode.jpg)


![Marketbeat 2012-2013 [RUS/ENG]](https://static.fdocuments.in/doc/165x107/55d4f451bb61ebe16b8b46f6/marketbeat-2012-2013-ruseng.jpg)