
Rural wages in Asia - Overseas Development Institute · PDF fileRural wages in Asia Steve...
49
Rural wages in Asia Steve Wiggins and Sharada Keats Report October 2014
Transcript of Rural wages in Asia - Overseas Development Institute · PDF fileRural wages in Asia Steve...

Rural wages in AsiaSteve Wiggins and Sharada Keats
Report
October 2014

Overseas Development Institute203 Blackfriars RoadLondon SE1 8NJ
Tel. +44 (0) 20 7922 0300 Fax. +44 (0) 20 7922 0399 E-mail: [email protected]
www.odi.org www.odi.org/facebook www.odi.org/twitter
Readers are encouraged to reproduce material from ODI Reports for their own publications, as long as they are not being sold commercially. As copyright holder, ODI requests due acknowledgement and a copy of the publication. For online use, we ask readers to link to the original resource on the ODI website. The views presented in this paper are those of the author(s) and do not necessarily represent the views of ODI.
© Overseas Development Institute 2014. This work is licensed under a Creative Commons Attribution-NonCommercial Licence (CC BY-NC 3.0).
ISSN: 2052-7209
Cover photo: © World Bank Photo Collection: Rice fields in Mai Chau, Vietnam

October 2014
developmentprogress.org
• RuralwagesarerisingacrossmuchofAsia,andinsomecaseshaveacceleratedsincethemid2000s.
• Thetwomaindriversareaslow-downinthegrowthoftherurallabourforce,probablymainlyfromlowerfertilityrates,andthegrowthofmanufacturingthatattractsworkersfromruralareas.
• MostpeopleonverylowincomesinAsiaworkinagriculture:risingwagespromisetoliftmostofthemoutofextremepoverty.
• Higherruralwagesaredrivingupthecostoffoodproduction,therebycreatingopportunitiesforothercountriestoexporttoAsia.
• Theyalsocontributetohigherwagesinmanufacturing.AscostsriseinChina,forexample,itislikelythatsomeplantswillrelocatetolow-incomeAsiaandtoAfrica.
Key messages
Report
Shaping policy for development odi.org
Rural wages in AsiaSteve Wiggins and Sharada Keats

Contents
Abbreviations 5
Acknowledgements 5
Executive summary 6
1. Introduction: aims of this study 8
1.1 Motivation for this study 9
1.2 Questions posed 9
2. Background: influences on rural wages 10
2.1 Theories of rural wage formation 11
2.2 Recent studies of changing wages in rural Asia 12
2.3 Summary 19
3. Study approach, data and methods 20
3.1 Research questions 21
3.2 Approach 21
3.3 Data sources 23
4. Results 27
4.1 Description of key variables 28
4.2 Causes of changes in rural wages 28
5. Conclusions and implications 40
5.1 Discussion of findings 41
5.2 Implications 41
References 43
2 ODI Report

Rural wages in Asia 3
Figures
Figure A: Changes in real daily wages for agricultural labour (US$ constant 2010 PPP) in four Asian countries 8
Figure 1: Bangladesh, agricultural wages, real, 1950-2006 12
Figure 2: Bangladesh, urban and rural wages, deflated by the general consumer price index, 2001-2011 13
Figure 3: China, population by age and sex, 2010 14
Figure 4: China, workforce, 1950-2050 14
Figure 5: India, real wage rates of rural casual labourers in India, 1983, 1987/88, 1993/94 and 1999/2000 at 1999/2000
prices 15
Figure 6: India, average farm wages, constant at 2011/12 prices, 1990/91 to 2011/12 16
Figure 7: India, sector-wise distribution of employment, 1983-2009/10 16
Figure 8: Indonesia, real agricultural wage rate in Java, 1983-2009, rupiah a day 18
Figure 9: Most populous Asian developing countries east of the Khyber Pass and south of Central Asia 22
Figure 10: Pathways to urbanisation in selected Asian countries, 1980/82-2010/12 23
Figure 11: Agricultural wage changes, 13 Asian countries, early and late 2000s, average annual rates 32
Figure 12: Changes in the gender wage gap in four Asian countries 33
Figure 13: Changing agricultural labour productivity, 12 Asian countries, 1995-2012, gross value production per worker,
constant US$ 2004/06 34
Figure 14: Average annual growth rate of agricultural labour productivity, 12 Asian countries, 1997-2004 and 2005-2012
34
Figure 15: Changes in value of manufacturing across 12 Asian countries, 1995-2012 35
Figure 16: Average annual growth rate of manufacturing in 12 Asian countries, 1997-2004 and 2005-2012 36
Figure 17: Changing rural working population, 12 Asian countries, 1995-2012 37
Figure 18: Average annual growth rate of rural working population in 13 Asian countries, 1997-2004 and 2005-2012 38
Figure 19: Changes in rural wages compared with those for agricultural labour productivity, manufacturing and rural
workers over two periods 38

Tables
Table 1: Population, proportion rural and agriculture’s contribution to GDP 22
Table 2: Description of data and sources on rural wages by country 24
Table 3: Time spans covered by data 25
Table 4: Data on key variables influencing rural wages and sources 26
Table 5: Real rural wages and changes for 13 Asian countries, 1995/96-2013 29
Table 7: Multivariate regression of changes in rural wages 39
Table 6: Correlation matrix between variables 39
Boxes
Box 1: Varying transitions from agrarian to industrial economies 21
4 ODI Report

AbbreviationsBBS Bangladesh Bureau of Statistics
CCAP Centre for Chinese Agricultural Policy
CPI Consumer Price Index
FAOSTAT Food and Agriculture Organization Statistical Service
GDP Gross Domestic Product
ILO International Labour Organization
IRRI International Rice Research Institute
ISIC International Standard Industrial Classification
LSMS Living Standards Measurement Study
MGNREGA Mahatma Gandhi National Rural Employment Guarantee Act [India]
PPP Purchasing Power Parity
RMG Ready-Made Garment
UN United Nations
UNDESA UN Department of Economic and Social Affairs
UNDP UN Development Programme
Acknowledgements
Rural wages in Asia 5
WearegratefulforhelpfulcommentsprovidedbypeerreviewersProfessorRickBarichelloandAndrewNorton.OurthanksalsotoDrFutoshiYamauchiforsharingdataonIndonesianwages.
ThisreporthasbeenproducedbyODIaspartoftheproject‘Shockwatch:ManagingRiskandBuildingResilienceinanUncertainWorld’,supportedbytheUKDepartmentforInternationalDevelopment(DFID).

Executive summaryRuralwagesindevelopingcountriesmatter.Ruralwagesnotonlydirectlyaffectthewelfareofmanyofthe(very)poor,butalsoaffectthewelfareofothersthroughtheirimpactoncostsoffoodproductionandhencefoodprices.Sincemanufacturinginlow-incomecountriesoftenrecruitslabourfromthecountryside,ruralwagessettheminimumleveloffactorywagesnecessarytoattractlabour,andhencecostsofproductionandtherebythegrowthofmanufacturing.
ReportsindicatethatruralwagesinpartsofAsia,incountriessuchasBangladesh,ChinaandIndia,havebeenrisingsincethemid-2000s,andprobablyatafasterratethanbefore:SeeFigureA.Hencethisstudy:tocheckhowruralwagesarechangingforothercountriesin(East,SouthandSoutheast)Asia;tolookatpotentialcauses;andtoconsidertheimplications.Specifically,thefollowingquestionsareposed:
• What trends can be seeninruralwagesinAsiaduringthe2000s?Howmuchisthereacommonpatternacrosstheregion?
• What factors are driving the increases seen?Aboveall,dotheystemfromincreasedagriculturalproductionandproductivity,fromchangingdemography,orfromurbanisationandindustrialisation?Towhatextentdotheyreflectpublicpolicysuchasminimumwagesandpublicemploymentschemes?Whatmaybeexpectedintermsoftrendsinruralwagesoverthenextfivetotenyears?
• Ifruralwagesarerising,thenwhat are the implicationsforruraldevelopmentandpoverty,forfoodpricesandfoodsecurityandforeconomicgrowth,bothinAsiaandinotherpartsofthedevelopingworld?
Ruralwagescanbeseenasinfluencedprimarilybysupplyanddemandinlabourmarkets–albeitwithimperfections–orasonesideofadualeconomy,wherelabourinatraditional(largelyrural)economyworksatlowproductivity,separatedfromthelabourmarketsofamoreproductivemodernsector.DualismmayhavecontributedtoAsianindustrialisationbyprovidingapoolofverycheaplabourfromthecountryside,butincreasinglyprobablydoesnotapplyinthe2000s.
Recentliterature,bothdescriptiveandanalytical,reportssimilarfindingsinseveralcountriesofAsia:
• InBangladesh,China,IndiaandIndonesia,ruralwagesarerising,apparentlyfasterinthesecondhalfofthe2000sthanbefore.
• Growthinmanufacturingandjobsoffthefarm,especiallyconstructionincities,isdrawinglabouroffthefields.
• ForChina,atleast,thepullofthecityiscoincidingwithreductionsinthelabourforceasthelowfertilityofthepast30yearscomesintoplay.
• Itislesscleartowhatextentthegrowthoftheruralnon-farmeconomyorincreasesinagriculturalproductivityhaveledtoincreaseddemandforlabourinruralareas.
• Althoughpublicemploymentprogrammesmaycontributetohigherruralwages,theymaynotdrivethemasstronglyaseconomicgrowth.Thatsaid,theIndianMahatmaGandhiNationalRuralEmploymentGuaranteeAct(MGNREGA)schememaybedisproportionatelyvaluabletofemaleworkersandtothoseineconomicallylaggingregions.
Dataonruralwages,agriculturallabourproductivity,growthofmanufacturingandruralworkingpopulationwerecollectedfromsecondarysourcesforthe13mostpopulouscountriesofEast,SouthandSoutheastAsia,forthe2000s.Ruralwageserieswereincompleteinseveralcases,soonlyforsixcountrieswasitpossibletolookatchangesinwagesintheearlyandlate2000s.
ResultsRural wagesroseinthe2000sinalmostallcasesobserved.Inseveralcountries,includingChinaandIndia,theriseacceleratedfromthemid-2000s.Forexample,inBangladesh,theaverage(male)ruralwageroseinrealtermsby45%between2005and2010,inIndiaby35%between2005and2012andinChinaby92%between2003and2007.Similartrendscanbeseenforothercountrieswheredataareavailable,suchasIndonesiaandVietnam.
Despitegrowth,levelsofpaystillremainedlowintheearly2010s,withfewcountriesseeingmorethan$5adaypaid.Ruralwagesforwomenwereinmostcasesbetweenaquarterandone-thirdlessthanthosepaidtomen,althoughinmostcountriesthegaphasnarrowed.
Forpotentialdriversofruralwages,thefollowingpatternswereseen:
• Agricultural labour productivityroseinallcasesexceptPakistaninthe2000s,inmostcountriesfasterinthelatterhalfofthedecade,withsevencountriesseeingaveragegrowthof2.5%ayearormore.
• Manufacturing outputgrewrapidlyacrossmostoftheregioninthe2000s.Growthofmanufacturingacceleratedbetween1997-2004and2005-2012forChina,India,Indonesia,Bangladesh,thePhilippinesandSriLanka.Infivecases,growthslowed,althoughfortheRepublicofKoreaandVietnamratesremainedhigh.
• Inthemid-1990s,rural working populationsroseinallcasesotherthantheRepublicofKorea.By2012,numberswerefallinginChina,Malaysia,ThailandandSriLanka–withIndonesiarisingslightlyafterseveralyearsoffalls.Inthesecases,aturningpointhasbeenpassed.Anothergrouphasseenruralworking
6 ODI Report

populationrisingthroughouttheperiod:Burma/Myanmar,Philippines,VietnamandSouthAsia.
Whatexplainschangesinruralwages?Across-countryregressionsuggestsruralwagesriseasruralworkingpopulationsdecline,andasmanufacturingoutputgrows.Changesinagriculturallabourproductivitymaybeassociatedwithhigherwages,buttheestimateprovedinsignificantandlowinthepresenceofthesetwomaindrivers.Asmallbutsignificanttimeshiftersuggestswagesgrewfasterinthesecondhalfofthe2000s,independentlyofchangeinothervariables.
Demographyplaysasignificantrole,moresothanmighthavebeenexpected.Indeed,thelargestdifferencesbetweencountriesariseintheruralworkingpopulation,withasharpdistinctionbetweenthosecountrieswheretheruralworkforceisnowshrinkingandthosewhereitcontinuestoincrease.Changesinruralworkingpopulationmaybethesinglemostpowerfuldriver,but,sincemigrationisincorporatedwithinthevariable,itisnotapurelyexogenousdriver.Asmanufacturinggrows,itisexpectedthatsomefactoryworkerswillberecruitedfromthecountryside,sothemigrationcomponentislinkedtomanufacturing.
ImplicationsWillruralwagesinAsiacontinuetoincreaseinthefuture?Theywillifthetwomaindriverscontinuealongrecenttrendsintothefuture.Fallingfertilityratessincethe1970sacrossAsiamoreorlesslockinreducedruralpopulationsforthefuture,anditishardtoimaginethatmanufacturingwillceasetogrow.Hence,itseemsruralwagescanbeexpectedtoriseinthefuture.
Thiscouldhaveprofoundimplicationsforpoverty,agricultureandfoodpricesandmanufacturing.
Rising rural wages will put a floor to low rural incomes–atleastforthoseabletowork–and,indeed,probablytoincomesthroughouttheeconomy,sinceruralwageshavetendedtomarkthelowestreturnstolabouronoffer.Hence,risingruralwagesshouldgreatlyreducepovertyformosthouseholdsthathaveworkingmembers.Thatsaid,ruralwagesinmanycountriesarestilllowandneedtorise–perhapstodoubleinsomecases–beforehouseholdsthatdependonthemcanescapepoverty.
Rising rural wages will push up costs of production in agriculture–alreadyincreasedbytheeffectofhigheroilpricesseensince2007–andspuronmechanisationforthosetaskswheremachineryischeaperthantheincreased
costofmanualoperations.Thatmayleadtolargerfarmsizesaswell.Asianfoodpriceswillrise,limitedtosomeextentbythepossiblelowercostofimportsfromtheworldmarket–moderatedbythewillingnessofgovernmentstoallowimportsofcheapfoodthatmightthreatenfarmers’incomes.Risingfoodpricesthreatenaccessofthoseonlowincomestofood,but,giventhateventhoseonlowincomesdonotspendalltheirincomesonfood,thebenefitofhigherwagesshouldoutweighthehardshipofhigherfoodcosts.
Perhapsthemost intriguing implication is for manufacturing.Asruralwagesrise,somanufacturingwageswillhavetoincreasetorecruitnewworkers.ThiseffectisalreadybeingseenstronglyinChina,wherebothphenomenaarelinkedtoanationalworkforcethatisnowshrinkingeveryyear.Manufacturershavetwooptionsastheircostsrise:tomechaniseandtherebyeconomiseonlabour;ortorelocatetoregionsandcountrieswithlowerlabourcosts.Giventhescaleofitsmanufacturing,China’sdecisionswillbecritical.Ifthemostfrequentanswerisrelocation,thenitislikelythatplantsincoastalChinawillnotonlymoveinlandtolessprosperousareaswithlowerwages,butalsorelocateoutsideofChina.NeighbouringcountriesinAsiawithlowwagesmaybethefirsttobenefitfromthis,withBangladesh,Burma/Myanmar,CambodiaandVietnamclearcandidates.
Thereis,however,afurtherprospect:thatofcompaniesmoving to Africainsearchoflowerwages.TheWorldBankreportsEthiopianfactorywagesforunskilledlabourasbeingone-quarterthoseofChinesewages.Logisticscostsarehigher,butoverallcostsarelower.OutsideAddisAbaba,thefirstpioneerwaveofrelocatedChineseplantscanbeseen.Nowthesehavebrokentheice,howmanymorewillfollow?Lin(2014,inWonacott,2014)speculatedthat85millionfactoryjobscouldleaveChinainthecomingyears.IfhalfofthosecametoAfrica,itwouldtransformacontinentwherethereisasurgeinyouthenteringthelabourmarket.Ofcourse,relocationtoAfricawillonlyhappenifroads,powersuppliesandportsareadequateandifthereispoliticalstability.
Africa’seconomicunderperformancehassincethe1970sbeenfargreaterinmanufacturingthaninfarming.Iftherightconditionscanbecreated,renewedgrowthofmanufacturinginAfricaledbyAsianindustrialistspromisesprosperousurbanisationwithvibrantmarketsforthosefarmersstayingontheland.Thatwouldbewelcomenewsallround,includingforagriculture.
Rural wages in Asia 7

Figure A: Changes in real daily wages for agricultural labour (US$ constant 2010 PPP) in four Asian countries
6.17
7.62
14.66
6.84 6.9
9.34
6.05 6.05
8.76
4.6
5.72
7.34
4
5
6
7
8
9
10
11
12
13
14
15
1998 2003 2007 2000/01 2005/06 2012/13 2000 2005 2010 1995/96 2003/04 2010/11
China, 5 province average India, national Bangladesh, national, peak season Nepal, national
US$,
con
stan
t 201
0, P
PP
8 ODI Report

1. Introduction: aims of this study

1.1 Motivation for this studyRural wages matter in developing countries …Ruralwagesinthedevelopingworldmatter:manyofthepoorestpeopledependonthemtosomedegree.Itisstillthecasethatthemajorityoftheworld’spoor—perhapsasmanyas75%,andespeciallythosewithincomesbelowextreme-povertylevelsof$1.25aday–liveinruralareas.Forexample,inIndiain2009/10,39%oftheruralworkforcedependedoncasuallabouring–upfrom36%in1993/94(AlhaandYonzon,2011).Thismayunderstatethenumbersthatdependoncasualwork:therearealsothosewhoareself-employed,butinoccupationssuchasbarberingorcollectingfirewood,wherethefeepaidistantamounttoawage.Levelsofrural(unskilled)wagesthusheavilyaffectpovertyinruralareas.
Moreover,ruralwagelevelsaffectthecostsofagriculturalproduction–aboveallthoseofgrowingfood–andthereforehaveanimpactonfoodprices.Notonlydofoodpricesmatterforthewelfareofthoseonlowincomes,butalsofoodpricesaffectthewagesofferedinindustryandservices.Simplytoensureworkersarefedwellenoughtowork,mostfactoryownerswillbereluctanttopaywagesbelowthelevelatwhichstaffcanaffordtoeat1.However,thescopebothtosubstitutemachineoperationsforlabouronfieldsandtoimportfoodatlowercostthanusingdomesticsuppliesmoderatestheinfluenceofruralwagesonfoodprices.
Lastly,forlow-incomecountriessomeoftheworkersformanufacturingandserviceswillcomefromtherurallabourforce.Henceruralwagesmarktheminimumwagesthathavetobepaidinthesesectors.Henceruralwagesinfluencecostsofmanufacturingandwiththistheprospectsforgrowthofthatsector.
… and in Asia they are risingReportsindicatethatruralwagesinpartsofAsia,incountriessuchasBangladesh,ChinaandIndia,havebeenrisingsincethemid-2000s,andprobablyatafasterratethanbefore.
Ifthisrepresentsatrend,ratherthananexceptionalshort-livedincrease,andespeciallyifthesameweretoapplytoothercountriesoftheregion,theimplicationsfordevelopmentinAsiaandevenbeyondAsiawouldbelittleshortofmomentous.Hence,thisstudyaimstoreviewchangeinruralwagesinAsiaduringthe2000s,investigatethecausesofchangesandconsidertheimplications.
ThestudyhereisrestrictedtoAsia,sinceeconomicgrowthhasbeenstronginmostcountriesthereoverthepastfourormoredecades,anditisthecontinentwhere
thetransitionfromagrariantoindustrialsocietiesismostevident.WithinAsia,theparticularfocusisonEast,SouthandSoutheastAsia:experiencesinCentralandWestAsiahavelessincommonwiththoseoftherestofcontinent.
1.2 Questions posedThisstudyaddressesthefollowingquestions.
• What trends can be seeninruralwagesinAsiaduringthe2000s?Howmuchisthereacommonpatternacrosstheregion?
• What factors are driving the increases seen? Aboveall,dotheystemfromincreasedagriculturalproductionandproductivity,fromchangingdemographyorfromurbanisationandindustrialisation?Towhatextentdotheyreflectpublicpolicysuchasminimumwagesandpublicemploymentschemes?Whatmightbeexpectedfortrendsinruralwagesoverthenextfivetotenyears?
• Ifruralwagesarerising,thenwhat are the implicationsforruraldevelopmentandpoverty,forfoodpricesandfoodsecurityandforeconomicgrowth,bothinAsiaandinotherpartsofthedevelopingworld?
Thesearesubstantialquestions,castmoreoveracrossalargecontinentwithdiversecountryexperiences.Toanswerthemfullywouldtakefarmoretimeandfundsthanwehadforthisstudy.Hence,thisreportisexploratory.Aswillbeapparent,theevidencecanbeinterpretedtogiveacompellingaccount,althoughquitewidemarginsofconfidenceapplytosomefindings.Thismeansthat,whilewecanbereasonablyconfidentofthetrendsandtheirdrivers,wearelessconfidentoftheexactdegreeoftherelationsobserved.
Restrictingobservationstooneortwocountrieswouldhaveallowedformoreprecision,butalsowouldhavelimitedthegeneralityofthefindings,leavingdoubtsthatthecountrieschosenwereexceptionalinsomerespects.
Therestofthisreportisarrangedasfollows.Section2reviewssomeexistingliteratureonruralwagesinAsia,toidentifychangesandfactorsthatmayexplainthem.Section3reportsontheapproachtaken,datausedandanalysescarriedoutinthisstudy.Results,bothdescriptiveandanalytical,appearinSection4.Section5concludes,withconsiderationofthepotentialimplicationsfordevelopmentbothinAsiaandfurtherafieldinthedevelopingworld.
Rural wages in Asia 10
1 Thisisthe‘efficiencywage’hypothesis:payingmoretoworkersonverylowwagessotheycanbebetternourishedleadstoadditionalproductivitythatexceedsthecostofincreasedwages.
10 ODI Report

2. Background: influences on
rural wages

2.1 Theories of rural wage formationIdeasaboutruralwageformationfallintotwobroadcamps:oneseeswagesastheoutcomeofdemandandsupplyoperatinginrelativelyfreemarkets;theotherseesrigiditiesofinstitutionsandlocationsthatcanleadtooutcomessignificantlydifferenttothoseexpectedfromamarketanalysis.
A market approachDemandforlabourisderivedfromthescaleofproductionandthereturnstolabourinproduction.Thislatterinturndependsonthemarginalphysicalproductivityoflabour,comparedwiththeproductivityofotherfactorsofproductionsuchasmachineryorland(inthecaseofagriculture)andthecostofthosefactors.Hence,demandforlabourshouldriseifi)productionincreasesandii)labourproductivityrises.Iftheeconomicreturnstootherfactorsrise,becauseeithertheirphysicalproductivityincreasesortheirunitcostsfall,thiswilltendtodepressthedemandforlabour,asincreasedproductioncanbeachievedbytheiruse.
Intheshortterm,productivityofallfactorsmaynotchangemuch,sodesiredlevelofproductionbecomesthemainelementofdemand.Inthelongerrun,alltheseelementscomeintoplay.
Supplyoflabourinruralareasisafunctionof:
• Growthofruralpopulation,dependinginlargepartonfertilityandthemortalityofminors;
• Migrationoutofruralareas,eithertocitiesoroutofthecountry.Someruralareas,usuallythosewithhighlyproductivefarming,mayseemigrantsarrivingfromotherruralareas;
• Prevailingnormsregardingparticipationintheworkforce.Theseincludetheageatwhichyouthenterthelabourmarketandtheelderlyleaveit,andtheextenttowhichwomenworkoutsideofthehomeandthejobsseenassuitableforthem;and
• Costofliving:iflocalwagesfallbelowsomeacceptablecostofliving,peoplemayeitherworklessorelseworkwithresentmentthatmaymanifestitselfinprotestandsabotage.
Thismodelassumesmarketsworkwellandthattherearemanyemployersofferingjobs,manyworkersseekingthemandplentyofinformationtoparticipantsongoingwagelevels.Inreality,andevenincaseswherelabourmarketscomeclosetothisideal,wagedeterminationisusuallycomplicatedbythefollowingfactors:
• Bargainingabilitiesmayaffectwages.Monopolypowermaybeexercisedtosomedegreeonbothsidesofthemarket,byemployers—forexampleinavillagewherea
landlordorasmallcabaloflandlordsdominatesthejobsmarkets—orbyworkersunionisedtonegotiatecollectively.
• Wages may be ‘sticky’:theydonotimmediatelyadjusttochangesindemandandsupply.Whendemandforlabourfalls,orsupplyincreases,wagesmaynotfall,astheremaybesocialreluctancetocutthemorbecauseworkersareoncontractsthatcannotberevisedintheshortterm.Whendemandpicksup,orsupplyfalls,andespeciallywhenthiscorrespondswithrisingcostsofliving,itmaytaketimeforwagestocatchup–owingpartlytosocialexpectationsofwhatafairwageisandpartlytowagebargainingsometimesbeingepisodic.Stickinessalsorespondstoimperfectinformation:itcantaketimeforbothemployersandemployeestoappreciatechangedconditionsinthemarket.Stickiness,however,isperhapslesslikelyinthelargelyinformallabourmarketsofruralareas,wherewagesmayadjustrapidlytochangedconditions.Ruralwagesmayappearinflexiblewhenworkerstakeintoconsiderationwhattheymightearnfrommigrationandhencerefusetoworkforlessthanthisreservationwage.Somewagedifferencescanbeexplainedonlybysocial relations and expectations.Themostprominentexampleconcernswomen,whotendtobepaidlessthanmen,evenwhereskillsandlabourproductivityareequivalent,owingtotraditionandgenderdiscrimination2.Suchdiscriminationmayalsoaffectthewagesofothergroups,includingtheelderly,thedisabledandthosebelongingtoanyothergroupstigmatisedbylanguage,class,creed,raceetc.
Labour market dualism Dualismpositstwosectors–amodernandatraditionalsector,thelatteroftenseenassynonymouswithsmallholderagriculture.Themodernsectorhashigherlabourproductivitythanthetraditionalsector.Indeed,inthelatter,labourproductivitymaybesolowthat,evenifnotzero,wagespaidmayexceedthemarginalvalueproductoflabour—sincealivingwagehastobepaid.Imagineahouseholdthatworksasmallfarm,sosmallthatthemarginaladditionsoflabouryieldverylittle,withnoopportunitiestoworkoffthefarm.Thehouseholdheadallocatestaskstothevariousmembersofthehousehold,butwhenitcomestorewardingthemtheyallgetthesamefoodandotherrewards.Thetraditionalsectorthusbecomesareserveofunder-employedlabour.Thetwolabourregimesexistinparallel,operatingtodifferentlogics.Distancefromvillagestocitieswithmanufacturingplantsfurtherprevents,oratleastdelays,integrationofthetworegimes,asmaydifferencesintheskillsoffarmlabourersandthoserequiredinfactories.
ThisconceptbecamethebasisforLewis’(1954)modelofdevelopmentwithunlimitedsuppliesoflabour.
2 AsignificantgendergapinwagesexistsinAsiaandthePacificcountries,withwomentendingtoearn54-90%ofwhatmenearn(DasguptaandKim,2011,citingUNDP,2010).
12 ODI Report

Rural wages in Asia 13
Amodernsectorsuchasmanufacturingcouldattractlabourfromthetraditionalsectoratarelativelylowwage:thiswouldallowmanufacturingtoproduceatlowcostwithprofitssufficientforhighlevelsofreinvestmentandhencerapidgrowth.Transfersoflabourwouldcostthetraditionalsectorlittle:indeed,withsomereorganisationandperhapsaccesstocapital,productivitycouldrisetocoverthelossoflabour(Ranis,2012).Hence,theeconomycouldgrowveryquickly,asthemodernsectorexpands,employinglabouratlowcostfromthetraditionalsectoruntilthelaboursurplusisexhausted.Thispoint,wherethemarginalvalueproductoflabourinbothsectorsshouldbeequalised,hasbeencalledthe‘Lewisturningpoint’.
Ranis(2012)hasaddedthepossibilitythat,althoughinitiallywagespaidinthetraditionalsectorexceedmarginalproduct,asagriculturaldevelopmenttakesplaceandlabourproductivityrisesfarmwageslagandfallbelowthemarginalvalueproductoflabour.TheyonlystarttocatchupastheLewisturningpointnears.
AlthoughLewis’smodelhasbeenquestionedandmodified–see,forinstance,Ho(1972),Jorgenson(1967)ormorerecentlyFields(2004)–itseemstodescribetheconditionsofAsianindustrialisationinthelastquarterofthe20thcentury.Chinainparticularhasbeenabletorecruitlabourformanufacturingatlowcostfromruralareaswhereworkersonverysmallfarmshadlowmarginalproductivity.Atleastthisiswhatapplieduntilthemid-2000s,whenitseemsChinamayhavestartedtoapproachtheLewisturningpoint.
Theextentofdualismisindebate:ruralhouseholdsusuallyhavemorethantheirfarmsonwhichtodeploylabour–non-farmsharesoffarmhouseholdincomesareoftenfoundtobe40%ormore.Hence,theLewismodelmayapplyonlyintheveryearlystagesofdevelopment,whenruralareasaredifficulttoaccess,whenlittlecapitalisavailable,soreturnstorurallabourareverylow.Butasdevelopmenttakesplaceandruralareasarebetterconnectedtocities,asmorecapitalbecomesavailableandasalternativestoworkingonfarmsmultiply,thendualismrecedesandlabourmarketsmaybegintoworkasexpected.Inthe2000s,functioninglabourmarketsmayexplainbetterwhatisobserved,whileelementsofdualismhelpexplainpreviousdevelopments.
Public policyPublicpolicycanalsoinfluenceruralwages.Someofthemorepertinentpoliciesthatmightaffectruralwagesincludethefollowing:
• Legislatingminimumwages,althoughtheyarenotoriouslydifficulttoenforceinthelargelyinformalworkplacesofruralAsia;
• Publicworksemploymentschemes,whichcanprovideafloortoruralwages;
• Legislationtoimproveruralworkingconditions,whichmayhavetheeffectofraisingcostsofemploymenttoemployers
andhencereducedemand.Thesameappliestopayrolltaxes,althoughtheseusuallyapplyonlytoformaljobs.
Byandlarge,itisnoteasyforpolicytoaffectruralwagesdirectly,sincesomuchruralemploymentisself-employmentorcasualhiring,bothunderinformalarrangementsthattakesplaceoverlargeandsometimesremoteareaswherethestatelacksthecapacitytoact.
2.2 Recent studies of changing wages in rural Asia
Bangladesh Lookingbackoverthelongertermfromtheperspectiveofthelate1990s,Palmer-JonesandParikh(1998)reportthatagriculturalwages,deflatedbythepriceofrice,fellbetweenthelate1940sandtheearly1970s,thenrosethroughthe1980sand1990s.Theyfoundthisrisetobeassociatedwithincreasesinbothrealmanufacturingwagesandagriculturalproductivity.
Morerecently,Hossain(2008)constructedanindexofrealagriculturalwagesfrom1950to2006(seeFigure1).Farmwagesinitiallyrose,butthentheydeclinedsharplybetweenthemid-1960sandmid-1970s–presumablyonaccountofthepoliticalturmoilofthoseyearsleadinguptoandimmediatelyfollowingindependence–butsubsequentlytheyhavebeenrisinginmostyears.Increasedagriculturalproductivityandthegrowthofthenon-farmruraleconomyprobablyaccountfortheincreases.ThisserieshasbeenfurtherupdatedbyZhangetal.(2013),whofindthatruralwageshaveacceleratedsince2005–somuchsothatthegapbetweenurbanandruralwageshasnarrowed(seeFigure2).
Sincethe1990s,anotherdriverofrisingruralwageshasbeenthegrowthofmanufacturing,especiallythegarments
Figure 1: Bangladesh, agricultural wages, real, 1950-2006
Source: Hossain (2008)

industry,whichemploys3millionworkers,mainlywomen,manyrecruitedfromvillages.Atfirst,whenlabourersmovedoutoftheagriculturesector,therewasonlyasmallimpactonruralwagesbecausesurpluslabourexisted.Overtime,however,thesupplyoflabourhasbeendrawndown,shiftingadvantageinthelabourmarketinfavourofworkers.
Escalationofrealwageshasenhancedtheearningsofthepoorandcontributedtoreducedpoverty.Povertyincidencefellfrom51%in1995to49%in2000to32%in2010,sothepaceofreductionofpovertyacceleratedinthe2000s.‘Risingrealwagesarelikelymajordriversbehindthisrapidpovertyreduction’(Zhangetal.,2013).
Otherdriversofhigherruralwageshavebeenthegrowthoftheruralnon-farmeconomyandmaleemigrationtotheGulfandothercountries,whichhavedrawnmenoutofthefarmlabourforce.
Hence,farmlabourisrunningshort.Intriguingly,Zahid(2014)claimswomenarenowincreasinglyfindingagriculturaljobsmoreattractivethanlow-skilledjobsinthegarmentindustry,aswagesinagriculturehaverisen.
According to the latest labour survey conducted by the Bangladesh Bureau of Statistics (BBS), in 2010, out of the estimated 25.6 million farm labourers in the country, 10.5 million were women, meaning that 6.7 million women joined the farm labour market over a period of ten years. […] The RMG [ready-made garment] industry is losing its shine to the female workers, mainly because of the low wage. The farm sector has emerged as a very prospective alternative sector of employment for rural womenfolk. With more and more male farmhands migrating to urban centres to take up better paying jobs
or rickshaw pulling, a void has been created in the rural farm labour market. The women have started to fill up the vacuum since the daily wage of a farm labourer is higher than the average daily wage of a RMG worker.
Comparingwagesinvillageswithhighandlowlandproductivity,Hossainetal.(2013)seeagriculturalwageratesrisingonaccountofhigheragriculturalproductivity.Atthesametime,newtechnologyinricegrowing–presumablylabour-saving–hasallowedlabourtomoveoutofagricultureintonon-farmwork:
[…] in villages with high land productivity, the proportion of household heads with farming as main occupation was 39% in 2008 compared with 47% observed in villages with low land productivity. In contrast, those who are engaged in trade were more prominent in high land productivity villages (17% as opposed to 10%).
Internationalmigrationplaysarole,notjustbecauseitreducesthesupplyoflabour,butalsobecauseremittancesarespentlocallyonconstruction,amongotherthings,creatingextrademandforlabour:
[…] wage growth tends to be higher in villages experiencing high growth in overseas remittances. Thus, high agricultural wage growth has been associated more with villages experiencing high remittance growth compared with villages experiencing low remittance growth. Overseas remittance indirectly supported the growth of construction sector in general and real estate sector in particular.
China
RecentChinesestudiesfocusontheever-reducingnumbersenteringtheworkforceasChina’sdemographictransitionproceeds.Thismeansfast-growingmanufacturingplantsneedtorecruitmigrantlabourfromthecountryside.Migrationismediatedbyurbanregistrationofresidents(hukou).Theeffectofminimumwagesisindebate.WithinruralChina,increasingnumbersworkofftheland,innon-farmactivities.
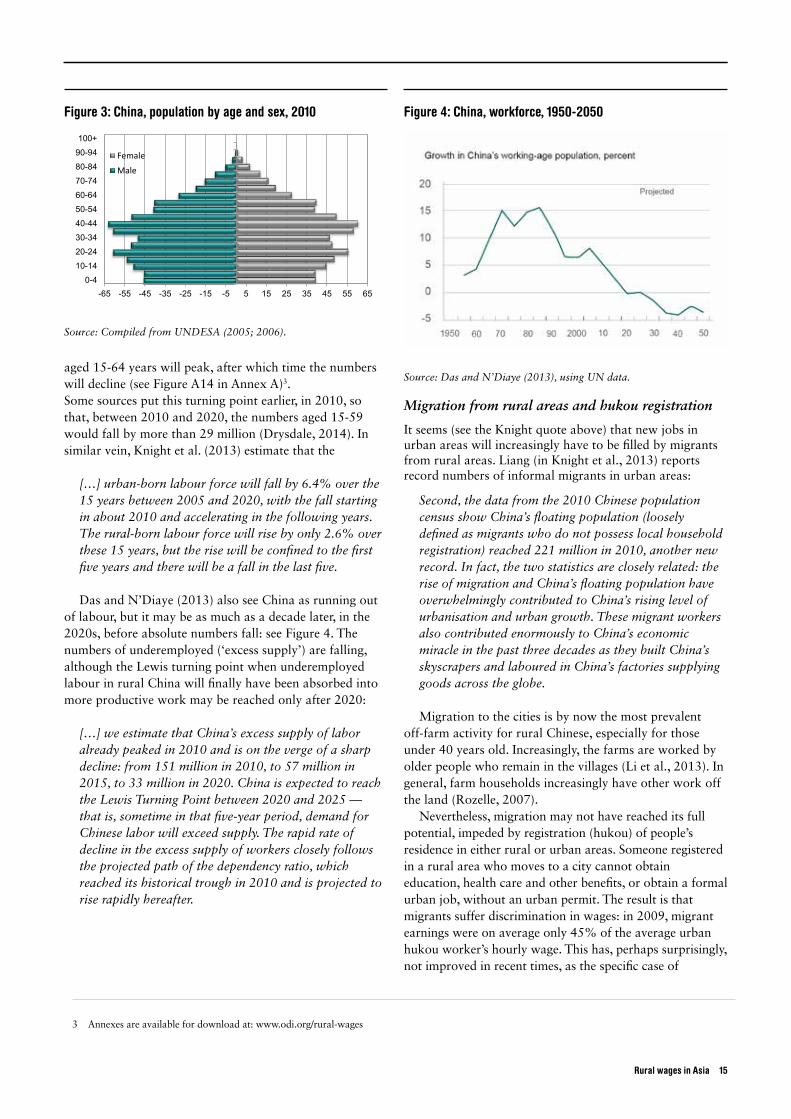
Chinese demography and workforceChina’spopulationstructureisstriking:theagepyramidfor2010(seeFigure3)showsapyramidfortheelderlydowntothoseinthe40-44-year-oldcohort,typicaloffastpopulationgrowthinthepast.Foryoungercohorts,thepyramidinverts,especiallybelowage20.ThisistheresultofarapiddeclineinfertilityaftertheOneChildPolicywasintroducedinthelate1970s.Hence,itwillnotbelongbeforethenumbersenteringtheworkforce–conventionallythosereaching15years–arefewerthanthoseleaving–conventionallythosereaching65years.Indeed,itisprojectedthatin2015thenumberofChinese
14 ODI Report
Figure 2: Bangladesh, urban and rural wages, deflated by the general consumer price index, 2001-2011
Note: Urban wages are for unskilled workers (such as helpers on
construction sites and other sectors). The base year is set to 2009/10.
Source: Zhang et al. (2013).
Rural wages in Asia 15
aged15-64yearswillpeak,afterwhichtimethenumberswilldecline(seeFigureA14inAnnexA)3.Somesourcesputthisturningpointearlier,in2010,sothat,between2010and2020,thenumbersaged15-59wouldfallbymorethan29million(Drysdale,2014).Insimilarvein,Knightetal.(2013)estimatethatthe
[…] urban-born labour force will fall by 6.4% over the 15 years between 2005 and 2020, with the fall starting in about 2010 and accelerating in the following years. The rural-born labour force will rise by only 2.6% over these 15 years, but the rise will be confined to the first five years and there will be a fall in the last five.
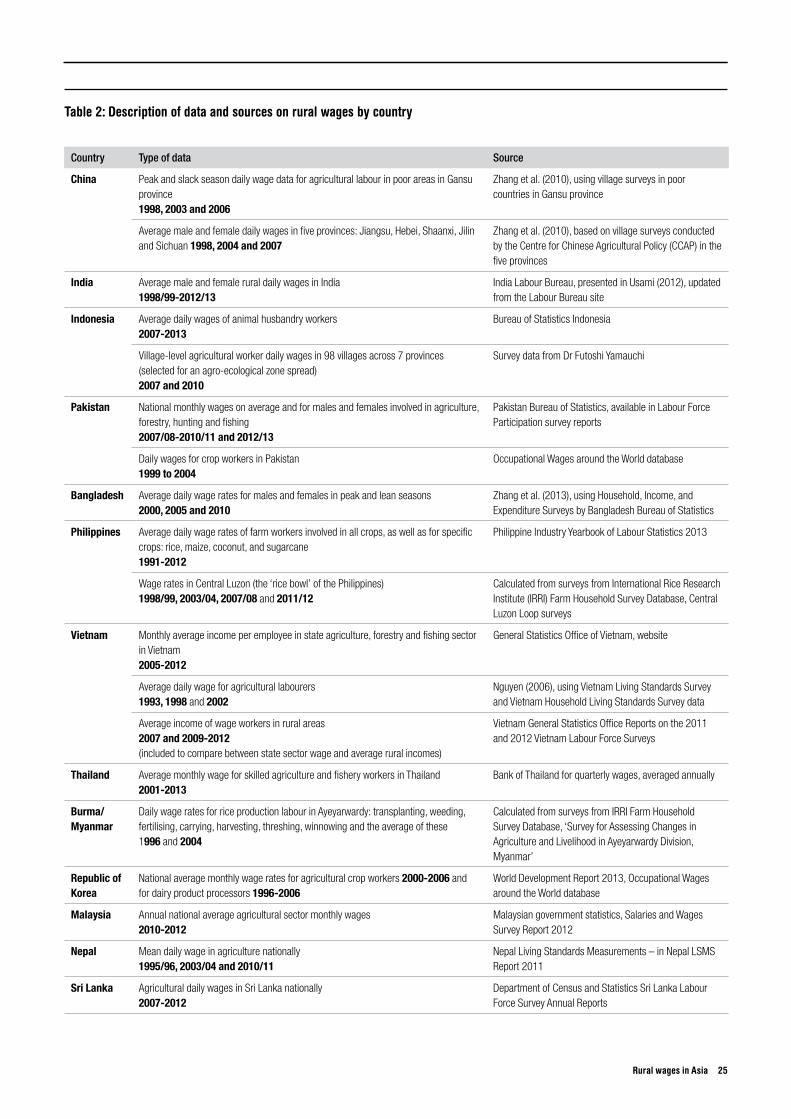
DasandN’Diaye(2013)alsoseeChinaasrunningoutoflabour,butitmaybeasmuchasadecadelater,inthe2020s,beforeabsolutenumbersfall:seeFigure4.Thenumbersofunderemployed(‘excesssupply’)arefalling,althoughtheLewisturningpointwhenunderemployedlabourinruralChinawillfinallyhavebeenabsorbedintomoreproductiveworkmaybereachedonlyafter2020:
[…] we estimate that China’s excess supply of labor already peaked in 2010 and is on the verge of a sharp decline: from 151 million in 2010, to 57 million in 2015, to 33 million in 2020. China is expected to reach the Lewis Turning Point between 2020 and 2025 — that is, sometime in that five-year period, demand for Chinese labor will exceed supply. The rapid rate of decline in the excess supply of workers closely follows the projected path of the dependency ratio, which reached its historical trough in 2010 and is projected to rise rapidly hereafter.
Migration from rural areas and hukou registration
Itseems(seetheKnightquoteabove)thatnewjobsinurbanareaswillincreasinglyhavetobefilledbymigrantsfromruralareas.Liang(inKnightetal.,2013)reportsrecordnumbersofinformalmigrantsinurbanareas:
Second, the data from the 2010 Chinese population census show China’s floating population (loosely defined as migrants who do not possess local household registration) reached 221 million in 2010, another new record. In fact, the two statistics are closely related: the rise of migration and China’s floating population have overwhelmingly contributed to China’s rising level of urbanisation and urban growth. These migrant workers also contributed enormously to China’s economic miracle in the past three decades as they built China’s skyscrapers and laboured in China’s factories supplying goods across the globe.
Migrationtothecitiesisbynowthemostprevalentoff-farmactivityforruralChinese,especiallyforthoseunder40yearsold.Increasingly,thefarmsareworkedbyolderpeoplewhoremaininthevillages(Lietal.,2013).Ingeneral,farmhouseholdsincreasinglyhaveotherworkofftheland(Rozelle,2007).
Nevertheless,migrationmaynothavereacheditsfullpotential,impededbyregistration(hukou)ofpeople’sresidenceineitherruralorurbanareas.Someoneregisteredinaruralareawhomovestoacitycannotobtaineducation,healthcareandotherbenefits,orobtainaformalurbanjob,withoutanurbanpermit.Theresultisthatmigrantssufferdiscriminationinwages:in2009,migrantearningswereonaverageonly45%oftheaverageurbanhukouworker’shourlywage.Thishas,perhapssurprisingly,notimprovedinrecenttimes,asthespecificcaseof
3 Annexesareavailablefordownloadat:www.odi.org/rural-wages
Figure 3: China, population by age and sex, 2010
-65 -55 -45 -35 -25 -15 -5 5 15 25 35 45 55 65 0-4
10-14
20-24
30-34
40-44
50-54
60-64
70-74
80-84
90-94
100+
Female
Male
Source: Compiled from UNDESA (2005; 2006).
Figure 4: China, workforce, 1950-2050
Source: Das and N’Diaye (2013), using UN data.

migrantstoShanghaiillustrates.In1995,migrantworkersinShanghaiearned50%ofthehourlyearningsofurbanhukouworkers;by2009,migrantsearnedonly40%ofthehourlyearningsoftheirurbancounterparts(Meng,2013).
Restrictionsonmovement,however,havebeenrelaxedinrecentyears,andarelikelytobecomeevenmoreso,asurbanjobdemandoutstripssupplyoflabour(Zheng,2013).
Wages and minimum wage policy
Inthesecondhalfofthe2000s,wageshavebeenrisingveryrapidlyindeed(Fang,2011):
In the period 2003 to 2008, the annual growth rate of monthly wages in real terms was 10.5 % in manufacturing, 9.8% in construction, and 10.2% for migrant workers. The real daily wages of paid agricultural workers in the same period rose even faster — 15.1% in grains, 21.4% in larger pig farms, and 11.7% in cotton.
Itisofficialpolicytoraiseminimumwages:the‘12thFive-YearPlantargetsanannualincreaseintheminimumwagelevelofnolessthan13%’(Fang,2011).Moreover,therearereportsthatlocalauthoritiesinthePearlRiverDeltamayberaisingtheminimumevenhigherinabidtoencouragehighertechnologyindustry(LauandGreen,2013):
Localities are free to set their wages above the national level. In fact, provinces have increased minimum wages by an average of 16 per cent this year, after a 20% increase last year. Shenzhen in the Pearl River Delta tops the list in terms of minimum wage levels, with minimum monthly pay of 1,600 yuan (US$258). This has forced more than half the companies in our survey to raise wages more than they had planned, particularly for the least skilled part of their workforce.
AsmanufacturingwagesriseinChina,itisexpectedthateitherfirmswillmechanisemore,orshiftfactoriesfromthehigher-wagecoasttolower-wageinlandlocations,orelsemovetocountrieswithlowerwages,withBangladesh,CambodiaandVietnamaslikelyplaces(LauandGreen,2013):
Around 30% of the companies surveyed said they planned to move factories inland, while 10% said they planned to move out of China altogether. Both of these figures more than doubled from last year. Within China, many companies in the Pearl River Delta want to move westward to Guangxi province, where wages are 30% lower. Other popular destinations include Jiangsu, Hunan, Hubei and Jiangxi provinces. The favoured overseas destinations are Cambodia, Bangladesh and Vietnam.
India
RuralwagesinIndiahavebeenrisingsinceatleastthelate1970s(seeFigure5).Bytheturnofthenewcentury,44%ofworkersinruralIndiadependedoncasualwages.Womenearnlessthanmen,althoughthedifferencenarrowedmarginallybetweentheearly1980sand2000.
Earlierstudiesassociaterisingruralwageswithincreasedyieldsonfarms(DattandRavallion,1998),aswellaswithpublicinvestmentsinphysicalinfrastructureofroadsandirrigationandinhumancapitalintheformofschools(Bhallaetal.,2004).
WagesonIndianfarmsthatweregrowingsteadilyinthe1990sat3.7%ayearfellbackintheearly2000sat-1.8%ayear,onlytoriserapidlyinthesecondhalfofthe2000s,at6.8%ayear(Gulatietal.,2013)(seeFigure6,overleaf).
Gulatietal.(2013)seesomecorrespondencewitheconomicgrowth,especiallywithincreasesinconstruction,whichtendstoattractrurallabour.About43%ofmaleruralmigrantsenduponbuildingsites.Constructionhasboomed:alabour-intensivesector,itsshareofIndianemploymenthasrisenjustasagriculture’ssharehasfallen.Indeed,itseemsthatfinally–studiesofruralIndiahavelonglamentedhowlittlechangehasbeenseeninthefractionoftheworkforceinagriculture–agricultureisrelinquishingitsshareofemploymentinfavourofothersectors,particularlyconstructionandservices(seeFigure7),overleaf.
Public employment schemesPartsofIndiahavelongusedpublicemploymentasawaytoalleviateruralpoverty.TheMaharashtraEmploymentGuaranteeScheme,inoperationsince1975/76,providesjobsforthepooronalargescale,withhalfoftheemploymentgiventowomen.Fundedequallybyataxonprofessionalandformaljobsandbygeneralrevenues,theschemelegallyentitlespeopletowork:whenever50jobseekersdemandwork,jobsmustbeprovided.
16 ODI Report
Figure 5: India, real wage rates of rural casual labourers in India, 1983, 1987/88, 1993/94 and 1999/2000 at 1999/2000 prices
10
20
30
40
50
60
Farm male Farm female Non-farm male Non-farmfemale
Rs
a da
y, 1
999/
2000
con
stan
t
19831987-881993-941999-00
Source: Bhalla et al. (2004), using Himanshu (2003).

Rural wages in Asia 17
Basedonfavourableevaluationsofthis,anationalschemewasintroducedin2006,throughtheMahatmaGandhiNationalRuralEmploymentGuaranteeAct(MGNREGA).Theschemeoffers100daysofworkataguaranteedwage–by2011atRs120-179aday–varyingbystate.Sinceitsintroduction,considerableinteresthasbeenshowninitseffectsonrurallabourmarkets,withtheexpectationthatitwillputafloorintherurallabourmarket,leadingtohighercasualunskilledwages.Gulatietal.(2013)summarisefindingsfromstudiesonitseffects:
Some recent research seems to support the idea of a rise in real casual labourer wages due to MGNREGA, with estimates ranging from 4% to 8% (Berg et al 2012, Azam 2012, Imbert and Papp 2012). NSSO data too indicate that the advent of MGNREGA has resulted in a significant structural break in rural wage increases. Between 1999 and 2005, pre-MGNREGA, nominal wages in the rural economy grew at an average annual rate of 2.7%. Post-MGNREGA, average wage increases almost quadrupled to 9.7% between 2006 and 2009-10.
Figure 6: India, average farm wages, constant at 2011/12 prices, 1990/91 to 2011/12
Source: Gulati et al. (2013), based on data from the Indian Labour Bureau.
Figure 7: India, sector-wise distribution of employment, 1983-2009/10
0
10
20
30
40
50
60
70
Agriculture Manufacturing Construction Trade, hotels,transport and
communication
Financing, real estateand business
services
Community, socialand personal service
Sha
res
in e
mpl
oym
ent (
%)
1983 2009-10
Source: Thomas (2012).

There are, however, studies which argue that rise in casual wage rates cannot be wholly attributed to MGNREGA (Dutta et al, 2012). Mukherjee & Sinha (2011) have conceived a microeconomic model that establishes that the fact of a guarantee of employment at a given wage through the MGNREGA would introduce contestability in the rural labour market. In other words, in the presence of MGNREGA scheme the large land holders in rural areas may now need to raise wage of workers they hire in order to ensure the necessary supply of labour.
AlhaandYonzon(2011)seetheschemeasespeciallyimportantforfemalelaboursincemalescanmoreeasilymigratetofindwork.InThanjavurdistrict,TamilNadu,verylargeincreasesinruralwages,fromRs60toRs110adayfrom2006to2008/09,havebeenreported,ashavecomplaintsfromlargefarmersofnotbeingabletorecruitlabourforpaddyplantingorharvesting(SelvaMaheswariandGangwar,2011).
Eveniftheschemeemploysonly10%casuals,itseemstoaffectlocalwagerates,whichhavegrownmostwheretheschemeismostactive.
ButhowmuchhastheMGNREGAschemepushedupruralwagescomparedwithotherdrivers?AregressionofaveragedaysofemploymentperhouseholdbytheMGNREGAscheme,productivityoffoodgrainsandroaddensityonruralwagesshowallthesehaveraisedthegrowthrateofwagesforbothmaleandfemalefarmlabourers(NarayanamoorthyandBhattarai,2013).Gulatietal.(2013)regresstheincidenceoftheschemeandgrowthoftheeconomyonruralwagestofindeconomicgrowthisamuchstrongerdriverthantheemploymentscheme.Theythereforearguethatfundsinvestedintheschememightbetterbespentonmeasurestostimulateeconomicgrowth–althoughiftheemploymentprojectscreateusefulphysicalinfrastructure,theschememightcontributetowardsthis.
IndonesiaRuralwagesinIndonesia4rosegraduallyfromtheearly1980s,butsunkforfivequartersin1998/99duringtheAsianfinancialcrisis;theyrecoveredslightlyinthelate1990s.Theychangedverylittleinrealtermsforthefirsthalfofthe2000s,butgrewinthesecondhalf,withapronouncedupwardsshiftbeginninginthethirdquarterof2005.Wagesagainrosedramaticallyaroundthe2007/08period,butfellfrompeaksofoverRph20,000perdayafter2008.Nonetheless,in2009theyweresomeRph5,000perday(50%)higherthantheirlevelsformostofthefirsthalfofthe2000s(seeFigure8).
ResearcherslookingatwhetherIndonesia’sagriculturalwageratewouldberaisedmorebyeitherincreased
industrialdemandorincreasedagriculturaldemandforlabourfoundthat,althoughbothhadapositiveinfluenceonraisingwages,industrialdemandplayedafargreaterrole(HarahapandBarichello,2014).
AgriculturalwagesweremodelledasafunctionofJava’sriceprice(aproxyforagriculturaldemandforlabour),Indonesia’smanufacturingwage(aproxyfortherealurbanwage)andquarterlymanufacturinggrossdomesticproduct(GDP)(aproxyforurbansectordemandforlabournotcapturedbythemanufacturingwage).Theirresultssuggestedthemanufacturingwageratewashighlyimportantindeterminingfarmwages,withestimatesoffarmwageratesrisingby0.3%fora1%riseinmanufacturingwage.Theeffectofrisesinthericepricewasonlyone-thirdaslarge,withfarmwagesrisingonly0.1%fora1%riseinthericeprice.ThegrowthinmanufacturingGDPwasalsofoundtohaveastronginfluenceonfarmwages,raisingthembyalmostasmuchasthemanufacturingwageratechanges.
Arias-Vazquezetal.(2013)comparedimpactsofgrowthinhigh-productivitysectors–manufacturing,transportandcommunications,finance,electricityandutilitiesandmining–andlow-productivitysectors–otherservices,agriculture,retailandwholesaletrade,governmentandpublicadministrationandconstruction–onannualchangesinaveragewagesacrossIndonesia,usingpaneldatafrom1988to2007.Thisgavealargepositiveandsignificantcoefficientongrowthfromhigh-productivitysectors,butonlyasmallpositive,butinsignificant,coefficientongrowthoflow-productivitysectors.
Theyalsousedacross-provinceregressiontodeterminehowmuchannualisedchangesinwages(amongother‘employmentoutcomes’)wereinfluencedbyshare-weightedgrowthindifferentsectorsoftheeconomy.Thisgavepositivecoefficientsonotherservices,agriculture,manufacturingandtransport,althoughonlymanufacturingwassignificant.Miningwasalsosignificant,butwithanegativeandsmallcoefficient.
Education, road quality and rural wagesOtherresearchhasexaminedtheimpactofimprovingruralroadsonruralwagesinIndonesia.Usingwagedataoverthe1995-2007period,Yamauchietal.(2011)showedimprovementsinroadinfrastructure(transportationspeed)increasednon-agriculturalwagesinruralIndonesiabyconnectingworkerstoemploymentopportunitiesoutsidevillages.Moreeducatedindividualswereabletotakeadvantageoftheopportunitiesraisedbybetterconnectivitytogainhigher-wageemploymentoutsidetheagriculturesector.
Morerecently,Yamauchi(2014)showedbetterroadsandfastertransportpositivelyinfluencedbothagriculturalandnon-agriculturalwagesinIndonesiabetween2007and
4 Here,agriculturalwagesinJavaareusedtoillustrateIndonesianwages.TheyareanaverageoftheprovincialaverageforWestJava,CentralJavaandEastJava,whichtogetherincludesome70%ofIndonesia’spopulation.
18 ODI Report

Rural wages in Asia 19
2010.Moreover,betterroadsandschoolinginteractedtoimproveagriculturaldailywagessignificantly.
Across-countryanalysis(Wintersetal.,2008)appearstocorroboratetheseresults,findingeducationalandinfrastructureinvestmentwerecriticalforprovidingopportunitiesinthelabourmarketthatledtohigherwagesacrossasampleof14countries,includingIndonesia.5Theywrote:
The key to participating in high value wage employment activities appears to be education. Generally, there is a positive relationship between education and participation in rural labour markets suggesting that education is linked to labour markets and that labour markets are used as a pathway out of poverty for the educated.
Andonagriculturalwagesspecifically:
While agriculture is not chosen as the sector to participate in by the educated, the educated workers that find the right opportunities do receive higher wages.
ForIndonesiaspecifically,usingdatafroma2000survey,theyfoundthatwagesinrurallabourmarketsrespondedstronglyandpositivelytoeducationandinfrastructure,butwithalargenegativecoefficientforfemaleworkers(seeTable3inWintersetal.,2008).Foragriculturealone,theyfoundastrongernegativecoefficientforfemaleworkersandapositiveeffectforeducation:infrastructurewasnotfoundtobesignificant(seeTable5inWintersetal.,2008).
Other parts of AsiaInMalaysia,ithasbecomeincreasinglydifficulttorecruitworkersforoilpalmestates.Indonesiausedtobeasourceofmigrantlabour,filling80%ofsuchjobs.ButthishasdwindledasaresultofhigherwagesandrapidurbanisationinIndonesia.ApplicantsforjobsinMalaysia’spalmoilsectorplungedto38,000in2013,frommorethan120,000ineachoftheprevioustwoyears,accordingtodatafromtheIndonesianEmbassyinKualaLumpur(Raghu,2014).
Malaysiaseemstobetakinginmigrantsfromothercountries.Asmanyas250,000BurmesemaybeworkinginMalaysia,oftentakinglow-paidjobs,includingatrestaurantsandconstructionsites,withhelpfromrecruitmentagencies.About110,000Burmanationalsinthecountrylackproperlegaldocumentation,accordingtotheLabourMinistry(ThaiPBS,2014).
BangladeshandMalaysiasignedanagreementinNovember2012formigrantlabour,withsofar4,000BangladeshistravellingtoMalaysiatofilljobsunderthedeal(Ara,2014).
InBurma,farmlabourshortagesarereportedascasuallabourersleavethelandforconstructionjobsinRangoon(Htike,2014).
InThailand,theshoppingmalls,factoriesandconstructionsitesinThailand’snortheastareattractinglabour,sincetheeconomyoftheregionisbooming.In2013,anationalminimumwageof$10adaywasintroduced,whichtranslatedtoa35%riseintherelativelypoornortheast.ThishasapparentlyevenledtosomeworkersreturningtotheirhomeregionfromBangkok(CarstenandTemphairojana,2013).
5 CountrysurveystheyusedwereAlbania(2005),Bangladesh(2000),Bulgaria(2001),Ecuador(1995),Ghana(1998),Guatemala(2000),Indonesia(2000),Malawi(2004),Nepal(2003),Nicaragua(2001),Nigeria(2004),Panama(2003),Tajikistan(2003)andVietnam(1998).
Figure 8: Indonesia, real agricultural wage rate in Java, 1983-2009, rupiah a day
Note: Wages have been deflated by the rural Consumer Price Index (CPI) to constant 2007 levels. Source: Quarterly data from Harahap and
Barichello (2014) (horizontal axis labels added).

Lesspositivereportscomefromeconomiesthathavenotbeengrowingasquickly,suchasPakistan(Dawn.com2014;OmanTribune,2014)andthePhilippines(ReyesandTabuga,2011).
2.3 SummaryRecentliterature,bothdescriptiveandanalytical,reportssimilarfindingsinseveralcountriesofAsia:
• InBangladesh,China,IndiaandIndonesia,ruralwagesarerising–andapparentlyfasterinthesecondhalfofthe2000sthanbefore.
• Growthofmanufacturingandjobsoffthefarm,especiallyconstructionincities,isdrawinglabouroffthefields.
• ForChina,atleast,thepullofthecitycoincideswithreductionsinthelabourforce,asthelowerfertilityofthepast30yearscomesintoplay.
• Itislesscleartowhatextentthegrowthoftheruralnon-farmeconomyorincreasesinagriculturalproductivityhaveledtoincreaseddemandforlabourinruralareas.
• Althoughpublicemploymentprogrammesmaycontributetohigherruralwages,theymaynotdrivethemasstronglyaseconomicgrowth.Thatsaid,theIndianMGNREGAschememaybedisproportionatelyvaluabletofemaleworkersandtothoseineconomicallylaggingregions.
20 ODI Report

3. Study approach, data and methods

3.1 Research questions Fromthegeneralquestionsposed,thefollowingtwowereselectedfordetailedinvestigation,giventhelimitsofsecondarydataavailableandtimeforstudy:
1. What trends can be seeninruralwagesinAsiaduringthe2000s?Inhowmanycaseswereincreasesinruralwagesmorerapidinthesecondhalfofthedecadecomparedwiththefirsthalf?
2. What factors are driving the increases seen?Whataretherelativesignificanceandweightofincreasesinagriculturalproductivityandmanufacturingoutputthatshouldraisedemandforlabour,orofchangesinnumbersofworking-agepopulationinruralareasthataffectthesupplyoflabour?
3.2 ApproachThefirstquestionwasansweredbycollectingdataonruralwagesinAsiaduringthe2000s,thencomparingtheratesofincreaseseenfortheearlyandlatepartofthedecade.
DatawerecollectedforthemostpopulousdevelopingcountrieseastoftheKhyberPassandsouthofCentralAsia.Thereare13countriesinthisregionwithmorethan20millioninhabitants;indecliningorderofpopulation,theseareChina,India,Indonesia,Pakistan,Bangladesh,Philippines,Vietnam,Thailand,Burma/Myanmar,RepublicofKorea,Nepal,MalaysiaandSriLanka.DPRKoreawasomittedowingtoitsunusualcharacteristicsandlackofdata.TaiwanChinawasomittedforlackofreadilyavailabledataonruralwages.6
Figure9showsthelocationofthecountries,whileTable1providessomebackgroundcharacteristics:population,proportionofresidentsclassifiedasruralandagriculture’scontributiontotheeconomyin2000comparedwith2012.
Forrural wages,theaimwastofindaseriesthatrepresentstrendsinunskilledruralwages.Thereis,ofcourse,nosinglenationalruralwage.Wagesvarybylocation,byseason,bythejobcarriedoutandusuallyalsobysex,withwomentypicallybeingpaidlessthanmen.Givenlimitationsoftimeandaccesstodata,afairlystrongassumptionhadtobemadeinseveralcases:thatthedataseriesselectedtorepresentruralwagesineachcountrywereconsistentintrendwithotherpotentialdataseriesforthatcountry.
Tolookatpotentialdriversofchangesinruralwages,asimplemodelhasbeenadopted:
Δ Rural wage = f[Δ agricultural labour productivity, Δ rural working age population, Δ manufacturing output, dummy for first half of the 2000s]
—whereΔindicateschangeinannualaveragerate.
Thisassumesthemaininfluencesonruralwageswillcomefromchangesindemandfromfarmingoralternativelyfromgrowthofmanufacturingoutput,andfromchangestothesupplyoflabour.Changesfortwotimeperiods,earlyandlate2000s,weremodelled,withadummytoseewhethertherewasanysignificantchangeintherelationsseenbetweenthetwoperiods.
Severalsimplifyingassumptionsweremade,including:1. Demandforagriculturallabourwillvarymainly
accordingtothemarginalproductivityoflabour.Increasesinareatilledmayalsoincrease,butthiswasomittedonthegroundsthatincreasesinareacultivatedhavebeenlimitedinmostofthesecountriesduringthe2000s.
2. Growthofmanufacturingwastakentorepresentgrowthofdemandforlabourinactivitiesotherthanagriculture.Clearly,servicesalsorequirelabour.Manufacturingwas,however,thoughttorepresenta
6 GivenTaiwan’slevelofindustrialisation,ruralwageratesprobablyrosesubstantiallypriortotheperiodofinterestforthisstudyinanycase.
22 ODI Report
Box 1: Varying transitions from agrarian to industrial economies
Theselectedcountriesrangefromthosestillheavilyreliantonagriculture–particularlyNepalandBurma/Myanmar–tothosetransitioningtowardsbeingmoreurbanandlessdependentonagriculture–withPakistan,Vietnam,BangladeshandIndiaintheearlierstagesofthetransitionandChina,IndonesiaandthePhilippinesinlaterstages–toafewcountrieswhereagricultureisnowarelativelysmallpartoftheeconomy(RepublicofKoreaandMalaysia).
Figure10illustratesthesetransitionsfromruraltourban,fromagriculturetoothersectors,throughtimefromtheearly1980sto2010/12.Thegeneraltrendrunsfromtopleft(ruralandagricultural)tobottomright(urbanandnon-agricultural),withmostcountriesseeingadeclineintherelativeimportanceofagricultureandtheproportionofpeoplelivinginruralareas.Therearefewexceptions.SriLankaaloneshowsarisingruralproportionofpopulation;someothercountriesgoagainstthetrendfortheodd10-yearperiod.
Theratesatwhichthesecountriesaremakingthetransitionvarysharply.Overthepast30years,somehaveincreasedtheproportionofthepopulationlivinginurbanareasbymorethan25percentagepoints(China,Malaysia,IndonesiaandRepublicofKorea);othershaveseenmuchslowerurbanisation(Pakistan,IndiaandThailand,withincreaseslimitedto7-8percentagepoints).SimilardifferencesapplytochangesintheshareofagricultureinGDP,withverystrongfallsseeninChina,NepalandVietnam.LesserreductionsapplyforPakistan,whiletheshareinBurma/Myanmaractuallyrose.

Rural wages in Asia 23
sourceofjobsbetterpaidthanagriculture,sinceservicescanincludeactivitiesthatarebadlyrewarded:informal,refugeactivitiesundertakenbypoorpeoplewhocannotaffordunemployment.
3. Growthofworking-agepopulationrepresentsthesupplyoflabour.Thisvariableshouldencompassbothpopulationgrowthinruralareasandnetmigrationoutofruralareas.Itassumestheratesatwhichdifferentpartsoftheworking-agepopulationparticipatedonotchangesignificantly.Inpractice,itmaybethatthischangesbyage–withincreasingincomes,adolescentsmayfeeltheycanspendmoretimeinschoolbeforeseekingajob,whileolderworkersmaybeabletoretireearlier–andbysex–womenmayprefertostayhomeasincomerises,oralternatively,astheyspendlongerinschool,mayactivelyseekcareers.Overadecade,however,weassumedsuchchangeswouldnotaffectthenumbersseekingworkasmuchasthedemographicfactors.
Thefirsttwoassumptionsmayseemquitestrong.However,giventhatthemodeloperatesbyratesofchangeratherthanbylevels,itisnotnecessarythatthevariablesselectedcompletelydescribedemandforrurallabour,butratherthattheyrepresentthemainforcesofdemandandthatomittedvariableswouldnotshowadifferenttrend.Toexpand:inthecaseofagriculture,theassumptionisnotthatincreasesinareadonotraisedemandforlabour;ofcoursetheydo.Theassumptionisthatsuchincreasesarenotgreaterthanthoseinagriculturallabourproductivity.Similarly,theomissionoflabourdemandinservicesassumesanyincreaseinservicejobs(betterpaidthaninagriculture)isnotgreaterthanthatofmanufacturing.
Table 1: Population, proportion rural and agriculture’s contribution to GDP
Population 2013 (millions) % rural Agriculture, value added, % of GDP, 2000
Agriculture, value added, % of GDP, 2012
China 1,417 46 15 10
India 1,252 68 23 18
Indonesia 250 48 16 14
Pakistan 182 63 26 24
Bangladesh 157 71 26 18
Philippines 98 51 14 12
Vietnam 92 68 23 20
Thailand 67 65 9 12
Burma/ Myanmar 53 66 57 48*
Korea, Republic of 49 16 5 3
Malaysia 30 26 9 10
Nepal 28 82 41 37
Sri Lanka 21 85 20 11
Note: National classifications of the rural/urban divide may not be fully comparable as different countries have different thresholds for village/
town size classified as ‘urban’. * Data for agriculture, value added as a proportion of GDP for Burma/Myanmar are for 2004 as later data are
not available.
Sources: Population data from FAOSTAT. Agriculture (% of GDP) from World Bank World Development Indicators.
Figure 9: Most populous Asian developing countries east of the Khyber Pass and south of Central Asia
Sources: Map from Wikimedia commons.

3.3 Data sources
Recent rural wage dataLiterature,databases7andsurveys(nationallyrepresentativeorotherwise)wereconsultedtosourcedataonruralwagetrendsinthe13focuscountries,lookingfornationallyrepresentative rural agricultural wage data spanning 2000 to 2014.
Databeginningbefore2000werealsoconsideredincaseswhereavailabledatawouldotherwisespantooshortaperiod.Subnationaldata,thosedisaggregatedbygenderofworker,typeofcrop,seasonofproduction,statesectorworkersandskilledagriculturalworkerwages,werealsocollectedwhereavailable:insomecases,onlysuchdisaggregateddatawereavailable.8
Table2presentsthewagedatacollectedforthe13countriesoverthepast15orsoyears.9Whiletherearelimitstothecomparisonsthatcanbemadeacrosscountries,givendifferencesinwagescovered,withincountriescomparisonsthroughtimeshouldbevalid.
Adjustments to wage data
Wherewageswerenotpresentedasdayrates,thesewereimputedfrommonthlywagesusingtheconventionappliedintheILO’sOccupationalWagesaroundtheWorlddatasetof25workingdayspermonth.
WagesinnominallocalcurrencyunitsweredeflatedbythenationalCPIre-basedto2010.Toallowforcomparisonacrosscountries,theywerethenconvertedtoUSdollarsusingthe2010exchangerate–marketexchangerate,sonotcorrectedforpurchasingpower.BothCPIsandexchangeratesweretakenfromtheWorldBank’sDevelopmentIndicatorsdatabase.Burma/Myanmarisanexception:wageshereweredeflatedto2012levelsandconvertedto2012USdollars:theofficialexchangerategrosslyovervaluedtheBurmesekyatpriorto2012,soa2010conversionwouldmakedailywageratesimplausiblyhigh.
Foranalysis,ruralwagedatawereselectedtobeasrepresentativeaspossible.Wherenationallyrepresentativeaveragewageswerenotavailable,thelargestavailableaggregateswereused(geographicallyorintermsofcrops).Whenwageswereavailableonlydividedbysex,men’s
7 SuchasthosefromnationalstatisticalservicesorinternationalorganisationsincludingtheWorldBankortheInternationalLabourOrganization(ILO).
8 Therearenointernationaldatabasesthatregularlyreportondailywagesforthesampleofcountriesofinterestthathaveconsistentlydonesoforthetimeperiodofinterest.Nationalsurveysthatcollectthistypeofdataarefewandfarbetween.
9 AnnexBpresentsmoredetailonindividualcountrydata.Availablefordownloadat:www.odi.org/rural-wages
24 ODI Report
Figure 10: Pathways to urbanisation in selected Asian countries, 1980/82-2010/12
Bangladesh
China
India
Indonesia
Malaysia
Myanmar
Nepal
Pakistan
Philippines
Korea, Rep
Sri Lanka Thailand
Vietnam
0
10
20
30
40
50
60
5 15 25 35 45 55 65 75 85
Con
trib
utio
n of
agr
icul
ture
to G
DP,
%
% of population that is urban
Bangladesh ChinaIndia IndonesiaMalaysia MyanmarNepal PakistanPhilippines Korea, Rep.Sri Lanka ThailandVietnam
Rural and agrarian
Transitioning
Urban and non-agricutlural
Note: Four data points for each country are shown to represent trends in time: 1980/82, 1990/92, 2000/02 and 2010/12. Vietnam is missing the
first data point and Burma/Myanmar the last, since data were unavailable.
Source: Constructed from data in World Bank WDI and FAOSTAT
Rural wages in Asia 25
Table 2: Description of data and sources on rural wages by country
Country Type of data Source
China Peak and slack season daily wage data for agricultural labour in poor areas in Gansu province 1998, 2003 and 2006
Zhang et al. (2010), using village surveys in poor countries in Gansu province
Average male and female daily wages in five provinces: Jiangsu, Hebei, Shaanxi, Jilin and Sichuan 1998, 2004 and 2007
Zhang et al. (2010), based on village surveys conducted by the Centre for Chinese Agricultural Policy (CCAP) in the five provinces
India Average male and female rural daily wages in India 1998/99-2012/13
India Labour Bureau, presented in Usami (2012), updated from the Labour Bureau site
Indonesia Average daily wages of animal husbandry workers 2007-2013
Bureau of Statistics Indonesia
Village-level agricultural worker daily wages in 98 villages across 7 provinces (selected for an agro-ecological zone spread) 2007 and 2010
Survey data from Dr Futoshi Yamauchi
Pakistan National monthly wages on average and for males and females involved in agriculture, forestry, hunting and fishing 2007/08-2010/11 and 2012/13
Pakistan Bureau of Statistics, available in Labour Force Participation survey reports
Daily wages for crop workers in Pakistan 1999 to 2004
Occupational Wages around the World database
Bangladesh Average daily wage rates for males and females in peak and lean seasons 2000, 2005 and 2010
Zhang et al. (2013), using Household, Income, and Expenditure Surveys by Bangladesh Bureau of Statistics
Philippines Average daily wage rates of farm workers involved in all crops, as well as for specific crops: rice, maize, coconut, and sugarcane 1991-2012
Philippine Industry Yearbook of Labour Statistics 2013
Wage rates in Central Luzon (the ‘rice bowl’ of the Philippines) 1998/99, 2003/04, 2007/08 and 2011/12
Calculated from surveys from International Rice Research Institute (IRRI) Farm Household Survey Database, Central Luzon Loop surveys
Vietnam Monthly average income per employee in state agriculture, forestry and fishing sector in Vietnam 2005-2012
General Statistics Office of Vietnam, website
Average daily wage for agricultural labourers 1993, 1998 and 2002
Nguyen (2006), using Vietnam Living Standards Survey and Vietnam Household Living Standards Survey data
Average income of wage workers in rural areas 2007 and 2009-2012 (included to compare between state sector wage and average rural incomes)
Vietnam General Statistics Office Reports on the 2011 and 2012 Vietnam Labour Force Surveys
Thailand Average monthly wage for skilled agriculture and fishery workers in Thailand 2001-2013
Bank of Thailand for quarterly wages, averaged annually
Burma/ Myanmar
Daily wage rates for rice production labour in Ayeyarwardy: transplanting, weeding, fertilising, carrying, harvesting, threshing, winnowing and the average of these 1996 and 2004
Calculated from surveys from IRRI Farm Household Survey Database, ‘Survey for Assessing Changes in Agriculture and Livelihood in Ayeyarwardy Division, Myanmar’
Republic of Korea
National average monthly wage rates for agricultural crop workers 2000-2006 and for dairy product processors 1996-2006
World Development Report 2013, Occupational Wages around the World database
Malaysia Annual national average agricultural sector monthly wages 2010-2012
Malaysian government statistics, Salaries and Wages Survey Report 2012
Nepal Mean daily wage in agriculture nationally 1995/96, 2003/04 and 2010/11
Nepal Living Standards Measurements – in Nepal LSMS Report 2011
Sri Lanka Agricultural daily wages in Sri Lanka nationally 2007-2012
Department of Census and Statistics Sri Lanka Labour Force Survey Annual Reports

wagesweretaken;whenwagesweregivenonlyseasonally,peakseasonwageswereused.Wagedatawereseparatedintotwotimeperiods–earlytomid-2000sandmid-2000stoearly2010s10–tocompareaverageannualchangesinruralwages–dependentvariable–toaverageannualchangesacrossthesametimeperiodinthreeindependentvariables:agriculturalproductivity,manufacturingandtheruralworkingpopulation.
Burma/Myanmarwasexcludedasdataonindependentvariableswerelacking.Malaysiawasexcludedaswagedatawerereadilyavailableonlyfor2010-2012.
Thedatasetendedupcomprising11countries,6ofwhichcoveredbothtimeperiods,giving17observationsinall.Table3showsthecountriesandyearsofobservations:greytogreenrepresentingthefirstperiodandgreentoredthesecondperiod.
Potential factors affecting rural wagesNationaldatarepresentingagricultural labour productivity, the value of manufacturingandthesizeoftherural working populationwerecompiled,asTable4shows.
10 Thesetimeperiodsvaryslightlydependingonavailabilityofdata.
26 ODI Report
Table 3: Time spans covered by data

Rural wages in Asia 27
Table 4: Data on key variables influencing rural wages and sources
Variable Description of data Source
Agricultural labour productivity Agricultural productivity per worker was constructed by taking gross production value of all agriculture in constant 2004/06 US dollars, divided by the estimated total economically active population in agriculture
Data not available for Burma/Myanmar
FAOSTAT
Value of manufacturing Manufacturing, value added in constant 2005 US dollars Manufacturing refers to industries belonging to International Standard Industrial Classification (ISIC) divisions 15-37(https://unstats.un.org/unsd/cr/registry/regcst.asp)Data not available for Burma/Myanmar
World Bank Development Indicators
Rural working population Constructed from data for rural population and the proportion of the total population between the ages of 15 and 64Applying the fraction of the total population aged 15-64 to the rural population gives an estimate of the rural working population. Ideally, the fraction of the rural population aged 15-64 would be used, but these data were not readily available
World Bank Development Indicators

4. Results

Rural wages in Asia 29
4.1 Description of key variables
Rural wagesTable5summarisesthewagedatafoundoverthreeperiodswhereavailable:i)early2000s,ii)mid-2000sandiii)late-2000stoearly2010s.Wagesarepresentedinconstant2010USdollars,withpercentagechangesbetweentheperiodsshownintheright-handcolumns.
Ruralwagesroseinmostcountriesandoverbothperiods(seeFigure11).Theexceptionsarefew:Pakistaninthesecondperiod;thePhilippinesformostcropsintheearlyperiodandallcropsexceptriceinthelaterperiod;andBangladeshinthefirstperiod.China,VietnamandsomeprovincesofIndonesiasawthemostpronouncedincreases.Attheotherendofthespectrum,PakistanandthePhilippinessawstagnantorfallingwages.Rural wages increases accelerated in the 2000sforthemajorityofcountrieswherethetwoperiodscouldbecompared.AccelerationwasclearforallseriesfromBangladesh,China,India,NepalandtheRepublicofKorea.WageincreaseshadslowedinThailandandVietnam.TheresultsforthePhilippinesweremixed.
Evenwithincreasesinthe2000s,levels of wages in rural areas in the early 2010s remained low,withfewexceptions.Onlytwoobservationsexceeded$10aday:farmworkersinMalaysiaanddairyprocessworkersintheRepublicofKorea.Indeed,manyobservationswerebelow$5aday.Considerwhatthatmeansforhouseholdsthathavetodependonsuchearnings.Ifaworkerwereemployedforsixdaysaweek,yearround–astrongassumption,whensomuchruralworkisseasonal–thenannualwageearningswouldbe$1,560.Assumingonedependantforeveryworker,thenaveragepercapitaincomeswouldcometojust$2.14aday.Thismayjustclearthepovertyline,butnotbymuch.Twoqualificationsapply,however.Oneisthatsomeruralhouseholdscouldhaveearningsfromnon-farmenterpriseswithhigherreturnstolabour;theotheristhattheconversiontoUSdollarshasbeendoneatmarket,ratherthanpurchasingpowerparity(PPP),rates–seeAnnexC11forPPPconversionsthatshowmanymorecaseswherewagesexceed$10aday.
Forfourofthecountries,China,India,PakistanandBangladesh,availablewage data are differentiated by gender.Ruralwagesforwomenareinmostcasesbetweenaquarterandone-thirdlessthanthosepaidtomen.Comparingdifferencethroughtime,thewagegapappearstobenarrowing,withrelativeincreasesinfemalewagesslightlyoutstrippingincreasesinthewagesoftheirmalecounterparts(seeFigure12).FemalewagesasaproportionofmalewagesgrewinmostofthefiveprovincesinChina,inIndiaslightlyandinBangladeshoverthelastperiodinparticular.NoprogressisapparentinPakistan,wherethewagegapisthe
worstofthesample,withfemaleagriculturallabourwageslessthanhalfofmalewagesin2012.
Agricultural labour productivity From1995to2012,agricultural labour productivity improvedinallofthesamplecountries,theexceptionbeingPakistan(seeFigure13).
Increasesfrom2005to2012canbecomparedwiththoseseenfortheprecedingsevenyears–1997-2004(seeFigure14).Mostcountriesshowanaccelerationintheaveragerateofgrowth:China,India(fromalmostnogrowthtoalmost3%ayear),Indonesia,Pakistan(fromnegativetopositive),Bangladesh,Thailand,RepublicofKorea,NepalandSriLanka(alsofromnegativetopositive).Incontrast,thePhilippines,VietnamandMalaysiasawaverageannualratesofgrowthshrinkfromthefirsttosecondperiod,althoughtherateremainedrelativelyhighinthecasesofVietnamandMalaysia.
Value of manufacturing outputFrom1995to2012,thevalueofmanufacturingoutputgrewacrossallcountries(seeFigure15),albeitatconsiderablydifferentrates.
Comparingmanufacturinggrowthin1997-2004withthatfor2005-2012(seeFigure16),showsitacceleratedforChina,India,Indonesia,Bangladesh,thePhilippinesandSriLanka.Infivecases,growthslowed,althoughfortheRepublicofKoreaandVietnamtheratesstillremainedhigh.
Rural working population Inthemid-1990s,ruralworkingpopulationswererisinginallcasesotherthanfortheRepublicofKorea.By2012,thenumberswerefallinginChina,Malaysia,ThailandandSriLanka–withIndonesiarisingslightlyafterseveralyearsoffalls.Inthesecases,aturningpointhasbeenpassed.Incontrast,anothergrouphashadruralworkingpopulationrisingthroughouttheperiod:Burma/Myanmar,Philippines,VietnamandSouthAsia.
Allcountriessawratesofgrowthfallbetween1997-2004and2005-2012,exceptfortheRepublicofKorea,whichexperiencedaconstantrateofdecline(seeFigure18).ThemostdramaticchangeoccurredinChina,wheretheruralworkingpopulationchangedlittleintheearlierperiodbutshrankonaverage,by1.7%ayear,inthelatter.InIndonesia,thegrowthratebecamenegativeinthesecondperiod,whileinThailand,MyanmarandSriLankaitdeclinedtohalfapercentperyearorless.
4.2 Causes of changes in rural wages
Examining the dataAmultivariatesimplelinearregressionwasconducted,withdatafromapanel,unbalancedowingtodata
11 Annexesareavailablefordownloadat:www.odi.org/rural-wages

30 ODI Report
Table 5: Real rural wages and changes for 13 Asian countries, 1995/96-2013
US$ real daily wages (constant 2010a) Change in wages (%)
Average daily wages
Early 2000s Mid-2000s 2010s Early 2000s-mid-2000s
Mid-2000s-2010s Early 2000s- 2010s
China 1998 2003 2006 1998-2003 2003-2006 1998-2006
Gansu province, poor areas, farm labour, harvest season
2.32 2.89 4.50 25 56 94
Gansu province, poor areas, farm labour, slack season
1.73 2.17 3.21 25 48 85
Agricultural labour, male, five-province average
1998 2003 2007 1998-2003 2003-2007 1998-2007
3.02 3.73 7.18 23 92 137
Jiangsu 3.26 4.30 7.11 32 65 118
Sichuan 2.35 3.29 6.60 40 101 181
Shaanxi 2.20 2.79 7.02 27 152 219
Jilin 4.67 4.64 8.37 -1 80 79
Hebei 2.55 3.60 6.72 41 87 163
Agricultural labour, female, five-province average
2.30 2.76 5.51 20 100 139
Jiangsu 2.49 3.33 5.76 34 73 132
Sichuan 1.92 2.39 4.99 25 109 161
Shaanxi 1.71 2.08 5.29 22 154 209
Jilin 3.58 3.53 6.52 -1 85 82
Hebei 1.71 2.37 4.92 38 108 187
India 2000/01 2005/06 2012/13 2000-2005 2005-2012 2000-2012
National, agricultural labour, male
2.13 2.15 2.91 1 35 36
National, agricultural labour, female
1.59 1.61 2.21 1 37 38
Indonesia n/a 2007 2010 n/a 2007-2010 n/a
98 villages, survey data, 7 provinces, median
2.92 3.64 25
Lampung 2.55 3.58 40
Central Java 2.27 2.67 18
East Java 2.36 2.84 20
West Nusa Tenggara
3.00 3.05 2
South Kalimantan 3.29 4.76 44
North Sulawesi 5.08 9.00 77

Rural wages in Asia 31
US$ real daily wages (constant 2010a) Change in wages (%)
Average daily wages
Early 2000s Mid-2000s 2010s Early 2000s-mid-2000s
Mid-2000s-2010s Early 2000s- 2010s
South Sulawesi 3.05 3.44 13
National average, animal husbandry workers
n/a 2007 2013b n/a 2007-2013 n/a
3.25 4.05 25
Pakistan n/a 2007 2012 n/a 2007-2012 n/a
National, agricultural workers
2.77 2.35 -15
Male 3.36 2.97 -12
Female 1.68 1.46 -13
Average daily wage, crop workers
2000 2004 n/a 2000-2004 n/a n/a
2.33 2.63 13
Bangladesh 2000 2005 2010 2000-2005 2005-2010 2000-2010
National, peak season, male
1.92 1.92 2.78 0 45 44
National, lean season, male
1.53 1.52 2.21 -1 46 45
National, peak season, female
1.32 1.22 2.02 -8 66 53
National, lean season, female
1.10 1.02 1.62 -7 58 48
Philippines 2000 2005 2012 2000-2005 2005-2012 2000-2012
National, farm labour all crops
4.61 4.47 4.54 -3 2 -2
Rice 4.77 4.58 5.09 -4 11 7
Corn 4.21 4.03 3.91 -4 -3 -7
Coconut 4.37 4.56 4.32 4 -5 -1
Sugarcane 5.39 4.95 4.38 -8 -11 -19
Central Luzon (rice bowl) rice labour
1998/99 2007/08 2011/12 1998/99- 2007/08 2007/08-2011/12 1998/99-2011/12
8.83 9.00 8.20 2 -9 -7
Vietnam 2005, 2009 2012 2005-2009, 2009-2012
2005-2012
National, agriculture, forestry and fishing work, state sector
4.05, 6.29 8.63 55,37 113
Daily wage agricultural labourer 1993 = 1.45; 1998 = 2.13
2002
2.16
Average income of wage worker in rural areasc
2007, 2010 2012 2007-2010, 2010-2012
2007-2012
3.92,4.69 5.26 20, 12 34
Thailand 2001 2007 2013 2001-2007 2007-2013 2001-2013

32 ODI Report
US$ real daily wages (constant 2010a) Change in wages (%)
Average daily wages
Early 2000s Mid-2000s 2010s Early 2000s-mid-2000s
Mid-2000s-2010s Early 2000s- 2010s
National, skilled agriculture and fishing workers
4.02 5.36 6.81 33 27 69
Burma/Myanmar 1998 2004 1998-2004
Ayeyarwardy, rice labour
1.55 2.26 45
Republic of Korea 2000 2006 2000-2006
National, field crop worker
41.21 56.20 36
National, dairy product processor
1996 2001 2006 1996-2001 2001-2006 1996-2006
39.12 44.52 51.03 14 15 30
Malaysia 2010 2012 2010-2012
National, agriculture sector
10.82 11.75 9
Nepal 1995/96 2003/04 2010/11 1995/96-2003/04 2003/04-2010/11 1995/96-2010/11
National, agriculture sector
1.39 1.73 2.22 24 29 60
Sri Lanka 2007 2012 2007-2012
National, agriculture daily work
2.24 3.08 38
Notes: a) Values all in constant 2010 values except for Burma/Myanmar, which is in constant 2012 values, owing to currency valuation; b)
2013 data for Indonesian animal husbandry workers goes to June; c) data on average income of wage workers in rural areas — included to
show the contrast between state sector wages and average worker incomes.
The three dates over which the data are presented vary by country depending on availability, hence the subheadings that list the actual dates.
Where male or female is not specified, wages are not disaggregated by gender.
Source: Data from various sources, as described in Table 2. See Annex B for detailed sources and wages in local currency. (Annexes are availble
for download at: www.odi.org/rural-wages).

Rural wages in Asia 33
Figure 11: Agricultural wage changes, 13 Asian countries, early and late 2000s, average annual rates
-5 0 5 10 15 20 25 30
Philippines: SugarcanePakistan: National agPakistan: Female ag
Pakistan: Male agPhilippines: Central Luzon rice
Philippines: CornPhilippines: All cropsPhilippines: Coconut
Indonesia: West Nusa TenggaraPhilippines: Rice
Pakistan: Crop workersIndonesia: Animal husbandry
Indonesia: South SulawesiMalaysia: ag sector
India: MaleIndia: Female
South Korea: Field crop workerSouth Korea: dairy prod. processor
Indonesia: Central JavaIndonesia: East Java
Nepal: Ag sectorMyanmar: Ayeyarwardy rice
Sri Lanka: Ag dailyIndonesia: 98 villages, 7 prov, median
Bangladesh: Lean season, maleBangladesh: Peak season, male
Bangladesh: Lean season, femaleVietnam: Ag daily
Thailand: Skilled ag & fishingBangladesh: Peak season, female
Indonesia: LampungVietnam: Avg inc. wage worker, rural
Indonesia: South KalimantanChina: Jilin male
China: Jilin femaleChina: Gansu poor areas, slack season
China: Jiangsu maleChina: Gansu poor areas, harvest
China: Jiangsu femaleIndonesia: North Sulawesi
China: 5 province average maleChina: 5 province average female
Vietnam: Ag, forest, fishing, state sectorChina: Hebei male
China: Sichuan femaleChina: Sichuan maleChina: Hebei female
China: Shaanxi femaleChina: Shaanxi male
Average annual wage change period 2 Average annual wage change period 1
Source: Constructed from data in Table 5.

34 ODI Report
Figure 12: Changes in the gender wage gap in four Asian countries
76 76
82
78 77
67
74
77
73
75 76
66
77
81
76 75
78
73
60
65
70
75
80
85
0
1
2
3
4
5
6
7
8
95
prov
ince
ave
rage
Gia
ngsu
Sic
huan
Sha
anxi
Jilin
Heb
ei
5 pr
ovin
ce a
vera
ge
Gia
ngsu
Sic
huan
Sha
anxi
Jilin
Heb
ei
5 pr
ovin
ce a
vera
ge
Gia
ngsu
Sic
huan
Sha
anxi
Jilin
Heb
ei
1998 2003 2007
%
Dai
ly w
age,
US$
, con
stan
t 201
0
Male Female Female wage (% of male)
75 75 76
60
65
70
75
80
85
0
0.5
1
1.5
2
2.5
3
3.5
National National National
2000/01 2005/06 2012/13
%
Dai
ly w
age,
US$
, con
stan
t 201
0 India
50 49
3537394143454749515355
00.5
11.5
22.5
33.5
4
2007 2012
%
Dai
ly w
age,
US$
, con
stan
t 20
10
Pakistan
69
64
73 72
67
73
60
65
70
75
80
85
0
0.5
1
1.5
2
2.5
3
2000 2005 2010 2000 2005 2010
Peak season Lean season
%
Dai
ly w
age,
US$
, con
stan
t 201
0 Bangladesh
Source: Constructed from data in Table 5.

Rural wages in Asia 35
Figure 13: Changing agricultural labour productivity, 12 Asian countries, 1995-2012, gross value production per worker, constant US$ 2004/06
Source: Data from FAOSTAT.
Figure 14: Average annual growth rate of agricultural labour productivity, 12 Asian countries, 1997-2004 and 2005-2012
3.2
0.1
2.9
-0.7
2.62.2
5.0
3.1
4.0
4.9
0.9
-0.7
3.6
2.73.3
0.5
3.0
1.6
3.0
3.7
5.7
4.3
2.1 2.4
-1
0
1
2
3
4
5
6
%
Average annual growth rate 1997-2004 Average annual growth rate 2005-2012
Source: Data from FAOSTAT, simple linear growth rates computed.

Figure 15: Changes in value of manufacturing across 12 Asian countries, 1995-2012
Note: Data for China stop at 2010.
Source: Data from World Bank WDI.
36 ODI Report

Rural wages in Asia 37
availabilityforsomecountries.Averageannualchangeinruralwageswasthedependentvariable,whileindependentvariableswereaverageannualchangesinagriculturalproductivity,valueofmanufacturingandnumberofruralworkers,aswellasadummyvariabletodifferentiatebetweentheearly(1)andlate2000s(0).
Scatterplotsshowrelationsbetweenthedependentandindependentvariables(seeFigure19).Visually,itseemstheexpectedrelationsapply:increasesinagriculturallabourproductivityandmanufacturingoutputcorrespondwithincreasesinruralwages,whileincreasednumbersofruralworkerscorrespondwithslowergrowthofruralwages.
Acorrelationmatrixofthevariables(seeTable6)showschangesinruralwagesdoindeedcorrelatequitestronglywiththeindependentvariables,withcoefficientsintherange0.60-0.66.Thematrix,however,alsoshowstheindependentvariablesalsocorrelatequitestrongly.Thatchangestoruralworkforceshouldcorrelateinverselywithagriculturallabourproductivitydoesnotsurprise:iftherearefewerruralworkers,onemightexpectmechanisationandotherinvestmentsonthelandmightcompensate.Similarly,theinversecorrelationbetweenruralworkforceandgrowthofmanufacturingoutputmightbeexpectedsincesomeoftheworkersinmanufacturingmaycomefromruralareas.Neitheroftheserelations,however,areautomatic:theresultofpeopleleavingruralareascanbeabandonedfieldsratherthanhigherlabourproductivity;formanufacturing,labourmaycomefromurbanratherthanruralareas.
Thecorrespondencebetweenagriculturallabourproductivityandmanufacturingoutput,however,wasunexpected,sinceitishardtoseeadirectcausalrelation.Presumably,factorsthatdrivegrowthofmanufacturingalsoencouragehigherproductivityoflabouronfarms–suchasavailabilityofcapitalandspreadoftechnicalknowledge,expertiseandskills.
ThecorrelationmatrixhintsatsomepositivedevelopmentprocessesinAsia,inwhichvigorousgrowthofmanufacturingdrawslabourfromruralareas,whilefarmersthenusemachineryandintensifyuseofotherinputstocompensateforlostlabourandhenceraiseoutputperagriculturalworker.
Regression to explain changes in rural wagesResultsoftheregressionprovedhighlysignificant(AnovaFtest99%significant)(seeTable7),withahighadjustedR-square,indicatingtheindependentvariablescouldexplainalmosttwo-thirdsofthevariationinchangesinruralwages.Giventhelackofdegreesoffreedomfortheregression,thisisapleasingresult.
Thecoefficientsontheexplanatoryvariablesalsocarrytheexpectedsigns.Thatonagricultural labour productivityispositive,butnotsignificantinthepresenceofothervariables.Thevalue of manufacturing,incontrast,hasalargeandsignificantpositivecoefficient.Thecoefficientonruralworkersisstronglynegativeandsignificant,whilethecoefficientonthetime dummyisasmallnegative,andalsosignificant.
Thestrongestdriverofchangestoruralwagesturnsouttobenumberofruralworkers,afunctionofpopulationgrowthinruralareaslessnetmigrationfromruraltourbanareas.Thisisanintriguingresult,sinceitbegsthequestionofwhetherthevariationsingrowthoftheruralworkforceresultsprimarilyfromthedemographyofruralfertilityandlifeexpectancy,orwhetherout-migrationfromruralareasplaysasignificantrole.Becauseofalackofreadilyavailabledata,wecannotaddressthisquestionnow.12Changeinruralworkersseemstobethevariablethatmostsharplydifferentiatesthesamplecountries.
Growthofmanufacturingoutputisthenextstrongestdriverofruralwages.Themostlikelycausallinkisthat
Figure 16: Average annual growth rate of manufacturing in 12 Asian countries, 1997-2004 and 2005-2012
9.6
5.4
3.4
5.9 5.7
3.1
10.3
5.3
8.4
5.3
2.1 3.2
10.5
7.9
4.2 2.9
7.8
3.6
8.3
3.1
5.5
2.4 1.6
5.6
0
2
4
6
8
10
12
%
Average annual growth rate 1997-2004 Average annual growth rate 2005-2012
Source: Data from World Bank WDI, simple linear growth rates computed.

Figure 17: Changing rural working population, 12 Asian countries, 1995-2012
Source: Data from World Bank WDI
12 Datamightbefoundbylookingatindividualcountrycensusdata,andifnecessaryconstructingdemographicmodels.Apreliminarylookatfertilityratesshowssomestrikingreductionsinfertilitysince1970:allcountrieshaveseenhavelargereductions,althoughsomestartedthereductionsearlierthanSouthAsia.
38 ODI Report

Rural wages in Asia 39
Figure 18: Average annual growth rate of rural working population in 13 Asian countries, 1997-2004 and 2005-2012
3.2
0.1
2.9
-0.7
2.62.2
5.0
3.1
4.0
4.9
0.9
-0.7
3.6
2.73.3
0.5
3.0
1.6
3.0
3.7
5.7
4.3
2.1 2.4
-1
0
1
2
3
4
5
6
%
Average annual growth rate 1997-2004 Average annual growth rate 2005-2012
Source: Data from World Bank WDI, simple linear growth rates computed.
Figure 19: Changes in rural wages compared with those for agricultural labour productivity, manufacturing and rural workers over two periods
-4%
-2%
0%
2%
4%
6%
8%
10%
12%
14%
16%
18%
-2% 0% 2% 4% 6% 8% 10% 12% 14%
Ave
rage
ann
ual c
hang
e in
rura
l wag
es
Average annual change, independent variables
Agricultural productivity period 1
Agricultural productivity period 2
Manufacturing period 1
Manufacturing period 2
Rural workers period 1
Rural workers period 2
Linear (Agricultural productivity)
Linear (Manufacturing)
Linear (Rural workers)
Source: Constructed from various sources, see Tables 2 and 3 for details.

higherwagesinmanufacturingdrawworkersfromfarmstofactoriesandtherebydriveupruralwages.
Changestoagriculturallabourproductivitywouldbethenextstrongestinfluence,buttheresultisinsignificant.Thiscouldbebecausetherearetoofewobservationstoconfirmtheexpectedrelation,oritmaybethat,afteraccountingfortheeffectsofthetwopreviousvariables,itaddslittletoexplainchangesinruralwages.
Lastly,thedummyforthefirsthalfofthe2000sisbothsignificantandnegative,althoughthevalueofthecoefficientissmall.Presumably,itpicksouttheinfluenceofsomeomittedvariable,orelsetheinfluencesmodelledonruralwageshaveintensifiedsincethemid-2000s.Givenhowsmallthecoefficientiscomparedwiththoseontheotherexplanatories,whateverthedummyrepresentsisnotthatimportant.
Overall,itseemsthemodelsupportsinitialhypothesesaboutthefactorsexplainingchangesinruralwages.Themain
qualificationisthatthepullofmanufacturingoutperformsthatofhigheragriculturalproductivity,andbysomeconsiderablemargin.
Table 6: Correlation matrix between variables
Agricultural labour productivity
Manufacturing Rural workers
Rural wage 0.65 0.6 -0.66
Agricultural labour productivity
1.00 0.65 -0.56
Manufacturing 1.00 -0.44
Rural workers 1.00
Table 7: Multivariate regression of changes in rural wages
Dependent: change in rural wages
Coef. Std. err. T.stat. P>│t│ 95% conf. interval
Agricultural output per worker
.194 .844 0.23 0.822 -1.65 2.03
Value manufacturing
.808 .363 2.23 0.046 0.17 1.599
Rural population 15-64
-1.754 .909 -1.92 0.079 -3.72 .235
Dummy for period -.045 .017 -2.68 0.020 -.081 -.008
Constant .028 .025 1.15 0.271 -.025 .082
Note: F(4,12) = 7.95, Prob > F = 0.0023; R-squared = 0.7260, Adj R-squared = 0.6347.
Source: Regression analysis in STATA.
40 ODI Report

5. Conclusions and implications
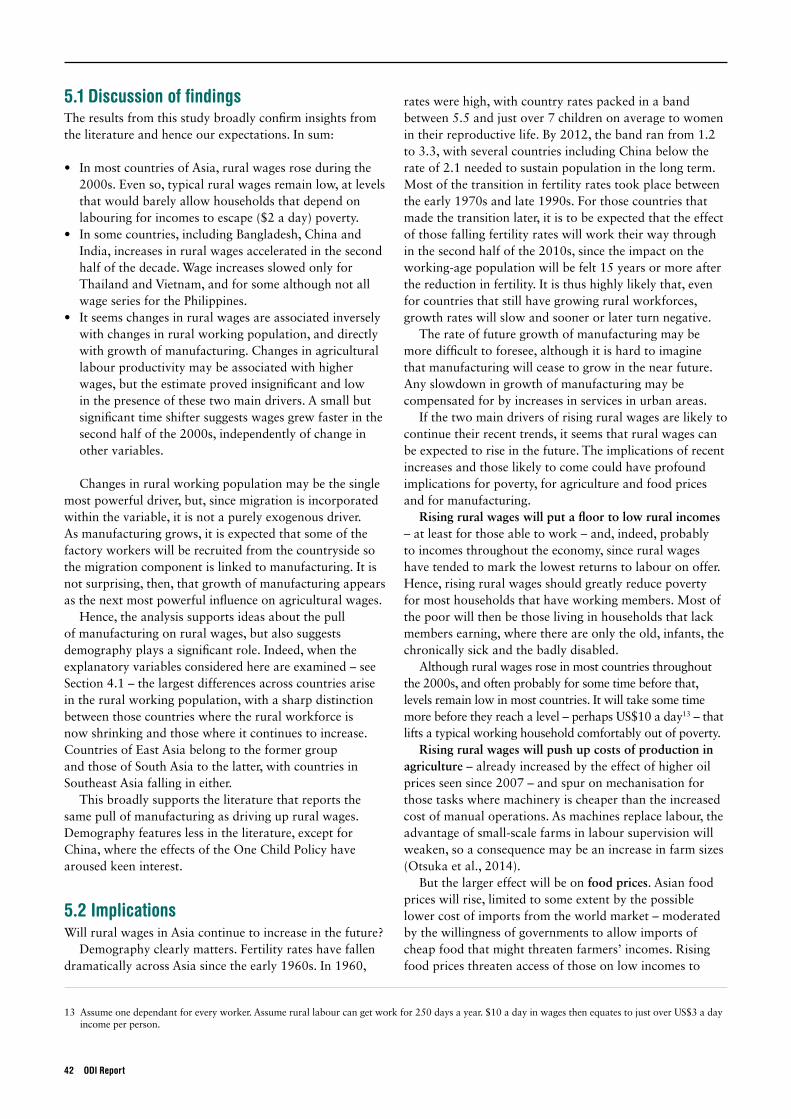
5.1 Discussion of findingsTheresultsfromthisstudybroadlyconfirminsightsfromtheliteratureandhenceourexpectations.Insum:
• InmostcountriesofAsia,ruralwagesroseduringthe2000s.Evenso,typicalruralwagesremainlow,atlevelsthatwouldbarelyallowhouseholdsthatdependonlabouringforincomestoescape($2aday)poverty.
• Insomecountries,includingBangladesh,ChinaandIndia,increasesinruralwagesacceleratedinthesecondhalfofthedecade.WageincreasesslowedonlyforThailandandVietnam,andforsomealthoughnotallwageseriesforthePhilippines.
• Itseemschangesinruralwagesareassociatedinverselywithchangesinruralworkingpopulation,anddirectlywithgrowthofmanufacturing.Changesinagriculturallabourproductivitymaybeassociatedwithhigherwages,buttheestimateprovedinsignificantandlowinthepresenceofthesetwomaindrivers.Asmallbutsignificanttimeshiftersuggestswagesgrewfasterinthesecondhalfofthe2000s,independentlyofchangeinothervariables.
Changesinruralworkingpopulationmaybethesinglemostpowerfuldriver,but,sincemigrationisincorporatedwithinthevariable,itisnotapurelyexogenousdriver.Asmanufacturinggrows,itisexpectedthatsomeofthefactoryworkerswillberecruitedfromthecountrysidesothemigrationcomponentislinkedtomanufacturing.Itisnotsurprising,then,thatgrowthofmanufacturingappearsasthenextmostpowerfulinfluenceonagriculturalwages.
Hence,theanalysissupportsideasaboutthepullofmanufacturingonruralwages,butalsosuggestsdemographyplaysasignificantrole.Indeed,whentheexplanatoryvariablesconsideredhereareexamined–seeSection4.1–thelargestdifferencesacrosscountriesariseintheruralworkingpopulation,withasharpdistinctionbetweenthosecountrieswheretheruralworkforceisnowshrinkingandthosewhereitcontinuestoincrease.CountriesofEastAsiabelongtotheformergroupandthoseofSouthAsiatothelatter,withcountriesinSoutheastAsiafallingineither.
Thisbroadlysupportstheliteraturethatreportsthesamepullofmanufacturingasdrivingupruralwages.Demographyfeatureslessintheliterature,exceptforChina,wheretheeffectsoftheOneChildPolicyhavearousedkeeninterest.
5.2 ImplicationsWillruralwagesinAsiacontinuetoincreaseinthefuture?
Demographyclearlymatters.FertilityrateshavefallendramaticallyacrossAsiasincetheearly1960s.In1960,
rateswerehigh,withcountryratespackedinabandbetween5.5andjustover7childrenonaveragetowomenintheirreproductivelife.By2012,thebandranfrom1.2to3.3,withseveralcountriesincludingChinabelowtherateof2.1neededtosustainpopulationinthelongterm.Mostofthetransitioninfertilityratestookplacebetweentheearly1970sandlate1990s.Forthosecountriesthatmadethetransitionlater,itistobeexpectedthattheeffectofthosefallingfertilityrateswillworktheirwaythroughinthesecondhalfofthe2010s,sincetheimpactontheworking-agepopulationwillbefelt15yearsormoreafterthereductioninfertility.Itisthushighlylikelythat,evenforcountriesthatstillhavegrowingruralworkforces,growthrateswillslowandsoonerorlaterturnnegative.
Therateoffuturegrowthofmanufacturingmaybemoredifficulttoforesee,althoughitishardtoimaginethatmanufacturingwillceasetogrowinthenearfuture.Anyslowdowningrowthofmanufacturingmaybecompensatedforbyincreasesinservicesinurbanareas.
Ifthetwomaindriversofrisingruralwagesarelikelytocontinuetheirrecenttrends,itseemsthatruralwagescanbeexpectedtoriseinthefuture.Theimplicationsofrecentincreasesandthoselikelytocomecouldhaveprofoundimplicationsforpoverty,foragricultureandfoodpricesandformanufacturing.
Rising rural wages will put a floor to low rural incomes –atleastforthoseabletowork–and,indeed,probablytoincomesthroughouttheeconomy,sinceruralwageshavetendedtomarkthelowestreturnstolabouronoffer.Hence,risingruralwagesshouldgreatlyreducepovertyformosthouseholdsthathaveworkingmembers.Mostofthepoorwillthenbethoselivinginhouseholdsthatlackmembersearning,wherethereareonlytheold,infants,thechronicallysickandthebadlydisabled.
Althoughruralwagesroseinmostcountriesthroughoutthe2000s,andoftenprobablyforsometimebeforethat,levelsremainlowinmostcountries.Itwilltakesometimemorebeforetheyreachalevel–perhapsUS$10aday13–thatliftsatypicalworkinghouseholdcomfortablyoutofpoverty.
Rising rural wages will push up costs of production in agriculture–alreadyincreasedbytheeffectofhigheroilpricesseensince2007–andspuronmechanisationforthosetaskswheremachineryischeaperthantheincreasedcostofmanualoperations.Asmachinesreplacelabour,theadvantageofsmall-scalefarmsinlaboursupervisionwillweaken,soaconsequencemaybeanincreaseinfarmsizes(Otsukaetal.,2014).
Butthelargereffectwillbeonfood prices.Asianfoodpriceswillrise,limitedtosomeextentbythepossiblelowercostofimportsfromtheworldmarket–moderatedbythewillingnessofgovernmentstoallowimportsofcheapfoodthatmightthreatenfarmers’incomes.Risingfoodpricesthreatenaccessofthoseonlowincomesto
13 Assumeonedependantforeveryworker.Assumerurallabourcangetworkfor250daysayear.$10adayinwagesthenequatestojustoverUS$3adayincomeperperson.
42 ODI Report

food.Thequestionthenistheextenttowhichhigherruralwagesmorethanoffsetthiseffect.Giventhateventhoseonlowincomesdonotspendalltheirincomesonfood–70%atmost–thenthewageseffectshouldoutweighthatofhigherfoodcosts.
Perhapsthemost intriguing implication is for manufacturing.Untilrecently,mostmanufacturersinAsiahavebeenabletorecruitunskilledlabourfromruralareasatlowcost,givenlowruralwages.But,asruralwagesrise,soitislikelymanufacturingwageswillhavetoincreasetorecruitnewworkers.ThiseffectisalreadybeingseenstronglyinChina,wherebothphenomenaarelinkedtoanationalworkforcethatisnowshrinkingeveryyear.Manufacturershavetwooptionsasthistakesplace:tomechaniseandtherebyeconomiseonlabour;ortorelocatetoregionsandcountrieswithlowerlabourcosts.Giventhescaleofitsmanufacturing,China’sdecisionswillbecritical.Ifthemostcommonanswerisrelocation,thenitislikelythatplantsincoastalChinawillmoveinlandtolessprosperousareaswithlowerwages,butalsorelocateoutsideofChina.NeighbouringcountriesinAsiawithlowwagesmaybethefirsttobenefitfromthis,with
Bangladesh,Burma/Myanmar,CambodiaandVietnamclearcandidates.
Thereis,however,afurtherprospect:thatofcompaniesmovingtoAfricainsearchoflowerwages.TheWorldBankreportsEthiopianfactorywagesforunskilledlabourasonequarterthoseofChinesewages.Logisticscostsarehigher,butoverallcostsarelower.OutsideAddisAbaba,thefirstpioneerwaveofrelocatedChineseplantscanbeseen.Nowthesehavebrokentheice,howmanymorewillfollow?Lin(2014,inWonacott,2014)speculatedthat85millionfactoryjobscouldleaveChinainthecomingyears.IfhalfofthosecametoAfrica,itwouldtransformacontinentwherethereisasurgeinyouthenteringthelabourmarket.Ofcourse,relocationtoAfricawillonlyhappenifroads,powersuppliesandportsareadequateandifthereispoliticalstability,
Africa’seconomicunderperformancehassincethe1970sbeenfargreaterinmanufacturingthaninfarming.RenewedgrowthofmanufacturinginAfricaledbyAsianindustrialistspromisesprosperousurbanisationwithvibrantmarketsforthosefarmersstayingontheland.Thiswouldbewelcomenewsallround,includingforagriculture.
Rural wages in Asia 43

ReferencesAra,A.(2014)‘BDWorkersNotGettingDueSalaryinMalaysia’.TheFinancialExpressBangladesh,12May,http://
www.thefinancialexpress-bd.com/2014/05/12/33553Arias-Vazquez,F.J.,Lee,J.N.andNewhouse,D.(2013)‘TheRoleofSectoralGrowthPatternsinLaborMarket
Development’.BackgroundPaperfortheWorldDevelopmentReport2013.Beltran,J.C.,Pannell,D.J.andDoole,G.J.(2011)‘EconomicImpactsofHighLabourCostandHerbicideResistancefor
theManagementofAnnualBarnyardgrass(Echinochloacrus-galli)inRiceProductioninthePhilippines’.WorkingPaper1116.Perth:UniversityofWesternAustralia
Berg,E.,Bhattacharyya,S.,Durgam,R.andRamachandra,M.(2012)‘CanRuralPublicWorksAffectAgriculturalWages?EvidencefromIndia’.WorkingPaperWPS/2012-05.Oxford:CSAE.
Bhalla,S.,Karan,A.K.andShobha,T.(2004)‘RuralCasualLabourers,WagesandPoverty:1983to1999–2000’.Manchester:CPRC.
BloombergNews(2013)‘FoxconnPlantinPeanutFieldShowsLaborErodingChinaEdge’,26March,http://www.bloomberg.com/news/2013-03-26/foxconn-plant-in-peanut-field-shows-labor-eroding-china-s-edge.html
Carsten,PandTemphairojana,P.(2013)‘Thailand’sBoom:TotheNortheasttheSpoils’.Reuters,15June,http://www.reuters.com/article/2013/06/16/thailand-northeast-idUSL3N0DJ2N820130616
Choudhury,C.(2014.)‘India’sEconomyLeavesJobGrowthintheDust’.BloombergView,4March,http://www.bloombergview.com/articles/2013-03-14/india-s-economy-leaves-job-growth-in-the-dust
Das,M.andN’Diaye,P.(2013)‘ChronicleofaDeclineForetold:HasChinaReachedtheLewisTurningPoint?’WorkingPaperWP/13/26.Washington,DC:IMF.
Dasgupta,S.andKim,K.B.(2011)‘CoordinatedMacroeconomic,EmploymentandSocialProtectionPoliciesinAsiaandthePacific’.Asia-PacificWorkingPaperSeries.Geneva:ILO.
Datt,G.andRavallion,M.(1998)‘FarmProductivityandRuralPovertyinIndia’.JournalofDevelopmentStudies34(4):62-85.Dawn.com(2014)‘OverHalfofPakistanLivesunderPovertyLine:Dar’,3June,http://www.dawn.com/news/1110248/
over-half-of-pakistan-lives-under-poverty-line-darDelCarpio,X.,Messina,J.andSanz-de-Galdeano,A.(2014)‘MinimumWage:DoesItImproveWelfareinThailand?’
IZADiscussionPaper7911.Bonn:InstitutefortheStudyofLabor.Drysdale,P.(2014)‘China’slabourshortageandthepaceandstructureofgrowth.’EastAsiaForum.http://www.
eastasiaforum.org/2014/06/16/chinas-labour-shortage-and-the-pace-and-structure-of-growth/Fields,G.S.(2004)‘DualismintheLaborMarket:APerspectiveontheLewisModelAfterHalfaCentury’.The
ManchesterSchool72(6):724-735.Gulati,A.,Surbhi,J.andSatija,N.(2013)‘RisingFarmWagesinIndia:The“Pull”and“Push”Factors.NewDelhi:
CommissionforAgriculturalCostsandPrices,MinistryofAgriculture.Harahap,F.andBarichello,R.(2013)‘DeterminantsofRuralWageRatesinJava:HowtoReduceRuralPoverty’.
PresentationtoAgriculturalandResourceEconomics,UC-Davis,31October.Harahap,F.andBarichello,R.(2014)‘HowtoReduceRuralPoverty:DeterminantsofJava’sAgriculturalWageRates’.
AsianDevelopmentBankSeminar.Herr,H.andKazandziska,M.(2011)‘PrinciplesofMinimumWagePolicy–Economics,Institutionsand
Recommendations’.WorkingPaperNo.11.Geneva:ILO.Ho,Y.-M.(1972)‘DevelopmentwithSurplusPopulation–theCaseofTaiwan:ACritiqueoftheClassicalTwo-Sector
Model,alaLewis’.EconomicDevelopmentandCulturalChange20(2);210-234.Hossain,A.A.(2008)‘RuralLabourMarketDevelopments,AgriculturalProductivity,andRealWagesinBangladesh,
1950-2006’.ThePakistanDevelopmentReview47(1):89-114.Hossain,M.,Sen,B.andSawada,Y.(2013).‘Jobs,GrowthandDevelopment:Makingofthe“Other”Bangladesh’.
BackgroundPaperfortheWorldDevelopmentReport2013.Htike,Z.(2014)‘FarmersPonderFutureasLabourFlees’.MyanmarTimes,26May,http://www.mmtimes.com/index.
php/business/10445-farmers-ponder-future-as-labour-flees.htmlJacoby,H.G.(2013)‘FoodPrices,Wages,andWelfareinRuralIndia’.PolicyResearchWorkingPaper6412.
WashingtonDC:WorldBank.Jorgenson,D.W.(1967)‘SurplusAgriculturalLabourandtheDevelopmentofaDualEconomy’.OxfordEconomic
Papers19(3):288-312.Knight,J.;Y.Zeng&Z.Liang,(2013)‘China’sdecliningworking-agepopulation’EastAsiaForum.http://www.
eastasiaforum.org/2013/04/19/chinas-declining-working-age-population/
44 ODI Report
Rural wages in Asia 45
Krishnan,U.(2013)‘India’sRuralSilentRevolutionSpursSpending’.BloombergNews,23September,http://www.bloomberg.com/news/2013-09-22/india-s-rural-silent-revolution-spurs-spending-in-boon-for-singh.html
Lau,K.&S.Green(2013),‘China’srisingwagesinquestforruralworkersreachacriticalmilestone’TheNation.http://www.nationmultimedia.com/business/Chinas-rising-wages-in-quest-for-rural-workers-rea-30207052.html
Leung,S.(2011)‘Indonesia,Bangladesh“Winners”asChinaCostsRise,KPMGSays’.BloombergNews,15September,http://www.bloomberg.com/news/2011-09-15/indonesia-bangladesh-winners-as-china-costs-rise-kpmg-says.html
Lewis,W.A.(1954)‘EconomicDevelopmentwithUnlimitedSuppliesofLabor’.ManchesterSchool22(2)139-191,reprintedinA.N.AgarwalaandS.P.Singh(1958)(eds)TheEconomicsofUnderdevelopment.NewYork:OxfordUniversityPress.
Li,Q.,Huang,J.,Luo,R.andLiu,C.(2013),China’sLaborTransitionandtheFutureofChina’sRuralWagesandEmployment.China&WorldEconomy,21:4–24.doi:10.1111/j.1749-124X.2013.12019.x
Meng,X.(2013)‘WhatWorkerShortage?TheRealStoryofChina’sMigrants’Blog.http://blogs.wsj.com/chinarealtime/2013/01/04/what-worker-shortage-the-real-story-of-chinas-migrants/
Narayanamoorthy,A.andBhattarai,M.(2013)‘RuralEmploymentSchemeandAgriculturalWageRateNexus:AnAnalysisacrossStates’.AgriculturalEconomicsResearchReview26:149-163.
Narayanamoorthy,A.andBhattarai,M.(2013)‘RuralEmploymentSchemeandAgriculturalWageRateNexus:AnAnalysisacrossStates’.AgriculturalEconomicsResearchReview26:149-163.
Nguyen,D.K.(2006)‘EffectsofRicePricesonAgriculturalWageRatesinVietnam’.MScThesis.OmanTribune(2014)‘RisingUnemployment,PopulationThreatenCountry’sEconomicOutlook’,4June,http://www.
omantribune.com/index.php?page=news&id=169035&heading=PakistanOtsuka,Keijiro,YanyanLiu,andFutoshiYamauchi,2014(forthcoming),‘TheFutureofSmallFarmsinAsia’,Paper
[Draft]forFutureAgriculturesConsortium.Oostendorp,R.(2012)‘TheOccupationalWagesaroundtheWorld(OWW)Database:Updatefor1983-2008)’.
BackgroundPaperfortheWorldDevelopmentReport2013.Palmer-Jones,R.andParikh,A.(1998)‘TheDeterminationofAgriculturalWageRatesinBangladesh’.Journalof
AgriculturalEconomics49(1):111-133.Raghu,A.(2014)‘LabourCrunchHurtsMalaysianPalmOilGrowersasIndonesiansStayHome’.Reuters,27April,
http://www.reuters.com/article/2014/04/27/us-palmoil-labour-idUSBREA3Q0P320140427Ranis,G.(2012)‘LaborSurplusrevisited’.EconomicGrowthCentreDiscussionPaperNo.1016.YaleUniversity.Reyes,C.&A.Tabuga(2011)‘PovertyandgrowthinthePhilippines’.EastAsiaForum.http://www.eastasiaforum.
org/2011/09/06/poverty-and-growth-in-the-philippines/SelvaMaheshwari,M.andGangwar,L.S.(2011)‘ImpactofRuralDevelopmentSchemeonAvailabilityofAgriculturalLabour
–AStudyofDairyFarmersinThanjavurDistrictofTamilNadu’.AgriculturalEconomicsResearchReview24:409-414.ThaiPBS(2014)‘89MyanmarWorkersReturnfromMalaysiaafterBrawl’,ThaiPBS,9January,http://englishnews.
thaipbs.or.th/89-myanmar-workers-return-malaysia-brawl/Thomas,J.J.(2012)‘India’sLabourMarketduringthe2000s:SurveyingtheChanges’.SpecialArticle.Economicand
PoliticalWeekly47(51).UNDESA(UNDepartmentofEconomicandSocialAffairs)(2005)‘WorldPopulationProspects:The2005Revision’.
NewYork:PopulationDivision,UNDESA.UNDESA(UNDepartmentofEconomicandSocialAffairs)(2006)‘WorldPopulationProspects:The2006Revision’.
NewYork:PopulationDivision,UNDESA.Usami,Y.(2012)‘RecentTrendsinWageRatesinRuralIndia:AnUpdate.’ReviewofAgrarianStudiesWinters,P.,delaO,A.P.,Quiñones,E.J.,Hertz,T.,Davis,B.,Zezza,A.,Covarrubias,K.andStamoulis,K.(2008)‘Rural
WageEmploymentinDevelopingCountries’.Rome:FAO.Wonacott,P.(2014)‘ChinaInc.MovesFactoryFloortoAfrica.RiseWagesatHomeSpurMakersofShoes,TVs,Carsto
ExpandontheContinent’.WallStreetJournal,14May.Yamauchi,F.(2014)‘Roads,LaborMarketsandReturnstoHumanCapital:EvidencefromRuralIndonesia’.
ForthcomingWorkingPaper.Washington,DC:WorldBank.Yamauchi,F.,Muto,M.,Chowdhury,S.andDewina,R.(2011)‘AreSchoolingandRoadsComplementary?Evidence
fromIncomeDynamicsinRuralIndonesia’.WorldDevelopment39:2232-2244.Zahid,S.H.(2014)‘IsRMGBecomingUnattractivetoRuralwomenWorkforce?’TheFinancialExpressBangladesh19May.Zhang,X.,Yang,J.andWang,S.(2010)‘ChinaHasReachedtheLewisTurningPoint’.DiscussionPaper977.
Washington,DC:IFPRI.Zhang,X.,Rashid,S.,Ahmad,K.,Mueller,V.,Lee,H.L.,Lemma,S.,Belal,S.andAhmed,A.(2013)‘RisingWagesin
Bangladesh’.DiscussionPaper01249.Washington,DC:IFPRI.

Zhang,Y.(2011)‘TheImpactofChina’s12thFive-YearPlan’.EastAsiaForum,24April,http://www.eastasiaforum.org/2011/04/24/the-impact-of-china-s-12th-five-year-plan/
Zheng,L.(2013).‘ChinaRural-IncomeGainsAidShiftTowardConsumption’.BloombergNews.http://www.bloomberg.com/news/2013-01-29/china-rural-income-gains-aid-shift-toward-consumption.html
Zhu,A.andCai,W.(2012)‘TheLewisTurningPointinChinaanditsImpactsontheWorldEconomy’.WorkingPaper1.Brussels:AUGUR.
46 ODI Report

ODI is the UK’s leading independent think tank on international development and humanitarian issues.
Readers are encouraged to reproduce material from ODI Reports for their own publications, as long as they are not being sold commercially. As copyright holder, ODI requests due acknowledgement and a copy of the publication. For online use, we ask readers to link to the original resource on the ODI website. The views presented in this paper are those of the author(s) and do not necessarily represent the views of ODI.© Overseas Development Institute 2014. This work is licensed under a Creative Commons Attribution-NonCommercial Licence (CC BY-NC 3.0).ISSN: 2052-7209
All ODI Reports are available from www.odi.org
Cover photo: © World Bank Photo Collection: Rice fields in Mai Chau, Vietnam
Overseas Development Institute203 Blackfriars Road London SE1 8NJTel +44 (0)20 7922 0300 Fax +44 (0)20 7922 0399
www.odi.org