Rural to urban journeys - Northern Ireland Assembly
14
Research and Library Services Northern Ireland Assembly Research Paper 81/10 March 2010 RURAL TO URBAN JOURNEYS Desmond Mcibbin This paper discusses the prevalence of car journeys which are made from rural to urban areas of Northern Ireland in order to access essential services and employment. Library Research Papers are compiled for the benefit of Members of The Assembly and their personal staff. Authors are available to discuss the contents of these papers with Members and their staff but cannot advise members of the general public.
Transcript of Rural to urban journeys - Northern Ireland Assembly

Research and Library Services
Northern Ireland Assembly
Research Paper 81/10 March 2010
RURAL TO URBAN JOURNEYS
Desmond Mcibbin
This paper discusses the prevalence of car journeys which are made from rural to urban areas of Northern Ireland in order to access essential services and employment.
Library Research Papers are compiled for the benefit of Members of The Assembly and their personal staff. Authors are available to discuss the contents of these papers with Members and their staff but cannot advise members of the general public.

Northern Ireland Assembly, Research and Library Service
Providing research and information services to the Northern Ireland Assembly
SUMMARY OF KEY POINTS The average person in Northern Ireland travelled 6,033 miles between 2006 and 2008 The average person in Northern Ireland made 81.5 per cent of all their journeys between 2006 and 2008 by car. Commuting to and from work accounts for more miles per person than any other activity The ‘proximity to services’ domain in the Northern Ireland Multiple Deprivation Measure (NIMDM) provides the best available data to demonstrate the distances people travel to access key services although it does not explicitly show rural to urban journeys. The NIMDM shows that across Northern Ireland the majority of the country has poor access to services. Patterns of commuting are typically analysed using Census origin-destination data using the information: where an individual lives and the address of that person’s main job. The major drawback with using Census data for analysing commuting patterns is that they become out of date. In Northern Ireland commuters rely heavily on cars and only a small percentage use public transport Belfast is the main centre of employment, administration and commerce for Northern Ireland and provides almost 30% of the total employment in Northern Ireland (this figure rises to 50% in the Belfast Metropolitan Area). A large percentage of people in the district council areas nearest Belfast commute there for work The data shows a tendency towards people travelling towards urban centres for work

Northern Ireland Assembly, Research and Library Service
Providing research and information services to the Northern Ireland Assembly
CONTENTS Introduction ..................................................................................................................1
Travel behaviour in Northern Ireland............................................................................1
The Northern Ireland Multiple Deprivation Measure (NIMDM).....................................2
Proximity to Services Domain ...........................................................................2
Travelling to work .........................................................................................................3
Transport Mode.................................................................................................4
Belfast Metropolitan Area..................................................................................4
Urban to rural journeys for work........................................................................4
Case study: Fermanagh....................................................................................6

Northern Ireland Assembly, Research and Library Service
Providing research and information services to the Northern Ireland Assembly - 1 -
INTRODUCTION At the meeting of the Committee for Regional Development on the 17th February 2010 members received a presentation based on a research paper entitled, ‘Sustainable Transport: actions in Scotland, the Republic of Ireland, England and Wales’. Following the presentation it was suggested that planning policy does not encourage the establishment of businesses in rural areas and this could have an impact on the future of any sustainable transport policies. Members therefore, requested details on the number and percentage of cars in Northern Ireland that travel from rural to urban areas for the purpose of accessing work and other important services as a way of highlighting the centralisation of employment and essential services. This paper consults the relevant data sources and provides an outline of travel behaviour in Northern Ireland. TRAVEL BEHAVIOUR IN NORTHERN IRELAND The Department for Regional Development in Northern Ireland commissioned the Central Survey Unit of the Northern Ireland Statistics and Research Agency (NISRA) to undertake the Travel Survey in Northern Ireland (TSNI). The main survey in Northern Ireland began as a continuous survey in March 1999 and has been running on a monthly basis since then. The TSNI surveys around 145 addresses each month. The survey shows that the average person in Northern Ireland travelled 6,033 miles between 2006 and 2008. 3,230 (53.5%) miles were covered driving a car and a further 1,686 (28%) were covered as a passenger of a car. On the basis of these figures, the average person in Northern Ireland made 81.5% of all their journeys between 20056 and 2008 by car. Ulsterbus accounted for 4.5% of journeys made while walking accounted for just over 2 per cent. The survey also looked at why people in Northern Ireland are making these journeys and it measures the average distance travelled according to purpose. Results show that commuting; defined as travelling to or from work, is where most miles are accrued, accounting for 21% of total miles, while shopping accounts for 15%, visiting friends homes 13% and personal business; defined as travelling to access services such as banks, doctor etc accounts for 11%. The remaining 40% was made up of various social activities Figure one shows the average length of journey by purpose. What immediately stands out is that travelling to a holiday base accounts for the longest journey, on average (37.4 miles) although this not surprising given that most holidays are taken away from where people tend to carry out their daily activitiesi. This type of journey is however, made relatively infrequentlyii, with the average number of miles travelled per year for holidays or day trips totalling 447 miles while miles travelled for business and commuting total 3975 across 400 separate trips.
iThe TSNI only looks at distances travelled within Northern Ireland, therefore someone travelling from Belfast to Galway (in the Republic of Ireland) via Enniskillen, for example, will only have their journey counted as far as Belcoo where they will cross the border. ii 6 journey’s to a holiday base per year and 17 day trips

Northern Ireland Assembly, Research and Library Service
Providing research and information services to the Northern Ireland Assembly - 2 -
Figure 1: Average journey length by purpose: 2006-2008
37.414.9
13.28.5
7.87.87.6
6.75.7
5.14.64.3
2.72.3
1.4
0 5 10 15 20 25 30 35 40
Holiday base
Business
Day Trip
Commuting
Visit friends at private home
Cvisit friends elsewhere
Entertainment/public social activities
Sport participate
Other escort
Personal Business
Shopping
Education
Undefined purpose
Escort education
Other/Just walk
Purp
ose
for T
rave
lling
Average Journey Length (Miles)
Source: NISRA (2008)1 What this data demonstrates is that the average journeys made by people to work (8.5 miles), to visit friends (7.8 miles), to carry out personal business (4.6 miles), and to go shopping (4.6 miles) could not conveniently be made by walking and therefore would require access to either a car or some form of public transport. THE NORTHERN IRELAND MULTIPLE DEPRIVATION MEASURE (NIMDM) The Northern Ireland Multiple Deprivation Measure is based on the concept that deprivation (in contrast to poverty which is seen as a lack of fiscal resources) occurs across a variety of social, economic and environmental provisions which include:
• Income • Employment • Health • Education, Skills and Training • Proximity to Services • The Living Environment • Crime and Disorder
The proximity to services domain provides the best available data to demonstrate the distances people travel to access key services although it does not explicitly show rural to urban journeys. PROXIMITY TO SERVICES DOMAIN “The purpose of this domain is to measure the extent to which people have poor geographical access to key services, including statutory and general services”2. This measurement is based on a series of indicators:
• Road distance to a GP premises (2004, Source: Central Services Agency
(CSA))

Northern Ireland Assembly, Research and Library Service
Providing research and information services to the Northern Ireland Assembly - 1 -
• Road distance to an Accident and Emergency hospital (2004, Source: Department of Health Social Services and Public Safety (DHSSPS))
• Road distance to a dentist (2004, Source: CSA) • Road distance to an optician (2004, Source: CSA) • Road distance to a pharmacist (2004, Source: CSA) • Road distance to a Job Centre or Jobs and Benefit office (2004, Source:
Department of Education and Learning (DEL)) • Road distance to a Post Office (2004, Source: Post Office Ltd) • Road distance to a food shop (2003, Source: Census of Employment) • Road distance to the centre of a settlement of 10,000 or more people (2004,
Source: Northern Ireland Statistics and Research Agency (NISRA)) Figure two shows the Proximity to Services Deprivation Domain for Northern Ireland. This shows that across Northern Ireland the majority of the country has poor access to services, demonstrated by the dark blue colouring of the map. The areas with the highest levels of deprivation in terms of having to travel long distances to key services are in Fermanagh, Omagh, Strabane, the west of Dungannon, Moyle and Larne. Areas which are less deprived in terms of distance to services are the main towns and cities and surrounding areas, for example, Belfast, Coleraine, Derry, Omagh, Enniskillen, Newry, Downpatrick, Lisburn and Antrim. There are limitations with the access to services domain as an indicator of deprivation, largely due to a lack of relevant data. For example, in the consultation document for the NIMDM 2005 it was proposed that an indicator which comprised access to a car and access to public transport should be included. It was felt however that the data was either outdated or unreliable. In terms of access to a car, the most reliable source was the 2001 census which looks at cars per household, however, this would assume that all members of the household have access to that car or cars, when in fact this is often not the case meaning many members of the household still must rely on public transport, or lifts to access services. The lack of this type of data means that this domain is based solely on distances to a number of key services and while this is useful it is perhaps misleading when viewed in isolation given that for many people, living in rural areas with a certain degree of isolation, is a lifestyle choice. When the overall map of multiple deprivation (figure3) is consulted it clearly shows that the areas inside the major towns and cities that have access to services are often more deprived (based on other indicators), than those in rural areas which are largely less deprived, with North Tyrone, South Derry and parts of South Armagh providing notable exceptions. It is suggested that an indicator which looks at households without access to a car would provide a stronger representation of access to services deprivation for rural areas, however, up-to-date data for this will not become available until after the next censusiii.
iii (NISRA) Northern Ireland Statistics and Research Agency (2005) “Northern Ireland Multiple Deprivation Measures 2005. Department of Finance and Personnel: Belfast

Northern Ireland Assembly, Research and Library Service
Providing research and information services to the Northern Ireland Assembly - 2 -
Figure 2: Proximity to Services Domain for Northern Ireland (SOAs)
Source: NISRA (2005)3
Figure 3: Multiple Deprivation Measure for Northern Ireland (SOAs)
Source NISRA (2005)

Northern Ireland Assembly, Research and Library Service
Providing research and information services to the Northern Ireland Assembly - 3 -
TRAVELLING TO WORK Patterns of commuting are typically analysed using Census origin-destination data using the information: where an individual lives and the address of that person’s main job. These data provide a very rich source of information on commuting flows for all workers; however, the major drawback with using Census data for analysing commuting patterns is that they become out of date. The last census was 2001 and for the purpose of answering the question of the number of workers travelling from rural to urban areas for work this is the best available source. Data from the Labour Force Survey (LFS) show that in autumn 2007 the average time spent travelling from home to work in Great Britain (GB) was 27 minutes. In addition the National Travel Survey 2006 (Department for Transport (DfT), 2006) found that one fifth of all km travelled in GB were due to commuting, and this correlates with the data from the NITS which shows that commuting accounts for 21% of total miles travelled. These figures suggest that commuting is highly important in terms of the way people spend their time, in contributing to overall travel patterns and, depending on the mode of transport used, in influencing national carbon emissions4. Figure 4: All occupations: percentage of workers using car/van transport by LSOA/DZ (Left) and percentage of workers using public transport by LSOA/DZ (right)

Northern Ireland Assembly, Research and Library Service
Providing research and information services to the Northern Ireland Assembly - 4 -
TRANSPORT MODE Figure 4 shows that in Northern Ireland there is a very high reliance on cars and vans for the purpose of commuting which is demonstrated by the dark blue covering which is over much of the country. This indicates that 73.1% or more of people use a car to commute while the other predominant colour is light blue indicating a range of 67.6% to 73%. In contrast the map on the right (figure 4) demonstrates a very low usage of public transport services; outside of the Belfast Metropolitan Area only 4.3% or less of the population use public transport while around some of the larger urban centres such as Londonderry and Newry for example, this increases up to 7.6%. BELFAST METROPOLITAN AREA The Belfast metropolitan Area is the largest Urban Centre in Northern Ireland with a population of approximately 645, 000 while almost 1.3 million people live within a 50 mile radius. Belfast is the main centre of employment, administration and commerce for Northern Ireland5 and provides almost 30% of the total employment in Northern Ireland (this figure rises to 50% in the Belfast Metropolitan Area)6. Research carried out in 1999 as part of the preparation of the Belfast Metropolitan Transport Plan estimated the daily number of cars travelling into and out of Greater Belfast at 297,000 carsiv while the number of cars travelling into and out of Belfast's central core on a daily basisv, was estimated at 149,0007. A survey carried out in November 2005 to establish the mode of transport used by people travelling into Belfast's inner cordon during the morning peak hour showed that 68 per cent of all cars were driver-only occupancy.9 RURAL TO URBAN COMMUTING The 2001 census data showed that there were 243, 972 rural dwellersvi employed and working in Northern Ireland. 113, 351 (46%) of these people work in urban areas and 35% of those working in urban areas are employed within the Belfast Metropolitan Urban Area (BMUA). When area of workplace is compared to area of residence at the district council level it provides some interesting statistics. For example, of the 34, 038 (employed) people living in North Down only 16,534 (48%) actually work in the area while 32% work within the Belfast district council area. Similarly in Newtownabbey 42% work locally while 39% work in Belfast. Of course these areas are within a relatively short commuting distance to Belfast and similarly close areas such as Castlreagh (52%) and Lisburn (32%) also have high percentages of their population working in the Belfast area. For the vast majority of employed people (229,282) living in the Belfast Metropolitan Urban Area (BMUAvii) 88% also work there. Figure 5 is a graphical representation of the commuter flows into the Belfast Area from the Newtownabbey district council area and is useful in demonstrating the high flow of people travelling in from this area. iv Based on cars travelling across the outer cordon, defined by the A55 outer ring road at v Defined as the area bounded by Westlink in the West of the City and the River Lagan in the South and East vi People living in Settlements classified in Bands F, G or H vii Belfast; Carrickfergus; Carryduff; Castlereagh; Lisburn; Milltown; Greenisland; Newtownabbey; Bangor; Groomsport and Crawfordsburn; Helens Bay; Holywood; and Seahill

Northern Ireland Assembly, Research and Library Service
Providing research and information services to the Northern Ireland Assembly - 5 -
Figure 5: Commuter flows from Newtownabbey District council Areaviii
These flows would be very similar for all the surrounding district council areas, like North Down, Carrickfergus, Castlereagh, Lisburn and Antrim, although we can see from figure 6 that in North West Antrim over 70% live and work in the same area, although this area is particularly rural with the main commuter flows going towards Ballymena and Antrim Town. In parts of South Antrim less than 20% live and work in the same area, here the main commuter flow is towards Belfast and Antrim town (see figure 7).
Figure 6: percentage of people who work in Antrim and also live there
viii All maps created using CommuterView. Supplied by the Office of National Statistics (ONS); General Register Office for Scotland (GROS); and the Northern Ireland Statistics and Research Agency (NISRA)

Northern Ireland Assembly, Research and Library Service
Providing research and information services to the Northern Ireland Assembly - 6 -
Figure 7: Example of commuter flows from North and South Antrim
CASE STUDY: FERMANAGH
Figure 8: % of population working in Fermanagh who also live there
Figure 8 (above) shows that for many parts of the county a large percentage of those who are in employment, work and live in the same area. However, around Enniskillen this percentage drops below 34% and even as low as 20% in some areas. Looking at the statistics for Fermanagh District Council 19,162 (88%) of the 21,725 total people in employment also work in the district council area. 4% do however, work in Omagh; 2.5% work in Belfast; 2% work in Dungannon and there are people from Fermanagh

Northern Ireland Assembly, Research and Library Service
Providing research and information services to the Northern Ireland Assembly - 7 -
who travel to every other district council area in Northern Ireland for work (see figure 9). Figure 10 shows that for many parts of the county employment was at between 50 to 59%.
Figure 9: Map showing major commuter flows out of Fermanagh
Figure 10: % of All Fermanagh residents in employment
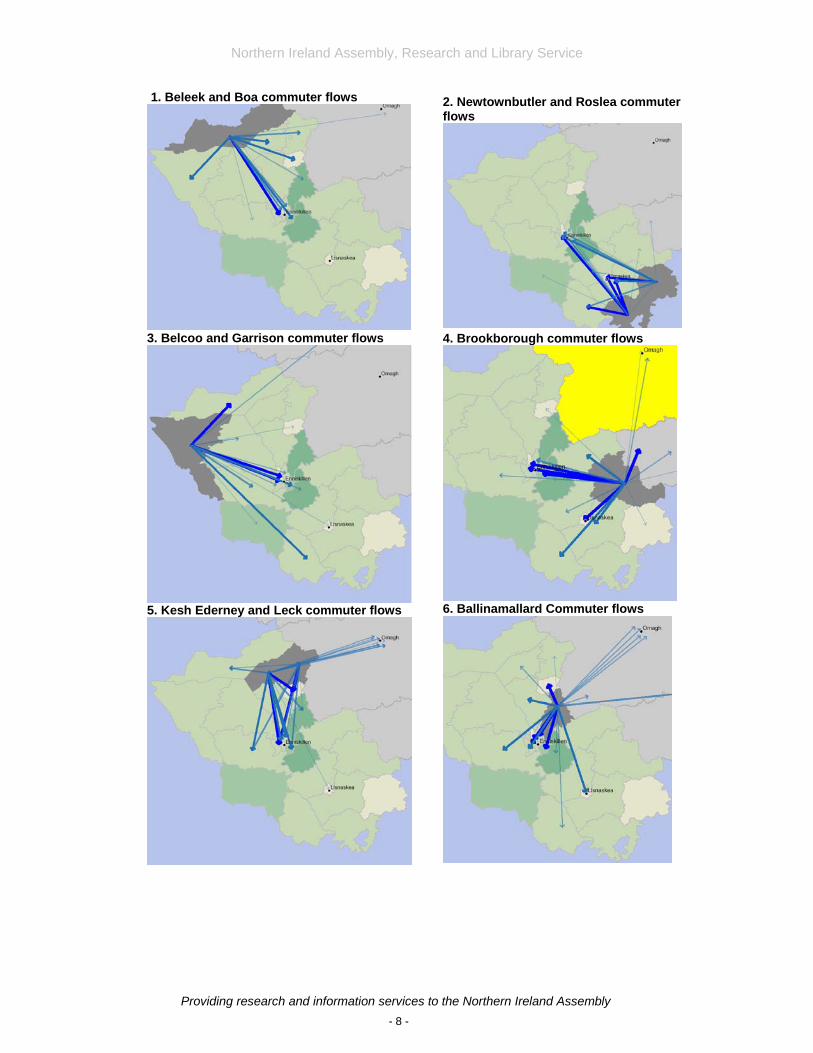
In terms of commuter flows, either within or out of Fermanagh we can see from that maps 1-6 (next page) the majority of these are directed from rural areas into the more urban areas of Fermanagh particularly the urban centre of Fermanagh; Enniskillen which is classified as a medium town (Band D). Lisnaskea is the next largest settlement in Fermanagh however it is classified as a rural area based on the census and is an intermediate settlement (Band F) while Irvinestown is a village (Band G). The maps also demonstrate that people in settlements towards the East of Fermanagh are more likely to travel to urban centres like Omagh and even Belfast.
Northern Ireland Assembly, Research and Library Service
Providing research and information services to the Northern Ireland Assembly - 8 -
1. Beleek and Boa commuter flows
3. Belcoo and Garrison commuter flows
5. Kesh Ederney and Leck commuter flows
2. Newtownbutler and Roslea commuter flows
4. Brookborough commuter flows
6. Ballinamallard Commuter flows
Northern Ireland Assembly, Research and Library Service
Providing research and information services to the Northern Ireland Assembly - 9 -
References 1 (NISRA) Northern Ireland Statistics and Research Agency (2008) “Travel Survey for Northern Ireland 2006-2008”. (DRD) Department for Regional Development: Belfast 2 (NISRA) Northern Ireland Statistics and Research Agency (2009) “Northern Ireland Multiple Deprivation Measures 2009: Consultation Document”. Department of Finance and Personnel: Belfast 3 (NISRA) Northern Ireland Statistics and Research Agency (2005) “Northern Ireland Multiple Deprivation Measures 2005. Department of Finance and Personnel: Belfast 4 Littlefield, M. and Nash, A. (2008) “Commuting Patterns as at the 2001 Census, and their Relationship with Modes of Transport and Types of Occupation”. Office for National Statistics: London [online] accessed 14/03/2010 available from: http://www.neighbourhood.statistics.gov.uk/HTMLDocs/images/Commuting%20by%20Occupation%20and%20Transport%20-%20Final%20for%20pdf_tcm97-70153.pdf 5 6 Belfast City Council (2008) “Belfast: A Profile of the City 2008-2009”. Belfast City Council: Belfast [online] accessed 11/03/2010 available from: http://www.belfastcity.gov.uk/factsandfigures/docs/BelfastProfileOfTheCity08.pdf 7 Letter from The Chief Executive of Roads Service (Dr. Malcolm McKibbin) to Mr. Gregory Campbell, the Secretary of State for Northern Ireland in answer to the question; how many commuter car journeys are estimated to be undertaken in and out of Belfast on a daily basis; and what percentage is estimated to be driver-only occupancy. Dated 6 April 2006 [online] accessed 25/02/2010 available from: http://www.publications.parliament.uk/pa/cm200506/cmhansrd/vo060418/text/60418114.htm