Rural Relevance Under Health Reform Research from the Hospital Strength Index Michael Topchik Senior...
35
Rural Relevance Under Health Reform Research from the Hospital Strength Index Michael Topchik Senior Vice President [email protected] 207-518-6705
-
Upload
silas-daniel -
Category
Documents
-
view
213 -
download
0
Transcript of Rural Relevance Under Health Reform Research from the Hospital Strength Index Michael Topchik Senior...

Rural Relevance Under Health Reform
Research from the Hospital Strength Index
Michael TopchikSenior Vice [email protected]

“$37 screws, a $7,622 coffee maker, $640 toilet seats; suppliers to our military just won't be oversold”
Headlines of inefficiency from the past

Headlines of inefficiency from last year
“Pay until it hurts”, “A Bitter Pill”, “How to bring price of healthcare into the open”

Headlines of inefficiency from last month
“In 2012, hospitals charged more for every one of 98 common ailments that could be compared to the previous year. For all but seven, the increase in charges exceeded the nation’s 2 percent inflation rate for that year.” NYTimes June 2, 2014
“Federal data released Monday show an increase in the average price hospitals charge to treat common conditions, with vascular procedures and chest-pain treatment showing some of biggest upticks.The numbers from the Centers for Medicare and Medicaid Services include 2012 prices at 3,376 hospitals for the 100 most common inpatient stays by Medicare patients” Wall Street Journal June 2, 2014

Headlines of inefficiency from last week
“Although U.S. hospitals account for the single largest chunk of the nation’s $2.7 trillion in health spending, few of them can say how much it actually costs them to care for every patient they admit.” Healthcare Finance News July 1, 2014
“…without understanding where inefficiencies, fat and waste are, hospitals under pressure to reduce spending may make the wrong cuts…” Healthcare Finance News July 1, 2014

• A study of rural healthcare in America demonstrating rural vs. urban cost effectiveness, efficiency, patient perception and quality.
Setting The Context For Rural
Full study available at www.ivantagehealth.com/rural-relevance-under-
healthcare-reform/

Delivering Value
Study Area A - Medicare Costs and Charges
What if non-CAHs charged a CAH per case rate?
Critical Access Hospitals vs. Non-CAH
Total Medicare Charges
Of the 351 DRGs common to CAHs and non-CAHs
$207BILLIONLESS
CHARGE
63%
Source: Rural Relevance Under Healthcare Reform 2014, Study Area A.

Delivering Value
Study Area B - Shared Savings (Medicare beneficiaries)
Less spending per beneficiary
Apply the rural rate of spend to urban beneficiaries
Total savings if all beneficiarieswere treated at
the rural equivalent?
In Potential Medicare Savings
* Approximate Totals
Medicare spends less on rural beneficiaries than on urban beneficiaries
Rural vs. Urban Spending
$5.2$1.5 $6.8BILLIONBILLION BILLION
Source: Rural Relevance Under Healthcare Reform 2014, Study Area B.

Rural vs. Urban

Delivering Value
Study Area C – Hospital Performance
• Quality• Patient Safety• Patient Outcomes• Patient Satisfaction• Price• Time in the ED
Data sources include CMS Process of Care, AHRQ PSI Indicators, CMS Outcomes, HCAHPS Inpatient/Patient Experience, MedPAR, HCRIS
Source: Rural Relevance Under Healthcare Reform 2014, Study Area C.
Rural
Urban
Who has the edge?
Rural hospitals match Urban hospitals on performance at a lower price

Delivering ValueStudy Area D - Emergency Department
56mins Faster than Urban
50%Of ED Visits are Low
Acuity
9to5 >50% of Low Acuity
Visits Occur Between 9 am and 5 pm
Do rural patients have adequate access to primary care?
14%Utilization Increase
Source: Rural Relevance Under Healthcare Reform 2014, Study Area D.

Hospital Strength Index Performance Summary

Hospital Strength Index
Overall Composite
Mid-South CAH Median 9.3
All Mid-South Median 33.15
All US CAH Median 34.37

Hospital Strength Index
Competitive
Strength IndexCompetitive
Intensity IdexMarket Size &Growth Index Population Risk
Mid-South CAH Median 33.22 29.11 21.50 27.55All Mid-South Median 48.11 45.07 46.78 27.23All US CAH Median 45.79 34.16 17.50 65.86
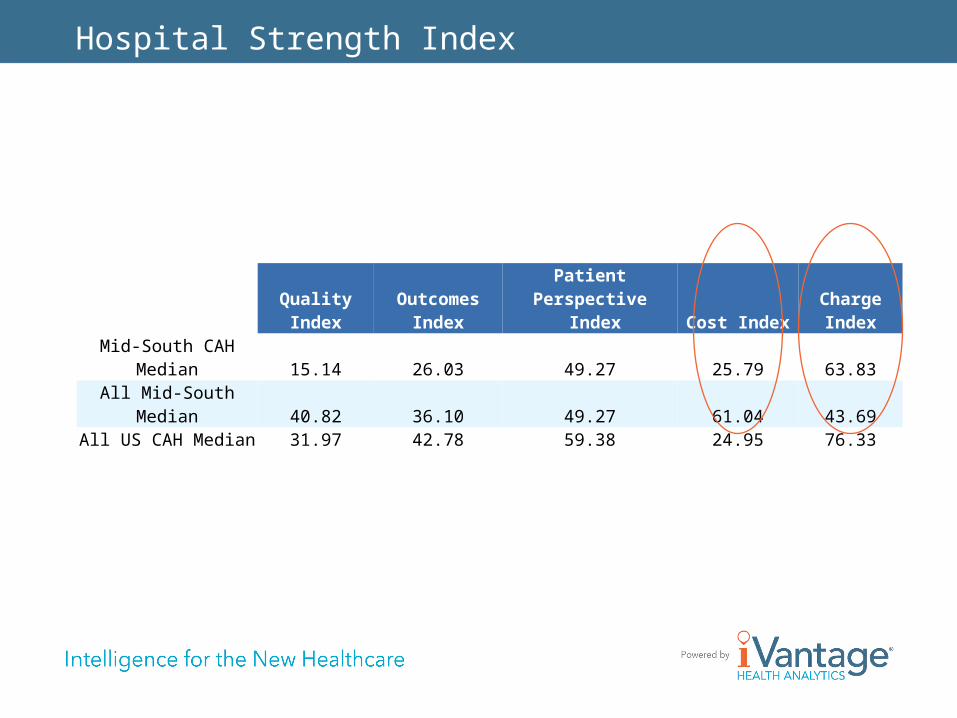
Hospital Strength Index
Quality Index Outcomes IndexPatient Perspective
Index Cost Index Charge IndexMid-South CAH Median 15.14 26.03 49.27 25.79 63.83All Mid-South Median 40.82 36.10 49.27 61.04 43.69All US CAH Median 31.97 42.78 59.38 24.95 76.33

Hospital Strength Index
Financial Stability
IndexMid-South CAH Median 21.82All Mid-South Median 41.47All US CAH Median 44.79

Rural vs. Urban
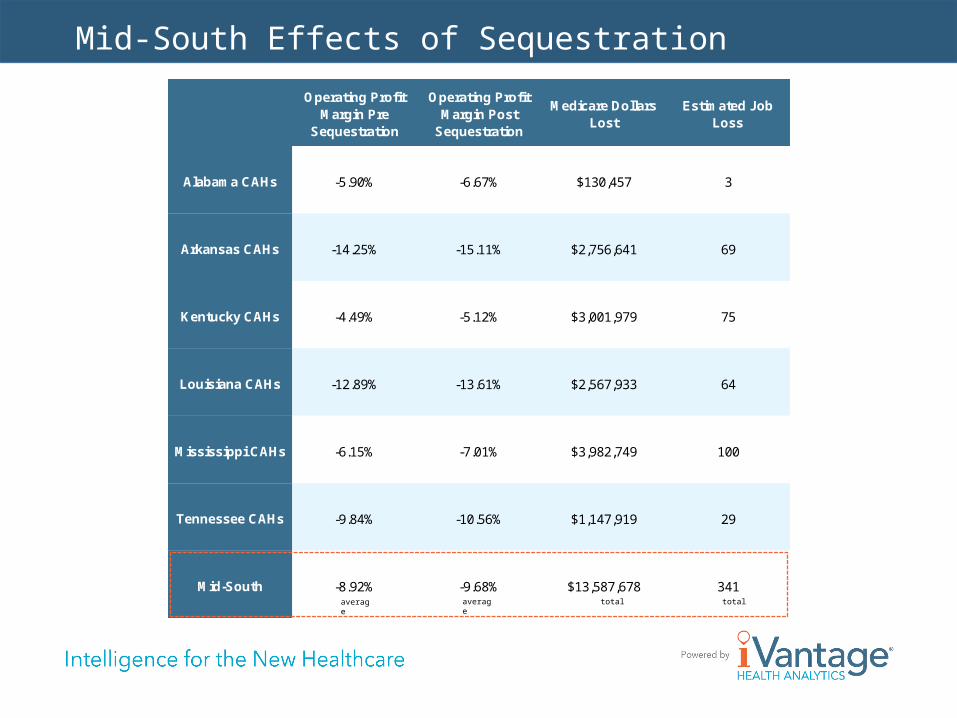
Mid-South Effects of SequestrationOperating Profit
Margin Pre Sequestration
Operating Profit Margin Post
Sequestration
Medicare Dollars Lost
Estimated Job Loss
Alabama CAHs -5.90% -6.67% $130,457 3
Arkansas CAHs -14.25% -15.11% $2,756,641 69
Kentucky CAHs -4.49% -5.12% $3,001,979 75
Louisiana CAHs -12.89% -13.61% $2,567,933 64
Mississippi CAHs -6.15% -7.01% $3,982,749 100
Tennessee CAHs -9.84% -10.56% $1,147,919 29
Mid-South -8.92% -9.68% $13,587,678 341average average total total

Charge RateRank* State Rural Charge Rate1 ND $7,7752 UT $9,7923 SD $9,8244 IA $10,9045 NE $10,9726 KS $11,0167 MA $11,1808 NM $11,2639 MT $11,29210 AR $11,72811 OK $11,83112 MD $12,59613 OH $12,85214 IL $13,12915 MS $13,85516 NH $14,02517 PA $14,24018 WA $14,46219 MN $14,46920 IN $14,69121 ID $14,77222 OR $15,26023 WI $15,75924 TX $16,00925 NV $16,10526 WY $16,18127 GA $16,64028 WV $16,89529 AL $16,93030 ME $16,96131 VT $17,05632 MI $17,21533 LA $18,11034 HI $18,20335 MO $18,69136 NC $18,86837 CO $19,07738 TN $19,12139 AZ $21,26940 AK $21,37141 VA $21,56742 SC $21,65643 FL $22,54744 NY $23,52945 KY $26,55546 CA $30,936

Direct Cost RateRank* State Rural Direct Cost Rate1 AL $2,9702 OK $2,9943 AR $3,0594 TN $3,1095 MS $3,2106 LA $3,4397 OH $3,5688 WV $3,5789 TX $3,67810 IN $3,69511 KY $3,71212 IL $3,75813 ND $3,81014 SC $3,81215 GA $3,81516 VA $3,82517 PA $3,89218 MO $3,90919 SD $3,91220 FL $3,96821 NC $4,03122 KS $4,07923 UT $4,12224 MD $4,38925 MA $4,43626 IA $4,56227 MT $4,61728 NH $4,86629 ME $4,89930 MI $4,98231 WI $5,06432 VT $5,08633 CO $5,09034 NV $5,16235 AZ $5,18436 NM $5,33637 OR $5,37238 WY $5,39139 NE $5,42940 MN $5,43041 ID $5,48442 WA $5,90843 CA $6,68544 NY $6,87245 AK $6,91346 HI $9,499

Total Cost RateRank* State Rural Total Cost Rate1 AL $5,7322 OK $6,2723 TN $6,3034 AR $6,3275 MS $6,7086 LA $6,7177 GA $7,1998 OH $7,3999 FL $7,41910 TX $7,47411 VA $7,53712 SD $7,57813 ND $7,57814 PA $7,70415 NC $7,75516 WV $7,76317 KY $7,77518 KS $7,82319 UT $8,00020 IN $8,05621 MO $8,13022 SC $8,14723 IL $8,19524 NV $8,63225 MT $8,73526 IA $8,98027 MD $9,25828 MI $9,40329 NH $9,60630 NM $9,93131 ME $9,94832 WI $9,99433 MN $10,06034 NE $10,19335 AZ $10,27236 CO $10,38937 WY $10,44338 MA $10,83439 ID $10,85040 OR $11,12241 VT $11,21242 WA $11,61643 CA $12,54244 NY $12,61945 AK $15,43346 HI $17,444

Mid-South ComparisonSummary Points:
Rural hospitals in Mid-South states served around 8% of the region’s total Medicare inpatients in 2012.
Medicare wage-adjusted charges for rural hospitals in Mid-South states were $2,361,939,094 accounting for around 4% of region’s Medicare wage-adjusted charges. Charges for all hospitals in the Mid-South region totaled $55,758,152,910.
Medicare wage-adjusted total costs for rural hospitals in Mid-South states were $819,456,000 accounting for around 5% of the region’s wage-adjusted total costs. Total costs for all hospitals in the Mid-South region totaled $15,313,292,833.
Medicare wage-adjusted direct costs for rural hospitals in Mid-South states were $400,427,089 accounting for around 4% of the region’s wage-adjusted direct costs. Direct costs for all hospitals in the Mid-South region totaled $8,980,935,596.

Rural vs. Urban
For the purposes of cost and charge analysis iVantage examined 507 DRGs that are common to both rural hospitals in Mid-South states and the Mid-South Region’s PPS hospitals. DRGs with less than 5 total cases were excluded.
The average charge per case for rural hospitals in Mid-South states ($19,629) is 47% less than the average charge per case for Mid-South PPS hospitals ($37,321).
The average total cost per case for rural hospitals in Mid-South states ($6,826) is 32% less than the average total cost per case for Mid-South PPS hospitals ($10,076).
The average direct cost per case for rural hospitals in Mid-South states ($3,332) is 43% less than the average direct cost per case for Mid-South PPS hospitals ($5,882).
If Mid-South PPS hospitals charged the same rate as rural hospitals in Mid-South states there would be $6,180,801,460 less in Medicare charges.

Rural vs. Urban
iVantage examined 507 DRGs that are common to both rural hospitals in Mid-South states and all US hospitals. DRGs with less than 5 total cases were excluded.
The average charge per case for rural hospitals in Mid-South states ($19,629) is 52% less than the average charge per case for all US hospitals ($41,003).
The average total cost per case for rural hospitals in Mid-South states ($6,826) is 40% less than the average total cost per case for all US hospitals ($11,417).
The average direct cost per case for rural hospitals in Mid-South states ($3,332) is 48% less than the average direct cost per case for all US hospitals ($6,358).
If all US hospitals charged the same rate as rural hospitals in Mid-South states there would be $113,636,026,778 less in Medicare charges.
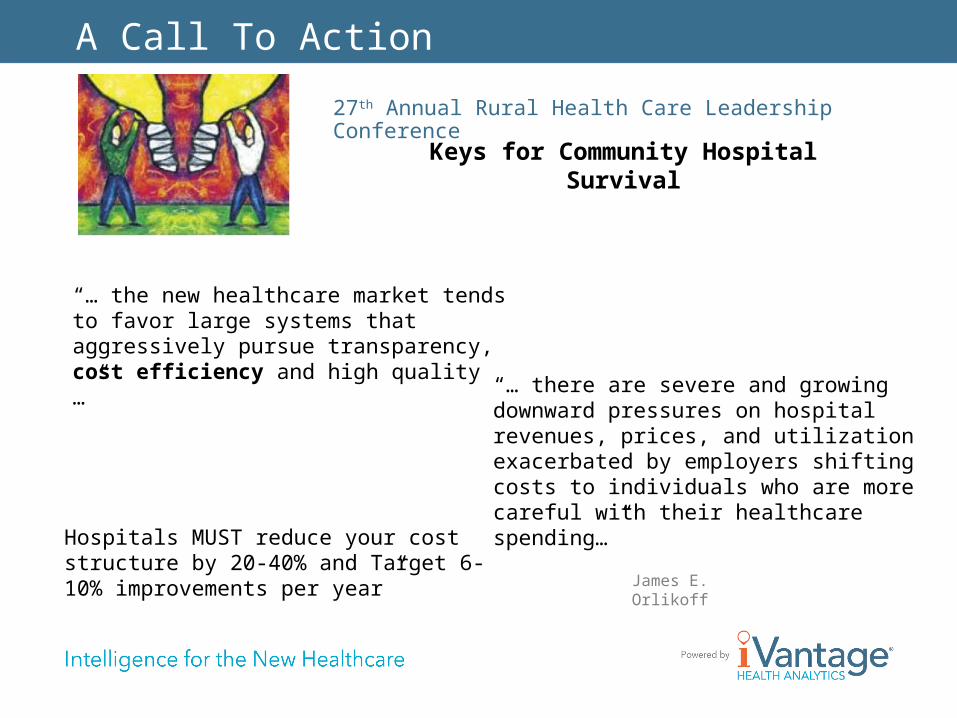
A Call To Action
27th Annual Rural Health Care Leadership Conference
Keys for Community Hospital Survival
“… the new healthcare market tends to favor large systems that aggressively pursue transparency, cost efficiency and high quality …”
“… there are severe and growing downward pressures on hospital revenues, prices, and utilization exacerbated by employers shifting costs to individuals who are more careful with their healthcare spending…”
Hospitals MUST reduce your cost structure by 20-40% and Target 6-10% improvements per year” James E. Orlikoff

Financial and Operational Performance: Managed Care Rates

Data Exploration by Region – All Service Lines

Data Exploration by Region - Orthopedics

Data Exploration by Region (hospital drill) - Orthopedics

31
Overall Functional Cost Performance
• Internal system comparisons reveal cost variation
Hospital 1
1 2 3 4 5 6 7
Hospital 2 Hospital 3 Hospital 4 Hospital 5 Hospital 6 Hospital 7
32
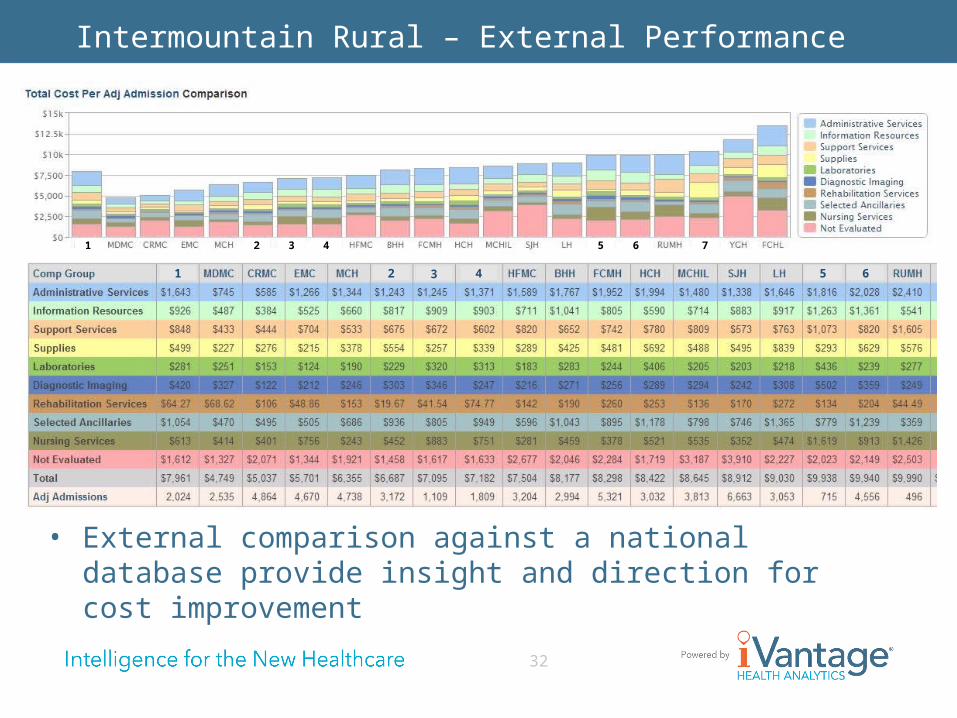
Intermountain Rural – External Performance
• External comparison against a national database provide insight and direction for cost improvement
1 2
1 2 3 4 5 6
3 4 5 6 7
33
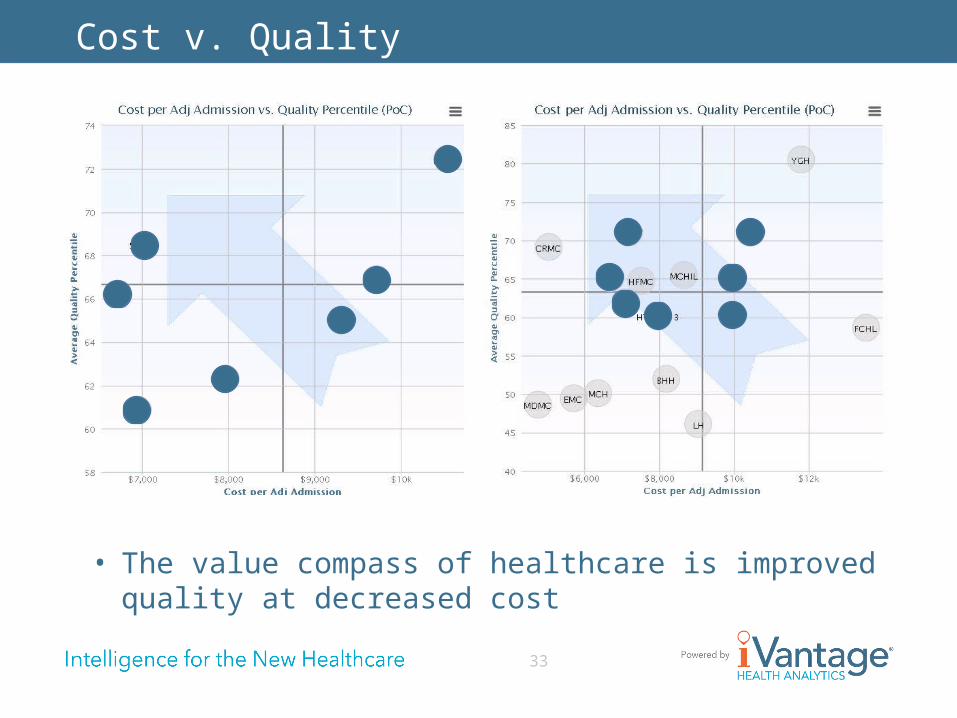
Cost v. Quality
• The value compass of healthcare is improved quality at decreased cost

34
Intermountain RR - Major Findings
• What were the major findings for rural hospitals?• Trends/patterns – IT, Benefits, Supplies consistent
among all facilities• Challenging of Assumptions? Expected labor hours to
be highest areas of opportunity.

35
• Quality- Crossridge Community Hospital, AR- Reeves Memorial Hospital, LA- Union General Hospital, LA- Field Memorial Community Hospital, MS
• Patient Perspectives- St. Elizabeth Grant, KY- Morgan County ARH Hospital, KY- Saint Joseph Martin, KY- Marcum And Wallace Memorial, KY- Richland Parish Hospital, LA- Lady Of The Sea General Hospital, LA- Lawrence County Hospital, MS- Pearl River County Hospital, MS- Trousdale Medical Center, TN
2014 Top Quartile Performances
Finance- Chicot Memorial Medical Center, AR- Dallas County Medical Center, AR- Lady Of The Sea General Hospital, LA- Richland Parish Memorial – Delhi, LA- Reeves Memorial Medical Center, LA- Union General Hospital, LA- Camden General Hospital, TN

36
• Quality- Union General Hospital, LA- Reeves Memorial Medical Center, LA
• Patient Perspectives- Morgan County ARH Hospital, KY- St. Elizabeth Grant, KY- Richland Parish Hospital, LA
2014 Top 100 All CAH
Finance- Chicot Memorial Medical Center, AR- Lady Of The Sea General Hospital, LA


![[6705-01-P] - Farm Credit Administration Register D… · Web view[6705-01-P] FARM CREDIT ADMINISTRATION. 12 CFR Part. s. 650, 6. 51, 653, and 655. RIN 3052-AC89. Federal Agricultural](https://static.fdocuments.in/doc/165x107/5a788d387f8b9a7b698caaf9/6705-01-p-farm-credit-administration-register-dweb-view6705-01-p-farm-credit.jpg)