Challenges in goat farming in india - Goat Farming Consultancy

RURAL COMMODITIES WRAP APRIL 2018
Author | Phin Ziebell @PhinZiebell
Cover photo | Carl Davies CSIRO

Photo | Mai Thai
The US-China trade dispute, which began with the US imposition of steel and aluminium tariffs, has now widened considerably. While the confrontation has not yet reached an all-out trade war yet, China’s retaliatory 25% tariff on over a hundred US agricultural products is an escalation. Soybeans are included in the tariffs, a major development given that China takes around two-thirds of global soybean trade. The extent to which this will affect Australian agriculture is unclear, with potential upside into some Chinese markets (e.g. horticulture, wine and potentially feed grains) but with a dose of uncertainty, particularly for global grain markets.
Back home, winter planting is rapidly approaching and conditions are hotter and drier than average across most grain-growing regions. While there is still plenty of time for rains to provide good yields, in-season events will be key, with little subsoil moisture going into planting.
Overall, Australian agricultural prices strengthened in March, with the NAB Rural Commodities Index up 3.0%.
KEY POINTS

PRICE UPDATE
On a state basis, cattle-heavy Queensland was the best performer, up 4.1% and reflecting good rains across much of the state. New South Wales was up 2.9%, while Victoria and Tasmania were up 2.8% and 3.1% respectively. South Australia was up 2.3% while grain dependent Western Australia rose 2.1%.
The index tracks 28 commodities weighted by the relative size of each commodity in the Australian agricultural sector.
Source: NAB Group Economics, ABARES, Meat and Livestock Australia, Australian Pork, Ausmarket Consultants, Australian Bureau of Statistics, Bloomberg and Profarmer.
3 Rural Commodities Wrap
The NAB Rural Commodities Index gained 3.0% month on month in March, its second consecutive rise . On a year on year basis, the index was up 0.6% in February. The recent upturn largely reflected favourable cotton, cattle, grain and horticultural prices.
The AUD remains perhaps higher than many producers would like, although we don’t expect major downside from here (75c by the end of 2018).
90
100
110
120
130
140
150
160
170
2010 2011 2012 2013 2014 2015 2016 2017 2018
National NSW VICQLD WA SATAS
January February March
Wheat ▼ 0.7% ▲ 3.3% ▲ 2.4%
Beef ▼ 4.4% ▼ 3.5% ▲ 4.2%
Dairy ▼ 2.1% ▲ 9.7% ▲ 2.1%
Lamb ▲ 1.0% ▼ 3.7% ▼ 1.6%
Wool ▲ 2.5% ▲ 1.4% ▼ 1.1%
Sugar ▼ 6.4% ▼ 2.6% ▼ 4.2%
Cotton ▲ 2.2% ▼ 2.1% ▲ 5.8%
MONTHLY PRICE CHANGES NAB RURAL COMMODITIES INDEX AUD prices January 2010 = 100
CONTENTS 3 Price update 4 Regional price indicators 5 Seasonal conditions 6 Price and production outlook 7 Exchange and interest rates 8 Farm input prices 9 Wheat 11 Other winter crops and sugar 12 Summer broadacre crops 13 Beef 14 Lamb and wool 15 Pork, poultry and goat 16 Dairy 17 Horticulture and wine

REGIONAL PRICE INDICATORS
MONTH ON MONTH February to March 2018
YEAR ON YEAR March 2017 to March 2018
Source: NAB Group Economics, ABARES, Meat and Livestock Australia, Australian Pork, Ausmarket Consultants, Australian Bureau of Statistics, Bloomberg and Profarmer.
4 Rural Commodities Wrap
Monthly regional price indicator data shows improved prices across most of the country in March, particularly in cattle country and horticulture heavy regions.
On a year on year basis, the best performing regions remain those with a cropping focus, particularly Western Australia, South Australia and New South Wales. On the other hand, cattle regions across Queensland and the Northern Territory have struggled with falling cattle prices for most of the year, although given the peak was so high, this was perhaps inevitable.
NAB’s regional price indicators are in effect a set of separate NAB rural commodities indices for every region in Australia. The project is still in a trial stage and is calculated on a different basis to our national and state data i.e. without annual chain-weighting. We will continue to develop this series throughout 2018, making further improvements where possible.
- more than 5% - 4-5% - 3-4% - 2-3% - 1-2% - 0-1% no data + 0-1% + 1-2% + 2-3% + 3-4% + 4-5% + more than 5%
- more than 20% - 15-20% - 10-15% - 5-10% - 0-5% no data + 0-5% + 5-10% + 10-15% + 15-20% + more than 20%

SEASONAL CONDITIONS
THREE MONTH RAINFALL OUTLOOK May to July
RAINFALL – MARCH 2018 Deciles based on long run average data
Source: Bureau of Meteorology
5 Rural Commodities Wrap
The Bureau of Meteorology’s latest three month climate outlook for May to July points to mostly neutral conditions in southern Australia, although Gippsland and Tasmania may see higher than average rainfall. Much of northern Australia is forecast to see abover average rain, especially the Northern Territory, the Pilbara and Kimberley. Parts of the WA wheatbelt and north as far as Shark Bay may see below average rainfall.
If this forecast is borne out, and parched cropping districts get close to average rainfall close to planting, the season could still see good yields, but a very late break will make things harder.
March rainfall has been very mixed overall, with a large part of Queensland and the Northern Territory enjoying very wet conditions and most of Tasmania also exceeding the average, but other areas are very dry. New South Wales, South Australia and parts of Victoria are experiencing the most challenging conditions.

80
85
90
95
100
105
110
Wheat
Barley
Canola
Wool
Cotton
Sugar
Beef
Lamb
Weighted dairy
Source: NAB Group Economics, ABARES, Meat and Livestock Australia, Australian Pork, Ausmarket Consultants, Australian Bureau of Statistics, Bloomberg and Profarmer
OUTLOOK FOR PRICES AND PRODUCTION
INDEX OF PRICE FORECASTS FOR RURAL COMMODITIES
Production
Looking ahead to the 2018-19 winter cropping season, the lack of subsoil moisture across major grain-growing districts of New South Wales, South Australia, Victoria and increasingly Western Australia leaves a lot of heavy lifting to be done by in-season rainfall. The outlook for late autumn and early winter is mostly average, although forecast reliability is often low at this time of year.
While rains in Queensland have boosted sentiment in the cattle industry, we have seen less restocker activity than perhaps expected.
6 Rural Commodities Wrap
Prices
Dry weather has been a major driver of elevated grain prices, slashing grain in the system on the east coast and increasing demand for supplementary feed. While the latter pressure has been alleviated somewhat by the strong rains in parts of Queensland, dry conditions south of the Tweed have caused some jitters about yields in the season ahead (although anything could happen if conditions turn). Cattle prices jumped on Queensland rain but have since retreated somewhat. The EYCI is now around 538c/kg. We still see a fall to around the 500c range as likely this year.
A US-China trade war threatens to throw a spanner in the works, although it is too early to assess the full impact for agriculture.
AUD index value, December quarter 2017 = 100 PRODUCTION OUTLOOK (ABARES MARCH 2018) Financial year production estimates, Australia
2016-17 2017-18 % change
Wheat (million tonnes) 34.4 21.2 ▼ 38.2%
Beef (kt) 2,069 2,227 ▲ 7.6%
Dairy (milk, ML) 9,015 9,250 ▲ 2.6%
Lamb and mutton (kt) 669 710 ▲ 6.1%
Wool 414 424 ▲ 2.4%
Sugar (kt) 4,804 4,700 ▼ 2.2%
Cotton (lint, kt) 891 995 ▲ 11.7%

0
1
2
3
4
5
6
7
8
0.00
0.20
0.40
0.60
0.80
1.00
1.20
2000 2005 2010 2015 2020
AUD/USD RBA cash rate (RHS)
EXCHANGE RATES AND INTEREST RATES
EXCHANGE AND INTEREST RATES INC. QUARTERLY FORECASTS
NAB FX STRATEGY TARGETS
Our USD/ AUD model currently has a fundamental value estimate of 77c +/- 5c. We have maintained our forecast that the AUD may move down to around 75c by late 2018 (as interest rate differential move in the USD favour and commodity prices come off by around 5% during the year). For 2019 we see the AUD hovering around the mid 70s. Of course this forecast does not include the outbreak of a real trade war between the USA and China, which would see a significantly lower AUD.
On monetary policy the RBA is very relaxed. We agree that inflation is unlikely to be a problem and the more important risks revolve around the consumer. Our forecasts see the slack in the labour market gradually improving and private sector wages starting to finally move up. However the reality is that so far this has not happened - despite employers signalling that they are finding suitable labour harder to find.
While the global environment will see other central banks removing emergency stimulus, the RBA will be very focussed on the local economy. They would not be concerned if current settings see some downside to the AUD from interest rate differentials.
Clearly until the consumer shows more strength the RBA will be on hold. Currently the markets have only priced 7 points of hikes by end 2018. That said our forecasts still point to the possibility of a very cautious start by the RBA to move rates higher by late 2018. Clearly the risks are that the timing will be delayed. Going forward, the RBA will be very cautious and very data driven. We have however maintained our view that two additional rate rises are likely in 2019.
Source: NAB
7 Rural Commodities Wrap
2018Q2 2018Q3 2018Q4 2019Q1
AUD/USD 0.78 0.77 0.75 0.75
NZD/USD 0.72 0.71 0.70 0.70
USD/JPY 110 109 109 109
EUR/USD 1.28 1.30 1.30 1.30
USD/CNY 6.25 6.20 6.18 6.18
FARM INPUT PRICES
NAB FERTILISER INDEX AUD index
NATIONAL AVERAGE FUEL PRICES AUc/litre
NAB WEIGHTED FEED GRAIN PRICE INDEX AUD/tonne
Fuel and fertiliser prices have been on the rise since last year. Given we expect oil prices to consolidate their gains and the Australian dollar to fall (although not by much), the risk for 2018 is probably on the upside.
Overall, the NAB Fertiliser index was up 2.7% in March, largely reflecting higher DAP and US natural gas prices, although urea prices have moved lower. This upward trend in fertiliser prices overall is likely to continue throughout 2018.
Domestic feed prices are still elevated in Queensland and northern New South Wales despite good pasture growth in parts of the former. The premium for ASW1 from Geelong to Brisbane has remained relatively steady all year. Feedlots will still need grain for the foreseeable future so these premiums will probably remain for some time. Overall the NAB weighted feed grain price index was off 0.3% in March.
Brent is currently trading in the high 60s range, enough to add some pressure at the pump. We see petrol prices largely remaining in the mid 130s cents/litre range in 2018, although is very sensitive to oil prices and exchange rates, both of which are difficult to forecast. Source: Bloomberg, Profarmer and NAB Group Economics
8 Rural Commodities Wrap
0
100
200
300
2010 2012 2014 2016 2018
100
120
140
160
180
200
220
240
2010 2012 2014 2016 2018
GEELONG-BRISBANE PRICE SPREAD ASW1 cash price, AUD/tonne
100
120
140
160
180
2010 2012 2014 2016 2018
petroldiesel
-60
-40
-20
0
20
40
60
80
100
120
2010 2012 2014 2016 2018
WHEAT
ASX MILLING WHEAT FUTURE Eastern Australia, AUD/tonne
CBOT SOFT RED WINTER WHEAT USD/tonne
ROOT ZONE SOIL MOISTURE Relative to average, 4 March 2018
Source: Bloomberg, Profarmer, CBH Group, Graincorp, US drought monitor, BoM and NAB Group Economics
9
0
100
200
300
400
2010 2012 2014 2016 20180
100
200
300
400
2010 2012 2014 2016 2018
US DROUGHT MONITOR 27 March 2018
Prices
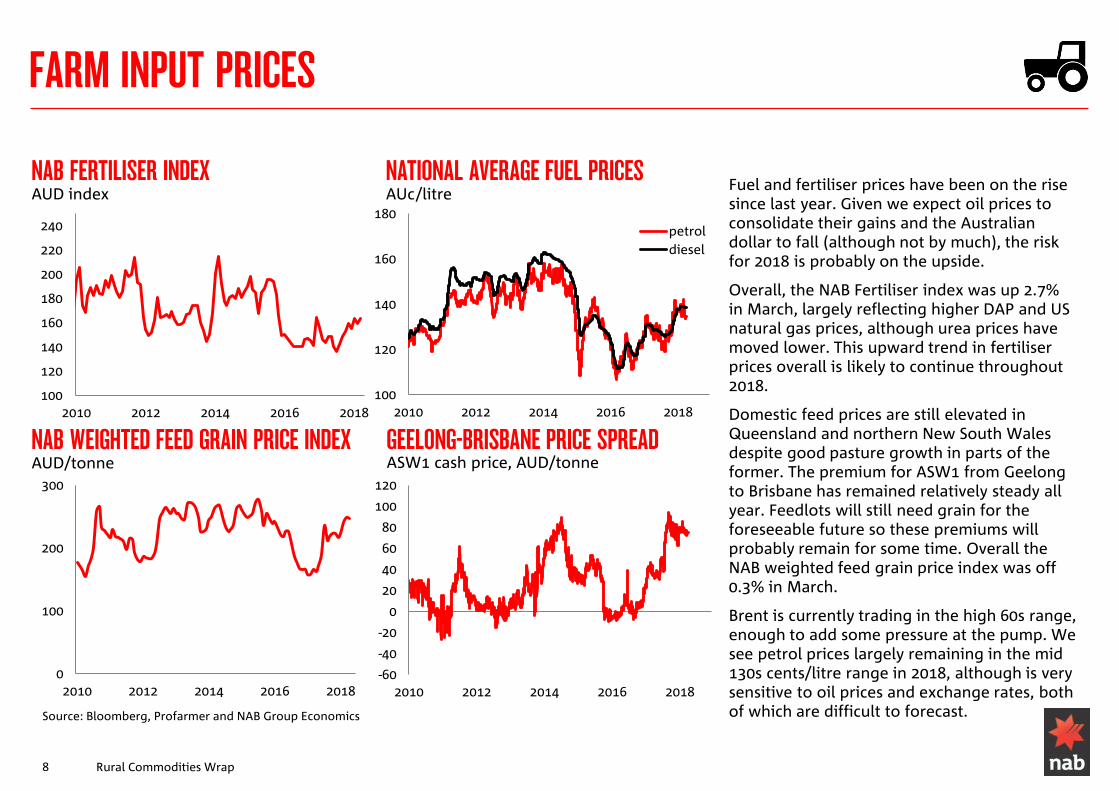
Global wheat prices have now lost most of their weather-driven March rally, although there have been signs of life in the last week amid reports of lower spring wheat plantings, winter wheat frost concerns and (the elephant in the room) worsening drought in parts of the US. But overall it remains tough to see a sustained rally amid strong global supplies.
Domestic wheat premiums remain – despite rain in Queensland putting a rocket under pastures. Lot feeders will continue to need grain for some time to come and after the disappointing summer crop, it is likely to remain at a premium for now.
Production
Planting is rapidly approaching but most of Australia’s wheat regions are as “dry as a chip”. New South Wales, South Australia and the northern half of Victoria are particularly dry, although the situation in the west is somewhat better (although March rainfall in the wheatbelt was below average). While the season could easily recover to produce average or even above yields, in-season rainfall will need to do most of the heavy lifting. If rain doesn’t arrive by winter, yields could come under pressure.
Rural Commodities Wrap
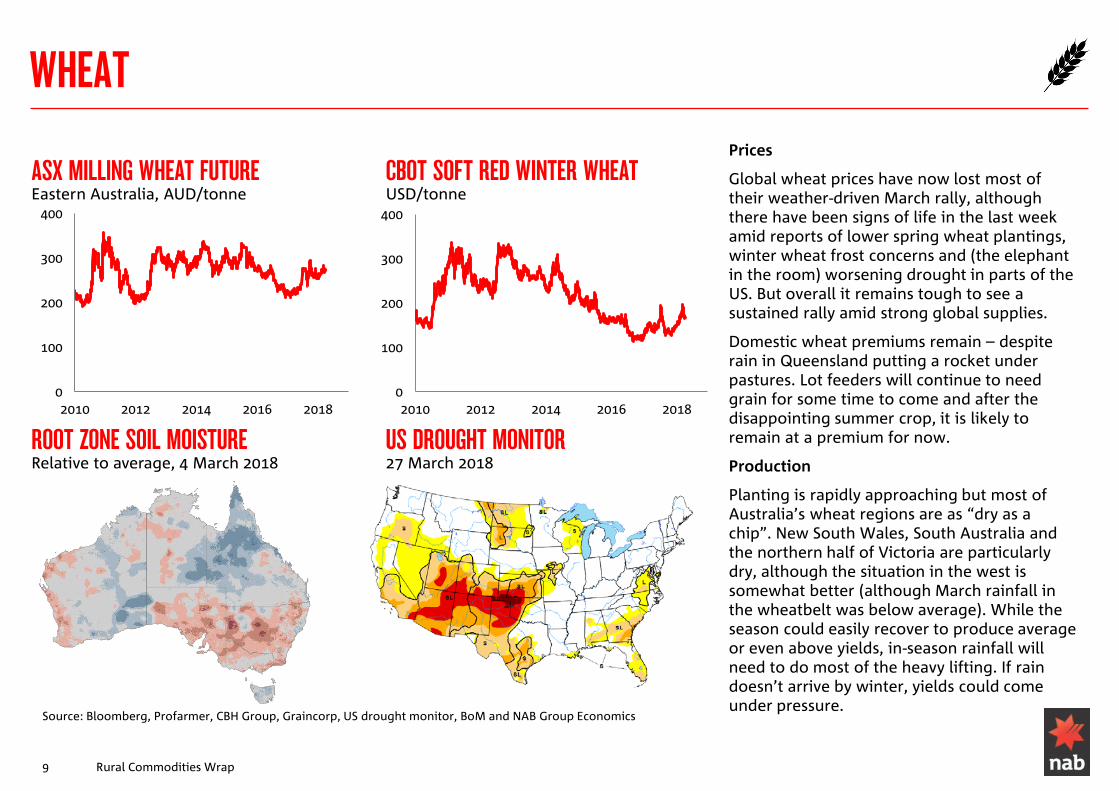
MONTHLY AVERAGE RAINFALL IN WHEAT REGIONS (MM)
NEW SOUTH WALES VICTORIA QUEENSLAND
Source: Bureau of Meteorology and NAB Group Economics
10
WESTERN AUSTRALIA SOUTH AUSTRALIA TASMANIA
0
50
100
150
200
Jan
Feb
Mar
Ap
r
May Jun
Jul
Au
g
Sep
Oct
No
v
Dec
0
50
100
150
200
Jan
Feb
Mar
Ap
r
May Jun
Jul
Au
g
Sep
Oct
No
v
Dec
0
50
100
150
200
Jan
Feb
Mar
Ap
r
May Jun
Jul
Au
g
Sep
Oct
No
v
Dec
0
50
100
150
200
Jan
Feb
Mar
Ap
r
May Jun
Jul
Au
g
Sep
Oct
No
v
Dec
0
50
100
150
200
Jan
Feb
Mar
Ap
r
May Jun
Jul
Au
g
Sep
Oct
No
v
Dec
0
50
100
150
200
250
300
Jan
Feb
Mar
Ap
r
May Jun
Jul
Au
g
Sep
Oct
No
v
Dec
Long run average 1900-01 to 2013-14 La Nina years 2018 YTD 2017

OTHER WINTER CROPS AND SUGAR
SELECTED COARSE GRAINS AUD/tonne
CANOLA, NEWCASTLE NSW AUD/tonne
SELECTED PULSES AUD/tonne
ICE NO.11 SUGAR AUD/tonne
Barley prices are still being held high by the aforementioned feed demand. Such is demand that feed barley is trading close to ASW levels, a delicious prospect for those with barley in storage.
On the other hand, the pulse prices continue to reflect increasing Indian tariffs – now up to 60% for chickpeas. Rumours abounded last week that the Indian Government was set to completely ban imports. While these remain rumours for now, the fact is that decent Indian production and high tariffs have effectively closed off the Indian market to pulse imports for the foreseeable future (or until Indian domestic supplies dwindle).
Indian domestic political considerations are also significant, with eight state legislative assembly elections in the coming year.
These price pressures are likely to mean much lower chickpea and lentil plantings this season.
Sugar prices are once again falling after cautious optimism in the second half of 2017. In AUD terms, ICE no. 11 sugar prices were down 4.2% in March.
Source: Bloomberg, Profarmer and NAB Group Economics
11
0
100
200
300
400
500
600
700
2010 2012 2014 2016 2018
0
200
400
600
800
1,000
1,200
1,400
2010 2012 2014 2016 2018
Chick peas Field peas Lupins
0
100
200
300
400
2010 2012 2014 2016 2018
Barley (feed)
Barley (malting, Geelong)
Oats (feed, Albany)
0
200
400
600
800
1,000
2010 2012 2014 2016 2018
Rural Commodities Wrap

SUMMER CROPS
SORGHUM AND RICE AUD/tonne
ABARES SORGHUM YIELD ESTIMATES Forecast median against all years
COTLOOK A INDEX AUD/bale
Sorghum prices have continued to surge on three factors: challenging yields, domestic feed demand and expectations of higher Chinese demand due to tariffs on US soybeans.
The outlook for sorghum faded through the season, although harvest has seen yields probably better than we expected a month ago. Still, given the mixed state of the last winter crop season, there is plenty of demand for domestic feed.
The coming 25% tariff on US soybeans are providing some upside (based on expectations of higher Chinese demand), although it is important to note that prices across the grains complex have moved arguably less than initially expected and Australian sorghum supplies are merely a drop in the ocean of Chinese feed demand (China imported over 92.5 million tonnes of soybeans in 2016-17).
The cotton harvest is underway and moving south. Yields have been generally good so far, although dryland has been more mixed. With cotton a very profitable crop, it is likely that the industry will expand in coming years. Cotton prices rose in March (up 5.8% in AUD terms) and the US-China trade dispute will be an issue to watch in coming months.
Source: ABARES, Bloomberg, Profarmer, ABARES and NAB Group Economics
12 Rural Commodities Wrap
0
200
400
600
800
1,000
1,200
1,400
2010 2012 2014 2016 2018
0
50
100
150
200
250
300
350
400
2010 2012 2014 2016 2018
Sorghum (Newcastle)
Rice (US rough)

BEEF
EYCI AND US LIVE CATTLE FUTURES AUc/kg
SELECTED AUSTRALIAN EXPORT PRICES AUc/kg
GLOBAL STEER PRICES AUc/kg lwt
Good rains across a much of Queensland cattle country over the last month saw a jump in prices, but with most of Australia still dry, restocker interest hasn’t fired up prices to a great extent (and the latest EYCI data has drifted lower). In the top end, live export prices have drifted lower on soft Indonesian demand.
Export markets are tricky to pick. The latest USDA projections suggest that the US cattle herd will peak in 2018-19. With Australian herd rebuilding out of sync, our performance against international benchmarks will probably remain difficult for some time.
The challenge for Australia is that saleyard prices have been largely running on restocker interest since 2016, all while US prices faced downward pressure. This has been tough for processors. The low cost of South American beef has been a further obstacle in emerging markets such as China.
Our view is that global trends, combined with expensive domestic feed grain and dry conditions in many areas, will see downward pressure on Australian prices this year (although not by a large amount). We still see the EYCI at the 500 mark or thereabouts over the coming months.
Source: ABARES, Australian Bureau of Statistics, Meat and Livestock Australia, USDA and NAB Group Economics
13 Rural Commodities Wrap
AUSTRALIAN AND US COW PRICES AUc/kg cwt
0
100
200
300
400
500
600
700
800
2000 2005 2010 2015
EYCI US live cattle future
0
100
200
300
400
500
600
700
800
2010 2012 2014 2016 2018
Japan export chilled grassfed fullset
US export cow 90CL
0
100
200
300
400
500
2010 2012 2014 2016 2018
Argentina 520kg+ Australia 500-600kgBrazil saleyard Uruguay 380kg+US choice fed
0
100
200
300
400
500
600
700
2010 2012 2014 2016 2018
Australia medium cowUS cutter cowUS utility cow

LAMB AND WOOL
NATIONAL TRADE LAMB INDICATOR AUc/kg
MONTHLY LAMB EXPORTS BY DESTINATION Tonnes swt
WOOL EASTERN MARKET INDICATOR AUc/kg
WOOL PRICES BY MICRON AUc/kg Southern Region
Lamb prices have been a little lower recently, with MLA’s National Trade Lamb Indicator hovering around the 600c/kg mark – below the same time last year but still a good return for producers. Dry weather probably hasn’t helped, so producers will be looking to the skies over the coming weeks.
Export markets for lamb are reasonably diversified, with the US and China accounting for a substantial volume. It looks likely that demand will continue to be strong this year.
Wool prices have also backed off slightly, with the latest auction putting the Eastern Market Indicator at 1,776c/kg, down from record levels. This still represents an excellent return for growers nonetheless and goes some way to explaining the resilience in lamb prices. Looking across the micron range, the biggest gains over the past two years have been in fine and superfine wool (below 20 micron), although they have seen some of the steeper declines recently. Chinese demand has been the major driver, and if the tap turns off, there could be some risks to prices. However it is important to note that we have not seen any major jitters yet.
Source: Meat and Livestock Australia, Australian Bureau of Statistics and NAB Group Economics
14 Rural Commodities Wrap
0
100
200
300
400
500
600
700
800
2010 2012 2014 2016 2018
0
500
1,000
1,500
2,000
2010 2012 2014 2016 20180
500
1,000
1,500
2,000
2,500
3,000
2010 2012 2014 2016 2018
17 19 21 2325 28 30
0
5,000
10,000
15,000
20,000
25,000
30,000
2010 2012 2014 2016 2018
Other Japan MalaysiaQatar Jordan PNGUAE China US
PORK, POULTRY AND GOAT
EASTERN STATES GOAT PRICES AUc/kg, average of weight classes
AUSTRALIAN MEAT CONSUMPTION Kg per person per year
AUSTRALIAN PORK PRICE INDICATOR AUc/kg
ABS POULTRY PRICE INDEX AUD index
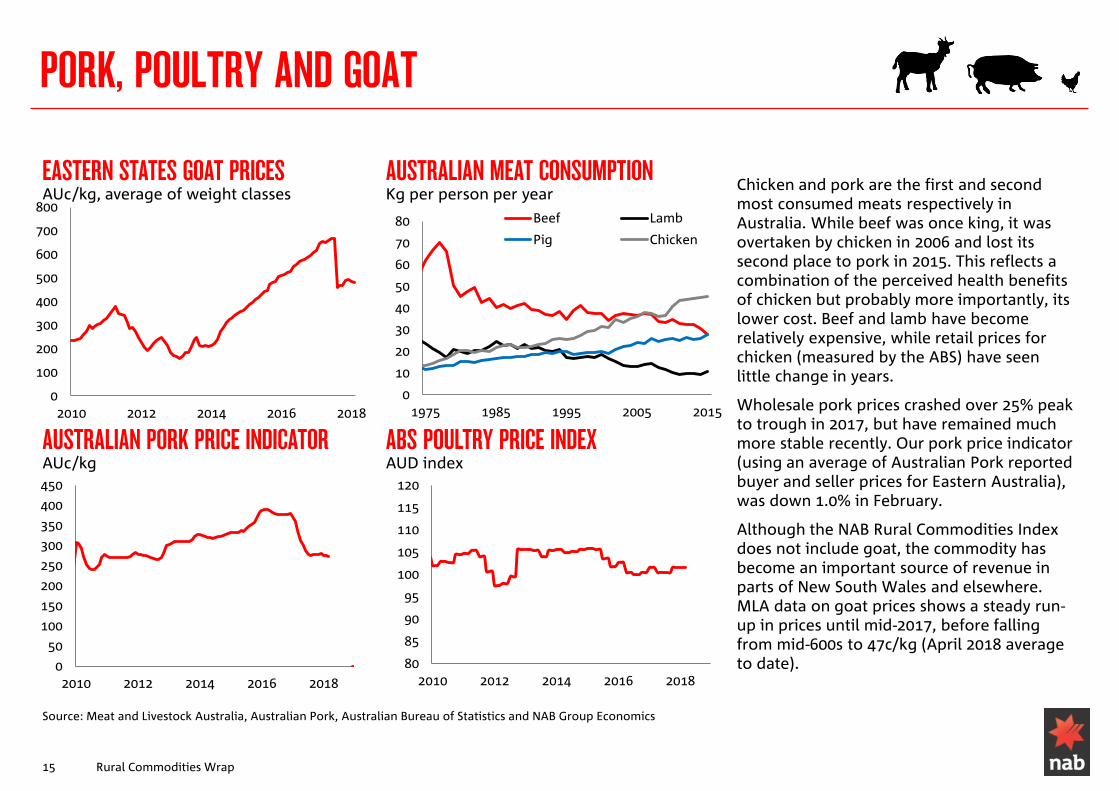
Chicken and pork are the first and second most consumed meats respectively in Australia. While beef was once king, it was overtaken by chicken in 2006 and lost its second place to pork in 2015. This reflects a combination of the perceived health benefits of chicken but probably more importantly, its lower cost. Beef and lamb have become relatively expensive, while retail prices for chicken (measured by the ABS) have seen little change in years.
Wholesale pork prices crashed over 25% peak to trough in 2017, but have remained much more stable recently. Our pork price indicator (using an average of Australian Pork reported buyer and seller prices for Eastern Australia), was down 1.0% in February.
Although the NAB Rural Commodities Index does not include goat, the commodity has become an important source of revenue in parts of New South Wales and elsewhere. MLA data on goat prices shows a steady run-up in prices until mid-2017, before falling from mid-600s to 47c/kg (April 2018 average to date).
Source: Meat and Livestock Australia, Australian Pork, Australian Bureau of Statistics and NAB Group Economics
15 Rural Commodities Wrap
0
50
100
150
200
250
300
350
400
450
2010 2012 2014 2016 2018
80
85
90
95
100
105
110
115
120
2010 2012 2014 2016 2018
0
10
20
30
40
50
60
70
80
1975 1985 1995 2005 2015
Beef Lamb
Pig Chicken
0
100
200
300
400
500
600
700
800
2010 2012 2014 2016 2018

0
2
4
6
8
0
2000
4000
6000
2008 2009 2010 2011 2012 2013 2014 2015 2016 2017 2018
AUD Index (LHS) USD index (LHS)Murray Goulburn milk price (RHS) Fonterra Australia milk price (RHS)
DAIRY
NAB WEIGHTED DAIRY EXPORT PRICE INDICATOR $/tonne (export price, LHS), AUD/kg milk solids (farm gate price RHS)
GDT AUCTION RESULTS AUD/tonne
FARMGATE PRICES Opening and latest (MG not whole year)
Global Dairy Trade auctions were lower in USD terms in March and the first April auction, in line with fading New Zealand weather concerns and ongoing strong supply from the northern hemisphere.
The slightly lower AUD cushioned this locally, with the NAB weighted dairy export price indicator up 2.1% in March.
Our forecasts do not point to much upside for global dairy prices in USD terms in the coming year, reflecting strong supply from the EU in particular, better weather conditions in New Zealand, cheap feed in the US and inventory overhang. Any local gains are more likely to come from currency or competition between processors.
Farmgate prices are tracking in the mid-$5 range in AUD terms for major processors. Given global market risks, there may be limited upside from here, although Bega has broken with convention and guaranteed its suppliers a price of $5.63 until September.
The ACCC and shareholders have now approved the sale of Murray Goulburn’s assets to Saputo, subject to the divestment of Koroit. While the deal still needs FIRB approval, it looks likely that Saputo will control around 1/3 of Australian milk production.
Source: Australian Bureau of Statistics, Global Dairy Trade, Dairy Australia, IBISworld and NAB Group Economics Note: chart shows Murray Goulburn farmgate prices except 2008-09 which shows Dairy Australia’s reported Victorian average value. MG latest farmgate prices apply from 1 November 2017 and are not retrospective.
16 Rural Commodities Wrap
forecasts
4.70 5.30 5.50 5.50 5.60 5.62 5.63 5.60
0
1
2
3
4
5
6
MG Fonterra Bega WCB
Opening Latest
0
1000
2000
3000
4000
5000
6000
7000
8000
2010 2012 2014 2016 2018
ButterCheddarSkim milk powderWhole milk powder

HORTICULTURE AND WINE
WHOLESALE FRUIT AND VEGETABLE PRICES AUD index, Sydney and Melbourne market average, Jan 2010=100
WINE AUSTRALIA WEIGHTED WINE GRAPE PRICES AUD/tonne
We produce wholesale price indices for fruit and vegetables, based on data from the Melbourne and Sydney wholesale markets.
Wholesale fruit and vegetable prices were higher in March. Fruit was up 13.1% in March, following a similar gain in February. The index has now reached 129.8 index points (January 2010 = 100). Vegetables were a also up 4.2%to 122.1 index points.
Wine Australia’s 2017 National Vintage Report shows prices rose once again this year, with the average of all wine grapes up 7% on a volume weighted basis. An AUD at more sustainable levels in 2016 likely explains some of the increase, although the higher currency more recently is some concern. Overall the industry looks to be on a more sustainable footing following years of glut and poor export conditions. Among the best performers were Riesling (up 13%), Shiraz (up 12%), and Pinot Gris (up 9%).
Source: Ausmarket Consultants, Wine Australia and NAB Group Economics
17 Rural Commodities Wrap
0
250
500
750
1000
2009 2010 2011 2012 2013 2014 2015 2016 2017
Cabernet Sauvignon
Chardonnay
Grenache
Merlot
Pinot Gris
Pinot Noir
Riesling
Sauvignon Blanc
Semillon
Shiraz
0
50
100
150
200
250
300
2010 2011 2012 2013 2014 2015 2016 2017 2018
Fruit
Vegetables
CONTACTS Phin Ziebell Alan Oster Dean Pearson Khan Horne Justine Dimond Agribusiness Economist Group Chief Economist Head of Economics General Manager Senior Consultant +61 (0) 475 940 662 +61 3 8634 2927 +61 3 8634 2331 NAB Agribusiness +61 (0) 455 085 137
Important Notice This document has been prepared by National Australia Bank Limited ABN 12 004 044 937 AFSL 230686 ("NAB"). Any advice contained in this document has been prepared without taking into account your objectives, financial situation or needs. Before acting on any advice in this document, NAB recommends that you consider whether the advice is appropriate for your circumstances. NAB recommends that you obtain and consider the relevant Product Disclosure Statement or other disclosure document, before making any decision about a product including whether to acquire or to continue to hold it. Please click here to view our disclaimer and terms of use.
Photo | Mai Thai