Ruprecht-Karls-Universit¨at Heidelberg · Huge thanks to Dr. Zuguang Gu and Dr. Volker Hovestadt...
210
Ruprecht-Karls-Universit¨ at Heidelberg Fakult¨ at f¨ ur Biowissenschaften PhD Thesis High-confidence fusion gene detection in different tumor entities & biomarker discovery in breast cancer Zhiqin Huang January, 2016 Referees Prof. Dr. Benedikt Brors Prof. Dr. Peter Lichter
Transcript of Ruprecht-Karls-Universit¨at Heidelberg · Huge thanks to Dr. Zuguang Gu and Dr. Volker Hovestadt...

Ruprecht-Karls-Universitat HeidelbergFakultat fur Biowissenschaften
PhD Thesis
High-confidence fusion gene detection indifferent tumor entities & biomarker discovery
in breast cancer
Zhiqin Huang
January, 2016
Referees
Prof. Dr. Benedikt Brors Prof. Dr. Peter Lichter

Huang, Zhiqin:
High-confidence fusion gene detection in different tumor entities& biomarker discovery in breast cancerPhD Thesis Bioinformatics
Ruprecht-Karls-Universitat Heidelberg
Thesis period: 08.2012 – 01.2016

INAUGURAL DISSERTATION
submitted to the
Combined Faculties for Natural Sciences and for Mathematics
of the Ruperto-Carola University of Heidelberg, Germany
for the degree ofDoctor of Natural Sciences
presented by
Zhiqin Huang, M.Sc.
born in Guangxi, China
Date of oral examination: March 21, 2016


High-confidence fusion gene detection indifferent tumor entities & biomarker discovery
in breast cancer
Referees
Prof. Dr. Benedikt Brors Prof. Dr. Peter Lichter

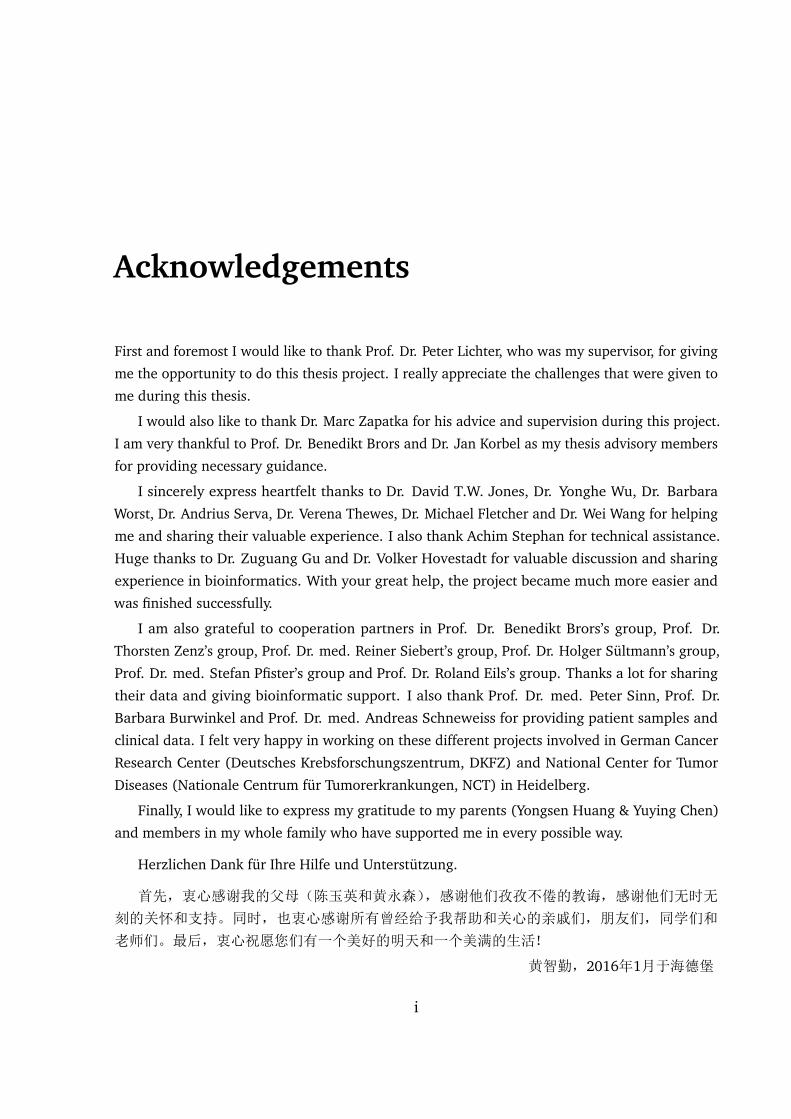
Acknowledgements
First and foremost I would like to thank Prof. Dr. Peter Lichter, who was my supervisor, for giving
me the opportunity to do this thesis project. I really appreciate the challenges that were given to
me during this thesis.
I would also like to thank Dr. Marc Zapatka for his advice and supervision during this project.
I am very thankful to Prof. Dr. Benedikt Brors and Dr. Jan Korbel as my thesis advisory members
for providing necessary guidance.
I sincerely express heartfelt thanks to Dr. David T.W. Jones, Dr. Yonghe Wu, Dr. Barbara
Worst, Dr. Andrius Serva, Dr. Verena Thewes, Dr. Michael Fletcher and Dr. Wei Wang for helping
me and sharing their valuable experience. I also thank Achim Stephan for technical assistance.
Huge thanks to Dr. Zuguang Gu and Dr. Volker Hovestadt for valuable discussion and sharing
experience in bioinformatics. With your great help, the project became much more easier and
was finished successfully.
I am also grateful to cooperation partners in Prof. Dr. Benedikt Brors’s group, Prof. Dr.
Thorsten Zenz’s group, Prof. Dr. med. Reiner Siebert’s group, Prof. Dr. Holger Sultmann’s group,
Prof. Dr. med. Stefan Pfister’s group and Prof. Dr. Roland Eils’s group. Thanks a lot for sharing
their data and giving bioinformatic support. I also thank Prof. Dr. med. Peter Sinn, Prof. Dr.
Barbara Burwinkel and Prof. Dr. med. Andreas Schneweiss for providing patient samples and
clinical data. I felt very happy in working on these different projects involved in German Cancer
Research Center (Deutsches Krebsforschungszentrum, DKFZ) and National Center for Tumor
Diseases (Nationale Centrum fur Tumorerkrankungen, NCT) in Heidelberg.
Finally, I would like to express my gratitude to my parents (Yongsen Huang & Yuying Chen)
and members in my whole family who have supported me in every possible way.
Herzlichen Dank fur Ihre Hilfe und Unterstutzung.
首先,衷心感谢我的父母(陈玉英和黄永森),感谢他们孜孜不倦的教诲,感谢他们无时无
刻的关怀和支持。同时,也衷心感谢所有曾经给予我帮助和关心的亲戚们,朋友们,同学们和
老师们。最后,衷心祝愿您们有一个美好的明天和一个美满的生活!
黄智勤,2016年1月于海德堡
i

ii

Abstract
Fusion genes play an important role in the tumorigenesis of many cancers. Next generation
sequencing (NGS) methods such as RNA-seq provide accurate, high-resolution data, which makes
unbiased fusion detection much more feasible. Most fusion detection tools based on RNA-seq
data report a great number of candidates (mostly false positives), making it hard to prioritize
candidates for validation. I therefore developed confFuse, a scoring algorithm to reliably select
high-confidence fusion genes which are likely to be biologically relevant.
Compared with alternative tools based on 96 published RNA-seq samples from six different
tumor entities, confFuse dramatically reduces the number of fusion candidates (301 high-
confidence from 8083 predicted fusion genes, ∼3.7%) and retains high detection accuracy
(recovery rate 85.7% of previously validated fusions). Another analysis of 27 unpublished tumors
of various origins, results in a recovery rate of ∼93% (25/27). Furthermore, a screen of 22
GBM tumors shows 242 high-confidence fusions from 6,018 candidates (∼4%), of which ∼62%
(150/242) were previously validated or harbor supporting reads in DNA-seq. Similarly, in 11
published prostate cancer tumors ∼72% high-confidence fusions (17/24 from 849 predictions)
have supporting evidence. Validation of 18 high-confidence fusions detected in three primary
breast tumor samples resulted in a 100% true positive rate. When applying confFuse on three
CLL samples, 15 of 18 candidates were successfully validated. In summary, confFuse can reliably
select high-confidence fusion genes that are more likely to be biologically relevant, achieving
both high validation rate and high detection accuracy, while reducing the number of candidates
to a restricted number for validation.
A genetic analysis of primary and refractory breast cancer tumors identified different aber-
rations in CNVs, SNVs/Indels and rearrangements. Mutations of microtubule-associated serine-
threonine kinase (MAST) and 1-phosphatidylinositol-4,5-bisphosphate phosphodiesterase beta
(PLCB) gene family members were only detected in refractory tumors (3/50 and 4/50, respec-
tively). Mutations of members of the calcium channel, voltage-dependent, alpha (CACNA) gene
family members, which are involved in the MAPK signalling pathway, are highly prevalent in
refractory tumors (24%, 12/50) compared to primary tumors (∼2%, 1/46). Rearrangements
of CACNA were also identified in one primary and two refractory tumors, and PLCB in three
iii

iv
refractory tumors. This suggests that mutations of MAST, CACNA or PLCB gene families may be
a novel acquired resistance mechanism in addition to ESR1 mutation.
Hundreds of known or novel fusion genes were identified by confFuse in seven unpublished
tumor cohorts, including more than 60 highly reliable fusion proteins in breast cancer. Further-
more, different chromosome-wide enrichments of fusion genes were identified across tumor
entities. Overall, a comprehensive landscape of fusion genes in different tumor entities was
provided to give an insight for biomarker discovery, especially in breast cancer.

Zusammenfassung
Fusionsgene spielen eine wichtige Rolle in der Tumorgenese von vielen Krebsarten. Next Genera-
tion Sequencing (NGS) Methoden wie RNA-Sequenzierung erlauben die Erfassung von genauen
Expressionsprofilen und ermoglichen die genomweite Erkennung von exprimierten Fusionsgenen.
Die meisten Algorithmen, die Fusiongene auf Basis von RNA-Sequenzierungsdaten erkennen,
identifizieren eine große Anzahl von Kandidaten (vermutlich meist falsch positive), was es
erschwert, Kandidaten fur die Validierung zu priorisieren. Ich entwickelte deshalb confFuse,
einen Algorithmus zur Bewertung von Fusionsgenen, um zuverlassig solche zu identifizieren, die
voraussichtlich biologisch relevant sind.
Basierend auf 96 veroffentlichten und validierten Fusionsgenen aus sechs Tumorentitaten
wurde confFuse mit alternativen Algorithmen verglichen. Es kann die Anzahl der Fusionsgenkan-
didaten drastisch reduzieren (Reduktion von 8083 Fusionsgenkandidaten auf 301, ∼3.7%) und
trotzdem eine hohe Sensitivitat erreichen (Identifikation von 85,7% der validierten Fusionsgene).
Eine weitere Analyse von 27 unveroffentlichten Tumoren verschiedenen Ursprungs, resultierte
in einer Identifikation von 93% validierbaren Fusionsgenen (25/27). Eine Untersuchung von
22 GBM Tumoren ergab eine Reduktion von 6018 Kandidaten auf 242 (∼4%), von denen
∼62% (150/242) experimentell validiert werden konnten oder auch in der DNA-Sequenzierung
detektiert werden. In elf Prostatakarzinomen konnten ebenfalls ∼72% der getesteten Fusions-
genkandidaten verifiziert werden (17/24 validiert aus 849 Kandidaten). In Brustkrebstumoren
konnten alle 18 getesteten, mittels confFuse identifizierten Fusionen, experimentell validiert
werden. Bei der Untersuchung von drei CLL Proben wurden 15 von 18 Kandidaten erfolgre-
ich validiert. Zusammenfassend kann confFuse zuverlassig Fusionsgene identifizieren, die sich
experimentell validieren lassen und reduziert die Anzahl der Fusionsgenkandidaten auf eine
realistische Anzahl fur die Validierung.
Eine genetische Analyse der Kopienzahlveranderungen, Mutationen und Insertio-
nen/Deletionen von primaren und refraktaren Brustkrebstumoren ergab verschiedene Veranderun-
gen. Mutationen der Mikrotubuli-assoziierten Serin-Threoninkinase (MAST) und der 1-
Phosphatidylinositol-4,5-bisphosphat-Phosphodiesterase beta (PLCB) Gene Familie wurden nur
in refraktaren Tumoren (3/50 und 4/50) detektiert. Mutationen der Gene Familie des span-
v

vi
nungsabhangigen Kalzium-Kanals alpha (CACNA), die am MAPK-Signalweg beteiligt ist, sind
haufiger in refraktaren Tumoren (24%, 12/50) als in primaren (∼2%, 1/46). DNA-Struktur-
Umlagerungen von CACNA wurden in einem primaren und zwei refraktaren Tumoren, sowie fur
PLCB in drei refraktaren Tumoren identifiziert. Diese Veranderungen in MAST, CACNA oder PLCB
Familie Genes konnten neben der Mutation von ESR1 ein weiterer Resistenzmechanismus sein.
Es wurden hunderte von bekannten oder neuen Fusionsgenen durch confFuse in sieben
unveroffentlichten Kohorten, darunter mehr als 60 Fusionsgene bei Brustkrebs identifiziert.
Außerdem konnten Haufungen von Fusionsgenen auf spezifischen Chromosomen in den unter-
suchten Tumorentitaten identifiziert werden. Insgesamt konnten nach der Entwicklung von conf-
Fuse eine umfassende Analyse der Fusionsgene in verschiedenen Tumorentitaten durchgefuhrt
werden und so, vor allem bei Brustkrebs, potentielle Biomarker identifiziert werden.

Contents
Acknowledgements i
Abstract iii
Zusammenfassung v
1 Introduction 1
1.1 Genetics and cancer . . . . . . . . . . . . . . . . . . . . . . . . . . . . . . . . . . 1
1.2 Breast cancer genomics . . . . . . . . . . . . . . . . . . . . . . . . . . . . . . . . 1
1.3 Mechanisms of fusion gene generation . . . . . . . . . . . . . . . . . . . . . . . . 7
1.4 Detection of fusion genes . . . . . . . . . . . . . . . . . . . . . . . . . . . . . . . 10
1.5 “deFuse” algorithm . . . . . . . . . . . . . . . . . . . . . . . . . . . . . . . . . . . 15
1.6 Objectives . . . . . . . . . . . . . . . . . . . . . . . . . . . . . . . . . . . . . . . . 15
2 Material and methods 19
2.1 Material . . . . . . . . . . . . . . . . . . . . . . . . . . . . . . . . . . . . . . . . . 19
2.2 NGS data analysis . . . . . . . . . . . . . . . . . . . . . . . . . . . . . . . . . . . 20
2.2.1 Whole-genome sequencing analysis . . . . . . . . . . . . . . . . . . . . . . 20
2.2.2 Whole-exome sequencing analysis . . . . . . . . . . . . . . . . . . . . . . 20
2.2.3 RNA sequencing analysis . . . . . . . . . . . . . . . . . . . . . . . . . . . . 21
2.3 “confFuse” algorithm . . . . . . . . . . . . . . . . . . . . . . . . . . . . . . . . . . 23
3 Results 27
3.1 CNVs and SNVs/Indels in breast cancer . . . . . . . . . . . . . . . . . . . . . . . . 27
3.1.1 CNVs in breast cancer . . . . . . . . . . . . . . . . . . . . . . . . . . . . . 27
vii

viii CONTENTS
3.1.2 Somatic mutations in breast cancer . . . . . . . . . . . . . . . . . . . . . . 28
3.1.3 Expression of mutant allele in breast cancer . . . . . . . . . . . . . . . . . 31
3.2 ConfFuse . . . . . . . . . . . . . . . . . . . . . . . . . . . . . . . . . . . . . . . . 32
3.2.1 Generation of artefact list . . . . . . . . . . . . . . . . . . . . . . . . . . . 32
3.2.2 Recovery rate of validated fusions . . . . . . . . . . . . . . . . . . . . . . . 34
3.2.3 Comparison of alternative fusion detection tools . . . . . . . . . . . . . . . 34
3.2.4 Comparison of deFuse probability and confFuse confidence score . . . . . 38
3.2.5 Validation of confFuse predicted candidates . . . . . . . . . . . . . . . . . 38
3.2.6 ConfFuse performance in data sets with verified fusion genes . . . . . . . 38
3.3 Fusion genes in different tumor entities . . . . . . . . . . . . . . . . . . . . . . . . 43
3.3.1 Sarcoma . . . . . . . . . . . . . . . . . . . . . . . . . . . . . . . . . . . . . 43
3.3.2 Prostate cancer . . . . . . . . . . . . . . . . . . . . . . . . . . . . . . . . . 44
3.3.3 Glioblastoma multiforme . . . . . . . . . . . . . . . . . . . . . . . . . . . 45
3.3.4 Germinal-center derived B-cell malignant lymphoma . . . . . . . . . . . . 47
3.3.5 B-cell chronic lymphocytic leukemia . . . . . . . . . . . . . . . . . . . . . 52
3.3.6 Ependymoma . . . . . . . . . . . . . . . . . . . . . . . . . . . . . . . . . . 57
3.3.7 Breast cancer . . . . . . . . . . . . . . . . . . . . . . . . . . . . . . . . . . 60
3.3.7.1 Ras superfamily . . . . . . . . . . . . . . . . . . . . . . . . . . . 61
3.3.7.2 Solute carrier family . . . . . . . . . . . . . . . . . . . . . . . . . 62
3.3.7.3 HIF1 pathway . . . . . . . . . . . . . . . . . . . . . . . . . . . . 62
3.3.7.4 Notch pathway . . . . . . . . . . . . . . . . . . . . . . . . . . . . 62
3.3.7.5 TP53 pathway . . . . . . . . . . . . . . . . . . . . . . . . . . . . 62
3.3.7.6 Estrogen pathway . . . . . . . . . . . . . . . . . . . . . . . . . . 62
3.3.7.7 Ras pathway . . . . . . . . . . . . . . . . . . . . . . . . . . . . . 63
3.3.7.8 ErbB pathway . . . . . . . . . . . . . . . . . . . . . . . . . . . . 63
3.3.7.9 PI3K-AKT-mTOR pathway . . . . . . . . . . . . . . . . . . . . . . 64
3.3.7.10 MAPK pathway . . . . . . . . . . . . . . . . . . . . . . . . . . . . 66
3.3.7.11 Tumor suppressor gene . . . . . . . . . . . . . . . . . . . . . . . 66
3.3.7.12 Oncogene . . . . . . . . . . . . . . . . . . . . . . . . . . . . . . . 66
3.3.7.13 Census gene (COSMIC) . . . . . . . . . . . . . . . . . . . . . . . 68
3.3.7.14 Recurrent fusions . . . . . . . . . . . . . . . . . . . . . . . . . . 68

CONTENTS ix
3.3.7.15 Fusions related to tamoxifen and estrogen metabolism . . . . . . 69
3.3.7.16 Potential fusion proteins . . . . . . . . . . . . . . . . . . . . . . . 70
3.3.7.17 Fusions in paired primary-refractory breast tumors . . . . . . . . 72
3.3.8 Fusion features across entities . . . . . . . . . . . . . . . . . . . . . . . . . 72
4 Discussion and outlook 77
4.1 Fusion gene detection . . . . . . . . . . . . . . . . . . . . . . . . . . . . . . . . . 77
4.1.1 ConfFuse performance . . . . . . . . . . . . . . . . . . . . . . . . . . . . . 77
4.1.2 Problems with deFuse . . . . . . . . . . . . . . . . . . . . . . . . . . . . . 78
4.1.3 Possible improvement . . . . . . . . . . . . . . . . . . . . . . . . . . . . . 79
4.2 Fusion genes in different tumor entities . . . . . . . . . . . . . . . . . . . . . . . . 79
4.3 Biomarker discovery in breast cancer . . . . . . . . . . . . . . . . . . . . . . . . . 80
4.3.1 CNV . . . . . . . . . . . . . . . . . . . . . . . . . . . . . . . . . . . . . . . 80
4.3.2 SNV/Indel . . . . . . . . . . . . . . . . . . . . . . . . . . . . . . . . . . . . 80
4.3.3 Fusion-related genes . . . . . . . . . . . . . . . . . . . . . . . . . . . . . . 81
4.4 Outlook . . . . . . . . . . . . . . . . . . . . . . . . . . . . . . . . . . . . . . . . . 83
Supplementary 85
Bibliography 171
List of Figures 189
List of Tables 193

x CONTENTS
Chapter 1
Introduction
1.1 Genetics and cancer
Cancer is a genetic disease arising from a multistep process of sequential alterations in different
types of genes, including oncogenes, tumor suppressor genes or microRNA genes [1, 2]. These
alterations include germline mutations (inherited variants) and somatic mutations (also called
acquired mutations). There are at least five types of somatic mutations, namely point mutations
(single nucleotide substitutions), insertions, deletions, gene amplifications and gene fusions
in genetic alterations. An example of somatic genetic alteration is the structural chromosome
rearrangement, Philadelphia chromosome, first identified in chronic myeloid leukaemia (CML)
by chromosome banding analysis [3]. After that, molecular cytogenetic techniques, such as
fluorescence in situ hybridization (FISH) and high-throughput microarray-based analysis, played
an important role in detecting genes associated with tumorigenesis and identified many genes
involved in fusions in neoplastic disorders, such as fusions BCR:ABL1, IGH:MYC in Burkitt
lymphoma and TMPRSS2:ERG in prostate cancer [3, 4].
1.2 Breast cancer genomics
Breast cancer is one of the most common cancers and occurs much more often in women than
in man. It is a heterogeneous disease originating from breast tissue and counts for >1,300,000
cases and >450,000 deaths each year all over the world [5]. More than 2/3 cases express
estrogen receptor-α (ERα+) [6, 7] and approximately 12%-17% of cases have triple-negative
breast cancer lacking expression of estrogen receptor (ER), progesterone receptor (PR) and HER2
[8]. Approximately 0.3% (∼1/300) women under age 40 were diagnosed with breast cancer
in the world [9]. Currently, treatment of breast cancer mostly depends on biologically intrinsic
1

2 CHAPTER 1. INTRODUCTION
subtypes which are classified into luminal A, luminal B, HER2-enriched and triple-negative based
on clinico-pathology [10]. A great many aspects of breast cancer biology have already been
investigated, including copy number variants (CNVs), single nucleotide variants (SNVs), mRNA,
microRNA, antisense RNA and alternative splicing RNA.
• Copy number variants
The copy number variants (CNVs) and single nucleotide polymorphisms (SNPs) are associated
with ∼40% of expressed genes based on a study cohort of ∼2000 breast tumors [11]. Ten novel
subgroups of breast cancer patients were classified by integrating CNVs and gene expression
profiling data based on ∼2000 breast tumor samples (method called intClust) [11]. These ten
subgroups/subtypes have been demonstrated that they were correlated with different clinical
outcomes [11].
• Single nucleotide variants
Four studies, in which more than 1000 whole-exome/-genome sequencing (WES/WGS) samples
were totally analyzed, show different numbers of significantly mutated genes (SMGs) in breast
cancer, including six SMGs of false discovery rate (FDR) <0.1 in 103 samples [12], 18 SMGs
of FDR<0.26 in 79 samples [13], 35 SMGs of FDR<0.05 in 507 samples [5] and 32 SMGs of
FDR<0.1 in 892 samples [14]. Four SMGs (TP53, PIK3CA, GATA3 and MAP3K1) have been
identified in these four studies. In addition, analysis of 79 ER+ and 21 ER− primary breast cancer
shows driver mutations in nine cancer genes (ARID1B, CASP8, MAP3K1, MAP3K13, NCOR1,
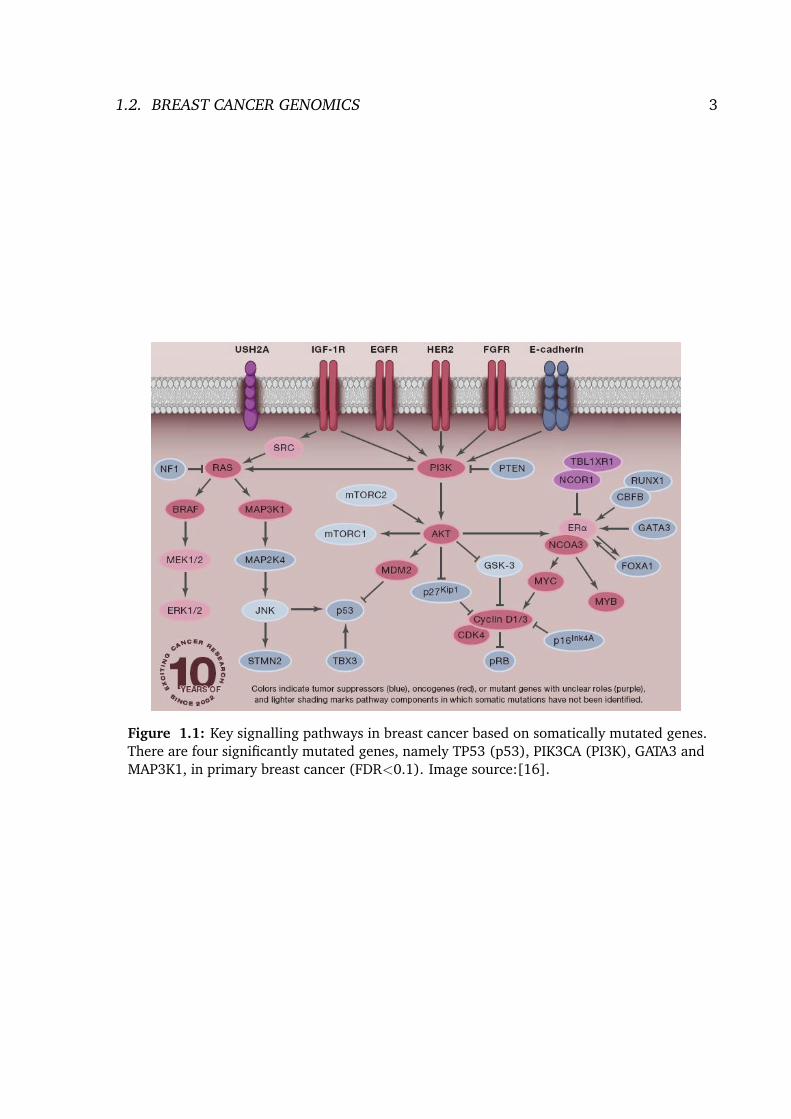
SMARCD1, CDKN1B and AKT2) [15]. A summary of somatically mutated genes in key signalling
pathways in primary breast cancer is given in Figure 1.1.
Two recent studies of aromatase inhibitor-resistant metastatic breast cancers revealed a high
mutation rate of ESR1, which indicates activating ESR1 mutations is a key mechanism in acquired
endocrine resistance during breast cancer treatment [6, 7]. A prevalence of mutations in TP53,
PIK3CA and GATA3 was comparable in both primary and relapsed breast tumors, whereas much
higher mutation rate of ESR1, ERBB3 and RPTOR was observed in aromatase inhibitor-resistant
relapsed breast cancers (Figure 1.2.a). Some identified ESR1 mutations are located in the
functional ligand-binding domain (LBD) (Figure 1.2.c and Figure 1.3). Some of the LBD-localized
ESR1 mutations can constitutively activate and continue responsiveness to anti-estrogen therapy
in vitro [7]. Furthermore, several amplified genes such as ERBB2, CCND1 and FGFR1 were
identified and these genes have been reported to be associated with hormone resistance (Figure
1.2.b) [6].
• Messenger RNA
Gene expression profiling by microarray has given us deep insight into understanding breast
cancer and has been used to provide prognostic and predictive information, such as 50-gene
PAM50 intrinsic subtypes [18, 19], 21-gene OncotypeDx assay [20, 21] and 70-gene MammaPrint
1.2. BREAST CANCER GENOMICS 3
Figure 1.1: Key signalling pathways in breast cancer based on somatically mutated genes.There are four significantly mutated genes, namely TP53 (p53), PIK3CA (PI3K), GATA3 andMAP3K1, in primary breast cancer (FDR<0.1). Image source:[16].

4 CHAPTER 1. INTRODUCTION
Figure 1.2: Top mutated and amplified genes in metastatic breast cancers. (a) Comparisonof top 6 mutated genes in aromatase inhibitor-resitant relapsed breast cancers and the onesin primary breast cancer and luminal A & luminal B cases in TCGA data set. Mutated genesidentified in more than 10% samples were shown. Three mutated genes (ESR1, RPTOR andERBB3) are of much higher rates in relapsed samples. (b) Top amplified genes in relapsedbreast cancers. Fold change of copy number in tumor and normal samples is greater than2. (c) The structure domains of ERα and location of identified mutations in ligand-bindingdomains (LBD). Image source:[6].

1.2. BREAST CANCER GENOMICS 5
Figure 1.3: ESR1 mutation in metastatic breast cancer. Rare ESR1 mutations can beidentified in primary and tamoxifen treatment-resistant metastatic ER+ breast cancers. TheERα structure includes activation function 1 (AF1) domain, DNA-binding domain (DBD) andactivation function 2 (AF2) which contains ligand-binding domain (LBD). Most of the ERαmutations locate in LBD (small black arrows). Image source:[17].

6 CHAPTER 1. INTRODUCTION
[22, 23]. Those studies showed the correlation between gene-expression profiling and clinical
outcomes as well as between gene-expression profiling and response to chemotherapy [24].
Analysis of gene-expression profiling based on DNA microarray has confirmed that “breast cancer
is not a single disease with variable morphologic features and biomarkers but, rather, a group of
molecularly distinct neoplastic disorders” [24]. A recent study has developed a novel method
to classify breast cancer into ten previously validated subgroups (intClust) based on 612 gene
expression profiling [25].
• MicroRNAs
MicroRNAs (20-23 nucleotides in length) play an important role in cell differentiation, apoptosis
and cell cycle regulation [26]. There are at least three types of microRNAs, including oncogenic,
tumor-suppressive and metastatic-influencing microRNAs in the pathogenesis of breast cancer
[27]. For example, microRNA-10b can promote cell migration and invasion as well as initiate
metastasis through targeting homeobox D10 (HOXD10) in breast cancer [28, 29]. Analysis of
1,302 breast tumors showed that microRNAs are associated with differential co-expression of
mRNA and confirmed that “miRNAs act as modulators of mRNA-mRNA interactions rather that as
on-off molecular switches” [30].
• Antisense RNA
Recently, a newly developed RNA-seq library protocol, strand-specific RNA-seq [31, 32], can
preserve strand information of the transcript for RNA sequencing, which makes antisense gene
expression detectable in the analysis of next-generation sequencing data. A study of 376 cancer
samples (strand-specific RNA-seq) from nine different tissue types including breast cancer shows
44 cancer-specific antisense loci involving tumor suppressor genes or oncogenes [33]. More than
38% of annotated transcripts have consistent antisense transcript expression which is positively
correlated with sense transcript expression [33]. In addition, several functional natural antisense
transcripts have been identified, such as NKX2-1-AS1 which can regulate NKX2-1 oncogene and
cell proliferation in lung cancer cells [33].
• Alternative splicing RNA
Alternative pre-mRNA splicing is a process of genetic regulation, which results in multiple proteins
from a single gene [34]. In the analysis of RNA splicing alteration in breast cancer, subtype
specific differentially spliced genes and spliced isoforms were identified and the predominant
splice events are exon skipping and intron retention [35].
• Targeting agents against breast cancer
Many targeting agents against breast cancer are now under clinical development. Those agents
are classified into three groups based on targeted cellular compartments including breast cancer
cells, breast cancer stem cells and breast cancer microenvironment [36]. Different agents
targeting functional genes in oncogenic signalling pathways are under development, including

1.3. MECHANISMS OF FUSION GENE GENERATION 7
PI3K-AKT-mTOR pathway, IGF signalling pathway, FGF signalling pathway, MET and MAPK
signalling pathway (Figure 1.4) [36].
• Reported fusions in breast cancer
Several recurrent fusions have been identified and experimentally validated in breast cancer
cells or tissues, such as MYB:NFIB in adenoid cystic carcinoma of the breast [37], ETV6:NTRK3
in secretory breast carcinomas [38], microtubule-associated serine-threonine kinase (MAST)
rearrangements and Notch gene family rearrangements [39], as well as ESR1:CCDC170 in ER+
breast tumors [40]. Another recurrent fusion MAGI3:AKT3 has been reported in triple negative
breast cancer (TNBC) which leads to constitutive activation of AKT kinase [12]. It was, however,
recently amended that MAGI3:AKT3 is neither recurrent nor sub-clonal in TNBC [41].
1.3 Mechanisms of fusion gene generation
A fusion gene is typically desired from two separate genes due to genomic aberrations instead
of read through co-transcript events. Fusion genes may occur as a result of interstitial deletion,
chromosomal inversion, translocation or duplication (Figure 1.5) [42]. Considering whether
the overall amount of genomic material is changed or not, rearrangements could be grouped
into two types: balanced rearrangements (inversion or translocation) and unbalanced rear-
rangements (deletion or duplication). The former only changes the order of chromosomal
genes/segments but does not result in loss or gain of any DNA, such as fusions IGH:BCL2 and
IGH:MYC (translocation) [43], whereas unbalanced rearrangements change the total amount of
genomic materials. Co-occurrence of translocations and deletions was often observed. Interest-
ingly, fusion TMPRSS2:ERG can be produced by either translocation or interstitial deletion which
were identified by array-based comparative genomic hybridization and interphase fluorescence in
situ hybridization in prostate cancer [44, 45, 46].
Two different structural groups of fusion genes were observed, including fusion of a coding
gene (or part of it) and a regulatory sequence such as IGH:MYC, and fusion of two different
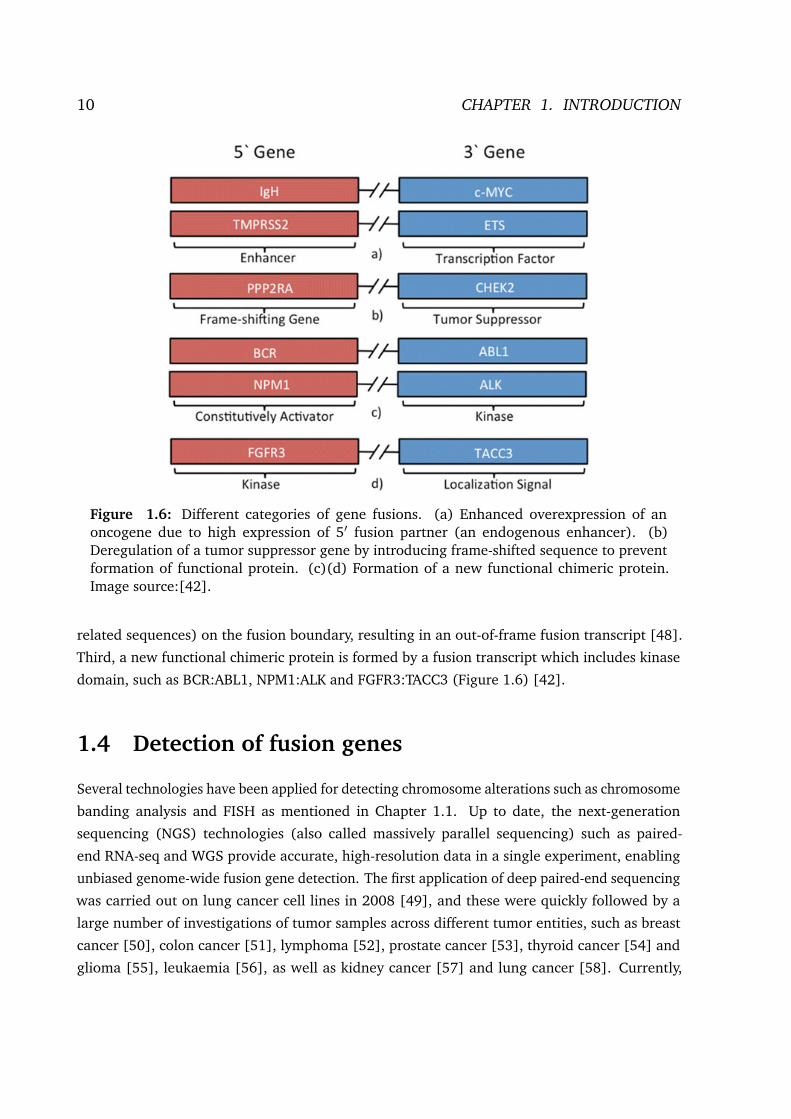
coding genes (or parts of them) such as BCR:ABL1. There are at least three categories of
gene fusion effects: overexpression of an oncogene, deregulation of a suppressor gene and
formation of a new functional protein [42]. First, an oncogene (3′ fusion partner) can be over
expressed by using highly expressed 5′ fusion partner which functions as an enhancer, such
as well known fusions IGH:MYC, IGH:BCL2 and TMPRSS2:ETS (E26 transformation-specific
family genes). Second, a tumor suppressor gene (3′ fusion partner) can be deregulated through
adding/removing a frame-shifted sequence during gene fusion process. Based on FISH and
reverse transcription-polymerase chain reaction (RT-PCR), fusion PPP2R2A:CHEK2 in childhood
teratoma has been identified that there is an inserted fragment (class I endogenous retrovirus-

8 CHAPTER 1. INTRODUCTION
Figure 1.4: Targeting agents under clinical development. Those agents are expected totarget molecular components involved in oncogenic pathways in breast cancer cell lines,including PI3K-AKT-mTOR pathway, IGF signaling pathway, MET signalling pathway, MAPKsignalling pathway as well as cyclin-dependent kinases (CDKs) and epigenetic regulators.Image source:[36].

1.3. MECHANISMS OF FUSION GENE GENERATION 9
Figure 1.5: Different types of chromosomal rearrangements. Four types of chromosomalrearrangements. These rearrangements occur due to either DNA double-strand breakageand reunion or crossing-over between repetitive chromosomal segments in different regions.Image source:[47].
10 CHAPTER 1. INTRODUCTION
Figure 1.6: Different categories of gene fusions. (a) Enhanced overexpression of anoncogene due to high expression of 5′ fusion partner (an endogenous enhancer). (b)Deregulation of a tumor suppressor gene by introducing frame-shifted sequence to preventformation of functional protein. (c)(d) Formation of a new functional chimeric protein.Image source:[42].
related sequences) on the fusion boundary, resulting in an out-of-frame fusion transcript [48].
Third, a new functional chimeric protein is formed by a fusion transcript which includes kinase
domain, such as BCR:ABL1, NPM1:ALK and FGFR3:TACC3 (Figure 1.6) [42].
1.4 Detection of fusion genes
Several technologies have been applied for detecting chromosome alterations such as chromosome
banding analysis and FISH as mentioned in Chapter 1.1. Up to date, the next-generation
sequencing (NGS) technologies (also called massively parallel sequencing) such as paired-
end RNA-seq and WGS provide accurate, high-resolution data in a single experiment, enabling
unbiased genome-wide fusion gene detection. The first application of deep paired-end sequencing
was carried out on lung cancer cell lines in 2008 [49], and these were quickly followed by a
large number of investigations of tumor samples across different tumor entities, such as breast
cancer [50], colon cancer [51], lymphoma [52], prostate cancer [53], thyroid cancer [54] and
glioma [55], leukaemia [56], as well as kidney cancer [57] and lung cancer [58]. Currently,

1.4. DETECTION OF FUSION GENES 11
whole-exome sequencing (WES) [59], whole-genome sequencing (WGS) [12, 53] and whole
transcriptome sequencing (RNA-seq) [52] have already been successfully applied on fusion gene
discovery in different tumor types. A great number of fusion gene detection tools have been
developed to interrogate data from NGS, particularly paired-end RNA-seq (Table 1.1).
Table 1.1: An overview of different fusion detection tools based on RNA-seq data.
Tool Name Reads Cited Tool Name Reads Cited
TopHat-Fusion [60] Single/Paired End 116 ShortFuse [61] Paired End 27deFuse [50] Paired End 108 FusionHunter [62] Paired End 22FusionSeq [63] Paired End 62 FusionFinder [64] Single/Paired End 15FusionMap [65] Single/Paired End 56 SOAPFuse [66] Paired End 13ChimeraScan [67] Paired End 53 BreakFusion [68] Paired End 10SnowShoes-FTD [69] Paired End 30 FusionAnalyser [70] Paired End 9
PRADA [71] Paired End 5
Based on WEB OF SCIENCE, 2015-09-14.
The NGS technologies can be applied on different cell lines or tumor types. Recently, a
new fusion detection pipeline PRADA [71] was applied on a large cohort of transcriptomic
data (4,366 neoplasms from 13 different tumor types) that had been previously studied in The
Cancer Genome Atlas (TCGA) network (Table 1.2) [72]. Using stringent filtering criteria, PRADA
identified more than 8,600 different fusion transcripts across 13 different cancer types, resulting
in a plethora of gene fusions (>9,000) (Figure 1.7) [4, 71, 72]. The distribution of currently
known/identified fusions across different neoplasia types is given in Table 1.3. More than 90% of
the total 9,928 fusions were identified by NGS technologies during the past five years, of which
75% are intrachromosomal and approximately 50% are in the same chromosome band [4]. In
nine of 13 tumor types from TCGA RNA-seq cohort, more than 80% of fusion transcripts were
associated with DNA amplifications or deletions (Figure 1.8) [72] .
RNA-seq provides a very high sensitivity in fusion gene detection. It should be noted that
most of the identified/putative fusions were not experimentally validated. Even though a very
stringent filtering method was used to select reliable fusion candidates, it can still not be sure
that all the identified fusions are true positives. Some false positive fusion predictions may be
due to sequencing/alignment artefacts or library preparation for sequencing. Different fusion
detection tools perform variably in terms of sensitivity and specificity, depending on the individual
algorithms and filtering methods [73]. Currently, RT-PCR followed by Sanger sequencing is a
typical experimental method for validating predicted fusion genes in addition to FISH validation.
Fusion detection based on RNA-seq may lead to not only false positive but also false negative
predictions, which may be a result of several aspects. First, low RNA quality of samples or
sequencing errors may reduce the number and quality of sequence reads, thereby decreasing the
probability of detecting fusion transcripts. For example, RNA in formalin-fixed paraffin-embedded

12 CHAPTER 1. INTRODUCTION
Table 1.2: RNA-seq data set from 13 different tumor types in TCGA. Source:[72].
Tumor type Tumor Normal
Bladder urothelial carcinoma (BLCA) 121 16Breast cancer (BRCA) 1,019 110Glioblastoma multiforme (GBM) 158 -Head and neck squamous cell carcinoma (HNSC) 300 37Clear cell renal cell carcinoma (KIRC) 474 71Acute myeloid leukemia (LAML) 171 -Low-grade glioma (LGG) 266 -Lung adenocarcinoma (LUAD) 487 57Lung squamous cell carcinoma (LUSC) 220 17Ovarian serous cystadenocarcinoma (OV) 400 -Prostate adenocarcinoma (PRAD) 178 -Skin cutaneous melanoma (SKCM) 78 -Thyroid carcinoma (THCA) 494 56Total 4,366 364
Figure 1.7: Number of newly reported fusions from 1982 to 2014. Guided fusion geneswere based on cytogenetic features, FISH and high-throughput array-based analysis, whereasunbiased fusions were detected using NGS data. Most of the newly identified fusions werereported in 2014. Image source:[4].

1.4. DETECTION OF FUSION GENES 13
Table 1.3: Number of known/identified gene fusions in different neoplasia subtypes.Source:[4].
DiagnosisNumber of gene fusions
Total Confirmed as recurrent
Haematological disordersUndifferentiated and biphenotypic leukaemia 25 3Acute myeloid leukaemia 302 51Myelodysplastic syndromes 52 8Myeloproliferative neoplasms, including chronic myeloidleukaemia
72 24
Acute lymphoblastic leukaemia 237 59Plasma cell neoplasms 22 5Mature B cell neoplasms 181 31Mature T cell and natural killer cell neoplasms 28 8Hodgkin disease 13 2Benign solid tumoursBenign epithelial tumours 14 6Benign mesenchymal tumours 57 8Malignant solid tumoursRespiratory system 2,110 11Digestive system 522 5Breast 3,856 68Female genital organs 432 0Male genital organs 676 25Urinary tract 626 5Endocrine system 158 15Nervous system 738 6Skin 193 0Bone 28 5Soft tissue 104 34
The total number of known/identified fusions is 9,928, 330 of which are recurrent fusions. Haema-tological disorders harbor 759 fusions (157 recurrent) and 9,189 fusions (176 recurrent) wereidentified in solid tumors.

14 CHAPTER 1. INTRODUCTION
Figure 1.8: Copy number variance of each fusion partner gene identified by PRADA. Fivetypes of copy number variance were presented in each bar plot for each tumor type. Copynumber status for some genes were not available (NA) due to incompatibility of gene symbolsbetween fusions and copy number variance. Excluding THCA, KIRC, LAML and PRAD, morethan 80% of fusion transcripts were associated with copy number variance in the remainingnine tumor types. Image source:[72].
1.5. “DEFUSE” ALGORITHM 15
tumor tissues considered to be highly degraded and chemically modified, may not be sufficient
for discovering fusions compared with RNA in fresh-frozen tissue samples. In addition, fusions
with low expression or low sequencing depth may be difficult to be detected. The same may
happen to sub-clonal fusion events in heterogeneous tumors [4].
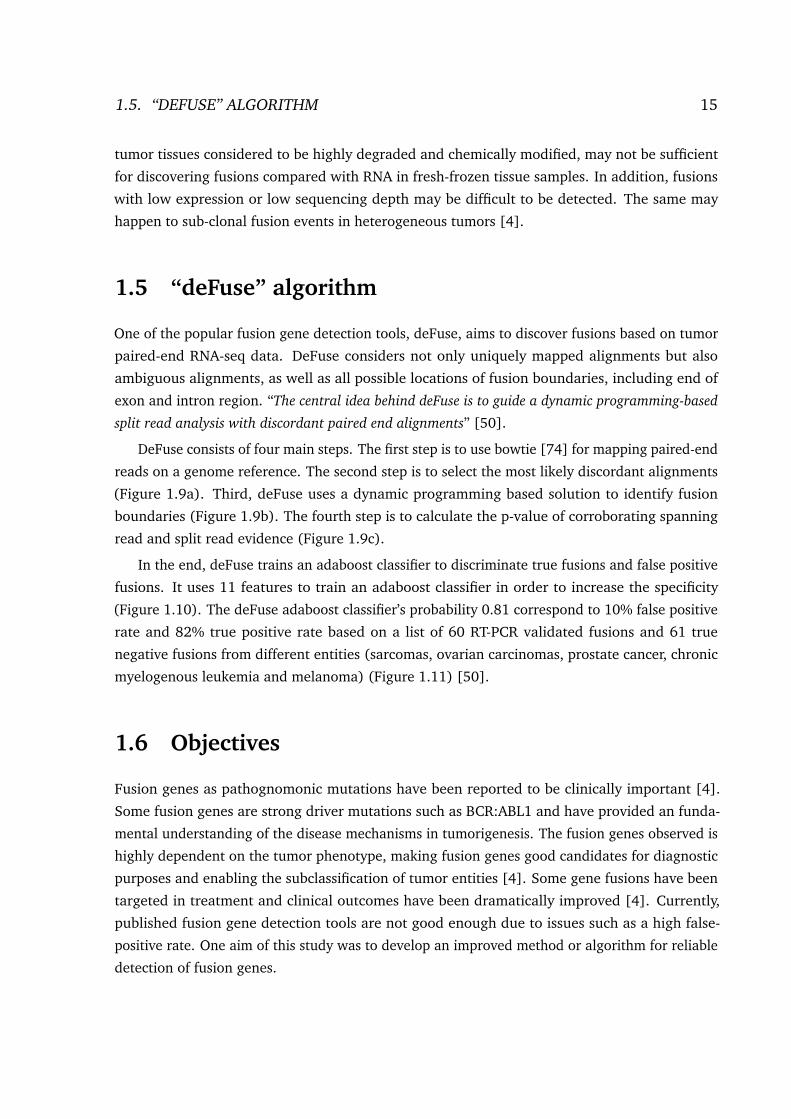
1.5 “deFuse” algorithm
One of the popular fusion gene detection tools, deFuse, aims to discover fusions based on tumor
paired-end RNA-seq data. DeFuse considers not only uniquely mapped alignments but also
ambiguous alignments, as well as all possible locations of fusion boundaries, including end of
exon and intron region. “The central idea behind deFuse is to guide a dynamic programming-based
split read analysis with discordant paired end alignments” [50].
DeFuse consists of four main steps. The first step is to use bowtie [74] for mapping paired-end
reads on a genome reference. The second step is to select the most likely discordant alignments
(Figure 1.9a). Third, deFuse uses a dynamic programming based solution to identify fusion
boundaries (Figure 1.9b). The fourth step is to calculate the p-value of corroborating spanning
read and split read evidence (Figure 1.9c).
In the end, deFuse trains an adaboost classifier to discriminate true fusions and false positive
fusions. It uses 11 features to train an adaboost classifier in order to increase the specificity
(Figure 1.10). The deFuse adaboost classifier’s probability 0.81 correspond to 10% false positive
rate and 82% true positive rate based on a list of 60 RT-PCR validated fusions and 61 true
negative fusions from different entities (sarcomas, ovarian carcinomas, prostate cancer, chronic
myelogenous leukemia and melanoma) (Figure 1.11) [50].
1.6 Objectives
Fusion genes as pathognomonic mutations have been reported to be clinically important [4].
Some fusion genes are strong driver mutations such as BCR:ABL1 and have provided an funda-
mental understanding of the disease mechanisms in tumorigenesis. The fusion genes observed is
highly dependent on the tumor phenotype, making fusion genes good candidates for diagnostic
purposes and enabling the subclassification of tumor entities [4]. Some gene fusions have been
targeted in treatment and clinical outcomes have been dramatically improved [4]. Currently,
published fusion gene detection tools are not good enough due to issues such as a high false-
positive rate. One aim of this study was to develop an improved method or algorithm for reliable
detection of fusion genes.

16 CHAPTER 1. INTRODUCTION
Figure 1.9: Method of fusion detection in deFuse. (a) Discordant alignments are clusteredbased on the spanning reads. Ambiguous alignments are assigned to the most likely set offusion events instead of filtering them directly and the remaining ambiguous alignments arediscarded. (b) DeFuse uses a dynamic programming-based method to mine split alignmentsfor both fusion partners gene 1 and gene 2 and predicts the fusion boundary. (c) Thefragment lengths of spanning reads are estimated based on the predicted fusion boundary.Then deFuse tests whether the fragment length distribution are random. Image source:[50].
Figure 1.10: Relative importance of 11 features in deFuse adaboost classifier. Those featureswere used to predict true positive fusions. Image source:[50].

1.6. OBJECTIVES 17
Figure 1.11: ROC curve of adaboost probability in deFuse. The area under the ROC curve(AUC) is 0.91. The adaboost probability 0.81 corresponds to a false positive rate of 10%and a true positive rate of 82%. The 60 RT-PCR validated fusion genes are from sarcomas,ovarian carcinomas, prostate cancer cell line, chronic myelogenous leukemia cell line andmelanoma samples. Image source:[50].

18 CHAPTER 1. INTRODUCTION
As mentioned above (Chapter 1.2), ESR1 mutation is a major mechanism in acquired en-
docrine resistance during breast cancer treatment [6, 7]. Fusions of MAST kinase and Notch gene
families affect the phenotype in breast epithelial cells [39]. It will be very interesting to identify
novel fusion genes or biomarkers by analyzing WES and RNA-seq data in primary and refractory
breast tumors in order to elucidate the resistance mechanism and contribute to individualized
therapy for breast cancer patients.
In summary, the objectives of this thesis were to reliably identify fusion genes for giving
a comprehensive landscape of fusion genes in different tumor entities and to identify novel
molecular markers that may contribute to personalized treatment in breast cancer.

Chapter 2
Material and methods
2.1 Material
In total, 46 primary and 29 refractory breast tumor samples from HIPO-017 (Heidelberg Center
for Personalized Oncology, DKFZ-HIPO) were involved for WES analysis in this thesis. The library
of control and tumor samples was prepared according to Agilent SureSelect Human All Exon
V5+UTRs protocol for WES. Paired-end sequencing (2×101bp) was carried out with Illumina
Hiseq-2000 instruments. Furthermore, additional 21 refractory WES data sets generated by
Matthew Ellis’s group were included in this thesis1.
Paired-end RNA-sequencing library was prepared with ribosomal RNA depleted, strand-
specific protocol for breast cancer samples as previous describes [31, 32]. Deep sequencing
(2×101bp) was carried out on an Illumina HiSeq-2000 platform. Totally, 98 breast tumor RNA-
seq samples from HIPO-017 project were sequenced, 42 of which were refractory tumors and 46
of which were primary tumors. In addition, 24 refractory tumor RNA-seq samples generated by
Matthew Ellis’s group were also analyzed in this thesis2.
Library preparation and sequencing of WES and RNA-seq from HIPO-017 were completed in
DKFZ3. There were five primary-refractory matched-paired samples in fusion analysis, namely
0E5B T1 & T2VO M1, QYXQ T1 & QYXQ M1, B2HF T1 & B2HF M1, 4R5V T1 & 4R5V M1 and
DMG3 T1 & DMG3 M1.
The other unpublished RNA-seq data sets in this thesis include sarcoma generated from
Benedikt Brors’s group (HIPO-028), CLL from Thorsten Zenz’s group (HIPO-005), gliomas from
1In total, 46 primary WES samples were involved in SNVs and Indels analysis and 44 primary WESsamples were involved in CNVs analysis. 50 refractory WES data were involved in SNVs, Indels and CNVsanalysis.
2Currently, three patient samples were sequenced by WES but not by RNA-seq in Ellis’s data.3Done by core facility in DKFZ, Dr. Andrius Serva and Dr. Verena Thewes in Peter Lichter’s group.
19
20 CHAPTER 2. MATERIAL AND METHODS
Peter Lichter’s group (HIPO-016), lymphomas from Reiner Siebert’s group (ICGC), prostate
cancer from Holger Sultmann’s group (ICGC), as well as ependymoma, 22 glioblastoma multi-
forme (GBM) and 27 INFORM samples (INdividualized Therapy FOr Relapsed Malignancies in
Childhood) from Stefan Pfister’s group. In this thesis, all raw sequencing data were not generated
by myself.
2.2 NGS data analysis
2.2.1 Whole-genome sequencing analysis
25 GBM samples were prepared with paired-end DNA library and mate-pair (long-range paired-
end) DNA library, according to Illumina, Inc. v2 protocol. Deep sequencing (2×101bp) was
carried out with HiSeq-2000 instruments. 22 of 25 GBM samples with previously validated
fusions were selected for downstream analysis after successful deFuse run.
Structural rearrangements were identified using CREST [75] with default parameters in
paired-end sequenced samples. Furthermore, another tool DELLY [76] was used for detecting
structural rearrangements in mate-pair sequenced samples4.
2.2.2 Whole-exome sequencing analysis
Using an in-house pipeline from Roland Eils’ group (B080) in German Cancer Research Center
(DKFZ), sequencing reads were mapped on human genome reference assembly (hg19) with
Burrows-Wheeler Aligner (BWA-v0.6.2) [77].
SNVs were then called by SAMtools mpileup (version-0.1.19) and bcftools (version-0.1.19)
[78]. Furthermore, additional filtering steps were complemented in order to remove possible
artefacts as previously described [79]. Only somatic mutations (non-synonymous, stop-gain or
stop-loss) of high-confidence score (≥8) were chosen for downstream analysis. CNV calling was
based on the alignment results and a tool for copy number alteration discovery, VarScan-2 [80].
Small insertions and deletions (Indels) were identified with the tool Platypus [81]. In-house
pipelines from Roland Eils’ group (B080) were used for CNV and SNV/Indels analysis.
4The structural arrangement analysis was done by David T.W. Jones et al.. Results of structuralaberration were used to estimate a validation rate by comparing with predicted fusion genes in RNA-seq.

2.2. NGS DATA ANALYSIS 21
Figure 2.1: Example of quality control of an RNA-seq sample.
2.2.3 RNA sequencing analysis
• Quality control for RNA-seq data
Quality control was performed using RNA-SeQC [82] which can provide investigators with
alignment rate, duplication rate, strand-specific rate, GC bias, rRNA content, regions of alignment
(exon, intron and intragenic), and count of detectable transcripts. An example of strand-specific
RNA-seq from breast cancer sample is given in Figure 2.1.
• Gene expression
Paired-end RNA-seq data were aligned to human reference genome hg19 with decoy sequence
(Hs37D5) using STAR-2.3.0e [83]. Sequence reads mapped on each gene were counted by
HTSeq-count [84] with GENCODE annotation version 19. HTSeq-count was specifically designed
for gene-level count based on exon model in order to analyze differentially expressed genes.
Ambiguous reads mapped on different genes were not considered for downstream analysis.
Gene-level count was then quantified in terms of reads per kilobase per million mapped reads
(RPKM). Gene length was calculated based on total non-redundant cumulative exon length of a
gene with GENCODE annotation version 19.
• Integration of SNVs and RNA-seq data
For breast tumor samples where both WES and RNA-seq data were available, DNA variant
positions (somatic mutation positions) were annotated with RNA mapped reads (RNA BAM files).
RNA aligned reads containing the same variance (tumor allele) was required to call a candidate

22 CHAPTER 2. MATERIAL AND METHODS
Paired-end RNA-seq
STAR fusionMap soapFuse deFuse
Quality control (RNA-seqQC)
Gene-level count (HTSeq)
confFuse
BLAT validation
Experimental validationRPKM
Mutant allele expression
Figure 2.2: Overview of data flow in RNA-seq analysis. High-confidence fusion candidateswere selected by confFuse and then validated in silico by BLAT, followed by experimentalvalidation.
DNA tumor allele expressed. Expressed tumor alleles with less then ten RNA-sequencing reads
mapped on the position were not used in further analysis.
• Fusion gene detection and validation
Different tools (fusionMap [65], soapFuse [66] and deFuse [50]) were used to detect fusion
genes based on paired-end RNA-seq data. Versions of these tools were SOAPfuse-v1.26, deFuse-
0.6.1 and FusionMap-2015-03-31. Human genome reference hg19/GRCh37 was used in deFuse
and SOAPfuse. Genome reference Human.B37.3 and gene model Ensemble.R75 were used in
FusionMap. In addition, I developed a new scoring algorithm, confFuse, to reliably select high-
confidence fusion genes (details in next section). After validation in silico by BLAT, experimental
validation for fusion candidates was carried out using RT-PCR followed by Sanger sequencing5.
Primers for RT-PCR validation were designed using Primer3 [85].
• Pathway analysis
Gene lists in different pathways were based on KEGG (Kyoto Encyclopedia of Genes and
Genomes). For fusion genes identified by confFuse, pathway figures were generated in INGENU-
ITY pathway analysis.
• Overview of data flow
An overview of data flow in RNA-seq analysis is given in Figure 2.2.
5RT-PCR and Sanger sequencing done by Yonghe Wu and Achim Stefan for three breast tumor samples,and done by Yonghe Wu for three CLL samples .

2.3. “CONFFUSE” ALGORITHM 23
2.3 “confFuse” algorithm
A great number of fusion gene detection tools/pipelines (Chapter 1.1) have been developed to
interrogate the NGS data. Those tools/pipelines consist of three major parts: mapping based
on existing alignment tools such as Bowtie and BWA; individual methods for generating fusion
candidates; and filtering algorithms to remove false positive candidates. The sensitivity of fusion
gene detection mainly depends on the mapping step and the specificity depends on the methods
of generating fusion candidates and filtering methods.
Most of those tools/pipelines generate a large number of putative fusion transcripts even
after filtering, of which most may be false positives or of low biological interest (e.g. precursor
read-through transcripts), making it hard to prioritize candidates for experimental validation.
Additional filtering methods were developed based on individual datasets in order to select
reliable fusion candidates [52, 57]. Those individual filters, however, may have a bias towards
cancer or cell type-specific artefacts. Furthermore, stringent filtering can decrease sensitivity of
true fusion detection [71]. Therefore, I developed confFuse, a new scoring algorithm, which can
be applied on paired-end RNA-seq across tumor entities with both high true positive rate and
high detection accuracy.
ConfFuse was designed to rank fusion candidates based on deFuse output by assigning each
fusion candidate a confidence score, with the aim of markedly reducing the total number of
fusion candidates while retaining a high recall rate for true positives. It takes multiple features
into account, including some from the standard deFuse output and also newly generated features,
with each given a specific score weight. Those features are related to number and quality of reads
supporting a fusion, fusion structural features and sequence motif such as gene homology. The
final confidence score is the sum of the score weights of different single/combined features (initial
baseline score is 10). These parameter weightings were iteratively optimized in comparison to a
known validated fusion list, in order to achieve a balance between eliminating false positives
whilst retaining true fusions. Fusion candidates scoring between 8 and 10 are considered as
being high-confidence. The main features used to calculate the score are described below.
Split reads and spanning reads. Highly expressed fusions are easier to be detected by RNA-
seq technology, resulting in more sequence reads identified by fusion detection tools. Sequencing
depth is another important factor related to the number of sequence reads from fusions. High
fusion expression and/or high coverage sequencing would likely result in a high number of split
reads and spanning reads in fusion detection. For lowly expressed fusions with low sequencing
depth, it is hard to detect them and only a few reads could probably be confirmed to support
predicted fusions. Setting a number threshold to filter fusions may increase the specificity but
can reduce the sensitivity. The more uniquely mapped the spanning reads are, the stronger is
the evidence supporting fusions. Considering the complexity of some genome regions, multiple

24 CHAPTER 2. MATERIAL AND METHODS
Osteosarcoma (4)Glioblastoma multiforme (5)
Brain control (5)
Low−grade glioma (5)
Ewing sarcoma (5)
ATRT (6)
Medulloblastoma (7)
Pilocytic astrocytoma (7)
ETANTR (7)
Nephroblastoma (8)Pancreatic cancer (16)
Sarcoma (18)
Healthy blood (23)
CLL (27)
Breast tumor (28)
Figure 2.3: 171 paired-end RNA-seq samples from 15 different entities.
mapped reads (ambiguous alignments) can still be evidence supporting true fusions. However,
spanning reads mapped on repeat regions may result in false putative fusion. ConfFuse therefore
assigns a positive score to fusions with a high number of split and uniquely mapped spanning
reads (or a negative score otherwise).
Artefact list. Fusions identified in multiple tumor types are mostly considered to be of high
false positive rate or of low biological interest (i.e. read-through fusions). In total, 171 samples
from 15 different entities were used to generate an artefact list including fusions identified in
no less than three different entities (Figure 2.3). To increase the detection accuracy, previously
verified fusions were manually extracted from the blacklist. Some fusions in the blacklist, however,
could still be true and play an important role in tumor formation in different tumor types (false
negative fusions). ConfFuse assigns a negative score to fusions in the artefact list.
Occurrence of fusion genes. Fusion genes with different fusion transcripts (i.e. splice
variants) in the same samples may be of high true positive rate, especially those fusion transcripts
of high count of split reads and spanning reads. ConfFuse gives a positive score to these
candidates.
Read through. Two adjacent genes in the same orientation may give rise to an apparent
fusion due to read-through transcription and aberrant splicing rather than genome rearrangement.
Although some may acquire novel functions, the vast majority are expected to be false positives.
Fusions with read-through or alternative splicing are assigned a negative score.
Open reading frame. True oncogenic fusions typically preserve the open reading frame in
order to form a functional fusion protein. Fusions without an open reading frame are therefore
given a negative score.

2.3. “CONFFUSE” ALGORITHM 25
Breakpoint of fusions. Homology of breakpoint shows the number of nucleotides at the
fusion splice region that map equally well to first fusion partner or second fusion partner. The
location of fusion breakpoint play an critical role in demonstrating evidence supporting true
positive fusions. When the locations of fusion splicing are at exon boundaries, those are more
likely true positive fusions. It may be of low biological interest when a breakpoint is located
downstream of the 3′ fusion partner. Fusions with high breakpoint homology were given a
negative score by confFuse, as are fusions with breakpoint locations not at exon boundaries or
located downstream of the 3′ fusion partner.
The initial confidence score is 10 and the final confidence score is the sum of the score weights
of different features. The weights of single/combined features are shown in Table 2.1.
Table 2.1: The weights of single and combined features in confFuse scoring algorithm.
Features Score weight
Single features
Fusion in artefact list -6
Fusion with alternative splicing between adjacent genes -4
Fusion with read through -4
Fusion occurs in the same gene -4
Breakpoint locates in 3′ fusion partner downstream or UTR3p -4
Fusion splice not at exon boundaries -1.5
Breakpoint homology ≥ 10 -1
Without open reading frame -1
Max of proportion of the spanning reads in 5′ gene or 3′ gene that span a repeat region>0.9
-1
Fusion from adjacent genes -0.5
Fusion produced by intrachromosomal rearrangement -0.5
Max of proportion of the spanning reads in 5′ gene or 3′ gene that span a repeat regionbetween 0.8 and 0.9
-0.5
Combined features∗
If (5′ gene or 3′ gene with zero detected reads) and (occurrences ≥ 2) and (span count- num multi map + split count <30)
-2
If span count = num multi map -1.5
If num multi map / span count>0.8 and span count>5 -1
If (span count - num multi map<5) and (number of split reads <5) -1
If span count - num multi map<5 -0.5
If occurrences ≥ 2 and (max proportion <0.5) and non-read-through and non-alternative-splicing and (100 ≥ span count - num multi map + split count >40)and (num multi map / span count <0.2)
+0.5
Continued on next page
26 CHAPTER 2. MATERIAL AND METHODS
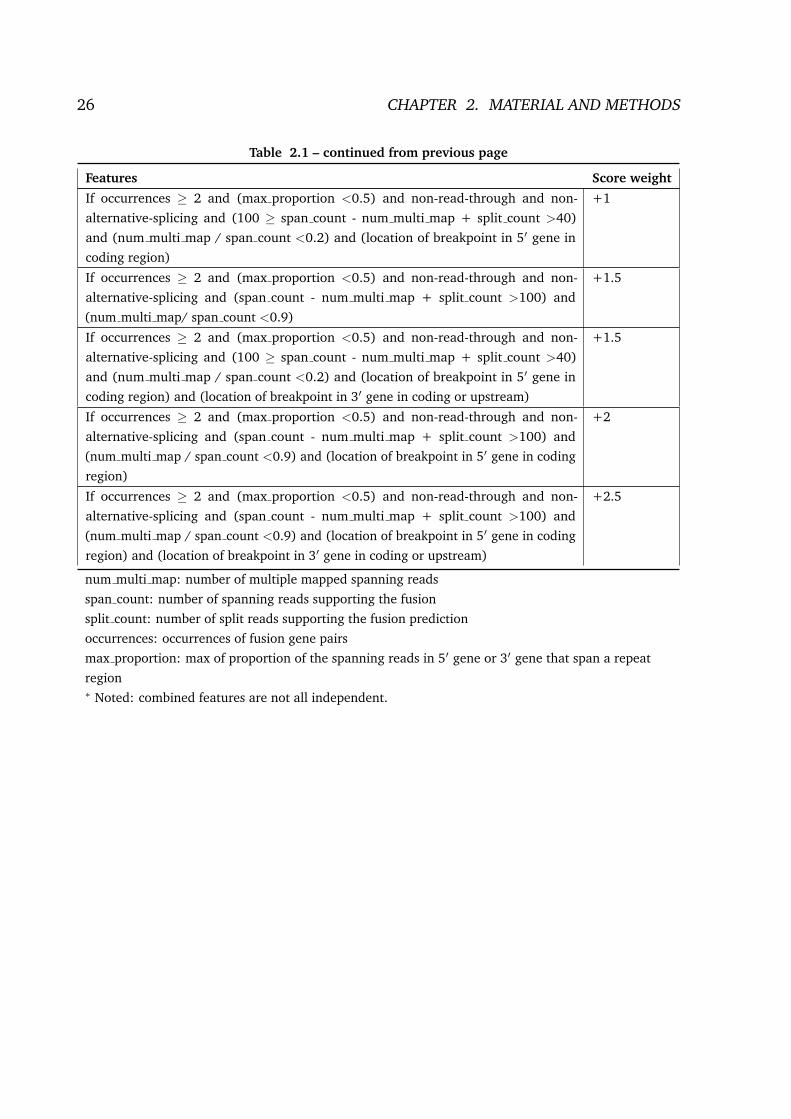
Table 2.1 – continued from previous page
Features Score weight
If occurrences ≥ 2 and (max proportion <0.5) and non-read-through and non-alternative-splicing and (100 ≥ span count - num multi map + split count >40)and (num multi map / span count <0.2) and (location of breakpoint in 5′ gene incoding region)
+1
If occurrences ≥ 2 and (max proportion <0.5) and non-read-through and non-alternative-splicing and (span count - num multi map + split count >100) and(num multi map/ span count <0.9)
+1.5
If occurrences ≥ 2 and (max proportion <0.5) and non-read-through and non-alternative-splicing and (100 ≥ span count - num multi map + split count >40)and (num multi map / span count <0.2) and (location of breakpoint in 5′ gene incoding region) and (location of breakpoint in 3′ gene in coding or upstream)
+1.5
If occurrences ≥ 2 and (max proportion <0.5) and non-read-through and non-alternative-splicing and (span count - num multi map + split count >100) and(num multi map / span count <0.9) and (location of breakpoint in 5′ gene in codingregion)
+2
If occurrences ≥ 2 and (max proportion <0.5) and non-read-through and non-alternative-splicing and (span count - num multi map + split count >100) and(num multi map / span count <0.9) and (location of breakpoint in 5′ gene in codingregion) and (location of breakpoint in 3′ gene in coding or upstream)
+2.5
num multi map: number of multiple mapped spanning readsspan count: number of spanning reads supporting the fusionsplit count: number of split reads supporting the fusion predictionoccurrences: occurrences of fusion gene pairsmax proportion: max of proportion of the spanning reads in 5′ gene or 3′ gene that span a repeatregion∗ Noted: combined features are not all independent.

Chapter 3
Results
3.1 CNVs and SNVs/Indels in breast cancer
3.1.1 CNVs in breast cancer
Comparison of 44 primary and 50 refractory breast tumors shows different distributions of
copy number variance (Figure 3.1). Refractory tumors harbor much more amplification in
chromosome 8, where 8q24 has been reported as a risk locus which showed tissue-specific
long-range interaction with MYC in prostate, breast and colon cancer [86].
Cyclin-dependent kinase inhibitor 2A (CDKN2A) is located in the deletion region in chromo-
some 9, which were identified as focal CNV (deletion) in three breast tumors (3/50, 6%) and
one primary tumor. CDKN2A is a tumor suppressor gene and plays an important role in cell cycle,
which is critical to cancer development. Deletion of CDKN2A associates with phenotype and
genotype in childhood acute lymphoblastic leukemia (ALL) [87]. Loss of CDKN2A could result in
oestrogen-independent cell cycle progression [88].
Runt-related transcription factor 3 (RUNX3) is located in the deletion region in chromosome 1,
which was identified in two primary (2/44) and four refractory (4/50) breast tumors. It has been
reported that RUNX3 was frequently deleted in various tumors, including colon, neuroblastoma
and breast cancer [89].
Estrogen-related receptor gamma (ESRRG) located in chromosome 1 is important in control
of cellular metabolism in breast cancer [90]. Three refractory (3/50) and one primary (1/44)
tumor harbor ESRRG amplification.
27

28 CHAPTER 3. RESULTS
Figure 3.1: Copy number variance in primary and refractory breast tumors. The mostobviously different regions (shown in black box) are located on chromosome 1, 8, 9 and X.
050
010
0015
0020
0025
00
Number of SNV
020
040
060
080
010
00
A>T,G>C A>G,T>C A>T,T>A C>A,G>T C>G,G>C C>T,G>A
Refractory tumors (n=50)Primary tumors (n=46)
Base substitution
Figure 3.2: Distribution of base substitutions in breast cancer. Comparing with primarytumors, refractory tumors have similar distribution of base substitution but higher number ofsomatic mutations.
3.1.2 Somatic mutations in breast cancer
In total, 1562 and 2975 somatic SNVs or small Indels were identified in 46 primary breast
tumors and 50 refractory breast tumors, respectively (Figure 3.2). These two groups show similar
distribution of base substitution. Higher number of somatic mutation, however, is observed in
refractory tumors (Figure 3.2).
A gene list with 731 genes was generated based on different KEGG pathways (ErbB, estrogen,
MAPK, PI3K-AKT-mTor and Ras signalling pathway), tamoxifen-related genes (KEGG) and 32
significantly mutated genes taken from the literature [14]. There is not much different between
primary and refractory tumors in terms of the number of mutations (Figure 3.3 and Figure 3.4).
145 and 112 somatically mutated genes from the 731 genes were identified in refractory and
primary tumors, respectively. PIK3CA and TP53 are the top two frequently mutated genes (15
and 8 in 46 primary tumors, 15 and 13 in 50 refractory tumors). The top ten recurrently mutated
genes in both primary and refractory tumors have been previously reported [91].
Calcium channel, voltage-dependent, alpha (CACNA) 14 subunits (CACNA1A-S and
CACNA2D1-4) are involved in MAPK signalling pathway. It has been reported that “methylation-
dependent transcriptional silencing of CACNA2D3 may contribute to the metastatic phenotype of

3.1. CNVS AND SNVS/INDELS IN BREAST CANCER 29
33%17%13%9%9%9%7%7%7%7%4%4%4%4%4%4%4%4%2%2%2%2%2%2%2%2%2%2%2%2%2%2%2%2%2%2%2%2%2%2%2%2%2%2%2%2%2%2%2%2%2%2%2%2%2%2%2%2%2%2%2%2%2%2%2%2%2%2%2%2%2%2%2%2%2%2%2%2%2%2%2%2%2%2%2%2%2%2%2%2%2%2%2%2%2%2%2%2%2%2%2%2%2%2%2%2%2%2%2%2%2%2%
Important 112/731 genes in 46 primary breast tumors
PIK3CATP53GATA3ARID1AMLL3RUNX1AKT1CBFBMAP3K1TBX3CDH1ERBB2KRASLAMA5LAMC3MAP2K4NCOR1PIK3R1ADCY4ADCY6ARAFARRB1CACNA1ACASP8CDKN1BCOL11A1COL24A1COL4A2COL4A4COL6A3COL6A5COL6A6COMPCREB3CUL4BCYP2C8DUSP16DUSP3DUSP8ECSITERBB4ETS1EXOC2FGF20FGF21FLNAFLNBFLT1FN1FOXA1FOXO3GAB2GABBR1GNA12GNG13GRIN2AHSP90B1HSPA2IGF1RIL2RAIL6IL7RITGA4ITGA6ITGA9ITGB4JAK2KCNJ9KSR2LAMA3LAMB1LAMB3LAMC1LPAR2LPAR4LPAR5MAP3K11MAPK13MAPK8IP2MAPTMED23METNF1NFKB2NR4A1NRG3PHLPP2PIK3R5PKN3PLA1APLCE1PLD1PPP2R2BPPP2R2CPPP2R5DPTENRAC1RAPGEF2RASA2RASGRP1RASGRP2RB1RELNRHOASF3B1STRADASYNGAP1TBL1XR1TCL1BTHBS3TNRTNXB
02468
101214
0 2 4 6 810 14
Figure 3.3: SNVs and Indels in primary breast tumors across different pathways, includingErbB, estrogen, MAPK, mTor, Ras, PI3K-AKT, as well as tamoxifen-related genes and 32reported significantly mutated genes. In total, there are 731 selected genes, 112 of whichharbor mutations (SNVs or Indels).

30 CHAPTER 3. RESULTS
30%26%16%10%10%8%8%8%6%6%6%6%6%6%4%4%4%4%4%4%4%4%4%4%4%4%4%4%4%4%4%4%4%4%2%2%2%2%2%2%2%2%2%2%2%2%2%2%2%2%2%2%2%2%2%2%2%2%2%2%2%2%2%2%2%2%2%2%2%2%2%2%2%2%2%2%2%2%2%2%2%2%2%2%2%2%2%2%2%2%2%2%2%2%2%2%2%2%2%2%2%2%2%2%2%2%2%2%2%2%2%2%2%2%2%2%2%2%2%2%2%2%2%2%2%2%2%2%2%2%2%2%2%2%2%2%2%2%2%2%2%2%2%2%2%
Important 145/731 genes in 50 refractory breast tumors
PIK3CATP53MAP3K1ARID1APTENAKT1CDH1TBX3CACNA1BERBB2ESR1ITGA2MLLNCOR1CACNA1CCACNA1ICACNA2D3COL6A3COL6A5FLNBFLNCGATA3ITGB7LAMA5LAMB1MLLT4NRG2PHLPP1PIK3R1PRKCGSHC4SPENTHBS1THBS4ADCY5ADCY8ANGPT2ATF6BBRAFCACNA1ACACNA1ECACNA1FCACNA1HCACNA1SCACNG3CAMK2ACBFBCDC37CDC42CDK4CHRM2COL27A1COL2A1COL3A1COL4A3COL6A1COL6A6CREB3CSF1CTCFCYP3A5DUSP1DUSP10ECSITEGFRERBB3ESR2FGF10FGF18FGF20FGFR1FLNAFOXA1GABBR1GNB2GNGT2GRIN2AGYS1HRASHSP90AA1IGF1RIL7RITGA1ITGA5ITGB3ITGB5ITPR1ITPR2JAK2KCNJ3KITLGLAMA1LAMA2LAMA4LAMC3LPAR5MAP2K1MAP3K2MAP3K5MAP3K8MAPKAPK5MECOMMED23MEF2CMETMLL3MOSNCK1NOS3NRG1PAK2PAK7PDGFCPDGFRBPHLPP2PIK3CBPIK3R2PKN1PLCB1PLCB2PLCB3PLCB4PLCG1PPP2R2APPP5CPTK2PTPN7RAF1RALBP1RASAL1RASGRF1RASSF5RB1RPS6KB2RRAGBRUNX1STAG2STAT5BSULT1A1SYNGAP1TEKTNFRSF1ATNRTNXBVEGFA
05
101520253035
0 2 4 6 810 14
Figure 3.4: SNVs and Indels in refractory breast tumors across different pathways, includingErbB, estrogen, MAPK, mTor, Ras, PI3K-AKT, as well as tamoxifen-related genes and 32reported significantly mutated genes. In total, there are 731 selected genes, 145 of whichharbor mutations (SNVs or Indels).

3.1. CNVS AND SNVS/INDELS IN BREAST CANCER 31
breast cancer” [92]. One CACNA1A mutation was identified in one primary tumor (∼2%, 1/46)
(Figure 3.3) and ten different CACNA subunit mutations were detected in 12 refractory tumors
(24%, 12/50) (Table 3.1), including CACNA2D3 mutation in two samples (Figure 3.4).
Table 3.1: Mutations of calcium channel, voltage-dependent, alpha subunits (CACNA).
Gene Sample ID Chromosome Position Reference Alternative
CACNA1A 615a439 19 13345795 A CCACNA1A IUCQ T1 19 13563823 T GCACNA1B RZBM M1 9 140907686 G ACACNA1B T2VO M1 9 140952667 A TCACNA1B YA4W M1 9 140807677 G TCACNA1C 007M M1 12 2702384 G CCACNA1C 7FNO M1 12 2760896 A CCACNA1E E65C M1 1 181721309 C GCACNA1F E65C M1 X 49068406 C TCACNA1F E65C M1 X 49081314 C GCACNA1H E65C M1 16 1265311 G ACACNA1I 35XC M1 22 40082285 G ACACNA1I F7FD M1 22 40069065 G ACACNA1S NF9D M1 1 201058422 G TCACNA2D3 e64126c 3 54798274 G ACACNA2D3 4R5V M1 3 54798253 A C
Note: “ T1” indicates primary tumors and the remaining are refractory tumor samples.
Taking 100 genes from estrogen signalling pathway into account, two groups of refractory-
specific somatic mutations have been identified, including estrogen receptor (ESR1 and ESR2) and
1-phosphatidylinositol-4,5-bisphosphate phosphodiesterase beta (p.Q244H in PLCB1, p.D981H in
PLCB2, p.D32E in PLCB3 and p.D933H in PLCB4) (Figure 3.5). It indicates that patients probably
acquired somatic mutations during treatment. ESR1 somatic mutations associate with hormone-
resistant breast cancer [7]. A novel somatic mutation1 S118P, located in ESR1 activation function
1 (AF1) domain, has been identified in the refractory sample WL6X M1. In addition, H459Q
somatic mutation in estrogen-related receptor gamma (ESRRG) was detected.
3.1.3 Expression of mutant allele in breast cancer
Tumor DNA allele frequencies in both primary and refractory tumors are mostly less than
0.5, which may indicate low tumor content in the breast tumor samples. Sequence coverage
is approximately 100× and the correlation coefficient between tumor DNA alleles and RNA
alleles are 0.58 and 0.51 in primary and refractory tumors, respectively. A little higher disperse
distribution is observed in refractory tumors than in primary ones (0.58<0.51) (Figure 3.6).
1It has been confirmed that ESR1 S118P is a somatic mutation instead of a germline mutation in sampleWL6X M1.

32 CHAPTER 3. RESULTS
33%
7%
4%
4%
2%
2%
2%
2%
2%
2%
2%
2%
12/100 genes in 50 primary tumors
PIK3CA
AKT1
KRAS
PIK3R1
HSP90B1
HSPA2
ADCY4
ADCY6
CREB3
PIK3R5
GABBR1
KCNJ9
00.5
11.5
22.5
3
0 2 4 6 810 14
30%
8%
6%
4%
4%
2%
2%
2%
2%
2%
2%
2%
2%
2%
2%
2%
2%
2%
2%
2%
2%
2%
2%
2%
2%
2%
26/100 genes in 50 refractory tumors
PIK3CA
AKT1
ESR1
SHC4
PIK3R1
ESR2
HSP90AA1
ADCY5
ADCY8
CREB3
ATF6B
EGFR
HRAS
RAF1
MAP2K1
PIK3CB
PIK3R2
GABBR1
KCNJ3
PLCB1
PLCB2
PLCB3
PLCB4
ITPR1
ITPR2
NOS3
012345
0 2 4 6 810 14
Figure 3.5: SNVs and Indels in the list of genes (n=100) from estrogen pathway in breastprimary and refractory tumors. Mutations of two gene families ESR and PLCB were onlydetected in refractory samples, indicating they may be acquired mutations.
3.2 ConfFuse
As mentioned in Chapter 2.3, most fusion gene detection tools generate a large number of
false positive fusion transcripts. Therefore, I developed an additional downstream filtering
algorithm, confFuse, to address this problem. In this section, the performance of confFuse and
the improvement in fusion gene detection are given in detail.
3.2.1 Generation of artefact list
Fusions identified in multiple samples from different tumor types are mostly considered to be
of high false positive rate. In total, we used 171 paired-end RNA-seq samples from 15 different
entities to generate the artefact list. When considering fusion candidates identified by deFuse-
v0.6.1 in no less than three entities (recurrence >3), 2,190 fusions were selected for the artefact
list (Figure 3.7). For candidates identified in >4 and >5 entities, there are 1,409 and 995 fusions
in the artefact list, respectively. In this study, a threshold of three was chosen for the final artefact
list. Of note, a small number of additional putative artefacts are still identified with each increase
in the number of different tumor types, suggesting that accuracy could be further improved by
increasing the sample size used to generate the artefact list.
In total, 5,881/9,169 (64%) putative fusion transcripts identified in 96 published samples

3.2. CONFFUSE 33
0.0 0.2 0.4 0.6 0.8 1.0
0.0
0.5
1.0
1.5
2.0
2.5
3.0
Primary tumors (n=46)
Tumor Variant Allele Frequencies in DNA
Var
ianc
e D
ensi
ty
0.0 0.2 0.4 0.6 0.8 1.0
0.0
0.5
1.0
1.5
2.0
2.5
3.0
3.5
Refractory tumors (n=50)
Tumor Variant Allele Frequencies in DNA
0.0 0.2 0.4 0.6 0.8 1.0
Primary tumors (n=46)
1010
010
00
Tumor Variant Allele Frequencies in DNA
Seq
uenc
e C
over
age
0.0 0.2 0.4 0.6 0.8 1.0
Refractory tumors (n=50)10
100
1000
Tumor Variant Allele Frequencies in DNA
Seq
uenc
e C
over
age
0.0 0.2 0.4 0.6 0.8 1.0
0.0
0.2
0.4
0.6
0.8
1.0
Primary tumors (n=46)
●
●r=0.58
Tumor Variant Allele Frequencies in DNA
VA
F in
RN
A
0.0 0.2 0.4 0.6 0.8 1.0
0.0
0.2
0.4
0.6
0.8
1.0
Refractory tumors (n=50)
VA
F in
RN
A
r=0.51
●
PIK3CATP53AKT1KRAS
Tumor Variant Allele Frequencies in DNA
VA
F in
RN
A
Figure 3.6: Tumor DNA allele variance and tumor allele expression in primary and refractorybreast tumors. Read coverage at RNA level is no less than 10. Higher disperse distribution isobserved in refractory tumors (bottom).
34 CHAPTER 3. RESULTSN
umbe
r of
rec
urre
nt fu
sion
s
010
0020
0030
0040
0050
00
1 2 3 4 5 6 7 8 9 10 11 12 13 14 15
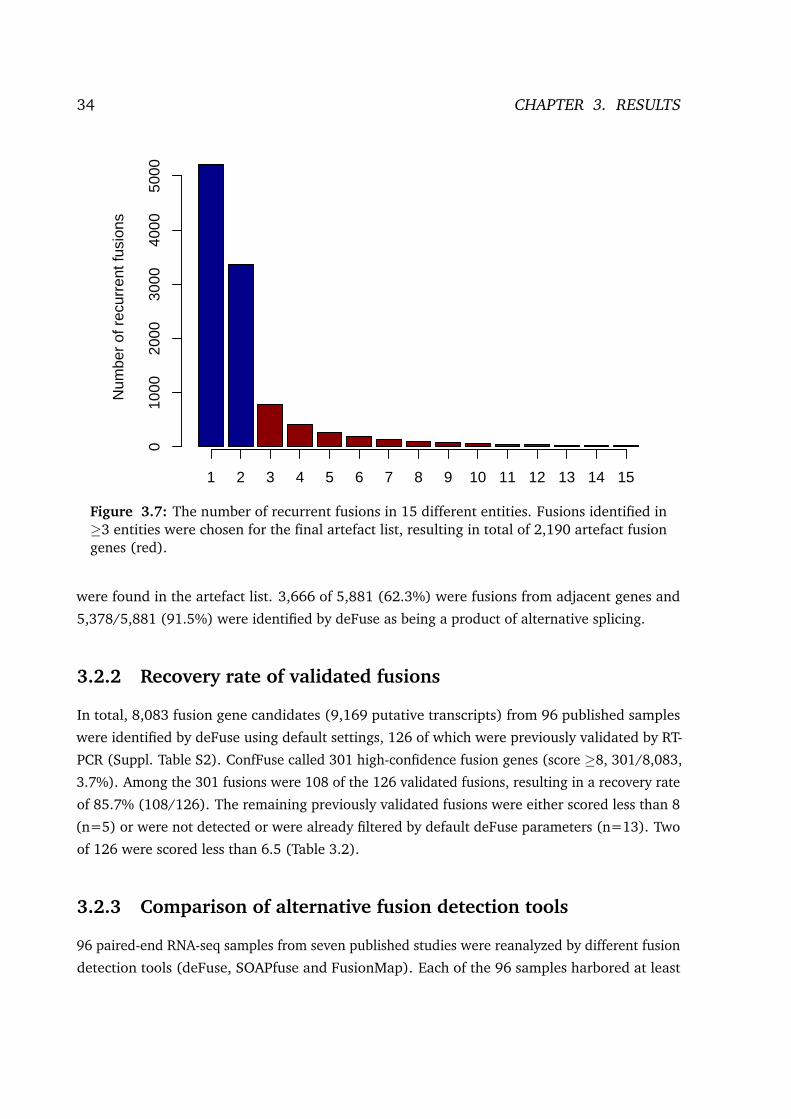
Figure 3.7: The number of recurrent fusions in 15 different entities. Fusions identified in≥3 entities were chosen for the final artefact list, resulting in total of 2,190 artefact fusiongenes (red).
were found in the artefact list. 3,666 of 5,881 (62.3%) were fusions from adjacent genes and
5,378/5,881 (91.5%) were identified by deFuse as being a product of alternative splicing.
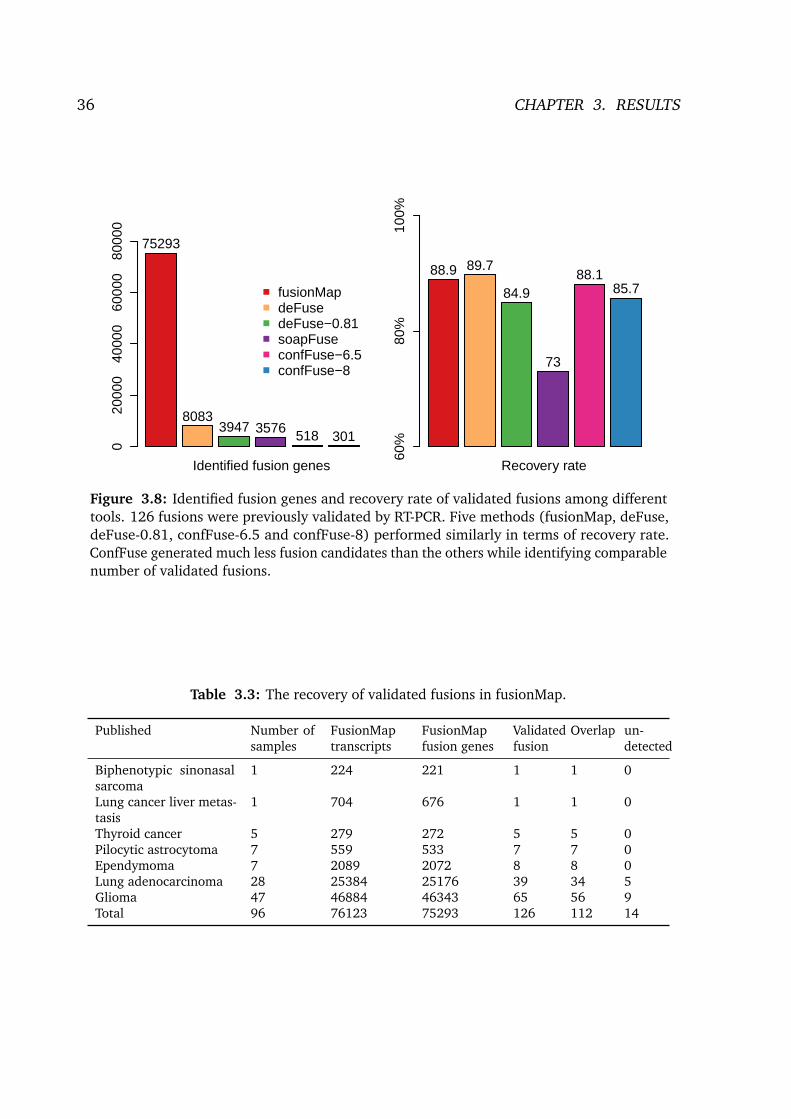
3.2.2 Recovery rate of validated fusions
In total, 8,083 fusion gene candidates (9,169 putative transcripts) from 96 published samples
were identified by deFuse using default settings, 126 of which were previously validated by RT-
PCR (Suppl. Table S2). ConfFuse called 301 high-confidence fusion genes (score ≥8, 301/8,083,
3.7%). Among the 301 fusions were 108 of the 126 validated fusions, resulting in a recovery rate
of 85.7% (108/126). The remaining previously validated fusions were either scored less than 8
(n=5) or were not detected or were already filtered by default deFuse parameters (n=13). Two
of 126 were scored less than 6.5 (Table 3.2).
3.2.3 Comparison of alternative fusion detection tools
96 paired-end RNA-seq samples from seven published studies were reanalyzed by different fusion
detection tools (deFuse, SOAPfuse and FusionMap). Each of the 96 samples harbored at least

3.2. CONFFUSE 35
Table 3.2: The recovery of validated fusions for deFuse, confFuse-6.5 and confFuse-8.
Published Numberofsamples
deFuse fu-sion tran-scripts
deFusefusiongenes
confFusescore≥8
Validatedfusions
Overlap confFusescore<8
confFusescore<6.5
Un-detected
Lung cancer livermetastasis [93]
1 237 214 5 1 1 0 0 0
Biphenotypicsinonasal sarcoma[94]
1 315 274 2 1 1 0 0 0
Pilocytic astrocytoma[95]
7 571 514 9 8 8 0 0 0
Thyroid cancer [54] 5 754 651 4 5 4 0 0 1Ependymoma [96] 7 1165 1019 7 7 6 0 0 1Lung adenocarci-noma [97]
28 2915 2569 73 39 28 2 1 9
Glioma [55] 47 3212 2842 201 65 60 3 1 2Total 96 9169 8083 301 126 108 5 2 13
There are 126 previously validated fusions by RT-PCR. 301 high confidence candidates (score >8) were generated byconfFuse. The recovery of confFuse and deFuse are 108/126 and 113/126, respectively. Fusion gene pairs with differentbreakpoints (different fusion transcripts) were counted only once.
one previously validated fusion. These samples were sequenced with different read lengths with
a range from 51bp to 101bp (Suppl. Table S1). The number of reads in those samples ranges
from ∼15 million to ∼206 million (Suppl. Figure S1).
While comparing the recovery rate of 126 previously RT-PCR validated fusions among different
fusion gene calling methods (Suppl. Table S2), we used default settings in all tools to avoid
parameter bias. DeFuse reports all fusion transcripts with probability ≥0.5 by default in the result
file (results.filtered.tsv). Based on the original deFuse paper [50], deFuse probability 0.81 was
additionally chosen as a threshold to examine recovery rate. Fusion genes with different putative
fusion transcripts were counted only once and the order of 5′ and 3′ fusion partners was ignored
to simplify the comparison. Score thresholds 6.5 and 8 were used in confFuse for medium to
high (medium+high) and high confidence calls, respectively.
Comparing with other tools, fusionMap, deFuse, deFuse-0.81 (deFuse with probability ≥0.81),
soapFuse, confFuse-6.5 (score ≥6.5) and confFuse-8 (high-confidence candidates scored ≥8)
showed recovery rates of 88.9%, 89.7%, 84.9%, 73.0%, 88.1% and 85.7% respectively for the
126 validated fusions (Figure 3.8; Table 3.3 and Table 3.4), indicating confFuse can dramatically
reduce the number of candidates from 8,083 to 301 without compromising detection accuracy
related to other available tools. In addition, the correlation between confFuse score and recovery
rate in the 96 published samples is given in Figure 3.9.
36 CHAPTER 3. RESULTS0
2000
040
000
6000
080
000
Identified fusion genes
75293
80833947 3576 518 301
fusionMapdeFusedeFuse−0.81soapFuseconfFuse−6.5confFuse−8
60%
80%
100%
Recovery rate
88.9 89.7
84.9
73
88.185.7
Figure 3.8: Identified fusion genes and recovery rate of validated fusions among differenttools. 126 fusions were previously validated by RT-PCR. Five methods (fusionMap, deFuse,deFuse-0.81, confFuse-6.5 and confFuse-8) performed similarly in terms of recovery rate.ConfFuse generated much less fusion candidates than the others while identifying comparablenumber of validated fusions.
Table 3.3: The recovery of validated fusions in fusionMap.
Published Number ofsamples
FusionMaptranscripts
FusionMapfusion genes
Validatedfusion
Overlap un-detected
Biphenotypic sinonasalsarcoma
1 224 221 1 1 0
Lung cancer liver metas-tasis
1 704 676 1 1 0
Thyroid cancer 5 279 272 5 5 0Pilocytic astrocytoma 7 559 533 7 7 0Ependymoma 7 2089 2072 8 8 0Lung adenocarcinoma 28 25384 25176 39 34 5Glioma 47 46884 46343 65 56 9Total 96 76123 75293 126 112 14

3.2. CONFFUSE 37
Table 3.4: The recovery of validated fusions in soapFuse.
Published Number ofsamples
soapFusetranscripts
soapFusefusion genes
Validatedfusion
Overlap un-detected
Lung cancer liver metas-tasis
1 61 56 1 1 0
Biphenotypic sinonasalsarcoma
1 223 183 1 1 0
Thyroid cancer 5 319 291 5 4 1Ependymoma 7 377 319 8 7 1Pilocytic astrocytoma 7 477 330 7 6 1Lung adenocarcinoma 28 1259 1101 39 22 17Glioma 47 1439 1296 65 51 14Total 96 4155 3576 126 92 34
2 4 6 8 10
0.3
0.4
0.5
0.6
0.7
0.8
0.9
Rec
over
y ra
te
● ● ● ● ● ● ● ● ● ● ●●
●
●
●
●
●
●0.857
confFuse score2 4 6 8 10
020
040
060
080
010
0012
00
Num
ber
of fu
sion
gen
es id
entif
ied
by d
eFus
e ●
●
●
●
●
●
●
●
●
●●
●
●
●
●
●
●
●301
confFuse score
Figure 3.9: ConfFuse score and recovery rate in 96 published samples. In total, 126 fusiongenes were validated, 113 of which were identified by deFuse. ConfFuse detected 108 of126 known validated fusions with score threshold 8. The right figure shows the correlationbetween confFuse score and the number fusions identified by deFuse.

38 CHAPTER 3. RESULTS
3.2.4 Comparison of deFuse probability and confFuse confidence
score
The distribution of deFuse probability was compared with confFuse confidence score for all
putative fusion transcripts in 96 published samples (Figure 3.10). Notably, there are many
putative transcripts with a high deFuse probability that get a low score (∼ -8) with confFuse.
None of these were in the list of 126 known validated fusions.
3.2.5 Validation of confFuse predicted candidates
To evaluate the accuracy of high-confidence candidate predictions (score ≥8), three primary
breast tumor samples were sequenced to generate paired-end RNA-seq data. The transcript
variant with the highest score was chosen for validation for fusion genes with multiple putative
fusion transcripts. In total, deFuse predicted 1,026 fusion genes in the three samples, 18 of which
were scored ≥8 by confFuse. All 18 high-confidence candidates were validated with RT-PCR
followed by Sanger sequencing, resulting in a 100% positive validation rate (Suppl. Table S3). A
plot showing the 18 high-confidence validated fusions is given in Figure 3.11.
In addition, some candidates scoring less than eight were randomly chosen for validation in
order to get a more comprehensive picture of confFuse confidence scores. Based on the validation
results in three primary breast tumor samples (∼69%, 9/13 fusions validated, 6.5 ≤ score ≤ 7.5),
fusion candidates scored between 6.5 and 7.5 were considered as medium-confidence fusions.
Furthermore, 30% low-confidence candidates (3/10, score ≤6) were experimentally validated.
The validation results are shown in supplementary Table S3 .
To the best of my knowledge, the 18 novel fusion genes haven’t been validated before.
Interestingly, one of them (QKI:PACRG) was predicted in three of 1,019 breast cancer samples
from TCGA [72], indicating that QKI:PACRG may be a novel recurrent fusion in breast cancer.
QKI has different isoforms and can suppress cell proliferation, regulate the NUMB gene to
prevent inappropriate activation of the Notch signaling pathway in lung cancer [98]. PACRG is
an evolutionarily conserved protein and plays an important role in outer-doublet microtubule
morphogenesis [99]. The likely biological consequence of this fusion, however, remains unclear.
3.2.6 ConfFuse performance in data sets with verified fusion genes
In the 22 pediatric glioblastoma multiforme from ICGC project, 50 fusions were previously
validated by RT-PCR, 46 of which are in the list of 242 high-confidence fusions. Comparing with

3.2. CONFFUSE 39
−15 −10 −5 0 5 10
0.5
0.6
0.7
0.8
0.9
Confidence score
deF
use
prob
ility
Num
ber
of p
utat
ive
tran
scrip
ts
020
040
060
080
0
Number of putative transcripts
0 100 200 300 400 500
Figure 3.10: Comparison of probability predicted by deFuse and confidence score byconfFuse in 96 published RNA-seq samples. High density is of red color and low density is ofblue color.

40 CHAPTER 3. RESULTS
SF
3A3
MA
CF
1
FASTKD1
CREB1
TBC1D9RP11−203B7.2
PACRG
QKI
PTE
N
PLC
E1−
AS
1
PPFI
A1
FAM
168A
MYO
7A
NDUFC2
MPZL
2
CD3D
DDX11ANO6
MLEC
ENOX1RB1
EML1WDR25
CDH3CDH1
ACSF3
TOM1L2
ACACA
BECN1
CDR2L
GRB2
EXOC7
SEPT9
GR
AP
2
GR
IA3
10MB 50MB 100MB 150MB
200MB
2
0MB50MB
100MB150M
B
200MB
3
0MB
50MB
100MB
150MB
40M
B50M
B100M
B
150M
B
5
0MB
50M
B
100M
B
150M
B
6
0MB
50M
B
100M
B
150M
B
70MB
50MB
100MB
150MB
8 0MB
50MB
100MB90MB50MB100MB
100MB
50MB
100MB
11
0MB
50MB
100MB
12
0MB
50MB
100MB
130M
B
50MB
100MB
140M
B
50MB
100MB
150M
B50M
B
100M
B
160M
B50
MB
17
0MB
50M
B
18
0MB
50M
B
19
0MB
50M
B
20
0MB
50MB 210MB
220MB50MB
X0MB
50MB100MB 150MB
Y0MB 50MB
Figure 3.11: 18 high-confidence fusions validated by RT-PCR followed by Sanger sequencingin three primary breast tumor samples (AC72 red, 8HNA black and DR8V blue).

3.2. CONFFUSE 41
020
0040
0060
0080
00
Identified fusion genes
6018
3446
2096
242
deFusefusionMapsoapFuseconfFuse−8TopHat−Fusion
80%
90%
100%
Recovery rate
96
90 9092 92
Figure 3.12: Comparison of different fusion detection tools in 22 GBM. All methodsperform well with ≥90% recovery rate. ConfFuse dramatically reduces the number of fusioncandidates from 6,018 to 242. The number of fusions detected by TopHat-Fusion is notavailable.
other three tools (Tophat-Fusion2, soapFuse and fusionMap), confFuse achieved a recovery rate
of 92% which is similar to the other tools (Figure 3.12).
242 of 6,018 fusion genes were scored ≥8 as being high-confidence by confFuse. Fusion
candidates3 based on whole genome sequencing and mate-paired sequencing were identified by
structural variance detection tools CREST and DELLY. 150 of 242 high-confidence candidates have
evidence either from previously validated fusions or DNA-seq support (whole genome sequencing
and mate-paired sequencing), resulting in a validated rate of ∼62% (150/242) (Figure 3.13).
In the 27 RNA-seq samples from the INFORM project, 94 of 8,549 fusion genes were scored
≥8, 25 of which were previously validated by RT-PCR4 (Table 3.5). Another two validated fusions
were scored as 5.5 and 7. Recurrent fusions EWSR1:FLI1, EWSR1:ERG and PAX3:FOXO1 were
identified by confFuse.
2Fusion genes identified by TopHat-Fusion were provided from David T.W. Jones. The total number offusions detected by TopHat-Fusion is not available.
3Fusion candidates based on WGS and mate-paired sequencing are from David T.W. Jones.4Independent validation was done by Stefan Pfister’s group.

42 CHAPTER 3. RESULTS
Table 3.5: High-confidence fusion genes in 27 INFORM samples (n=94),25 of which were previously validated by RT-PCR (boldface).
Gene1 Gene2 Sample ID Gene1 Gene2 Sample ID
ACTG1 ACTB I007 002 PAX3 FOXO1 AC 00ACAMKMT ALK TU 00A PAX3 FOXO1 BE 00BCARS ALK ES 00A PAX3 FOXO1 ST 00EDCX CAPN6 BE 00B PAX3 FOXO1 HL 00BDNAH2 C17orf85 HD 00M PAX3 FOXO1 I019 001DNAJC21 ARL15 I023 001 PDGFRA KIT I027 003DRAXIN ATN1 FR 00C POLR2B HOPX I027 003EWSR1 ERG FR 00C PRKAR1A CNTROB HD 00MEWSR1 ERG ST 00D PTGES3 MYT1L HL 00BFAM131B BRAF BE 00F PTPRZ1 AC006159.3 HD 00MFAM228B CD81 ES 00A PTPRZ1 MET HD 00MFKBP1A FAM71E1 I023 001 PUM1 CEP95 ST 00EFLI1 EWSR1 MS 00B QRICH2 MRC2 HD 00MFLI1 EWSR1 MS 00C RAB3GAP1 HADHA ES 00AFLI1 EWSR1 MS 00G RFC2 CLIP2 HD 00MFLI1 EWSR1 GO 00A RNF213 ABR HD 00MFLI1 EWSR1 HD 00P RP11-3L8.3 C9orf72 I023 001FLI1 EWSR1 I041 001 RP11-440L14.1 MYO7A ST 00AFLI1 EWSR1 I042 001 SLC22A23 BPHL I023 001FLI1 EWSR1 LZ 00A SLC35D2 PGM5 I023 001GMEB1 EXT2 I015 001 SMC5 RP11-289F5.1 I023 001GOLGB1 EYA1 I015 001 SMPDL3B CNBP ST 00EGRAMD1B CELF2 I007 002 SOCS5 KIF1A I015 001GUSBP2 GUSBP11 I007 002 SPAG7 FAM117A HD 00MHBD HBB I074 001 SPATA8 DYRK1A I023 001HLA-G HLA-C I019 001 SPTBN4 CA8 I023 001HLA-L HLA-B HL 00B STK35 SAMD4B I023 001HLA-L HLA-B I027 003 STON2 CD82 I015 001HLA-L HLA-B I074 001 STXBP1 NTMT1 I023 001INPP5D ABL1 I074 001 SUGT1 NOL6 ST 00EIVNS1ABP IL8 I019 001 SUV420H1 NUMA1 ST 00AKIAA1211 HEATR7B2 HD 00M SYNPO2L FAM177A1 TU 00AKIF27 CNTNAP3B I023 001 TANC2 ITGAE HD 00MLILRA6 AC008984.2 I019 001 TBC1D15 FAM109A MS 00CLNX1 CEP135 I027 003 TCERG1L GPR123 I023 001LNX1 KDR I027 003 TMEM165 KDR I027 003MFF ARIH2 LZ 00A TSFM SPRYD4 HL 00BMLLT10 MLL I007 002 UNKL IFT140 ST 00DNAA10 HAUS7 I019 001 USP46 KCNK17 I023 001NASP LUZP1 TU 00A USP46 NMU I027 003NFX1 HMCN1 ST 00D USP8 MLL ST 00ANOTCH2 DIO1 I015 001 VPS35 HSBP1 TU 00ANOTCH2 LRRC42 I015 001 VSTM1 LSM14A I023 001NTRK2 GKAP1 I023 001 WT1 EWSR1 AC 00BOTOGL ATP2B1 TU 00A WWC2 PDLIM3 I023 001OTUB1 NAA40 BE 00B ZNF202 FCHSD2 I007 002PAMR1 ABTB2 I023 001 ZNF577 SLC8A2 I023 001
Note: The order of fusion partner 5′ and 3′ is ignored to simplify comparison. Another two validatedfusions CIC:DUX4L7 and RELA:C11orf95 were scored as 5.5 and 7 by confFuse, respectively.

3.3. FUSION GENES IN DIFFERENT TUMOR ENTITIES 43
Figure 3.13: Validated fusions in 22 GBM based on known fusions and DNA-seq supportingevidence. 150 of 242 confFuse candidates are reconfirmed, resulting in a validation rate of∼62%.
3.3 Fusion genes in different tumor entities
3.3.1 Sarcoma
The HIPO-028 project aims to identify actionable genetic alteration in soft-tissue sarcoma based
on whole-exome and whole-transcriptome profiling. In total, 83 sarcoma RNA-seq samples
were analyzed and confFuse identified 680 high-confidence fusions (1253 fusions scored ≥6.5)
(Suppl. Table S4), 19 of which were recurrent fusions (Table 3.6), including well-known fusion
SS18:SSX1 in synovial sarcoma [100] and fusion FUS:DDIT3 in myxoid liposarcoma [101].
Table 3.6: Recurrent fusion genes identified in HIPO-028 sarcoma samples.
Gene1 Gene2 Recurrence(score ≥8)
Gene1 Gene2 Recurrence(6.5≤ score <8)
SSX1 SS18 4 LRRC37A2 KANSL1 2FUS DDIT3 4 SH3PXD2A AC021066.1 2GRIP1 CSAD 2 SLC25A3 RPL6P25 2MDM2 CPM 2 TMTC2 METTL25 2RAPGEF3 ESPL1 2 TPH2 TMTC2 2RP11-547C5.2 ATP2B1 2 TRHDE SP1 2STAT6 NAB2 2 ZRANB3 IFI6 2TMEM106C GIT2 2UBC NCOR2 2UBE2N CPM 2VDR TSFM 2VTI1A TPH2 2
Several recurrent fusion partners were identified, including fusion partner fibroblast growth
factor receptor substrate 2 (FRS2) in nine samples, E3 Ubiquitin protein ligase MDM2 (proto-
oncogene) in nine samples, protein tyrosine phosphatase receptor-type R (PTPRR) in three sam-
ples and Ras-related protein Rap-1b (RAP1B) in three samples (Table 3.7). Fusion OSBPL8:PRPRR

44 CHAPTER 3. RESULTS
was identified in one of 1,019 TCGA breast cancer samples and fusions C12orf28:MDM2 and
FRS2:MDM2 were identified in two different TCGA lung adenocarcinoma samples (n=487), re-
spectively. In addition, a novel fusion RICTOR (rapamyclin-intensive companion of MTOR)::AKT1
(RAC-alpha serine/threonine-protein kinase) was categorized as being high-confidence in one
sample.
Table 3.7: Fusions with recurrent partners (score ≥8) in 83 sarcoma samples.
Gene1 Gene2 Sample ID Gene1 Gene2 Sample ID
MDM2 CAND1 91Z1 PTPRR LGR5 RZA9MDM2 CENPL 91Z1 PTPRR OSBPL8 NTATMDM2 KCNMB4 91Z1 PTPRR PPM1H JSF3MDM2 AL583842.3 TT6Q CTDSP2 FRS2 6SSRMDM2 C12orf28 RW8V ANO2 FRS2 NTATMDM2 CPM RW8V EFHC1 FRS2 91Z1MDM2 CPM 6MN5 DAB1 FRS2 HLDXMDM2 KATNA1 T56Q RP11-620J15.3 FRS2 TT6QMDM2 FAM5B NF4Z LRRC8B FRS2 W7DBMDM2 PIP4K2C JSF3 MARCH9 FRS2 W7DBMDM2 PTPRD 8UBW PRTFDC1 FRS2 LL1UMDM2 SNX9 W7DB SRXN1 FRS2 LL1URAP1B ELK3 RW8V METTL25 FRS2 8UBWRAP1B LRRC8C W7DB PDE4DIP FRS2 2CJVRAP1B RPS6KA3 6SSR MDM2 FRS2 W7DB
Note: The order of fusion partner 5′ and 3′ is ignored to simplify comparison.
3.3.2 Prostate cancer
Based on RNA-seq data from 11 published early-onset prostate cancer [53], 849 fusion genes
were called by deFuse, 24 of which were identified as high-confidence fusions (score ≥8) by
confFuse. The well-known E26 transformation-specific (ETS) fusion genes were identified in
10 of 11 samples, which are the same as previously published results [53]. Among the 24
candidates, 17 were of confirmed by DNA-seq, FISH validation or known ETS fusions, resulting
in a ∼70% (17/24) recovery rate (Table 3.8). Furthermore, a novel 3′ fusion partner CEP85 of
gene TMPRSS2 (TMPRSS2:CEP85) was identified.
The ICGC early-onset prostate cancer project conducts a system genomic analysis to identify
hereditary mechanisms and to find optimal treatment regimens based on NGS data such as WGS
and RNA-seq. A cohort of 84 unpublished prostate cancer RNA-seq from ICGC project shows
117 high-confidence fusion genes (score ≥8) from identified 9,043 candidates (371 fusions
scored ≥6.5) (Suppl. Table S5). In total, ∼48.8% (41/84) of samples harbor rearrangements of
TMPRSS2, ERG, ETV1 or ETV4. Several novel fusion genes were identified, including RIOBP:ERG,

3.3. FUSION GENES IN DIFFERENT TUMOR ENTITIES 45
Table 3.8: 24 high-confidence fusion genes identified in 11 early-onset prostate cancer byconfFuse. The confirmed evidence (DNA-seq support) is from published paper [53].
SampleID Gene1 Gene2 Support from DNA-seq Descriptions
EOPC 01 PPAP2A MICAL2 Y FISH validatedEOPC 01 RBM47 FBXL14 Y DNA-seq supportEOPC 01 ZNF37A BCL2L13 - -EOPC 02 SLC45A3 ERG Y ETS fusionEOPC 02 TFG GPR128 validated in other tumorsEOPC 03 SNRPN/SNURF ETV1 Y DNA-seq supportEOPC 04 MIPEP FOXP1 Y FISH validatedEOPC 04 TMPRSS2 ERG - ETS fusionEOPC 05 TMPRSS2 ERG - ETS fusionEOPC 05 VPS8 SHISA5 - -EOPC 06 PPP2R1A GPX3 - -EOPC 06 SLC45A3 ERG Y ETS fusionEOPC 06 TMEFF2 DTWD2 Y DNA-seq supportEOPC 06 TMPRSS2 EPB41L1 Y DNA-seq supportEOPC 07 SETD1A H6PD - -EOPC 07 TMPRSS2 ERG - ETS fusionEOPC 08 TMPRSS2 ERG - ETS fusionEOPC 09 CEP85 ARHGAP35 - -EOPC 09 TMPRSS2 CEP85 - -EOPC 09 TMPRSS2 ERG Y ETS fusion
EOPC 010 TMPRSS2 ERG - ETS fusionEOPC 011 LINC00365 ABCC4 - -EOPC 011 PRPH2 NEDD4L Y FISH validatedEOPC 011 TMPRSS2 ERG - ETS fusion
TMPRSS2:LNX1, AGR:ETV1 and RAB4A:ETV4. Three recurrent fusion genes were identified
as being high-confidence, namely TMPRSS2:ERG (34/84, ∼40%), KLK3:KLK2 (17/84, ∼20%)
and SLC45A3:ERG (2/84, ∼2%). A further analysis of kallikrein-related peptidase gene family
(prostate-specific antigen is a member), including KLK3 and KLK2, should be followed in order to
find out whether there are aberrations.
3.3.3 Glioblastoma multiforme
The HIPO-016 project aims to identify potential molecular markers and therapy-interference
points in adult gliomas by integration of clinical data and deep sequencing data such as RNA-seq,
DNA-methylation and exom-seq. In the HIPO-016 project, there are 48 adult GBM, 22 low-grade
glioma tumors and 5 healthy brain RNA-seq samples. 470 fusion candidates (score ≥6.5) were
identified, 227 of which were scored ≥8 (Suppl. Table S6). Twelve recurrent fusion genes were
identified, including a novel fusion ST7:MET which was validated by RT-PCR followed by Sanger
sequencing5 (Table 3.9). Another MET fusion (JAZF1:MET) was also identified. A plot of the 12
recurrent fusions is given in Figure 3.14.
Four novel rearrangements of glioma-associated oncogene homolog 1 (GLI1), namely
5Validation has been done by Yonghe Wu.

46 CHAPTER 3. RESULTS
ATP
2B4
NFA
SC
SCN3A
SCN1A
NEK11
WDR70
AP3B1
NXPH1
VSTM2A
LANC
L2
ME
T
ST7
UB
AP
1C10
orf6
8
C12orf55
NEDD1TDG
TMEM132B
CTC−296K1.3
GJC1
AR
MC
X4
10MB 50MB 100MB 150MB
200MB
2
0MB50MB
100MB150M
B
200MB
3
0MB
50MB
100MB
150MB
40M
B50M
B100M
B
150M
B
5
0MB
50M
B
100M
B
150M
B
6
0MB
50M
B
100M
B
150M
B
70MB
50MB
100MB
150MB
8 0MB
50MB
100MB90MB50MB100MB
100MB
50MB
100MB
11
0MB
50MB
100MB
12
0MB
50MB
100MB
130M
B
50MB
100MB
140M
B
50MB
100MB
150M
B50M
B
100M
B
160M
B50
MB
17
0MB
50M
B
18
0MB
50M
B
19
0MB
50M
B
20
0MB
50MB 210MB
220MB50MB
X0MB
50MB100MB 150MB
Y0MB 50MB
Figure 3.14: Plot of 12 recurrent fusions (score ≥6.5) in 48 GBM samples. Blue color showsthe inter-chromosome fusions and red color represents the intra-chromosome fusions.

3.3. FUSION GENES IN DIFFERENT TUMOR ENTITIES 47
Table 3.9: Recurrent fusions (n=12, score ≥6.5) in 48 GBM samples.
Gene1 Gene2 Recurrence Gene1 Gene2 Recurrence
TRIO ARHGEF3 3 TMEM132B TDG 2SCN3A SCN1A 3 ST7 MET* 2NEDD1 C12orf55 3 NFASC ATP2B4 2WDR70 UBAP1 2 NEK11 C10orf68 2WDR70 NXPH1 2 GJC1 CTC-296K1.3 2VSTM2A LANCL2 2 ARMCX4 AP3B1 2
Note: The order of fusion partner 5′ and 3′ is ignored to simplify comparison.* Fusion ST7:MET in two different samples was experimentally validated.
AATF:GLI1, CPSF6:GLI1, DDIT3:GLI1 and INHBE:GLI1, were identified in four different samples
(three fusions scored ≥ 7 and one scored 3.5). Interestingly, expression of GLI1 is much higher in
samples with GLI1 rearrangement than in ones without GLI1 fusions (Figure 3.15), indicating
that over expression of GLI1 maybe a result of fusion. Validation of GLI1 rearrangements and
further analysis should be carried on in the future.
3.3.4 Germinal-center derived B-cell malignant lymphoma
The project ICGC-MMML-Seq (Molecular Mechanisms in Malignant Lymphoma by Sequencing)
aims to translate finding based on NGS data to clinics. A cohort of 135 GCB-lymphoma samples
from project ICGC-MMML-Seq was analyzed by confFuse. In total, 380 fusions (score ≥6.5) were
identified by confFuse, 174 of which were scored ≥8 (Suppl. Table S7). Among the 135 samples,
118 of them harbored at least one fusion with score ≥6.5 (74 samples with at least one fusion
scored ≥8) (Figure 3.16). Comparison of the median number of fusions identified that one
sample (ID 4145528) harbors much more putative fusion candidates than the others (67 fusions
scored ≥6.5 and 32 fusions scored ≥8) (Figure 3.16). Score threshold 6.5 was chosen for further
analysis in this cohort because previously reported IGH:BCL2 rearrangement was identified as
being scored ≥6.5 in several samples (mentioned below).
In total, 50 of 135 samples harbor at least one fusion which has fusion partner immunoglobulin
(IG), such as immunoglobulin kappa locus (IGK) and immunoglobulin heavy locus (IGH). Multiple
recurrent rearrangements were identified, including previously published ones such as IG:MYC
(in six samples), BCL2:IGH in 11 samples, BCL6:IGH in six samples and IG rearrangements
(IGKJ5:IGKV5-2 in eight samples) (Table 3.10 and Figure 3.17).
In addition, several novel recurrent fusions were identified, such as HLA-DPB1:HLA-DRB1
(n=7) and RIPK1:SERPINB9 (n=4). Receptor-interacting serine/threonine-protein kinase 1
(RIPK1) plays an important role in caspase-independent cell death [102]. Protease inhibitor 9
(SERPINB9) is a member of the serine protease inhibitor family, which can specifically inhibit

48 CHAPTER 3. RESULTS
● ● ● ● ● ● ● ● ● ●●
● ● ● ●●
● ● ● ● ● ● ● ●● ● ● ● ● ●
● ● ● ●● ● ● ● ● ● ●
●● ● ● ● ● ● ● ● ● ● ● ● ● ● ● ● ● ● ● ● ● ● ● ● ● ● ● ● ●
●
●
●
●
GLI1 expression in 75 samples
RP
KM
of g
ene
GLI
1
0
20
40
60
80
100
120
AK
003
AK
015
AK
017
AK
030
AK
041
AK
049
AK
051
AK
055
AK
066
AK
068
AK
071
AK
072
AK
074
AK
076
AK
085
AK
088
AK
089
AK
091
AK
098
AK
102
AK
103
AK
124
AK
132
AK
139
AK
142
AK
149
AK
153
AK
156
AK
158
AK
167
AK
168
AK
178
AK
183
AK
185
AK
188
AK
195
AK
199
AK
203
AK
213
AK
216
AK
217
AK
227
AK
231
AK
236
AK
501
AK
509
AK
512
AK
514
AK
516
AK
517
AK
518
AK
519
AK
520
AK
521
AK
525
AK
526
AK
532
AK
533
AK
534
AK
540
AK
541
AK
543
AK
548
AK
551
AK
560
AK
561
norm
al_f
ront
alno
rmal
_occ
ipita
lno
rmal
_par
ieta
lno
rmal
_tem
pora
lno
rmal
_tot
al_b
rain
AK
173
AK
165
AK
053
AK
100
Figure 3.15: Gene expression of GLI1 in 75 samples (48 GBM, 22 low-grade gliomas andfive healthy brain samples). Fusions AATF:GLI1 and CPSF6:GLI1 (score ≥8) were identifiedin sample AK100 and AK053, respectively (red). Another fusion DDIT3:GLI1 (score=7)was found in sample AK165 (red) and fusion INHBE:GLI1 was detected as a read-throughtranscript in sample AK173 (blue).

3.3. FUSION GENES IN DIFFERENT TUMOR ENTITIES 49
●
●
010
2030
4050
60
118 samples
●
24
68
10
117 samples
●
●
●
●●● ●● ●●
●●● ●● ●● ●● ●●
●●● ●● ●● ●● ●●
●●● ●● ●● ●● ●● ●● ●● ●●
●●● ●● ●● ●● ●● ●● ●● ●● ●● ●● ●● ●● ●● ●
●●● ●● ●● ●● ●● ●● ●● ●● ●● ●● ●● ●● ●● ●● ●● ●● ●● ●● ●● ●
●
05
1015
2025
30
74 samples
12
34
5
73 samples
●●
●●● ●● ●●
●●● ●● ●● ●● ●● ●● ●●
●●● ●● ●● ●● ●
●●● ●● ●● ●● ●● ●● ●● ●● ●● ●● ●● ●● ●● ●● ●● ●● ●● ●● ●●
Figure 3.16: Number of fusions scored ≥6.5 (top) and ≥8 (bottom) in 135 lymphomasamples. One sample has very high number of predicted fusions, indicating higher level ofgenomic aberration. Most of the remaining samples harbor ≤4 fusions. The right box plotsshow the results after removing one outlier.

50 CHAPTER 3. RESULTS
Table 3.10: 29 recurrent fusion genes (score ≥6.5) in 135 lymphoma samples.
Gene1 Gene2 Recurrence Gene1 Gene2 Recurrence
IGKJ5 IGKV5-2 8 IGHM RP11-211G3.2 2HLA-DPB1 HLA-DRB1 7 LYZ RP11-186B7.4 2AC016831.7 SYT9 6 AL122127.3 RP11-1136L8.1 2HERC2P3 RERE 6 IGHM MYC 2ASMT HLA-DQA1 5 KIAA0922 MND1 2GPR128 TFG 4 FCRL3 LSAMP 2RIPK1 SERPINB9 4 CHMP1A IGLL5 2AL122127.3 BCL6 4 BCL2 IGHJ6 2ATAD3A SH3BP1 3 BCL2 IGHJ3 2BCL2 IGHJ5 3 BCL6 IGHG3 2BCL2 IGHJ4 3 HLA-B HLA-G 2BCL2 IGHG1 3 HLA-B HLA-F 2SLC16A14 TRIP12 2 HLA-DPB1 HLA-DRB5 2LYN TGS1 2 ANXA1 CD58 2KIF20B SPINK9 2
Note: The order of fusion partner 5′ and 3′ is ignored to simplify comparison.
Table 3.11: Nine validated fusions in lymphoma samples.
Sample Gene1 Gene2 Deletion Score
B0979 CTSB C8orf12 Y 2B0979 RAI1 TOM1L2 Y -8.5B0979 ESCO1 GREB1L Y -2.5B2196 ARID5B SOX5 N 10B2193 ZNF407 EPSTI1 N 10B2190 ZC3H11A ATP2B4 N 7.5C1635 RCSD1 MPZL1 Y -1C1561 CCDC106 U2AF2 Y 0B0981 TRAF3IP2 CD109 N 9.5
Note: The order of fusion partner 5′ and 3′ is ignored to simplify comparison.
granzyme B (a cytotoxic serine protease) in the cytosolic granules of cytotoxic T lymphocytes
and natural killer cells [103]. A novel fusion HLA-E:HLA-B has been experimentally validated in
esophageal squamous cell carcinoma [104]. The biological function of this fusion (HLA-E:HLA-B),
however, remains unclear.
An independent validation of nine fusions has been done in this project6. All the four non-
deletion fusions were identified with score ≥7.5. The rest five deletion fusions have not been
identified as medium/high confidence fusions (Table 3.11).
6Independent validation was done by Reiner Siebert’s group.

3.3. FUSION GENES IN DIFFERENT TUMOR ENTITIES 51
1
0MB 50MB 100MB150MB
200MB
2
0MB
50MB
100MB
150MB
200MB
3
0MB
50MB
100MB
150MB
40M
B50M
B100M
B
150M
B
5
0MB
50M
B
100M
B
150M
B
6
0MB
50M
B
100M
B
150M
B
7
0MB
50MB
100MB
150MB
8 0MB
50MB
100MB90MB50MB100MB
100MB
50MB
100MB
11
0MB
50MB
100MB
12
0MB
50MB
100MB
130M
B
50MB
100MB
140M
B
50MB
100MB
150M
B50M
B
100M
B
160M
B50
MB
17
0MB
50M
B
18
0MB
50M
B
19
0MB
50M
B
20
0MB
50MB 210MB
220MB
50MBX
0MB50MB
100MB150MB
Y0MB 50MB
Figure 3.17: Plot of 29 recurrent fusion genes scored ≥6.5 in 135 lymphoma samples. Bluecolor shows the inter-chromosome fusions and red color represents the intra-chromosomefusions.

52 CHAPTER 3. RESULTS
010
000
2000
030
000
4000
0
13816
109 48
40827
725 374
Identified fusion genes
ICGCHIPO005
●
●
●
●
100
200
300
400
500
600
700
Identified fusion genes
ICGCHIPO005
●
●
●
●
●
●
●
●●
●
●
●
05
1015
2025
3035
Fusions scored ≥ 6.5
ICGCHIPO005
●
●
●
●
●
●
●
●
●
510
1520
25
Fusions scored ≥ 8
ICGCHIPO005
Figure 3.18: Number of fusions identified in CLL samples from ICGC (n=96) and HIPO-005(n=114). Numbers of high-confidence fusions identified in projects ICGC and HIPO-005 are116 and 374, respectively (209 and 725 fusions scored ≥6.5).
3.3.5 B-cell chronic lymphocytic leukemia
The HIPO-005 aims to identify the critical gene mutations which may result in therapy resistance
or partially sensitive in CLL samples based on exom-seq and RNA-seq data. In total, 374 of 40,827
fusion genes were identified as being high-confidence in 114 CLL RNA-seq samples from the
HIPO-005 project (725 fusions scored ≥6.5) (Suppl. Table S8). In 96 published CLL samples
from the respective ICGC project [105], 48 of 15,501 fusion genes scored ≥8 (109 fusions scored
≥6.5) . The number of fusions identified in HIPO-005 samples was much higher than the one in
ICGC samples (Figure 3.18).
Many recurrent fusions were identified in CLL samples from both ICGC and HIPO-005 (Table
3.12). Most of the recurrent fusions identified here are novel and have not been reported before,

3.3. FUSION GENES IN DIFFERENT TUMOR ENTITIES 53
including CXCR4:PTMA, CXCR4:CHD2 and CXCR4:GNAS. The gene fusion CXCR4:PTMA was
identified in 82 of 114 CLL samples from HIPO-005 (score ≥6.5). To make a complementary
detection, another fusion detection tool fusionMap was applied on these CLL samples. In total,
96 samples from HIPO-005 harbor CXCR4:PTMA fusion which was detected by either confFuse
or fusionMap. Another highly recurrent fusion partner is KLF2 (31 samples scored ≥6.5, 16
samples scored ≥8), which plays an important role in development, erythroid differentiation,
adipogenesis and T-cell differentiation [106].
Table 3.12: Recurrent fusions in CLL samples from HIPO-005 (n=114) and ICGC (n=96).
Gene1 Gene2 HIPO-005-score≥6.5
HIPO-005-score≥8
ICGC-score≥6.5
ICGC-score≥8
CHD2 B2M 32 32 1 1CXCR4 CHD2 19 19 NA NAGNAS CXCR4 13 13 2 2YPEL5 CXCR4 13 13 NA NAIGHA2 IGHA1 12 12 8 8CXCR4 BCL2L11 9 9 1 1GNAS B2M 9 9 1 1TCF3 OAZ1 9 9 1 1PTMA CXCR4 82 8 7 NAOAZ1 CSNK1G2 8 8 NA NARBM38 CXCR4 8 8 NA NAKLF2 FOSB 7 7 NA NADDX5 CXCR4 6 6 NA NAUBC NCOR2 6 6 NA NACXCR4 B2M 5 5 NA NACXCR4 CLK1 5 5 NA NAUSP34 NAV3 6 4 NA NAOAZ1 KLF2 4 4 1 1TFG GPR128 4 4 4 3KLF2 AKAP8 4 4 NA NAUBB CXCR4 4 4 NA NATMEM18 PTMA 7 3 NA NARGPD5 BCL2L11 5 3 NA NACXCR4 ATP6V0C 3 3 NA NAKLF2 ACTB 3 3 NA NANOC4L FBRSL1 3 3 NA NAPNRC1 BACH2 3 3 NA NAPTMA OAZ1 3 3 NA NASIK1 KLF2 3 3 NA NA
Continued on next page
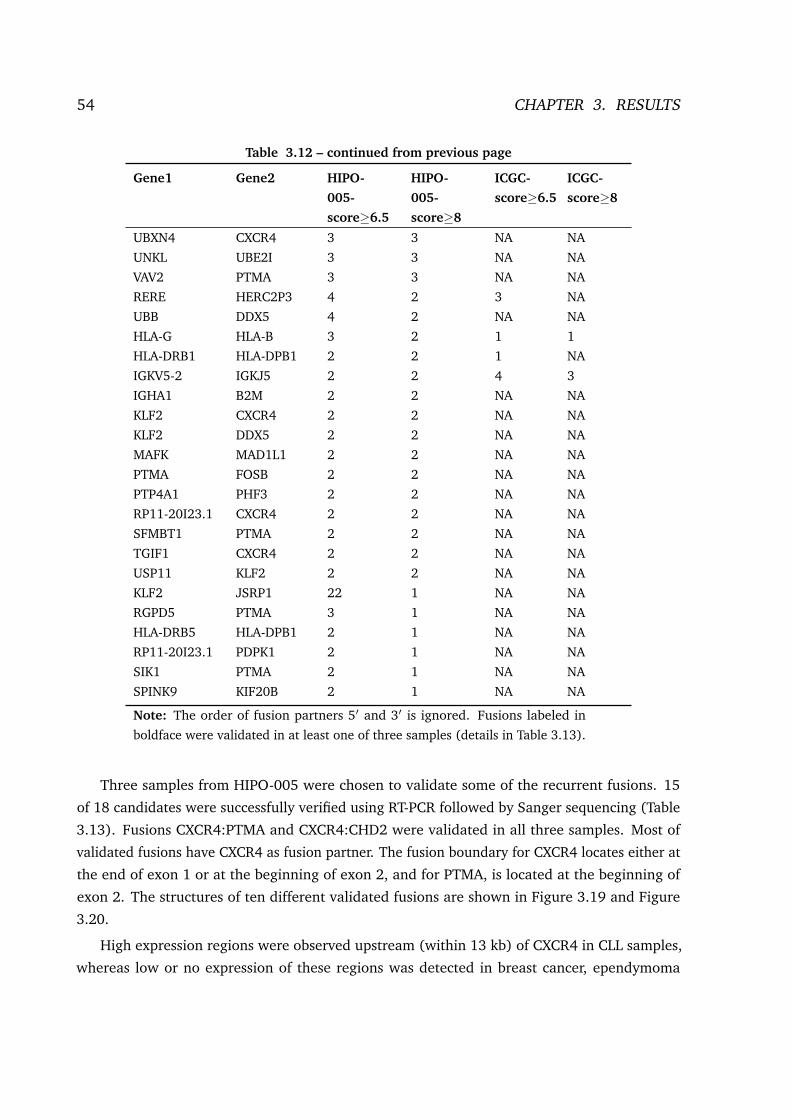
54 CHAPTER 3. RESULTS
Table 3.12 – continued from previous page
Gene1 Gene2 HIPO-005-score≥6.5
HIPO-005-score≥8
ICGC-score≥6.5
ICGC-score≥8
UBXN4 CXCR4 3 3 NA NAUNKL UBE2I 3 3 NA NAVAV2 PTMA 3 3 NA NARERE HERC2P3 4 2 3 NAUBB DDX5 4 2 NA NAHLA-G HLA-B 3 2 1 1HLA-DRB1 HLA-DPB1 2 2 1 NAIGKV5-2 IGKJ5 2 2 4 3IGHA1 B2M 2 2 NA NAKLF2 CXCR4 2 2 NA NAKLF2 DDX5 2 2 NA NAMAFK MAD1L1 2 2 NA NAPTMA FOSB 2 2 NA NAPTP4A1 PHF3 2 2 NA NARP11-20I23.1 CXCR4 2 2 NA NASFMBT1 PTMA 2 2 NA NATGIF1 CXCR4 2 2 NA NAUSP11 KLF2 2 2 NA NAKLF2 JSRP1 22 1 NA NARGPD5 PTMA 3 1 NA NAHLA-DRB5 HLA-DPB1 2 1 NA NARP11-20I23.1 PDPK1 2 1 NA NASIK1 PTMA 2 1 NA NASPINK9 KIF20B 2 1 NA NA
Note: The order of fusion partners 5′ and 3′ is ignored. Fusions labeled inboldface were validated in at least one of three samples (details in Table 3.13).
Three samples from HIPO-005 were chosen to validate some of the recurrent fusions. 15
of 18 candidates were successfully verified using RT-PCR followed by Sanger sequencing (Table
3.13). Fusions CXCR4:PTMA and CXCR4:CHD2 were validated in all three samples. Most of
validated fusions have CXCR4 as fusion partner. The fusion boundary for CXCR4 locates either at
the end of exon 1 or at the beginning of exon 2, and for PTMA, is located at the beginning of
exon 2. The structures of ten different validated fusions are shown in Figure 3.19 and Figure
3.20.
High expression regions were observed upstream (within 13 kb) of CXCR4 in CLL samples,
whereas low or no expression of these regions was detected in breast cancer, ependymoma

3.3. FUSION GENES IN DIFFERENT TUMOR ENTITIES 55
Table 3.13: 15 fusions validated by RT-PCR and Sanger sequencing in three CLL samples.
5′ gene 3′ gene 5′ chr 5′ break point 3′ chr 3′ break point Sample ID confFusescore
B2M CHD2 15 45003811 15 93428745 QGBA 8.5CXCR4 PTMA 2 136875616 2 232576058 QGBA 6.5CXCR4 CHD2 2 136875616 15 93428745 QGBA 9CXCR4 GNAS 2 136875616 20 57470667 0XXE 8.5B2M CXCR4 15 45003811 2 136873482 0XXE 9BCL2L11 CXCR4 2 111878765 2 136873482 0XXE 8.5CXCR4 DDX5 2 136875616 17 62500960 0XXE 9CXCR4 PTMA 2 136875616 2 232576058 0XXE 6.5CXCR4 CHD2 2 136875616 15 93428745 0XXE optimizedCXCR4 CHD2 2 136875616 15 93428745 A72M 9YPEL5 CXCR4 2 30369928 2 136873482 A72M 8.5BCL2L11 PTMA 2 111878765 2 232576058 A72M 6.5CXCR4 PTMA 2 136875616 2 232576058 A72M 6.5CXCR4 GNAS 2 136875616 20 57470667 A72M optimizedB2M GNAS 15 45003811 20 57470667 A72M optimized
Recurrent fusion genes were labeled with different colors.
5’
3’
5’
3’
3’
5’
3’
5’
- 3’5’ - exon1 exon2-5
PTMA
CXCR4
CXCR4 PTMA
CXCR4
GNAS
- 3’5’ - exon1 exon2-13
GNASCXCR4
Figure 3.19: Structure of fusions CXCR4:PTMA and CXCR4:GNAS in CLL, and Sangersequencing of fusion boundaries.
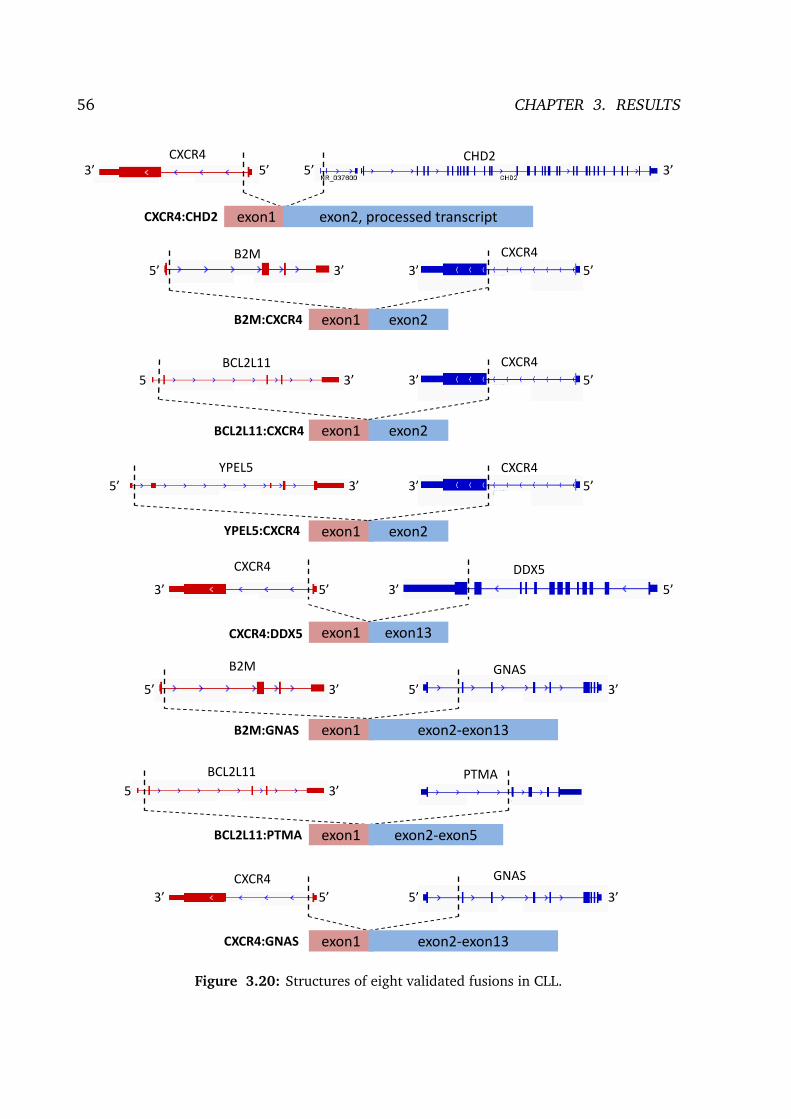
56 CHAPTER 3. RESULTS
5’ 3’
5’ 3’
5’
3’5’
5’CXCR4 CHD2
B2M CXCR4
BCL2L11
YPEL5
CXCR4 DDX5
GNAS
PTMA
exon1 exon2, processed transcript
3’ 3’5’
5’3’
exon1 exon2
3’
CXCR4
5’
3’
CXCR4
5’
exon1 exon2
3’
exon1 exon2
3’ 5’ 3’ 5’
exon1 exon13
5’
B2M
3’
exon1 exon2-exon13
5’
BCL2L11
3’
exon1 exon2-exon5
5’ 3’
GNASCXCR4
3’ 5’
exon1 exon2-exon13
CXCR4:CHD2
B2M:CXCR4
BCL2L11:CXCR4
YPEL5:CXCR4
CXCR4:DDX5
B2M:GNAS
BCL2L11:PTMA
CXCR4:GNAS
Figure 3.20: Structures of eight validated fusions in CLL.

3.3. FUSION GENES IN DIFFERENT TUMOR ENTITIES 57
Figure 3.21: Expression of novel regions located CXCR4 upstream. The IGV snapshot showsthe log-scale expression. Many reads were mapped on the region 3 (R3) of CXCR4 upstreamin CLL samples but not in other entities, which indicates expression in this region may beCLL specific.
or lymphoma samples (Figure 3.21). Interestingly, these three regions were not annotated by
Gencode Genes (v18). Comparison of samples with fusion CXCR4:PTMA (n=96) and samples
without this fusion (n=18) shows significantly different expression of gene CXCR4 (t-test,
p=0.00035) and non-annotated region R1 (t-test, p=0.036). There is no significant difference in
expression in non-annotated regions R2 and R3 between samples with and without CXCR4:PTMA
fusion (Figure 3.22). Furthermore, samples with fusion CXCR4:PTMA shows a lower correlation
between R3 and CXCR4 expression (r=0.143) than the ones without this fusion (Figure 3.23).
3.3.6 Ependymoma
A epigenomic analysis aims to identify the drivers in ependymoma based different NGS data such
as ChiP-seq, RNA-seq and WES. Analysis of 25 strand-specific RNA-seq ependymoma samples (24
tumors, 1 cell line) shows in total 4,709 fusion genes identified by deFuse, 67 of which were scored
>6.5 by confFuse (Suppl. Table S9). Six recurrent fusions were identified, including previously
reported fusions C11orf95:RELA (n=5) [107] and YAP1:MAMLD1 (n=3) in our published paper
[96]. The other four recurrent fusions are NEDD1:C12orf55 (C12orf55 is also known as CFAP54)
(n=17), CXorf59:CXorf22 (n=7), CXorf59:HMGB1P16 (n=5) and LINC00969:SDHAP1 (n=2).
Neural precursor cell expressed, developmentally down-regulated 1 (NEDD1), which is

58 CHAPTER 3. RESULTS
●
●
●
Without fusion With fusion
1000
2000
3000
4000
RP
KM
of C
XC
R4
P=0.00035
n=18n=96
●
●
●
●
●
●
Without fusion With fusion
02
46
810
RP
KM
of r
egio
n 1
P=0.03621
●
●
●
Without fusion With fusion
01
23
4
RP
KM
of r
egio
n 2
P=0.18521
●
●
●
●
Without fusion With fusion
02
46
810
RP
KM
of r
egio
n 3
P=0.19552
Figure 3.22: Expression of CXCR4 and non-annotated regions in two groups (CLL sampleswith fusion CXCR4:PTMA and ones without this fusion from the HIPO-005 project).

3.3. FUSION GENES IN DIFFERENT TUMOR ENTITIES 59
●
●
●
●
●●
●
●
●
●
●
●
●
●●
●
●
●
0 2 4 6 8 10
500
1500
2500
RP
KM
of C
XC
R4
RPKM of region 1
r = 0.304without fusion (n=18)
●
●
●
●●
●
●
●●
●
●
●
●
●
●
●
●
●
●
●
●
●●
●
●
●
●●
●
●
●
●
●
●
●
●
●
●
●
●
●
●
●●
●●
●
●
●
●
●
●
●
●
●
●
●●
●
●
●
● ●
●
●
●
●
●
●
●
●
●
●
●
●
●
●
●
●
●
●●
●
●
●
●
●
●
●
●
●
●
●
●
●
●
2 4 6 8 10
500
1500
2500
3500
RPKM of region 1
r = 0.18with fusion (n=96)
●
●
●
●
●●
●
●
●
●
●
●
●
●●
●
●
●
0 1 2 3 4
500
1500
2500
RP
KM
of C
XC
R4
RPKM of region 2
r = 0.346without fusion (n=18)
●
●
●
●●
●
●
●●
●
●
●
●
●
●
●
●
●
●
●
●
●●
●
●
●
●●
●
●
●
●
●
●
●
●
●
●
●
●
●
●
●●
●●
●
●
●
●
●
●
●
●
●
●
●●
●
●
●
● ●
●
●
●
●
●
●
●
●
●
●
●
●
●
●
●
●
●
●●
●
●
●
●
●
●
●
●
●
●
●
●
●
●
0 1 2 3 4
500
1500
2500
3500
RPKM of region 2
r = 0.327with fusion (n=96)
●
●
●
●
●●
●
●
●
●
●
●
●
●●
●
●
●
0 2 4 6 8 10
500
1500
2500
RP
KM
of C
XC
R4
RPKM of region 3
r = 0.43without fusion (n=18)
●
●
●
●●
●
●
●●
●
●
●
●
●
●
●
●
●
●
●
●
●●
●
●
●
●●
●
●
●
●
●
●
●
●
●
●
●
●
●
●
●●
●●
●
●
●
●
●
●
●
●
●
●
●●
●
●
●
● ●
●
●
●
●
●
●
●
●
●
●
●
●
●
●
●
●
●
●●
●
●
●
●
●
●
●
●
●
●
●
●
●
●
2 4 6 8 10
500
1500
2500
3500
RPKM of region 3
r = 0.143with fusion (n=96)
Figure 3.23: Correlation coefficient between CXCR4 and non-annotated regions in twogroups (CLL samples with fusion CXCR4:PTMA and ones without this fusion from theHIPO-005 project).
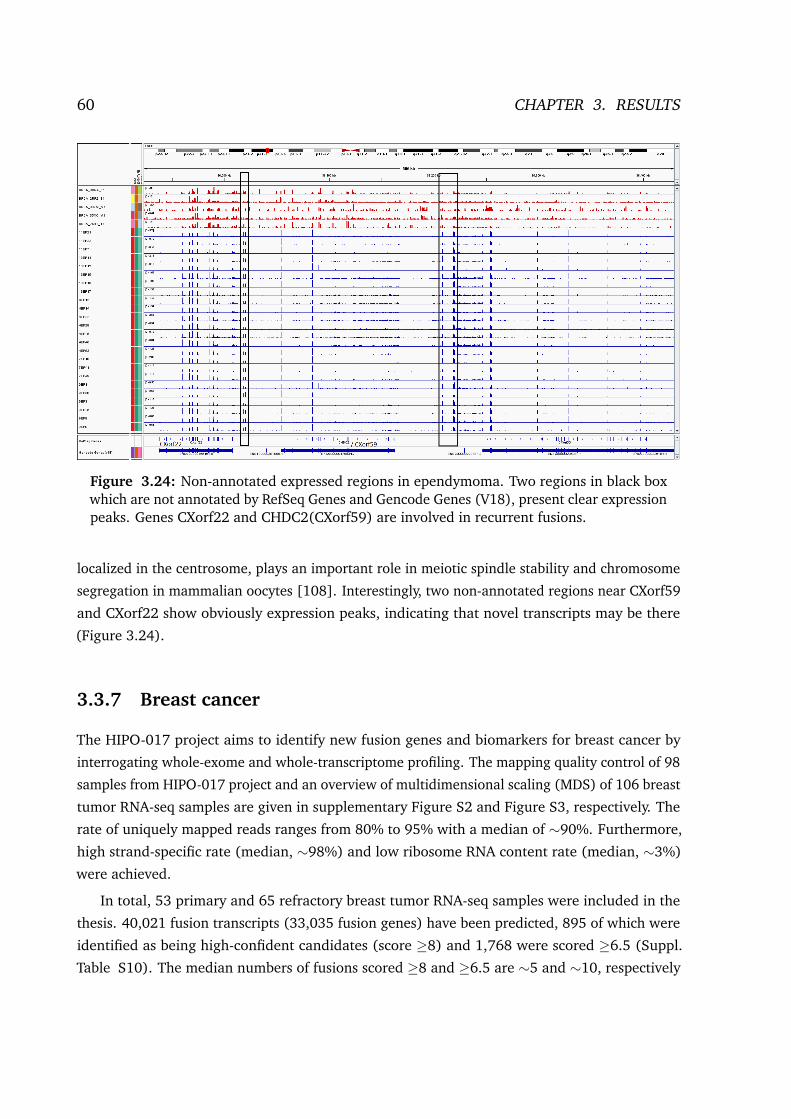
60 CHAPTER 3. RESULTS
Figure 3.24: Non-annotated expressed regions in ependymoma. Two regions in black boxwhich are not annotated by RefSeq Genes and Gencode Genes (V18), present clear expressionpeaks. Genes CXorf22 and CHDC2(CXorf59) are involved in recurrent fusions.
localized in the centrosome, plays an important role in meiotic spindle stability and chromosome
segregation in mammalian oocytes [108]. Interestingly, two non-annotated regions near CXorf59
and CXorf22 show obviously expression peaks, indicating that novel transcripts may be there
(Figure 3.24).
3.3.7 Breast cancer
The HIPO-017 project aims to identify new fusion genes and biomarkers for breast cancer by
interrogating whole-exome and whole-transcriptome profiling. The mapping quality control of 98
samples from HIPO-017 project and an overview of multidimensional scaling (MDS) of 106 breast
tumor RNA-seq samples are given in supplementary Figure S2 and Figure S3, respectively. The
rate of uniquely mapped reads ranges from 80% to 95% with a median of ∼90%. Furthermore,
high strand-specific rate (median, ∼98%) and low ribosome RNA content rate (median, ∼3%)
were achieved.
In total, 53 primary and 65 refractory breast tumor RNA-seq samples were included in the
thesis. 40,021 fusion transcripts (33,035 fusion genes) have been predicted, 895 of which were
identified as being high-confident candidates (score ≥8) and 1,768 were scored ≥6.5 (Suppl.
Table S10). The median numbers of fusions scored ≥8 and ≥6.5 are ∼5 and ∼10, respectively

3.3. FUSION GENES IN DIFFERENT TUMOR ENTITIES 61
Table 3.14: Distribution of fusion genes identified in 118 breast tumors across 13 differentfunctional categories (fusions scored ≥6.5).
Catogory Number ofgenes
Involved genein fusions
Number offusions
Number ofsamples
Notch signalling pathway 48 8 10 9Ras superfamily 154 13 14 14p53 signalling pathway 68 14 26 21Estogen signlling pathway 100 17 28 22HIF1 signalling pathway 106 17 30 18Tumor suppressor 258 23 34 24Solute carrier family 321 31 34 26ErbB signalling pathway 87 26 50 34Ras signalling pathway 227 36 62 33MAPK signalling pathway 257 43 69 42Pi3k-Akt-mTOR pathway 368 49 87 50Proto oncogene 233 44 96 40census gene (COSMIC) 571 113 211 71
(Suppl. Figure S4).
To uncover the potentially biological importance of fusion genes, 13 different functional
categories of fusion genes were analyzed (score ≥6.5), including different key cancer signalling
pathways, gene families and biologically important genes (Table 3.14). The number of fusion
genes in each category ranges from 10 to 211 with corresponding 9 to 71 different tumor samples.
Details of fusion genes (score ≥6.5) in the 13 categories are given in supplementary Table S11.
Some fusion genes are involved in different categories. For example, PAK1 participates in ErbB
pathway, MAPK pathway and Ras pathway. It should be noted that not all of the high-confidence
fusion genes were exemplified in each category.
3.3.7.1 Ras superfamily
Fourteen different fusions were detected in seven primary and seven refractory samples, including
recurrent rearrangements of ADP-ribosylation factor-like protein (ARL) gene family (n=2, e.g.
ANO1:ARL2) and Ras-related protein Rab (RAB) gene family (n=8, e.g. RAB25:SRGAP2B).
ADP-ribosylation factor-like protein 2 (ARL2) plays an important role in microtubule dynamics
and cell cycle in breast tumor cells [109]. Furthermore, ARL2 is associated with p53 localization
and chemosensitivity in a breast cancer cell line [110]. High level expression of Ras-related
protein 25 (RAB25) is correlated with lymphatic metastasis in ER+ and PR+ breast cancer [111].

62 CHAPTER 3. RESULTS
3.3.7.2 Solute carrier family
34 different rearrangements of solute carrier (SLC) gene family were detected in 10 primary
and 16 refractory samples. The function of solute carrier genes in cancer cells shows significant
impact on cancer therapy by directly bringing anticancer drugs into cancer cells and by uptaking
of nutrients for tumor growth and survival [112]. Recently, a study published in Nature shows
that SLC38A9 as a lysosomal membrane-resident protein plays an important role in amino acid
transport by controlling the amino-acid-induced mTORC1 activation [113].
3.3.7.3 HIF1 pathway
30 different fusions were detected in eight primary and ten refractory breast tumor samples,
including recurrent rearrangements of phosphofructokinase (PFK) gene family (n=2) and protein
kinase C (PRKC) gene family (n=4).
3.3.7.4 Notch pathway
Ten different fusions were identified in three primary and six refractory samples. Functionally
recurrent rearrangements of Notch gene families have been reported in breast cancer [39].
Three Notch gene fusions were identified in one primary and two refractory samples, of which
fusion SEC22B:NOTCH2 was previously reported in a breast cell line [39]. In addition, recurrent
rearrangements of corepressor interacting with RBPJ 1 (CIR1) have been identified in one primary
sample (OSBPL6:CIR1) and one refractory samples (CERS6:CIR1).
3.3.7.5 TP53 pathway
26 different fusions were identified in twelve primary and nine refractory samples. Six recurrent
rearrangements of PPM1D (n=5), THBS1 (n=3), PTEN (n=2), SESN1 (n=2), CCND1 (n=2)
and CCNE1 (n=2) were detected.
Protein phosphatase, Mg2+/Mn2+ dependent, 1D (PPM1D) dependent signalling has been
reported as being “a novel target to improve the efficacy of chemotherapeutic agents in resistant
breast cancer cells” [114]. The cycling genes, including CCND1 and CCNE1, play an important
role in cell cycle by activating cyclin-dependent kinase (CDK) [115].
3.3.7.6 Estrogen pathway
28 different fusions were identified in ten primary and twelve refractory samples. Fusion
ESR1:CCDC170 has been reported as recurrent rearrangements in endocrine-resistant luminal

3.3. FUSION GENES IN DIFFERENT TUMOR ENTITIES 63
B tumors [40] and it was identified in three refractory and one primary sample. In addition,
a novel fusion CDH8:ESR1 was detected in one refractory sample. The other recurrent fusion
partners include ADCY8 (n=2), GNAI3 (n=2), ITPR2 (n=2) as well as SOS gene family (n=3),
CREB gene family (n=3) and PLCB gene family (n=3).
Guanine nucleotide-binding protein G(k) subunit alpha (GNAI3) can inhibit hepatocellular
carcinoma cell migration and invasion [116]. Activation of cAMP response element-binding
protein (CREB) is required to enhance aromatase expression in tamoxifen-resistant human breast
cancer cells compared with control MCF-7 cells [117]. Phospholipase C (PLC) has six struc-
ture isotypes such as 1-Phosphatidylinositol-4,5-bisphosphate phosphodiesterase beta (PLCB).
Interestingly, fusions of PLCB members were only detected in three refractory tumor samples.
3.3.7.7 Ras pathway
62 different fusions were detected in 33 samples, including recurrent rearrangements of fibroblast
growth factor (FGF) gene family (n=5), Protein kinase (PRK) gene family (n=5), Phospholipases
A2 (PLA2) gene family (n=3), RAPGEF5 (n=2), GNB1 (n=2), GNG12 (n=2), KITLG (n=2) and
NF1 (n=4).
Fibroblast growth factor 14 (FGF14), a member of fibroblast growth factor (FGF) gene
family, is “an intracellular modulator of valtage-gated sodium channels” in central nervous system
[118]. Rearrangements of FGF14 were only identified in three refractory tumors. In addition,
rearrangements of FGF3, FGFR2 and FDF19 were detected in one refractory and two primary
tumors, respectively.
Guanine nucleotide binding protein (G Protein), beta polypeptide 1 (GNB1) can be regulated
by phytoestrogens through estrogen receptor pathway in breast MCF-7 cells [119]. Guanine
nucleotide binding protein (G Protein), gamma 12 (GNG12) can negatively regulate the inflam-
matory response in the microglial cell line [120].
KIT-ligand (KITLG), also known as stem cell factor, can activate its receptor tyrosine kinase
c-Kit, resulting in c-Kit’s autophosphorylation and initiation of signal transduction [121]. Fusions
of KITLG were found in one primary and one refractory tumor (SH2D4A:KITLG).
Neurofibromatosis type 1 (NF1) is associated with high risk of breast cancer development
in women, especially at younger ages (< 50) [122]. Recurrent rearrangements of NF1 were
identified in two primary and two refractory tumors.
3.3.7.8 ErbB pathway
50 different fusions were detected in 34 samples, including recurrent rearrangements of ERBB
gene family (n=3), NRG gene family (n=4), PAK gene family (n=5), PTK2 (n=4) and GRB2

64 CHAPTER 3. RESULTS
(n=3).
Human epidermal growth factor receptor 2 (HER2) encoded by ERBB2 show overexpression
in ∼20%-30% of breast cancer tumors [123]. It has been a drug target for HER2 positive breast
cancer patients using Trastuzumab which is a HER2 receptor blocker [123]. Fusion ERBB2:ALG6
was found in one refractory tumor. Rearrangements of ERBB4 were detected in two primary
tumors.
Neuregulin 1 (NRG1), a ligand of HER3 receptor, may induce cancer stem cell like char-
acteristics in breast cancer cell lines [124]. Lapatinib is a drug acting as an inhibitor of EGFR
and HER2 [125]. A combination treatment using lapatinib and pertuzumab can induce tumor
growth regression, which may overcome lapatinib-resistance due to NRG1-mediated signalling in
HER2-amplified breast cancer [125]. Fusions ATP8A1:NRG1 and NRG1:MAK16 were identified
in two primary samples. In addition, MLL5:NRG3 and SIN3A:NRG4 were found in two refractory
samples.
Growth factor receptor-bound protein 2 (GRB2) is one of the most significantly downreg-
ulated genes in HER2 mutated breast cancer based on transcriptional analysis [126]. Fusion
GRB2:TSEN54 was found in one refractory tumor; fusions GRB2:SEPT9 and GRB2:RNFT1 were
identified in two primary tumors.
Protein kinase C alpha (PRKCA) downregulates estrogen receptor expression by suppressing
c-JUN phosphorylation in ER+ breast cancer cells and may be a potential target to treat ER+ and
tamoxifen-resistant breast cancer [127]. Fusions TMRM104:PRKCA and PRKCA:BEND5 were
detected in two primary tumors and PRKCA:USP32 was in one refractory tumor. In addition,
fusion PRKCB:ARFGEF2 was identified in one refractory tumor.
PAK1 encodes serine/threonine protein kinase PAK1 and high level expression of PAK1 is
associated with poor clinical outcomes in luminal breast cancer [128]. Rearrangements of PAK1
have been identified in one refractory and three primary samples. In addition, fusion JAG1:PAK7
was detected in one primary sample.
Protein tyrosine kinase 2 (PTK2) is a focal adhesion-associated protein kinase (FAK) which
plays an important role in regulation of cellular responses such as cell adhesion, migration and
survival [129]. Interestingly, different fusions of PTK2 have been only detected in four primary
tumors.
A Her2 breast cancer pathway analysis based on INGENUITY is given in Figure 3.25.
3.3.7.9 PI3K-AKT-mTOR pathway
87 different fusions were detected in 50 samples, including recurrent rearrangements of collagen
(COL) gene family (n=7), integrin (ITG) gene family (n=9), MAMA4 (n=2), RPTOR (n=2) and

3.3. FUSION GENES IN DIFFERENT TUMOR ENTITIES 65
Figure 3.25: Fusion-involved genes in Her2 breast cancer pathway based on INGENUITY(labeled with red color).

66 CHAPTER 3. RESULTS
RPS6KB1 (n=5).
Ribosomal protein S6 kinase beta-1 (RPS6KB1), encoding the 70kDa ribosomal protein S6
kinase (p70S6K), is involved in various human diseases and it performs as “a biomarker for
response to immunosuppressant as well as anticancer effects of inhibitors of the mTOR” [130].
RPS6KB1 activates ESR1 by phosphorylating ESR1 on serine 167, which is a key position, leading
to ESR1 mediated cell proliferation in breast cancer [131]. Interaction between tamoxifen
and RPS6KB1 has been identified and phosphorylated RPS6KB1 significantly associated with
tamoxifen resistance [132]. Rearrangements of RPS6KB1 were identified in two primary and
three refractory tumors. In addition, fusion of RPS6KA1 was found in one primary tumor.
3.3.7.10 MAPK pathway
69 different fusions were detected in 42 samples, including recurrent rearrangements of calcium-
channels voltage-dependent (CACN) gene family (n=5), dual specificity protein phosphatase
(DUSP) gene family (n=2), mitogen-activated protein kinase (MAPK) related genes (n=10) and
serine/threonine-protein kinase TAO (TAOK) gene family (n=5).
Mitogen-activated protein kinases (MAPKs) consist of different protein-serine/threonine
kinases, which play important roles in signal transduction pathways that regulate cell functions
such as proliferation and apoptosis [133]. Rearrangements of MAPK related genes were identified
in one refractory and nine primary tumors.
The MAPK pathway analysis based on INGENUITY is shown in Figure 3.26.
3.3.7.11 Tumor suppressor gene
34 different fusions were detected in 24 samples, including recurrent rearrangements of BUB1B
(n=2), CDC73 (n=2), MTUS1 (n=2), PTEN (n=2) and neurofibromin (NF) gene family (n=5).
Mitoti checkpoint serine/threonine-protein kinase BUB1 beta (BUB1B) can interacte with
BRCA2 [134] and can correct mitotic checkpoint impairment and microtubule-kinetochore
attachment defects [135]. Rearrangements of BUB1B were identified in one primary and one
refractory tumor.
3.3.7.12 Oncogene
96 different fusions were detected in 40 samples, including recurrent rearrangements of ETV6
(n=2), HLF (n=2), MECOM (n=2), MKL1 (n=2), USP6 (n=2), RARA (n=3), RB1 (n=2),
MYEOV (n=4), RNF213 (n=5), RUNX1 (n=5), TRIM37 (n=6) and BCAS3 (n=7).

3.3. FUSION GENES IN DIFFERENT TUMOR ENTITIES 67
Figure 3.26: Fusion-involved genes in the MAPK signalling pathway based on INGENUITY(labeled with red color).
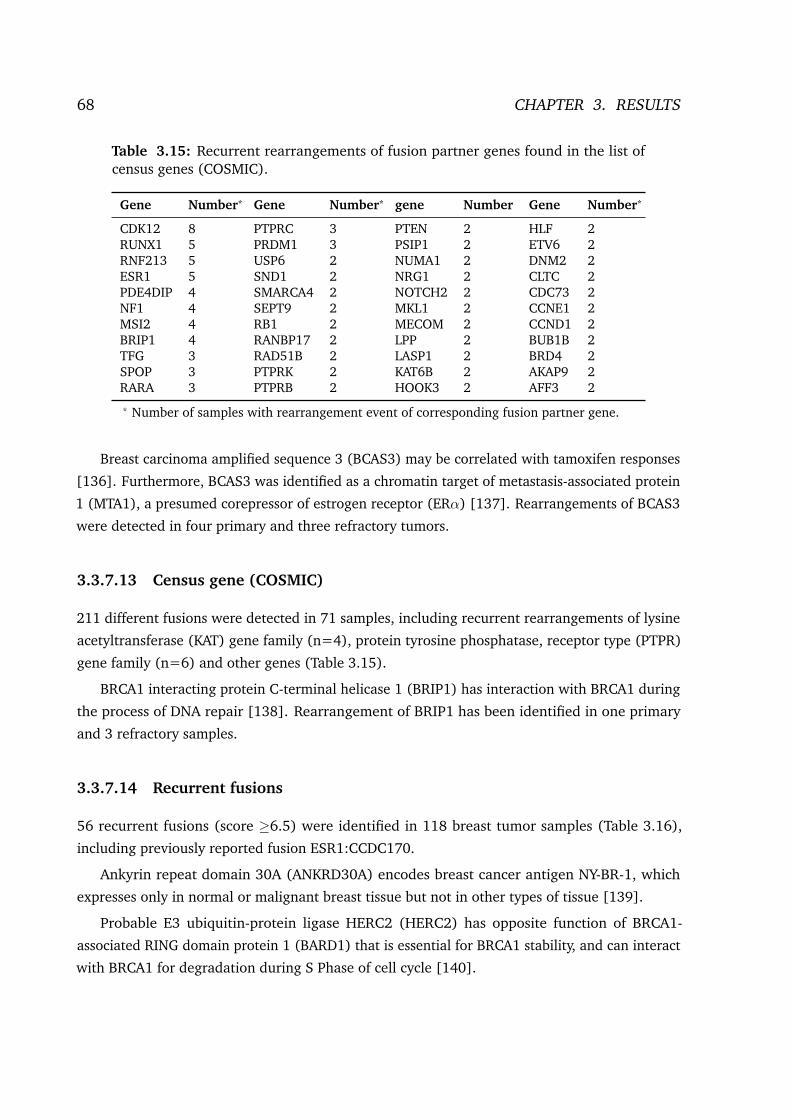
68 CHAPTER 3. RESULTS
Table 3.15: Recurrent rearrangements of fusion partner genes found in the list ofcensus genes (COSMIC).
Gene Number* Gene Number* gene Number Gene Number*
CDK12 8 PTPRC 3 PTEN 2 HLF 2RUNX1 5 PRDM1 3 PSIP1 2 ETV6 2RNF213 5 USP6 2 NUMA1 2 DNM2 2ESR1 5 SND1 2 NRG1 2 CLTC 2PDE4DIP 4 SMARCA4 2 NOTCH2 2 CDC73 2NF1 4 SEPT9 2 MKL1 2 CCNE1 2MSI2 4 RB1 2 MECOM 2 CCND1 2BRIP1 4 RANBP17 2 LPP 2 BUB1B 2TFG 3 RAD51B 2 LASP1 2 BRD4 2SPOP 3 PTPRK 2 KAT6B 2 AKAP9 2RARA 3 PTPRB 2 HOOK3 2 AFF3 2
* Number of samples with rearrangement event of corresponding fusion partner gene.
Breast carcinoma amplified sequence 3 (BCAS3) may be correlated with tamoxifen responses
[136]. Furthermore, BCAS3 was identified as a chromatin target of metastasis-associated protein
1 (MTA1), a presumed corepressor of estrogen receptor (ERα) [137]. Rearrangements of BCAS3
were detected in four primary and three refractory tumors.
3.3.7.13 Census gene (COSMIC)
211 different fusions were detected in 71 samples, including recurrent rearrangements of lysine
acetyltransferase (KAT) gene family (n=4), protein tyrosine phosphatase, receptor type (PTPR)
gene family (n=6) and other genes (Table 3.15).
BRCA1 interacting protein C-terminal helicase 1 (BRIP1) has interaction with BRCA1 during
the process of DNA repair [138]. Rearrangement of BRIP1 has been identified in one primary
and 3 refractory samples.
3.3.7.14 Recurrent fusions
56 recurrent fusions (score ≥6.5) were identified in 118 breast tumor samples (Table 3.16),
including previously reported fusion ESR1:CCDC170.
Ankyrin repeat domain 30A (ANKRD30A) encodes breast cancer antigen NY-BR-1, which
expresses only in normal or malignant breast tissue but not in other types of tissue [139].
Probable E3 ubiquitin-protein ligase HERC2 (HERC2) has opposite function of BRCA1-
associated RING domain protein 1 (BARD1) that is essential for BRCA1 stability, and can interact
with BRCA1 for degradation during S Phase of cell cycle [140].

3.3. FUSION GENES IN DIFFERENT TUMOR ENTITIES 69
Table 3.16: Recurrent fusions in 118 breast tumor samples (n=56, score ≥6.5).
Gene1 Gene2 Recurrence Gene1 Gene2 Recurrence
ATP8A2P1 ATP8A2 28 TRMT2A OR2J3 2ATP8A2P1 ANKRD30A 17 TPTE2P5 RP11-64P12.8 2HERC2 C11orf72 8 TMC2 PRCP 2ZNF761 TMEM8B 7 SYN3 ACOT13 2ZNF761 GULP1 7 STXBP4 ACOX1 2WDR70 NXPH1 7 SSBP2 DHFR 2RP11-20F24.4 ANKRD30A 7 SRSF1 CHN2 2MCFD2 HSD17B4 7 SOX5 ELF1 2RP11-20F24.4 ATP8A2 6 SKAP1 CA10 2NAV3 ANKRD30A 6 SEPT7P2 KAT7 2ITGB5 GOLM1 5 SECISBP2L MTR 2TTC6 MIPOL1 4 RP11-182J1.12 GOLGA6A 2IKZF2 AC079610.1 4 RP11-167N24.6 ACSS3 2IBTK CERS5 4 RP11-159D12.5 CHN2 2ESR1 CCDC170 4 RIMS2 C6orf203 2WDPCP PDZD9 3 PTPN20B BMS1P2 2UBXN2A TARBP1 3 PSIP1 MIR5007 2TPTE2P5 TPTE2 3 NPLOC4 HLF 2THSD4 CYP27C1 3 NADSYN1 C20orf94 2THBS1 RP11-624L4.1 3 MTMR4 CDR2L 2TFG GPR128 3 LUZP2 ELP4 2SH3D19 LRBA 3 HERPUD2 ASTN2 2LGMN CDC14A 3 HERPUD2 AC007349.7 2ZPLD1 NFKBIZ 2 EXOC7 CDR2L 2ZNF512B PDE1C 2 DISP1 C10orf68 2WHAMM RP11-752G15.9 2 CHODL ASTN2 2USP32 BCAS3 2 CCDC74A AC093838.7 2UBC UBB 2 ATP8A2 ANKRD30A 2
Note: The order of fusion partner 5′ and 3′ is ignored to simplify comparison. Fusions labeled withgreen color are from paired B2HF T1 & B2HF M1, with labeled blue color are from paired 0E5B T1 &T2VO M1 and labeled with red color are from paired DMG3 T1 & DMG3 M1.
Fusion MCFD2:HSD17B4 was not verified by Sanger sequencing in one primary tumor
(AC72). It, however, turns out that a novel/non-annotated transcribed region locates upstream of
HSD17B4 (Suppl. Figure S5). Interestingly, the novel expressed region directly connects to the
second exon of HSD17B4 instead of the first exon, indicating that this combination may result
in a new isoform of HSD17B4 in sample AC72. The other six refractory tumors with predicted
rearrangement of HSD17B4 also express in the novel region.
3.3.7.15 Fusions related to tamoxifen and estrogen metabolism
Tamoxifen can be metabolized by cytochrome P450 (CYP) and flavin-containing monooxy-
genase (FMO), and the inactivation of tamoxifen and its metabolites are via various UDP-

70 CHAPTER 3. RESULTS
glucuronosyltransferase (UGT) and sulfotransferase (SULT) (Suppl. Figure S8) [141]. Rear-
rangements of CYP genes were identified in two primary and four refractory tumors. Fusions
FMO5:PRPF3 and ADAMTS12:UGT3A2 were found in one primary and one refractory tumor,
respectively. In addition, fusion EIF2AK2:SULT6B1 was detected in one refractory tumor.
In estrogen metabolism, CYP, SULT and UGT are involved (Suppl. Figure S7) [142]. Fur-
thermore, hydroxysteroid (17-Beta) dehydrogenase 1 (HSD17B1) participates in converting
androstenedione to testosterone. A newly expressed region located upstream of HSD17B4 was
mentioned before.
3.3.7.16 Potential fusion proteins
Not all fusion transcripts could be translated into proteins due to lack of an open reading frame
or an out-of-frame fusion. Among the high-confidence fusion genes, confFuse can further identify
a reliable subset (labeled precious, inter-chromosome) which are predicted to be able to produce
fusion proteins, especially for those with high number of supporting reads and abnormal exon
expression before and after fusion boundary. In some ideal cases, dramatically different exon
expression before and after fusion boundary can be observed in IGV plot, showing strong evidence
supporting a generated fusion protein (Figure 3.27 and Figure 3.28). 20 fusions harboring >40
split reads and >30 spanning reads are given in Table 3.17. Recurrent fusion protein MYB:NFIB
has been previously reported in carcinomas of the breast and head and neck [37].
Table 3.17: Potential fusion proteins (inter-chromosome) identified by confFusein 118 breast tumor samples.
5′ gene 3′ gene Sample ID 5′ gene 3′ gene Sample ID
ACER3 GOLGA7 ZQC5 T1 MAP2K4 IFT122 SR1R M1ACSF3 MLEC 8HNA T1 MYB NFIB Q4W1 T1ADAM9 PPFIA1 7DTJ T1 NEMF LAMA4 EDTK T1C16orf72 RALGAPA2 I4ZX T1 PFKFB2 CEP192 HMXT T1CLTC PDE3B 2RR2 T1 PPP1R12B KCNMB4 TW0Z T1EPB41L5 POLB I4ZX T1 PTK2 MMP1 TC6T T1ERO1L PDSS2 EDTK T1 RPS6KB1 CAMSAP2 Q6FY T1FAM135A SLC35E3 F7FD M1 SLC25A42 CCT6B LRU2 M1FBXL4 RP4-604K5.1 QYXQ M1 TMEM189 PRKCE TX2S T1FOXJ3 SESN1 2RR2 T1 UBAP2 ELOVL2 DMG3 M1
Fusions of more than 40 split reads and 30 spanning reads are shown (n=20). Fusionslabeled with precious in confFuse output are inter-chromosome and open reading framepreserved. Fusion protein MYB:NFIB has been reported in carcinomas of the breast andhead and neck [37].
Another set of likely fusion proteins were selected by >40 split reads, >30 spanning reads
and gene distance >1 mb (intra-chromosome and score=9.5). In total, 43 different potential

3.3. FUSION GENES IN DIFFERENT TUMOR ENTITIES 71
Figure 3.27: Example of fusion MYB:NFIB leading to abnormal exon expression in 5′ fusionpartner in one triple negative breast tumor (Q4W1 T1). The possible DNA breakpoint maylocate between the last two exons of MYB because the last exon expresses much lower thanthe second last exon. The predicted fusion MYB:NFIB is very likely to produce a fusionprotein.

72 CHAPTER 3. RESULTS
Figure 3.28: Example of fusion (PTK2:MMP1) leading to abnormal exon expression in 3′
fusion partner in one breast tumor (TC61 T1). Expression of the first exon is much lowerthan the second one, indicating that the possible DNA break point may locate between thefirst and the second exon of MMP1.
fusion proteins under this criteria were identified in 11 refractory and 17 primary tumor samples
(Table 3.18). Two potential fusion proteins FMO5:PRPF3 and RNF43:HEATR6 were exemplified
in Figure 3.29. Remarkably differential exon expression before and after fusion boundary in both
fusion partners can be observed in IGV plot.
3.3.7.17 Fusions in paired primary-refractory breast tumors
In total, five paired primary-refractory breast tumor samples were analyzed. Three pairs harbor
recurrent fusions which were mentioned above in Table 3.16. Recurrent fusion genes were not
identified in these five refractory tumors. However, six recurrent fusion partners were detected in
primary-refractory pairs, including STXBP4, PPM1D, NPLOC4, LRBA, ELOVL2 and BCAS3.
3.3.8 Fusion features across entities
Some tumor entities have specific fusions such as TMPRSS2:ERG in prostate cancer and IG:MYC
in lymphoma. Interestingly, different genomic distributions of fusion genes across tumor entities
have been identified (Figure 3.30), indicating that fusion genes are not randomly distributed in a
specific tumor entity.

3.3. FUSION GENES IN DIFFERENT TUMOR ENTITIES 73
Table 3.18: Potential fusion proteins (intra-chromosome) identified by confFusein 118 breast tumor samples (n=43).
5′gene 3′ gene Sample ID 5′gene 3′ gene Sample ID
ACACA BECN1 AC72 T1 KIF13B PTK2 X0Z1 T1ANO1 ARL2 T6Z1 M1 MED13L PRKAB1 L50R T1ARHGAP23 MSI2 cfd2f24 MYO1D ADORA2B EDTK T1BRD4 NFIX Y5G9 T1 NDUFC2 PPFIA1 DR8V T1CDC42BPA ASTN1 Q6FY T1 NUP133 CDC42BPA Q6FY T1CDC42BPA TDRD5 Q6FY T1 PCBD1 KCNMA1 L50R T1CIR1 OSBPL6 TX2S T1 RAB22A ACOT8 2S2Q T1CTPS2 SCML2 HMXT T1 RB1 ENOX1 8HNA T1DDB1 ORAOV1 L50R T1 RNF43 HEATR6 2RR2 T1DOCK5 ADAM32 WHDD M1 RPRD2 ACP6 TW0Z T1EIF3H CSMD3 2RR2 T1 RPRD2 GJA5 TW0Z T1ERO1L MYH6 EDTK T1 SHANK2 LRP5 ZQC5 T1FAM3B TRAPPC10 X0Z1 T1 SND1 CASD1 46DP M1FMO5 PRPF3 HY35 T1 TADA2A MSI2 b9b21b9FREM2 RB1 TX2S T1 TAOK1 C17orf79 8MNH T1GLS HAT1 HMXT T1 TBCD USP36 cfd2f24HELZ ACSF2 cfd2f24 TMEM104 PRKCA F11Y T1HELZ GDPD1 2RR2 T1 UQCRC1 RBM6 RQX5 M1HSPD1 NCKAP1 cfd2f24 UTP18 PIP4K2B QYXQ M1INPP5A RASGEF1A 46DP M1 WWP1 CSMD3 35XC M1ITGB5 PDIA5 SR1R M1 YIPF1 ROR1 f1ae704KDM2A MS4A14 JVRW M1
Fusions were chosen by >40 split reads, >30 spanning reads, gene distance >1 mb(intra-chromosome) and score=9.5 (n=43).

74 CHAPTER 3. RESULTS
b) FMO5:PRPF3
a) RNF43:HEATR6
3’ 5’
3’ 5’
3’ 5’
5’ 3’
Figure 3.29: Examples of potential fusion proteins (intra-chromosome) in two primarybreast tumors. Fusion boundaries were labeled with red dash line.

3.3. FUSION GENES IN DIFFERENT TUMOR ENTITIES 75
Chromosome 2 and chromosome 17 are the hot spots of fusion genes for CLL and breast
cancer, respectively. Chromosome 12 is hot spot for both GBM and sarcoma. In addition,
chromosome 2 and 6 are hot spots of fusions in lymphomas, and chromosome 19 and 21 in
prostate cancer.
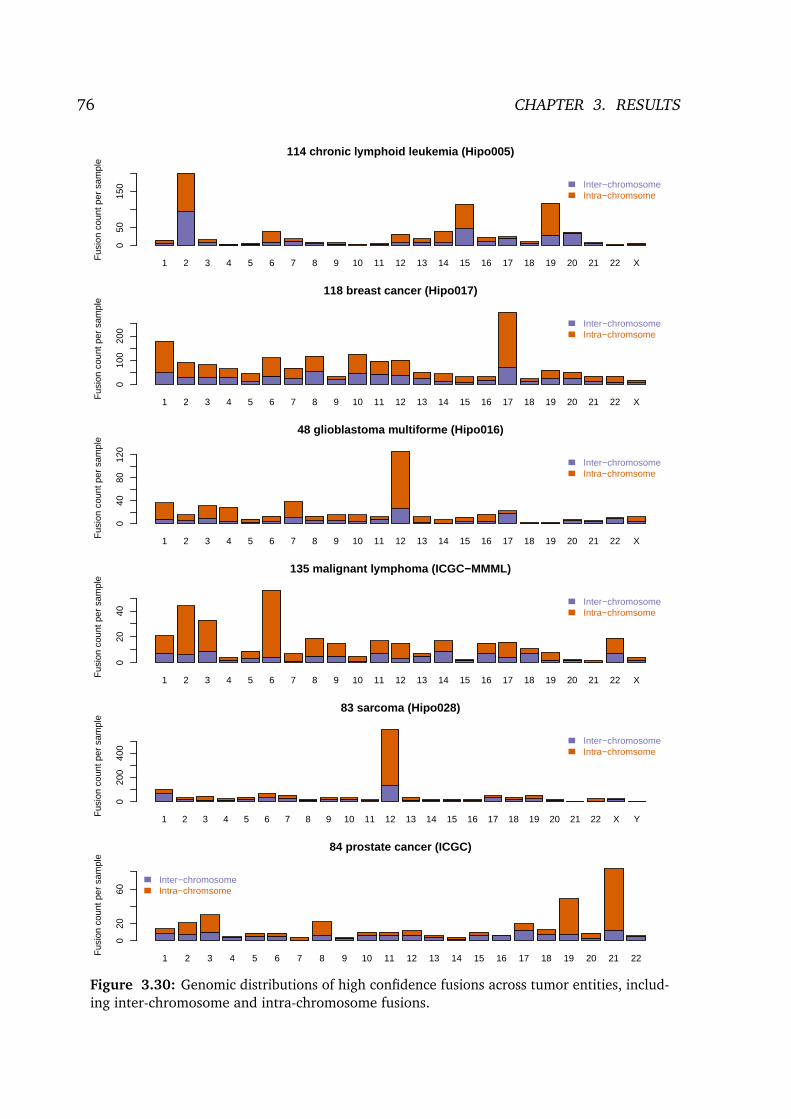
76 CHAPTER 3. RESULTS
1 2 3 4 5 6 7 8 9 10 11 12 13 14 15 16 17 18 19 20 21 22 X
114 chronic lymphoid leukemia (Hipo005)
Chromosome
Fus
ion
coun
t per
sam
ple
050
150 Inter−chromosome
Intra−chromsome
1 2 3 4 5 6 7 8 9 10 11 12 13 14 15 16 17 18 19 20 21 22 X
118 breast cancer (Hipo017)
Chromosome
Fus
ion
coun
t per
sam
ple
010
020
0
Inter−chromosomeIntra−chromsome
1 2 3 4 5 6 7 8 9 10 11 12 13 14 15 16 17 18 19 20 21 22 X
48 glioblastoma multiforme (Hipo016)
Chromosome
Fus
ion
coun
t per
sam
ple
040
8012
0
Inter−chromosomeIntra−chromsome
1 2 3 4 5 6 7 8 9 10 11 12 13 14 15 16 17 18 19 20 21 22 X
135 malignant lymphoma (ICGC−MMML)
Chromosome
Fus
ion
coun
t per
sam
ple
020
40
Inter−chromosomeIntra−chromsome
1 2 3 4 5 6 7 8 9 10 11 12 13 14 15 16 17 18 19 20 21 22 X Y
83 sarcoma (Hipo028)
Chromosome
Fus
ion
coun
t per
sam
ple
020
040
0
Inter−chromosomeIntra−chromsome
1 2 3 4 5 6 7 8 9 10 11 12 13 14 15 16 17 18 19 20 21 22
84 prostate cancer (ICGC)
Fus
ion
coun
t per
sam
ple
020
60
Inter−chromosomeIntra−chromsome
Figure 3.30: Genomic distributions of high confidence fusions across tumor entities, includ-ing inter-chromosome and intra-chromosome fusions.
Chapter 4
Discussion and outlook
4.1 Fusion gene detection
4.1.1 ConfFuse performance
A great number of fusion detection tools have been recently published. All the tools claim that
they have better performance compared to alternative tools based on their individual data set.
These tools may have bias towards individual synthetic data, specific cell line or tumor data
(e.g. limited number of different tumor entities or different cell lines). Furthermore, even after
filtering step using their methods, these tools still generate a large number of predicted fusion
transcripts, most of which may be false positives or of low biological interest (e.g. precursor
read-through transcripts). Therefore, I developed confFuse, a new scoring algorithm, which can
be applied on paired-end RNA-seq across tumor entities with both high true positive rate and
high detection accuracy.
Based on the previous experience and common usage in the scientific literature such as
number of citations (Chapter 1.1), deFuse was chosen as basis for developing additional filtering
algorithm for downstream analysis. The scoring algorithm confFuse assigns each putative
fusion transcript a confidence score based on deFuse reports. Compared with alternative tools
(soapFuse, fusionMap and deFuse) based on 96 published RNA-seq samples from different tumor
entities, confFuse can significantly reduce the number of fusion candidates (301 high-confidence
candidates from 8083 predicted fusion genes) and retain high detection accuracy (recovery rate
85.7%) (Figure 3.8).
Furthermore, a screen of 22 GBM tumors identified 242 high-confidence fusions from 6,018
unfiltered deFuse candidates. Approximately 62% (150/242) were either experimentally val-
idated or confirmed by DNA-seq. In addition, approximately 72% of high-confidence fusions
77
78 CHAPTER 4. DISCUSSION AND OUTLOOK
(17/24 from 849 unfiltered deFuse predictions in 11 published prostate tumors) were confirmed
by FISH validation, DNA-seq or by the occurrence of the well known ETS fusions in prostate
cancer. Another analysis of 27 INFORM tumors with 27 previously validated fusions identifies
94 high-confidence fusions, 25 of which are previously verified, resulting in a recovery rate of
approximately 93% (25/27).
In three breast tumor samples, 100% true positive rate for high-confidence fusion candidates
(score ≥8) was achieved. Furthermore, 69% of medium-confidence candidates (6.5≤ score ≤7.5)
and 30% of low-confidence candidates (0.5≤ score ≤6) were experimentally verified. While
applying confFuse on three CLL samples, 15 of 18 candidates were successfully validated.
In summary, confFuse can reliably select high-confidence fusion genes that are more likely to
be biologically relevant, achieving both high validation rate and high detection accuracy, while
reducing the number of candidates to a restricted number for validation.
4.1.2 Problems with deFuse
DeFuse generates several unique features which are not available in some tools, such as fusion
transcripts which are very useful in designing primers for experimental validation. It has the
highest fusion detection accuracy in terms of recovery rate based on different tumor RNA-
seq data (Figure 3.8 and Figure 3.12). However, deFuse is not perfect and still has some
problems/disadvantages.
• Failed runs
For some unknown reasons, deFuse could not be applied on some samples. Currently, several
hundreds of RNA-seq samples were successfully processed by deFuse but some samples failed to
run, including two GBM and four breast cancer samples. Additional efforts would be necessary
to solve this problem in the future.
• Computational resource
DeFuse demands high computer power. For example, it requires approximately two to three
days for processing 200 million RNA-seq paired-end reads. In some unusual cases, deFuse took
several hundreds hours (walltime) and used several hundreds GB memory running in a ten-core
computer (Suppl. Figure S6). Furthermore, deFuse requires large disk storage (typically more
than 250GB) for running a sample of 200 million paired-end reads. Due to the high computational
resource requirement, deFuse may have disadvantages in practice such as clinical application.
• Order of fusion gene partners
For the same fusion gene pair, deFuse reports different 5′ fusion partners. For example, deFuse
may predict fusion transcripts 5′-A-B-3′ and 5′-B-A-3′ for gene A and B. In order to identify the
right order of fusion partners, further in silico validation using complimentary tools such as BLAT

4.2. FUSION GENES IN DIFFERENT TUMOR ENTITIES 79
is necessary.
• Visualization of fusion gene
DeFuse does not provide SAM/BAM files as output, making it impossible to visualize reads
mapped to fusion genes in IGV and making it unable for further downstream analysis.
4.1.3 Possible improvement
Currently, 23 features were used in confFuse (Chapter 2.1). The weightings of features are mostly
based on biological importance of fusion structures and partially based on supervised learning
by observation. Further systematic analysis of these features and other new features may be
useful in improving the scoring algorithm. The artefact list should also be improved to reduce
the number of false negative candidates. Additional annotation of predicted fusion transcripts
such as structure simulation and functional domain should be considered too.
Published paired-end RNA-seq data with validated fusions are a very good reference resource
for improving fusion detection methods. More than one hundred validated fusion genes were
included in this thesis. Adding more samples with experimentally validated fusions may help in
systematic optimization of the confFuse scoring scheme.
DeFuse performs better than other tools in terms of fusion accuracy detection. It, however,
still could not detect all potential fusion genes. There may be a way to improve the fusion
detection sensitivity by combining confFuse with other different tools such as fusionMap.
4.2 Fusion genes in different tumor entities
ConfFuse was applied on several unpublished data set from HIPO projects and ICGC projects.
Several well-known fusion genes have been identified such as SS18:SSX1 in synovial sarcoma,
FUS:DDIT3 in myxoid liposarcoma, IGH:MYC in lymphoma, C11orf95:RELA and YAP1:MAMLD1
in ependymoma as well as SEC22B:NOTCH2 and ESR1:CCDC170 in breast cancer, which provide
much more evidence supporting that confFuse method performs well across different tumor
entities.
Furthermore, a large number of novel fusion candidates has been detected. Biological func-
tions of these novel identified fusion genes could be further studied after successful experimental
validation. Based on previous studies, some fusion genes were observed in specific tumor entities,
such as SS18:SSX1 in sarcoma and TMPRSS2:ERG in most of prostate cancer, C11orf95:RELA
and YAP1:MAMLD1 in ependymoma, indicating that these fusions may be driver mutations and
have clinical relevance. Fusion genes are not randomly distributed across chromosomes and hot

80 CHAPTER 4. DISCUSSION AND OUTLOOK
spots of fusion genes in six tumor entities have been identified (Chapter 3.30), proposing that
there are specific fusion-driven diseases.
In HIPO-005 CLL samples, several recurrent fusion genes have been identified and validated
such as CXCR4:PTMA. Interestingly, expression of CXCR4 significantly associates with fusion
CXCR4:PTMA. Higher expression of CXCR4 was observed at RNA level in CLL samples with
fusion CXCR4:PTMA. Another interesting finding is a non-annotated expressed region located
upstream of CXCR4. It has been demonstrated that CXCR4 plays an important role in heterotypic
adherence to bone marrow stromal cells [143]. Several receptor antagonist have been used to
inhibit CXCR4 [144]. Those new finding may lead to more comprehensive understanding of
CXCR4 at genetic level. Although 15 fusion candidates have been experimentally verified, the
biological functions of them are still unclear. To uncover whether those fusions are CLL specific,
healthy blood RNA-seq samples will be analyzed for comparison in the future.
After understanding the biological functions of fusion genes, it may go further to clinical
application. Currently, several drugs have been applied on targeting gene fusions in malignant
disorders, such as ALK fusion in non-small-cell lung carcinoma as well as BCR:ABL1 in chronic
myelogenous leukemia and acute lymphoblastic leukemia [4].
4.3 Biomarker discovery in breast cancer
4.3.1 CNV
Comparison of copy number variance in primary and refractory breast tumors shows difference
in some regions including several important genes such as CDKN2A and ESRRG (Figure 3.1).
Further biological interpretation of the different CNVs between primary and refractory tumors
are necessary to address the question of treatment resistance. As mentioned in the introduction
(Chapter 1.4), more than ∼80% fusion transcripts associated with CNV based on nine tumor
entities from TCGA data. Integration of CNV and fusion genes based on breast cancer from
HIPO-017 will be analyzed in the future.
4.3.2 SNV/Indel
Interestingly, three MAST mutations (p.E1544K in MAST2, p.S900C in MAST3 and p.G2043V
in MAST4) were identified only in three refractory tumors but MAST rearrangement were not
detected, while functional rearrangements of MAST kinase have been reported in breast cancer
[39].
Mutations of CACNA family genes, which are involved in MAPK signalling pathway, are highly

4.3. BIOMARKER DISCOVERY IN BREAST CANCER 81
prevalent in refractory tumors (24%, 12/50) compared to primary tumor (∼2%, 1/46) (Table
3.1). In 11 published ER-positive metastatic breast cancer cases, three patients harbored CACN
mutations (∼27%, 3/11), including CACNA1A, CACNA1F and CACNA1E in one case, as well
as CACNA1E and CACNB1 in two other cases [7]. Interestingly, CACNA2D3 associates with
steroid receptor co-activator-3 (SRC-3) and ESR1 in a chromatin immunoprecipitation-based
study [145]. Furthermore, rearrangements of CACNA were identified in one primary and two
refractory tumors.
In addition, mutations of PLCB family genes involved in estrogen signalling pathway, were only
identified in refractory tumors (8%, 4/50). Receptor-mediated activation of PLC, including PLCB1-
4, results in phosphatidylinositol 4,5-bisphosphate (PIP2) hydrolysis, leading to inactivation of
the TRPM7 channel [146]. TRPM7 is required for metastasis formation in a mouse xenograft
model and highly expressed TRPM7 can predict poor outcomes in breast cancer patients [147].
Mutations of TRPM1 and TRPM6 were detected in two refractory tumors. Beside single point
mutations in PLCB family genes, rearrangements of them have been only identified in three
refractory samples. The fusions TRPM7:LEO1 and TRPM7:MAPK6 were identified in a refractory
tumor. Higher number of mutations in estrogen signalling pathway were observed in refractory
tumor samples (Figure 3.5), which may indicate that patients acquired those mutations during
endocrine treatment. Based on these findings, I came up with the hypothesis that mutations of
CACNA and PLCB family genes may be a novel acquired resistance mechanism in addition to
ESR1 mutation.
4.3.3 Fusion-related genes
• ESR1 and GRB2
Several ESR1 rearrangements have been reported, including ESR1:YAP1, ESR1:POLH,
ESR1:AKAP12 and ESR1:CCDC170 in breast cancer [88]. Among 118 breast cancer samples,
three refractory tumors and one primary tumor harbor ESR1:CCDC17. Additionally, one novel
fusion CDH8:ESR1 was identified in a refractory tumor. Fusion ESR1:CCDC170 may engage
GRB2-associated-binding protein 1 (GAB1) to enhance cell motility and downstream growth factor
signalling and to reduce endocrine sensitivity [40]. Three fusions (GRB2:TSEN54, GRB2:RNFT1
and validated GRB2:SEPT9) were identified in one refractory and two primary tumors. Another
fusion GRB7:KLHL11 was detected in a refractory sample. Both GRB2 and GRB7 contain SRC
homology 2 (SH2) domain which can interact with estrogen receptor [148].
• RPS6KB1
As mentioned above (Chapter 3.3.7.9), RPS6KB1 is involved in various diseases and has in-
teraction with ESR1 and tamoxifen in breast cancer. Furthermore, it has been reported that

82 CHAPTER 4. DISCUSSION AND OUTLOOK
mTORC1 regulates transcription and translation through interaction with eukaryotic translation
initiation factor 4E-binding protein 1 (EIF4EBP1) or RPS6KB1 [149]. Fusion SGCZ:EIF4EBP1
was found in one refractory tumor and rearrangements of RPS6KB1 have been identified in two
primary and three refractory tumors, including RPS6KB1:VMP1 and potential fusion protein
RPS6KB1:CAMSAP2. In addition, fusion of RPS6KA1 was found in one primary tumor and
point mutation of RPS6KB2 was detected in a refractory tumor. Furthermore, another muta-
tion of RPS6KB2 was reported in 1 of 11 hormone resistant metastatic breast tumors [7] and
recurrent fusion RPS6KB1:VMP1 was identified in TCGA database (4 of 1019 primary tumors)
[72]. Distance between VMP1 and RPS6KB1 on chromosome 17 is approximately 60 kb. These
novel findings together with previous reports as mentioned in Chapter 3.3.7.9 may suggest that
aberrations of RPS6KB1 may play a role in breast cancer.
• STXBP4
Five refractory tumors and one primary tumor harbor different rearrangements of syntaxin
binding protein (STXBP4), including fusion ACOX1:STXBP4 identified in paired tumors (B2HF T1
and B2HF M1). STXBP4, also known as synip, can be phosphorylated by AKT2 to regulate
docking/fusion of glucose transporter 4 (GLUT4)-containing vesicles on the plasma membrane
[150]. It has been reported that 17β-estradiol enhances estrogen receptor dependent rapid
signalling, leading to increased glucose uptake, which may provide energy demands for high
proliferation in MCF-7 breast cancer cells [151]. This suggests that aberration of STXBP4 may
affect the glucose uptake which is an essential step for cell proliferation.
• Metabolism-related genes
HSD17B1, one of 17β-hydroxysteroid dehydrogenase (HSD17B), is involved in estrogen
metabolism by converting estrone to estradiol [152]. Single point mutations of HSD17B11
(p.T252A) and HSD3B1 (p.G141A) were detected in one primary and one refractory tumor, re-
spectively. Recurrent HSD17B12 mutations (p.S251F and p.G121V) were found in two refractory
tumors.
Several gene families participate in metabolism of tamoxifen and estrogen, including CYP,
SULT, FMO, UGT (Suppl. Figure S7 and Figure S8). Five CYP mutations were detected in five
primary tumors (5/46) and six different CYP mutations were detected in five different refractory
tumors (5/50). SULT and UGT mutations were identified in two primary and three refractory
tumors (Suppl. Table S12). In addition, rearrangements of CYP were identified in six refractory
tumors and two primary tumors, and two refractory tumors harbor rearrangements of SULT
and UGT. One potential fusion protein FMO5:PRPF3 (Figure 3.29.b) was identified in a primary
tumor.
Solute carrier (SLC) transporters play an important role in cancer therapy through uptake
of anticancer agents in cancer cells and essential nutrients for tumor growth and survival

4.4. OUTLOOK 83
[112]. Approximately 32% (21/65) refractory and ∼19% (10/53) primary tumors harbor
rearrangements of SLC.
Aromatase inhibitor resistance may be agent-selective as tumors can still respond to other
endocrine therapies such as a different aromatase inhibitor class, tamoxifen or fulvestrant [88].
Based on the aberration of genes involved in estrogen and tamoxifen metabolism, I propose
the hypothesis that abnormality of metabolism is a possible mechanism of endocrine therapy
resistance.
4.4 Outlook
The NGS technologies, especially paired-end RNA-seq, provide a platform to uncover fusion
genes. Although a great number of fusion detection tools have been developed in the last
few years, a perfect tool which can detect all fusion genes in a sample is still not available.
DeFuse performs better than several alternative tools but could still be improved in term of
fusion detection accuracy. ConfFuse, as a downstream filtering method mainly dependent on
deFuse, can dramatically reduce the total number of predicted fusion transcripts with comparable
detection accuracy. It may be possible to increase the fusion detection accuracy by ensemble of
different tools, while remaining comparable true positive rate in resulted fusion candidates.
Fusion genes have been identified as driver mutations in several tumor entities, indicating
that there may be fusion-specific driven tumor. In this thesis, hundreds of novel fusion genes
have been identified in different tumor entities, including more than 60 highly reliable predicted
fusion proteins in breast cancer. Further functional characterization of fusion genes should be
carried out to understand how they regulate or interfere cellular processes and which targets they
interact with. Understanding fusion gene function and their importance in cancer will provide
important insights to discover novel biomarkers for cancer treatment or patient stratification.

84 CHAPTER 4. DISCUSSION AND OUTLOOK

Supplementary
85

86
●
●●
●
●
●
5.0e
+07
1.0e
+08
1.5e
+08
2.0e
+08
Number of paired−end reads
205978644
96081958
2426631732294233.5
54677522
14947391
Figure S1: The number of read pairs in 96 published paired-end RNA-seq samples fromseven different studies.
Table S1: Sequenced-read length of seven published studies.
Entities RNA-seq paired-end read length (bp)
Lung cancer liver metastasis 2 × 101Biphenotypic sinonasal sarcoma 2 × 50Pilocytic astrocytoma 2 × 51Thyroid cancer 2 × 75Ependymoma 2 × 101Lung adenocarcinoma 2 × 101Glioma 2 × 101
Table S2: Validated fusions from 96 paired-end RNA-seq samples in seven published studies.
Sample ID Gene1 Gene2 deFuse confFusescore≥8
fusion-Map
SOAP-Fuse
confFusescore<8
CGGA 1024 PLA2G6 CRYBB1 Y Y Y YCGGA 1026 MLL3 CHGB Y Y N NCGGA 1026 VHL BRK1 Y Y Y YCGGA 1034 SBF2 AP2A2 Y Y Y YCGGA 1034 SCUBE2 RASSF7 Y Y Y YCGGA 1034 SPAG6 CD81 Y Y Y NCGGA 1046-1 TPT1 AADAT Y Y Y YCGGA 1046-1 ZNF197 CHMP2B Y Y Y YCGGA 1049 OGDH CCM2 Y Y Y NCGGA 1049 TPM3 ADAR Y Y Y Y
Continued on next page

87
Table S2 – continued from previous page
Sample ID Gene1 Gene2 deFuse confFusescore≥8
fusion-Map
SOAP-Fuse
confFusescore<8
CGGA 1059 MYO10 MARCH6 Y Y Y YCGGA 1068 PTPRZ1 MET Y Y Y YCGGA 1077 LANCL2 DNAH11 Y Y Y YCGGA 1079 CELA1 BIN2 Y Y N YCGGA 1094 GPR162 CCDC39 Y Y Y NCGGA 1094 SLC6A8 GABRA3 N N Y YCGGA 1109 TACC3 FGFR3 Y Y N YCGGA 1113 XRCC6BP1 CTDSP2 Y Y Y YCGGA 1118 SNTG1 PVRL2 Y Y Y YCGGA 1119 PLAGL2 HCK Y Y Y YCGGA 1170 TSFM CDK4 Y N N Y 7CGGA 1175 DENND5B B4GALNT3 Y Y Y YCGGA 1175 MED13L GRIP1 Y Y Y NCGGA 1234 PODXL BGN Y Y Y YCGGA 1240 VPS29 GLTP Y Y Y YCGGA 1251 CLPSL1 BRPF3 Y Y Y YCGGA 1251 FAM155A COL4A1 Y Y Y YCGGA 1272 SNTG1 PVRL2 Y Y Y NCGGA 1272 ST7 CTTNBP2 N N N NCGGA 1287 PTN DGKI Y Y Y NCGGA 1313 TACC3 FGFR3 Y Y Y YCGGA 1324 CBX3 C15orf57 Y N Y Y 1.5CGGA 1324 KCNC2 CDK17 Y Y Y YCGGA 1329 GPC6 COG3 Y Y Y NCGGA 1329 SERP2 LHFP Y Y Y NCGGA 1329 TCF7L1 KIF1B Y Y Y YCGGA 1329 URI1 SLC6A20 Y Y Y YCGGA 1329 ZMIZ1 MAT1A Y Y Y YCGGA 245 IL1RAP FGF12 Y Y Y YCGGA 274 MTAP C9orf92 Y Y N YCGGA 309 FARP2 DTNB Y Y Y YCGGA 374 FBXO2 CBL Y Y N YCGGA 374 MGAT5 KIAA0825
/C5orf36Y Y Y Y
CGGA 374 TTLL11 FIBCD1 Y Y Y YCGGA 413 SYMPK CLASRP
/SFRS16Y Y Y Y
CGGA 413 TMEM178B AHCYL2 Y Y Y NCGGA 491 RIBC1 HUWE1 Y Y Y YCGGA 493 TGFB1 SAE1 Y Y Y YCGGA 564 ZC3H11A REN Y Y Y YCGGA 578 MRPS28 ASPH Y Y N YCGGA 578 PFKP FRMD4A Y Y Y YCGGA 603 VEZT CORO1C Y Y Y YCGGA 604 SLC26A11 RNF213 Y Y Y YCGGA 616 CPNE5 ANXA6 Y Y Y YCGGA 661 PTPRZ1 MET Y Y Y YCGGA 704 MLH1 IFT80 Y Y N Y
Continued on next page

88
Table S2 – continued from previous page
Sample ID Gene1 Gene2 deFuse confFusescore≥8
fusion-Map
SOAP-Fuse
confFusescore<8
CGGA 796 RAD51C PITPNA Y Y Y YCGGA 802 RXRA NEK6 Y Y Y YCGGA 815 SH3GL1 CHAF1A Y N Y Y 7.5CGGA 842 TACC3 FGFR3 Y Y Y YCGGA 859 LZTR1 BCR Y Y Y NCGGA 878 NFATC3 CPNE2 Y Y Y YCGGA D27 SLC26A11 RNF213 Y Y Y NCGGA D36 SHISA5 APEH Y Y Y NCGGA D64 PTPRZ1 MET Y Y Y YT22 NTRK3 ETV6 Y Y Y NT23 BRAF AGK N N Y YT24 NTRK3 ETV6 Y Y Y YT25 PPARG CREB3L2 Y Y Y YT5 RET NCOA4 Y Y Y YAK55 KIF5B RET Y Y Y YSRR1028024 PAX3 MAML3 Y Y Y YLC C11 UBR4 ATP13A2 Y Y Y YLC C12 KRAS CDH13 N N Y NLC C15 TNFSF11 APLP2 Y Y Y YLC C16 MAN1A2 IGSF3 Y Y Y YLC C17 TXNRD1 GPR133 Y Y Y YLC C24 RAB21 FRS2 N N Y NLC C25 ZFYVE9 CGA Y Y Y YLC C25 UBE2E1 ASCC3 N N Y YLC C26 TCTEX1D4 ARHGEF16 Y N Y Y 7LC C36 SLC16A7 MUCL1 Y Y Y YLC S11 HYOU1 C11orf93 Y Y N NLC S12 NDUFAF6 CMBL Y Y Y NLC S13 FGFR2 CIT Y Y Y YLC S15 XRCC1 MAL Y Y N YLC S18 NMRK2 MIER2 Y Y Y NLC S18 RBM14 FGF3 Y Y N NLC S18 ITGB1BP3 DNM2 N N N YLC S19 MAST4 ERBB2IP Y Y Y YLC S2 RET KIF5B Y Y Y YLC S20 MAP3K3 BCAS3 N N Y YLC S20 SFTPA2 FTL N N Y NLC S20 PECAM1 MAP3K3 N N N NLC S23 MBIP AXL Y Y Y NLC S26 CEP112 BRWD1 Y Y Y NLC S26 EML4 ALK Y Y Y YLC S26 PRKCE MAP4K3 Y Y Y YLC S29 SRSF4 SNRNP40 Y Y Y NLC S35 TTC19 ATPAF2 Y Y Y YLC S38 SCAF11 PDGFRA Y Y Y NLC S38 SPTLC3 MAOA Y Y Y YLC S39 ROS1 CD74 Y Y Y NLC S39 SIPA1L3 LSM14A Y Y Y Y
Continued on next page

89
Table S2 – continued from previous page
Sample ID Gene1 Gene2 deFuse confFusescore≥8
fusion-Map
SOAP-Fuse
confFusescore<8
LC S42 RET KIF5B Y Y Y NLC S42 TRMT11 TPD52L1 Y N Y N 5.5LC S42 UTRN OS9 N N Y NLC S46 MGAT5 HNMT Y Y Y YLC S48 SLC34A2 ROS1 Y Y Y NLC S51 MID1 EDA N N Y YLC S9 ROS1 CCDC6 Y Y Y YICGC PA112 RNF130 BRAF Y Y Y YICGC PA112 RUFY1 TMEM178B Y Y Y NICGC PA134 NTRK2 NACC2 Y Y Y YICGC PA144 CLCN6 BRAF Y Y Y YICGC PA159 QKI NTRK2 Y Y Y YICGC PA58 MKRN1 BRAF Y Y Y YICGC PA82 QKI NTRK2 Y Y Y YICGC PA96 RNF130 BRAF Y Y Y Y11EP21 YAP1 MAMLD1 Y Y Y Y2EP25 YAP1 MAMLD1 Y Y Y Y3EP29 YAP1 MAMLD1 Y Y Y Y3EP45 YAP1 FAM118B Y Y Y N3EP6 YAP1 MAMLD1 Y Y Y Y4EP46 YAP1 MAMLD1 N N Y Y9EP45 YAP1 MAMLD1 Y Y Y Y
Note: The order of fusion partner 5′ and 3′ is ignored to simplify comparison.

90
●
●
●
●
●
●
●
●
●
●
TotalReads MappedReads UniqMappedReads
2e+
083e
+08
4e+
085e
+08
●●
●
●
●
●
●
0e+
002e
+07
4e+
07
●
rRNA reads
●
●
●
●●
●●
●●
●●●
●
●
●
StrandnessRate MappedRate UniqMappedRate
0.80
0.85
0.90
0.95
1.00
●
●
●
Breast tumors in Hipo017 (n=98)
●
●
●
●
0.00
0.04
0.08
0.12
●
rRNA rate
Figure S2: Mapping quality control of 98 breast RNA-seq samples in HIPO-017. It showstotal number of sequencing reads, mapped reads, uniquely mapped reads, ribosome RNAreads and their corresponding rates. In addition, strand-specific rates are shown.

91
●
●
●
●
●
●
●
●
●
●
●
●
●
●
●
●
●
●
●
●
●
●
●
●
●
●●
●
●
●
●
●
●
●
●
●●
●
●
●
●
●
●
●
●
●
●
●
●
●
●
●
●
●
●
●
●
●
●
●
●
●
●
●
●
●
●
●
●
●
●
●
●
●
●
●
●
●
●
●
●
●
●
●
●
●
●
●
●
●
●
●
●
●
●
●
●
●
●
●
●
●
● ●
●
●
●
●
●●
●
●
●
●
●
●
●
●
●
●
●
●
−200 −100 0 100 200
−20
0−
100
010
020
0
Multidimensional scaling (MDS)
Refractory−HDRefractory−USAPrimary−HD
PF9X
FHKD
GN0A
Figure S3: Multidimensional scaling of 122 breast tumor RNA-seq samples, including 24RNA-seq samples from Ellis’s group in USA (blue). The HIPO-017 samples are separated fromthe Ellis’s samples due to using different sequencing protocols, where strand-specific protocolwas used in HIPO-017 and polyA+ protocol was applied on Ellis’s samples. Two samples(PF9X and FHKD) were prepared with old version of library chemistry. One refractory sample(GN0A) was grouped with Ellis’s samples. Normalization was based on DESeq [153].
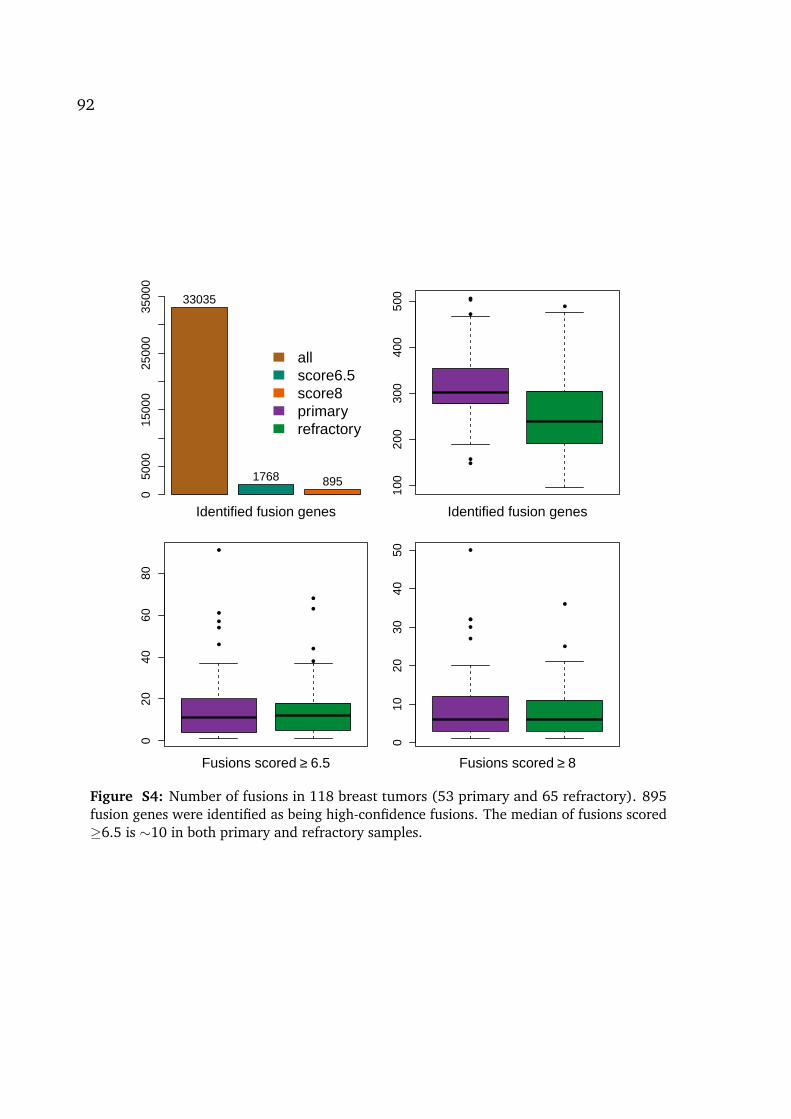
92
050
0015
000
2500
035
000
33035
1768 895
Identified fusion genes
allscore6.5score8primaryrefractory
●
●
●
●
●
●
100
200
300
400
500
Identified fusion genes
●
●
●
●
●
●
●
●
●
020
4060
80
Fusions scored ≥ 6.5
●
●
●●
●
●
●
010
2030
4050
Fusions scored ≥ 8
Figure S4: Number of fusions in 118 breast tumors (53 primary and 65 refractory). 895fusion genes were identified as being high-confidence fusions. The median of fusions scored≥6.5 is ∼10 in both primary and refractory samples.

93
Figure S5: Novel non-annotated region shown in red box in upstream of gene HSD17B4.
Figure S6: Example of required computer resource in running deFuse. Typically, deFuseneeds two to three days for processing 200 million RNA-seq paired-end reads.
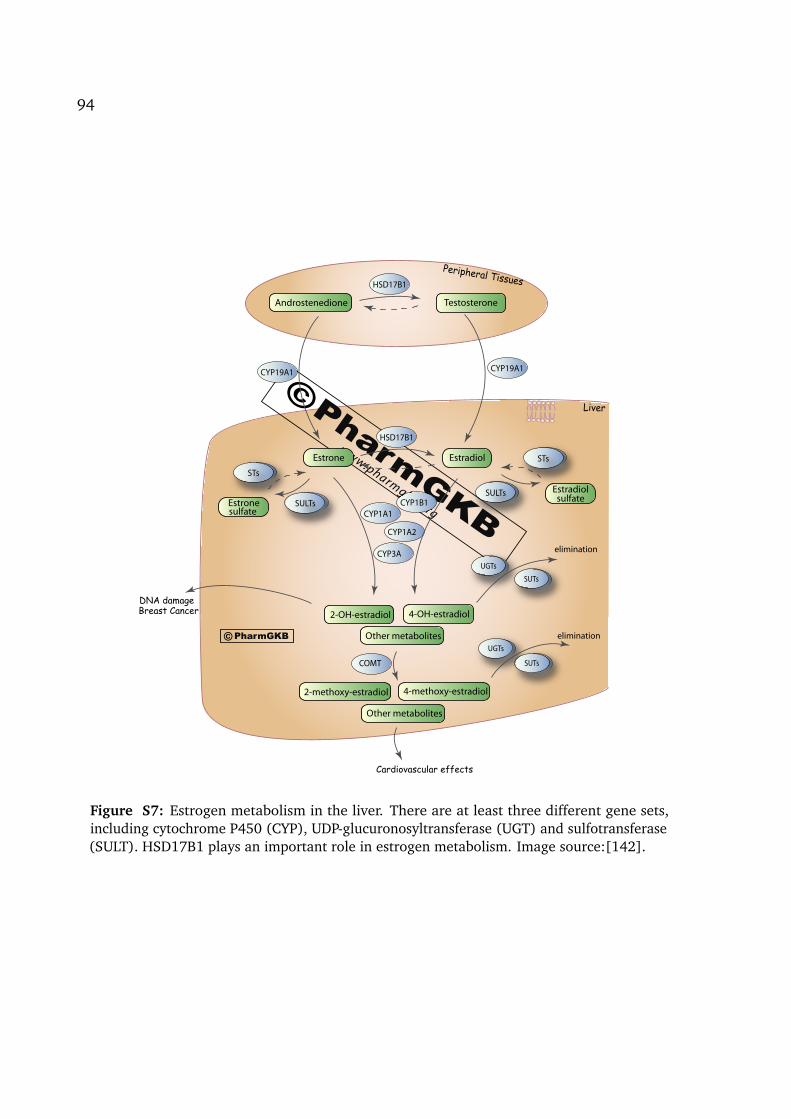
94
PharmGKB
©www.pharmgkb.org
PharmGKB©
Liver
Peripheral Tissues
COMT
CYP3A
CYP1A2
CYP1A1CYP1B1
Estrone Estradiol
EstradiolsulfateEstrone
sulfate
elimination
elimination
UGTs
UGTs
SUTs
SUTs
Breast CancerDNA damage
Cardiovascular effects
CYP19A1CYP19A1
STs
SULTs
HSD17B1
HSD17B1
SULTs
STs
2-OH-estradiol 4-OH-estradiol
Other metabolites
2-methoxy-estradiol 4-methoxy-estradiol
Other metabolites
Androstenedione Testosterone
Figure S7: Estrogen metabolism in the liver. There are at least three different gene sets,including cytochrome P450 (CYP), UDP-glucuronosyltransferase (UGT) and sulfotransferase(SULT). HSD17B1 plays an important role in estrogen metabolism. Image source:[142].

95
PharmGKB
©www.pharmgkb.org
PharmGKB©
Liver Cell
CYP2C19
CYP2D6
CYP2C9
CYP2B6
CYP3A4
CYP2D6N-desmethyl tamoxifen
Endoxifen
Tamoxifen
Target Cell
Antiestrogenic effects
Metabolite Y
Metabolite E
CYP3A4
CYP3A5
CYP3A4
?
?
CYP3A5
CYP3A5
CYP3A4
CYP3A5
N,N-didesmethyl tamoxifen
PharmGKB©
Endoxifensulfate
EndoxifenO-glucuronide
4’-OH-N-desmethyl tamoxifen
Metabolite Eglucuronide
Metabolite Esulfate
Tamoxifen-N-glucuronide
ɑ-OH-tamoxifen
ɑ-OH-tamoxifen-O-glucuronide
Tamoxifen-N-oxide
4’-OH-tamoxifen
4-OH-tamoxifen sulfate
4-OH-tamoxifen-N-glucuronide
4-OH-tamoxifen-O-glucuronide
CYP3A4
CYP1A2
CYP2C19
CYP2C9
CYP2D6
FMO3
FMO1
UGT1A4
CYP3A4
CYP2D6
CYP2B6 SULT1E1
SULT1A1
SULT2A1
UGT1A3
UGT1A4
UGT2B7
UGT1A4
UGT2B15
UGT1A10
UGT1A8
UGT1A8UGT2B7
UGT1A10
SULT1A1
SULT1A1
SULT1E1
CYP2D6CYP2C19
UGTs
Norendoxifen
de-methylation
4-OH tamoxifen
Tamoxifen
N-Desmethyltamoxifen
4-OH tamoxifen
Endoxifen
ABCB1
ABCC2
Figure S8: Tamoxifen metabolism in the liver. There are at least four different genesets involved in the tamoxifen metabolism, including cytochrome P450 (CYP), flavin-containing monooxygenase(FMO), uridine 5′-diphospho-glucuronosyltransferase (UDP-glucuronosyltransferase, UGT) and sulfotransferase (SULT). Image source:[141].
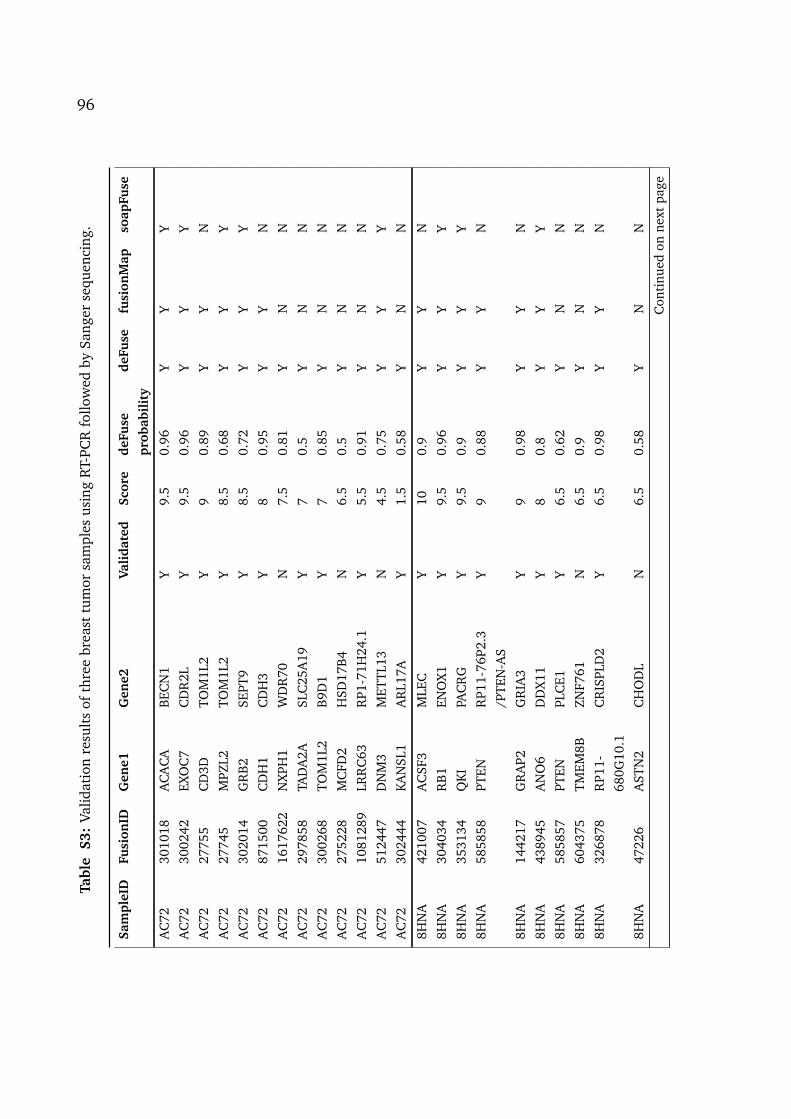
96Ta
ble
S3:
Valid
atio
nre
sult
sof
thre
ebr
east
tum
orsa
mpl
esus
ing
RT-
PCR
follo
wed
bySa
nger
sequ
enci
ng.
Sam
pleI
DFu
sion
IDG
ene1
Gen
e2Va
lida
ted
Scor
ede
Fuse
prob
abil
ity
deFu
sefu
sion
Map
soap
Fuse
AC
7230
1018
AC
AC
AB
ECN
1Y
9.5
0.96
YY
YA
C72
3002
42EX
OC
7C
DR
2LY
9.5
0.96
YY
YA
C72
2775
5C
D3D
TOM
1L2
Y9
0.89
YY
NA
C72
2774
5M
PZL2
TOM
1L2
Y8.
50.
68Y
YY
AC
7230
2014
GR
B2
SEPT
9Y
8.5
0.72
YY
YA
C72
8715
00C
DH
1C
DH
3Y
80.
95Y
YN
AC
7216
1762
2N
XPH
1W
DR
70N
7.5
0.81
YN
NA
C72
2978
58TA
DA
2ASL
C25
A19
Y7
0.5
YN
NA
C72
3002
68TO
M1L
2B
9D1
Y7
0.85
YN
NA
C72
2752
28M
CFD
2H
SD17
B4
N6.
50.
5Y
NN
AC
7210
8128
9LR
RC
63R
P1-7
1H24
.1Y
5.5
0.91
YN
NA
C72
5124
47D
NM
3M
ETTL
13N
4.5
0.75
YY
YA
C72
3024
44KA
NSL
1A
RL1
7AY
1.5
0.58
YN
N
8HN
A42
1007
AC
SF3
MLE
CY
100.
9Y
YN
8HN
A30
4034
RB
1EN
OX
1Y
9.5
0.96
YY
Y8H
NA
3531
34Q
KI
PAC
RG
Y9.
50.
9Y
YY
8HN
A58
5858
PTEN
RP1
1-76
P2.3
/PTE
N-A
SY
90.
88Y
YN
8HN
A14
4217
GR
AP2
GR
IA3
Y9
0.98
YY
N8H
NA
4389
45A
NO
6D
DX
11Y
80.
8Y
YY
8HN
A58
5857
PTEN
PLC
E1Y
6.5
0.62
YN
N8H
NA
6043
75TM
EM8B
ZNF7
61N
6.5
0.9
YN
N8H
NA
3268
78R
P11-
680G
10.1
CR
ISPL
D2
Y6.
50.
98Y
YN
8HN
A47
226
AST
N2
CH
OD
LN
6.5
0.58
YN
N
Con
tinu
edon
next
page

97Ta
ble
S3–
con
tin
ued
from
prev
iou
spa
ge
Sam
pleI
DFu
sion
IDG
ene1
Gen
e2Va
lida
ted
Scor
ede
Fuse
prob
abil
ity
deFu
sefu
sion
Map
soap
Fuse
8HN
A52
2585
LIN
SA
P3B
1N
60.
9Y
NN
8HN
A35
0788
BTN
3A2
BTN
3A3
N4.
50.
91Y
NN
8HN
A55
371
DT
X2P
1-U
PK3B
P1-
PMS2
P11
PMS2
P3N
2.5
0.64
YN
N
DR
8V39
8749
TBC
1D9
RP1
1-20
3B7.
2Y
9.5
0.91
YY
ND
R8V
3541
32W
DR
25EM
L1Y
9.5
0.98
YY
ND
R8V
687
ND
UFC
2PP
FIA
1Y
9.5
0.87
YY
ND
R8V
1414
56M
AC
F1SF
3A3
Y9
0.91
YY
YD
R8V
6888
9C
REB
1FA
STK
D1
Y8.
50.
98Y
NY
DR
8V12
54FA
M16
8AM
YO7A
Y8.
50.
96Y
YY
DR
8V51
2R
AB
6AFC
HSD
2Y
70.
7Y
NN
DR
8V33
7PP
FIA
1R
P11-
800A
3.3
Y7
0.94
YN
ND
R8V
3987
50TB
C1D
9R
P11-
203B
7.2
N7
0.99
YY
ND
R8V
923
MYE
OV
UC
P2Y
70.
87Y
NN
DR
8V20
3LR
P5R
P11-
800A
3.3
Y7
0.92
YN
ND
R8V
676
P2RY
6U
CP2
Y7
0.82
YN
ND
R8V
2770
99G
OLM
1IT
GB
5N
60.
74Y
NN
DR
8V33
51SC
GB
2A2
AC
0112
93.1
N6
0.61
YN
ND
R8V
2542
50EF
HC
1EX
OC
2N
3.5
0.87
YN
ND
R8V
2339
80B
AN
PC
TD-2
547E
10.3
Y0.
50.
91Y
NN
Not
e:Th
eor
der
offu
sion
part
ner
5′an
d3′
isig
nore
dto
sim
plif
yco
mpa
riso
n.
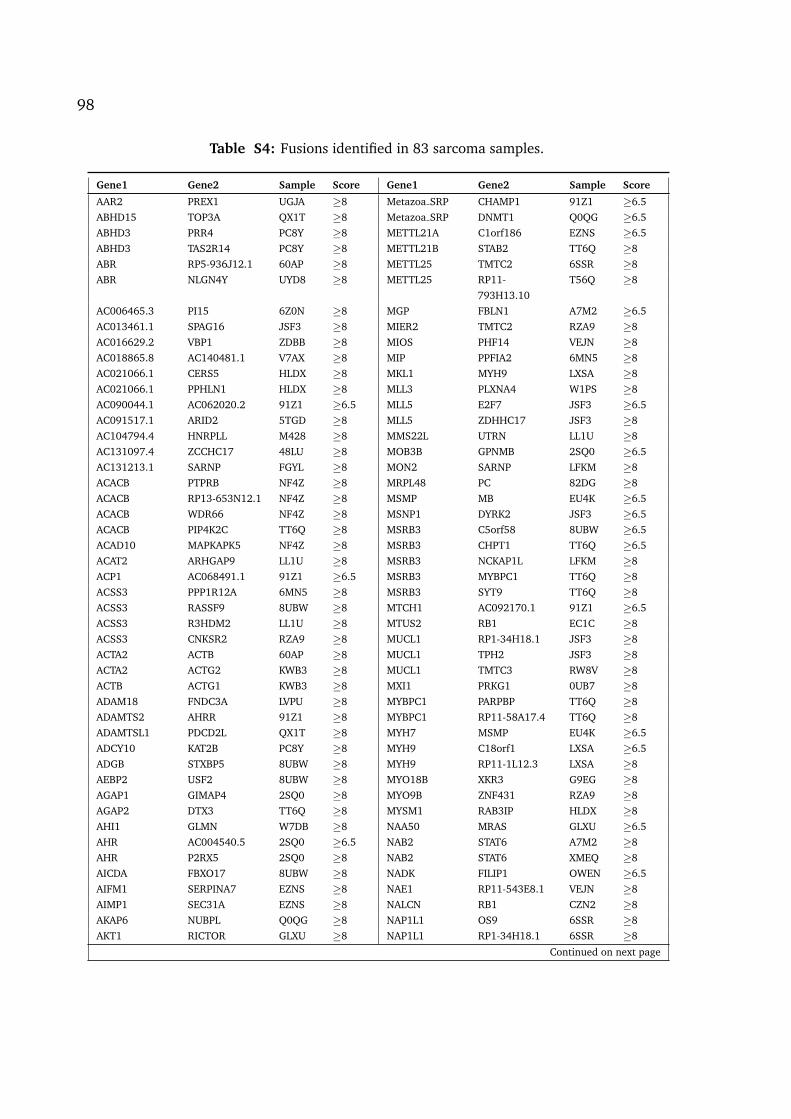
98
Table S4: Fusions identified in 83 sarcoma samples.
Gene1 Gene2 Sample Score Gene1 Gene2 Sample Score
AAR2 PREX1 UGJA ≥8 Metazoa SRP CHAMP1 91Z1 ≥6.5ABHD15 TOP3A QX1T ≥8 Metazoa SRP DNMT1 Q0QG ≥6.5ABHD3 PRR4 PC8Y ≥8 METTL21A C1orf186 EZNS ≥6.5ABHD3 TAS2R14 PC8Y ≥8 METTL21B STAB2 TT6Q ≥8ABR RP5-936J12.1 60AP ≥8 METTL25 TMTC2 6SSR ≥8ABR NLGN4Y UYD8 ≥8 METTL25 RP11-
793H13.10T56Q ≥8
AC006465.3 PI15 6Z0N ≥8 MGP FBLN1 A7M2 ≥6.5AC013461.1 SPAG16 JSF3 ≥8 MIER2 TMTC2 RZA9 ≥8AC016629.2 VBP1 ZDBB ≥8 MIOS PHF14 VEJN ≥8AC018865.8 AC140481.1 V7AX ≥8 MIP PPFIA2 6MN5 ≥8AC021066.1 CERS5 HLDX ≥8 MKL1 MYH9 LXSA ≥8AC021066.1 PPHLN1 HLDX ≥8 MLL3 PLXNA4 W1PS ≥8AC090044.1 AC062020.2 91Z1 ≥6.5 MLL5 E2F7 JSF3 ≥6.5AC091517.1 ARID2 5TGD ≥8 MLL5 ZDHHC17 JSF3 ≥8AC104794.4 HNRPLL M428 ≥8 MMS22L UTRN LL1U ≥8AC131097.4 ZCCHC17 48LU ≥8 MOB3B GPNMB 2SQ0 ≥6.5AC131213.1 SARNP FGYL ≥8 MON2 SARNP LFKM ≥8ACACB PTPRB NF4Z ≥8 MRPL48 PC 82DG ≥8ACACB RP13-653N12.1 NF4Z ≥8 MSMP MB EU4K ≥6.5ACACB WDR66 NF4Z ≥8 MSNP1 DYRK2 JSF3 ≥6.5ACACB PIP4K2C TT6Q ≥8 MSRB3 C5orf58 8UBW ≥6.5ACAD10 MAPKAPK5 NF4Z ≥8 MSRB3 CHPT1 TT6Q ≥6.5ACAT2 ARHGAP9 LL1U ≥8 MSRB3 NCKAP1L LFKM ≥8ACP1 AC068491.1 91Z1 ≥6.5 MSRB3 MYBPC1 TT6Q ≥8ACSS3 PPP1R12A 6MN5 ≥8 MSRB3 SYT9 TT6Q ≥8ACSS3 RASSF9 8UBW ≥8 MTCH1 AC092170.1 91Z1 ≥6.5ACSS3 R3HDM2 LL1U ≥8 MTUS2 RB1 EC1C ≥8ACSS3 CNKSR2 RZA9 ≥8 MUCL1 RP1-34H18.1 JSF3 ≥8ACTA2 ACTB 60AP ≥8 MUCL1 TPH2 JSF3 ≥8ACTA2 ACTG2 KWB3 ≥8 MUCL1 TMTC3 RW8V ≥8ACTB ACTG1 KWB3 ≥8 MXI1 PRKG1 0UB7 ≥8ADAM18 FNDC3A LVPU ≥8 MYBPC1 PARPBP TT6Q ≥8ADAMTS2 AHRR 91Z1 ≥8 MYBPC1 RP11-58A17.4 TT6Q ≥8ADAMTSL1 PDCD2L QX1T ≥8 MYH7 MSMP EU4K ≥6.5ADCY10 KAT2B PC8Y ≥8 MYH9 C18orf1 LXSA ≥6.5ADGB STXBP5 8UBW ≥8 MYH9 RP11-1L12.3 LXSA ≥8AEBP2 USF2 8UBW ≥8 MYO18B XKR3 G9EG ≥8AGAP1 GIMAP4 2SQ0 ≥8 MYO9B ZNF431 RZA9 ≥8AGAP2 DTX3 TT6Q ≥8 MYSM1 RAB3IP HLDX ≥8AHI1 GLMN W7DB ≥8 NAA50 MRAS GLXU ≥6.5AHR AC004540.5 2SQ0 ≥6.5 NAB2 STAT6 A7M2 ≥8AHR P2RX5 2SQ0 ≥8 NAB2 STAT6 XMEQ ≥8AICDA FBXO17 8UBW ≥8 NADK FILIP1 OWEN ≥6.5AIFM1 SERPINA7 EZNS ≥8 NAE1 RP11-543E8.1 VEJN ≥8AIMP1 SEC31A EZNS ≥8 NALCN RB1 CZN2 ≥8AKAP6 NUBPL Q0QG ≥8 NAP1L1 OS9 6SSR ≥8AKT1 RICTOR GLXU ≥8 NAP1L1 RP1-34H18.1 6SSR ≥8
Continued on next page

99
Table S4 – continued from previous page
Gene1 Gene2 Sample Score Gene1 Gene2 Sample Score
AL583842.3 MDM2 TT6Q ≥8 NAP1L1 PAWR LFKM ≥8ALG14 CTDSP2 W7DB ≥8 NAP1L1 SLC16A7 LFKM ≥8ALKBH5 HMGB3P23 EZNS ≥8 NAP1L4P3 ASTN2 5KJM ≥6.5ANGPT4 MMS22L LL1U ≥8 NAV2 GAS2 6Z0N ≥6.5ANKLE2 AGAP2 TT6Q ≥6.5 NAV3 CAND1 LFKM ≥6.5ANKLE2 RP11-571M6.6 TT6Q ≥8 NBPF11 TRHDE W7DB ≥8ANKRD13A RAB3IP TT6Q ≥8 NCOA3 TCP10L2 91Z1 ≥8ANKRD32 RP11-133F8.2 91Z1 ≥8 NCOR1 CTC-297N7.9 JSF3 ≥6.5ANKRD52 SLC16A7 LFKM ≥8 NCOR2 UBC 5KJM ≥8ANKRD6 SNX9 8UBW ≥8 NCOR2 UBC UMND ≥8ANKS1B TMEM117 6MN5 ≥8 NDUFAF4 SPICE1 QX1T ≥8ANO10 ERC2 PC8Y ≥8 NDUFAF5 MDM2 LL1U ≥6.5ANO2 URM1 2SQ0 ≥8 NEDD4 ABR 60AP ≥6.5ANO2 FRS2 NTAT ≥8 NEK10 RNF126 48LU ≥8ANO4 RP1-34H18.1 LL1U ≥8 NELL2 ANO6 JSF3 ≥6.5ANO6 CRADD 5TGD ≥8 NFATC1 NPC1 NTAT ≥8ANO6 LUM 5TGD ≥8 NFATC2 CABLES1 VEJN ≥6.5ANO6 C12orf28 JSF3 ≥8 NFKBIB NUP155 8UBW ≥8ANO6 TPH2 JSF3 ≥8 NHSL1 NOS1AP S81X ≥8ANP32B SNX30 91Z1 ≥8 NLGN1 MFN1 GLXU ≥6.5ANTXR2 UBA6 OWEN ≥8 NLGN4X STS RZA9 ≥8AP2A2 RPLP2 ZDBB ≥8 NLRP7 ZNF461 Q0QG ≥8AP5Z1 NUDT1 T56Q ≥8 NMNAT3 NAA50 GLXU ≥6.5ARF3 ATP10A 63LW ≥8 NOL9 LARP1 JSF3 ≥6.5ARHGEF25 ZDHHC17 6SSR ≥8 NOS1AP CPM 5TGD ≥6.5ARHGEF7 DNAH2 QX1T ≥8 NOSTRIN EPC2 JSF3 ≥6.5ARID2 DCN 5TGD ≥8 NPHP3 MRPS22 GLXU ≥6.5ARID2 TMEM5 HLDX ≥8 NPLOC4 CSNK1D Q0QG ≥6.5ARIH2 VPS8 9C3U ≥8 NR1H4 MSRB3 TT6Q ≥6.5ARMC8 RBP1 GLXU ≥8 NR1H4 RP11-175P13.3 TT6Q ≥8ASB9 LRIG3 RW8V ≥8 NR2C1 LTA4H FGYL ≥6.5ASF1B SPC24 ERAH ≥8 NR3C1 URGCP WHGE ≥8ASH1L ATF6 W7DB ≥8 NREP CCND1 VK9K ≥6.5ASPH EPB41L4A GLXU ≥8 NRF1 AC107021.1 9C3U ≥6.5ASPSCR1 TFE3 N61A ≥8 NRXN3 WIF1 8UBW ≥8ASTN1 ANO6 5TGD ≥6.5 NT5E EFHC1 91Z1 ≥6.5ASXL3 CS PC8Y ≥8 NTN4 SH3BGR RW8V ≥8ATF1 EWSR1 UGJA ≥8 NTN4 TENC1 RW8V ≥8ATF1 TBC1D15 UGJA ≥8 NTRK3 RFX7 PC8Y ≥8ATF7 METTL25 T56Q ≥8 NTS UHRF1BP1L T56Q ≥8ATG7 SGOL1 ZDBB ≥8 NUBPL DTX3 JSF3 ≥6.5ATIC SFPQ YHM7 ≥8 NUMB RP11-362K2.2 63LW ≥8ATP12A SKA3 ZDBB ≥8 NUMB TPH2 63LW ≥8ATP2B1 RP11-547C5.2 6MN5 ≥8 NUP107 TMEM87A 63LW ≥8ATP2B1 RP11-547C5.2 RW8V ≥8 NUP107 RABGAP1L 91Z1 ≥8ATP6V0A4 CADPS2 2SQ0 ≥8 NUP107 SERINC5 91Z1 ≥8ATP6V0A4 SND1 2SQ0 ≥8 NUP107 STX6 91Z1 ≥8ATP6V1A NMNAT3 GLXU ≥8 NUP210L RAD9B 2CJV ≥8ATP6V1A ZMAT3 GLXU ≥8 NUP37 ELK3 TT6Q ≥6.5
Continued on next page

100
Table S4 – continued from previous page
Gene1 Gene2 Sample Score Gene1 Gene2 Sample Score
ATP6V1H CDKN2A 91Z1 ≥8 OR6C1 CTDSP2 6SSR ≥6.5ATP7A PREX2 GLXU ≥8 OR6C66P ACSS3 6MN5 ≥6.5ATP8A2 RB1 QX1T ≥8 OR6K5P FGGY HLDX ≥6.5ATP9B RP11-433A23.1 ZDBB ≥8 OS9 RP11-754N21.1 63LW ≥8ATXN10 TMTC2 8UBW ≥8 OS9 PPFIA2 TT6Q ≥8AVIL BX004987.4 HLDX ≥8 OSBPL8 TRHDE 8UBW ≥8AVIL DNM3 W7DB ≥8 OSBPL8 RP11-571M6.6 JSF3 ≥8AVIL NBPF20 W7DB ≥8 OSBPL8 TSPAN31 JSF3 ≥8B4GALNT1 GLS2 PC8Y ≥8 OSBPL8 PTPRR NTAT ≥8B4GALT3 CCDC53 5TGD ≥8 OSBPL8 SYNE1 NTAT ≥8BASP1 SLC15A2 Q0QG ≥8 OTOA PPFIBP2 Q0QG ≥8BAZ2A KCNMB4 JSF3 ≥8 OTOGL CPSF6 LFKM ≥6.5BAZ2A PTPRQ LFKM ≥8 OTUD1 GNPNAT1 Q0QG ≥6.5BBS9 PTPRD EU4K ≥8 PAK2 COL6A6 9C3U ≥6.5BCAT2 TFPT 2SQ0 ≥8 PAK7 BCKDHB RW8V ≥6.5BCKDHB SMAP1 NTAT ≥8 PAPOLA ATP2B1 T56Q ≥6.5BCL2L13 SLC25A18 RZA9 ≥8 PAPPA2 ATG5 91Z1 ≥6.5BCOR ZC3H7B PC8Y ≥8 PAPPA2 PTPRR 91Z1 ≥8BEST3 ADPRHL1 91Z1 ≥6.5 PARD3B ANKRD44 JSF3 ≥6.5BEST3 NUP107 TT6Q ≥8 PARD3B EPC2 JSF3 ≥6.5BICD1 ROCK1 PC8Y ≥8 PAWR RP11-320P7.2 63LW ≥8BIRC6 MDM1 JSF3 ≥8 PCDH7 CDH7 ZDBB ≥6.5BIRC6 LINC00265 WHGE ≥8 PCP4L1 SDHC ZDBB ≥8BOC RAB7A 9C3U ≥8 PDE4DIP BIRC6 WHGE ≥6.5BRWD1 RP11-230G5.2 RW8V ≥8 PDK3 DDX3X 5KJM ≥6.5BTG3 HHAT 9C3U ≥8 PDSS2 EYS 91Z1 ≥6.5BTLA SLC35A5 GLXU ≥8 PDZD9 GALNTL2 VEJN ≥6.5C12orf28 SH3BP2 8UBW ≥8 PIEZO2 UVRAG 2SQ0 ≥8C12orf28 DNM3 91Z1 ≥8 PIGC RP11-956E11.1 W7DB ≥8C12orf28 GRIA3 91Z1 ≥8 PIGL NCOR1 60AP ≥6.5C12orf28 MDM2 RW8V ≥8 PIP4K2C RP11-443D10.3 TT6Q ≥8C12orf50 CPM 2CJV ≥8 PKD1L2 INSIG2 ERAH ≥6.5C12orf55 CUX2 2CJV ≥8 PLAUR ETHE1 8UBW ≥6.5C12orf56 RP11-611E13.2 6SSR ≥8 PLAUR ZNF404 W6TV ≥8C12orf56 RP1-34H18.1 6SSR ≥8 PLCB1 ZFR2 8UBW ≥8C12orf56 NACA LFKM ≥8 PLEKHA8P1 RP11-81H14.2 JSF3 ≥8C12orf66 SP1 6SSR ≥8 PLIN2 CEBPD GLXU ≥6.5C16orf96 XYLT1 6SSR ≥8 PLXNC1 METTL7A RW8V ≥6.5C17orf103 C11orf30 0UB7 ≥6.5 PLXNC1 TENC1 RW8V ≥8C17orf75 YWHAE VEJN ≥8 PMCH TSFM TT6Q ≥8C17orf79 TMEM184A 72GV ≥8 PMP22 RDH12 UYD8 ≥8C18orf1 LGR4 LXSA ≥8 POC1B TMTC2 NF4Z ≥8C19orf47 GAPVD1 2SQ0 ≥8 POLR2KP2 FTSJ2 M428 ≥6.5C19orf47 SLC25A25 2SQ0 ≥8 POU2F2 ZNF568 8UBW ≥8C1orf105 KIAA0825 91Z1 ≥8 PPAP2C USE1 RZA9 ≥8C22orf13 LGALS2 G9EG ≥8 PPFIA2 ESPL1 6MN5 ≥6.5C6orf170 AL357515.1 91Z1 ≥6.5 PPFIA2 CNOT2 NTAT ≥6.5CABIN1 SEC14L3 G9EG ≥8 PPFIA2 COPE TT6Q ≥6.5CALCRL CCDC150 JSF3 ≥8 PPM1H ANO6 JSF3 ≥6.5
Continued on next page

101
Table S4 – continued from previous page
Gene1 Gene2 Sample Score Gene1 Gene2 Sample Score
CALD1 PPP1R1A LL1U ≥8 PPM1H MYL6 JSF3 ≥6.5CALU SRI NTAT ≥8 PPM1H PTPRR JSF3 ≥8CAMK2G VCL LXSA ≥8 PPOX BEST3 HLDX ≥6.5CAND1 ASCC3 LL1U ≥6.5 PPOX RP11-588G21.2 HLDX ≥8CAND1 DNM3 91Z1 ≥8 PPP1R10 AL137003.1 9C3U ≥6.5CAND1 MDM2 91Z1 ≥8 PPP1R12A NFIA 63LW ≥6.5CAND1 E2F7 LFKM ≥8 PPP2R4 AC005621.1 12C6 ≥6.5CAND1 LRIG3 LFKM ≥8 PPP6R2 DAP 2SQ0 ≥6.5CAND1 ELK3 TT6Q ≥8 PQLC1 ADNP2 G9EG ≥6.5CANX AC073128.10 WHGE ≥6.5 PQLC1 TXNL4A Q0QG ≥8CAPNS1 A1BG 8UBW ≥6.5 PRIM1 CAPS2 LFKM ≥6.5CAPRIN2 LGR5 JSF3 ≥8 PRIMA1 LRP11 NTAT ≥6.5CAPS2 RP11-244J10.1 5TGD ≥8 PRLR PPP1R12A 5TGD ≥6.5CAPZA2 ST7-OT4 WHGE ≥8 PRPF4 RP11-360A18.2 TT6Q ≥8CASP8 AP2S1 6SSR ≥6.5 PRR14L KIAA1671 T56Q ≥6.5CAV1 ATP6V0A4 2SQ0 ≥6.5 PRRC2C CPSF6 2CJV ≥6.5CBX3 GRAMD3 12C6 ≥8 PRRC2C CNOT2 HLDX ≥6.5CBX5 E2F7 LFKM ≥8 PRRC2C CPM HLDX ≥6.5CBX5 PPP1R12A LFKM ≥8 PRRC2C FASLG PC8Y ≥6.5CBX5 USP15 LFKM ≥8 PRRC2C SCYL3 7GAB ≥8CC2D1A EMR2 RZA9 ≥8 PRTFDC1 PTCHD3 LL1U ≥8CCDC132 CALD1 12C6 ≥6.5 PSEN1 RP11-
1008C21.163LW ≥8
CCDC28A NT5E 91Z1 ≥8 PSMC2 DLGAP1-AS3 2SQ0 ≥6.5CCDC38 VDR 6MN5 ≥8 PSMD1 COL3A1 2SQ0 ≥6.5CCDC59 GIT2 6MN5 ≥8 PSMD8 RP11-20J1.1 TT6Q ≥8CCDC59 DAD1 8UBW ≥8 PSMF1 ZNF800 LL1U ≥8CCDC93 NCKAP5 2SQ0 ≥8 PSTPIP2 TSPAN9 PC8Y ≥8CCER1 TMPRSS12 RW8V ≥8 PTGES3 MSRB3 LFKM ≥6.5CCNT1 RAP1B JSF3 ≥8 PTGIS ZFP64 VEJN ≥8CCNT2 SYNE1 48LU ≥8 PTPRB OSBPL8 NTAT ≥6.5CCR3 CTNNB1 PC8Y ≥8 PTPRM SPIRE1 ERAH ≥8CCT2 RP11-120I21.2 LL1U ≥8 PTPRN2 SP140 48LU ≥8CCT5 RAI14 8UBW ≥8 PTPRQ ZFC3H1 JSF3 ≥8CD2AP CDC5L 0UB7 ≥8 PTPRR HOXC5 LFKM ≥6.5CD320 ZNF560 7GAB ≥8 PTPRR RP11-611E13.2 91Z1 ≥8CD63 HMGA2 LFKM ≥8 PTPRR TBC1D15 JSF3 ≥8CD63 RAB3IP LFKM ≥8 PUS7 AP000567.27 2SF3 ≥6.5CD63 RPSAP52 LFKM ≥8 PUS7L GRIP1 JSF3 ≥6.5CDC16 DNM3 91Z1 ≥8 QARS CADPS GLXU ≥6.5CDH18 KDM5A 8UBW ≥8 R3HDM2 CCNT1 JSF3 ≥6.5CDH19 PCGF3 ZDBB ≥8 RAB21 SLC38A1 63LW ≥8CDH2 TSPAN8 PC8Y ≥8 RAB21 TSPAN8 63LW ≥8CDK17 SARNP RZA9 ≥8 RAB21 TMEM5 LFKM ≥8CDK17 CPSF6 TT6Q ≥8 RAB27B RP11-114H23.1 PC8Y ≥8CDK17 RP11-620J15.2 TT6Q ≥8 RAB27B RP11-114H23.2 PC8Y ≥8CDK17 SSH1 TT6Q ≥8 RAB3IP TBC1D15 LFKM ≥8CDK17 XRCC6BP1 TT6Q ≥8 RAB7A ARID4B 9C3U ≥6.5CDK4 CPM 91Z1 ≥8 RABGAP1L MDM2 91Z1 ≥6.5
Continued on next page

102
Table S4 – continued from previous page
Gene1 Gene2 Sample Score Gene1 Gene2 Sample Score
CDK4 MR1 91Z1 ≥8 RABGAP1L MTCH1 91Z1 ≥6.5CDK4 STX6 91Z1 ≥8 RABGAP1L PDSS2 91Z1 ≥6.5CDK4 ELK3 TT6Q ≥8 RAP1B RPS6KA3 6SSR ≥8CDK8 DGKH M428 ≥8 RASA3 PDSS2 91Z1 ≥6.5CDKAL1 DNM3 91Z1 ≥8 RASIP1 ZNF542 8UBW ≥8CDKAL1 NUP107 91Z1 ≥8 RASSF3 AC005307.3 LFKM ≥6.5CDKAL1 SNX14 91Z1 ≥8 RASSF3 RP11-620J15.3 LFKM ≥8CEACAM7 ZNF566 8UBW ≥8 RASSF9 MYF6 NTAT ≥6.5CECR1 CRKL T56Q ≥8 RB1 GPR110 GQPU ≥6.5CENPL MDM2 91Z1 ≥8 RB1 LINC00358 YHM7 ≥6.5CEP290 RP11-150C16.1 RW8V ≥8 RB1CC1 AC016113.1 QX1T ≥6.5CEP78 SEC61B 12C6 ≥8 RBFOX3 ROR2 OWEN ≥8CERS4 RAB11B QX1T ≥8 RBM19 RNF10 JSF3 ≥8CERS6 TSPAN31 6SSR ≥8 RBMS2 FRS2 LFKM ≥6.5CHAMP1 RP11-360A9.2 91Z1 ≥8 RBMS2 IFNG-AS1 LFKM ≥6.5CHD2 TNRC6C 63LW ≥8 RBMS2 PTPRR LFKM ≥6.5CHD9 NUP93 Q0QG ≥8 RCBTB1 DLEU1 WHGE ≥6.5CHN1 SEMA3E 2SQ0 ≥8 REV3L CPM 91Z1 ≥6.5CHPT1 YWHAQ TT6Q ≥8 REV3L RP11-222A5.1 91Z1 ≥8CHRD RCBTB2 9C3U ≥8 RFTN2 SLC40A1 JSF3 ≥8CHRNA6 PLAT 8UBW ≥8 RFX1 IL27RA A7M2 ≥6.5CHST11 RNF111 63LW ≥8 RGL1 MYO5C PC8Y ≥6.5CIB2 TBC1D2B 91Z1 ≥8 RGPD5 PID1 91Z1 ≥6.5CIT NAA25 NF4Z ≥8 RGS8 HERC2P2 PC8Y ≥6.5CLU RPS24 9C3U ≥8 RNA5SP299 RBM20 48LU ≥6.5CMKLR1 NTNG1 GJQ0 ≥8 RNASEL SCYL3 W7DB ≥8CNOT2 SRGAP1 JSF3 ≥8 RND3 AC009313.1 JSF3 ≥6.5CNOT2 ZDHHC17 JSF3 ≥8 RNF114 MYO18A VEJN ≥6.5CNOT2 PTPRR LL1U ≥8 RNF182 SNRNP48 LL1U ≥8CNOT2 HMGA2 NTAT ≥8 RNU7-14P RBBP8 VEJN ≥6.5CNTLN PTPRD EU4K ≥8 RP11-1022B3.1 FGGY HLDX ≥6.5COL11A1 USP6 60AP ≥8 RP11-
1041F24.1BTG1 5TGD ≥6.5
COL14A1 SLC7A5P1 W1PS ≥8 RP11-114H23.1 OS9 5TGD ≥6.5COL1A1 ACTA2 9C3U ≥6.5 RP11-
123M21.1CDK4 TT6Q ≥6.5
COL1A1 CHRDL2 9C3U ≥6.5 RP11-123M21.2
CDK4 TT6Q ≥6.5
COL1A1 COL1A2 HLDX ≥8 RP11-125O18.1 RAD54L2 PC8Y ≥6.5COL1A1 COL3A1 HLDX ≥8 RP11-13A1.3 CPSF6 2CJV ≥6.5COL4A2 CHRDL2 9C3U ≥6.5 RP11-14I4.3 DCBLD1 8UBW ≥6.5COL4A3 SP100 GLXU ≥8 RP11-168J19.2 PPP1R1A LFKM ≥6.5COL6A2 DSCAM PC8Y ≥8 RP11-171L9.1 FRS2 63LW ≥6.5COL6A3 B2M QIEE ≥6.5 RP11-171L9.1 ZDHHC17 JSF3 ≥8COLEC12 SENP2 Q0QG ≥8 RP11-181K3.4 GRM1 W7DB ≥6.5COPZ1 OSBPL8 LFKM ≥8 RP11-202H2.1 RP1-34H18.1 6SSR ≥6.5COPZ1 TSPAN8 RW8V ≥8 RP11-203B7.2 TCEAL3 JSF3 ≥8COX10-AS1 NME1 Q0QG ≥8 RP11-21J18.1 SPIRE1 ERAH ≥8COX11 NEBL LL1U ≥8 RP11-21J7.1 CSNK1D Q0QG ≥6.5
Continued on next page
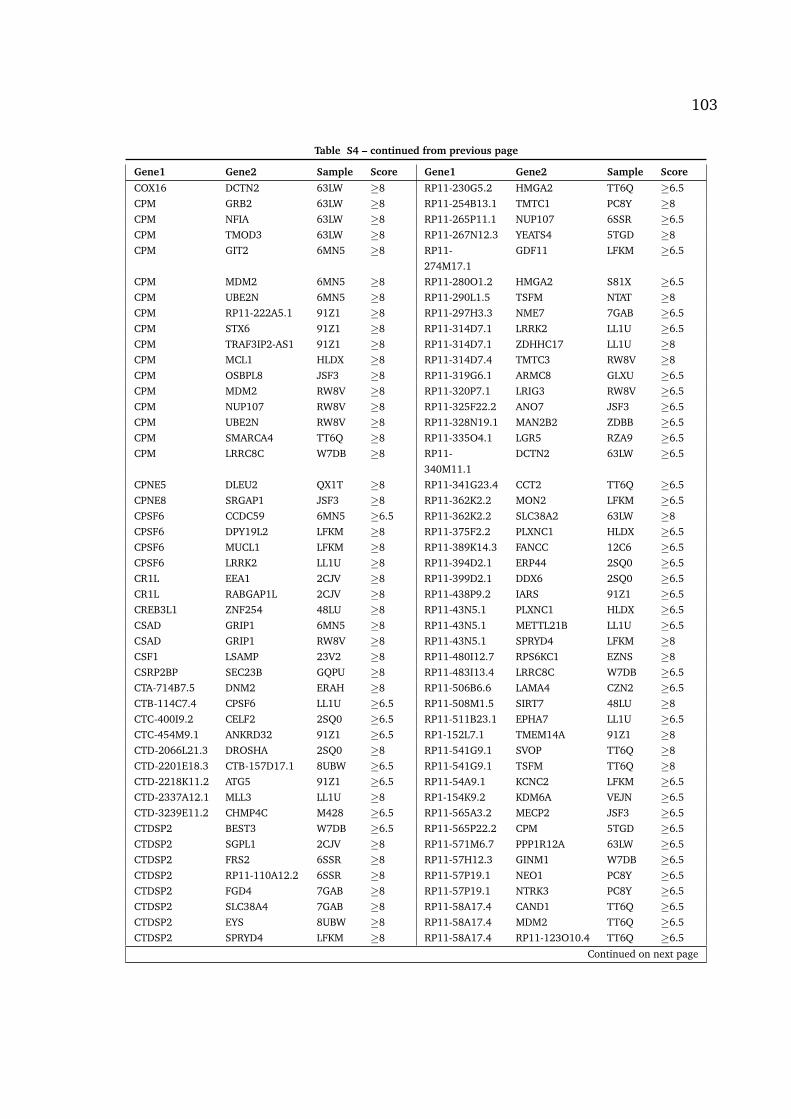
103
Table S4 – continued from previous page
Gene1 Gene2 Sample Score Gene1 Gene2 Sample Score
COX16 DCTN2 63LW ≥8 RP11-230G5.2 HMGA2 TT6Q ≥6.5CPM GRB2 63LW ≥8 RP11-254B13.1 TMTC1 PC8Y ≥8CPM NFIA 63LW ≥8 RP11-265P11.1 NUP107 6SSR ≥6.5CPM TMOD3 63LW ≥8 RP11-267N12.3 YEATS4 5TGD ≥8CPM GIT2 6MN5 ≥8 RP11-
274M17.1GDF11 LFKM ≥6.5
CPM MDM2 6MN5 ≥8 RP11-280O1.2 HMGA2 S81X ≥6.5CPM UBE2N 6MN5 ≥8 RP11-290L1.5 TSFM NTAT ≥8CPM RP11-222A5.1 91Z1 ≥8 RP11-297H3.3 NME7 7GAB ≥6.5CPM STX6 91Z1 ≥8 RP11-314D7.1 LRRK2 LL1U ≥6.5CPM TRAF3IP2-AS1 91Z1 ≥8 RP11-314D7.1 ZDHHC17 LL1U ≥8CPM MCL1 HLDX ≥8 RP11-314D7.4 TMTC3 RW8V ≥8CPM OSBPL8 JSF3 ≥8 RP11-319G6.1 ARMC8 GLXU ≥6.5CPM MDM2 RW8V ≥8 RP11-320P7.1 LRIG3 RW8V ≥6.5CPM NUP107 RW8V ≥8 RP11-325F22.2 ANO7 JSF3 ≥6.5CPM UBE2N RW8V ≥8 RP11-328N19.1 MAN2B2 ZDBB ≥6.5CPM SMARCA4 TT6Q ≥8 RP11-335O4.1 LGR5 RZA9 ≥6.5CPM LRRC8C W7DB ≥8 RP11-
340M11.1DCTN2 63LW ≥6.5
CPNE5 DLEU2 QX1T ≥8 RP11-341G23.4 CCT2 TT6Q ≥6.5CPNE8 SRGAP1 JSF3 ≥8 RP11-362K2.2 MON2 LFKM ≥6.5CPSF6 CCDC59 6MN5 ≥6.5 RP11-362K2.2 SLC38A2 63LW ≥8CPSF6 DPY19L2 LFKM ≥8 RP11-375F2.2 PLXNC1 HLDX ≥6.5CPSF6 MUCL1 LFKM ≥8 RP11-389K14.3 FANCC 12C6 ≥6.5CPSF6 LRRK2 LL1U ≥8 RP11-394D2.1 ERP44 2SQ0 ≥6.5CR1L EEA1 2CJV ≥8 RP11-399D2.1 DDX6 2SQ0 ≥6.5CR1L RABGAP1L 2CJV ≥8 RP11-438P9.2 IARS 91Z1 ≥6.5CREB3L1 ZNF254 48LU ≥8 RP11-43N5.1 PLXNC1 HLDX ≥6.5CSAD GRIP1 6MN5 ≥8 RP11-43N5.1 METTL21B LL1U ≥6.5CSAD GRIP1 RW8V ≥8 RP11-43N5.1 SPRYD4 LFKM ≥8CSF1 LSAMP 23V2 ≥8 RP11-480I12.7 RPS6KC1 EZNS ≥8CSRP2BP SEC23B GQPU ≥8 RP11-483I13.4 LRRC8C W7DB ≥6.5CTA-714B7.5 DNM2 ERAH ≥8 RP11-506B6.6 LAMA4 CZN2 ≥6.5CTB-114C7.4 CPSF6 LL1U ≥6.5 RP11-508M1.5 SIRT7 48LU ≥8CTC-400I9.2 CELF2 2SQ0 ≥6.5 RP11-511B23.1 EPHA7 LL1U ≥6.5CTC-454M9.1 ANKRD32 91Z1 ≥6.5 RP1-152L7.1 TMEM14A 91Z1 ≥8CTD-2066L21.3 DROSHA 2SQ0 ≥8 RP11-541G9.1 SVOP TT6Q ≥8CTD-2201E18.3 CTB-157D17.1 8UBW ≥6.5 RP11-541G9.1 TSFM TT6Q ≥8CTD-2218K11.2 ATG5 91Z1 ≥6.5 RP11-54A9.1 KCNC2 LFKM ≥6.5CTD-2337A12.1 MLL3 LL1U ≥8 RP1-154K9.2 KDM6A VEJN ≥6.5CTD-3239E11.2 CHMP4C M428 ≥6.5 RP11-565A3.2 MECP2 JSF3 ≥6.5CTDSP2 BEST3 W7DB ≥6.5 RP11-565P22.2 CPM 5TGD ≥6.5CTDSP2 SGPL1 2CJV ≥8 RP11-571M6.7 PPP1R12A 63LW ≥6.5CTDSP2 FRS2 6SSR ≥8 RP11-57H12.3 GINM1 W7DB ≥6.5CTDSP2 RP11-110A12.2 6SSR ≥8 RP11-57P19.1 NEO1 PC8Y ≥6.5CTDSP2 FGD4 7GAB ≥8 RP11-57P19.1 NTRK3 PC8Y ≥6.5CTDSP2 SLC38A4 7GAB ≥8 RP11-58A17.4 CAND1 TT6Q ≥6.5CTDSP2 EYS 8UBW ≥8 RP11-58A17.4 MDM2 TT6Q ≥6.5CTDSP2 SPRYD4 LFKM ≥8 RP11-58A17.4 RP11-123O10.4 TT6Q ≥6.5
Continued on next page

104
Table S4 – continued from previous page
Gene1 Gene2 Sample Score Gene1 Gene2 Sample Score
CTDSP2 SLC31A1 TT6Q ≥8 RP11-596D21.1 HECTD1 N61A ≥6.5CTDSPL ARHGEF3 9C3U ≥6.5 RP1-15D23.2 FBXL17 91Z1 ≥6.5CTNNAL1 NEK6 RW8V ≥8 RP1-15D23.2 NUP107 91Z1 ≥6.5CTNNAL1 RP11-202G18.1 RW8V ≥8 RP11-611E13.2 GRIA3 91Z1 ≥6.5CTSB ERI1 KWB3 ≥8 RP11-611E13.2 LRIG3 RW8V ≥6.5CTTN SUCLG2 0UB7 ≥8 RP11-611E13.2 RP11-571M6.8 RW8V ≥6.5CUBN EPC1 JSF3 ≥8 RP11-611E13.2 SYT1 LL1U ≥8CUBN RP11-799O21.1 JSF3 ≥8 RP11-611O2.3 FGGY 63LW ≥6.5CUX1 DLG1 9C3U ≥8 RP11-620J15.2 COPZ1 LFKM ≥6.5CUZD1 FOXO1 6MN5 ≥8 RP11-620J15.2 HMGA2 LFKM ≥6.5CYP39A1 CD2AP GJQ0 ≥6.5 RP11-620J15.3 RP11-32B5.7 PC8Y ≥6.5CYP7B1 TMEM200A LL1U ≥8 RP11-690D19.1 MMP13 W6TV ≥6.5DAB1 FGGY HLDX ≥8 RP11-6F2.7 GRM7 9C3U ≥6.5DAB1 FRS2 HLDX ≥8 RP11-6N13.1 EPB41L4A 6MN5 ≥6.5DAB1 PRKACB HLDX ≥8 RP11-706O15.5 MIER2 RZA9 ≥6.5DAOA AVIL 2CJV ≥6.5 RP11-718O11.1 IFLTD1 PC8Y ≥6.5DBC1 UBE3B TT6Q ≥8 RP11-718O11.1 RYR3 63LW ≥8DBX2 RAB21 JSF3 ≥8 RP11-753H16.3 PRKACB HLDX ≥6.5DCTN2 AC139931.1 NTAT ≥6.5 RP11-753H16.3 MYH9 LXSA ≥6.5DCTN2 RP11-362K2.2 63LW ≥8 RP11-754N21.1 RNA5SP360 5TGD ≥6.5DCTN2 RP11-624L4.1 63LW ≥8 RP11-754N21.1 ZDHHC17 JSF3 ≥8DCTN2 TRHDE 63LW ≥8 RP11-762I7.5 FRS2 LFKM ≥6.5DCTN2 SYNE1 NTAT ≥8 RP11-766N7.3 TMEM19 LFKM ≥8DDIT3 FUS 2SF3 ≥8 RP11-768F21.1 KDM2B ZDBB ≥6.5DDIT3 FUS CHZ6 ≥8 RP11-788H18.1 ZDHHC17 LL1U ≥8DDIT3 UST NTAT ≥8 RP11-78C3.1 FYN 91Z1 ≥6.5DDIT3 FUS S1JM ≥8 RP11-793H13.8 RP11-314D7.4 LFKM ≥6.5DDIT3 FUS Y20T ≥8 RP11-804L24.2 NWD1 VEJN ≥6.5DDR2 METTL13 S81X ≥8 RP11-81H14.2 HMGA2 8UBW ≥6.5DEF6 FRS3 8UBW ≥8 RP11-81H14.2 LRFN5 8UBW ≥6.5DEPDC4 NR1H4 TT6Q ≥8 RP11-834C11.5 CERS5 RW8V ≥6.5DHPS CA10 2SF3 ≥6.5 RP11-85G21.2 PEX11B 2CJV ≥6.5DHRS7B RP5-1112F19.2 VEJN ≥8 RP11-85G21.2 RNF115 2CJV ≥6.5DHX15 UBE2K EZNS ≥8 RP11-86H7.1 RAPGEF2 CZN2 ≥6.5DHX16 GNL1 8UBW ≥8 RP11-8L2.1 NUP54 EZNS ≥6.5DKK2 PDE7A GLXU ≥8 RP11-90C1.1 ZDHHC17 JSF3 ≥8DLEU1 TSPAN9 W6TV ≥8 RP11-90K18.1 AARS OWEN ≥6.5DMD ARHGAP6 2SQ0 ≥6.5 RP11-93L9.1 GRID2 WHGE ≥6.5DNAJB1 ELK3 TT6Q ≥8 RP11-93O17.1 CDC16 91Z1 ≥6.5DNAJC1 LRRK2 LL1U ≥8 RP11-96H19.1 ADAMTS20 5TGD ≥6.5DNAJC3 RB1 5KJM ≥8 RP11-96H19.1 RP11-118A3.1 5TGD ≥6.5DNER TNS1 91Z1 ≥8 RP11-96H19.1 RP11-297H3.4 HLDX ≥6.5DNM2 DTX3 TT6Q ≥8 RP11-
977G19.117SK LFKM ≥6.5
DNM3 CTDSP2 7GAB ≥6.5 RP1-34H18.1 GLIPR1L1 LFKM ≥6.5DNM3 CTD-2021H9.1 91Z1 ≥6.5 RP1-34H18.1 TBC1D15 LFKM ≥8DNM3 CTDSP1 W7DB ≥6.5 RP1-35C21.2 KCNMB4 91Z1 ≥6.5DNM3 EXOC2 91Z1 ≥8 RP1-81F6.1 PDE7B 7GAB ≥6.5DNM3 GRIP1 91Z1 ≥8 RP3-340B19.2 CUL9 8UBW ≥6.5
Continued on next page
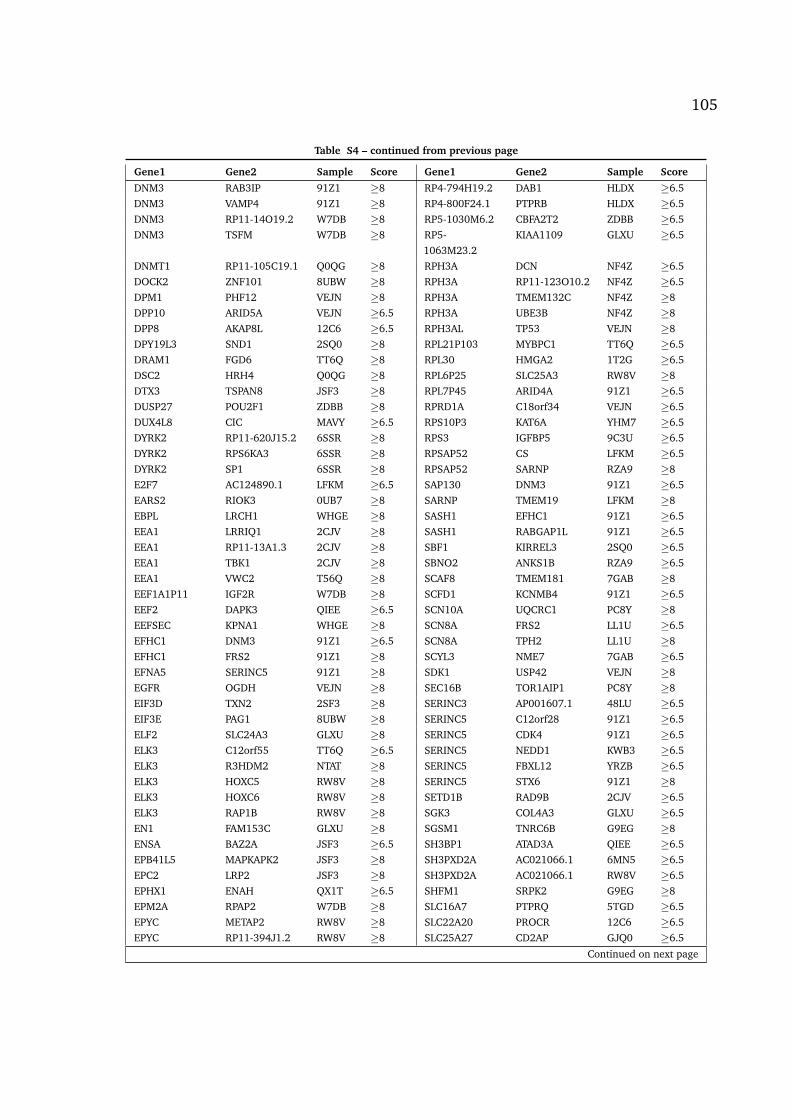
105
Table S4 – continued from previous page
Gene1 Gene2 Sample Score Gene1 Gene2 Sample Score
DNM3 RAB3IP 91Z1 ≥8 RP4-794H19.2 DAB1 HLDX ≥6.5DNM3 VAMP4 91Z1 ≥8 RP4-800F24.1 PTPRB HLDX ≥6.5DNM3 RP11-14O19.2 W7DB ≥8 RP5-1030M6.2 CBFA2T2 ZDBB ≥6.5DNM3 TSFM W7DB ≥8 RP5-
1063M23.2KIAA1109 GLXU ≥6.5
DNMT1 RP11-105C19.1 Q0QG ≥8 RPH3A DCN NF4Z ≥6.5DOCK2 ZNF101 8UBW ≥8 RPH3A RP11-123O10.2 NF4Z ≥6.5DPM1 PHF12 VEJN ≥8 RPH3A TMEM132C NF4Z ≥8DPP10 ARID5A VEJN ≥6.5 RPH3A UBE3B NF4Z ≥8DPP8 AKAP8L 12C6 ≥6.5 RPH3AL TP53 VEJN ≥8DPY19L3 SND1 2SQ0 ≥8 RPL21P103 MYBPC1 TT6Q ≥6.5DRAM1 FGD6 TT6Q ≥8 RPL30 HMGA2 1T2G ≥6.5DSC2 HRH4 Q0QG ≥8 RPL6P25 SLC25A3 RW8V ≥8DTX3 TSPAN8 JSF3 ≥8 RPL7P45 ARID4A 91Z1 ≥6.5DUSP27 POU2F1 ZDBB ≥8 RPRD1A C18orf34 VEJN ≥6.5DUX4L8 CIC MAVY ≥6.5 RPS10P3 KAT6A YHM7 ≥6.5DYRK2 RP11-620J15.2 6SSR ≥8 RPS3 IGFBP5 9C3U ≥6.5DYRK2 RPS6KA3 6SSR ≥8 RPSAP52 CS LFKM ≥6.5DYRK2 SP1 6SSR ≥8 RPSAP52 SARNP RZA9 ≥8E2F7 AC124890.1 LFKM ≥6.5 SAP130 DNM3 91Z1 ≥6.5EARS2 RIOK3 0UB7 ≥8 SARNP TMEM19 LFKM ≥8EBPL LRCH1 WHGE ≥8 SASH1 EFHC1 91Z1 ≥6.5EEA1 LRRIQ1 2CJV ≥8 SASH1 RABGAP1L 91Z1 ≥6.5EEA1 RP11-13A1.3 2CJV ≥8 SBF1 KIRREL3 2SQ0 ≥6.5EEA1 TBK1 2CJV ≥8 SBNO2 ANKS1B RZA9 ≥6.5EEA1 VWC2 T56Q ≥8 SCAF8 TMEM181 7GAB ≥8EEF1A1P11 IGF2R W7DB ≥8 SCFD1 KCNMB4 91Z1 ≥6.5EEF2 DAPK3 QIEE ≥6.5 SCN10A UQCRC1 PC8Y ≥8EEFSEC KPNA1 WHGE ≥8 SCN8A FRS2 LL1U ≥6.5EFHC1 DNM3 91Z1 ≥6.5 SCN8A TPH2 LL1U ≥8EFHC1 FRS2 91Z1 ≥8 SCYL3 NME7 7GAB ≥6.5EFNA5 SERINC5 91Z1 ≥8 SDK1 USP42 VEJN ≥8EGFR OGDH VEJN ≥8 SEC16B TOR1AIP1 PC8Y ≥8EIF3D TXN2 2SF3 ≥8 SERINC3 AP001607.1 48LU ≥6.5EIF3E PAG1 8UBW ≥8 SERINC5 C12orf28 91Z1 ≥6.5ELF2 SLC24A3 GLXU ≥8 SERINC5 CDK4 91Z1 ≥6.5ELK3 C12orf55 TT6Q ≥6.5 SERINC5 NEDD1 KWB3 ≥6.5ELK3 R3HDM2 NTAT ≥8 SERINC5 FBXL12 YRZB ≥6.5ELK3 HOXC5 RW8V ≥8 SERINC5 STX6 91Z1 ≥8ELK3 HOXC6 RW8V ≥8 SETD1B RAD9B 2CJV ≥6.5ELK3 RAP1B RW8V ≥8 SGK3 COL4A3 GLXU ≥6.5EN1 FAM153C GLXU ≥8 SGSM1 TNRC6B G9EG ≥8ENSA BAZ2A JSF3 ≥6.5 SH3BP1 ATAD3A QIEE ≥6.5EPB41L5 MAPKAPK2 JSF3 ≥8 SH3PXD2A AC021066.1 6MN5 ≥6.5EPC2 LRP2 JSF3 ≥8 SH3PXD2A AC021066.1 RW8V ≥6.5EPHX1 ENAH QX1T ≥6.5 SHFM1 SRPK2 G9EG ≥8EPM2A RPAP2 W7DB ≥8 SLC16A7 PTPRQ 5TGD ≥6.5EPYC METAP2 RW8V ≥8 SLC22A20 PROCR 12C6 ≥6.5EPYC RP11-394J1.2 RW8V ≥8 SLC25A27 CD2AP GJQ0 ≥6.5
Continued on next page

106
Table S4 – continued from previous page
Gene1 Gene2 Sample Score Gene1 Gene2 Sample Score
ERC2 SNRK PC8Y ≥8 SLC25A3 RPL6P25 6MN5 ≥6.5ESPL1 RAPGEF3 6MN5 ≥8 SLC26A10 DPF3 63LW ≥6.5ESPL1 RAPGEF3 RW8V ≥8 SLC2A13 GRIP1 PC8Y ≥6.5ETHE1 MACROD2 8UBW ≥8 SLC2A13 RPL29P32 PC8Y ≥6.5EVC2 FRAS1 EZNS ≥8 SLC35E3 NELL2 7GAB ≥6.5EVX1 PDE1C EU4K ≥8 SLC35E3 HS3ST5 T56Q ≥6.5EXOC2 FYN 91Z1 ≥8 SLC35F1 EFHC1 91Z1 ≥6.5EXOC2 GTF3C6 91Z1 ≥8 SLC35F1 METTL13 91Z1 ≥6.5EYA4 PREP LL1U ≥8 SLC38A2 LRIG3 63LW ≥6.5FAM105B CLPTM1L 2SQ0 ≥6.5 SLC38A4 FAM19A2 7GAB ≥6.5FAM182A TPH2 JSF3 ≥8 SLC52A1 SSH1 TT6Q ≥8FAM182B TPH2 JSF3 ≥8 SLC9A8 ANKFY1 VEJN ≥6.5FAM189A1 BLOC1S6 12C6 ≥6.5 SLCO1B1 NFIB GLXU ≥6.5FAM193A AC019118.3 2SQ0 ≥6.5 SMARCA2 DAB1 QX1T ≥6.5FAM19A2 DDX23 LL1U ≥6.5 SMARCA4 PCDH19 TT6Q ≥6.5FAM204A NR3C1 48LU ≥8 SMARCC2 PPM1H JSF3 ≥6.5FAM210B EYA2 ZDBB ≥6.5 SMG6 ALKBH5 EZNS ≥6.5FAM214A RYR3 63LW ≥8 SMG6 HMGB3P23 EZNS ≥6.5FAM214A SLC38A1 63LW ≥8 SMG9 IFT20 0UB7 ≥6.5FAM22B YWHAE VK9K ≥8 SMPDL3A SND1 LL1U ≥8FAM24B snoU13 6MN5 ≥8 SND1 AKAP7 LL1U ≥6.5FAM5B MDM2 NF4Z ≥8 snoU13 C12orf60 Q0QG ≥6.5FBXL18 ARSB 12C6 ≥6.5 snoU13 CUZD1 RW8V ≥6.5FBXL3 TOP3A QX1T ≥8 SNRK RP5-1027O15.1 TT6Q ≥6.5FBXL7 METTL25 8UBW ≥8 SNRNP48 GPR126 LL1U ≥6.5FER KIAA1109 GLXU ≥8 SNRPD3 PES1 G9EG ≥6.5FGD6 MYO1H TT6Q ≥8 SNRPD3 PRNP T56Q ≥6.5FGFR1OP2P1 PAN3 ZDBB ≥8 SNX13 SOSTDC1 LVPU ≥8FIGN EVPL GLXU ≥6.5 SNX24 RGS13 2CJV ≥6.5FIS1 BCR G9EG ≥6.5 SOX2-OT COL4A2 12C6 ≥6.5FMO1 GOLPH3L 2CJV ≥8 SOX2-OT LRRK1 SSYE ≥6.5FMO3 TRHDE S81X ≥8 SOX3 PAK1 0UB7 ≥6.5FN1 AC114499.1 23V2 ≥6.5 SP1 RPS6KA3 6SSR ≥6.5FOXN3 TELO2 GLXU ≥8 SPAG6 FRS2 LL1U ≥6.5FRAS1 IGJ EZNS ≥8 SPARC H19 91Z1 ≥6.5FRMD6 FAM120A 2SQ0 ≥6.5 SPARC COL1A2 EZNS ≥6.5FRS2 AC139931.1 8UBW ≥6.5 SPARC MMP9 YHM7 ≥6.5FRS2 CDK18 8UBW ≥6.5 SPSB4 TM9SF2 WHGE ≥8FRS2 CPM 8UBW ≥6.5 SRGAP1 HMGA2 6SSR ≥6.5FRS2 CDK2 LL1U ≥6.5 SRGAP1 TAC3 LFKM ≥8FRS2 FAM19A2 LL1U ≥6.5 SRGAP2B LRAT ERAH ≥6.5FRS2 AC131213.1 RZA9 ≥6.5 SRPK2 TCF4 12C6 ≥8FRS2 DPYD W7DB ≥6.5 SS18 SSX1 BV4N ≥8FRS2 PDE4DIP 2CJV ≥8 SS18 SSX1 L2JM ≥8FRS2 METTL25 8UBW ≥8 SS18 VPS4B PC8Y ≥8FRS2 PRTFDC1 LL1U ≥8 SS18 SSX1 S4JF ≥8FRS2 SRXN1 LL1U ≥8 SS18 SSX1 V7AX ≥8FRS2 RP11-620J15.3 TT6Q ≥8 SSH1 LRRC10 TT6Q ≥6.5FRS2 LRRC8B W7DB ≥8 SSR1 RP11-127H5.1 T56Q ≥6.5
Continued on next page

107
Table S4 – continued from previous page
Gene1 Gene2 Sample Score Gene1 Gene2 Sample Score
FRS2 MARCH9 W7DB ≥8 ST8SIA1 KLHDC5 60AP ≥6.5FRS2 MDM2 W7DB ≥8 ST8SIA1 MBP PC8Y ≥6.5GABBR2 PDGFRA 2SQ0 ≥8 STAB2 DNM2 TT6Q ≥6.5GAS2 TSFM 7GAB ≥8 STAT5B DEAF1 6Z0N ≥6.5GBP1 NEGR1 EZNS ≥8 STAT6 RAP1B RW8V ≥6.5GDAP2 ST7L VEJN ≥8 STAU1 HS3ST3A1 VEJN ≥6.5GFM1 SOX2-OT GLXU ≥8 STK24 DNAJC3 5KJM ≥6.5GFPT2 TRIO GLXU ≥8 STK24 DZIP1 5KJM ≥6.5GINM1 RWDD3 W7DB ≥8 STX6 MARCH9 91Z1 ≥6.5GIT2 TMEM106C 6MN5 ≥8 STXBP5 GOPC T56Q ≥6.5GIT2 TMEM106C RW8V ≥8 SVEP1 PPFIA2 TT6Q ≥6.5GLDC METTL16 VEJN ≥8 SVEP1 WDR31 TT6Q ≥8GLG1 MT1F QX1T ≥8 SVOP LRRC10 TT6Q ≥6.5GLG1 MT1X QX1T ≥8 SVOP SSH1 TT6Q ≥6.5GLI1 FANCC YRZB ≥6.5 SYN3 KLF16 ERAH ≥6.5GLI1 PTPRQ JSF3 ≥8 SYNE1 DCBLD1 T56Q ≥6.5GLI1 MKL1 LXSA ≥8 SYT1 CS LFKM ≥6.5GLI1 ZFAND5 YRZB ≥8 SYT1 RASSF3 LFKM ≥6.5GLT25D2 ACACB NF4Z ≥6.5 SYT1 USP15 7GAB ≥8GM2AP2 C1orf112 91Z1 ≥6.5 SYT1 TMEM19 LFKM ≥8GNA12 RNASEH2B M428 ≥8 TAMM41 PRICKLE2 GLXU ≥6.5GNB5 PTPRB 63LW ≥8 TARSL2 FAM169B PC8Y ≥6.5GNG12 COL22A1 5KJM ≥6.5 TAX1BP3 RP11-536P6.3 2SQ0 ≥6.5GNS KRR1 LFKM ≥8 TBC1D15 LGR5 8UBW ≥6.5GNS TMEM5 LFKM ≥8 TBC1D15 HOXC5 LFKM ≥6.5GPC5 DNAJC3 12C6 ≥6.5 TBC1D28 KDM2A 0UB7 ≥6.5GRB2 KCNMB4 63LW ≥8 TBC1D5 C1orf81 9C3U ≥6.5GRIA3 PPFIA2 TT6Q ≥8 TBC1D9 ASTN2 2SQ0 ≥6.5GRIA3 ZNF618 TT6Q ≥8 TBCK SEC31A EZNS ≥6.5GRIP1 ADAM17 TT6Q ≥6.5 TBP DUSP6 2CJV ≥6.5GRIP1 MSRB3 8UBW ≥8 TCEA1 SOX17 91Z1 ≥6.5GRIP1 PLCZ1 8UBW ≥8 TCF7L1 ATG2B 2CJV ≥6.5GRIP1 TMTC2 8UBW ≥8 TDRD12 CSPP1 GLXU ≥6.5GRIP1 ZDHHC17 8UBW ≥8 TDRD12 PDZRN4 GLXU ≥6.5GRIP1 PPP1R12A JSF3 ≥8 TENC1 ELK3 RW8V ≥6.5GRIP1 LRIG3 LFKM ≥8 TERT TRIO 8UBW ≥8GRM1 CPSF6 7GAB ≥6.5 TFB1M MDM2 7GAB ≥6.5GRM7 LEKR1 9C3U ≥8 TFDP1 RP11-568A7.2 91Z1 ≥6.5GRN ACTG1 N61A ≥6.5 TFDP1 TMEM217 91Z1 ≥8GS1-410F4.4 ANKHD1 8UBW ≥6.5 TGFBR2 TKTL1 GLXU ≥8GSK3B MITF 9C3U ≥8 TIMELESS RBMS2 LFKM ≥6.5GSK3B RP11-319G6.1 9C3U ≥8 TK1 RASL11A 9C3U ≥6.5GSTA1 DNM3 91Z1 ≥6.5 TKTL1 RP13-884E18.2 GLXU ≥6.5GTF2A1 KPNA3 GLXU ≥8 TMEFF2 ANKRD44 JSF3 ≥6.5GTF2I MPP7 OWEN ≥8 TMEM117 CNOT2 JSF3 ≥6.5GTSF1 AGAP2 HLDX ≥6.5 TMEM117 NELL2 JSF3 ≥6.5GTSF1 TTLL7 HLDX ≥8 TMEM117 DIP2B LL1U ≥6.5GXYLT2 RP11-735B13.1 PC8Y ≥8 TMEM19 RPSAP52 FGYL ≥6.5GYPC BIN1 91Z1 ≥6.5 TMEM194A GPR182 91Z1 ≥6.5
Continued on next page

108
Table S4 – continued from previous page
Gene1 Gene2 Sample Score Gene1 Gene2 Sample Score
HELB SCFD1 8UBW ≥8 TMEM194A ATXN7L3B LFKM ≥6.5HLA-DRB6 HLA-DPB1 SSYE ≥6.5 TMEM198B BEST3 LL1U ≥6.5HMGA2 SETD1B 2CJV ≥8 TMEM5 RP11-305O6.3 LFKM ≥6.5HMGA2 IL22 JSF3 ≥8 TMEM56 RP11-620J15.1 W7DB ≥6.5HMGA2 TRHDE JSF3 ≥8 TMEM80 STAT5B 6Z0N ≥6.5HMGA2 ZDHHC17 LFKM ≥8 TMEM87A HOXC5 63LW ≥6.5HMGA2 KERA LL1U ≥8 TMLHE MED12 CZN2 ≥6.5HMGA2 RP11-13A1.3 NF4Z ≥8 TMOD3 ZNF808 63LW ≥8HMGA2 RP1-34H18.1 RW8V ≥8 TMTC2 RP11-268G12.1 6SSR ≥6.5HMGB1P36 FOXP1 PC8Y ≥6.5 TMTC2 LRFN5 8UBW ≥6.5HNRNPU AL592494.5 YHM7 ≥6.5 TMTC2 PDE4DIP JSF3 ≥6.5HOXC4 C12orf54 RW8V ≥6.5 TMTC2 METTL25 NTAT ≥6.5HOXC5 C12orf54 RW8V ≥6.5 TMTC2 ELMO1 T56Q ≥6.5HOXC5 NABP2 LFKM ≥8 TNFSF12 RBFOX3 OWEN ≥6.5HOXC5 NACA LFKM ≥8 TNMD UBE3B TT6Q ≥8HSPB8 RPH3A NF4Z ≥8 TNNT1 SRRM2 EU4K ≥6.5HYDIN NTNG1 W7DB ≥8 TNR MDM2 91Z1 ≥6.5ICT1 KCTD2 LL1U ≥8 TNRC18 MICALL2 M428 ≥6.5IDS ODZ3 JSF3 ≥8 TNRC6C RP11-136F16.1 63LW ≥6.5IFI16 RP11-335O4.1 HLDX ≥8 TNS1 CXCR2 KWB3 ≥6.5IFNG-AS1 C12orf28 NTAT ≥6.5 TOR1AIP2 UNC13C PC8Y ≥8IFNG-AS1 RP11-620J15.3 LFKM ≥8 TPH2 TMTC2 6MN5 ≥6.5IFNGR1 SLC35E3 91Z1 ≥8 TPH2 CR381670.1 JSF3 ≥6.5IGF2 COL1A2 6MN5 ≥6.5 TPH2 ERBB4 JSF3 ≥6.5IGF2R OS9 W7DB ≥8 TPH2 OSBPL8 JSF3 ≥6.5IGLL5 IGLV4-69 CHZ6 ≥8 TPH2 PPP1R12A JSF3 ≥6.5IKZF2 IFNG-AS1 JSF3 ≥6.5 TPH2 RP11-54A9.1 JSF3 ≥6.5IL26 ITGB1 JSF3 ≥8 TPH2 TMTC2 JSF3 ≥6.5ILF3 ZNF560 Q0QG ≥8 TPH2 FRS2 LL1U ≥6.5IRAK3 DNM3 S81X ≥6.5 TPH2 SCAF11 LL1U ≥6.5IRAK3 METTL21B FGYL ≥8 TPH2 HMGA2 NTAT ≥6.5IRAK4 PPHLN1 6MN5 ≥8 TPH2 NBPF11 W7DB ≥6.5IRAK4 RP11-230G5.2 JSF3 ≥8 TPH2 NBPF12 W7DB ≥6.5ISM1 ZEB1 YHM7 ≥8 TPH2 VTI1A 6MN5 ≥8ITGA5 PRKACB HLDX ≥8 TPH2 VTI1A RW8V ≥8ITGA5 TRHDE LFKM ≥8 TPM1 CHRDL2 9C3U ≥6.5ITGAE NCOR1 60AP ≥8 TPM1 MGP 9C3U ≥6.5ITPR2 CAPRIN2 Q0QG ≥6.5 TPM2 MYL2 EU4K ≥6.5JAKMIP2 TNIP1 WHGE ≥8 TPM2 TPM1 KWB3 ≥6.5JAZF1 SUZ12 72GV ≥8 TPM2 KRT17 LXSA ≥6.5KATNA1 MDM2 T56Q ≥8 TPM2 TPM4 KWB3 ≥8KCNC2 LGR5 T56Q ≥8 TRAPPC12 ELK3 TT6Q ≥6.5KCNH1 CDK18 8UBW ≥6.5 TRAPPC8 RP11-386P4.1 PC8Y ≥6.5KCNIP4 ALB 6Z0N ≥6.5 TRAPPC9 KNTC1 12C6 ≥6.5KCNIP4 FAM13A EZNS ≥6.5 TRAPPC9 COL22A1 6MN5 ≥6.5KCNIP4 SCARB2 EZNS ≥8 TRAV41 NCKAP1 8UBW ≥6.5KCNJ12 DPM1 VEJN ≥6.5 TRHDE FRS2 63LW ≥6.5KCNMA1 RAD9B 2CJV ≥8 TRHDE RP11-171L9.1 63LW ≥6.5KCNMA1 YWHAE VK9K ≥8 TRHDE SP1 6MN5 ≥6.5
Continued on next page

109
Table S4 – continued from previous page
Gene1 Gene2 Sample Score Gene1 Gene2 Sample Score
KCNMB4 COCH 8UBW ≥6.5 TRHDE CPM HLDX ≥6.5KCNMB4 MDM2 91Z1 ≥8 TRHDE RP11-
498M15.1JSF3 ≥6.5
KCNMB4 MSRB3 JSF3 ≥8 TRHDE RP11-956E11.1 JSF3 ≥6.5KCNMB4 ZDHHC17 JSF3 ≥8 TRHDE SP1 RW8V ≥6.5KCTD1 AKAP10 VEJN ≥6.5 TRHDE RP11-366L20.4 W7DB ≥6.5KDM1B EYS WHGE ≥6.5 TRHDE YEATS4 S81X ≥8KDM4C RP11-536O18.1 EU4K ≥8 TRIM65 WBP2 W6TV ≥8KIAA0146 RPL39L GLXU ≥8 TRPC4 TSC22D1 0UB7 ≥8KIAA0355 CCDC59 8UBW ≥6.5 TRPM3 FAM122A T56Q ≥6.5KIAA0895 IFI6 RZA9 ≥6.5 TSFM NELL2 7GAB ≥6.5KIAA0947 CTDSP2 5TGD ≥6.5 TSFM NUP210L PC8Y ≥6.5KIAA1109 SMPD4 GLXU ≥8 TSFM VDR 6MN5 ≥8KIAA1191 NEURL1B M428 ≥8 TSFM VDR RW8V ≥8KIAA1199 C20orf196 Q0QG ≥6.5 TSPAN31 BBS10 6SSR ≥6.5KIAA1211 CLOCK EZNS ≥6.5 TSPAN31 SNORA40 91Z1 ≥6.5KIAA1324L DNAJC2 2SQ0 ≥6.5 TSPAN8 OR10AD1 JSF3 ≥6.5KIAA1586 PRIM2 8UBW ≥8 TSPAN8 PTPRQ LFKM ≥6.5KIAA1715 BAZ2B V7AX ≥6.5 TSPAN8 RP11-81H14.2 NTAT ≥6.5KIAA1919 SASH1 91Z1 ≥8 TTC39B CREB5 EU4K ≥6.5KIAA2026 UBBP4 VEJN ≥8 TUFT1 C12orf55 FGYL ≥6.5KIF13A MFSD12 UYD8 ≥8 TULP4 PTN LL1U ≥6.5KIF5A RP1-34H18.1 RW8V ≥8 TXNDC11 RP11-77K12.1 NTAT ≥6.5KIF5A TMPRSS12 RW8V ≥8 U6 SEC23IP 0UB7 ≥6.5KIFAP3 NEDD1 FGYL ≥8 U6 PDE7B 7GAB ≥6.5KITLG FRS2 2CJV ≥6.5 U6 IQSEC3 8UBW ≥6.5KLF11 CHPT1 TT6Q ≥6.5 U6 TMEM194A 91Z1 ≥6.5KLHL22 FBLN1 S81X ≥6.5 U6 GJB6 9C3U ≥6.5KNDC1 MYB W7DB ≥8 UAP1 DDR2 S81X ≥6.5KPNA1 GTPBP8 WHGE ≥6.5 UBB UBC 60AP ≥8KRR1 RP11-101K23.1 6MN5 ≥8 UBE2G1 DOK5 VEJN ≥6.5KRT86 PPHLN1 HLDX ≥8 UBN2 SNORA48 2SQ0 ≥6.5LAMA4 TRAF3IP2 91Z1 ≥8 UBXN7 RNA5SP231 9C3U ≥6.5LCORL SLC2A9 ZDBB ≥8 UNC5D SNTG1 BV4N ≥6.5LCT GYPC 91Z1 ≥6.5 URI1 BSPRY TT6Q ≥6.5LDHAL6CP KRR1 LFKM ≥6.5 USP42 AC006465.3 BV4N ≥6.5LDLR RP11-110A12.2 RZA9 ≥8 USP44 EPYC RW8V ≥6.5LGALS3BP PUS7 2SF3 ≥8 USP45 ANKRD32 91Z1 ≥6.5LGR4 MDK LXSA ≥8 USP6 AIG1 5KJM ≥6.5LGR5 ACSS3 8UBW ≥6.5 UST R3HDM2 NTAT ≥6.5LGR5 PTPRR RZA9 ≥8 UTP20 NUP107 TT6Q ≥6.5LIFR PRSS12 GLXU ≥8 UTP6 ZNF521 VEJN ≥8LIN52 M6PR 63LW ≥8 VAV3 GBP1P1 W7DB ≥6.5LIN7A ARID2 5TGD ≥6.5 VCP TMEM206 2SQ0 ≥6.5LINC00478 AP000470.2 EZNS ≥6.5 VDR RP11-221N13.4 6MN5 ≥6.5LINC00478 AP000477.3 EZNS ≥6.5 VPS35 KPNA7 UMND ≥6.5LINC00670 STX8 GQPU ≥8 VPS41 DPP10 JSF3 ≥6.5LL22NC03-80A10.6
CABIN1 G9EG ≥6.5 VPS8 TCF20 12C6 ≥6.5
Continued on next page

110
Table S4 – continued from previous page
Gene1 Gene2 Sample Score Gene1 Gene2 Sample Score
LL22NC03-80A10.6
MICALL1 G9EG ≥8 VPS8 GM2AP1 9C3U ≥6.5
LMTK2 PUS7 G9EG ≥8 VWC2 KCNMB4 JSF3 ≥6.5LPAR6 NALCN CZN2 ≥8 WASH3P TPT1-AS1 LXSA ≥6.5LPHN1 FXR2 QX1T ≥6.5 WIF1 FRS2 8UBW ≥6.5LRBA DLEU2 QX1T ≥6.5 WNT10B ATP10A 63LW ≥6.5LRCH1 KIAA1704 EC1C ≥6.5 WRAP53 GTF2A1 GLXU ≥6.5LRFN5 FRS2 8UBW ≥6.5 WSB1 RP11-131K5.1 QX1T ≥6.5LRFN5 HMGA2 8UBW ≥6.5 XIRP2 NAP1L1 6SSR ≥6.5LRIG3 BCL11B NTAT ≥6.5 XRCC5 FTX GLXU ≥6.5LRP1 CCDC59 JSF3 ≥6.5 XRCC6BP1 PPHLN1 HLDX ≥6.5LRP1 SLC16A7 LFKM ≥8 XRCC6BP1 RASSF3 LFKM ≥6.5LRP1 SLC11A2 RW8V ≥8 XRCC6BP1 FRS2 TT6Q ≥6.5LRP1 RAB3IP RZA9 ≥8 XRN1 RP11-167H9.4 T56Q ≥6.5LRP4 CKAP5 WHGE ≥6.5 Y RNA MARCH6 12C6 ≥6.5LRP8 MAGOH CHZ6 ≥8 Y RNA RAB21 W7DB ≥6.5LRRC37A2 KANSL1 1T2G ≥6.5 YEATS2 IL17RD 9C3U ≥6.5LRRC37A2 KANSL1 S4JF ≥6.5 YEATS4 RP11-654D12.2 LL1U ≥6.5LRRC48 NCOR1 60AP ≥8 YLPM1 ZFYVE26 JSF3 ≥8LRRC48 RP5-947P14.1 60AP ≥8 YWHAE CRK LXSA ≥6.5LRRC8C RAP1B W7DB ≥8 YWHAG YEATS4 LL1U ≥6.5LRRC8C RP11-362K2.2 W7DB ≥8 YWHAZP2 HHAT JSF3 ≥6.5LRRC8D SUCO W7DB ≥8 ZBBX SDHAP2 G9EG ≥6.5LTBP4 SAE1 Q0QG ≥8 ZBTB24 ZBTB49 LL1U ≥8LVRN KDM2B 2CJV ≥6.5 ZCCHC11 AC092661.1 BV4N ≥6.5LVRN RP11-324P9.1 2CJV ≥8 ZCWPW2 BSDC1 PC8Y ≥6.5LYZ TMTC2 6SSR ≥8 ZFC3H1 TSPAN8 JSF3 ≥6.5LYZ OTOGL LFKM ≥8 ZFC3H1 RP11-
1038A11.3PC8Y ≥6.5
LYZ NSUN6 LL1U ≥8 ZFP64 RP11-372K20.1 9C3U ≥6.5MACF1 PLA2G2A VK9K ≥8 ZFP64 NF1 VEJN ≥6.5MACROD2 GABARAPL1 Q0QG ≥6.5 ZFP64 SUZ12 VEJN ≥6.5MAFIPL ESCO1 PC8Y ≥6.5 ZFX SMS 6SSR ≥6.5MAGT1 AC093901.1 GLXU ≥6.5 ZHX3 TOP1 ZDBB ≥6.5MAGT1 CPA6 GLXU ≥6.5 ZMAT5 IGLV3-21 G9EG ≥6.5MAPKBP1 SLC25A13 48LU ≥8 ZMYND11 SOX5 YHM7 ≥6.5MARCH11 SCARA3 NTAT ≥8 ZNF146 MYBPC1 TT6Q ≥6.5MARS CELSR2 JSF3 ≥6.5 ZNF18 ZNF333 TT6Q ≥8MARS CTD-2526M8.2 PC8Y ≥6.5 ZNF277 EGFR 12C6 ≥6.5MARS PMEL LFKM ≥8 ZNF280D NTRK3 PC8Y ≥6.5MATN2 HMGA2 1T2G ≥6.5 ZNF333 RPL21P122 TT6Q ≥6.5MBIP RP11-149A7.2 2SQ0 ≥8 ZNF345 RAI14 8UBW ≥6.5MBTD1 AL845154.2 VEJN ≥6.5 ZNF407 ZNF516 PC8Y ≥8MCPH1 VWA8 LVPU ≥8 ZNF430 YEATS4 RZA9 ≥6.5MDM1 MSRB3 8UBW ≥8 ZNF44 BET1L Q0QG ≥6.5MDM1 MED21 JSF3 ≥8 ZNF551 RP11-
492M23.2JSF3 ≥6.5
MDM2 CDK17 NTAT ≥6.5 ZNF585A SMARCA4 QIEE ≥6.5MDM2 PTPRD 8UBW ≥8 ZNF736 VKORC1L1 12C6 ≥6.5
Continued on next page

111
Table S4 – continued from previous page
Gene1 Gene2 Sample Score Gene1 Gene2 Sample Score
MDM2 PIP4K2C JSF3 ≥8 ZNF775 SCAF11 LL1U ≥6.5MDM2 SNX9 W7DB ≥8 ZNF800 FAM19A2 LL1U ≥6.5MERTK KIFAP3 JSF3 ≥6.5 ZNF800 FRS2 LL1U ≥6.5METAP2 RP11-1105G2.3 RW8V ≥8 ZRANB3 IFI6 GQPU ≥6.5
ZRANB3 IFI6 S4JF ≥6.5
Note: The order of fusion partner 5′ and 3′ is ignored to simplify comparison.

112
Table S5: Fusions identified in 84 prostate cancer samples (n=371, score ≥6.5).
Gene1 Gene2 Sample Score Gene1 Gene2 Sample Score
AC018816.4 AC018816.3 PCA035 ≥6.5 RP4-673D20.3 MYH9 PCA062 ≥6.5AKT3 ADSS PCA030 ≥8 RPL11 DOCK7 PCA069 ≥6.5ATP8A2P1 ATP8A2 PCA190 ≥6.5 RPL13P5 POLR3B PCA138 ≥6.5AXL ACPP PCA198 ≥8 RPL14 EP400 PCA037 ≥6.5BCHE ADAMTS9 PCA158 ≥8 RPL14 EP400 PCA069 ≥6.5C7orf63 AC002127.4 PCA188 ≥8 RPL14 ATN1 PCA070 ≥6.5CALR AFF1 PCA034 ≥6.5 RPL14 EP400 PCA090 ≥6.5CCDC141 AC009478.1 PCA035 ≥6.5 RPL14 ATN1 PCA094 ≥6.5CDC27 ATRNL1 PCA127 ≥6.5 RPL14 EP400 PCA106 ≥6.5COPA CCDC19 PCA099 ≥6.5 RPL14 MED15 PCA106 ≥6.5CRTAP AC008069.1 PCA027 ≥6.5 RPL14 MIR205HG PCA106 ≥6.5CTD-2545G14.2
CCAR1 PCA062 ≥6.5 RPL14 EP400 PCA111 ≥6.5
DHRS7 ALOX15B PCA071 ≥6.5 RPN2 BPI PCA025 ≥8DIS3L2 AC073263.1 PCA192 ≥6.5 RPS24 PPIB PCA030 ≥6.5DKK2 AC079949.1 PCA125 ≥6.5 RRBP1 PTPN2 PCA112 ≥6.5DLG2 CAPRIN1 PCA158 ≥8 RYBP DTNBP1 PCA116 ≥6.5DNAJC11 AC017080.1 PCA021 ≥6.5 SCG2 CTNNB1 PCA084 ≥6.5EEF1DP3 ATF7IP PCA025 ≥6.5 SEH1L RRBP1 PCA112 ≥8EMC10 ABCC10 PCA021 ≥6.5 SEMA6D AP000487.5 PCA030 ≥6.5EML5 AP000525.8 PCA043 ≥8 SERPINI1 NAT10 PCA158 ≥8ENO2 DHRS13 PCA138 ≥8 SETD5 RAD18 PCA116 ≥6.5EPC2 DNAJC11 PCA021 ≥6.5 SFPQ RP5-965F6.2 PCA059 ≥6.5ERG AC125238.3 PCA014 ≥6.5 SGMS1 RPAIN PCA062 ≥8ERG CHD2 PCA061 ≥6.5 SHANK2 SEMA6D PCA030 ≥8ERLIN2 ADAM5 PCA196 ≥8 SHQ1 FOXP1 PCA015 ≥8ETV1 AGR2 PCA112 ≥8 SHROOM3 NOX5 PCA184 ≥6.5ETV4 C1orf116 PCA168 ≥8 SKIL SDCCAG8 PCA030 ≥8EXOSC9 DOCK9 PCA044 ≥6.5 SKIL ACPP PCA100 ≥8FAM105A CDH18 PCA044 ≥6.5 SLC12A2 KIAA0040 PCA035 ≥6.5FAM135A DDX43 PCA041 ≥8 SLC22A23 EIF3J PCA148 ≥8FAM160A1 DAGLB PCA198 ≥6.5 SLC25A6 FLJ37644 PCA070 ≥6.5FAM81A COPS2 PCA031 ≥8 SLC25A6 SFN PCA070 ≥6.5FBXO3 AC091493.1 PCA158 ≥6.5 SLC38A2 NLRP11 PCA016 ≥6.5FBXO38 C5orf62 PCA030 ≥8 SLC45A3 ERG PCA028 ≥8FGD5 EPM2AIP1 PCA158 ≥6.5 SLC45A3 SKIL PCA030 ≥8FMN2 ADH5 PCA125 ≥6.5 SLC45A3 ERG PCA099 ≥8FNDC3B COMMD8 PCA196 ≥8 SLC8A1-AS1 AC008280.5 PCA192 ≥8FOLH1 CUL5 PCA039 ≥6.5 SLCO5A1 RNA28S5 PCA027 ≥6.5FOXJ3 ACPP PCA198 ≥8 SLCO5A1 RNA28S5 PCA035 ≥6.5FOXN3 AP000525.8 PCA027 ≥8 SLCO5A1 RNA28S5 PCA057 ≥6.5FUT8 DFFA PCA025 ≥6.5 SLCO5A1 RYR2 PCA057 ≥6.5GOLPH3 C1QTNF3 PCA024 ≥6.5 SLCO5A1 RNA28S5 PCA058 ≥6.5GPM6A CKAP4 PCA195 ≥6.5 SLCO5A1 RNA28S5 PCA059 ≥6.5GRAMD3 CTC-278L1.1 PCA192 ≥6.5 SLCO5A1 RNA28S5 PCA060 ≥6.5GREB1L ESCO2 PCA060 ≥8 SMAD7 EPM2A PCA035 ≥8HFM1 DKK2 PCA058 ≥6.5 SMAD7 SMAD2 PCA035 ≥6.5HIGD1B ERBB2 PCA192 ≥8 SMEK1 EML5 PCA043 ≥8
Continued on next page

113
Table S5 – continued from previous page
Gene1 Gene2 Sample Score Gene1 Gene2 Sample Score
HIP1R GDF15 PCA033 ≥8 SMG1P1 EMILIN2 PCA158 ≥6.5HLA-K HLA-A PCA056 ≥6.5 SNRPN KLF13 PCA045 ≥6.5HNRPLL ABCC4 PCA116 ≥6.5 SOCS5 EIF2AK3 PCA192 ≥6.5hsa-mir-3187 LSM7 PCA057 ≥8 SORBS2 MOB1B PCA184 ≥6.5HTR7 CLK1 PCA030 ≥8 SPDEF ERCC1 PCA031 ≥6.5HTRA4 C8orf42 PCA196 ≥8 SPON2 ENOX1 PCA025 ≥6.5IGHGP IGHG3 PCA099 ≥6.5 SPON2 AC027612.3 PCA030 ≥6.5IGHGP IGHG4 PCA106 ≥6.5 SQRDL ERG PCA059 ≥8IL6 ARPC4-TTLL3 PCA125 ≥6.5 SRBD1 DHX57 PCA192 ≥8IL6ST ADAMTSL1 PCA041 ≥8 SREBF1 ASGR2 PCA198 ≥8ILF2 DYM PCA057 ≥8 SRRM2 CALD1 PCA045 ≥6.5INPP5A CTC-512J12.6 PCA027 ≥6.5 SRRM2 NCL PCA045 ≥6.5IQSEC1 CLASP2 PCA161 ≥6.5 SRRM2 NEFH PCA059 ≥6.5ITCH BCAS4 PCA042 ≥6.5 SRRM2 PTMS PCA072 ≥6.5JMJD1C C10orf107 PCA024 ≥6.5 SRRM2 ACIN1 PCA110 ≥6.5JMJD7-PLA2G4B
GALK2 PCA031 ≥8 STAMBP PDE11A PCA192 ≥8
KCNU1 DDHD2 PCA196 ≥8 STARD9 MPP5 PCA025 ≥6.5KLK3 KLK2 PCA015 ≥8 STAU1 DMGDH PCA030 ≥8KLK3 KLK2 PCA027 ≥8 STX10 AC139099.4 PCA037 ≥6.5KLK3 KLK2 PCA030 ≥6.5 STX17 APBA2 PCA041 ≥6.5KLK3 KLK2 PCA035 ≥8 SUFU MINPP1 PCA035 ≥8KLK3 KLK2 PCA037 ≥6.5 SUGP1 FAM124A PCA037 ≥8KLK3 KLK2 PCA038 ≥6.5 SUSD1 RPL26 PCA084 ≥6.5KLK3 KLK2 PCA044 ≥8 SUZ12 CALR PCA116 ≥6.5KLK3 KLK2 PCA045 ≥8 TACC1 FRY PCA043 ≥8KLK3 KLK2 PCA056 ≥8 TAGAP SNX9 PCA072 ≥8KLK3 KLK2 PCA059 ≥8 TBC1D14 BCAS3 PCA033 ≥6.5KLK3 KLK2 PCA061 ≥6.5 TERF2IP PSMD11 PCA049 ≥8KLK3 KLK2 PCA064 ≥6.5 TFAP2A CPNE4 PCA037 ≥8KLK3 KLK2 PCA069 ≥6.5 TFG GPR128 PCA049 ≥8KLK3 KLK2 PCA070 ≥8 TGS1 LYN PCA026 ≥8KLK3 KLK2 PCA071 ≥8 THADA POLR1A PCA192 ≥8KLK3 KLK2 PCA090 ≥8 THADA SRBD1 PCA192 ≥8KLK3 KLK2 PCA091 ≥8 THNSL2 FBLN1 PCA116 ≥6.5KLK3 KLK2 PCA092 ≥6.5 TIMP3 EXOC6B PCA188 ≥6.5KLK3 KLK2 PCA094 ≥8 TLK2 PRKCA PCA041 ≥6.5KLK3 KLK2 PCA096 ≥8 TMBIM6 MSMB PCA059 ≥6.5KLK3 KLK2 PCA106 ≥6.5 TMC6 RELA PCA026 ≥8KLK3 KLK2 PCA110 ≥8 TMEFF2 TMC1 PCA043 ≥8KLK3 KLK2 PCA111 ≥8 TMEM181 PLEKHS1 PCA161 ≥8KLK3 KLK2 PCA144 ≥8 TMEM232 NDST1 PCA146 ≥8KLK3 KLK2 PCA146 ≥6.5 TMEM241 DOK6 PCA190 ≥8KLK3 KLK2 PCA168 ≥8 TMEM59 TCF12 PCA184 ≥6.5KLK4 KLK3 PCA031 ≥6.5 TMEM91 ATP5SL PCA198 ≥8KLK4 KLK3 PCA062 ≥6.5 TMPO C10orf11 PCA021 ≥8KLK4 KLK3 PCA098 ≥6.5 TMPRSS2 ERG PCA015 ≥8LCP1 ERG PCA144 ≥6.5 TMPRSS2 ERG PCA016 ≥6.5LDLR CLPTM1 PCA168 ≥6.5 TMPRSS2 ERG PCA024 ≥8
Continued on next page

114
Table S5 – continued from previous page
Gene1 Gene2 Sample Score Gene1 Gene2 Sample Score
LPP KNG1 PCA057 ≥8 TMPRSS2 ERG PCA025 ≥8LRRK2 KIF21A PCA192 ≥8 TMPRSS2 ERG PCA026 ≥8LSM1 ERICH1-AS1 PCA196 ≥8 TMPRSS2 ERG PCA027 ≥8LYRM5 CCDC91 PCA148 ≥8 TMPRSS2 ERG PCA028 ≥8MAGI1 KIRREL3 PCA037 ≥8 TMPRSS2 ERG PCA031 ≥8MAGI1 FHIT PCA041 ≥8 TMPRSS2 ERG PCA035 ≥8MAST2 IPP PCA109 ≥8 TMPRSS2 ERG PCA037 ≥8MBOAT7 CWH43 PCA031 ≥8 TMPRSS2 ERG PCA038 ≥8MBOAT7 ITPR2 PCA031 ≥8 TMPRSS2 NEDD4L PCA038 ≥6.5Metazoa SRP FAM54B PCA198 ≥6.5 TMPRSS2 ERG PCA039 ≥8MLLT4 ERG PCA015 ≥6.5 TMPRSS2 ERG PCA043 ≥8MOB3B CAAP1 PCA158 ≥6.5 TMPRSS2 ERG PCA049 ≥8MOBP HMGN2P46 PCA196 ≥6.5 TMPRSS2 ERG PCA056 ≥8MSLN DNAH9 PCA192 ≥6.5 TMPRSS2 TMEM87B PCA056 ≥8MSMB KIAA1324 PCA059 ≥6.5 TMPRSS2 IFNGR2 PCA057 ≥8MT-ND5 MT-CO3 PCA043 ≥6.5 TMPRSS2 ERG PCA059 ≥8MYH9 FOXRED2 PCA159 ≥6.5 TMPRSS2 ERG PCA061 ≥8MYO18A CAMKK1 PCA198 ≥8 TMPRSS2 ERG PCA062 ≥8NCOA2 LACTB2 PCA198 ≥8 TMPRSS2 ERG PCA069 ≥8NCOA3 JPH2 PCA042 ≥8 TMPRSS2 ERG PCA070 ≥8NDC80 C2orf74 PCA034 ≥6.5 TMPRSS2 ERG PCA084 ≥8NDC80 C2orf74 PCA156 ≥6.5 TMPRSS2 ERG PCA093 ≥8NDRG1 ERG PCA057 ≥8 TMPRSS2 ERG PCA096 ≥8NDUFAF6 CTB-89H12.4 PCA043 ≥6.5 TMPRSS2 ERG PCA098 ≥8NEK11 IPO8 PCA035 ≥6.5 TMPRSS2 ERG PCA106 ≥8NEK11 MBNL1 PCA035 ≥8 TMPRSS2 ERG PCA111 ≥8NF1 AF127577.11 PCA049 ≥6.5 TMPRSS2 ERG PCA116 ≥8NKX3-1 ATE1 PCA021 ≥6.5 TMPRSS2 ERG PCA124 ≥8NME5 NCKAP1 PCA198 ≥8 TMPRSS2 ERG PCA138 ≥8NPC1L1 LIMCH1 PCA042 ≥6.5 TMPRSS2 SLC37A1 PCA138 ≥8NPEPPS NBR1 PCA098 ≥8 TMPRSS2 ERG PCA155 ≥8NPM1 DBN1 PCA037 ≥6.5 TMPRSS2 ERG PCA156 ≥8NR2F6 FCER2 PCA190 ≥6.5 TMPRSS2 ERG PCA159 ≥8NRAS CNN3 PCA072 ≥6.5 TMPRSS2 ERG PCA161 ≥8NRIP1 NF1 PCA049 ≥8 TMPRSS2 ERG PCA187 ≥8NTM EIF3M PCA158 ≥8 TMPRSS2 ERG PCA190 ≥8OMG NRIP1 PCA049 ≥8 TMPRSS2 CLN6 PCA196 ≥8OR4B1 NUP98 PCA113 ≥6.5 TMPRSS2 LNX1 PCA196 ≥8PAPOLG MTA3 PCA192 ≥8 TP53 LCN15 PCA113 ≥8PARD3 KIAA1704 PCA027 ≥8 TPD52 RP11-48B3.2 PCA198 ≥8PAXIP1 KIAA1549 PCA162 ≥6.5 TRAPPC10 MYO18B PCA188 ≥8PDE11A LRPPRC PCA192 ≥6.5 TRIOBP ERG PCA170 ≥8PDIA4 MATN2 PCA034 ≥6.5 TXNL1 STARD6 PCA146 ≥8PDZD9 DGKD PCA043 ≥6.5 U6 RBM47 PCA030 ≥6.5PIK3C3 LIPG PCA021 ≥6.5 UBA52 CDKN2B-AS1 PCA039 ≥6.5PLA2G2A KLK3 PCA045 ≥6.5 UBA52 CDKN2B-AS1 PCA109 ≥6.5POLR3B ING4 PCA138 ≥8 UBE2E2 FOXP1 PCA155 ≥6.5POU2F1 DPYD PCA041 ≥8 UBE2E3 PAPOLG PCA192 ≥6.5POU2F2 ATAD2B PCA041 ≥8 UBP1 STAG1 PCA037 ≥8
Continued on next page

115
Table S5 – continued from previous page
Gene1 Gene2 Sample Score Gene1 Gene2 Sample Score
PPAP2A MIPEP PCA064 ≥6.5 UGDH KIF21A PCA158 ≥8PPAP2A PDS5B PCA161 ≥6.5 UNC45B HFM1 PCA043 ≥6.5PPAP2A FLI1 PCA196 ≥8 UNC45B RPL37A PCA057 ≥6.5PRIM2 EFHC1 PCA090 ≥6.5 UNC45B HFM1 PCA058 ≥6.5PRIM2 EFHC1 PCA100 ≥6.5 UNC45B ATP4A PCA084 ≥6.5PRIM2 EFHC1 PCA109 ≥6.5 UNC5CL AFF3 PCA111 ≥8PRIM2 EFHC1 PCA134 ≥6.5 USH2A ETV1 PCA192 ≥6.5PRIM2 EFHC1 PCA139 ≥6.5 USP34 COMMD1 PCA159 ≥8PRIM2 EFHC1 PCA144 ≥6.5 USP43 SS18 PCA190 ≥8PRKCA DDX42 PCA084 ≥6.5 VDAC3 B3GALTL PCA138 ≥8PRKCE NUP205 PCA155 ≥6.5 VDAC3 NBN PCA195 ≥8PRKCH ERG PCA070 ≥6.5 VEZF1 RPL14 PCA098 ≥6.5PSD3 DAB1 PCA037 ≥6.5 WDR90 TMCO7 PCA196 ≥6.5PSD3 ABHD2 PCA161 ≥8 WIZ VPS8 PCA025 ≥6.5PSMB3 GAS7 PCA037 ≥6.5 WRAP53 HGS PCA061 ≥6.5PTEN MINPP1 PCA035 ≥8 WSCD1 TRUB1 PCA015 ≥8PTN MTHFD1L PCA030 ≥6.5 WWOX USP34 PCA059 ≥8PTRH2 GATA6 PCA037 ≥8 XBP1 TAGLN PCA060 ≥6.5R3HCC1 PDZRN3 PCA134 ≥6.5 XPO7 M6PR PCA030 ≥8RAB27B FAM105B PCA188 ≥6.5 YPEL1 RHBDL1 PCA192 ≥8RAB4A ETV4 PCA110 ≥8 Y RNA ROGDI PCA158 ≥6.5RAF1 FHIT PCA184 ≥8 Y RNA HMGN2P46 PCA188 ≥6.5RALGAPA2 NKX2-2 PCA031 ≥6.5 ZC3H13 FAM48A PCA144 ≥8RALGAPA2 FHIT PCA041 ≥8 ZDHHC20P1 NPLOC4 PCA112 ≥6.5RAPGEF4 DIS3L2 PCA192 ≥6.5 ZDHHC7 ADAMTS18 PCA015 ≥6.5RBL1 C20orf132 PCA138 ≥8 ZFHX3 TMPRSS2 PCA138 ≥8RBM27 APBA2 PCA041 ≥8 ZFP36 IGKJ5 PCA106 ≥6.5RNA5SP347 IFI6 PCA196 ≥6.5 ZFP64 SFXN1 PCA112 ≥6.5RNF13 COLQ PCA158 ≥8 ZMIZ1 CCDC28A PCA118 ≥6.5RNF170 PARD3 PCA098 ≥6.5 ZMIZ1 CCDC28A PCA196 ≥6.5RNF43 MTMR4 PCA098 ≥6.5 ZNF24 CD226 PCA112 ≥8RP11-174O3.1 PTOV1 PCA038 ≥8 ZNF292 RP1-263J7.2 PCA192 ≥6.5RP11-174O3.1 PTOV1 PCA069 ≥6.5 ZNF292 RP11-532N4.2 PCA198 ≥6.5RP11-19O2.4 GPATCH8 PCA044 ≥6.5 ZNF473 TBX3 PCA030 ≥6.5RP11-20I23.3 RAE1 PCA031 ≥6.5 ZNF503 ADK PCA025 ≥6.5RP11-416L21.1 EML4 PCA196 ≥6.5 ZNF652 RBM3 PCA111 ≥6.5RP11-417J1.1 ODC1 PCA146 ≥6.5 ZNF677 NLRP4 PCA190 ≥8RP11-480D4.3 ODC1 PCA146 ≥6.5 ZNF717 GSK3B PCA158 ≥6.5RP11-505K9.4 ACAA2 PCA138 ≥8 ZNF737 RP11-508M1.3 PCA127 ≥6.5RP11-505K9.4 CEP164 PCA138 ≥8 ZNF737 DACT3 PCA190 ≥8RP11-617D20.1 PANK1 PCA112 ≥6.5 ZP3 HSPA1B PCA170 ≥6.5RP11-902B17.1 LIFR PCA158 ≥6.5
Note: The order of fusion partner 5′ and 3′ is ignored to simplify comparison.

116
Table S6: Fusions identified in 48 GBM samples (n=470, score ≥6.5).
Gene1 Gene2 Sample Score Gene1 Gene2 Sample Score
AF146191.4 ADCY8 AK053r ≥6.5 RP11-141O11.2 CTC-340D7.1 AK203r ≥6.5
AGAP2 ACACA AK100r ≥6.5 RP11-152F13.8 GOLGA6B AK051r ≥6.5APP ABCC4 XEMY ≥8 RP11-159D12.5 EFCAB13 U676 ≥6.5ARMCX4 AP3B1 7EN2 ≥6.5 RP11-166D19.1 FGF3 AK173r ≥6.5ARMCX4 AP3B1 AK100r ≥6.5 RP11-204C23.1 RAF1 AK124r ≥6.5AUTS2 AC011288.2 JGR2 ≥8 RP11-22B23.2 CHD4 AK199r ≥6.5C9orf11 APTX LEZR ≥8 RP11-272B17.2 LRIG3 AK053r ≥6.5CBFA2T3 ANKRD11 AK142r ≥6.5 RP11-272B17.2 AP3B1 AK173r ≥6.5CBWD1 AL583842.3 AK213r ≥6.5 RP11-272B17.2 R3HDM2 AK173r ≥8CCDC171 AP3B1 K82Q ≥6.5 RP11-345F18.1 CHIC2 L5XL ≥6.5CDC27 ACTN4 AK227r ≥6.5 RP11-347I19.3 NOS1 XEMY ≥8CDC42EP3 BMP2K DD22 ≥6.5 RP11-362K2.2 CPSF6 AK053r ≥6.5CDK14 AKAP9 JGR2 ≥8 RP11-364L4.3 HSPA4L AK199r ≥6.5CDKAL1 ARHGAP12 XEMY ≥8 RP11-366L20.2 BIRC6 XEMY ≥8CDKN2B BNC2 L5XL ≥6.5 RP11-372K20.1 GTF3C4 AK153r ≥8CHD9 AMFR GA6F ≥8 RP11-384J4.2 NOVA1 AK199r ≥8CHIC2 AC111194.1 L5XL ≥6.5 RP11-386C23.1 JMJD1C YKZ5 ≥8CLEC16A ACSM1 AK217r ≥8 RP11-39E4.1 PLCH1 AK055r ≥6.5CLEC16A C16orf62 AK217r ≥8 RP11-41O4.1 PCDH15 D3VY ≥6.5CNOT2 CCDC126 AK003r ≥6.5 RP11-420N3.2 CLCN7 AK124r ≥6.5CNOT2 AC007682.1 AK213r ≥6.5 RP11-436F9.1 LANCL2 AK100r ≥6.5CPSF6 CNOT2 AK003r ≥8 RP11-463H12.2 CLOCK L5XL ≥8CTA-292E10.6 CCDC53 AK199r ≥8 RP11-467L24.1 CHD9 GA6F ≥6.5CYC1 BAIAP2 AK139r ≥6.5 RP11-489P6.1 DTX3 AK053r ≥6.5DARS ANP32B 761V ≥6.5 RP1-149C7.1 PHLPP2 STUK ≥8DCTN2 AVIL 59ND ≥8 RP11-4F22.2 KIF3B AZH7 ≥6.5DCTN2 CTDSP2 59ND ≥6.5 RP11-
519M16.1GAB1 AK199r ≥6.5
DCTN2 ACACA AK100r ≥8 RP11-571M6.6 LIMA1 AK142r ≥6.5DGKA ARHGEF25 AK142r ≥6.5 RP11-571M6.7 ACACA AK100r ≥6.5DGKZ CADPS2 AK173r ≥8 RP11-571M6.8 MBD6 AK100r ≥6.5DPY19L1 ADCY7 AK227r ≥6.5 RP11-589P10.7 EFCAB13 U676 ≥6.5DYRK1A AP000946.2 XEMY ≥6.5 RP11-58A17.4 AATF AK100r ≥8EFCAB2 CAPN8 AK178r ≥8 RP11-58A17.4 GLI1 AK100r ≥8EFCAB6 AC073610.1 AK199r ≥6.5 RP11-58A17.4 GRIP1 XEMY ≥8EFCAB6 ARF3 AK199r ≥8 RP11-608B3.1 KLF3 AK199r ≥6.5EIF2AK4 CHURC1 AK100r ≥8 RP11-611E13.2 PTPRR AK003r ≥6.5EPHB2 CD164 AK139r ≥6.5 RP11-614O9.3 KIAA0284 59ND ≥6.5EPM2A DLG1 AK053r ≥6.5 RP11-620J15.2 ACACA AK100r ≥8ERGIC2 A2MP1 AK199r ≥8 RP11-620J15.3 CTDSP2 AK053r ≥8ERP27 CCDC117 AK199r ≥8 RP11-620J15.3 ACACA AK100r ≥8EXOC1 CLOCK L5XL ≥8 RP11-620J15.3 PPM1H AK199r ≥6.5FAF1 AGBL4 K48U ≥8 RP11-655H13.2 EPC1 XEMY ≥8FAM133B AC006374.2 JGR2 ≥6.5 RP11-657O9.1 RAB6B JGR2 ≥6.5FHDC1 DGKG K48U ≥6.5 RP11-690J15.1 NCOR2 AK217r ≥8FNDC3A ABCC4 AK199r ≥8 RP11-707P17.1 MGA K48U ≥6.5
Continued on next page

117
Table S6 – continued from previous page
Gene1 Gene2 Sample Score Gene1 Gene2 Sample Score
FRMD4B FBXL2 AK213r ≥8 RP11-729M20.1
GAB1 AK199r ≥6.5
FSD1L FKTN DUHE ≥8 RP11-739N20.2 LANCL2 DUHE ≥6.5FSTL5 CLCN3 VNDF ≥8 RP11-849H4.2 OTOG AK173r ≥6.5GDF10 GCLC XEMY ≥6.5 RP11-94P11.4 DHCR24 AK185r ≥6.5GJC1 CTC-296K1.3 23H0 ≥6.5 RP11-974F13.6 RP11-
1023L17.1AK199r ≥6.5
GJC1 CTC-296K1.3 AK003r ≥6.5 RP1-230L10.1 QKI AK003r ≥6.5GLI1 DDIT3 59ND ≥6.5 RP3-410C9.1 MIR3687 AK213r ≥6.5GLI1 CPSF6 AK053r ≥8 RP3-453D15.1 NR2E1 AK203r ≥6.5GLI1 AATF AK100r ≥8 RP5-1024C24.1 DNAJC24 AK124r ≥8GLI1 ACACA AK100r ≥6.5 RPGRIP1L FTO GA6F ≥6.5GNB1 CAMTA1 D3H7 ≥6.5 RPH3A HECTD4 K48U ≥6.5GNPDA2 C4orf52 AK199r ≥8 RPS4X COL6A4P1 AK124r ≥8GRIP2 GPD1L AK213r ≥8 RPTOR CBX2 YKZ5 ≥8GRM7 COL6A4P1 AK124r ≥6.5 RTF1 MGA K48U ≥8GTF2IRD1 GTF2I K48U ≥8 SACS LINC00543 7EN2 ≥6.5HMGA2 BIRC6 XEMY ≥6.5 SAMD12 MTSS1 JGR2 ≥8HNRNPH1 AGAP1 AK178r ≥8 SARDH COL5A1 AK178r ≥8HOOK1 DARS AK051r ≥6.5 SCD5 RP11-302F12.3 AK199r ≥8HPSE2 FRMD4A XEMY ≥8 SCD5 PCBD2 JGR2 ≥6.5HSCB CDK17 AK199r ≥8 SCFD2 POLR2B AK003r ≥8HSPA4L GAB1 AK199r ≥8 SCLT1 METTL21B AK199r ≥8ICAM2 ASXL1 AZH7 ≥8 SCN3A SCN1A 59ND ≥8IL1RAPL2 EMC3 AK124r ≥8 SCN3A SCN1A 9JGR ≥6.5ISPD AGMO AK178r ≥8 SCN3A SCN1A AK217r ≥6.5ITPR1 FANCD2 AK124r ≥6.5 SDC2 CPQ STUK ≥8JAK2 GLIS3 D3VY ≥8 SDR42E2 DCTN5 AK217r ≥6.5JMJD1C CDH23 XEMY ≥6.5 SEC22B RP11-277L2.2 DUHE ≥6.5KAT2B ITPR1 AK124r ≥8 SEC61G EGFR AK071r ≥6.5KCNH8 IQCJ-SCHIP1 AK124r ≥6.5 SEMA3C RALA AK217r ≥6.5KDR CHIC2 L5XL ≥8 SERINC5 NEDD1 LEZR ≥6.5KIAA0556 FOPNL AK003r ≥8 SERPINA5 DAAM1 AK199r ≥6.5KIAA1328 GLI1 AK100r ≥6.5 SETBP1 CHST9 D3H7 ≥8KIAA2026 INTS9 9JGR ≥8 SFMBT2 FAM171A1 23H0 ≥8KIAA2026 FARP1 AK124r ≥6.5 SHISA5 GBE1 AK213r ≥8KIAA2026 ERMP1 AK217r ≥6.5 SHISA5 PFKFB4 AK213r ≥6.5KIF17 CAMTA1 D3H7 ≥8 SHISA5 PTPN23 AK213r ≥8KIF5A AVIL AK053r ≥8 SLBP FGFR3 K48U ≥6.5KITLG ANKS1B AK199r ≥6.5 SLC12A3 FTO GA6F ≥6.5KLF3 CTDSP2 AK199r ≥8 SLC13A3 PRKCA AZH7 ≥6.5KRR1 AGAP2 59ND ≥6.5 SLC14A1 NOL4 D3H7 ≥6.5LAMP2 FAM70A K48U ≥8 SLC16A7 MDM2 AK053r ≥6.5LANCL2 EGFR AK053r ≥6.5 SLC16A7 R3HDM2 AK173r ≥8LAP3 FAM114A1 AK199r ≥6.5 SLC16A7 GRIP1 XEMY ≥8LATS2 FRY AK217r ≥8 SLC25A18 CECR2 JGR2 ≥6.5LCTL ARNT2 AK003r ≥8 SLC35E3 SLC16A7 AK053r ≥8LGI1 HAPLN2 AK142r ≥6.5 SLC38A4 GRIN2B AK003r ≥8LIMA1 FAM19A2 AK142r ≥6.5 SLC7A6 NFATC3 K48U ≥8
Continued on next page

118
Table S6 – continued from previous page
Gene1 Gene2 Sample Score Gene1 Gene2 Sample Score
LIN52 ACOT2 AK074r ≥8 SLFN11 FOXK2 U676 ≥8LINC00478 FOLH1 XEMY ≥6.5 SLIT1 CERS5 K48U ≥8LINS AP3B1 AK203r ≥6.5 SMARCA2 GLIS3 77FF ≥6.5LIPJ AP3B1 STUK ≥6.5 SMARCB1 CHST8 VNDF ≥6.5LMBR1 ATXN2 77FF ≥8 SMG1 SH3BGR AK051r ≥8LNX2 CDK8 AK124r ≥8 snoU13 SNAPC3 D3VY ≥6.5LRIG3 CPM AK053r ≥8 snoZ247 EML6 XEMY ≥8LRIG3 CPSF6 AK053r ≥8 snoZ247 TTC27 XEMY ≥8LRRC37A2 KANSL1 AK203r ≥6.5 SNTG2 IL1R2 XEMY ≥6.5MAP4 C20orf194 AK199r ≥8 SPAST ARHGAP12 XEMY ≥8MARCH9 ATXN7L3B AK003r ≥6.5 SPATA6 LINS AK098r ≥6.5MARS DCTN2 3LK6 ≥6.5 SPDYA KCNS3 D3VY ≥6.5MARS CTDSP2 AK053r ≥8 SPG21 FANCI AK185r ≥8MARS ACACA AK100r ≥8 SPHKAP PPP3CC AK124r ≥8MBNL1 ATP2B2 AK124r ≥8 SRGAP3 IQCJ-SCHIP1 AK124r ≥6.5MDM2 ARHGEF25 59ND ≥8 SRPK2 AC011288.2 LEZR ≥6.5MDM2 ATXN7L3B AK003r ≥6.5 ST7 MET AK173r ≥8MDM2 FRMD5 AK003r ≥8 ST7 MET AK199r ≥8MDM2 IFNG-AS1 AK003r ≥8 ST7-AS1 MET AK199r ≥8MDM2 MDM1 AK003r ≥6.5 ST7-OT4 MET AK199r ≥8MDM4 EGFR AK185r ≥8 STAG1 RP11-731C17.1 GA6F ≥6.5MET JAZF1 JGR2 ≥8 STAG2 SMARCA1 AK153r ≥8MET JAZF1-AS1 JGR2 ≥8 STIM2 GUF1 AK199r ≥8METTL1 ACACA AK100r ≥8 STOX2 ING2 AK199r ≥8METTL1 FGF3 AK173r ≥8 STPG1 PPP1R12B AK074r ≥8METTL21B ACACA AK100r ≥6.5 STXBP3 GPSM2 K48U ≥6.5METTL21B MBD6 AK100r ≥8 STYXL1 POR JGR2 ≥8MFN2 FBXO44 K82Q ≥8 SUMF1 SNX12 AK124r ≥6.5MGA DMXL2 K48U ≥8 SUMO2P2 SNAPC3 D3VY ≥6.5MKLN1 CCDC57 AK074r ≥8 SUZ12P EXOC7 AZH7 ≥6.5MON2 KDM2B XEMY ≥6.5 SUZ12P RP11-260O18.1 K82Q ≥6.5MORN3 KDM2B STUK ≥8 SYNE2 CHURC1-FNTB AK178r ≥8MOV10 CSDE1 D3VY ≥8 SYNRG INHBE AK100r ≥8MPRIP HNRNPK AK139r ≥6.5 TADA2A B4GALNT1 AK100r ≥8MRPS9 AC013402.2 XEMY ≥8 TAF3 RP11-325P15.3 AK217r ≥6.5MRPS9 AC068535.4 XEMY ≥8 TBC1D15 KCNC2 AK003r ≥8MSH2 CALM2 K48U ≥6.5 TBC1D15 CPM AK142r ≥8MTAP ADAM28 L5XL ≥8 TBC1D15 MDM2 AK142r ≥6.5MTMR8 BRWD3 AK124r ≥8 TBC1D15 OR6C68 AK142r ≥6.5MYT1L AC013402.2 XEMY ≥6.5 TBC1D22A DNAH10 AK199r ≥6.5MYT1L AC068535.4 XEMY ≥6.5 TBC1D22A PTMS AK199r ≥8MZT1 LCP1 AK142r ≥8 TBC1D5 GRM7 AK124r ≥6.5NBPF20 NBPF15 AK213r ≥6.5 TCEB3 ID3 AK139r ≥6.5NCAM1 LAPTM4B K48U ≥8 TCEB3 MDS2 AK139r ≥8NCOR2 CDH20 761V ≥6.5 TCF20 SRGAP1 AK199r ≥8NCS1 HNRNPUL2 K48U ≥8 TDRD12 PAK7 AK066r ≥6.5NDEL1 AC005772.2 77FF ≥6.5 TERT CCDC127 YKZ5 ≥8NDRG1 AF146191.4 AK053r ≥8 TIAM1 NBEA XEMY ≥8NDRG1 EFR3A VNDF ≥8 TIAM2 PCDH10 AK217r ≥6.5
Continued on next page

119
Table S6 – continued from previous page
Gene1 Gene2 Sample Score Gene1 Gene2 Sample Score
NDUFA4L2 MARS 59ND ≥8 TLE4 NTRK2 JGR2 ≥8NEDD1 C12orf55 AK074r ≥6.5 TLN2 RP11-38G5.1 AK003r ≥6.5NEDD1 C12orf55 LEZR ≥6.5 TM4SF19 PCYT1A YKZ5 ≥6.5NEDD1 C12orf55 WFRL ≥6.5 TMC1 SHC3 AK053r ≥6.5NEK11 C10orf68 AK074r ≥6.5 TMEM132B TDG 59ND ≥6.5NEK11 C10orf68 WFRL ≥6.5 TMEM132B TDG AK168r ≥6.5NFASC MAP4 AK074r ≥8 TMEM164 GMPS AK124r ≥8NFASC ATP2B4 AK185r ≥8 TMEM35 MTMR8 AK124r ≥8NFASC GS1-18A18.2 DUHE ≥8 TMEM50B IFNAR2 761V ≥8NFASC ATP2B4 YKZ5 ≥6.5 TMEM74 SYBU K82Q ≥8NFASC LAX1 YKZ5 ≥8 TMTC1 CTDSP2 AK199r ≥8NFIB KIAA2026 7EN2 ≥6.5 TMTC1 FAR2 AK199r ≥6.5NOS1 AC084018.1 XEMY ≥6.5 TMTC1 NCAPD2 AK199r ≥6.5NOS1AP IRF6 AK217r ≥8 TMTC1 SEL1L3 AK199r ≥6.5NOX4 FOLH1 XEMY ≥6.5 TNR RFWD2 AK199r ≥8NR5A2 KLHL29 761V ≥6.5 TP63 SOX6 AK217r ≥8NRXN2 CADPS2 AK173r ≥8 TPH2 LARP4 AK199r ≥8NTM EXOC4 AK124r ≥6.5 TPTE2P5 TPTE2 AK203r ≥8NVL CAPN8 AK178r ≥6.5 TRIM2 TBCCD1 K48U ≥8OPTC CNTN2 AK185r ≥6.5 TRIM36 CCDC112 761V ≥8OR6C72P LIMA1 AK142r ≥8 TRIM36 CTB-161J7.2 761V ≥6.5OR6C74 CYP27B1 AK142r ≥6.5 TRIO ARHGEF3 AK003r ≥6.5OS9 KRR1 59ND ≥6.5 TRIO ARHGEF3 AK066r ≥6.5OS9 MDM1 AK003r ≥8 TRIO ARHGEF3 AK100r ≥6.5OS9 LRIG3 AK053r ≥6.5 TRPC1 FAM159A 3LK6 ≥6.5OSBPL8 OS9 59ND ≥8 TSFM MDM2 59ND ≥8OSBPL9 BMP8B AK139r ≥6.5 TSFM NAV3 59ND ≥8OSBPL9 MACF1 AK139r ≥8 TSFM RP11-611O2.2 59ND ≥8PACRG DLG1 AK053r ≥8 TSFM ACACA AK100r ≥8PARP11 L3MBTL2 AK199r ≥8 TSFM RAB21 AK142r ≥8PBX3 AC107057.2 AZH7 ≥6.5 TSPAN31 SLC35E3 AK003r ≥6.5PCDHB7 DOT1L YKZ5 ≥6.5 TSPAN9 C12orf5 YKZ5 ≥8PCSK5 C1orf100 AK217r ≥6.5 TTC28 RP11-541G9.1 AK199r ≥6.5PDGFRA NMU L5XL ≥8 TTLL1 C12orf28 AK199r ≥6.5PEAK1 ADAMTSL3 D3VY ≥6.5 TTLL1 RP11-611E13.2 AK199r ≥8PFKFB4 FAM198A AK213r ≥6.5 TULP4 SNX9 AK139r ≥8PFKFB4 GBE1 AK213r ≥8 U6 ITGB3BP AK139r ≥6.5PHF20 CTNNBL1 AK199r ≥8 U6 NFASC DUHE ≥8PHIP APBB1IP XEMY ≥6.5 UBE2E1 BRWD3 AK124r ≥8PHYHIPL AP3B1 3LK6 ≥6.5 UBE2E1 RP3-455H14.1 AK124r ≥6.5PIK3C2B LANCL2 DUHE ≥8 UBE2E2 CRBN AK124r ≥8PIP4K2C OS9 AK053r ≥8 UBE3B APOLD1 AK199r ≥6.5PKNOX2 GRAMD1B D3VY ≥8 UBR2 FAM65B AK203r ≥8PLEKHA6 LANCL2 DUHE ≥8 UBXN2A TARBP1 AK213r ≥8PMM1 BTBD2 K48U ≥8 UNC119B PITPNM2 AK199r ≥6.5POC1B CTDSP2 AK199r ≥8 USHBP1 CNOT2 AK098r ≥6.5POLR1D CDK8 AK124r ≥6.5 USP12 UBAC2 XEMY ≥6.5POU6F2 GATAD2A AK217r ≥6.5 USP32 TBCD U676 ≥6.5PPFIBP1 NUAK1 AK199r ≥6.5 USP8 RP11-162I7.1 DD22 ≥6.5
Continued on next page

120
Table S6 – continued from previous page
Gene1 Gene2 Sample Score Gene1 Gene2 Sample Score
PPP1R15B LANCL2 DUHE ≥6.5 UTP18 C1orf86 AK142r ≥6.5PPP2R3A MSL2 AK217r ≥8 VCL PRR12 K48U ≥6.5PPT1 FOXO6 AK139r ≥8 VOPP1 SEC61G AK074r ≥8PREX1 ARFGEF2 K48U ≥6.5 VOPP1 RASEF AK100r ≥6.5PRKCA NCOA6 AZH7 ≥8 VPS33A CLIP1 AK213r ≥6.5PRR4 ETV6 AK199r ≥8 VSTM2A LANCL2 AK098r ≥8PRUNE2 OSBPL2 AK153r ≥8 VSTM2A LANCL2 AK178r ≥8PTN HSPE1 9JGR ≥6.5 WDFY3 GPM6B AK213r ≥6.5PTPRD KDM4C 7EN2 ≥6.5 WDR70 NXPH1 AK100r ≥6.5PTPRR ATXN7L3B AK003r ≥6.5 WDR70 UBAP1 AK124r ≥6.5PTPRR CPM AK003r ≥6.5 WDR70 UBAP1 AK199r ≥6.5PTPRR CTDSP2 AK003r ≥8 WDR70 NXPH1 AK213r ≥6.5PTPRR MDM1 AK003r ≥6.5 XRCC6BP1 CTDSP2 AK053r ≥6.5PWP1 CAND1 AK199r ≥8 XRCC6BP1 LRIG3 AK053r ≥8PZP AGAP2 AK199r ≥8 XRCC6BP1 AATF AK100r ≥8QKI CTAGE13P AK098r ≥6.5 XRCC6BP1 GRIP1 XEMY ≥8QKI DACT2 AK098r ≥8 XYLB GBE1 AK213r ≥6.5QKI OSTM1 AK203r ≥8 XYLB PTPN23 AK213r ≥6.5R3HDM2 AVIL AK173r ≥8 XYLT1 EGFR AK217r ≥8RAB21 METTL1 AK142r ≥8 XYLT1 UQCRC2 AK217r ≥8RAB21 METTL21B AK142r ≥8 XYLT1 MAML2 K48U ≥8RAB21 OR6C72P AK142r ≥6.5 YIPF7 STIM2 AK199r ≥8RAB6B EPHB1 JGR2 ≥8 Y RNA SETD2 AK074r ≥6.5RABGEF1 CHMP4C DD22 ≥6.5 ZBTB20 SLC12A8 AK053r ≥6.5RAD51 PIGL AK100r ≥8 ZCCHC14 JPH3 K48U ≥6.5RAD51AP1 ATP2A2 AK199r ≥8 ZCCHC8 RSRC2 59ND ≥6.5RAP1B OSBPL8 AK003r ≥6.5 ZEB1 ARHGAP12 AK217r ≥8RAPGEF3 DNAH10 AK199r ≥8 ZEB1 PSAP K48U ≥8RASSF2 HAPLN2 AK142r ≥8 ZFR GOLPH3 K48U ≥8RB1 GNG5P5 7EN2 ≥6.5 ZHX3 CHD6 K48U ≥6.5RB1 OTUD7A D3VY ≥6.5 ZNF202 AP000866.1 D3VY ≥6.5RBMS3 HACL1 AK213r ≥8 ZNF236 CLPB AK173r ≥6.5RCOR3 ACP6 AK217r ≥8 ZNF236 CYB5R4 AK203r ≥6.5REV3L FYN AK071r ≥8 ZNF302 RPS6 AK203r ≥6.5RMND5A PLGLA AK074r ≥6.5 ZNF317 DMWD AK066r ≥6.5RNF220 HSPB11 AK139r ≥6.5 ZNF317 ZNF253 AK066r ≥6.5RNU6-67 NDFIP2 7EN2 ≥6.5 ZNF343 RP11-20J15.2 AK203r ≥6.5ROBO3 CSNK1G1 D3VY ≥6.5 ZNF407 NFIC K48U ≥6.5RP11-1055B8.2 C11orf49 AK074r ≥8 ZNF532 FAM60CP D3VY ≥6.5RP11-1055B8.6 MCC AK139r ≥8 ZNF713 SEPT7P2 AK053r ≥6.5RP11-107C16.2 C10orf137 7EN2 ≥6.5 ZNF713 VSTM2A STUK ≥6.5RP11-114H23.1 OS9 59ND ≥8 ZNF761 GULP1 AK068r ≥6.5RP11-116O18.3 NOL4 D3H7 ≥6.5 ZNF761 TMEM8B AK199r ≥6.5RP11-123O10.4 CNTN1 XEMY ≥6.5 ZNF799 ZNF709 AK071r ≥6.5RP11-136F16.1 MDM2 59ND ≥8 ZNF92 ZNF85 AK199r ≥6.5
Note: The order of fusion partner 5′ and 3′ is ignored to simplify comparison.

121
Table S7: Fusions identified in 135 lymphomas samples (n=380, score≥6.5).
Gene1 Gene2 Sample Score Gene1 Gene2 Sample Score
ACOT7 AC007283.5 C1640 ≥6.5 RAB7L1 IGHD D0236 ≥6.5ALKBH1 ADCK1 D2119 ≥8 RAD54L2 ANKLE2 D0230 ≥8ASH1L ARHGEF11 D0242 ≥8 RALGAPB DNAJC5B D0228 ≥6.5ATP2A3 ANKFY1 D0242 ≥8 RASA4 BCL2L11 D0230 ≥6.5ATP5S AL122127.3 D2146 ≥8 RBM6 BCL6 B2195 ≥8BCL2 AL122127.25 C0417 ≥8 REEP1 POLR1A A1106 ≥8BCL6 AL122127.3 B0979 ≥8 REL AC010733.4 C1738 ≥6.5BCL6 AL122127.3 C3566 ≥6.5 RENBP ARHGAP4 D0242 ≥8BCL6 AL122127.3 D0228 ≥6.5 RERE HERC2P3 B2197 ≥8BCL6 AL122127.3 D2137 ≥6.5 RERE PEX10 C1565 ≥8BZRAP1 ABI3 C1745 ≥8 RERE HERC2P3 B0976 ≥6.5C11orf53 BTG4 D0242 ≥8 RERE HERC2P3 B0981 ≥6.5C8orf12 AP3B1 D2136 ≥6.5 RERE HERC2P3 C1742 ≥6.5CAPZA2 CADPS2 C1739 ≥8 RERE HERC2P3 C3568 ≥6.5CCDC126 AP3B1 C1739 ≥6.5 RERE HERC2P3 D2126 ≥6.5CD58 ANXA1 C3567 ≥6.5 RFWD3 FA2H D0230 ≥8CD58 ANXA1 C3568 ≥6.5 RFX3 DCAF12 C1636 ≥6.5CEP85L BIRC6 C1565 ≥6.5 RHBDL3 AL122127.3 D2129 ≥6.5CFLAR ARL6IP6 C0423 ≥8 RHOH BCL6 D0251 ≥8CHD2 CD80 C3567 ≥6.5 RNF38 PDCD1LG2 C1636 ≥8CIR1 AC004507.1 D2125 ≥6.5 RP11-10N16.3 IL28RA B2190 ≥6.5CORO1A CALR C2874 ≥6.5 RP11-1101K5.1 EXT1 C2874 ≥6.5CSMD3 AC023590.1 C1739 ≥6.5 RP11-1101K5.1 PKHD1L1 C2874 ≥6.5DDX10 ARID5B D0234 ≥6.5 RP11-1136L8.1 IGHG1 A1106 ≥6.5DIP2B ASH1L D2139 ≥6.5 RP11-1136L8.1 AL122127.3 A1164 ≥6.5DLG2 CIITA C1744 ≥8 RP11-1136L8.1 IGHD1-26 A1164 ≥6.5DNAJC3 CLDN10 B0980 ≥8 RP11-1136L8.1 AL122127.3 B2188 ≥6.5EEF2 C5orf17 C1738 ≥6.5 RP11-120C12.3 ARID5B D0242 ≥6.5FAM157B AFG3L1P D0242 ≥6.5 RP11-152F13.8 GOLGA6D B0976 ≥6.5FBXO36 AC009950.1 C1731 ≥6.5 RP11-186B7.4 LYZ B0980 ≥6.5FHIT CADPS B2190 ≥8 RP11-186B7.4 LYZ C0419 ≥6.5FLI1 ETS1 D2122 ≥6.5 RP11-211G3.2 IGHM D0254 ≥6.5FNBP1 C20orf196 C1561 ≥8 RP11-211G3.2 IGHG1 D2137 ≥6.5GAP43 ABCD3 C1729 ≥8 RP11-211G3.2 IGHM D2138 ≥6.5GCLC BTBD9 C1728 ≥8 RP11-211G3.3 CBLB D0243 ≥6.5GGA3 GABRP C1635 ≥8 RP11-30O15.1 LPP D0242 ≥6.5GIT2 ANAPC7 D0242 ≥8 RP11-3B12.3 CBLB B2192 ≥6.5GNA13 ALPK2 D0241 ≥8 RP11-427E4.1 LATS1 D0248 ≥6.5GNPTAB DRAM1 D0242 ≥6.5 RP11-440L16.1 DOCK10 D2130 ≥8GUK1 ARF1 B2192 ≥8 RP11-557C18.4 COG5 A1107 ≥6.5HDHD1 ANXA11 C1738 ≥6.5 RP11-705C15.2 AC103588.1 D2138 ≥6.5HEPACAM DGKH D0236 ≥8 RP11-731F5.1 BCL6 C1733 ≥8HERC2P8 COTL1 D0254 ≥6.5 RP11-731F5.1 RP11-211G3.2 C1733 ≥6.5HLA-DMA ABHD16A D0242 ≥8 RP11-731F5.2 LAPTM5 D0239 ≥6.5HLA-DQA1 ASMT C1731 ≥8 RP11-731F5.2 HS2ST1 D0912 ≥6.5HLA-DQA1 ASMT D2126 ≥8 RP11-73O6.4 PFKFB4 D2120 ≥6.5HLA-DQA1 ASMT B2195 ≥6.5 RP11-807H22.7 NUMA1 D0242 ≥6.5HLA-DQA1 ASMT C0419 ≥6.5 RP11-87G24.5 CIITA B2195 ≥6.5
Continued on next page

122
Table S7 – continued from previous page
Gene1 Gene2 Sample Score Gene1 Gene2 Sample Score
HLA-DQA1 ASMT D0239 ≥6.5 RP11-882G5.1 GCNT2 D0242 ≥6.5HLA-DQB2 HLA-DPB1 B2195 ≥6.5 RP3-399J4.2 C6orf106 D0242 ≥6.5HLA-DRB1 HLA-DPB1 A1170 ≥8 RP4-655J12.5 GON4L C0420 ≥6.5HLA-DRB1 HLA-DPB1 C1635 ≥8 RP5-972B16.2 CASK A1170 ≥6.5HLA-DRB1 HLA-DPB1 C3560 ≥8 RPL14 AC006465.3 D0257 ≥8HLA-DRB1 HLA-DPB1 D2137 ≥8 RPL14 E2F4 D0257 ≥8HLA-DRB1 HLA-DPB1 D2139 ≥8 RPL24 CEP97 D0242 ≥6.5HLA-DRB1 HLA-DPB1 C0422 ≥6.5 RPL28 PCED1B C1743 ≥6.5HLA-DRB1 HLA-DPB1 D0241 ≥6.5 RRM1 NUP98 D0242 ≥8HLA-DRB5 HLA-DPB1 C1744 ≥8 RYR2 HSPE1 C1732 ≥8HLA-DRB5 HLA-DPB1 C3566 ≥8 SAFB2 INSR D0242 ≥8HLA-E HLA-B B2196 ≥6.5 SCO2 PPP6R2 B2192 ≥8HLA-F HLA-B B2195 ≥8 SCO2 PIM3 C3555 ≥8HLA-F HLA-C D2121 ≥8 SCO2 PLXNB2 C3555 ≥8HLA-F HLA-B D2127 ≥8 SDK1 CARD11 D0242 ≥6.5HLA-G HLA-B B2197 ≥8 SERINC5 NEDD1 D2119 ≥6.5HLA-G HLA-B C3556 ≥6.5 SERPINB6 SERPINB1 D0242 ≥8HLA-L HLA-B D2126 ≥8 SERPINB9 RIPK1 B2188 ≥8IGHD4-4 BCL6 D0228 ≥6.5 SERPINB9 RIPK1 C1729 ≥8IGHE BCL6 C1635 ≥6.5 SERPINB9 RIPK1 C1741 ≥8IGHE C15orf37 C3566 ≥6.5 SERPINB9 RIPK1 C2876 ≥8IGHG1 CIITA C1562 ≥8 SETD2 RP4-655J12.5 B0980 ≥6.5IGHG1 BCL2L13 B0974 ≥6.5 SF3B3 CDH1 D0242 ≥8IGHG1 BCL2 B2193 ≥6.5 SFI1 RNF185 A1167 ≥8IGHG1 BCL2 C1737 ≥6.5 SFI1 POU2AF1 D0912 ≥6.5IGHG1 IGHE C1738 ≥6.5 SH2B2 CUX1 D0242 ≥6.5IGHG1 BCL2 D0243 ≥6.5 SH3BP1 ATAD3A B2187 ≥6.5IGHG1 BTG1 D2130 ≥6.5 SH3BP1 ATAD3A B2196 ≥6.5IGHG2 CIITA C1562 ≥6.5 SH3BP1 ATAD3A D2137 ≥6.5IGHG3 CIITA C1562 ≥8 SIPA1L3 FCHSD2 D2137 ≥8IGHG3 BCL6 D0236 ≥8 SKAP1 PITPNC1 C3564 ≥8IGHG3 CD86 C1736 ≥6.5 SLAMF7 COPA D0242 ≥6.5IGHG3 BCL6 D0225 ≥6.5 SLC38A1 KIF21A C0416 ≥8IGHG4 BCL2L13 B0974 ≥6.5 SLC41A3 AC106722.1 C1736 ≥8IGHG4 IGHG3 B2190 ≥6.5 SLC41A3 MBNL1 C1736 ≥8IGHG4 CD86 C1736 ≥6.5 SLC43A2 RPA1 D0242 ≥6.5IGHG4 BCL6 C3557 ≥6.5 SLC9C1 ATP6V1A D0242 ≥6.5IGHJ3 BCL2 C3561 ≥6.5 SLMAP PBRM1 D0230 ≥6.5IGHJ3 BCL2 D0243 ≥6.5 SLU7 ATP10B D0242 ≥8IGHJ4 BCL2 C1637 ≥6.5 SMAD2 PARD6G C1731 ≥8IGHJ4 BCL2 C1740 ≥6.5 SMARCA4 C3P1 D0242 ≥6.5IGHJ4 BCL2 C1743 ≥6.5 SMC6 CHL1 D2126 ≥6.5IGHJ5 BCL2 C1743 ≥8 SMCHD1 NDC80 D0242 ≥8IGHJ5 BCL2 B0977 ≥6.5 SMU1 MTAP C1636 ≥8IGHJ5 BCL2 D0238 ≥6.5 SMYD3 EFCAB2 B0979 ≥8IGHJ6 BCL2 B2194 ≥6.5 SNAP23 CHD7 D0233 ≥8IGHJ6 BCL2 D0253 ≥6.5 SNHG3 BCL6 A1170 ≥6.5IGHM BCL6 C1562 ≥6.5 SNX14 FAM165A D0242 ≥6.5IGKJ5 AC233263.1 B2185 ≥6.5 SOS2 POLE2 D0242 ≥8
Continued on next page

123
Table S7 – continued from previous page
Gene1 Gene2 Sample Score Gene1 Gene2 Sample Score
IGKV1-9 IGKJ5 C3561 ≥6.5 SOX5 ARID5B B2196 ≥8IGKV3D-7 IGKJ5 D0241 ≥6.5 SP110 FBXO36 C1731 ≥8IGKV4-1 AC096579.13 D2146 ≥6.5 SPATA16 NCEH1 D0242 ≥8IGKV5-2 IGKJ5 B0975 ≥8 SPG11 ARID4A C1732 ≥6.5IGKV5-2 IGKJ5 C1639 ≥8 SPIB CD209 C1730 ≥8IGKV5-2 IGKJ2 C3558 ≥8 SPINK9 KIF20B B2188 ≥6.5IGKV5-2 IGKJ5 D0231 ≥8 SPINK9 KIF20B B2189 ≥6.5IGKV5-2 IGKJ5 D0237 ≥8 SPPL3 GTF2H3 D0242 ≥6.5IGKV5-2 IGKJ5 D0255 ≥8 SRPK2 MLL5 B2197 ≥8IGKV5-2 IGKJ5 D2119 ≥8 STAMBPL1 CHUK D0250 ≥8IGKV5-2 IGKJ5 D2122 ≥8 STEAP1B RAPGEF5 D0242 ≥6.5IGKV5-2 IGKJ5 D2138 ≥8 STK24 SLC15A1 D0242 ≥6.5IGKV5-2 AC096579.13 C3559 ≥6.5 STK33 IPO7 D0242 ≥6.5IGLC2 FCRLA D2146 ≥8 STYK1 KLRAP1 D0242 ≥6.5IGLC3 FCRLA D2146 ≥8 SYT9 AC016831.7 B2190 ≥6.5IGLL5 CHMP1A C2876 ≥8 SYT9 AC016831.7 B2195 ≥6.5IGLL5 CHMP1A D2126 ≥8 SYT9 AC016831.7 C1728 ≥6.5IRF2BPL BTBD7 C1640 ≥6.5 SYT9 AC016831.7 C1736 ≥6.5IRF4 IGKJ5 C3568 ≥8 SYT9 AC016831.7 C1738 ≥6.5ITPR2 FGFR1OP2 D0242 ≥6.5 SYT9 AC016831.7 D0226 ≥6.5JARID2 CD83 C1742 ≥8 TAF2 SAMD12 C1739 ≥8JMJD1C FAM188A D0231 ≥6.5 TAF4B NSG1 C1635 ≥8KIAA1468 CCBE1 D0242 ≥6.5 TAOK1 NLK D0242 ≥8KIF9 CCDC12 D0242 ≥8 TBC1D17 AP2A1 D0242 ≥6.5KXD1 DDX39A B2196 ≥8 TEP1 HAUS4 D0242 ≥8LHFPL2 ARSB D0242 ≥6.5 TFB2M CNST D0257 ≥6.5LINC00265 CDK13 B2190 ≥6.5 TFG GPR128 C0416 ≥8LNPEP CTD-2333K2.1 D0228 ≥6.5 TFG GPR128 C1562 ≥8LPAR6 IRF1 C1736 ≥8 TFG GPR128 D0231 ≥8LRRC37A3 BPTF D0255 ≥6.5 TFG GPR128 D0241 ≥8LSAMP FCRL3 C0418 ≥6.5 TGS1 LYN C0416 ≥8LSAMP FCRL3 D0242 ≥6.5 TGS1 LYN D0230 ≥6.5LSM12 ESCO1 D0231 ≥6.5 THNSL2 LRWD1 D0230 ≥6.5MAEA CTBP1 B2192 ≥6.5 TIPRL DCAF6 D0242 ≥8MAN2B1 CHERP A1170 ≥6.5 TMC8 RFX2 C2876 ≥8MAP3K14 HLA-B D0251 ≥6.5 TMCO7 COG4 D0242 ≥6.5MAPK1 CDKN1A D0243 ≥8 TMEM159 SLC7A5P1 D0242 ≥8MAPK4 AP1S3 C1731 ≥8 TMEM241 RBBP8 D2126 ≥6.5MAPKAPK5 ACAD10 C1728 ≥8 TMEM56 ACADM C1729 ≥8MCFD2 HSD17B4 B2183 ≥6.5 TNFRSF10D MAN1B1 B0979 ≥8MCM3AP LSS D0242 ≥8 TNFRSF14 CEP104 C0417 ≥8METTL21A C1orf186 D0256 ≥6.5 TNIP1 LIX1 D2138 ≥8MND1 KIAA0922 C3567 ≥6.5 TNIP1 RIOK2 D2138 ≥8MND1 KIAA0922 C3568 ≥6.5 TOX EYA1 C1635 ≥8MNDA CANX B0979 ≥6.5 TOX NSMAF D0242 ≥8MORN3 KDM2B D0242 ≥6.5 TRAF3IP2 CD109 B0981 ≥8MTMR12 GOLPH3 D0242 ≥6.5 TRAF3IP2 FYN D0242 ≥8MTMR6 MTAP C1732 ≥8 TRAK1 TEX264 D2122 ≥8MYC IGHM A1107 ≥8 TRAPPC11 MT4 D0235 ≥6.5
Continued on next page
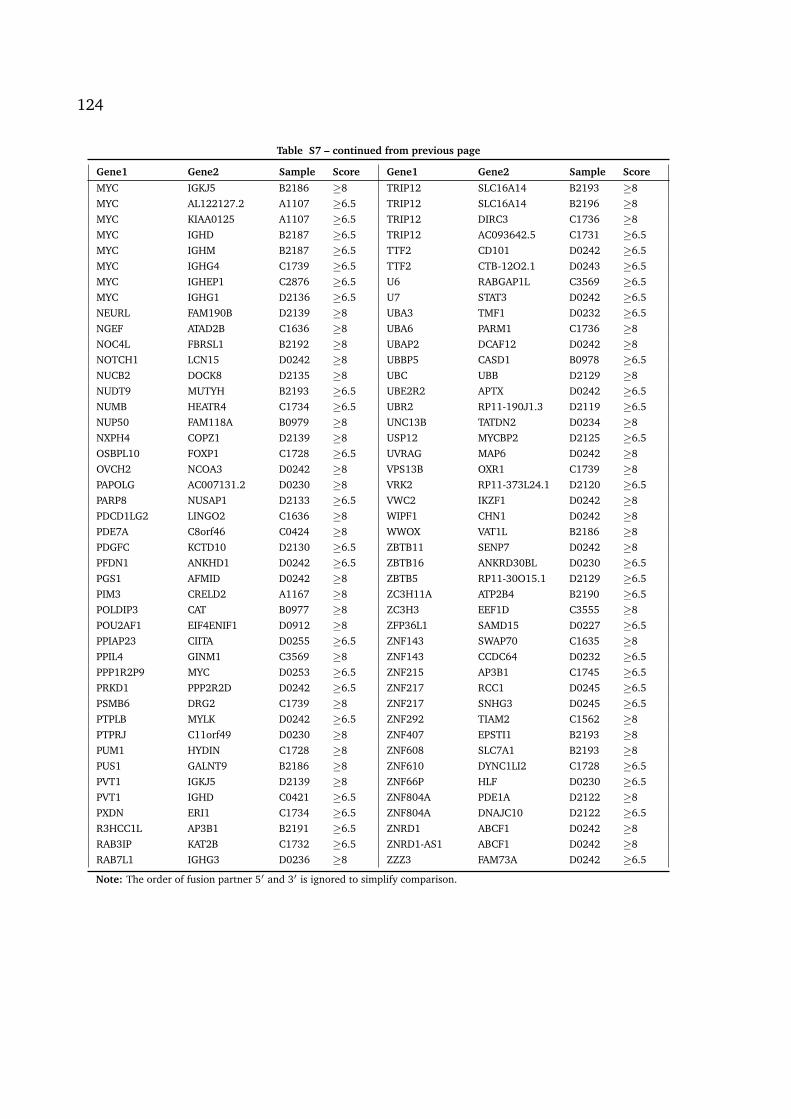
124
Table S7 – continued from previous page
Gene1 Gene2 Sample Score Gene1 Gene2 Sample Score
MYC IGKJ5 B2186 ≥8 TRIP12 SLC16A14 B2193 ≥8MYC AL122127.2 A1107 ≥6.5 TRIP12 SLC16A14 B2196 ≥8MYC KIAA0125 A1107 ≥6.5 TRIP12 DIRC3 C1736 ≥8MYC IGHD B2187 ≥6.5 TRIP12 AC093642.5 C1731 ≥6.5MYC IGHM B2187 ≥6.5 TTF2 CD101 D0242 ≥6.5MYC IGHG4 C1739 ≥6.5 TTF2 CTB-12O2.1 D0243 ≥6.5MYC IGHEP1 C2876 ≥6.5 U6 RABGAP1L C3569 ≥6.5MYC IGHG1 D2136 ≥6.5 U7 STAT3 D0242 ≥6.5NEURL FAM190B D2139 ≥8 UBA3 TMF1 D0232 ≥6.5NGEF ATAD2B C1636 ≥8 UBA6 PARM1 C1736 ≥8NOC4L FBRSL1 B2192 ≥8 UBAP2 DCAF12 D0242 ≥8NOTCH1 LCN15 D0242 ≥8 UBBP5 CASD1 B0978 ≥6.5NUCB2 DOCK8 D2135 ≥8 UBC UBB D2129 ≥8NUDT9 MUTYH B2193 ≥6.5 UBE2R2 APTX D0242 ≥6.5NUMB HEATR4 C1734 ≥6.5 UBR2 RP11-190J1.3 D2119 ≥6.5NUP50 FAM118A B0979 ≥8 UNC13B TATDN2 D0234 ≥8NXPH4 COPZ1 D2139 ≥8 USP12 MYCBP2 D2125 ≥6.5OSBPL10 FOXP1 C1728 ≥6.5 UVRAG MAP6 D0242 ≥8OVCH2 NCOA3 D0242 ≥8 VPS13B OXR1 C1739 ≥8PAPOLG AC007131.2 D0230 ≥8 VRK2 RP11-373L24.1 D2120 ≥6.5PARP8 NUSAP1 D2133 ≥6.5 VWC2 IKZF1 D0242 ≥8PDCD1LG2 LINGO2 C1636 ≥8 WIPF1 CHN1 D0242 ≥8PDE7A C8orf46 C0424 ≥8 WWOX VAT1L B2186 ≥8PDGFC KCTD10 D2130 ≥6.5 ZBTB11 SENP7 D0242 ≥8PFDN1 ANKHD1 D0242 ≥6.5 ZBTB16 ANKRD30BL D0230 ≥6.5PGS1 AFMID D0242 ≥8 ZBTB5 RP11-30O15.1 D2129 ≥6.5PIM3 CRELD2 A1167 ≥8 ZC3H11A ATP2B4 B2190 ≥6.5POLDIP3 CAT B0977 ≥8 ZC3H3 EEF1D C3555 ≥8POU2AF1 EIF4ENIF1 D0912 ≥8 ZFP36L1 SAMD15 D0227 ≥6.5PPIAP23 CIITA D0255 ≥6.5 ZNF143 SWAP70 C1635 ≥8PPIL4 GINM1 C3569 ≥8 ZNF143 CCDC64 D0232 ≥6.5PPP1R2P9 MYC D0253 ≥6.5 ZNF215 AP3B1 C1745 ≥6.5PRKD1 PPP2R2D D0242 ≥6.5 ZNF217 RCC1 D0245 ≥6.5PSMB6 DRG2 C1739 ≥8 ZNF217 SNHG3 D0245 ≥6.5PTPLB MYLK D0242 ≥6.5 ZNF292 TIAM2 C1562 ≥8PTPRJ C11orf49 D0230 ≥8 ZNF407 EPSTI1 B2193 ≥8PUM1 HYDIN C1728 ≥8 ZNF608 SLC7A1 B2193 ≥8PUS1 GALNT9 B2186 ≥8 ZNF610 DYNC1LI2 C1728 ≥6.5PVT1 IGKJ5 D2139 ≥8 ZNF66P HLF D0230 ≥6.5PVT1 IGHD C0421 ≥6.5 ZNF804A PDE1A D2122 ≥8PXDN ERI1 C1734 ≥6.5 ZNF804A DNAJC10 D2122 ≥6.5R3HCC1L AP3B1 B2191 ≥6.5 ZNRD1 ABCF1 D0242 ≥8RAB3IP KAT2B C1732 ≥6.5 ZNRD1-AS1 ABCF1 D0242 ≥8RAB7L1 IGHG3 D0236 ≥8 ZZZ3 FAM73A D0242 ≥6.5
Note: The order of fusion partner 5′ and 3′ is ignored to simplify comparison.

125
Table S8: Fusions identified in 114 CLL samples from HIPO-005.
Gene1 Gene2 Sample Score Gene1 Gene2 Sample Score
IGHA2 IGHA1 001N ≥8 CHD2 B2M K49C ≥8JSRP1 CSNK1G2 0TRN ≥6.5 KIF20B ARHGAP24 K49C ≥6.5LUC7L2 FCRL2 0TRN ≥6.5 PTMA CXCR4 K49C ≥6.5MRPS18A B4GALT1 0TRN ≥6.5 TAF8 EML2 K49C ≥6.5PTMA CXCR4 0TRN ≥6.5 TMEM18 PTMA K49C ≥6.5RTP2 NOL10 0TRN ≥6.5 PTMA CXCR4 KATI ≥6.5SCAMP4 FGD2 0TRN ≥8 RNY4P27 ABCC4 KATI ≥6.5TOMM7 EAF2 0TRN ≥8 CXCR4 CHD2 KGAR ≥8TSC1 EHMT1 0TRN ≥8 GNAS CXCR4 KGAR ≥8CXCR4 B2M 0XXE ≥8 IGHA2 IGHA1 KGAR ≥8CXCR4 BCL2L11 0XXE ≥8 KLF2 AKAP8 KGAR ≥8DDX5 CXCR4 0XXE ≥8 KLF2 B2M KGAR ≥8GNAS CXCR4 0XXE ≥8 KLF2 CXCR4 KGAR ≥8MRPS18A B4GALT1 0XXE ≥6.5 KLF2 FOSB KGAR ≥8NOC4L FBRSL1 0XXE ≥8 KLF2 JSRP1 KGAR ≥6.5PTMA CXCR4 0XXE ≥8 PTMA CXCR4 KGAR ≥6.5PTMA CXCR4 0Z63 ≥6.5 RERE HERC2P3 KGAR ≥6.5TXLNB MBNL1 0Z63 ≥6.5 RGPD5 PTMA KGAR ≥6.5CHD2 B2M 15W9 ≥8 SIK1 KLF2 KGAR ≥8CXCR4 CHD2 15W9 ≥8 STK3 ARHGAP24 KGAR ≥6.5FAM60A DENND5B 15W9 ≥8 TFG GPR128 KGAR ≥8JSRP1 CSNK1G2 15W9 ≥6.5 CHD2 B2M LAGT ≥8PTMA CXCR4 15W9 ≥6.5 CXCR4 CHD2 LAGT ≥8RGPD5 PTMA 15W9 ≥8 GNAS B2M LAGT ≥8RNF126 JSRP1 15W9 ≥6.5 HMGB1 CXCR4 LAGT ≥6.5RNF126 OAZ1 15W9 ≥8 KLF2 FOSB LAGT ≥8UBC NCOR2 15W9 ≥8 PNRC1 BACH2 LAGT ≥8CHD2 B2M 19N0 ≥8 PTMA ACTB LAGT ≥6.5IGHG4 IGHG3 19N0 ≥6.5 PTMA CXCR4 LAGT ≥6.5MRPS18A B4GALT1 19N0 ≥6.5 PTMA FOSB LAGT ≥8NUDC EYA3 19N0 ≥8 RP11-20I23.1 CXCR4 LAGT ≥8PTMA CXCR4 19N0 ≥6.5 RP11-20I23.3 B2M LAGT ≥6.5SAMD3 MTHFD1L 19N0 ≥6.5 SAMHD1 RP5-977B1.10 LAGT ≥8SAMD3 PLEKHG1 19N0 ≥6.5 TGFBRAP1 MED4 LAGT ≥8SETBP1 MYO5B 19N0 ≥8 TGIF2 SAMHD1 LAGT ≥8SPINK9 KIF20B 19N0 ≥8 UBC NCOR2 LAGT ≥8TCF3 OAZ1 19N0 ≥8 UBC PPP1CC LAGT ≥8TMEM110 PSMD12 19N0 ≥6.5 VAV2 PTMA LAGT ≥8TXLNB MBNL1 19N0 ≥6.5 YPEL5 CXCR4 LAGT ≥8UHRF1 PLIN3 19N0 ≥6.5 IGHG4 IGHG3 LBKM ≥6.5CHD2 B2M 1A5K ≥8 MRPS18A B4GALT1 LBKM ≥6.5CXCR4 CHD2 1A5K ≥8 CXCR4 ATP6V0C LSLK ≥8IGHG1 AL122127.3 1A5K ≥6.5 PTMA CXCR4 LSLK ≥8IGHG1 AL122127.4 1A5K ≥6.5 RGPD6 BCL2L11 LSLK ≥6.5KLF2 JSRP1 1A5K ≥6.5 RGPD8 PTMA LSLK ≥6.5PTMA CXCR4 1A5K ≥6.5 YPEL5 CXCR4 LSLK ≥8RBM38 CXCR4 1A5K ≥8 FNDC3A ATP7B M76U ≥6.5SNED1 PTMA 1A5K ≥6.5 MAFK MAD1L1 M76U ≥8
Continued on next page
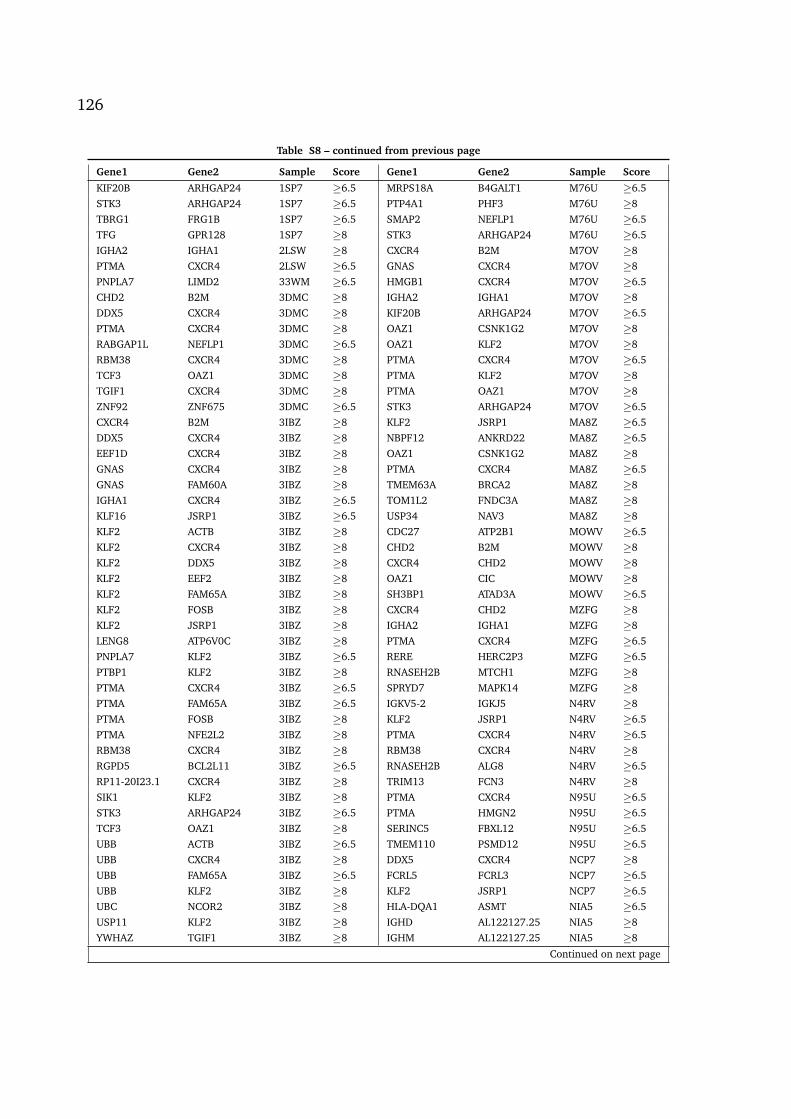
126
Table S8 – continued from previous page
Gene1 Gene2 Sample Score Gene1 Gene2 Sample Score
KIF20B ARHGAP24 1SP7 ≥6.5 MRPS18A B4GALT1 M76U ≥6.5STK3 ARHGAP24 1SP7 ≥6.5 PTP4A1 PHF3 M76U ≥8TBRG1 FRG1B 1SP7 ≥6.5 SMAP2 NEFLP1 M76U ≥6.5TFG GPR128 1SP7 ≥8 STK3 ARHGAP24 M76U ≥6.5IGHA2 IGHA1 2LSW ≥8 CXCR4 B2M M7OV ≥8PTMA CXCR4 2LSW ≥6.5 GNAS CXCR4 M7OV ≥8PNPLA7 LIMD2 33WM ≥6.5 HMGB1 CXCR4 M7OV ≥6.5CHD2 B2M 3DMC ≥8 IGHA2 IGHA1 M7OV ≥8DDX5 CXCR4 3DMC ≥8 KIF20B ARHGAP24 M7OV ≥6.5PTMA CXCR4 3DMC ≥8 OAZ1 CSNK1G2 M7OV ≥8RABGAP1L NEFLP1 3DMC ≥6.5 OAZ1 KLF2 M7OV ≥8RBM38 CXCR4 3DMC ≥8 PTMA CXCR4 M7OV ≥6.5TCF3 OAZ1 3DMC ≥8 PTMA KLF2 M7OV ≥8TGIF1 CXCR4 3DMC ≥8 PTMA OAZ1 M7OV ≥8ZNF92 ZNF675 3DMC ≥6.5 STK3 ARHGAP24 M7OV ≥6.5CXCR4 B2M 3IBZ ≥8 KLF2 JSRP1 MA8Z ≥6.5DDX5 CXCR4 3IBZ ≥8 NBPF12 ANKRD22 MA8Z ≥6.5EEF1D CXCR4 3IBZ ≥8 OAZ1 CSNK1G2 MA8Z ≥8GNAS CXCR4 3IBZ ≥8 PTMA CXCR4 MA8Z ≥6.5GNAS FAM60A 3IBZ ≥8 TMEM63A BRCA2 MA8Z ≥8IGHA1 CXCR4 3IBZ ≥6.5 TOM1L2 FNDC3A MA8Z ≥8KLF16 JSRP1 3IBZ ≥6.5 USP34 NAV3 MA8Z ≥8KLF2 ACTB 3IBZ ≥8 CDC27 ATP2B1 MOWV ≥6.5KLF2 CXCR4 3IBZ ≥8 CHD2 B2M MOWV ≥8KLF2 DDX5 3IBZ ≥8 CXCR4 CHD2 MOWV ≥8KLF2 EEF2 3IBZ ≥8 OAZ1 CIC MOWV ≥8KLF2 FAM65A 3IBZ ≥8 SH3BP1 ATAD3A MOWV ≥6.5KLF2 FOSB 3IBZ ≥8 CXCR4 CHD2 MZFG ≥8KLF2 JSRP1 3IBZ ≥8 IGHA2 IGHA1 MZFG ≥8LENG8 ATP6V0C 3IBZ ≥8 PTMA CXCR4 MZFG ≥6.5PNPLA7 KLF2 3IBZ ≥6.5 RERE HERC2P3 MZFG ≥6.5PTBP1 KLF2 3IBZ ≥8 RNASEH2B MTCH1 MZFG ≥8PTMA CXCR4 3IBZ ≥6.5 SPRYD7 MAPK14 MZFG ≥8PTMA FAM65A 3IBZ ≥6.5 IGKV5-2 IGKJ5 N4RV ≥8PTMA FOSB 3IBZ ≥8 KLF2 JSRP1 N4RV ≥6.5PTMA NFE2L2 3IBZ ≥8 PTMA CXCR4 N4RV ≥6.5RBM38 CXCR4 3IBZ ≥8 RBM38 CXCR4 N4RV ≥8RGPD5 BCL2L11 3IBZ ≥6.5 RNASEH2B ALG8 N4RV ≥6.5RP11-20I23.1 CXCR4 3IBZ ≥8 TRIM13 FCN3 N4RV ≥8SIK1 KLF2 3IBZ ≥8 PTMA CXCR4 N95U ≥6.5STK3 ARHGAP24 3IBZ ≥6.5 PTMA HMGN2 N95U ≥6.5TCF3 OAZ1 3IBZ ≥8 SERINC5 FBXL12 N95U ≥6.5UBB ACTB 3IBZ ≥6.5 TMEM110 PSMD12 N95U ≥6.5UBB CXCR4 3IBZ ≥8 DDX5 CXCR4 NCP7 ≥8UBB FAM65A 3IBZ ≥6.5 FCRL5 FCRL3 NCP7 ≥6.5UBB KLF2 3IBZ ≥8 KLF2 JSRP1 NCP7 ≥6.5UBC NCOR2 3IBZ ≥8 HLA-DQA1 ASMT NIA5 ≥6.5USP11 KLF2 3IBZ ≥8 IGHD AL122127.25 NIA5 ≥8YWHAZ TGIF1 3IBZ ≥8 IGHM AL122127.25 NIA5 ≥8
Continued on next page
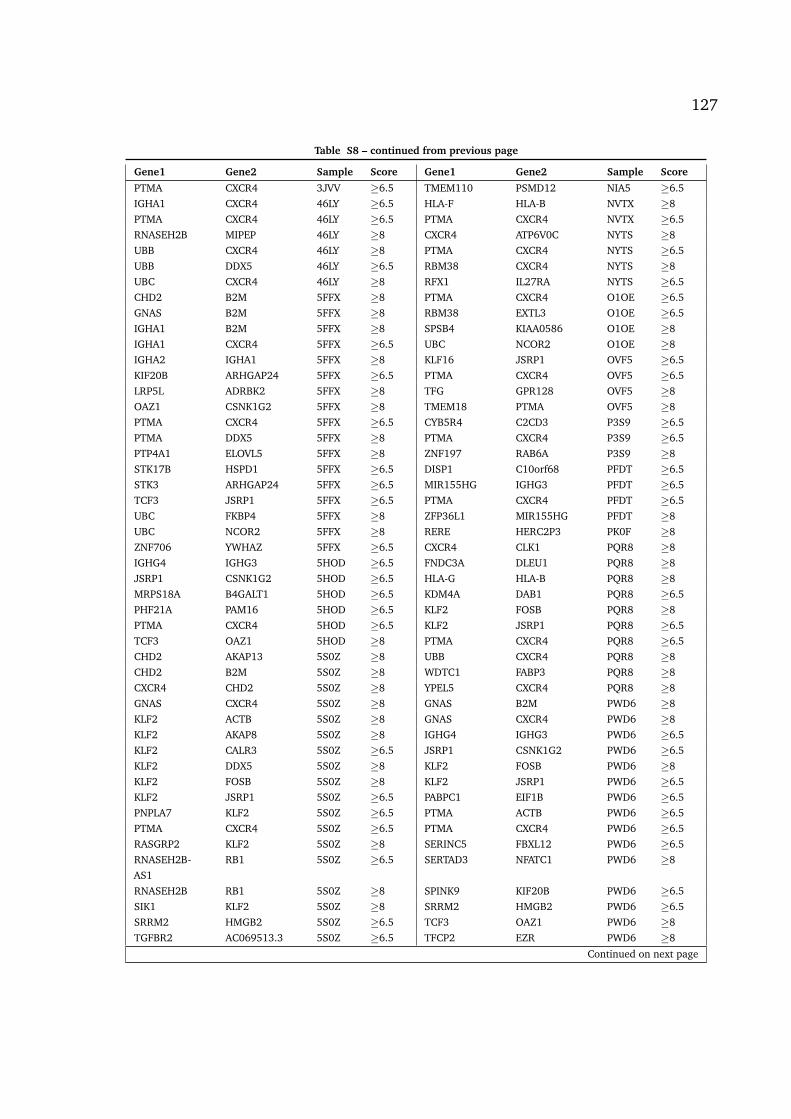
127
Table S8 – continued from previous page
Gene1 Gene2 Sample Score Gene1 Gene2 Sample Score
PTMA CXCR4 3JVV ≥6.5 TMEM110 PSMD12 NIA5 ≥6.5IGHA1 CXCR4 46LY ≥6.5 HLA-F HLA-B NVTX ≥8PTMA CXCR4 46LY ≥6.5 PTMA CXCR4 NVTX ≥6.5RNASEH2B MIPEP 46LY ≥8 CXCR4 ATP6V0C NYTS ≥8UBB CXCR4 46LY ≥8 PTMA CXCR4 NYTS ≥6.5UBB DDX5 46LY ≥6.5 RBM38 CXCR4 NYTS ≥8UBC CXCR4 46LY ≥8 RFX1 IL27RA NYTS ≥6.5CHD2 B2M 5FFX ≥8 PTMA CXCR4 O1OE ≥6.5GNAS B2M 5FFX ≥8 RBM38 EXTL3 O1OE ≥6.5IGHA1 B2M 5FFX ≥8 SPSB4 KIAA0586 O1OE ≥8IGHA1 CXCR4 5FFX ≥6.5 UBC NCOR2 O1OE ≥8IGHA2 IGHA1 5FFX ≥8 KLF16 JSRP1 OVF5 ≥6.5KIF20B ARHGAP24 5FFX ≥6.5 PTMA CXCR4 OVF5 ≥6.5LRP5L ADRBK2 5FFX ≥8 TFG GPR128 OVF5 ≥8OAZ1 CSNK1G2 5FFX ≥8 TMEM18 PTMA OVF5 ≥8PTMA CXCR4 5FFX ≥6.5 CYB5R4 C2CD3 P3S9 ≥6.5PTMA DDX5 5FFX ≥8 PTMA CXCR4 P3S9 ≥6.5PTP4A1 ELOVL5 5FFX ≥8 ZNF197 RAB6A P3S9 ≥8STK17B HSPD1 5FFX ≥6.5 DISP1 C10orf68 PFDT ≥6.5STK3 ARHGAP24 5FFX ≥6.5 MIR155HG IGHG3 PFDT ≥6.5TCF3 JSRP1 5FFX ≥6.5 PTMA CXCR4 PFDT ≥6.5UBC FKBP4 5FFX ≥8 ZFP36L1 MIR155HG PFDT ≥8UBC NCOR2 5FFX ≥8 RERE HERC2P3 PK0F ≥8ZNF706 YWHAZ 5FFX ≥6.5 CXCR4 CLK1 PQR8 ≥8IGHG4 IGHG3 5HOD ≥6.5 FNDC3A DLEU1 PQR8 ≥8JSRP1 CSNK1G2 5HOD ≥6.5 HLA-G HLA-B PQR8 ≥8MRPS18A B4GALT1 5HOD ≥6.5 KDM4A DAB1 PQR8 ≥6.5PHF21A PAM16 5HOD ≥6.5 KLF2 FOSB PQR8 ≥8PTMA CXCR4 5HOD ≥6.5 KLF2 JSRP1 PQR8 ≥6.5TCF3 OAZ1 5HOD ≥8 PTMA CXCR4 PQR8 ≥6.5CHD2 AKAP13 5S0Z ≥8 UBB CXCR4 PQR8 ≥8CHD2 B2M 5S0Z ≥8 WDTC1 FABP3 PQR8 ≥8CXCR4 CHD2 5S0Z ≥8 YPEL5 CXCR4 PQR8 ≥8GNAS CXCR4 5S0Z ≥8 GNAS B2M PWD6 ≥8KLF2 ACTB 5S0Z ≥8 GNAS CXCR4 PWD6 ≥8KLF2 AKAP8 5S0Z ≥8 IGHG4 IGHG3 PWD6 ≥6.5KLF2 CALR3 5S0Z ≥6.5 JSRP1 CSNK1G2 PWD6 ≥6.5KLF2 DDX5 5S0Z ≥8 KLF2 FOSB PWD6 ≥8KLF2 FOSB 5S0Z ≥8 KLF2 JSRP1 PWD6 ≥6.5KLF2 JSRP1 5S0Z ≥6.5 PABPC1 EIF1B PWD6 ≥6.5PNPLA7 KLF2 5S0Z ≥6.5 PTMA ACTB PWD6 ≥6.5PTMA CXCR4 5S0Z ≥6.5 PTMA CXCR4 PWD6 ≥6.5RASGRP2 KLF2 5S0Z ≥8 SERINC5 FBXL12 PWD6 ≥6.5RNASEH2B-AS1
RB1 5S0Z ≥6.5 SERTAD3 NFATC1 PWD6 ≥8
RNASEH2B RB1 5S0Z ≥8 SPINK9 KIF20B PWD6 ≥6.5SIK1 KLF2 5S0Z ≥8 SRRM2 HMGB2 PWD6 ≥6.5SRRM2 HMGB2 5S0Z ≥6.5 TCF3 OAZ1 PWD6 ≥8TGFBR2 AC069513.3 5S0Z ≥6.5 TFCP2 EZR PWD6 ≥8
Continued on next page
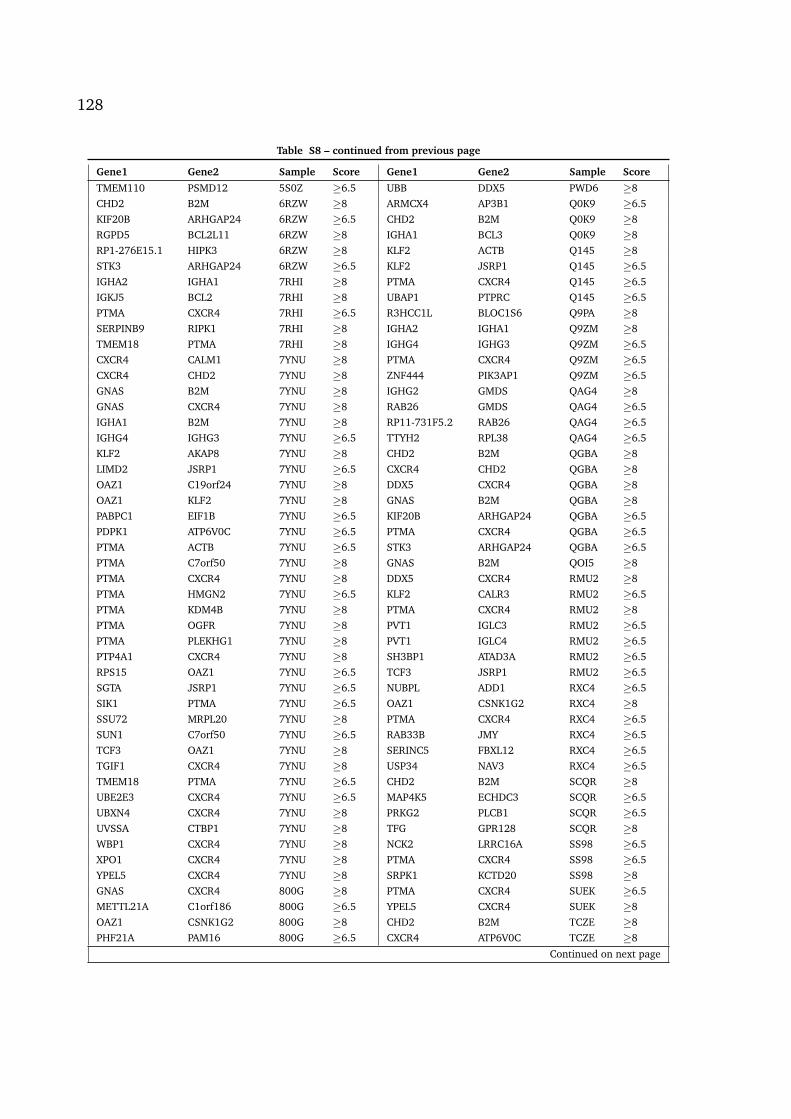
128
Table S8 – continued from previous page
Gene1 Gene2 Sample Score Gene1 Gene2 Sample Score
TMEM110 PSMD12 5S0Z ≥6.5 UBB DDX5 PWD6 ≥8CHD2 B2M 6RZW ≥8 ARMCX4 AP3B1 Q0K9 ≥6.5KIF20B ARHGAP24 6RZW ≥6.5 CHD2 B2M Q0K9 ≥8RGPD5 BCL2L11 6RZW ≥8 IGHA1 BCL3 Q0K9 ≥8RP1-276E15.1 HIPK3 6RZW ≥8 KLF2 ACTB Q145 ≥8STK3 ARHGAP24 6RZW ≥6.5 KLF2 JSRP1 Q145 ≥6.5IGHA2 IGHA1 7RHI ≥8 PTMA CXCR4 Q145 ≥6.5IGKJ5 BCL2 7RHI ≥8 UBAP1 PTPRC Q145 ≥6.5PTMA CXCR4 7RHI ≥6.5 R3HCC1L BLOC1S6 Q9PA ≥8SERPINB9 RIPK1 7RHI ≥8 IGHA2 IGHA1 Q9ZM ≥8TMEM18 PTMA 7RHI ≥8 IGHG4 IGHG3 Q9ZM ≥6.5CXCR4 CALM1 7YNU ≥8 PTMA CXCR4 Q9ZM ≥6.5CXCR4 CHD2 7YNU ≥8 ZNF444 PIK3AP1 Q9ZM ≥6.5GNAS B2M 7YNU ≥8 IGHG2 GMDS QAG4 ≥8GNAS CXCR4 7YNU ≥8 RAB26 GMDS QAG4 ≥6.5IGHA1 B2M 7YNU ≥8 RP11-731F5.2 RAB26 QAG4 ≥6.5IGHG4 IGHG3 7YNU ≥6.5 TTYH2 RPL38 QAG4 ≥6.5KLF2 AKAP8 7YNU ≥8 CHD2 B2M QGBA ≥8LIMD2 JSRP1 7YNU ≥6.5 CXCR4 CHD2 QGBA ≥8OAZ1 C19orf24 7YNU ≥8 DDX5 CXCR4 QGBA ≥8OAZ1 KLF2 7YNU ≥8 GNAS B2M QGBA ≥8PABPC1 EIF1B 7YNU ≥6.5 KIF20B ARHGAP24 QGBA ≥6.5PDPK1 ATP6V0C 7YNU ≥6.5 PTMA CXCR4 QGBA ≥6.5PTMA ACTB 7YNU ≥6.5 STK3 ARHGAP24 QGBA ≥6.5PTMA C7orf50 7YNU ≥8 GNAS B2M QOI5 ≥8PTMA CXCR4 7YNU ≥8 DDX5 CXCR4 RMU2 ≥8PTMA HMGN2 7YNU ≥6.5 KLF2 CALR3 RMU2 ≥6.5PTMA KDM4B 7YNU ≥8 PTMA CXCR4 RMU2 ≥8PTMA OGFR 7YNU ≥8 PVT1 IGLC3 RMU2 ≥6.5PTMA PLEKHG1 7YNU ≥8 PVT1 IGLC4 RMU2 ≥6.5PTP4A1 CXCR4 7YNU ≥8 SH3BP1 ATAD3A RMU2 ≥6.5RPS15 OAZ1 7YNU ≥6.5 TCF3 JSRP1 RMU2 ≥6.5SGTA JSRP1 7YNU ≥6.5 NUBPL ADD1 RXC4 ≥6.5SIK1 PTMA 7YNU ≥6.5 OAZ1 CSNK1G2 RXC4 ≥8SSU72 MRPL20 7YNU ≥8 PTMA CXCR4 RXC4 ≥6.5SUN1 C7orf50 7YNU ≥6.5 RAB33B JMY RXC4 ≥6.5TCF3 OAZ1 7YNU ≥8 SERINC5 FBXL12 RXC4 ≥6.5TGIF1 CXCR4 7YNU ≥8 USP34 NAV3 RXC4 ≥6.5TMEM18 PTMA 7YNU ≥6.5 CHD2 B2M SCQR ≥8UBE2E3 CXCR4 7YNU ≥6.5 MAP4K5 ECHDC3 SCQR ≥6.5UBXN4 CXCR4 7YNU ≥8 PRKG2 PLCB1 SCQR ≥6.5UVSSA CTBP1 7YNU ≥8 TFG GPR128 SCQR ≥8WBP1 CXCR4 7YNU ≥8 NCK2 LRRC16A SS98 ≥6.5XPO1 CXCR4 7YNU ≥8 PTMA CXCR4 SS98 ≥6.5YPEL5 CXCR4 7YNU ≥8 SRPK1 KCTD20 SS98 ≥8GNAS CXCR4 800G ≥8 PTMA CXCR4 SUEK ≥6.5METTL21A C1orf186 800G ≥6.5 YPEL5 CXCR4 SUEK ≥8OAZ1 CSNK1G2 800G ≥8 CHD2 B2M TCZE ≥8PHF21A PAM16 800G ≥6.5 CXCR4 ATP6V0C TCZE ≥8
Continued on next page

129
Table S8 – continued from previous page
Gene1 Gene2 Sample Score Gene1 Gene2 Sample Score
PTMA CXCR4 800G ≥6.5 CXCR4 BCL2L11 TCZE ≥8RGPD8 BCL2L11 800G ≥6.5 GNAS CXCR4 TCZE ≥8TMEM18 PTMA 800G ≥8 HLA-G HLA-B TCZE ≥8ZC3H4 PCBP1-AS1 800G ≥6.5 KLF2 JSRP1 TCZE ≥6.5IL10RA BIRC3 8E7F ≥6.5 PTMA CXCR4 TCZE ≥6.5PTMA CXCR4 8E7F ≥6.5 RBM38 CXCR4 TCZE ≥8CHD2 B2M 9ELC ≥8 RGPD5 BCL2L11 TCZE ≥8CXCR4 BCL2L11 9ELC ≥8 RGPD6 PTMA TCZE ≥6.5KLF2 DDX39A 9ELC ≥8 SIK1 PTMA TCZE ≥8PTMA BCL2L11 9ELC ≥6.5 TMEM18 PTMA TCZE ≥6.5PTMA CXCR4 9ELC ≥6.5 YPEL5 CXCR4 TCZE ≥8JSRP1 CSNK1G2 9F34 ≥6.5 PTMA CXCR4 TIW9 ≥6.5KLF2 JSRP1 9F34 ≥6.5 CXCR4 CHD2 TMVO ≥8OAZ1 DAZAP1 9F34 ≥8 PTMA CXCR4 TMVO ≥6.5PHF21A PAM16 9F34 ≥6.5 YPEL5 CXCR4 TMVO ≥8PTMA CXCR4 9F34 ≥6.5 ZNF138 NCOR1 TMVO ≥6.5UBXN4 CXCR4 9F34 ≥8 MRPS18A B4GALT1 TUQ6 ≥6.5USP34 NAV3 9F34 ≥6.5 RERE HERC2P3 TUQ6 ≥8CHD2 B2M 9P4M ≥8 PTMA CXCR4 TV7J ≥6.5JSRP1 ATP6V0C 9P4M ≥6.5 UBAP1 PTPRC TV7J ≥6.5KLF2 JSRP1 9P4M ≥6.5 CXCR4 BCL2L11 U1QP ≥8KLF2 KDM4B 9P4M ≥8 CXCR4 CLK1 U1QP ≥8PNRC1 BACH2 9P4M ≥8 NOC4L FBRSL1 U1QP ≥8PTMA CXCR4 9P4M ≥6.5 PTMA CXCR4 U1QP ≥6.5USP34 NAV3 9P4M ≥8 CHD2 B2M U1TH ≥8CHD2 B2M 9S37 ≥8 CXCR4 CLK1 U1TH ≥8CXCR4 CHD2 9S37 ≥8 IGHA2 IGHA1 U1TH ≥8IGHG2 IGHG1 9S37 ≥6.5 NSRP1 GATAD2A U1TH ≥6.5JSRP1 CSNK1G2 9S37 ≥6.5 PTMA CXCR4 U1TH ≥6.5KSR1 CHD2 9S37 ≥8 RBM38 CXCR4 U1TH ≥8MAFK MAD1L1 9S37 ≥8 SRRM2 IGHD U1TH ≥6.5MRPS18A B4GALT1 9S37 ≥6.5 IGHA2 IGHA1 U2VJ ≥8PTMA CXCR4 9S37 ≥6.5 SH3BP1 ATAD3A U2VJ ≥6.5PTMA JSRP1 9S37 ≥6.5 KLF2 JSRP1 U64J ≥6.5RGPD8 BCL2L11 9S37 ≥6.5 PTMA CXCR4 U64J ≥6.5RP11-20I23.1 PDPK1 9S37 ≥6.5 RBM38 CXCR4 U64J ≥8TCF3 JSRP1 9S37 ≥6.5 YPEL5 CXCR4 U64J ≥8TCF3 OAZ1 9S37 ≥8 CXCR4 BCL2L11 U8HQ ≥8TESK2 PPIA 9S37 ≥6.5 LIMD2 JSRP1 U8HQ ≥6.5UNKL UBE2I 9S37 ≥8 PTMA CXCR4 U8HQ ≥6.5ZFAND6 MORF4L1 9S37 ≥6.5 CHD2 B2M UAYJ ≥8CHD2 B2M 9VRO ≥8 KLF16 JSRP1 UAYJ ≥6.5IGHA1 CXCR4 9VRO ≥6.5 LRRC37A2 KANSL1 UAYJ ≥6.5KLF2 JSRP1 9VRO ≥6.5 OAZ1 KLF2 UAYJ ≥8PTMA CXCR4 9VRO ≥6.5 PTMA CXCR4 UAYJ ≥6.5TMEM110 PSMD12 9VRO ≥6.5 PTP4A1 PHF3 UAYJ ≥8YPEL5 CXCR4 9VRO ≥8 RP11-152F13.8 GOLGA6D UAYJ ≥6.5CXCR4 B2M A72M ≥8 SPRYD7 MTMR4 UAYJ ≥8CXCR4 CHD2 A72M ≥8 SRRM2 ATP6V0C UAYJ ≥8
Continued on next page

130
Table S8 – continued from previous page
Gene1 Gene2 Sample Score Gene1 Gene2 Sample Score
HLA-DRB1 HLA-DPB1 A72M ≥8 VAV2 PTMA UAYJ ≥8HMGB1 CXCR4 A72M ≥6.5 YPEL5 CXCR4 UAYJ ≥8PTMA BCL2L11 A72M ≥6.5 ZNF138 NCOR1 UAYJ ≥6.5PTMA CXCR4 A72M ≥6.5 ZNF92 ZNF675 UAYJ ≥6.5RGPD5 PTMA A72M ≥6.5 CHD2 B2M UCF9 ≥8RP3-468B3.2 ITPR3 A72M ≥6.5 CXCR4 CLK1 UCF9 ≥8SH3GLB1 ASCC1 A72M ≥6.5 IGHA1 CXCR4 UCF9 ≥6.5TESK2 PPIA A72M ≥6.5 NADSYN1 AC005307.3 UCF9 ≥6.5UBC NCOR2 A72M ≥8 PTMA CXCR4 UCF9 ≥6.5YPEL5 CXCR4 A72M ≥8 SERINC5 FBXL12 UCF9 ≥6.5CHD2 B2M A7KR ≥8 NRF1 CLVS1 UJI6 ≥6.5CXCR4 CHD2 A7KR ≥8 STYXL1 C4BPB UJI6 ≥6.5DDX5 CHD2 A7KR ≥8 TSGA13 CHD7 UJI6 ≥8HMGB1 CXCR4 A7KR ≥6.5 UBAP1 PTPRC UJI6 ≥6.5HNRNPA2B1 CHD2 A7KR ≥8 GNAS CXCR4 VFKZ ≥8JSRP1 CHD2 A7KR ≥6.5 JSRP1 CSNK1G2 VFKZ ≥6.5N4BP2L1 HMGB1 A7KR ≥8 PTMA CXCR4 VFKZ ≥6.5OAZ1 CSNK1G2 A7KR ≥8 CHD2 B2M VJQU ≥8PABPC1 EIF1B A7KR ≥6.5 KLF2 CALR3 VJQU ≥6.5PDK3 COL28A1 A7KR ≥6.5 OAZ1 KLF2 VJQU ≥8PTMA AC131097.3 A7KR ≥6.5 PRAMEL KDSR VJQU ≥8PTMA CALM2 A7KR ≥8 PTMA CXCR4 VJQU ≥6.5PTMA CXCR4 A7KR ≥8 SERINC5 FBXL12 VJQU ≥6.5PTMA HNRNPA2B1 A7KR ≥8 CXCR4 CHD2 VZB0 ≥8PTMA HNRNPH1 A7KR ≥6.5 FNDC3A ADAM5 VZB0 ≥8RBM38 PTMA A7KR ≥8 MACF1 AKIRIN1 VZB0 ≥8REXO1 JSRP1 A7KR ≥6.5 PLCXD1 CNBP VZB0 ≥6.5RGPD5 BCL2L11 A7KR ≥6.5 RP4-564F22.2 CAMP VZB0 ≥6.5RGPD6 PTMA A7KR ≥6.5 TMEM209 ADAM5 VZB0 ≥8RNF126 PTBP1 A7KR ≥8 UQCR10 C1orf194 VZB0 ≥6.5RP11-20I23.1 JSRP1 A7KR ≥6.5 XPO6 CTC-454M9.1 VZB0 ≥8RPS15 OAZ1 A7KR ≥6.5 MRPS18A B4GALT1 WARE ≥6.5SF1 HNRNPA2B1 A7KR ≥8 RFX7 AL109763.1 WARE ≥8TMEM18 PTMA A7KR ≥6.5 RNF38 FOCAD WARE ≥8UBQLN1 HNRNPK A7KR ≥6.5 RNF38 PARP16 WARE ≥8UNKL ATP6V0C A7KR ≥8 RP1-225E12.2 NUP210 WARE ≥8UNKL UBE2I A7KR ≥8 RP5-1062J16.1 FOCAD WARE ≥6.5YPEL5 PTMA A7KR ≥6.5 TCF3 JSRP1 WARE ≥6.5ZC3H3 EEF1D A7KR ≥8 TMPRSS15 RFX7 WARE ≥6.5CHD2 B2M AJYE ≥8 UFL1 GIGYF2 WARE ≥6.5LIMD2 JSRP1 AJYE ≥6.5 KLF2 JSRP1 WHTN ≥6.5MKRN1 JHDM1D AJYE ≥8 OAZ1 LIMD2 WHTN ≥8PTMA CXCR4 AJYE ≥6.5 PTMA BCL2L11 WHTN ≥6.5SH3BP1 ATAD3A AJYE ≥6.5 CXCR4 BCL2L11 X5Z3 ≥8TMC6 LRCH4 AJYE ≥8 GNAS B2M X5Z3 ≥8AKAP8 ACOT7 BO0I ≥6.5 GNAS CXCR4 X5Z3 ≥8CHD2 B2M BO0I ≥8 HSPD1 CLK1 X5Z3 ≥6.5CXCR4 B2M BO0I ≥8 IGHA1 CXCR4 X5Z3 ≥6.5CXCR4 BCL2L11 BO0I ≥8 IGHM IGHG1 X5Z3 ≥8
Continued on next page

131
Table S8 – continued from previous page
Gene1 Gene2 Sample Score Gene1 Gene2 Sample Score
CXCR4 CHD2 BO0I ≥8 KLF2 JSRP1 X5Z3 ≥6.5GABPB1 B2M BO0I ≥6.5 OAZ1 CSNK1G2 X5Z3 ≥8KLF2 AKAP8 BO0I ≥8 PDPK2 ATP6V0C X5Z3 ≥6.5KLF2 JSRP1 BO0I ≥6.5 PTMA CXCR4 X5Z3 ≥6.5PTMA BCL2L11 BO0I ≥6.5 PTMA HMGN2 X5Z3 ≥6.5PTMA CXCR4 BO0I ≥6.5 RGPD5 BCL2L11 X5Z3 ≥8PTPN12 LHFPL5 BO0I ≥6.5 RP11-20I23.3 CXCR4 X5Z3 ≥6.5RBM38 JSRP1 BO0I ≥6.5 SRSF7 PTMA X5Z3 ≥8SFMBT1 PTMA BO0I ≥8 SSU72 SKI X5Z3 ≥8SRSF7 CXCR4 BO0I ≥8 TCF3 OAZ1 X5Z3 ≥8ZNF407 CNDP1 BO0I ≥6.5 UBB DDX5 X5Z3 ≥6.5HLA-DRB5 HLA-DPB1 CF04 ≥6.5 UBXN4 CXCR4 X5Z3 ≥8NOC4L FBRSL1 CF04 ≥8 UNKL UBE2I X5Z3 ≥8YPEL5 CXCR4 CF04 ≥8 B2M ACTB XMEH ≥8PTMA CXCR4 CI7B ≥6.5 CHD2 B2M XMEH ≥8CHD2 B2M CRU4 ≥8 IGHM IGHG4 XMEH ≥6.5CXCR4 BCL2L11 CRU4 ≥8 PPP3CC PIWIL2 XMEH ≥8CXCR4 CHD2 CRU4 ≥8 PTMA ACTB XMEH ≥6.5GNAS B2M CRU4 ≥8 PTMA CXCR4 XMEH ≥6.5GNAS CXCR4 CRU4 ≥8 PTMA OAZ1 XMEH ≥8HMGB1 CXCR4 CRU4 ≥6.5 CHD2 B2M XY05 ≥8IGHA1 CXCR4 CRU4 ≥6.5 IGKV5-2 IGKJ5 XY05 ≥8OAZ1 ATP6V0C CRU4 ≥8 MORF4L1 B2M XY05 ≥8PTMA CXCR4 CRU4 ≥8 OAZ1 CSNK1G2 XY05 ≥8RGPD8 BCL2L11 CRU4 ≥6.5 PTMA CXCR4 XY05 ≥6.5RP11-20I23.1 B2M CRU4 ≥8 PTMA OAZ1 XY05 ≥8RP11-20I23.1 PDPK1 CRU4 ≥8 STK3 ARHGAP24 XY05 ≥6.5SFMBT1 PTMA CRU4 ≥8 UBB ACTB XY05 ≥6.5UBB CXCR4 CRU4 ≥8 UBB DDX5 XY05 ≥8KLF2 JSRP1 CY4B ≥6.5 ZEB1 BMI1 XY05 ≥8UBAC2 PAN3 CY4B ≥8 CXCR4 CHD2 Y67L ≥8UBC UBB CY4B ≥6.5 DLG1 AC090018.1 Y67L ≥6.5IGHA2 IGHA1 ECD1 ≥8 DLG1 APOD Y67L ≥6.5IGHG3 AL122127.4 ECD1 ≥6.5 FYTTD1 CXCR4 Y67L ≥8LRRC37A2 KANSL1 ECD1 ≥6.5 GNAS CXCR4 Y67L ≥8PTMA CXCR4 ECD1 ≥6.5 PTMA CXCR4 Y67L ≥6.5SIK3 RP11-680E19.2 ECD1 ≥6.5 USP34 NAV3 Y67L ≥8CHD2 B2M ES0J ≥8 VAV2 PTMA Y67L ≥8SRRM2 IGHD ES0J ≥6.5 WAC EPS15L1 Y67L ≥6.5UHRF1 PLIN3 ES0J ≥6.5 CHD2 B2M YB12 ≥8LINS CNOT2 FBE8 ≥6.5 CXCR4 CHD2 YB12 ≥8OAZ1 BTBD2 FBE8 ≥8 KLF2 JSRP1 YB12 ≥6.5PTMA CXCR4 FBE8 ≥8 PTMA CXCR4 YB12 ≥6.5MAP4K5 ECHDC3 FHFW ≥6.5 SMEK1 CATSPERB YB12 ≥8PNRC1 BACH2 FHFW ≥8 HLA-DRB5 HLA-DPB1 YNIY ≥8PTMA CXCR4 FHFW ≥6.5 RP4-545L17.7 ANGPT4 YTYV ≥6.5STK3 ARHGAP24 FHFW ≥6.5 SMCHD1 ATP9B YTYV ≥8YPEL5 CXCR4 FHFW ≥8 ALKBH4 AFAP1 YV7I ≥6.5ZBTB4 EXOC7 FHFW ≥6.5 KLF2 JSRP1 YV7I ≥6.5
Continued on next page

132
Table S8 – continued from previous page
Gene1 Gene2 Sample Score Gene1 Gene2 Sample Score
MAOA DDX3X FK5H ≥8 PNPLA7 LIMD2 YV7I ≥6.5RP6-113J7.1 DDX3X FK5H ≥8 PTMA CXCR4 YV7I ≥6.5MRPS18A B4GALT1 FSHB ≥6.5 USP11 KLF2 YV7I ≥8PTMA CXCR4 FSHB ≥6.5 VPS18 CHD2 YV7I ≥6.5USP34 NAV3 FSHB ≥8 CHD2 B2M Z0HX ≥8CHD2 B2M GN55 ≥8 CXCR4 CLK1 Z0HX ≥8CXCR4 CHD2 GN55 ≥8 PTMA CXCR4 Z0HX ≥6.5HLA-DRB1 HLA-DPB1 GN55 ≥8 RP11-309I15.1 NUP88 Z0HX ≥6.5HLA-G HLA-B GN55 ≥6.5 STRN4 ARHGAP35 Z0HX ≥8PTMA CXCR4 GN55 ≥6.5 TMEM110 PSMD12 Z0HX ≥6.5CXCR4 BCL2L11 GPLO ≥8 ENPP2 BX284650.2 ZCLY ≥6.5UBAP1 PTPRC GPLO ≥6.5 GRM7 FCRL1 ZCLY ≥8USPL1 FLT3 GPLO ≥6.5 IGHA2 IGHA1 ZCLY ≥8KLF2 FOSB GTPS ≥8 MRPS18A B4GALT1 ZCLY ≥6.5MAN2A1 INTS6 GTPS ≥8 PTMA CXCR4 ZCLY ≥6.5PTMA CXCR4 GTPS ≥6.5 RP11-495P10.1 ENPP2 ZCLY ≥6.5RANBP9 ATXN1 GTPS ≥8 SUCLA2 DHRS12 ZF32 ≥6.5RANBP9 MAN2A1 GTPS ≥8 ESCO1 EFCAB13 ZRWN ≥6.5TCF3 OAZ1 GTPS ≥8 GNAS B2M ZRWN ≥8KLF2 JSRP1 JQ6C ≥6.5 RGPD1 KDM3A ZRWN ≥6.5PNPLA7 KLF2 JQ6C ≥6.5 PTMA CXCR4 HNZA ≥6.5PTMA CXCR4 JQ6C ≥6.5
Note: The order of fusion partner 5′ and 3′ is ignored to simplify comparison.
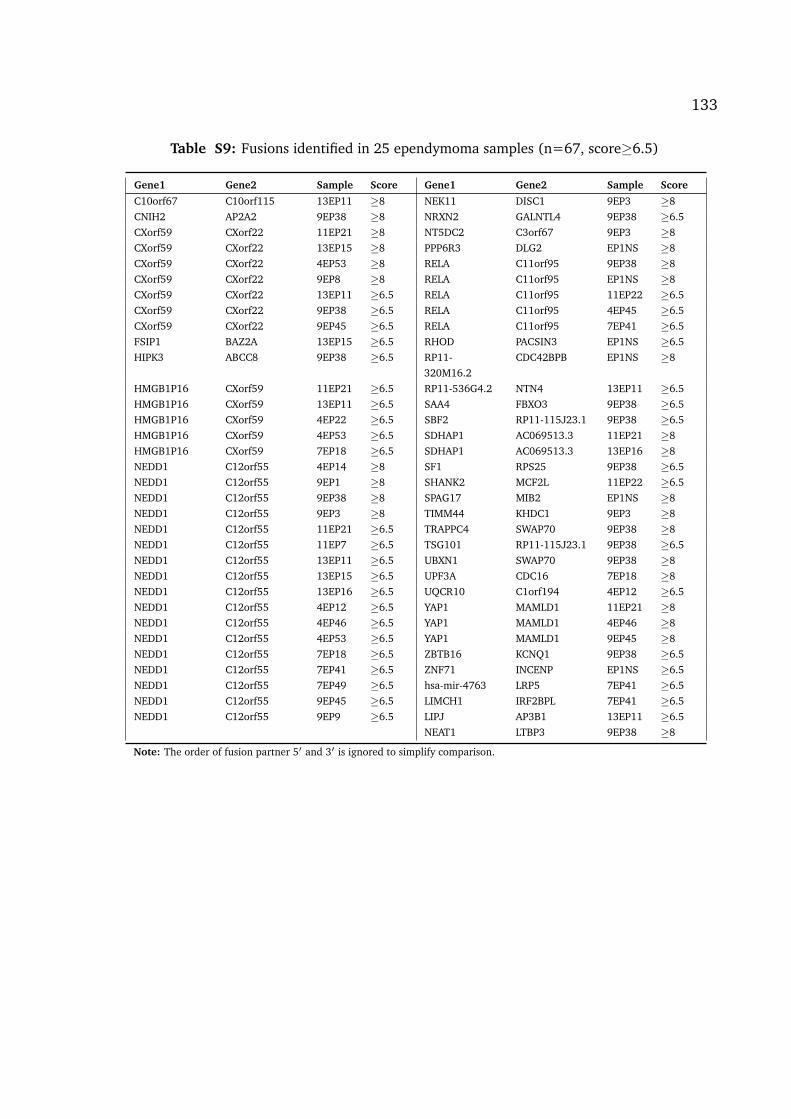
133
Table S9: Fusions identified in 25 ependymoma samples (n=67, score≥6.5)
Gene1 Gene2 Sample Score Gene1 Gene2 Sample Score
C10orf67 C10orf115 13EP11 ≥8 NEK11 DISC1 9EP3 ≥8CNIH2 AP2A2 9EP38 ≥8 NRXN2 GALNTL4 9EP38 ≥6.5CXorf59 CXorf22 11EP21 ≥8 NT5DC2 C3orf67 9EP3 ≥8CXorf59 CXorf22 13EP15 ≥8 PPP6R3 DLG2 EP1NS ≥8CXorf59 CXorf22 4EP53 ≥8 RELA C11orf95 9EP38 ≥8CXorf59 CXorf22 9EP8 ≥8 RELA C11orf95 EP1NS ≥8CXorf59 CXorf22 13EP11 ≥6.5 RELA C11orf95 11EP22 ≥6.5CXorf59 CXorf22 9EP38 ≥6.5 RELA C11orf95 4EP45 ≥6.5CXorf59 CXorf22 9EP45 ≥6.5 RELA C11orf95 7EP41 ≥6.5FSIP1 BAZ2A 13EP15 ≥6.5 RHOD PACSIN3 EP1NS ≥6.5HIPK3 ABCC8 9EP38 ≥6.5 RP11-
320M16.2CDC42BPB EP1NS ≥8
HMGB1P16 CXorf59 11EP21 ≥6.5 RP11-536G4.2 NTN4 13EP11 ≥6.5HMGB1P16 CXorf59 13EP11 ≥6.5 SAA4 FBXO3 9EP38 ≥6.5HMGB1P16 CXorf59 4EP22 ≥6.5 SBF2 RP11-115J23.1 9EP38 ≥6.5HMGB1P16 CXorf59 4EP53 ≥6.5 SDHAP1 AC069513.3 11EP21 ≥8HMGB1P16 CXorf59 7EP18 ≥6.5 SDHAP1 AC069513.3 13EP16 ≥8NEDD1 C12orf55 4EP14 ≥8 SF1 RPS25 9EP38 ≥6.5NEDD1 C12orf55 9EP1 ≥8 SHANK2 MCF2L 11EP22 ≥6.5NEDD1 C12orf55 9EP38 ≥8 SPAG17 MIB2 EP1NS ≥8NEDD1 C12orf55 9EP3 ≥8 TIMM44 KHDC1 9EP3 ≥8NEDD1 C12orf55 11EP21 ≥6.5 TRAPPC4 SWAP70 9EP38 ≥8NEDD1 C12orf55 11EP7 ≥6.5 TSG101 RP11-115J23.1 9EP38 ≥6.5NEDD1 C12orf55 13EP11 ≥6.5 UBXN1 SWAP70 9EP38 ≥8NEDD1 C12orf55 13EP15 ≥6.5 UPF3A CDC16 7EP18 ≥8NEDD1 C12orf55 13EP16 ≥6.5 UQCR10 C1orf194 4EP12 ≥6.5NEDD1 C12orf55 4EP12 ≥6.5 YAP1 MAMLD1 11EP21 ≥8NEDD1 C12orf55 4EP46 ≥6.5 YAP1 MAMLD1 4EP46 ≥8NEDD1 C12orf55 4EP53 ≥6.5 YAP1 MAMLD1 9EP45 ≥8NEDD1 C12orf55 7EP18 ≥6.5 ZBTB16 KCNQ1 9EP38 ≥6.5NEDD1 C12orf55 7EP41 ≥6.5 ZNF71 INCENP EP1NS ≥6.5NEDD1 C12orf55 7EP49 ≥6.5 hsa-mir-4763 LRP5 7EP41 ≥6.5NEDD1 C12orf55 9EP45 ≥6.5 LIMCH1 IRF2BPL 7EP41 ≥6.5NEDD1 C12orf55 9EP9 ≥6.5 LIPJ AP3B1 13EP11 ≥6.5
NEAT1 LTBP3 9EP38 ≥8
Note: The order of fusion partner 5′ and 3′ is ignored to simplify comparison.
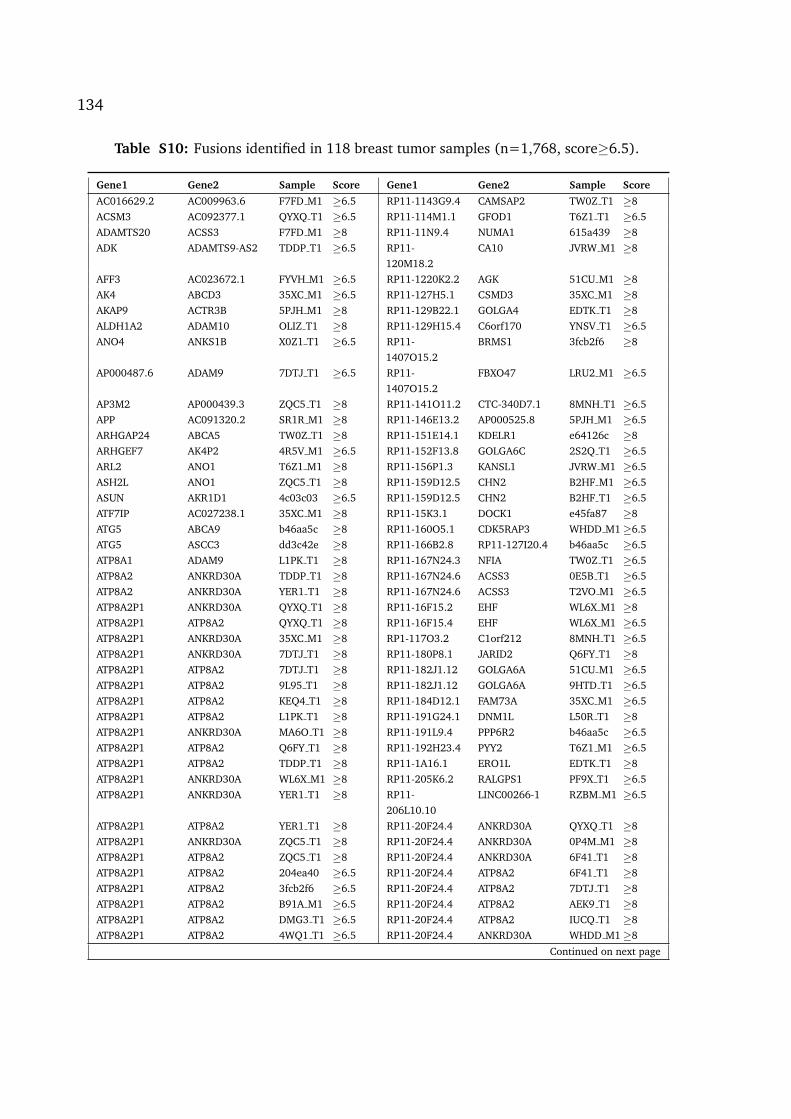
134
Table S10: Fusions identified in 118 breast tumor samples (n=1,768, score≥6.5).
Gene1 Gene2 Sample Score Gene1 Gene2 Sample Score
AC016629.2 AC009963.6 F7FD M1 ≥6.5 RP11-1143G9.4 CAMSAP2 TW0Z T1 ≥8ACSM3 AC092377.1 QYXQ T1 ≥6.5 RP11-114M1.1 GFOD1 T6Z1 T1 ≥6.5ADAMTS20 ACSS3 F7FD M1 ≥8 RP11-11N9.4 NUMA1 615a439 ≥8ADK ADAMTS9-AS2 TDDP T1 ≥6.5 RP11-
120M18.2CA10 JVRW M1 ≥8
AFF3 AC023672.1 FYVH M1 ≥6.5 RP11-1220K2.2 AGK 51CU M1 ≥8AK4 ABCD3 35XC M1 ≥6.5 RP11-127H5.1 CSMD3 35XC M1 ≥8AKAP9 ACTR3B 5PJH M1 ≥8 RP11-129B22.1 GOLGA4 EDTK T1 ≥8ALDH1A2 ADAM10 OLIZ T1 ≥8 RP11-129H15.4 C6orf170 YNSV T1 ≥6.5ANO4 ANKS1B X0Z1 T1 ≥6.5 RP11-
1407O15.2BRMS1 3fcb2f6 ≥8
AP000487.6 ADAM9 7DTJ T1 ≥6.5 RP11-1407O15.2
FBXO47 LRU2 M1 ≥6.5
AP3M2 AP000439.3 ZQC5 T1 ≥8 RP11-141O11.2 CTC-340D7.1 8MNH T1 ≥6.5APP AC091320.2 SR1R M1 ≥8 RP11-146E13.2 AP000525.8 5PJH M1 ≥6.5ARHGAP24 ABCA5 TW0Z T1 ≥8 RP11-151E14.1 KDELR1 e64126c ≥8ARHGEF7 AK4P2 4R5V M1 ≥6.5 RP11-152F13.8 GOLGA6C 2S2Q T1 ≥6.5ARL2 ANO1 T6Z1 M1 ≥8 RP11-156P1.3 KANSL1 JVRW M1 ≥6.5ASH2L ANO1 ZQC5 T1 ≥8 RP11-159D12.5 CHN2 B2HF M1 ≥6.5ASUN AKR1D1 4c03c03 ≥6.5 RP11-159D12.5 CHN2 B2HF T1 ≥6.5ATF7IP AC027238.1 35XC M1 ≥8 RP11-15K3.1 DOCK1 e45fa87 ≥8ATG5 ABCA9 b46aa5c ≥8 RP11-160O5.1 CDK5RAP3 WHDD M1≥6.5ATG5 ASCC3 dd3c42e ≥8 RP11-166B2.8 RP11-127I20.4 b46aa5c ≥6.5ATP8A1 ADAM9 L1PK T1 ≥8 RP11-167N24.3 NFIA TW0Z T1 ≥6.5ATP8A2 ANKRD30A TDDP T1 ≥8 RP11-167N24.6 ACSS3 0E5B T1 ≥6.5ATP8A2 ANKRD30A YER1 T1 ≥8 RP11-167N24.6 ACSS3 T2VO M1 ≥6.5ATP8A2P1 ANKRD30A QYXQ T1 ≥8 RP11-16F15.2 EHF WL6X M1 ≥8ATP8A2P1 ATP8A2 QYXQ T1 ≥8 RP11-16F15.4 EHF WL6X M1 ≥6.5ATP8A2P1 ANKRD30A 35XC M1 ≥8 RP1-117O3.2 C1orf212 8MNH T1 ≥6.5ATP8A2P1 ANKRD30A 7DTJ T1 ≥8 RP11-180P8.1 JARID2 Q6FY T1 ≥8ATP8A2P1 ATP8A2 7DTJ T1 ≥8 RP11-182J1.12 GOLGA6A 51CU M1 ≥6.5ATP8A2P1 ATP8A2 9L95 T1 ≥8 RP11-182J1.12 GOLGA6A 9HTD T1 ≥6.5ATP8A2P1 ATP8A2 KEQ4 T1 ≥8 RP11-184D12.1 FAM73A 35XC M1 ≥6.5ATP8A2P1 ATP8A2 L1PK T1 ≥8 RP11-191G24.1 DNM1L L50R T1 ≥8ATP8A2P1 ANKRD30A MA6O T1 ≥8 RP11-191L9.4 PPP6R2 b46aa5c ≥6.5ATP8A2P1 ATP8A2 Q6FY T1 ≥8 RP11-192H23.4 PYY2 T6Z1 M1 ≥6.5ATP8A2P1 ATP8A2 TDDP T1 ≥8 RP11-1A16.1 ERO1L EDTK T1 ≥8ATP8A2P1 ANKRD30A WL6X M1 ≥8 RP11-205K6.2 RALGPS1 PF9X T1 ≥6.5ATP8A2P1 ANKRD30A YER1 T1 ≥8 RP11-
206L10.10LINC00266-1 RZBM M1 ≥6.5
ATP8A2P1 ATP8A2 YER1 T1 ≥8 RP11-20F24.4 ANKRD30A QYXQ T1 ≥8ATP8A2P1 ANKRD30A ZQC5 T1 ≥8 RP11-20F24.4 ANKRD30A 0P4M M1 ≥8ATP8A2P1 ATP8A2 ZQC5 T1 ≥8 RP11-20F24.4 ANKRD30A 6F41 T1 ≥8ATP8A2P1 ATP8A2 204ea40 ≥6.5 RP11-20F24.4 ATP8A2 6F41 T1 ≥8ATP8A2P1 ATP8A2 3fcb2f6 ≥6.5 RP11-20F24.4 ATP8A2 7DTJ T1 ≥8ATP8A2P1 ATP8A2 B91A M1 ≥6.5 RP11-20F24.4 ATP8A2 AEK9 T1 ≥8ATP8A2P1 ATP8A2 DMG3 T1 ≥6.5 RP11-20F24.4 ATP8A2 IUCQ T1 ≥8ATP8A2P1 ATP8A2 4WQ1 T1 ≥6.5 RP11-20F24.4 ANKRD30A WHDD M1≥8
Continued on next page

135
Table S10 – continued from previous page
Gene1 Gene2 Sample Score Gene1 Gene2 Sample Score
ATP8A2P1 ATP8A2 5D6N M1 ≥6.5 RP11-20F24.4 ANKRD30A WL6X M1 ≥8ATP8A2P1 ATP8A2 5PJH M1 ≥6.5 RP11-20F24.4 ANKRD30A YA4W M1 ≥8ATP8A2P1 ANKRD30A 6F41 T1 ≥6.5 RP11-20F24.4 ANKRD30A ZQC5 T1 ≥8ATP8A2P1 ATP8A2 6F41 T1 ≥6.5 RP11-20F24.4 ATP8A2 ZQC5 T1 ≥8ATP8A2P1 ATP8A2 75Z1 T1 ≥6.5 RP11-20F24.4 ATP8A2 ZCYX M1 ≥6.5ATP8A2P1 ATP8A2 86DK M1 ≥6.5 RP11-219E7.4 AP000525.8 EDTK T1 ≥8ATP8A2P1 ANKRD30A 9L95 T1 ≥6.5 RP11-219E7.4 EEA1 L50R T1 ≥8ATP8A2P1 ATP8A2 A0GM T1 ≥6.5 RP11-
240M16.1KIAA1244 T6Z1 T1 ≥6.5
ATP8A2P1 ANKRD30A AEK9 T1 ≥6.5 RP11-268G12.1 AGBL5 0XC1 M1 ≥8ATP8A2P1 ATP8A2 AEK9 T1 ≥6.5 RP11-281N10.1 NUDCD1 35XC M1 ≥6.5ATP8A2P1 ANKRD30A DBBB M1 ≥6.5 RP11-285A15.1 NBAS b46aa5c ≥8ATP8A2P1 ATP8A2 DBBB M1 ≥6.5 RP11-285F7.2 CTB-50L17.10 4R5V M1 ≥8ATP8A2P1 ATP8A2 FHKD T1 ≥6.5 RP11-304C16.3 FUCA2 QYXQ M1 ≥6.5ATP8A2P1 ATP8A2 PF9X T1 ≥6.5 RP11-30L4.5 DOCK2 D988 M1 ≥6.5ATP8A2P1 ANKRD30A Q6FY T1 ≥6.5 RP11-310E22.5 C10orf76 D988 M1 ≥6.5ATP8A2P1 ATP8A2 SR1R M1 ≥6.5 RP11-311F12.1 LASP1 Q6FY T1 ≥6.5ATP8A2P1 ANKRD30A T2VO M1 ≥6.5 RP11-313P18.1 LOXL1 HY35 T1 ≥6.5ATP8A2P1 ATP8A2 TC6T T1 ≥6.5 RP11-314D7.4 LIMCH1 T6Z1 T1 ≥8ATP8A2P1 ANKRD30A TDDP T1 ≥6.5 RP11-314D7.4 METTL21B 2S2Q T1 ≥6.5ATP8A2P1 ANKRD30A TM97 T1 ≥6.5 RP11-314D7.4 ATP5S 8H0R M1 ≥6.5ATP8A2P1 ANKRD30A TX2S T1 ≥6.5 RP11-314P15.2 NDST3 ZCYX M1 ≥8ATP8A2P1 ANKRD30A WHDD M1≥6.5 RP11-330L19.4 BUB1B YNSV T1 ≥6.5ATP8A2P1 ATP8A2 WHDD M1≥6.5 RP11-356C4.5 ARL17B 8H0R M1 ≥6.5ATP8A2P1 ATP8A2 WL6X M1 ≥6.5 RP11-357F12.1 NUFIP2 YER1 T1 ≥8BAZ2B ARID5A b46aa5c ≥8 RP11-359J23.1 CMIP SR1R M1 ≥8BCAS3 ABCA8 Q6FY T1 ≥8 RP11-368P15.1 FERMT2 7FNO M1 ≥8BCAS3 AC005682.8 B2HF T1 ≥6.5 RP11-393K19.1 CSMD3 35XC M1 ≥6.5BCL2L14 ASTN2 HMXT T1 ≥6.5 RP11-410A13.3 DHRSX 3b8237c ≥6.5BECN1 ACACA AC72 T1 ≥8 RP11-420N3.2 DNASE1 b46aa5c ≥6.5BLMH ALOX12P1 ZS4T T1 ≥6.5 RP11-420N3.2 GSPT1 b46aa5c ≥6.5BRIP1 BCAS3 QYXQ M1 ≥6.5 RP11-420N3.2 RP11-166B2.8 b46aa5c ≥6.5BTBD16 ACSL5 SR1R M1 ≥6.5 RP11-428C19.4 NAV2 4R5V M1 ≥6.5BTG3 APP 4R5V M1 ≥6.5 RP11-431D12.1 CYP7B1 35XC M1 ≥6.5C11orf85 ATE1 L50R T1 ≥8 RP11-431D12.1 PKHD1L1 35XC M1 ≥6.5C12orf66 AFF3 86DK M1 ≥6.5 RP11-431M3.1 KANSL1 JVRW M1 ≥8C14orf39 ALCAM WL6X M1 ≥8 RP11-433C9.2 KPNA5 AEK9 T1 ≥6.5C16orf52 BOLA3 SR1R M1 ≥8 RP11-446F3.2 RGMB WL6X M1 ≥6.5C5orf22 ATG16L2 4R5V T1 ≥8 RP11-475O6.1 BAIAP2 EDTK T1 ≥8CAAP1 AC079776.7 699525b ≥6.5 RP11-480O10.2 PPFIA1 FYVH M1 ≥6.5CALD1 AKR1B10 51CU M1 ≥8 RP11-496I2.3 ATG5 EDTK T1 ≥6.5CALD1 AKR1B15 51CU M1 ≥6.5 RP11-498D10.4 NKD1 YNSV T1 ≥6.5CAMK1D ATE1 L50R T1 ≥6.5 RP11-521I2.3 KIF13B RQX5 M1 ≥6.5CASP8 AP2S1 B2HF T1 ≥6.5 RP11-522N14.1 BCAS3 2S2Q T1 ≥8CCDC171 AL589988.1 L50R T1 ≥8 RP11-543E8.2 MGP bed845b ≥6.5CCDC74A AC093838.7 QYXQ T1 ≥6.5 RP11-545L5.1 RP11-
1407O15.28MNH T1 ≥8
CCDC74A AC093838.7 I4ZX T1 ≥6.5 RP11-549B18.3 MOCOS 4R5V M1 ≥6.5CCDC88A AGFG1 cb6c764 ≥6.5 RP11-56B16.5 ATP8B4 HY35 T1 ≥6.5
Continued on next page

136
Table S10 – continued from previous page
Gene1 Gene2 Sample Score Gene1 Gene2 Sample Score
CCND1 ANO1 L50R T1 ≥6.5 RP1-15D23.2 EDARADD IUCQ T1 ≥6.5CCNE1 ANKRD27 e64126c ≥8 RP11-5N23.2 FAM188A 4c03c03 ≥6.5CCNI AC022431.2 5D6N M1 ≥8 RP11-611E13.2 HOOK3 TW0Z T1 ≥6.5CCR3 ATP7B RQX5 M1 ≥6.5 RP11-624L4.1 PGAP3 35XC M1 ≥6.5CD5L ALDH9A1 Q6FY T1 ≥6.5 RP11-626H12.1 NRD1 L50R T1 ≥6.5CDC42BPA ASTN1 Q6FY T1 ≥8 RP11-632B21.1 RAB3IP b9b21b9 ≥8CDC42BPG 7SK L50R T1 ≥8 RP11-64C1.1 FLNB cb6c764 ≥6.5CDC42EP3 BMP2K 5D6N M1 ≥6.5 RP11-65J21.3 ABCC1 b9b21b9 ≥6.5CDH20 ATP9B B2HF M1 ≥8 RP11-662G23.1 PRPF3 TW0Z T1 ≥8CDH3 CDH1 AC72 T1 ≥8 RP11-680G10.1 ACSM3 QYXQ T1 ≥6.5CDK14 AUTS2 ZCYX M1 ≥6.5 RP11-680G10.1 CRISPLD2 8HNA T1 ≥6.5CHCHD3 CASD1 46DP M1 ≥8 RP11-702L6.4 HMBOX1 T6Z1 T1 ≥6.5CHN1 AC073465.3 EDTK T1 ≥8 RP11-731N10.1 FABP12 TW0Z T1 ≥6.5CHODL ASTN2 51CU M1 ≥6.5 RP11-73H14.1 CCDC138 F7FD M1 ≥6.5CHODL ASTN2 8HNA T1 ≥6.5 RP11-73O6.4 CDKL4 b46aa5c ≥6.5CHSY1 ADAMTS17 8MNH T1 ≥8 RP11-744I24.2 NUP205 TX2S T1 ≥6.5CIR1 CERS6 5D6N M1 ≥6.5 RP11-744I24.2 OPA1 TX2S T1 ≥6.5CLASP1 AC064875.2 4R5V M1 ≥6.5 RP11-74C3.1 PPFIA1 L50R T1 ≥8CMIP CCNY SR1R M1 ≥8 RP11-76P2.3 PTEN 8HNA T1 ≥8CNIH3 C17orf96 Q6FY T1 ≥6.5 RP11-773D16.1 PDS5A QK84 M1 ≥6.5CNTD1 ACACA AC72 T1 ≥6.5 RP11-783L4.1 KLHL28 F7FD M1 ≥6.5CNTN4 ANKRD17 699525b ≥8 RP11-800A3.3 LRP5 DR8V T1 ≥6.5CNTNAP5 CCDC93 Y5G9 T1 ≥8 RP11-800A3.3 PPFIA1 DR8V T1 ≥6.5COG5 ARNT YNSV T1 ≥8 RP11-805J14.3 RBM14 HY35 T1 ≥6.5COL1A2 COL1A1 af07947 ≥8 RP11-805J14.3 RBM14-RBM4 HY35 T1 ≥6.5COL1A2 CASD1 2S2Q T1 ≥8 RP11-805L22.1 ACACA QYXQ M1 ≥6.5COL24A1 APBB3 0XC1 M1 ≥6.5 RP11-86H7.1 MED13L F7FD M1 ≥6.5COL6A5 ACTL6A NF9D M1 ≥6.5 RP11-89M20.1 NARS2 ZQC5 T1 ≥8CPB1 AP000318.2 ZCYX M1 ≥6.5 RP11-93K22.11 MTUS1 dd3c42e ≥6.5CRB1 CNIH3 Q6FY T1 ≥6.5 RP11-93L9.1 BRIP1 b46aa5c ≥8CRHR1 CNTNAP1 b46aa5c ≥6.5 RP11-973H7.2 NR6A1 WHDD M1≥8CRLF3 B4GALNT2 2RR2 T1 ≥8 RP11-974F13.6 RP11-
1023L17.16F41 T1 ≥6.5
CRTC3 ARRDC4 HY35 T1 ≥6.5 RP11-977P2.1 MTFMT 35XC M1 ≥6.5CRY2 CD82 F11Y T1 ≥8 RP1-249H1.4 PPIL6 AEK9 T1 ≥6.5CSMD1 AGPAT5 1ED9 T1 ≥6.5 RP1-309H15.2 ATXN1 L50R T1 ≥6.5CTA-392C11.1 AGPAT6 ZQC5 T1 ≥8 RP13-16H11.2 NEBL 1ED9 T1 ≥6.5CTA-392C11.1 ACE cb6c764 ≥6.5 RP1-35C21.2 ACBD6 YNSV T1 ≥8CTB-131B5.5 CDKL3 RZBM M1 ≥6.5 RP1-66C13.4 PPP1R9B 699525b ≥6.5CTD-2021H9.2 CTD-2021H9.1 QYCP T1 ≥6.5 RP3-406P24.1 B3GNTL1 Q6FY T1 ≥6.5CTD-2033D24.2
CACNG5 F7FD M1 ≥6.5 RP3-429O6.1 COL14A1 SR1R M1 ≥6.5
CTD-2194A8.2 BAD AEK9 T1 ≥8 RP3-453D15.1 FRK QYXQ M1 ≥6.5CTD-2542L18.1 AC004381.7 QYXQ T1 ≥8 RP3-486B10.1 MYEOV L50R T1 ≥8CTD-2542L18.1 ACSM3 QYXQ T1 ≥8 RP4-562J12.1 GCDH 7FNO M1 ≥6.5CTNND2 CENPQ YNSV T1 ≥6.5 RP4-594L9.2 EHF F7FD M1 ≥6.5CTTN CLNS1A YNSV T1 ≥6.5 RP4-604K5.1 FBXL4 QYXQ M1 ≥8CUX1 CPA6 8MNH T1 ≥8 RP4-669L17.4 HELZ 2RR2 T1 ≥8CWC25 CDC27 T6Z1 M1 ≥8 RP4-737E23.2 KIAA0556 YNSV T1 ≥6.5
Continued on next page

137
Table S10 – continued from previous page
Gene1 Gene2 Sample Score Gene1 Gene2 Sample Score
CXADR APP 4R5V M1 ≥6.5 RP4-810F7.1 ATXN1 T6Z1 T1 ≥6.5CYLD CNEP1R1 E65C M1 ≥6.5 RP5-1029K10.2 PKN1 WHDD M1≥8CYP4B1 AL136985.1 E65C M1 ≥6.5 RP5-1031J8.1 NCOA6 7DTJ T1 ≥6.5CYP4F24P CYP4F12 A0GM T1 ≥6.5 RP5-1112F19.2 DNTTIP1 TX2S T1 ≥6.5CYTH1 ASPSCR1 cfd2f24 ≥8 RP5-914P20.5 NFATC2 cb6c764 ≥6.5CYTH1 CEP95 cfd2f24 ≥8 RP5-981L23.1 ATP9A TX2S T1 ≥6.5DCP2 APC 51CU M1 ≥8 RP5-984P4.1 ARFGEF2 SR1R M1 ≥6.5DCTN5 COG7 DMG3 M1 ≥6.5 RPAP2 NOS1 L50R T1 ≥8DDHD2 ADAM32 FYVH M1 ≥6.5 RPL18 CDK12 D988 M1 ≥6.5DDX11 ANO6 8HNA T1 ≥8 RPL21P110 PIBF1 8H0R M1 ≥6.5DDX11L1 AC018816.3 cfd2f24 ≥6.5 RPL31P41 ASPH 2S2Q T1 ≥8DDX42 ABCA5 Q6FY T1 ≥8 RPL36 GIPC3 SR1R M1 ≥6.5DDX6 CTD-2216M2.1 HMXT T1 ≥6.5 RPRD2 ACP6 TW0Z T1 ≥8DENND1B BRIP1 Q6FY T1 ≥8 RPRD2 GJA5 TW0Z T1 ≥8DENND4C ACER2 8H0R M1 ≥8 RPS15AP5 FGFR2 L50R T1 ≥6.5DGCR2 CECR2 2S2Q T1 ≥8 RPS15AP5 NSMCE4A L50R T1 ≥6.5DIRC1 CTDP1 af07947 ≥8 RPS24 C10orf11 46DP M1 ≥6.5DISP1 C10orf68 3b8237c ≥6.5 RPS6KA1 KIAA1522 DMG3 T1 ≥6.5DISP1 C10orf68 4ec8eca ≥6.5 RPS6KA4 KDM2A JVRW M1 ≥6.5DMXL2 ARIH1 3fcb2f6 ≥6.5 RPS6KB1 BCAS3 B2HF T1 ≥8DNAJC3 CLDN10 8H0R M1 ≥8 RPS6KB1 CAMSAP2 Q6FY T1 ≥8DNM2 ADAMTS10 WHDD M1≥8 RPS6KB1 BAG4 JVRW M1 ≥6.5DOCK5 ADAM32 WHDD M1≥8 RPTOR DUS1L cfd2f24 ≥8DPP10 C2orf49 Q6FY T1 ≥8 RPTOR NF1 LRU2 M1 ≥6.5DPP6 AKAP9 ZCYX M1 ≥8 RRAGC MACF1 2S2Q T1 ≥6.5DPP6 CNTNAP2 ZCYX M1 ≥8 RSBN1L-AS1 DPP6 5PJH M1 ≥8DUSP4 CDCA2 WL6X M1 ≥6.5 RUFY1 RAPGEF5 dd3c42e ≥6.5DYRK1A ADRM1 X0Z1 T1 ≥8 RUNX1 CCDC58 b46aa5c ≥8DYRK2 CCT2 007M M1 ≥6.5 RUNX1 KPNA1 b46aa5c ≥8ECT2 C2orf15 35XC M1 ≥6.5 RUNX1 BRE HMXT T1 ≥8EFHA2 BLMH 8H0R M1 ≥6.5 RUNX1 FARSB SR1R M1 ≥8EFNA1 C1orf167 4c03c03 ≥8 RUNX1 PPM1H 2S2Q T1 ≥6.5EIF2S3 ACOT9 59cb2ad ≥6.5 RUNX1 MOGAT1 SR1R M1 ≥6.5EIF3H CSMD3 2RR2 T1 ≥8 RUNX1 AGPAT3 X0Z1 T1 ≥6.5ELOVL2 AL137003.1 QYXQ M1 ≥8 RWDD1 RP11-
126M14.1QYXQ M1 ≥6.5
ELOVL2 ATXN1 QYXQ M1 ≥8 RYR1 ACTN4 HMXT T1 ≥8ELOVL2 ATG5 QYXQ M1 ≥6.5 RYR3 COPS2 35XC M1 ≥6.5ELP3 DHX30 RQX5 M1 ≥8 S100A7A C1orf43 T6Z1 M1 ≥6.5ELP3 CEBPD cfd2f24 ≥6.5 S100Z AGGF1 T2VO M1 ≥8ENY2 ADCY8 35XC M1 ≥6.5 SAFB BLNK 5f7b7fb ≥8EPB42 CWC25 TC6T T1 ≥8 SAP30L AC114947.1 T6Z1 M1 ≥8EPG5 C18orf25 007M M1 ≥6.5 SARNP RP11-291B21.2 I4ZX T1 ≥6.5EPHA7 ATG5 EDTK T1 ≥8 SASH1 PCMT1 T6Z1 T1 ≥8EPS15 ABCA4 L50R T1 ≥8 SBNO1 MPHOSPH9 HMXT T1 ≥8ERBB2 ACLY 35XC M1 ≥6.5 SBNO2 POLRMT YNSV T1 ≥6.5ERBB2 ALG6 35XC M1 ≥6.5 SCAI ATXN2 H9F4 M1 ≥8ERBB4 CYFIP1 YNSV T1 ≥6.5 SCML2 CTPS2 HMXT T1 ≥8ERGIC2 CASC1 b9b21b9 ≥8 SCML4 RTN4IP1 EDTK T1 ≥6.5
Continued on next page

138
Table S10 – continued from previous page
Gene1 Gene2 Sample Score Gene1 Gene2 Sample Score
ERGIC3 CEP250 HMXT T1 ≥8 SCN5A ARPP21 F7FD M1 ≥6.5ESR1 CDH8 SR1R M1 ≥8 SCRN3 CERS6 5D6N M1 ≥8ESR1 CCDC170 DMG3 M1 ≥6.5 SDC2 CPQ af07947 ≥8ESR1 CCDC170 0E5B T1 ≥6.5 SDCBP ADCY8 35XC M1 ≥6.5ESR1 CCDC170 86DK M1 ≥6.5 SDCBP CYP7B1 35XC M1 ≥6.5ESR1 CCDC170 8H0R M1 ≥6.5 SDCBP KCNB2 35XC M1 ≥6.5ETV6 ANKS1B I4ZX T1 ≥8 SDCBP RP11-1D12.1 35XC M1 ≥6.5ETV6 BCL2L14 HMXT T1 ≥6.5 SDHAF2 C10orf47 L50R T1 ≥8EXOC2 EFHC1 4R5V T1 ≥6.5 SDHAP1 AC069513.3 DMG3 T1 ≥8EXOC7 CDR2L AC72 T1 ≥8 SDR42E1 AES 35XC M1 ≥8EXOC7 CDR2L B2HF M1 ≥6.5 SEC14L6 LIMK2 L50R T1 ≥8EYS ATG5 EDTK T1 ≥8 SEC22B KDM5B T6Z1 T1 ≥8EZH2 ESCO1 ZCYX M1 ≥8 SEC22B NOTCH2 TX2S T1 ≥6.5FAIM3 C4BPB cfd2f24 ≥8 SEC63 DDX42 b46aa5c ≥8FAM107B C18orf1 cfd2f24 ≥6.5 SEC63 RP11-305B6.3 EDTK T1 ≥6.5FAM160B1 ABLIM1 HMXT T1 ≥6.5 SECISBP2L MTR 9L95 T1 ≥6.5FAM172A ELL2 F7FD M1 ≥8 SECISBP2L MTR IUCQ T1 ≥6.5FAM49B ADCY8 YNSV T1 ≥8 SEH1L RIMS3 SR1R M1 ≥8FAM50B DUSP22 T6Z1 T1 ≥8 SELENBP1 PI4KB 4R5V M1 ≥8FAM59A DNAJC1 3b8237c ≥6.5 SEMA3E SEMA3D 35XC M1 ≥8FARS2 B3GNTL1 Q6FY T1 ≥6.5 SEMA4B AKAP13 HY35 T1 ≥6.5FASN CDK12 cfd2f24 ≥8 SEPT11 EMCN WL6X M1 ≥6.5FASTKD1 CREB1 DR8V T1 ≥8 SEPT5 PPIL2 f1ae704 ≥8FBXL20 CTD-2206N4.4 F11Y T1 ≥8 SEPT7 DAB1 35XC M1 ≥6.5FBXO47 CDC27 LRU2 M1 ≥8 SEPT7P2 KAT7 B2HF M1 ≥6.5FBXW11 DNAH12 HMXT T1 ≥6.5 SEPT7P2 KAT7 B2HF T1 ≥6.5FBXW8 BTBD11 F11Y T1 ≥6.5 SEPT7P2 LHFPL3 LRU2 M1 ≥6.5FCHSD2 ARAP1 YNSV T1 ≥6.5 SEPT9 CUEDC1 b9b21b9 ≥8FEM1AP2 ANKRD12 ZCYX M1 ≥6.5 SEPT9 GDPD1 b9b21b9 ≥8FGF14 COL4A1 4R5V M1 ≥8 SEPT9 GRB2 AC72 T1 ≥8FGF14 DNM2 4c03c03 ≥6.5 SERGEF ANO3 SR1R M1 ≥8FGF14 DNAJC3 SR1R M1 ≥6.5 SERPINB9 RIPK1 75Z1 T1 ≥8FGF19 EHD1 L50R T1 ≥6.5 SESN1 CCDC162P b46aa5c ≥8FILIP1 ATG5 RQX5 M1 ≥8 SESN1 FOXJ3 2RR2 T1 ≥8FLCN BTC F7FD M1 ≥8 SETD5 LMCD1 af07947 ≥8FLJ37644 DDX42 Q6FY T1 ≥6.5 SF3A3 MACF1 DR8V T1 ≥8FMN2 EFCAB7 E65C M1 ≥8 SFI1 RNF185 4R5V M1 ≥6.5FN1 AC007563.5 TX2S T1 ≥6.5 SFI1 GRAP2 L50R T1 ≥6.5FOXO3 EYS EDTK T1 ≥6.5 SFTPD PDS5A QK84 M1 ≥8FRG1 CDK5RAP2 PF9X T1 ≥8 SGCE LRRC6 YNSV T1 ≥8FRG1B CDC27 699525b ≥8 SGCZ RP11-150O12.1 FYVH M1 ≥8FRMD4A FAM188A L50R T1 ≥8 SGCZ DDHD2 FYVH M1 ≥6.5FUT8 C14orf39 7FNO M1 ≥6.5 SGCZ EIF4EBP1 FYVH M1 ≥6.5FYN CDK12 cfd2f24 ≥6.5 SGCZ MRPL13 T2VO M1 ≥6.5FZD7 AC007966.1 IUCQ T1 ≥6.5 SH2D4A KITLG b9b21b9 ≥8G3BP2 CNTN4 699525b ≥6.5 SH3D19 LRBA 0E5B T1 ≥8G6PC3 FMNL1 TC6T T1 ≥6.5 SH3D19 LRBA 9LEL M1 ≥8GALNS DYM F7FD M1 ≥8 SH3D19 LRBA B2HF M1 ≥8GALNT1 DTNA 4R5V M1 ≥6.5 SH3GL1 LRBA 4R5V M1 ≥8
Continued on next page

139
Table S10 – continued from previous page
Gene1 Gene2 Sample Score Gene1 Gene2 Sample Score
GALNTL6 GALNT7 231B T1 ≥6.5 SHANK2 CTTN 0XC1 M1 ≥8GAN FAM18B2-
CDRT45Y1T T1 ≥6.5 SHANK2 IGF1R HY35 T1 ≥8
GDF5 ERGIC3 HMXT T1 ≥6.5 SHANK2 LRP5 ZQC5 T1 ≥8GIPC1 DNM2 WHDD M1≥6.5 SHB KLHL9 LRU2 M1 ≥6.5GLI3 AC005022.1 b46aa5c ≥6.5 SHOC2 PRKG1 4R5V M1 ≥8GLTSCR2 GLTSCR1 4ec8eca ≥8 SHPRH ASCC3 QYXQ M1 ≥8GMDS GCNT2 F7FD M1 ≥8 SHROOM3 PITX2 ZCYX M1 ≥8GMEB1 EPB41 YNSV T1 ≥8 SHROOM3 HPRT1 OLIZ T1 ≥6.5GNA13 C17orf104 cfd2f24 ≥8 SIAH1 INSR Y5G9 T1 ≥6.5GNAI3 C1orf101 699525b ≥8 SIM2 IARS F7FD M1 ≥6.5GNAI3 FAM102B 0E5B T1 ≥8 SIN3A NRG4 YA4W M1 ≥8GNB1 AC004996.1 HMXT T1 ≥8 SIPA1L3 CCNE1 7FNO M1 ≥8GNB1 AJAP1 SR1R M1 ≥6.5 SIPA1L3 RP11-103B5.2 L50R T1 ≥6.5GNLY AC009961.3 b46aa5c ≥8 SKA2 RNF213 cfd2f24 ≥6.5GOLGA7 ACER3 ZQC5 T1 ≥8 SKAP1 CA10 B2HF M1 ≥8GON4L AL513123.1 2RR2 T1 ≥6.5 SKAP1 CA10 B2HF T1 ≥8GOSR1 BLMH ZS4T T1 ≥6.5 SKI PRKCZ 231B T1 ≥8GPD1L ANO10 TW0Z T1 ≥6.5 SLAIN2 DTHD1 8H0R M1 ≥8GRHL2 FAM91A1 5f7b7fb ≥8 SLAMF1 CLSPN JVRW M1 ≥8GRIA3 GRAP2 8HNA T1 ≥8 SLC13A3 KLF12 FYVH M1 ≥6.5GSDMA ACLY 35XC M1 ≥8 SLC15A5 RREB1 SR1R M1 ≥8GSTM3P1 ARFGEF2 SR1R M1 ≥8 SLC16A12 RNFT2 L50R T1 ≥6.5H2AFY FAM13B 2RR2 T1 ≥8 SLC16A7 METTL2A 2S2Q T1 ≥6.5HACE1 COL6A3 5d6b06c ≥6.5 SLC16A9 ANK3 YNSV T1 ≥8HAS1 AP2A1 75Z1 T1 ≥6.5 SLC17A8 GAS2L3 59cb2ad ≥6.5HAT1 GLS HMXT T1 ≥8 SLC1A2 C11orf49 0XC1 M1 ≥8HDAC4 ARHGAP21 ZS4T T1 ≥6.5 SLC20A2 NRF1 I4ZX T1 ≥8HEATR6 BRIP1 QYXQ M1 ≥8 SLC22A20 ACAD11 372fc45 ≥6.5HECTD1 HEATR5A YNSV T1 ≥8 SLC24A3 AC005220.3 I4ZX T1 ≥6.5HELZ ACSF2 cfd2f24 ≥8 SLC25A17 MKL1 4R5V M1 ≥8HELZ GDPD1 2RR2 T1 ≥8 SLC25A26 ARHGAP21 WHDD M1≥8HERC2 C11orf72 35XC M1 ≥6.5 SLC25A42 CCT6B LRU2 M1 ≥8HERC2 C11orf72 5D6N M1 ≥6.5 SLC26A3 CXCL14 HIHE T1 ≥6.5HERC2 C11orf72 A0GM T1 ≥6.5 SLC26A4 COG5 YNSV T1 ≥8HERC2 C11orf72 E65C M1 ≥6.5 SLC29A3 ADK TX2S T1 ≥8HERC2 C11orf72 JVRW M1 ≥6.5 SLC2A12 PLEKHA7 Y5G9 T1 ≥8HERC2 C11orf72 KEQ4 T1 ≥6.5 SLC2A1-AS1 RLF f1ae704 ≥6.5HERC2 C11orf72 QYCP T1 ≥6.5 SLC30A8 RP11-157E21.1 L50R T1 ≥6.5HERC2 C11orf72 SR1R M1 ≥6.5 SLC30A9 RP11-162G9.1 H9F4 M1 ≥8HERPUD2 AC007349.7 0E5B T1 ≥8 SLC35B4 PRKG1 46DP M1 ≥8HERPUD2 ASTN2 0E5B T1 ≥6.5 SLC35E3 FAM135A F7FD M1 ≥8HERPUD2 AC007349.7 T2VO M1 ≥6.5 SLC35F4 CLTA L50R T1 ≥6.5HERPUD2 ASTN2 T2VO M1 ≥6.5 SLC38A10 RBPMS cb6c764 ≥8HIST4H4 C12orf69 0E5B T1 ≥8 SLC39A11 BCAS3 Q6FY T1 ≥8HLA-F HLA-B e45fa87 ≥8 SLC39A8 DEPDC5 WL6X M1 ≥6.5HMBOX1 CCDC25 L50R T1 ≥6.5 SLC41A3 PARP9 b46aa5c ≥8HMGCS1 GZMA L50R T1 ≥8 SLC45A1 INADL 615a439 ≥8HMGCS1 GZMAP1 L50R T1 ≥6.5 SLC48A1 LIMA1 F7FD M1 ≥8
Continued on next page

140
Table S10 – continued from previous page
Gene1 Gene2 Sample Score Gene1 Gene2 Sample Score
HNF4G BMPR2 WHDD M1≥6.5 SLC4A10 RBMS1 51CU M1 ≥6.5HNRNPC CHD8 cb6c764 ≥6.5 SLC4A10 C19orf77 TX2S T1 ≥6.5HOOK3 C12orf28 TW0Z T1 ≥6.5 SLC6A11 ADAM18 TW0Z T1 ≥8HOOK3 ADAM5 YA4W M1 ≥6.5 SLC6A6 RPRD2 TW0Z T1 ≥8HS6ST3 C8orf34 59cb2ad ≥8 SLC8A1-AS1 QRSL1 b46aa5c ≥6.5hsa-mir-2117 KANSL1 T6Z1 M1 ≥8 SLC9A3R1 MYOG Q6FY T1 ≥8hsa-mir-4763 RP11-313D6.4 HMXT T1 ≥8 SLCO1A2 NECAP1 5PJH M1 ≥6.5hsa-mir-4763 PDCD4 HMXT T1 ≥6.5 SLFN12 RP11-686D22.8 T2VO M1 ≥6.5HTR7 CYP7B1 D988 M1 ≥8 SLIRP CTD-2175M1.4 YNSV T1 ≥6.5HUWE1 CTPS2 QYXQ M1 ≥8 SLMAP DNAH12 59cb2ad ≥6.5HYDIN BAG4 TW0Z T1 ≥8 SMAD4 MAD2L1 0XC1 M1 ≥8HYDIN ATG7 TW0Z T1 ≥6.5 SMARCA2 HAUS6 WHDD M1≥6.5IAPP FOXJ2 5PJH M1 ≥8 SMARCA4 KANK3 Y5G9 T1 ≥8IARS2 ATP1A4 Q6FY T1 ≥8 SMARCA4 PLA2G6 Y5G9 T1 ≥8IBTK CERS5 GN0A M1 ≥6.5 SMARCAD1 PDLIM5 YNSV T1 ≥8IBTK CERS5 DBBB M1 ≥6.5 SMG6 MNT DMG3 M1 ≥8IBTK CERS5 F7FD M1 ≥6.5 SMURF2 GTF3C3 75Z1 T1 ≥6.5IBTK CERS5 TM97 T1 ≥6.5 SNAP25-AS1 ESF1 4c03c03 ≥6.5IFT52 CUEDC1 699525b ≥8 SND1 CASD1 46DP M1 ≥8IFT74 FAM188A F7FD M1 ≥6.5 SNORA31 EIF3H B2HF M1 ≥6.5IGF1R CCDC33 HY35 T1 ≥8 SNORD112 MPI HY35 T1 ≥6.5IGHGP IGHG3 4c03c03 ≥6.5 snoU13 BEND7 cfd2f24 ≥6.5IGHMBP2 CLPB 372fc45 ≥8 SNRNP35 SBNO1 51CU M1 ≥6.5IKZF2 AC079610.1 0P4M M1 ≥6.5 SNTB1 SAMD12 H9F4 M1 ≥8IKZF2 AC079610.1 2S2Q T1 ≥6.5 SNTG1 CBLB 2RR2 T1 ≥8IKZF2 AC079610.1 5PJH M1 ≥6.5 SNX16 FTO WL6X M1 ≥8IKZF2 AC079610.1 MA6O T1 ≥6.5 SNX6 NPAS3 TX2S T1 ≥6.5IKZF3 ACLY 35XC M1 ≥8 SORBS1 PDLIM1 T2VO M1 ≥6.5IL12RB2 CDC73 TW0Z T1 ≥6.5 SORL1 RP11-215D10.1 HMXT T1 ≥8IL1RAPL2 ENOX2 af07947 ≥8 SOS1 RP6-65G23.3 b46aa5c ≥8IL36A EAF2 DMG3 T1 ≥8 SOS1 ARFGEF2 TX2S T1 ≥8INO80 DNAJC17 HMXT T1 ≥8 SOS2 NGDN EDTK T1 ≥8INPP4B C10orf11 L50R T1 ≥6.5 SOX5 ELF1 0E5B T1 ≥6.5INPP5K DPH1 HMXT T1 ≥6.5 SOX5 ELF1 T2VO M1 ≥6.5INSR FCER2 Y5G9 T1 ≥6.5 SPACA7 LAMP1 4c03c03 ≥8INTS2 AC012065.4 b46aa5c ≥6.5 SPAG9 MMP28 b9b21b9 ≥8INTS2 HSD3B2 F7FD M1 ≥6.5 SPAG9 PSMG4 Q6FY T1 ≥8INTS8 ERBB4 DMG3 T1 ≥6.5 SPAG9 NF1 T6Z1 M1 ≥6.5IQGAP1 DAPK2 35XC M1 ≥8 SPAG9 INPP4B b46aa5c ≥6.5IRX1 ALG6 35XC M1 ≥6.5 SPATA13 CTD-2184D3.5 I4ZX T1 ≥6.5ITGB5 GOLM1 4R5V T1 ≥6.5 SPATA20 PPM1D B2HF M1 ≥8ITGB5 GOLM1 6F41 T1 ≥6.5 SPATA24 NDST1 HMXT T1 ≥6.5ITGB5 GOLM1 TDDP T1 ≥6.5 SPATA7 NUFIP2 8H0R M1 ≥6.5ITGB5 GOLM1 WHDD M1≥6.5 SPATS2 FBXO42 51CU M1 ≥8ITGB5 GOLM1 WL6X M1 ≥6.5 SPEF2 SKP2 IUCQ T1 ≥8IVD BUB1B 8H0R M1 ≥8 SPEN DDI2 51CU M1 ≥8JAM2 AP001432.14 TX2S T1 ≥8 SPHKAP MYT1 TX2S T1 ≥8JARID2 GFOD1 Q6FY T1 ≥6.5 SPINK9 KIF20B cb6c764 ≥6.5KANK3 CERS4 Y5G9 T1 ≥8 SPIRE1 C18orf1 HY35 T1 ≥8
Continued on next page

141
Table S10 – continued from previous page
Gene1 Gene2 Sample Score Gene1 Gene2 Sample Score
KANSL1 DHX8 T6Z1 M1 ≥8 SPIRE1 CIDEA HY35 T1 ≥8KAT6B AP3M1 L50R T1 ≥8 SPOP GNA13 2S2Q T1 ≥8KAT6B DLG5 QK84 M1 ≥6.5 SPOP HNF1B T6Z1 M1 ≥6.5KAT7 ARMC2 cfd2f24 ≥8 SPOP MRPL45P2 T6Z1 M1 ≥6.5KAT7 FUT10 8MNH T1 ≥8 SPOP RP11-192H23.4 T6Z1 M1 ≥6.5KAT8 C16orf93 8H0R M1 ≥6.5 SPOP RP11-697E22.2 T6Z1 M1 ≥6.5KCNB2 CSMD3 35XC M1 ≥6.5 SPOP RP11-429O1.1 cfd2f24 ≥6.5KCND2 CDK14 5D6N M1 ≥6.5 SRBD1 ASAP2 FYVH M1 ≥6.5KCNMA1 C10orf11 L50R T1 ≥8 SRC METTL2B 46DP M1 ≥6.5KCNMB4 IRAK3 F7FD M1 ≥8 SRCIN1 DHX40 QYXQ M1 ≥6.5KDM2A CCDC88B JVRW M1 ≥6.5 SRD5A3 AFP EDTK T1 ≥8KDM5A CCDC77 46DP M1 ≥6.5 SRGAP1 GNS 2S2Q T1 ≥8KHDRBS3 GALNTL2 TW0Z T1 ≥6.5 SRGAP1 OTOGL RQX5 M1 ≥8KIAA0146 C18orf1 cfd2f24 ≥8 SRGAP1 AFF3 86DK M1 ≥6.5KIAA0368 C9orf84 f1ae704 ≥8 SRGAP2 PLEKHA6 4WQ1 T1 ≥8KIAA0907 CCT3 59cb2ad ≥8 SRGAP2B RAB25 cfd2f24 ≥8KIAA1217 CCNY 1ED9 T1 ≥8 SRGAP2B NUCKS1 4WQ1 T1 ≥8KIAA1217 FAM188A 4c03c03 ≥6.5 SRGAP2B BX284650.1 HWX7 M1 ≥6.5KIAA1522 CEP192 SR1R M1 ≥8 SRGAP2B LINC00623 QYCP T1 ≥6.5KIAA1671 CATSPERD Y5G9 T1 ≥6.5 SRP68 RP11-149P24.1 35XC M1 ≥8KIAA1731 CTTNBP2 0XC1 M1 ≥8 SRP72 AC005062.2 35XC M1 ≥6.5KIF13B BNIP3L HIHE T1 ≥8 SRPK2 NRG3 e45fa87 ≥8KIF21A C12orf40 46DP M1 ≥8 SRSF1 CHN2 B2HF M1 ≥6.5KIF5B EPC1 HMXT T1 ≥8 SRSF1 CHN2 B2HF T1 ≥6.5KITLG CEP290 b9b21b9 ≥6.5 SSBP2 DHFR 0E5B T1 ≥6.5KITLG HAUS6 L50R T1 ≥6.5 SSBP2 DHFR T2VO M1 ≥6.5KLF3 KDM5B 8H0R M1 ≥8 SSH2 CWC25 WL6X M1 ≥8KLHL11 GRB7 35XC M1 ≥8 ST3GAL5 PLEKHB1 HMXT T1 ≥6.5KLHL5 KCNMA1 QK84 M1 ≥8 ST8SIA6 GLRA2 cfd2f24 ≥6.5KPNA6 FABP3 8MNH T1 ≥8 ST8SIA6 EXD3 2RR2 T1 ≥6.5KRT18P55 CASC3 T6Z1 M1 ≥8 STAM RP11-750B16.1 af07947 ≥6.5KRT19 CNTNAP1 b46aa5c ≥8 STARD3 DAB1 35XC M1 ≥6.5KSR2 FBXO21 TW0Z T1 ≥6.5 STAT3 CDK12 T6Z1 M1 ≥8L3MBTL1 CEP95 cfd2f24 ≥8 STAT4 AC062020.2 EDTK T1 ≥6.5L3MBTL1 CDH22 cfd2f24 ≥6.5 STAT4 AC098872.3 EDTK T1 ≥6.5LACE1 BAZ2B b46aa5c ≥8 STEAP1B RAPGEF5 8MNH T1 ≥8LACE1 FIG4 F11Y T1 ≥8 STIP1 PLCB3 DMG3 M1 ≥8LAMTOR1 ARRB1 HWX7 M1 ≥8 STK17A INADL 231B T1 ≥8LARP4B HACE1 L50R T1 ≥8 STK17A N4BP3 L50R T1 ≥6.5LARP7 AC092661.1 QK84 M1 ≥6.5 STK32C DLG5 e45fa87 ≥8LDLR ELAVL3 Y5G9 T1 ≥8 STK38L ASAH1 b9b21b9 ≥8LEPROT FAF1 TW0Z T1 ≥8 STK39 BRIP1 b46aa5c ≥6.5LEPROT AGBL4 TW0Z T1 ≥6.5 STOX1 ADK L50R T1 ≥6.5LGMN CDC14A QYXQ T1 ≥6.5 STRA13 CSNK1D 8MNH T1 ≥8LGMN CDC14A 7DTJ T1 ≥6.5 STX16 PHACTR3 8H0R M1 ≥8LGMN CDC14A KEQ4 T1 ≥6.5 STX16 RP11-522N14.1 2S2Q T1 ≥6.5LGR4 GALNTL6 L50R T1 ≥8 STX16-NPEPL1 PHACTR3 8H0R M1 ≥8LHFPL2 AC013409.1 46DP M1 ≥6.5 STX16-NPEPL1 RP11-522N14.1 2S2Q T1 ≥6.5LINC00243 CMAHP 5D6N M1 ≥6.5 STX3 RP11-626H12.2 372fc45 ≥6.5
Continued on next page

142
Table S10 – continued from previous page
Gene1 Gene2 Sample Score Gene1 Gene2 Sample Score
LINC00460 CDK12 T6Z1 T1 ≥6.5 STXBP4 MARCH10 QYXQ M1 ≥8LINC00674 C1orf198 Q6FY T1 ≥8 STXBP4 NUP153 QYXQ M1 ≥8LINS CNOT2 JVRW M1 ≥6.5 STXBP4 SDF2 cb6c764 ≥8LINS AP3B1 NL3B T1 ≥6.5 STXBP4 ARHGAP23 cfd2f24 ≥8LIPT1 ECT2 35XC M1 ≥6.5 STXBP4 ACOX1 B2HF M1 ≥8LOXL1 GABPB1 HY35 T1 ≥6.5 STXBP4 ACOX1 B2HF T1 ≥8LPP HSD17B4 D988 M1 ≥8 STXBP4 C7orf31 B2HF T1 ≥8LPP AL133168.3 WL6X M1 ≥8 STXBP4 BRIP1 WHDD M1≥8LRBA CYB5B JVRW M1 ≥6.5 SULF1 RHBG LU50 M1 ≥6.5LRCH2 KIF21A D988 M1 ≥8 SULT6B1 EIF2AK2 59cb2ad ≥8LRIF1 KCND3 YNSV T1 ≥8 SUMF1 CNTN4 699525b ≥8LRP2 FASTKD1 59cb2ad ≥8 SUMO1P1 SLC24A3 I4ZX T1 ≥6.5LRP5 CARNS1 4WQ1 T1 ≥8 SUMO3 HSPA13 L50R T1 ≥8LRP5 CCS HY35 T1 ≥8 SUPT6H CCR7 T6Z1 M1 ≥8LRRC16A KDM1B LU50 M1 ≥8 SUV420H1 RP11-619A14.3 4WQ1 T1 ≥6.5LRRC37A11P CPD 8H0R M1 ≥8 SUZ12P SDK2 JVRW M1 ≥8LRRFIP1 AC112715.2 JVRW M1 ≥6.5 SV2C IQGAP2 E65C M1 ≥6.5LRRFIP2 GALNTL2 TW0Z T1 ≥8 SVIL PARD3 4R5V M1 ≥8LUZP2 ELP4 0E5B T1 ≥6.5 SVIL RP11-166N17.1 4R5V M1 ≥6.5LUZP2 ELP4 T2VO M1 ≥6.5 SVIP RP11-313M3.1 0XC1 M1 ≥6.5LYZ C1orf106 TW0Z T1 ≥6.5 SYBU CDCA2 35XC M1 ≥6.5MACF1 HIVEP3 SR1R M1 ≥6.5 SYCP2L POU2F1 Q6FY T1 ≥6.5MACROD2 KIAA1328 4c03c03 ≥6.5 SYDE2 RAB3B L50R T1 ≥6.5MAD1L1 ERBB2 35XC M1 ≥6.5 SYN2 IGHV1OR21-1 QYXQ M1 ≥6.5MAK CDKAL1 T6Z1 T1 ≥6.5 SYN3 ACOT13 007M M1 ≥6.5MAK16 HMBOX1 L50R T1 ≥6.5 SYN3 ACOT13 5PJH M1 ≥6.5MAOB EFHC2 59cb2ad ≥8 SYNE2 LINC00478 615a439 ≥8MAP2K4 IFT122 SR1R M1 ≥8 SYNGR2 PGS1 cb6c764 ≥8MAP3K1 ENC1 4R5V T1 ≥8 SYT13 SHANK2 0XC1 M1 ≥8MAP3K5 LRRC16A OLIZ T1 ≥8 TACC2 C11orf85 L50R T1 ≥6.5MAPK8 FRMPD2 YNSV T1 ≥6.5 TACC2 GHITM SR1R M1 ≥6.5MAPKAPK2 DENND1B Q6FY T1 ≥8 TACO1 SUMF1 Q6FY T1 ≥6.5MAPKAPK3 HEMK1 HMXT T1 ≥6.5 TACSTD2 FAM73A 35XC M1 ≥6.5MARCH10 ARMC2 b46aa5c ≥6.5 TADA2A MSI2 b9b21b9 ≥8MARCH11 ENPP1 2RR2 T1 ≥6.5 TADA2A SLC25A19 AC72 T1 ≥6.5MBD5 ATL2 4R5V M1 ≥8 TAF13 NUP153 QYXQ M1 ≥8MBD5 DISP1 35XC M1 ≥6.5 TANC2 PDSS2 b46aa5c ≥8MCFD2 HSD17B4 QYXQ M1 ≥6.5 TANC2 RPS6KB1 cb6c764 ≥8MCFD2 HSD17B4 e45fa87 ≥6.5 TANC2 HEATR6 b46aa5c ≥6.5MCFD2 HSD17B4 35XC M1 ≥6.5 TANC2 PRDM11 2RR2 T1 ≥6.5MCFD2 HSD17B4 AC72 T1 ≥6.5 TANC2 SMARCA4 WHDD M1≥6.5MCFD2 HSD17B4 RZBM M1 ≥6.5 TANK PSMD14 HMXT T1 ≥8MCFD2 HSD17B4 SR1R M1 ≥6.5 TAOK1 PCTP 7FNO M1 ≥8MCFD2 HSD17B4 WL6X M1 ≥6.5 TAOK1 C17orf79 8MNH T1 ≥8MCRS1 ANKS1B b9b21b9 ≥8 TAOK1 CDK12 IUCQ T1 ≥8ME1 CD109 DMG3 M1 ≥8 TAOK1 KAT6A HMXT T1 ≥6.5MECOM EGFEM1P SR1R M1 ≥8 TAOK3 RNFT2 TW0Z T1 ≥8MECOM GOLIM4 NF9D M1 ≥6.5 TATDN1 FBXO32 YNSV T1 ≥8MED1 CDK12 8MNH T1 ≥6.5 TATDN2 IDO2 TW0Z T1 ≥8
Continued on next page

143
Table S10 – continued from previous page
Gene1 Gene2 Sample Score Gene1 Gene2 Sample Score
MED18 EYA3 b9b21b9 ≥6.5 TATDN2 RP11-44K6.3 TW0Z T1 ≥6.5MERTK C2orf15 Q6FY T1 ≥8 TBC1D16 GGA3 f1ae704 ≥8Metazoa SRP ATR PF9X T1 ≥6.5 TBC1D16 SPECC1 QYXQ M1 ≥6.5METTL15 CREB3L1 0XC1 M1 ≥6.5 TBC1D16 L3MBTL1 cfd2f24 ≥6.5METTL2B DENND2A 46DP M1 ≥8 TBC1D16 RPL19 cfd2f24 ≥6.5MFHAS1 GPT2 WL6X M1 ≥8 TBC1D23 C3orf26 DMG3 M1 ≥8MFHAS1 CHD9 WL6X M1 ≥6.5 TBC1D3G NTF4 WL6X M1 ≥6.5MFSD6 MAPK10 TX2S T1 ≥8 TBC1D3P2 AC008687.1 WL6X M1 ≥6.5MGAT3 KAT6B L50R T1 ≥8 TBC1D9 RP11-203B7.2 DR8V T1 ≥8MGAT4C CCT2 L50R T1 ≥8 TBC1D9 RP11-362F19.1 4R5V M1 ≥6.5MICAL1 ITGA11 372fc45 ≥6.5 TBCA BIRC6 YNSV T1 ≥8MICAL3 CTA-85E5.10 L50R T1 ≥8 TBCD MYH10 D988 M1 ≥6.5MIEN1 MAD1L1 35XC M1 ≥6.5 TBKBP1 CLPB RZBM M1 ≥6.5MITD1 ECT2 35XC M1 ≥8 TC2N CATSPERB WHDD M1≥8MITF FOXP1 8H0R M1 ≥6.5 TCF20 MYH9 EDTK T1 ≥8MLEC ACSF3 8HNA T1 ≥8 TCF7L1 AC009961.3 b46aa5c ≥8MLL3 AC008132.1 TW0Z T1 ≥8 TCF7L1 PLA2R1 b46aa5c ≥6.5MLL5 AKAP9 5PJH M1 ≥8 TCIRG1 ALDH3B2 HY35 T1 ≥6.5MLLT1 CATSPERD Y5G9 T1 ≥8 TCP11 NUDT3 59cb2ad ≥8MMP26 AASDHPPT F11Y T1 ≥6.5 TCTN2 RILPL1 86DK M1 ≥6.5MMP28 HSD17B12 b9b21b9 ≥6.5 TDRD5 PTPRC 4WQ1 T1 ≥8MOGAT1 CUL3 b9b21b9 ≥8 TDRD5 CDC42BPA Q6FY T1 ≥8MOXD1 HBS1L 231B T1 ≥8 TDRKH GLDC OLIZ T1 ≥6.5MPDZ LINC00583 51CU M1 ≥6.5 TEAD4 CACNA1C HMXT T1 ≥8MPP5 GPHN YNSV T1 ≥8 TEAD4 ITFG2 YNSV T1 ≥8MRPL1 C10orf57 QK84 M1 ≥8 TEC MIER3 WL6X M1 ≥6.5MRPL11 CPT1A NL3B T1 ≥8 TEKT3 ACACA cfd2f24 ≥8MRPL21 C11orf74 0XC1 M1 ≥6.5 TEN1 RIMS2 35XC M1 ≥8MRPL45 FBXO28 Q6FY T1 ≥8 TESC INPP4B L50R T1 ≥6.5MRPL48 MOCOS 4R5V M1 ≥8 TEX14 DCAKD cfd2f24 ≥6.5MRS2 BTN3A3 T6Z1 T1 ≥6.5 TEX2 RAD51C cfd2f24 ≥6.5MS4A14 KDM2A JVRW M1 ≥8 TEX28 BCAP31 PF9X T1 ≥6.5MSI2 ARHGAP23 cfd2f24 ≥8 TFG GPR128 DBBB M1 ≥8MSI2 BCAS3 TW0Z T1 ≥8 TFG GPR128 NF9D M1 ≥8MSRA CNOT1 WL6X M1 ≥6.5 TFG GPR128 Y5G9 T1 ≥8MTA3 AC079807.4 TX2S T1 ≥8 TFRC SLC51A dd3c42e ≥8MTCH2 CRY2 PF9X T1 ≥8 TGFBRAP1 ANAPC1 Q6FY T1 ≥6.5MTDH LAPTM4B T2VO M1 ≥8 TGS1 IPO9-AS1 TW0Z T1 ≥6.5MTF1 MEAF6 B2HF M1 ≥8 TGS1 RNA5SP267 TW0Z T1 ≥6.5MTMR3 KAT6B L50R T1 ≥8 THADA MYBL2 TX2S T1 ≥6.5MTMR3 LIMK2 L50R T1 ≥6.5 THBS1 RP11-624L4.1 IUCQ T1 ≥6.5MTMR4 CDR2L B2HF M1 ≥6.5 THBS1 RP11-624L4.1 TX2S T1 ≥6.5MTMR4 CDR2L B2HF T1 ≥6.5 THBS1 RP11-624L4.1 YA4W M1 ≥6.5MTOR EXOSC10 B2HF T1 ≥8 THRA PCGF2 WL6X M1 ≥6.5MTUS1 FAM86A dd3c42e ≥8 THRAP3 SKIL XV6H M1 ≥6.5MUC16 BRD4 WHDD M1≥6.5 THSD4 LRRC49 F7FD M1 ≥8MUC16 CEP112 WHDD M1≥6.5 THSD4 FAH HY35 T1 ≥8MX1 ABCG1 TX2S T1 ≥8 THSD4 CYP27C1 DBBB M1 ≥6.5MYBPC1 ARL1 HMXT T1 ≥6.5 THSD4 IL16 HY35 T1 ≥6.5
Continued on next page
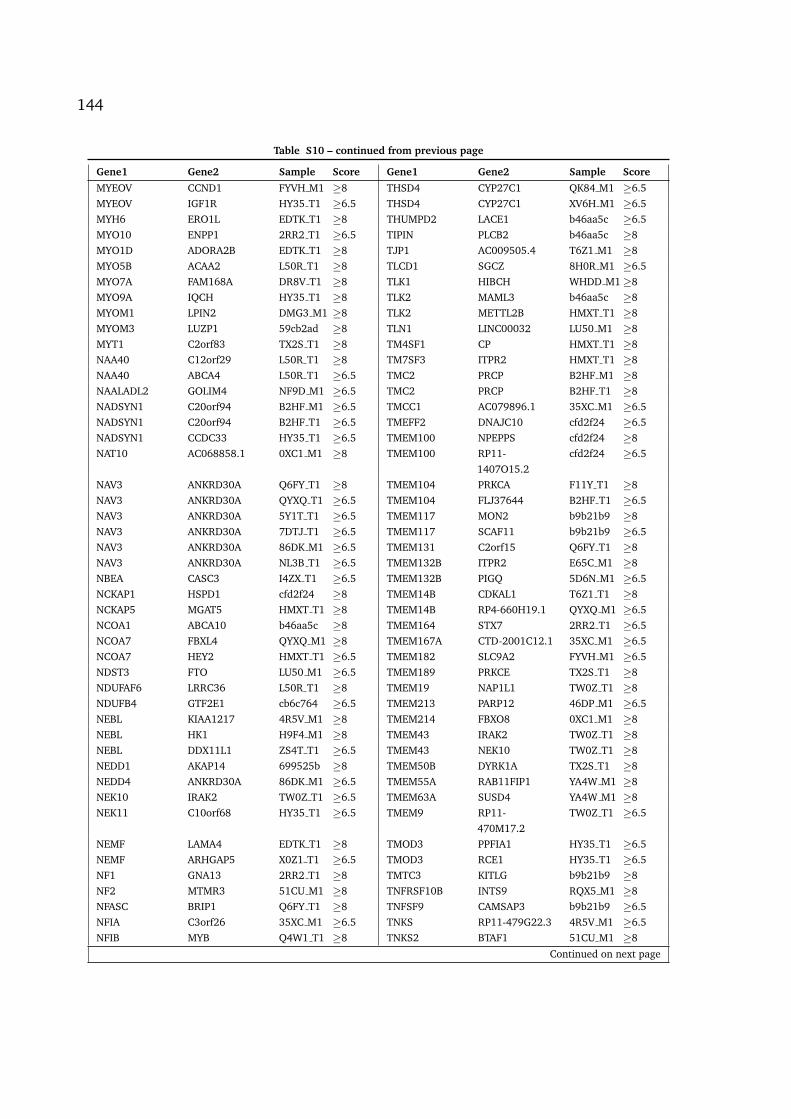
144
Table S10 – continued from previous page
Gene1 Gene2 Sample Score Gene1 Gene2 Sample Score
MYEOV CCND1 FYVH M1 ≥8 THSD4 CYP27C1 QK84 M1 ≥6.5MYEOV IGF1R HY35 T1 ≥6.5 THSD4 CYP27C1 XV6H M1 ≥6.5MYH6 ERO1L EDTK T1 ≥8 THUMPD2 LACE1 b46aa5c ≥6.5MYO10 ENPP1 2RR2 T1 ≥6.5 TIPIN PLCB2 b46aa5c ≥8MYO1D ADORA2B EDTK T1 ≥8 TJP1 AC009505.4 T6Z1 M1 ≥8MYO5B ACAA2 L50R T1 ≥8 TLCD1 SGCZ 8H0R M1 ≥6.5MYO7A FAM168A DR8V T1 ≥8 TLK1 HIBCH WHDD M1≥8MYO9A IQCH HY35 T1 ≥8 TLK2 MAML3 b46aa5c ≥8MYOM1 LPIN2 DMG3 M1 ≥8 TLK2 METTL2B HMXT T1 ≥8MYOM3 LUZP1 59cb2ad ≥8 TLN1 LINC00032 LU50 M1 ≥8MYT1 C2orf83 TX2S T1 ≥8 TM4SF1 CP HMXT T1 ≥8NAA40 C12orf29 L50R T1 ≥8 TM7SF3 ITPR2 HMXT T1 ≥8NAA40 ABCA4 L50R T1 ≥6.5 TMC2 PRCP B2HF M1 ≥8NAALADL2 GOLIM4 NF9D M1 ≥6.5 TMC2 PRCP B2HF T1 ≥8NADSYN1 C20orf94 B2HF M1 ≥6.5 TMCC1 AC079896.1 35XC M1 ≥6.5NADSYN1 C20orf94 B2HF T1 ≥6.5 TMEFF2 DNAJC10 cfd2f24 ≥6.5NADSYN1 CCDC33 HY35 T1 ≥6.5 TMEM100 NPEPPS cfd2f24 ≥8NAT10 AC068858.1 0XC1 M1 ≥8 TMEM100 RP11-
1407O15.2cfd2f24 ≥6.5
NAV3 ANKRD30A Q6FY T1 ≥8 TMEM104 PRKCA F11Y T1 ≥8NAV3 ANKRD30A QYXQ T1 ≥6.5 TMEM104 FLJ37644 B2HF T1 ≥6.5NAV3 ANKRD30A 5Y1T T1 ≥6.5 TMEM117 MON2 b9b21b9 ≥8NAV3 ANKRD30A 7DTJ T1 ≥6.5 TMEM117 SCAF11 b9b21b9 ≥6.5NAV3 ANKRD30A 86DK M1 ≥6.5 TMEM131 C2orf15 Q6FY T1 ≥8NAV3 ANKRD30A NL3B T1 ≥6.5 TMEM132B ITPR2 E65C M1 ≥8NBEA CASC3 I4ZX T1 ≥6.5 TMEM132B PIGQ 5D6N M1 ≥6.5NCKAP1 HSPD1 cfd2f24 ≥8 TMEM14B CDKAL1 T6Z1 T1 ≥8NCKAP5 MGAT5 HMXT T1 ≥8 TMEM14B RP4-660H19.1 QYXQ M1 ≥6.5NCOA1 ABCA10 b46aa5c ≥8 TMEM164 STX7 2RR2 T1 ≥6.5NCOA7 FBXL4 QYXQ M1 ≥8 TMEM167A CTD-2001C12.1 35XC M1 ≥6.5NCOA7 HEY2 HMXT T1 ≥6.5 TMEM182 SLC9A2 FYVH M1 ≥6.5NDST3 FTO LU50 M1 ≥6.5 TMEM189 PRKCE TX2S T1 ≥8NDUFAF6 LRRC36 L50R T1 ≥8 TMEM19 NAP1L1 TW0Z T1 ≥8NDUFB4 GTF2E1 cb6c764 ≥6.5 TMEM213 PARP12 46DP M1 ≥6.5NEBL KIAA1217 4R5V M1 ≥8 TMEM214 FBXO8 0XC1 M1 ≥8NEBL HK1 H9F4 M1 ≥8 TMEM43 IRAK2 TW0Z T1 ≥8NEBL DDX11L1 ZS4T T1 ≥6.5 TMEM43 NEK10 TW0Z T1 ≥8NEDD1 AKAP14 699525b ≥8 TMEM50B DYRK1A TX2S T1 ≥8NEDD4 ANKRD30A 86DK M1 ≥6.5 TMEM55A RAB11FIP1 YA4W M1 ≥8NEK10 IRAK2 TW0Z T1 ≥6.5 TMEM63A SUSD4 YA4W M1 ≥8NEK11 C10orf68 HY35 T1 ≥6.5 TMEM9 RP11-
470M17.2TW0Z T1 ≥6.5
NEMF LAMA4 EDTK T1 ≥8 TMOD3 PPFIA1 HY35 T1 ≥6.5NEMF ARHGAP5 X0Z1 T1 ≥6.5 TMOD3 RCE1 HY35 T1 ≥6.5NF1 GNA13 2RR2 T1 ≥8 TMTC3 KITLG b9b21b9 ≥8NF2 MTMR3 51CU M1 ≥8 TNFRSF10B INTS9 RQX5 M1 ≥8NFASC BRIP1 Q6FY T1 ≥8 TNFSF9 CAMSAP3 b9b21b9 ≥6.5NFIA C3orf26 35XC M1 ≥6.5 TNKS RP11-479G22.3 4R5V M1 ≥6.5NFIB MYB Q4W1 T1 ≥8 TNKS2 BTAF1 51CU M1 ≥8
Continued on next page

145
Table S10 – continued from previous page
Gene1 Gene2 Sample Score Gene1 Gene2 Sample Score
NFIX BRD4 Y5G9 T1 ≥8 TNPO2 MACROD2 4c03c03 ≥8NFYA FOXP4 PF9X T1 ≥8 TNRC6C RNF157 LU50 M1 ≥6.5NHEJ1 DNPEP 51CU M1 ≥8 TNS3 NAT10 0XC1 M1 ≥8NIPBL AC015820.1 5D6N M1 ≥6.5 TNS3 S100A10 bed845b ≥6.5NIT1 DUSP10 Q6FY T1 ≥6.5 TNS4 KRT222 4R5V T1 ≥8NLK KRT18P55 T6Z1 M1 ≥8 TOM1L1 C6orf183 cfd2f24 ≥6.5NLK LRRC37A3 2RR2 T1 ≥8 TOM1L2 CD3D AC72 T1 ≥8NLK ADAP2 3fcb2f6 ≥6.5 TOM1L2 MPZL2 AC72 T1 ≥8NOD1 DDX56 B2HF T1 ≥8 TOM1L2 B9D1 AC72 T1 ≥6.5NOL11 ATP13A3 AEK9 T1 ≥6.5 TOP2A CASC3 QYXQ M1 ≥8NOL11 ARHGAP24 TW0Z T1 ≥6.5 TOP2A AC126365.1 QYXQ M1 ≥6.5NOP2 NFIA 231B T1 ≥8 TOP2A CACNB1 QYXQ M1 ≥6.5NOTCH2NL DNM3 LRU2 M1 ≥6.5 TOPBP1 RP11-284G10.1 f1ae704 ≥8NOTCH3 CEP112 WHDD M1≥6.5 TOPORS-AS1 KRT13 DBBB M1 ≥8NPAS1 DHX34 4c03c03 ≥8 TOR1AIP2 SOAT1 cfd2f24 ≥8NPEPPS NF1 NL3B T1 ≥8 TP53BP2 PLA2G4A TX2S T1 ≥8NPIPL3 NDE1 ZS4T T1 ≥6.5 TP53I11 CAPRIN1 0XC1 M1 ≥6.5NPLOC4 ALYREF HMXT T1 ≥8 TP53I11 LRRC4C 0XC1 M1 ≥6.5NPLOC4 HLF B2HF M1 ≥6.5 TPD52 FABP4 X0Z1 T1 ≥8NPLOC4 HLF B2HF T1 ≥6.5 TPD52 CSMD3 TW0Z T1 ≥6.5NPLOC4 HGS T2VO M1 ≥6.5 TPD52L1 NCOA7 HMXT T1 ≥8NPSR1-AS1 MSI2 B2HF M1 ≥8 TPPP BRD9 QYXQ T1 ≥6.5NR2F6 BABAM1 4R5V M1 ≥6.5 TPST1 EYA2 ZS4T T1 ≥6.5NR6A1 GSN PF9X T1 ≥8 TPTE AC008132.1 TW0Z T1 ≥8NRCAM EMCN 5PJH M1 ≥8 TPTE MLL3 007M M1 ≥6.5NRG1 ATP8A1 L1PK T1 ≥8 TPTE2P5 RP11-64P12.8 4R5V T1 ≥8NRG1 MAK16 L50R T1 ≥6.5 TPTE2P5 TPTE2 6F41 T1 ≥8NRG3 MLL5 e45fa87 ≥6.5 TPTE2P5 TPTE2 Q6FY T1 ≥8NSMCE2 COL22A1 X0Z1 T1 ≥8 TPTE2P5 RP11-64P12.8 ZCYX M1 ≥8NSMCE2 CIR1P2 LRU2 M1 ≥6.5 TPTE2P5 TPTE2 ZCYX M1 ≥8NSMCE2 Metazoa SRP LRU2 M1 ≥6.5 TRAF3IP2-AS1 PTPRT cfd2f24 ≥8NSMCE4A ATE1 L50R T1 ≥8 TRAP1 BCAR4 b46aa5c ≥6.5NSRP1 EFCAB5 8H0R M1 ≥8 TRAPPC10 ERG X0Z1 T1 ≥8NT5C1B ATL2 4R5V M1 ≥6.5 TRAPPC10 FAM3B X0Z1 T1 ≥8NT5C1B MBD5 4R5V M1 ≥6.5 TRAPPC10 RP11-15M15.1 X0Z1 T1 ≥8NT5C3 COA1 L50R T1 ≥8 TRAPPC10 TFF3 X0Z1 T1 ≥8NTPCR FLVCR1 cfd2f24 ≥8 TRAPPC8 RP11-746B8.1 8H0R M1 ≥6.5NUDT12 KCNN2 007M M1 ≥6.5 TRAPPC9 AL137003.1 HMXT T1 ≥6.5NUFIP2 CDK12 8H0R M1 ≥8 TRDMT1 CDC123 cfd2f24 ≥6.5NUGGC BMP1 699525b ≥6.5 TRHDE ACP6 TW0Z T1 ≥8NUP133 CDC42BPA Q6FY T1 ≥8 TRIM2 FBXW7 HMXT T1 ≥8NUP153 JARID2 WHDD M1≥8 TRIM36 CCDC112 HMXT T1 ≥8NUP205 AGK TX2S T1 ≥8 TRIM37 LINC00511 cfd2f24 ≥8NUP210L GATAD2B HMXT T1 ≥8 TRIM37 RPS6KB1 cfd2f24 ≥8NUP98 INPP4B L50R T1 ≥8 TRIM37 SNHG16 cfd2f24 ≥8NXPH1 KIAA1217 7FNO M1 ≥6.5 TRIM37 FLJ37644 2RR2 T1 ≥8NXPH3 CACNA1G T6Z1 M1 ≥6.5 TRIM37 HOXB-AS3 JVRW M1 ≥8NYAP2 CUL3 QK84 M1 ≥8 TRIM37 PPM1E Q6FY T1 ≥8NYAP2 FN1 TX2S T1 ≥8 TRIM37 TBC1D7 Q6FY T1 ≥8
Continued on next page

146
Table S10 – continued from previous page
Gene1 Gene2 Sample Score Gene1 Gene2 Sample Score
OACYLP C12orf49 L50R T1 ≥8 TRIM37 MARCH10 b9b21b9 ≥6.5ODZ2 CNOT6 D988 M1 ≥8 TRIM37 RARA cfd2f24 ≥6.5OFCC1 ATG5 QYXQ M1 ≥8 TRIM44 LDLRAD3 0E5B T1 ≥8OIT3 FAM149B1 YNSV T1 ≥8 TRIM60P19 MLL3 cfd2f24 ≥6.5OMG APPBP2 B2HF M1 ≥8 TRIM8 TACC2 SR1R M1 ≥6.5OR13Z1P HYDIN TW0Z T1 ≥8 TRIO ARHGEF3 E65C M1 ≥6.5OR2Z1 GIPC1 E65C M1 ≥6.5 TRIP13 RP1-158P9.1 35XC M1 ≥6.5OR5BB1P NUMA1 8MNH T1 ≥6.5 TRMT2A OR2J3 0E5B T1 ≥6.5ORAOV1 CIT L50R T1 ≥8 TRMT2A OR2J3 T2VO M1 ≥6.5ORAOV1 DDB1 L50R T1 ≥8 TRNT1 CNTN4 YNSV T1 ≥8ORC4 GPD2 35XC M1 ≥6.5 TRPM7 LEO1 HY35 T1 ≥8ORMDL3 ACACA 35XC M1 ≥8 TRPM7 MAPK6 HY35 T1 ≥6.5OSBPL6 CIR1 TX2S T1 ≥8 TRPS1 SLC36A2 3b8237c ≥8OSBPL6 AC073283.4 TX2S T1 ≥6.5 TRPS1 RP11-536K17.1 T2VO M1 ≥6.5OSR2 KB-1047C11.2 TW0Z T1 ≥6.5 TSEN2 RP11-30J20.1 TW0Z T1 ≥6.5OSTM1 DDX42 b46aa5c ≥8 TSEN54 GRB2 7FNO M1 ≥8OTUD4 DOCK7 4R5V M1 ≥8 TSNAX PTPRC Q6FY T1 ≥6.5OTUD6B NECAB1 YA4W M1 ≥8 TSPAN14 DUPD1 46DP M1 ≥8OXCT1 GCSHP1 IUCQ T1 ≥6.5 TSPAN14 C22orf45 HWX7 M1 ≥6.5OXNAD1 GHRL YA4W M1 ≥8 TSPAN15 RP11-359E19.2 46DP M1 ≥6.5OXR1 FAM49B TC6T T1 ≥8 TSPAN5 FAM190A WL6X M1 ≥8OXR1 LARP1B ZS4T T1 ≥8 TSPAN8 RP11-495P10.2 TW0Z T1 ≥6.5PACSIN2 MKL1 WL6X M1 ≥6.5 TSR3 AC093515.1 TX2S T1 ≥6.5PAFAH2 ARID1A 0E5B T1 ≥6.5 TTC16 SLC12A7 4R5V M1 ≥8PAK1 MTL5 ZQC5 T1 ≥8 TTC17 SS18 4R5V M1 ≥8PAK1 C11orf49 HY35 T1 ≥6.5 TTC28 THOC5 8MNH T1 ≥8PAK1 CYP4Z1 TX2S T1 ≥6.5 TTC28 PIWIL3 L50R T1 ≥8PAK1 CPT1A ZQC5 T1 ≥6.5 TTC28 CERS4 Y5G9 T1 ≥8PAK7 JAG1 HMXT T1 ≥6.5 TTC28 CTA-85E5.10 L50R T1 ≥6.5PAMR1 HIPK3 dd3c42e ≥6.5 TTC28 MYO18B Y5G9 T1 ≥6.5PARK2 CNKSR3 T6Z1 M1 ≥8 TTC3 GART TX2S T1 ≥8PARM1 ALB 699525b ≥8 TTC3 HLCS TX2S T1 ≥8PARM1 LINC00504 699525b ≥6.5 TTC39B OLAH L50R T1 ≥6.5PARP12 ATP6V0A4 46DP M1 ≥8 TTC39C CCDC160 PF9X T1 ≥6.5PBX1 CDC73 SR1R M1 ≥8 TTC6 MIPOL1 DMG3 M1 ≥8PBX1 F11R SR1R M1 ≥8 TTC6 MIPOL1 007M M1 ≥8PBX3 MAPKAP1 WHDD M1≥8 TTC6 MIPOL1 HY35 T1 ≥8PBX3 NEK6 WHDD M1≥6.5 TTC6 MIPOL1 WL6X M1 ≥8PCBD1 KCNMA1 L50R T1 ≥8 TTC6 BMP4 T6Z1 M1 ≥6.5PCDH20 AL109763.2 F7FD M1 ≥6.5 TTI2 HMBOX1 L50R T1 ≥8PCGF2 CLTC cfd2f24 ≥8 TTI2 ADAM32 8MNH T1 ≥6.5PCNT NBEA TX2S T1 ≥8 TTLL7 CDCA5 L50R T1 ≥8PCNXL4 FUT8 231B T1 ≥8 TTTY14 MACROD1 L50R T1 ≥6.5PCP4 DOPEY2 X0Z1 T1 ≥8 TTYH2 BCAS3 Q6FY T1 ≥8PCTP HEATR6 F7FD M1 ≥8 TUBE1 LAMA4 8MNH T1 ≥8PCTP CCR7 WL6X M1 ≥6.5 TUBGCP3 IRS2 WHDD M1≥8PDCD4 CITF22-92A6.1 HMXT T1 ≥6.5 TULP3 CACNA1C HMXT T1 ≥8PDE1C MYT1 T2VO M1 ≥8 TULP4 EGFLAM 2RR2 T1 ≥8PDE3B CLTC 2RR2 T1 ≥8 TUSC3 RAPGEFL1 8H0R M1 ≥6.5
Continued on next page

147
Table S10 – continued from previous page
Gene1 Gene2 Sample Score Gene1 Gene2 Sample Score
PDE4B GNG12 35XC M1 ≥6.5 TWIST2 MSL3P1 T2VO M1 ≥6.5PDE4DIP KDM5B T6Z1 T1 ≥6.5 TWSG1 CEP192 cfd2f24 ≥6.5PDE4DIP NOTCH2 8H0R M1 ≥6.5 TXNDC9 TMEM87B Q6FY T1 ≥8PDE4DIP NDUFS4 IUCQ T1 ≥6.5 TYW1 RABGEF1 59cb2ad ≥8PDE7A ATPBD4 F7FD M1 ≥6.5 U1 ENY2 35XC M1 ≥6.5PDE7A NDST1 HMXT T1 ≥6.5 U2AF2 CDC42EP5 75Z1 T1 ≥8PDIA2 IFT140 AEK9 T1 ≥8 U6 RLF f1ae704 ≥8PDIA4 DTX2P1-
UPK3BP1-PMS2P11
ZCYX M1 ≥6.5 U6 TMCC1 35XC M1 ≥8
PDIA5 ITGB5 SR1R M1 ≥8 U6 RP11-127H5.1 35XC M1 ≥6.5PDLIM7 LMAN2 ZS4T T1 ≥8 U6 PARD3B EDTK T1 ≥6.5PDS5B CDK12 I4ZX T1 ≥8 U6 C10orf11 QK84 M1 ≥6.5PDS5B NBEA TX2S T1 ≥8 U6 NARS2 ZQC5 T1 ≥6.5PDSS2 AHI1 T6Z1 T1 ≥8 U7 SVIL 4R5V M1 ≥6.5PDSS2 ARMC2 cfd2f24 ≥8 UACA RFWD3 HY35 T1 ≥8PDSS2 ERO1L EDTK T1 ≥8 UBA1 SYAP1 QYXQ M1 ≥6.5PDSS2 C6orf203 TW0Z T1 ≥6.5 UBAP1 DRAM1 QK84 M1 ≥6.5PDZD2 CERS6 RQX5 M1 ≥6.5 UBAP2 ELOVL2 DMG3 M1 ≥8PDZD8 C14orf180 LU50 M1 ≥8 UBAP2 B4GALT1 HMXT T1 ≥6.5PDZRN3 FOXP1 8H0R M1 ≥8 UBAP2L DENND4B T6Z1 M1 ≥6.5PEX7 GRIK2 QYXQ M1 ≥8 UBC UBB cb6c764 ≥8PEX7 EYA4 T6Z1 T1 ≥6.5 UBC UBB e64126c ≥8PFDN2 F11R DMG3 M1 ≥6.5 UBE2G1 CTDSPL2 4R5V M1 ≥8PFKFB2 CEP192 HMXT T1 ≥8 UBE2M TRIM28 YNSV T1 ≥6.5PFKFB3 AKR1C1 HMXT T1 ≥8 UBL3 TNFRSF19 WHDD M1≥8PFKL PCNT TX2S T1 ≥8 UBL3 RP1-225E12.2 T6Z1 T1 ≥6.5PGAM1P2 PAK1 WHDD M1≥6.5 UBR4 CAMK2D E65C M1 ≥6.5PGS1 C17orf99 cb6c764 ≥8 UBR5 AZIN1 59cb2ad ≥8PHF20 AHCY dd3c42e ≥8 UBXN2A TARBP1 L1PK T1 ≥8PHF20 ANO1 dd3c42e ≥6.5 UBXN2A TARBP1 4R5V M1 ≥6.5PHF20 FGF3 dd3c42e ≥6.5 UBXN2A TARBP1 ZCYX M1 ≥6.5PHF20L1 CA2 X0Z1 T1 ≥8 UCHL5 GADD45A TW0Z T1 ≥6.5PHF3 EYS EDTK T1 ≥6.5 UCP2 MYEOV DR8V T1 ≥6.5PHKB LONP2 YA4W M1 ≥8 UCP2 P2RY6 DR8V T1 ≥6.5PHTF1 PHGDH 4R5V T1 ≥6.5 UFD1L CABIN1 Z2AO T1 ≥6.5PICALM MAPK10 Y5G9 T1 ≥8 UFL1 AIM1 TW0Z T1 ≥8PIGR C18orf1 HMXT T1 ≥6.5 UGDH RP11-63A11.1 cfd2f24 ≥8PIR CCDC3 cfd2f24 ≥6.5 UGGT2 GREB1 0XC1 M1 ≥8PITHD1 CUL4A IUCQ T1 ≥8 UGT3A2 ADAMTS12 35XC M1 ≥8PITPNC1 CA10 b9b21b9 ≥8 UHRF1BP1L SCYL2 OLIZ T1 ≥6.5PITPNC1 NOL11 8H0R M1 ≥8 ULK4 RP11-187E13.2 5d6b06c ≥6.5PITPNC1 B3GNTL1 2RR2 T1 ≥6.5 ULK4 TRAK1 TW0Z T1 ≥6.5PITPNC1 PIK3C2B Q6FY T1 ≥6.5 UNC5C BTNL9 0E5B T1 ≥6.5PKHD1L1 KCNB2 35XC M1 ≥6.5 UNC5C SPATA5 QK84 M1 ≥6.5PLA2G10 NDE1 ZS4T T1 ≥8 UNC5D SUPT6H cb6c764 ≥8PLCB1 C20orf94 3fcb2f6 ≥6.5 UNC5D PLEKHA2 cb6c764 ≥6.5PLCB4 C20orf94 3fcb2f6 ≥6.5 UPF1 TJP1 TC6T T1 ≥6.5PLD1 JHDM1D TX2S T1 ≥8 UPF2 AIM1 L50R T1 ≥6.5
Continued on next page

148
Table S10 – continued from previous page
Gene1 Gene2 Sample Score Gene1 Gene2 Sample Score
PLEKHA2 BAG4 FYVH M1 ≥6.5 UQCRC1 KIF13B RQX5 M1 ≥8PLEKHA6 CD34 4WQ1 T1 ≥8 UQCRC1 RBM6 RQX5 M1 ≥8PLEKHM2 ETV6 HMXT T1 ≥8 UQCRC1 RP11-521I2.3 RQX5 M1 ≥6.5PMEPA1 APMAP SR1R M1 ≥6.5 URB1 RP11-347D21.1 X0Z1 T1 ≥8PNISR COL10A1 QYXQ M1 ≥6.5 USB1 SGCZ WL6X M1 ≥6.5PNPO MLLT6 T6Z1 M1 ≥8 USH2A TNRC18 FYVH M1 ≥8POLA1 PHEX 0XC1 M1 ≥8 USO1 RASSF6 DMG3 M1 ≥8POLB EPB41L5 I4ZX T1 ≥8 USP1 CC2D1B E65C M1 ≥8POP4 ANKRD27 e64126c ≥8 USP15 PPM1H T6Z1 T1 ≥8POU6F1 CBX5 af07947 ≥8 USP24 GLIS1 TW0Z T1 ≥8PPA1 LRRC3B TW0Z T1 ≥8 USP25 AP000282.2 0E5B T1 ≥6.5PPA1 AZI2 TW0Z T1 ≥6.5 USP25 AP000290.7 0E5B T1 ≥6.5PPARGC1A HTT SR1R M1 ≥6.5 USP32 BAIAP2 cfd2f24 ≥8PPFIA1 ADAM9 7DTJ T1 ≥8 USP32 CEP95 cfd2f24 ≥8PPFIA1 NDUFC2 DR8V T1 ≥8 USP32 PRKCA cfd2f24 ≥8PPFIA1 FAM102B L50R T1 ≥6.5 USP32 RARA cfd2f24 ≥8PPFIBP1 FAR2 ZCYX M1 ≥8 USP32 BCAS3 B2HF M1 ≥8PPIL4 KATNA1 0E5B T1 ≥8 USP32 BCAS3 B2HF T1 ≥8PPM1D AP2B1 QYXQ M1 ≥8 USP32 GPRC5C Q6FY T1 ≥8PPM1D AMZ2 B2HF T1 ≥8 USP32 RPS6KB1 Q6FY T1 ≥8PPM1D EPCAM b46aa5c ≥6.5 USP32 HDAC9 B2HF M1 ≥6.5PPM1D BRIP1 Q6FY T1 ≥6.5 USP32 ATXN1 Q6FY T1 ≥6.5PPM1D DDX42 Q6FY T1 ≥6.5 USP32 DCLK2 Q6FY T1 ≥6.5PPM1E ARHGEF1 WL6X M1 ≥8 USP36 TBCD cfd2f24 ≥8PPP1R12B KCNMB4 TW0Z T1 ≥8 USP43 IFT122 SR1R M1 ≥8PPP1R12B MTMR11 TW0Z T1 ≥8 USP6 MIPEP JVRW M1 ≥8PPP1R21 AC078994.2 TX2S T1 ≥8 USP6 RPAIN LU50 M1 ≥8PPP1R3B AC093901.1 4R5V M1 ≥6.5 USP6NL FAM188A 4c03c03 ≥8PPP1R9B C17orf108 699525b ≥8 USP9X ANXA13 615a439 ≥8PPP1R9B MTMR4 699525b ≥8 UTP11L AP000525.8 f1ae704 ≥8PPP2R5E C14orf37 LU50 M1 ≥6.5 UTP18 PIP4K2B QYXQ M1 ≥8PPP3CA CISD2 B91A M1 ≥8 UTP6 TAOK1 8MNH T1 ≥8PPP6R2 MAPK12 231B T1 ≥6.5 UTRN PDE7B 007M M1 ≥8PPP6R2 PLXNB2 HWX7 M1 ≥6.5 UVRAG ODZ4 e45fa87 ≥8PPP6R3 HSPH1 SR1R M1 ≥8 UVRAG GRIK2 8MNH T1 ≥8PPP6R3 C11orf80 WHDD M1≥8 UVRAG LRP5 4WQ1 T1 ≥6.5PPP6R3 PDSS2 WHDD M1≥8 UVRAG RP11-589C21.1 ZQC5 T1 ≥6.5PPT1 OR4N2 f1ae704 ≥6.5 VAC14 COG4 YNSV T1 ≥8PRCD LASP1 DMG3 M1 ≥6.5 VAMP1 ANKS3 HMXT T1 ≥6.5PRDM1 LINC00085 T6Z1 T1 ≥8 VANGL1 PDE4DIP 51CU M1 ≥8PRDM1 ORAOV1 L50R T1 ≥8 VAPB ANKRD60 2S2Q T1 ≥8PRDM1 IL12RB2 QYXQ M1 ≥6.5 VAPB CTCFL 0XC1 M1 ≥6.5PREP 7SK cfd2f24 ≥6.5 VCL RP11-745K9.1 46DP M1 ≥8PREX1 CSE1L HY35 T1 ≥8 VIPR1 SCN5A F7FD M1 ≥8PREX1 KCNQ2 cb6c764 ≥6.5 VMP1 RPS6KB1 B2HF T1 ≥8PREX2 ACOX1 35XC M1 ≥8 VMP1 RP11-
1018N14.5cfd2f24 ≥6.5
PRIM2 PREP b46aa5c ≥6.5 VMP1 TRIM37 cfd2f24 ≥6.5PRINS NEBL 4R5V M1 ≥6.5 VMP1 HDAC9 B2HF T1 ≥6.5
Continued on next page
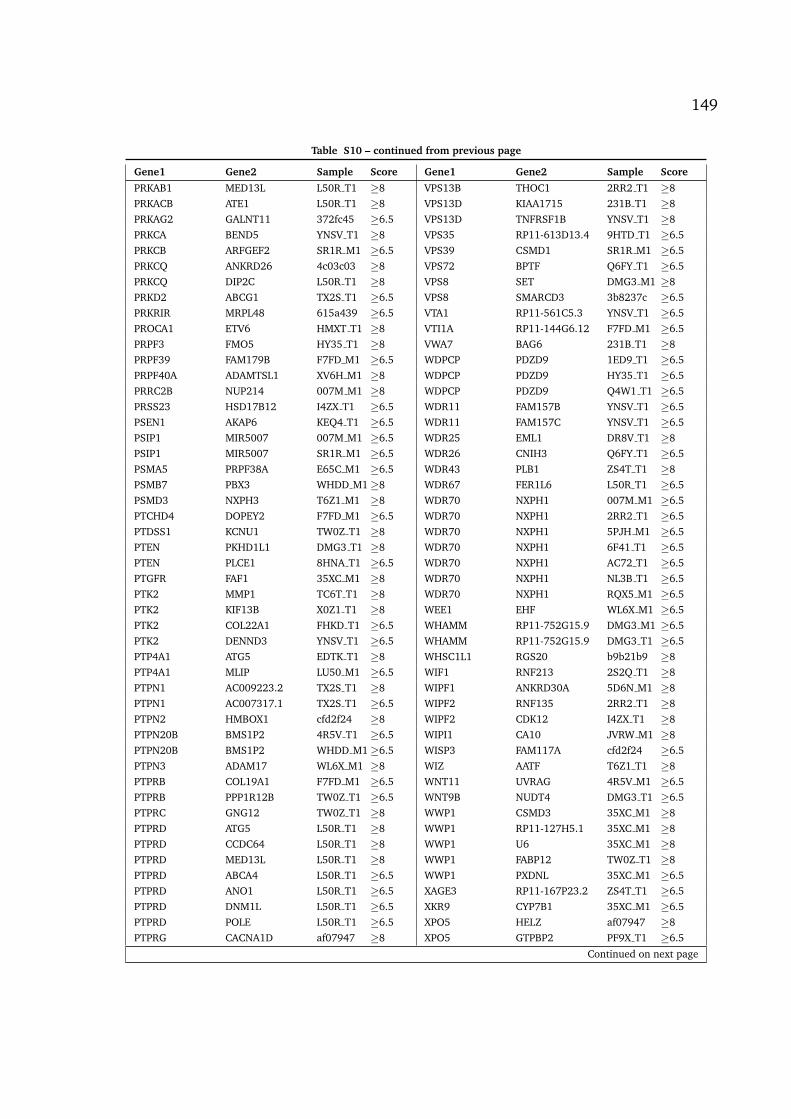
149
Table S10 – continued from previous page
Gene1 Gene2 Sample Score Gene1 Gene2 Sample Score
PRKAB1 MED13L L50R T1 ≥8 VPS13B THOC1 2RR2 T1 ≥8PRKACB ATE1 L50R T1 ≥8 VPS13D KIAA1715 231B T1 ≥8PRKAG2 GALNT11 372fc45 ≥6.5 VPS13D TNFRSF1B YNSV T1 ≥8PRKCA BEND5 YNSV T1 ≥8 VPS35 RP11-613D13.4 9HTD T1 ≥6.5PRKCB ARFGEF2 SR1R M1 ≥6.5 VPS39 CSMD1 SR1R M1 ≥6.5PRKCQ ANKRD26 4c03c03 ≥8 VPS72 BPTF Q6FY T1 ≥6.5PRKCQ DIP2C L50R T1 ≥8 VPS8 SET DMG3 M1 ≥8PRKD2 ABCG1 TX2S T1 ≥6.5 VPS8 SMARCD3 3b8237c ≥6.5PRKRIR MRPL48 615a439 ≥6.5 VTA1 RP11-561C5.3 YNSV T1 ≥6.5PROCA1 ETV6 HMXT T1 ≥8 VTI1A RP11-144G6.12 F7FD M1 ≥6.5PRPF3 FMO5 HY35 T1 ≥8 VWA7 BAG6 231B T1 ≥8PRPF39 FAM179B F7FD M1 ≥6.5 WDPCP PDZD9 1ED9 T1 ≥6.5PRPF40A ADAMTSL1 XV6H M1 ≥8 WDPCP PDZD9 HY35 T1 ≥6.5PRRC2B NUP214 007M M1 ≥8 WDPCP PDZD9 Q4W1 T1 ≥6.5PRSS23 HSD17B12 I4ZX T1 ≥6.5 WDR11 FAM157B YNSV T1 ≥6.5PSEN1 AKAP6 KEQ4 T1 ≥6.5 WDR11 FAM157C YNSV T1 ≥6.5PSIP1 MIR5007 007M M1 ≥6.5 WDR25 EML1 DR8V T1 ≥8PSIP1 MIR5007 SR1R M1 ≥6.5 WDR26 CNIH3 Q6FY T1 ≥6.5PSMA5 PRPF38A E65C M1 ≥6.5 WDR43 PLB1 ZS4T T1 ≥8PSMB7 PBX3 WHDD M1≥8 WDR67 FER1L6 L50R T1 ≥6.5PSMD3 NXPH3 T6Z1 M1 ≥8 WDR70 NXPH1 007M M1 ≥6.5PTCHD4 DOPEY2 F7FD M1 ≥6.5 WDR70 NXPH1 2RR2 T1 ≥6.5PTDSS1 KCNU1 TW0Z T1 ≥8 WDR70 NXPH1 5PJH M1 ≥6.5PTEN PKHD1L1 DMG3 T1 ≥8 WDR70 NXPH1 6F41 T1 ≥6.5PTEN PLCE1 8HNA T1 ≥6.5 WDR70 NXPH1 AC72 T1 ≥6.5PTGFR FAF1 35XC M1 ≥8 WDR70 NXPH1 NL3B T1 ≥6.5PTK2 MMP1 TC6T T1 ≥8 WDR70 NXPH1 RQX5 M1 ≥6.5PTK2 KIF13B X0Z1 T1 ≥8 WEE1 EHF WL6X M1 ≥6.5PTK2 COL22A1 FHKD T1 ≥6.5 WHAMM RP11-752G15.9 DMG3 M1 ≥6.5PTK2 DENND3 YNSV T1 ≥6.5 WHAMM RP11-752G15.9 DMG3 T1 ≥6.5PTP4A1 ATG5 EDTK T1 ≥8 WHSC1L1 RGS20 b9b21b9 ≥8PTP4A1 MLIP LU50 M1 ≥6.5 WIF1 RNF213 2S2Q T1 ≥8PTPN1 AC009223.2 TX2S T1 ≥8 WIPF1 ANKRD30A 5D6N M1 ≥8PTPN1 AC007317.1 TX2S T1 ≥6.5 WIPF2 RNF135 2RR2 T1 ≥8PTPN2 HMBOX1 cfd2f24 ≥8 WIPF2 CDK12 I4ZX T1 ≥8PTPN20B BMS1P2 4R5V T1 ≥6.5 WIPI1 CA10 JVRW M1 ≥8PTPN20B BMS1P2 WHDD M1≥6.5 WISP3 FAM117A cfd2f24 ≥6.5PTPN3 ADAM17 WL6X M1 ≥8 WIZ AATF T6Z1 T1 ≥8PTPRB COL19A1 F7FD M1 ≥6.5 WNT11 UVRAG 4R5V M1 ≥6.5PTPRB PPP1R12B TW0Z T1 ≥6.5 WNT9B NUDT4 DMG3 T1 ≥6.5PTPRC GNG12 TW0Z T1 ≥8 WWP1 CSMD3 35XC M1 ≥8PTPRD ATG5 L50R T1 ≥8 WWP1 RP11-127H5.1 35XC M1 ≥8PTPRD CCDC64 L50R T1 ≥8 WWP1 U6 35XC M1 ≥8PTPRD MED13L L50R T1 ≥8 WWP1 FABP12 TW0Z T1 ≥8PTPRD ABCA4 L50R T1 ≥6.5 WWP1 PXDNL 35XC M1 ≥6.5PTPRD ANO1 L50R T1 ≥6.5 XAGE3 RP11-167P23.2 ZS4T T1 ≥6.5PTPRD DNM1L L50R T1 ≥6.5 XKR9 CYP7B1 35XC M1 ≥6.5PTPRD POLE L50R T1 ≥6.5 XPO5 HELZ af07947 ≥8PTPRG CACNA1D af07947 ≥8 XPO5 GTPBP2 PF9X T1 ≥6.5
Continued on next page

150
Table S10 – continued from previous page
Gene1 Gene2 Sample Score Gene1 Gene2 Sample Score
PTPRK C6orf170 2RR2 T1 ≥8 XPOT NAP1L1 231B T1 ≥8PTPRK PEX7 YNSV T1 ≥8 XPR1 RP11-46A10.5 EDTK T1 ≥8PTPRN2 NCAPG2 f1ae704 ≥8 XRCC5 PECR cb6c764 ≥6.5PTPRS NFIC TX2S T1 ≥8 XRRA1 UNC5D 372fc45 ≥8PTPRT PPP1R1B cfd2f24 ≥8 XRRA1 AP3B1 HMXT T1 ≥6.5PTPRT PIGU 2S2Q T1 ≥8 XYLT2 SUPT6H T6Z1 M1 ≥6.5PTPRT AC005808.3 7DTJ T1 ≥6.5 Y RNA MAP3K7 2RR2 T1 ≥6.5PUM1 C1orf212 8MNH T1 ≥8 YARS2 KHDRBS2 E65C M1 ≥8PUM1 C1orf94 8MNH T1 ≥8 YARS2 PTPRD L50R T1 ≥6.5PUM1 B3GNTL1 HMXT T1 ≥6.5 YEATS2 VPS8 86DK M1 ≥8PVRL1 BCL9L 8H0R M1 ≥6.5 YEATS4 HOOK3 TW0Z T1 ≥8PVT1 CA3 X0Z1 T1 ≥8 YIPF1 ROR1 f1ae704 ≥8PVT1 KCNQ3 L50R T1 ≥6.5 YIPF1 TADA2A 35XC M1 ≥8PWWP2A FCHSD1 b46aa5c ≥6.5 YPEL2 SLC38A10 cfd2f24 ≥8PXDNL NSMAF 35XC M1 ≥6.5 YPEL2 C7orf31 B2HF T1 ≥6.5PXDNL FAM150A 8MNH T1 ≥6.5 YY1AP1 ASH1L 8MNH T1 ≥8PYGB ENTPD6 af07947 ≥8 ZBTB11 FNDC3B 35XC M1 ≥8PYGB CST7 SR1R M1 ≥8 ZBTB44 ACIN1 Y5G9 T1 ≥8PYGB CSMD1 dd3c42e ≥6.5 ZC2HC1C TMED10 8H0R M1 ≥8PYGB ADRA1D L50R T1 ≥6.5 ZC3H11A LAX1 4R5V M1 ≥6.5PYROXD1 CTD-2547L16.1 b9b21b9 ≥6.5 ZC3H7B TTC28-AS1 L50R T1 ≥8PYY2 KRT18P55 YNSV T1 ≥6.5 ZC3HAV1 RALGAPB 46DP M1 ≥8QKI PACRG 8HNA T1 ≥8 ZCCHC7 STIP1 8MNH T1 ≥8QRSL1 ARHGAP10 b46aa5c ≥8 ZDHHC21 CCBL2 4R5V M1 ≥8QRSL1 BCAS3 b46aa5c ≥8 ZDHHC21 ARMCX4 DR8V T1 ≥6.5QRSL1 ITGB6 b46aa5c ≥6.5 ZFAND4 SGMS1 7FNO M1 ≥8QSOX1 NEK7 4WQ1 T1 ≥8 ZFC3H1 CTD-2547L16.1 b9b21b9 ≥8QSOX1 PTPRC 4WQ1 T1 ≥8 ZFC3H1 TRIM37 TW0Z T1 ≥8R3HDM2 OTOGL RQX5 M1 ≥8 ZFPL1 ZCCHC11 L50R T1 ≥8R3HDM2 AC010887.1 46DP M1 ≥6.5 ZFR SUB1 HMXT T1 ≥6.5RAB10 KIF3C 231B T1 ≥6.5 ZFYVE9 GFRA1 L50R T1 ≥8RAB22A ACOT8 2S2Q T1 ≥8 ZGPAT RTEL1 35XC M1 ≥6.5RAB2A CEBPG 231B T1 ≥8 ZHX2 RP11-758M4.1 X0Z1 T1 ≥8RAB2A MCMDC2 F7FD M1 ≥6.5 ZKSCAN2 PHYHD1 T2VO M1 ≥6.5RAB37 CA12 3fcb2f6 ≥6.5 ZMAT3 HECTD1 TX2S T1 ≥6.5RAB6A CTD-2555I5.1 4WQ1 T1 ≥6.5 ZMAT4 AP000487.6 7DTJ T1 ≥8RAB6A FCHSD2 DR8V T1 ≥6.5 ZMAT4 NARS2 ZQC5 T1 ≥8RAB7A APH1B FYVH M1 ≥8 ZMAT4 PPFIA1 7DTJ T1 ≥6.5RABGAP1L CNIH3 Q6FY T1 ≥8 ZMAT4 ERLIN2 EDTK T1 ≥6.5RABGAP1L KDM5B YA4W M1 ≥8 ZMYM1 DLGAP3 8MNH T1 ≥8RABGAP1L NSL1 YA4W M1 ≥8 ZMYND11 CSMD3 YA4W M1 ≥8RABGAP1L CRB1 Q6FY T1 ≥6.5 ZMYND8 PTPRT 2S2Q T1 ≥8RAD51B PLCG2 HMXT T1 ≥8 ZNF117 SND1 e45fa87 ≥8RAD51B NRXN3 IUCQ T1 ≥8 ZNF142 GLS TX2S T1 ≥8RAE1 MON2 2S2Q T1 ≥8 ZNF195 SUV420H1 EDTK T1 ≥6.5RAF1 CHD1L TW0Z T1 ≥8 ZNF20 KDM4B Y5G9 T1 ≥6.5RALB AC062020.2 4R5V M1 ≥8 ZNF248 PARD3 WHDD M1≥6.5RALGAPA2 C16orf72 I4ZX T1 ≥8 ZNF257 SKAP1 2S2Q T1 ≥8RALGAPB MKLN1 46DP M1 ≥8 ZNF26 CPT1A L50R T1 ≥8
Continued on next page

151
Table S10 – continued from previous page
Gene1 Gene2 Sample Score Gene1 Gene2 Sample Score
RALGPS1 GOLGA1 4c03c03 ≥6.5 ZNF326 DPYD 35XC M1 ≥8RANBP10 CENPT HMXT T1 ≥6.5 ZNF326 OSBPL11 4R5V M1 ≥8RANBP17 FAF2 cfd2f24 ≥8 ZNF331 ZNF114 75Z1 T1 ≥8RANBP17 HTR4 0E5B T1 ≥8 ZNF334 VMP1 cfd2f24 ≥8RANGAP1 P2RY4 L50R T1 ≥6.5 ZNF346 NSD1 8H0R M1 ≥8RAP1A PIGS 8H0R M1 ≥8 ZNF366 SKIV2L2 F7FD M1 ≥8RAPGEF5 ITGB8 dd3c42e ≥6.5 ZNF37A SIGLEC6 D988 M1 ≥8RARA ABCA5 cfd2f24 ≥8 ZNF420 PLD3 L50R T1 ≥6.5RARA NLK 8H0R M1 ≥8 ZNF43 ZNF208 A0GM T1 ≥6.5RARA LINC00365 I4ZX T1 ≥6.5 ZNF43 RP11-488L18.8 DBBB M1 ≥6.5RARA NBEA I4ZX T1 ≥6.5 ZNF442 DNM2 4c03c03 ≥8RASAL2 GATC L50R T1 ≥8 ZNF451 7SK 231B T1 ≥6.5RASGEF1A INPP5A 46DP M1 ≥8 ZNF488 RP11-292F22.7 8MNH T1 ≥6.5RASL11A LIMCH1 QK84 M1 ≥6.5 ZNF512B PDE1C 0E5B T1 ≥6.5RASSF8 ERGIC2 b9b21b9 ≥8 ZNF512B PDE1C T2VO M1 ≥6.5RAVER1 LINC00460 T6Z1 T1 ≥8 ZNF548 CREB5 L50R T1 ≥8RB1 ENOX1 8HNA T1 ≥8 ZNF558 CEP112 WHDD M1≥6.5RB1 FREM2 TX2S T1 ≥8 ZNF568 AY269186.2 46DP M1 ≥6.5RB1CC1 EFCAB4B dd3c42e ≥6.5 ZNF573 SNAP23 FYVH M1 ≥8RBBP7 EEA1 L50R T1 ≥8 ZNF587 ZNF552 4ec8eca ≥8RBFOX3 ABCA10 b46aa5c ≥6.5 ZNF587 NADKD1 F7FD M1 ≥8RBM12 APP 2S2Q T1 ≥6.5 ZNF589 ARIH2 7DTJ T1 ≥8RBM12B FAM92A1 T2VO M1 ≥6.5 ZNF595 PINX1 46DP M1 ≥8RBM14-RBM4 ANO1 HY35 T1 ≥6.5 ZNF611 NLRP7 WL6X M1 ≥6.5RBM19 PTPRD L50R T1 ≥8 ZNF615 PHF12 WL6X M1 ≥8RBM4 CTTN HY35 T1 ≥6.5 ZNF625 KDM4B Y5G9 T1 ≥6.5RBM47 C4orf34 B91A M1 ≥8 ZNF649 ITSN1 TX2S T1 ≥8RBPMS KIF13B cb6c764 ≥8 ZNF652 CASC3 T6Z1 M1 ≥8RCC1 ANXA2 HMXT T1 ≥8 ZNF652 KRT18P55 T6Z1 M1 ≥6.5REEP1 EPAS1 H9F4 M1 ≥8 ZNF665 CEACAM21 TX2S T1 ≥6.5REEP3 FRMD4A 5PJH M1 ≥8 ZNF66P EPS15L1 E65C M1 ≥6.5REPS1 ACAP2 T6Z1 T1 ≥6.5 ZNF674 KIAA1217 4c03c03 ≥8RERE ERRFI1 HMXT T1 ≥8 ZNF677 AGAP4 F7FD M1 ≥6.5RFPL4B FAM117A cfd2f24 ≥6.5 ZNF697 PHTF1 4R5V T1 ≥6.5RFWD3 GLG1 T2VO M1 ≥8 ZNF701 AC006293.3 TX2S T1 ≥6.5RHOBTB3 ARSK B2HF T1 ≥8 ZNF726 R3HDM1 5D6N M1 ≥6.5RIMS2 C6orf203 2RR2 T1 ≥6.5 ZNF761 GULP1 QYXQ T1 ≥6.5RIMS2 C6orf203 TW0Z T1 ≥6.5 ZNF761 GULP1 5Y1T T1 ≥6.5RLF COL9A2 59cb2ad ≥8 ZNF761 TMEM8B 75Z1 T1 ≥6.5RLF FAM183A f1ae704 ≥6.5 ZNF761 TMEM8B 86DK M1 ≥6.5RNF103 DNAH5 RQX5 M1 ≥8 ZNF761 TMEM8B 8HNA T1 ≥6.5RNF168 FBXO45 699525b ≥8 ZNF761 GULP1 8MNH T1 ≥6.5RNF169 CTD-2023N9.1 HMXT T1 ≥6.5 ZNF761 GULP1 9L95 T1 ≥6.5RNF185 ARMC3 cfd2f24 ≥6.5 ZNF761 GULP1 F11Y T1 ≥6.5RNF213 AC026188.1 f1ae704 ≥8 ZNF761 TMEM8B JVRW M1 ≥6.5RNF213 ENDOV 86DK M1 ≥8 ZNF761 GULP1 PF9X T1 ≥6.5RNF213 OGT Q6FY T1 ≥8 ZNF761 TMEM8B T2VO M1 ≥6.5RNF4 GPM6A WL6X M1 ≥8 ZNF761 GULP1 TW0Z T1 ≥6.5RNF43 HEATR6 2RR2 T1 ≥8 ZNF761 TMEM8B VE5V M1 ≥6.5
Continued on next page

152
Table S10 – continued from previous page
Gene1 Gene2 Sample Score Gene1 Gene2 Sample Score
RNF44 ATRIP b46aa5c ≥6.5 ZNF761 TMEM8B WHDD M1≥6.5RNFT1 GRB2 Q6FY T1 ≥8 ZNF763 KIAA1671 Y5G9 T1 ≥6.5RNFT2 AP2B1 ZCYX M1 ≥6.5 ZNF783 ZNF212 OLIZ T1 ≥6.5RNLS DCUN1D5 Y5G9 T1 ≥6.5 ZNF791 ZNF564 DMG3 M1 ≥6.5RNMT C18orf1 HMXT T1 ≥6.5 ZNF808 KLK3 PF9X T1 ≥6.5RNPEP BCL9 TW0Z T1 ≥6.5 ZNF814 KCNQ2 e64126c ≥8RNU7-14P PTPRT 7DTJ T1 ≥8 ZNF816 L3MBTL1 TX2S T1 ≥8ROBO1 ADAMTS12 35XC M1 ≥8 ZNF827 TRAPPC11 YA4W M1 ≥8ROBO1 LRRC63 AC72 T1 ≥6.5 ZNF83 LRRC4B 75Z1 T1 ≥8ROBO2 GRHL2 TW0Z T1 ≥8 ZNRF3 CCDC117 b9b21b9 ≥8ROCK2 KRTAP24-1 SR1R M1 ≥6.5 ZNRF3 CHEK2 b9b21b9 ≥8RP11-101O21.1 BCAS3 Q6FY T1 ≥8 ZPLD1 NFKBIZ DMG3 M1 ≥8RP11-1029J19.5
MNAT1 RZBM M1 ≥8 ZPLD1 NFKBIZ WL6X M1 ≥6.5
RP11-1042B17.3
FUT8 7FNO M1 ≥6.5 ZRANB3 UGP2 LRU2 M1 ≥8
RP11-107C16.2 INADL L50R T1 ≥6.5 ZRANB3 CNTNAP2 4R5V T1 ≥6.5RP11-1094H24.4
HEATR6 JVRW M1 ≥6.5 ZSCAN23 ARHGAP17 T2VO M1 ≥6.5
RP11-111M22.3
NARS2 4WQ1 T1 ≥8 ZUFSP MTUS1 AEK9 T1 ≥6.5
RP11-112H10.4 LUC7L3 B2HF M1 ≥6.5 ZZZ3 GNG12 35XC M1 ≥8
Note: The order of fusion partner 5′ and 3′ is ignored to simplify comparison.
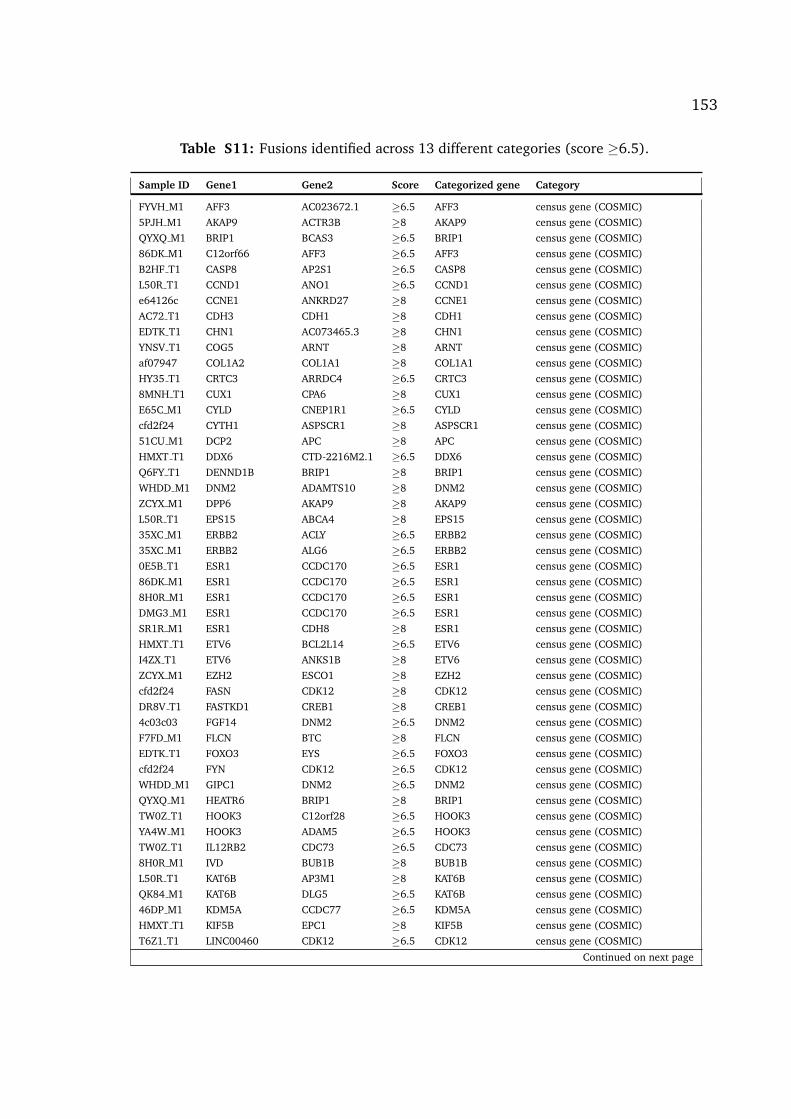
153
Table S11: Fusions identified across 13 different categories (score ≥6.5).
Sample ID Gene1 Gene2 Score Categorized gene Category
FYVH M1 AFF3 AC023672.1 ≥6.5 AFF3 census gene (COSMIC)5PJH M1 AKAP9 ACTR3B ≥8 AKAP9 census gene (COSMIC)QYXQ M1 BRIP1 BCAS3 ≥6.5 BRIP1 census gene (COSMIC)86DK M1 C12orf66 AFF3 ≥6.5 AFF3 census gene (COSMIC)B2HF T1 CASP8 AP2S1 ≥6.5 CASP8 census gene (COSMIC)L50R T1 CCND1 ANO1 ≥6.5 CCND1 census gene (COSMIC)e64126c CCNE1 ANKRD27 ≥8 CCNE1 census gene (COSMIC)AC72 T1 CDH3 CDH1 ≥8 CDH1 census gene (COSMIC)EDTK T1 CHN1 AC073465.3 ≥8 CHN1 census gene (COSMIC)YNSV T1 COG5 ARNT ≥8 ARNT census gene (COSMIC)af07947 COL1A2 COL1A1 ≥8 COL1A1 census gene (COSMIC)HY35 T1 CRTC3 ARRDC4 ≥6.5 CRTC3 census gene (COSMIC)8MNH T1 CUX1 CPA6 ≥8 CUX1 census gene (COSMIC)E65C M1 CYLD CNEP1R1 ≥6.5 CYLD census gene (COSMIC)cfd2f24 CYTH1 ASPSCR1 ≥8 ASPSCR1 census gene (COSMIC)51CU M1 DCP2 APC ≥8 APC census gene (COSMIC)HMXT T1 DDX6 CTD-2216M2.1 ≥6.5 DDX6 census gene (COSMIC)Q6FY T1 DENND1B BRIP1 ≥8 BRIP1 census gene (COSMIC)WHDD M1 DNM2 ADAMTS10 ≥8 DNM2 census gene (COSMIC)ZCYX M1 DPP6 AKAP9 ≥8 AKAP9 census gene (COSMIC)L50R T1 EPS15 ABCA4 ≥8 EPS15 census gene (COSMIC)35XC M1 ERBB2 ACLY ≥6.5 ERBB2 census gene (COSMIC)35XC M1 ERBB2 ALG6 ≥6.5 ERBB2 census gene (COSMIC)0E5B T1 ESR1 CCDC170 ≥6.5 ESR1 census gene (COSMIC)86DK M1 ESR1 CCDC170 ≥6.5 ESR1 census gene (COSMIC)8H0R M1 ESR1 CCDC170 ≥6.5 ESR1 census gene (COSMIC)DMG3 M1 ESR1 CCDC170 ≥6.5 ESR1 census gene (COSMIC)SR1R M1 ESR1 CDH8 ≥8 ESR1 census gene (COSMIC)HMXT T1 ETV6 BCL2L14 ≥6.5 ETV6 census gene (COSMIC)I4ZX T1 ETV6 ANKS1B ≥8 ETV6 census gene (COSMIC)ZCYX M1 EZH2 ESCO1 ≥8 EZH2 census gene (COSMIC)cfd2f24 FASN CDK12 ≥8 CDK12 census gene (COSMIC)DR8V T1 FASTKD1 CREB1 ≥8 CREB1 census gene (COSMIC)4c03c03 FGF14 DNM2 ≥6.5 DNM2 census gene (COSMIC)F7FD M1 FLCN BTC ≥8 FLCN census gene (COSMIC)EDTK T1 FOXO3 EYS ≥6.5 FOXO3 census gene (COSMIC)cfd2f24 FYN CDK12 ≥6.5 CDK12 census gene (COSMIC)WHDD M1 GIPC1 DNM2 ≥6.5 DNM2 census gene (COSMIC)QYXQ M1 HEATR6 BRIP1 ≥8 BRIP1 census gene (COSMIC)TW0Z T1 HOOK3 C12orf28 ≥6.5 HOOK3 census gene (COSMIC)YA4W M1 HOOK3 ADAM5 ≥6.5 HOOK3 census gene (COSMIC)TW0Z T1 IL12RB2 CDC73 ≥6.5 CDC73 census gene (COSMIC)8H0R M1 IVD BUB1B ≥8 BUB1B census gene (COSMIC)L50R T1 KAT6B AP3M1 ≥8 KAT6B census gene (COSMIC)QK84 M1 KAT6B DLG5 ≥6.5 KAT6B census gene (COSMIC)46DP M1 KDM5A CCDC77 ≥6.5 KDM5A census gene (COSMIC)HMXT T1 KIF5B EPC1 ≥8 KIF5B census gene (COSMIC)T6Z1 T1 LINC00460 CDK12 ≥6.5 CDK12 census gene (COSMIC)
Continued on next page

154
Table S11 – continued from previous page
Sample ID Gene1 Gene2 Score Categorized gene Category
D988 M1 LPP HSD17B4 ≥8 LPP census gene (COSMIC)WL6X M1 LPP AL133168.3 ≥8 LPP census gene (COSMIC)35XC M1 MAD1L1 ERBB2 ≥6.5 ERBB2 census gene (COSMIC)SR1R M1 MAP2K4 IFT122 ≥8 MAP2K4 census gene (COSMIC)4R5V T1 MAP3K1 ENC1 ≥8 MAP3K1 census gene (COSMIC)NF9D M1 MECOM GOLIM4 ≥6.5 MECOM census gene (COSMIC)SR1R M1 MECOM EGFEM1P ≥8 MECOM census gene (COSMIC)8MNH T1 MED1 CDK12 ≥6.5 CDK12 census gene (COSMIC)PF9X T1 Metazoa SRP ATR ≥6.5 ATR census gene (COSMIC)0XC1 M1 METTL15 CREB3L1 ≥6.5 CREB3L1 census gene (COSMIC)L50R T1 MGAT3 KAT6B ≥8 KAT6B census gene (COSMIC)8H0R M1 MITF FOXP1 ≥6.5 FOXP1 census gene (COSMIC)8H0R M1 MITF FOXP1 ≥6.5 MITF census gene (COSMIC)5PJH M1 MLL5 AKAP9 ≥8 AKAP9 census gene (COSMIC)Y5G9 T1 MLLT1 CATSPERD ≥8 MLLT1 census gene (COSMIC)YNSV T1 MPP5 GPHN ≥8 GPHN census gene (COSMIC)cfd2f24 MSI2 ARHGAP23 ≥8 MSI2 census gene (COSMIC)TW0Z T1 MSI2 BCAS3 ≥8 MSI2 census gene (COSMIC)L50R T1 MTMR3 KAT6B ≥8 KAT6B census gene (COSMIC)WHDD M1 MUC16 BRD4 ≥6.5 BRD4 census gene (COSMIC)FYVH M1 MYEOV CCND1 ≥8 CCND1 census gene (COSMIC)b46aa5c NCOA1 ABCA10 ≥8 NCOA1 census gene (COSMIC)2RR2 T1 NF1 GNA13 ≥8 NF1 census gene (COSMIC)51CU M1 NF2 MTMR3 ≥8 NF2 census gene (COSMIC)Q6FY T1 NFASC BRIP1 ≥8 BRIP1 census gene (COSMIC)Q4W1 T1 NFIB MYB ≥8 MYB census gene (COSMIC)Q4W1 T1 NFIB MYB ≥8 NFIB census gene (COSMIC)Y5G9 T1 NFIX BRD4 ≥8 BRD4 census gene (COSMIC)NL3B T1 NPEPPS NF1 ≥8 NF1 census gene (COSMIC)B2HF M1 NPLOC4 HLF ≥6.5 HLF census gene (COSMIC)B2HF T1 NPLOC4 HLF ≥6.5 HLF census gene (COSMIC)B2HF M1 NPSR1-AS1 MSI2 ≥8 MSI2 census gene (COSMIC)L1PK T1 NRG1 ATP8A1 ≥8 NRG1 census gene (COSMIC)L50R T1 NRG1 MAK16 ≥6.5 NRG1 census gene (COSMIC)8H0R M1 NUFIP2 CDK12 ≥8 CDK12 census gene (COSMIC)L50R T1 NUP98 INPP4B ≥8 NUP98 census gene (COSMIC)8MNH T1 OR5BB1P NUMA1 ≥6.5 NUMA1 census gene (COSMIC)WL6X M1 PACSIN2 MKL1 ≥6.5 MKL1 census gene (COSMIC)0E5B T1 PAFAH2 ARID1A ≥6.5 ARID1A census gene (COSMIC)SR1R M1 PBX1 CDC73 ≥8 CDC73 census gene (COSMIC)SR1R M1 PBX1 CDC73 ≥8 PBX1 census gene (COSMIC)SR1R M1 PBX1 F11R ≥8 PBX1 census gene (COSMIC)cfd2f24 PCGF2 CLTC ≥8 CLTC census gene (COSMIC)2RR2 T1 PDE3B CLTC ≥8 CLTC census gene (COSMIC)8H0R M1 PDE4DIP NOTCH2 ≥6.5 NOTCH2 census gene (COSMIC)8H0R M1 PDE4DIP NOTCH2 ≥6.5 PDE4DIP census gene (COSMIC)IUCQ T1 PDE4DIP NDUFS4 ≥6.5 PDE4DIP census gene (COSMIC)T6Z1 T1 PDE4DIP KDM5B ≥6.5 PDE4DIP census gene (COSMIC)I4ZX T1 PDS5B CDK12 ≥8 CDK12 census gene (COSMIC)
Continued on next page
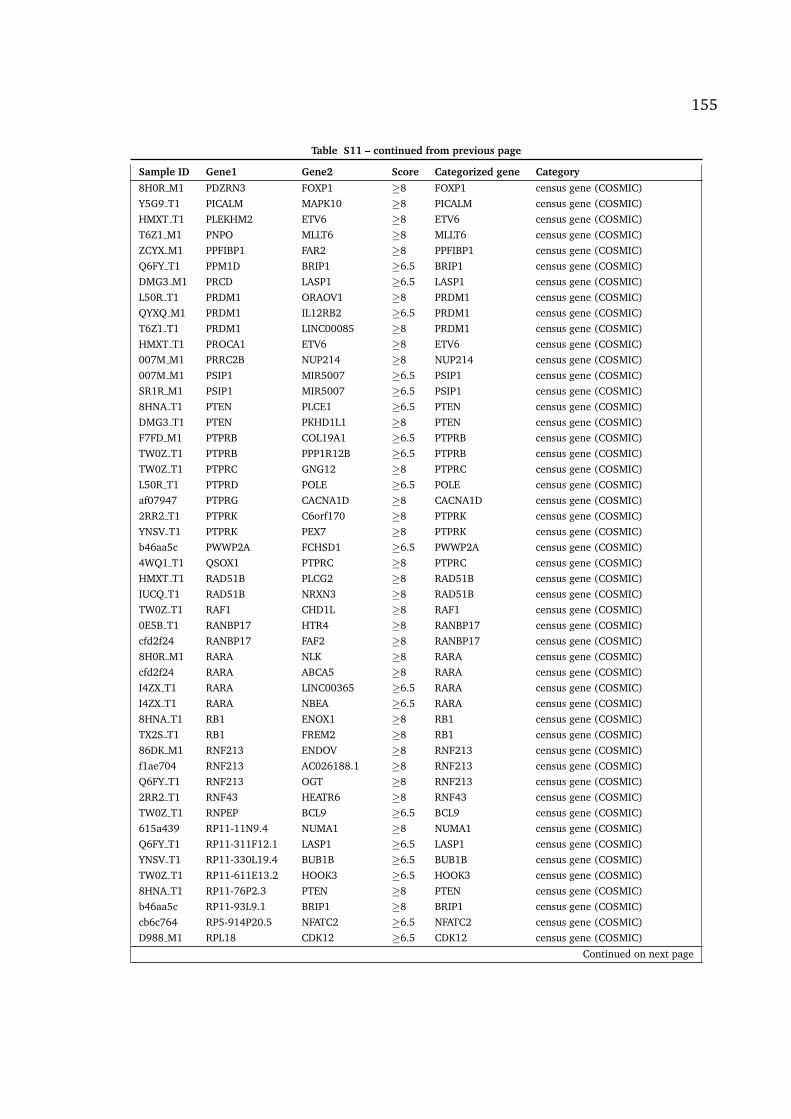
155
Table S11 – continued from previous page
Sample ID Gene1 Gene2 Score Categorized gene Category
8H0R M1 PDZRN3 FOXP1 ≥8 FOXP1 census gene (COSMIC)Y5G9 T1 PICALM MAPK10 ≥8 PICALM census gene (COSMIC)HMXT T1 PLEKHM2 ETV6 ≥8 ETV6 census gene (COSMIC)T6Z1 M1 PNPO MLLT6 ≥8 MLLT6 census gene (COSMIC)ZCYX M1 PPFIBP1 FAR2 ≥8 PPFIBP1 census gene (COSMIC)Q6FY T1 PPM1D BRIP1 ≥6.5 BRIP1 census gene (COSMIC)DMG3 M1 PRCD LASP1 ≥6.5 LASP1 census gene (COSMIC)L50R T1 PRDM1 ORAOV1 ≥8 PRDM1 census gene (COSMIC)QYXQ M1 PRDM1 IL12RB2 ≥6.5 PRDM1 census gene (COSMIC)T6Z1 T1 PRDM1 LINC00085 ≥8 PRDM1 census gene (COSMIC)HMXT T1 PROCA1 ETV6 ≥8 ETV6 census gene (COSMIC)007M M1 PRRC2B NUP214 ≥8 NUP214 census gene (COSMIC)007M M1 PSIP1 MIR5007 ≥6.5 PSIP1 census gene (COSMIC)SR1R M1 PSIP1 MIR5007 ≥6.5 PSIP1 census gene (COSMIC)8HNA T1 PTEN PLCE1 ≥6.5 PTEN census gene (COSMIC)DMG3 T1 PTEN PKHD1L1 ≥8 PTEN census gene (COSMIC)F7FD M1 PTPRB COL19A1 ≥6.5 PTPRB census gene (COSMIC)TW0Z T1 PTPRB PPP1R12B ≥6.5 PTPRB census gene (COSMIC)TW0Z T1 PTPRC GNG12 ≥8 PTPRC census gene (COSMIC)L50R T1 PTPRD POLE ≥6.5 POLE census gene (COSMIC)af07947 PTPRG CACNA1D ≥8 CACNA1D census gene (COSMIC)2RR2 T1 PTPRK C6orf170 ≥8 PTPRK census gene (COSMIC)YNSV T1 PTPRK PEX7 ≥8 PTPRK census gene (COSMIC)b46aa5c PWWP2A FCHSD1 ≥6.5 PWWP2A census gene (COSMIC)4WQ1 T1 QSOX1 PTPRC ≥8 PTPRC census gene (COSMIC)HMXT T1 RAD51B PLCG2 ≥8 RAD51B census gene (COSMIC)IUCQ T1 RAD51B NRXN3 ≥8 RAD51B census gene (COSMIC)TW0Z T1 RAF1 CHD1L ≥8 RAF1 census gene (COSMIC)0E5B T1 RANBP17 HTR4 ≥8 RANBP17 census gene (COSMIC)cfd2f24 RANBP17 FAF2 ≥8 RANBP17 census gene (COSMIC)8H0R M1 RARA NLK ≥8 RARA census gene (COSMIC)cfd2f24 RARA ABCA5 ≥8 RARA census gene (COSMIC)I4ZX T1 RARA LINC00365 ≥6.5 RARA census gene (COSMIC)I4ZX T1 RARA NBEA ≥6.5 RARA census gene (COSMIC)8HNA T1 RB1 ENOX1 ≥8 RB1 census gene (COSMIC)TX2S T1 RB1 FREM2 ≥8 RB1 census gene (COSMIC)86DK M1 RNF213 ENDOV ≥8 RNF213 census gene (COSMIC)f1ae704 RNF213 AC026188.1 ≥8 RNF213 census gene (COSMIC)Q6FY T1 RNF213 OGT ≥8 RNF213 census gene (COSMIC)2RR2 T1 RNF43 HEATR6 ≥8 RNF43 census gene (COSMIC)TW0Z T1 RNPEP BCL9 ≥6.5 BCL9 census gene (COSMIC)615a439 RP11-11N9.4 NUMA1 ≥8 NUMA1 census gene (COSMIC)Q6FY T1 RP11-311F12.1 LASP1 ≥6.5 LASP1 census gene (COSMIC)YNSV T1 RP11-330L19.4 BUB1B ≥6.5 BUB1B census gene (COSMIC)TW0Z T1 RP11-611E13.2 HOOK3 ≥6.5 HOOK3 census gene (COSMIC)8HNA T1 RP11-76P2.3 PTEN ≥8 PTEN census gene (COSMIC)b46aa5c RP11-93L9.1 BRIP1 ≥8 BRIP1 census gene (COSMIC)cb6c764 RP5-914P20.5 NFATC2 ≥6.5 NFATC2 census gene (COSMIC)D988 M1 RPL18 CDK12 ≥6.5 CDK12 census gene (COSMIC)
Continued on next page

156
Table S11 – continued from previous page
Sample ID Gene1 Gene2 Score Categorized gene Category
L50R T1 RPS15AP5 FGFR2 ≥6.5 FGFR2 census gene (COSMIC)LRU2 M1 RPTOR NF1 ≥6.5 NF1 census gene (COSMIC)2S2Q T1 RUNX1 PPM1H ≥6.5 RUNX1 census gene (COSMIC)b46aa5c RUNX1 CCDC58 ≥8 RUNX1 census gene (COSMIC)b46aa5c RUNX1 KPNA1 ≥8 RUNX1 census gene (COSMIC)HMXT T1 RUNX1 BRE ≥8 RUNX1 census gene (COSMIC)SR1R M1 RUNX1 FARSB ≥8 RUNX1 census gene (COSMIC)SR1R M1 RUNX1 MOGAT1 ≥6.5 RUNX1 census gene (COSMIC)X0Z1 T1 RUNX1 AGPAT3 ≥6.5 RUNX1 census gene (COSMIC)L50R T1 SDHAF2 C10orf47 ≥8 SDHAF2 census gene (COSMIC)TX2S T1 SEC22B NOTCH2 ≥6.5 NOTCH2 census gene (COSMIC)f1ae704 SEPT5 PPIL2 ≥8 SEPT5 census gene (COSMIC)AC72 T1 SEPT9 GRB2 ≥8 SEPT9 census gene (COSMIC)b9b21b9 SEPT9 CUEDC1 ≥8 SEPT9 census gene (COSMIC)b9b21b9 SEPT9 GDPD1 ≥8 SEPT9 census gene (COSMIC)4R5V M1 SH3GL1 LRBA ≥8 SH3GL1 census gene (COSMIC)7FNO M1 SIPA1L3 CCNE1 ≥8 CCNE1 census gene (COSMIC)cfd2f24 SKA2 RNF213 ≥6.5 RNF213 census gene (COSMIC)4R5V M1 SLC25A17 MKL1 ≥8 MKL1 census gene (COSMIC)0XC1 M1 SMAD4 MAD2L1 ≥8 SMAD4 census gene (COSMIC)Y5G9 T1 SMARCA4 KANK3 ≥8 SMARCA4 census gene (COSMIC)Y5G9 T1 SMARCA4 PLA2G6 ≥8 SMARCA4 census gene (COSMIC)46DP M1 SND1 CASD1 ≥8 SND1 census gene (COSMIC)2RR2 T1 SNTG1 CBLB ≥8 CBLB census gene (COSMIC)T6Z1 M1 SPAG9 NF1 ≥6.5 NF1 census gene (COSMIC)51CU M1 SPEN DDI2 ≥8 SPEN census gene (COSMIC)2S2Q T1 SPOP GNA13 ≥8 SPOP census gene (COSMIC)cfd2f24 SPOP RP11-429O1.1 ≥6.5 SPOP census gene (COSMIC)T6Z1 M1 SPOP HNF1B ≥6.5 SPOP census gene (COSMIC)T6Z1 M1 SPOP MRPL45P2 ≥6.5 SPOP census gene (COSMIC)T6Z1 M1 SPOP RP11-192H23.4 ≥6.5 SPOP census gene (COSMIC)T6Z1 M1 SPOP RP11-697E22.2 ≥6.5 SPOP census gene (COSMIC)86DK M1 SRGAP1 AFF3 ≥6.5 AFF3 census gene (COSMIC)T6Z1 M1 STAT3 CDK12 ≥8 CDK12 census gene (COSMIC)T6Z1 M1 STAT3 CDK12 ≥8 STAT3 census gene (COSMIC)b46aa5c STK39 BRIP1 ≥6.5 BRIP1 census gene (COSMIC)WHDD M1 STXBP4 BRIP1 ≥8 BRIP1 census gene (COSMIC)b9b21b9 TADA2A MSI2 ≥8 MSI2 census gene (COSMIC)WHDD M1 TANC2 SMARCA4 ≥6.5 SMARCA4 census gene (COSMIC)HMXT T1 TAOK1 KAT6A ≥6.5 KAT6A census gene (COSMIC)IUCQ T1 TAOK1 CDK12 ≥8 CDK12 census gene (COSMIC)QYXQ M1 TBC1D16 SPECC1 ≥6.5 SPECC1 census gene (COSMIC)EDTK T1 TCF20 MYH9 ≥8 MYH9 census gene (COSMIC)4WQ1 T1 TDRD5 PTPRC ≥8 PTPRC census gene (COSMIC)DBBB M1 TFG GPR128 ≥8 TFG census gene (COSMIC)NF9D M1 TFG GPR128 ≥8 TFG census gene (COSMIC)Y5G9 T1 TFG GPR128 ≥8 TFG census gene (COSMIC)dd3c42e TFRC SLC51A ≥8 TFRC census gene (COSMIC)XV6H M1 THRAP3 SKIL ≥6.5 THRAP3 census gene (COSMIC)
Continued on next page

157
Table S11 – continued from previous page
Sample ID Gene1 Gene2 Score Categorized gene Category
X0Z1 T1 TRAPPC10 ERG ≥8 ERG census gene (COSMIC)HMXT T1 TRIM2 FBXW7 ≥8 FBXW7 census gene (COSMIC)cfd2f24 TRIM37 RARA ≥6.5 RARA census gene (COSMIC)Q6FY T1 TSNAX PTPRC ≥6.5 PTPRC census gene (COSMIC)4R5V M1 TTC17 SS18 ≥8 SS18 census gene (COSMIC)59cb2ad UBR5 AZIN1 ≥8 UBR5 census gene (COSMIC)cfd2f24 USP32 RARA ≥8 RARA census gene (COSMIC)JVRW M1 USP6 MIPEP ≥8 USP6 census gene (COSMIC)LU50 M1 USP6 RPAIN ≥8 USP6 census gene (COSMIC)51CU M1 VANGL1 PDE4DIP ≥8 PDE4DIP census gene (COSMIC)DMG3 M1 VPS8 SET ≥8 SET census gene (COSMIC)F7FD M1 VTI1A RP11-144G6.12 ≥6.5 VTI1A census gene (COSMIC)b9b21b9 WHSC1L1 RGS20 ≥8 WHSC1L1 census gene (COSMIC)2S2Q T1 WIF1 RNF213 ≥8 RNF213 census gene (COSMIC)2S2Q T1 WIF1 RNF213 ≥8 WIF1 census gene (COSMIC)I4ZX T1 WIPF2 CDK12 ≥8 CDK12 census gene (COSMIC)TW0Z T1 YEATS4 HOOK3 ≥8 HOOK3 census gene (COSMIC)e45fa87 ZNF117 SND1 ≥8 SND1 census gene (COSMIC)75Z1 T1 ZNF331 ZNF114 ≥8 ZNF331 census gene (COSMIC)8H0R M1 ZNF346 NSD1 ≥8 NSD1 census gene (COSMIC)4c03c03 ZNF442 DNM2 ≥8 DNM2 census gene (COSMIC)b9b21b9 ZNRF3 CHEK2 ≥8 CHEK2 census gene (COSMIC)AEK9 T1 CTD-2194A8.2 BAD ≥8 BAD ErbB signalling pathway35XC M1 ERBB2 ACLY ≥6.5 ERBB2 ErbB signalling pathway35XC M1 ERBB2 ALG6 ≥6.5 ERBB2 ErbB signalling pathwayYNSV T1 ERBB4 CYFIP1 ≥6.5 ERBB4 ErbB signalling pathwayF7FD M1 FLCN BTC ≥8 BTC ErbB signalling pathwayDMG3 T1 INTS8 ERBB4 ≥6.5 ERBB4 ErbB signalling pathway35XC M1 MAD1L1 ERBB2 ≥6.5 ERBB2 ErbB signalling pathwaySR1R M1 MAP2K4 IFT122 ≥8 MAP2K4 ErbB signalling pathwayYNSV T1 MAPK8 FRMPD2 ≥6.5 MAPK8 ErbB signalling pathwayTX2S T1 MFSD6 MAPK10 ≥8 MAPK10 ErbB signalling pathwayB2HF T1 MTOR EXOSC10 ≥8 MTOR ErbB signalling pathwayL1PK T1 NRG1 ATP8A1 ≥8 NRG1 ErbB signalling pathwayL50R T1 NRG1 MAK16 ≥6.5 NRG1 ErbB signalling pathwaye45fa87 NRG3 MLL5 ≥6.5 NRG3 ErbB signalling pathwayHY35 T1 PAK1 C11orf49 ≥6.5 PAK1 ErbB signalling pathwayTX2S T1 PAK1 CYP4Z1 ≥6.5 PAK1 ErbB signalling pathwayZQC5 T1 PAK1 CPT1A ≥6.5 PAK1 ErbB signalling pathwayZQC5 T1 PAK1 MTL5 ≥8 PAK1 ErbB signalling pathwayHMXT T1 PAK7 JAG1 ≥6.5 PAK7 ErbB signalling pathwayWHDD M1 PGAM1P2 PAK1 ≥6.5 PAK1 ErbB signalling pathwayY5G9 T1 PICALM MAPK10 ≥8 MAPK10 ErbB signalling pathwayYNSV T1 PRKCA BEND5 ≥8 PRKCA ErbB signalling pathwaySR1R M1 PRKCB ARFGEF2 ≥6.5 PRKCB ErbB signalling pathwayFHKD T1 PTK2 COL22A1 ≥6.5 PTK2 ErbB signalling pathwayTC6T T1 PTK2 MMP1 ≥8 PTK2 ErbB signalling pathwayX0Z1 T1 PTK2 KIF13B ≥8 PTK2 ErbB signalling pathwayYNSV T1 PTK2 DENND3 ≥6.5 PTK2 ErbB signalling pathway
Continued on next page

158
Table S11 – continued from previous page
Sample ID Gene1 Gene2 Score Categorized gene Category
HMXT T1 RAD51B PLCG2 ≥8 PLCG2 ErbB signalling pathwayTW0Z T1 RAF1 CHD1L ≥8 RAF1 ErbB signalling pathwayQ6FY T1 RNFT1 GRB2 ≥8 GRB2 ErbB signalling pathwayB2HF T1 RPS6KB1 BCAS3 ≥8 RPS6KB1 ErbB signalling pathwayJVRW M1 RPS6KB1 BAG4 ≥6.5 RPS6KB1 ErbB signalling pathwayQ6FY T1 RPS6KB1 CAMSAP2 ≥8 RPS6KB1 ErbB signalling pathwayAC72 T1 SEPT9 GRB2 ≥8 GRB2 ErbB signalling pathwayFYVH M1 SGCZ EIF4EBP1 ≥6.5 EIF4EBP1 ErbB signalling pathwayYA4W M1 SIN3A NRG4 ≥8 NRG4 ErbB signalling pathway2RR2 T1 SNTG1 CBLB ≥8 CBLB ErbB signalling pathwayb46aa5c SOS1 RP6-65G23.3 ≥8 SOS1 ErbB signalling pathwayTX2S T1 SOS1 ARFGEF2 ≥8 SOS1 ErbB signalling pathwayEDTK T1 SOS2 NGDN ≥8 SOS2 ErbB signalling pathway46DP M1 SRC METTL2B ≥6.5 SRC ErbB signalling pathwaye45fa87 SRPK2 NRG3 ≥8 NRG3 ErbB signalling pathwaycb6c764 TANC2 RPS6KB1 ≥8 RPS6KB1 ErbB signalling pathwayF11Y T1 TMEM104 PRKCA ≥8 PRKCA ErbB signalling pathwaycfd2f24 TRIM37 RPS6KB1 ≥8 RPS6KB1 ErbB signalling pathway7FNO M1 TSEN54 GRB2 ≥8 GRB2 ErbB signalling pathwayE65C M1 UBR4 CAMK2D ≥6.5 CAMK2D ErbB signalling pathwaycfd2f24 USP32 PRKCA ≥8 PRKCA ErbB signalling pathwayQ6FY T1 USP32 RPS6KB1 ≥8 RPS6KB1 ErbB signalling pathwayB2HF T1 VMP1 RPS6KB1 ≥8 RPS6KB1 ErbB signalling pathway35XC M1 ENY2 ADCY8 ≥6.5 ADCY8 Estrogen signalling pathway0E5B T1 ESR1 CCDC170 ≥6.5 ESR1 Estrogen signalling pathway86DK M1 ESR1 CCDC170 ≥6.5 ESR1 Estrogen signalling pathway8H0R M1 ESR1 CCDC170 ≥6.5 ESR1 Estrogen signalling pathwayDMG3 M1 ESR1 CCDC170 ≥6.5 ESR1 Estrogen signalling pathwaySR1R M1 ESR1 CDH8 ≥8 ESR1 Estrogen signalling pathwayYNSV T1 FAM49B ADCY8 ≥8 ADCY8 Estrogen signalling pathwayDR8V T1 FASTKD1 CREB1 ≥8 CREB1 Estrogen signalling pathway0E5B T1 GNAI3 FAM102B ≥8 GNAI3 Estrogen signalling pathway699525b GNAI3 C1orf101 ≥8 GNAI3 Estrogen signalling pathway0XC1 M1 METTL15 CREB3L1 ≥6.5 CREB3L1 Estrogen signalling pathway3fcb2f6 PLCB1 C20orf94 ≥6.5 PLCB1 Estrogen signalling pathway3fcb2f6 PLCB4 C20orf94 ≥6.5 PLCB4 Estrogen signalling pathwayL50R T1 PRKACB ATE1 ≥8 PRKACB Estrogen signalling pathwayTW0Z T1 RAF1 CHD1L ≥8 RAF1 Estrogen signalling pathwayQ6FY T1 RNFT1 GRB2 ≥8 GRB2 Estrogen signalling pathway35XC M1 SDCBP ADCY8 ≥6.5 ADCY8 Estrogen signalling pathwayAC72 T1 SEPT9 GRB2 ≥8 GRB2 Estrogen signalling pathwayb46aa5c SOS1 RP6-65G23.3 ≥8 SOS1 Estrogen signalling pathwayTX2S T1 SOS1 ARFGEF2 ≥8 SOS1 Estrogen signalling pathwayEDTK T1 SOS2 NGDN ≥8 SOS2 Estrogen signalling pathway46DP M1 SRC METTL2B ≥6.5 SRC Estrogen signalling pathwayDMG3 M1 STIP1 PLCB3 ≥8 PLCB3 Estrogen signalling pathwayb46aa5c TIPIN PLCB2 ≥8 PLCB2 Estrogen signalling pathwayHMXT T1 TM7SF3 ITPR2 ≥8 ITPR2 Estrogen signalling pathwayE65C M1 TMEM132B ITPR2 ≥8 ITPR2 Estrogen signalling pathway
Continued on next page

159
Table S11 – continued from previous page
Sample ID Gene1 Gene2 Score Categorized gene Category
7FNO M1 TSEN54 GRB2 ≥8 GRB2 Estrogen signalling pathwayL50R T1 ZNF548 CREB5 ≥8 CREB5 Estrogen signalling pathwayT6Z1 M1 ARL2 ANO1 ≥8 ARL2 Ras superfamilyHMXT T1 MYBPC1 ARL1 ≥6.5 ARL1 Ras superfamily231B T1 RAB10 KIF3C ≥6.5 RAB10 Ras superfamily2S2Q T1 RAB22A ACOT8 ≥8 RAB22A Ras superfamily3fcb2f6 RAB37 CA12 ≥6.5 RAB37 Ras superfamily4WQ1 T1 RAB6A CTD-2555I5.1 ≥6.5 RAB6A Ras superfamilyDR8V T1 RAB6A FCHSD2 ≥6.5 RAB6A Ras superfamilyFYVH M1 RAB7A APH1B ≥8 RAB7A Ras superfamily4R5V M1 RALB AC062020.2 ≥8 RALB Ras superfamily8H0R M1 RAP1A PIGS ≥8 RAP1A Ras superfamilyQK84 M1 RASL11A LIMCH1 ≥6.5 RASL11A Ras superfamilyB2HF T1 RHOBTB3 ARSK ≥8 RHOBTB3 Ras superfamilycfd2f24 SRGAP2B RAB25 ≥8 RAB25 Ras superfamilyL50R T1 SYDE2 RAB3B ≥6.5 RAB3B Ras superfamilyFYVH M1 SLC13A3 KLF12 ≥6.5 SLC13A3 solute carrier familyL50R T1 SLC16A12 RNFT2 ≥6.5 SLC16A12 solute carrier family2S2Q T1 SLC16A7 METTL2A ≥6.5 SLC16A7 solute carrier familyYNSV T1 SLC16A9 ANK3 ≥8 SLC16A9 solute carrier family59cb2ad SLC17A8 GAS2L3 ≥6.5 SLC17A8 solute carrier family0XC1 M1 SLC1A2 C11orf49 ≥8 SLC1A2 solute carrier family372fc45 SLC22A20 ACAD11 ≥6.5 SLC22A20 solute carrier familyI4ZX T1 SLC24A3 AC005220.3 ≥6.5 SLC24A3 solute carrier family4R5V M1 SLC25A17 MKL1 ≥8 SLC25A17 solute carrier familyWHDD M1 SLC25A26 ARHGAP21 ≥8 SLC25A26 solute carrier familyLRU2 M1 SLC25A42 CCT6B ≥8 SLC25A42 solute carrier familyHIHE T1 SLC26A3 CXCL14 ≥6.5 SLC26A3 solute carrier familyYNSV T1 SLC26A4 COG5 ≥8 SLC26A4 solute carrier familyTX2S T1 SLC29A3 ADK ≥8 SLC29A3 solute carrier familyY5G9 T1 SLC2A12 PLEKHA7 ≥8 SLC2A12 solute carrier familyL50R T1 SLC30A8 RP11-157E21.1 ≥6.5 SLC30A8 solute carrier familyH9F4 M1 SLC30A9 RP11-162G9.1 ≥8 SLC30A9 solute carrier familyF7FD M1 SLC35E3 FAM135A ≥8 SLC35E3 solute carrier familyL50R T1 SLC35F4 CLTA ≥6.5 SLC35F4 solute carrier familycb6c764 SLC38A10 RBPMS ≥8 SLC38A10 solute carrier familyQ6FY T1 SLC39A11 BCAS3 ≥8 SLC39A11 solute carrier familyWL6X M1 SLC39A8 DEPDC5 ≥6.5 SLC39A8 solute carrier family615a439 SLC45A1 INADL ≥8 SLC45A1 solute carrier family51CU M1 SLC4A10 RBMS1 ≥6.5 SLC4A10 solute carrier familyTX2S T1 SLC4A10 C19orf77 ≥6.5 SLC4A10 solute carrier familyTW0Z T1 SLC6A11 ADAM18 ≥8 SLC6A11 solute carrier familyTW0Z T1 SLC6A6 RPRD2 ≥8 SLC6A6 solute carrier family5PJH M1 SLCO1A2 NECAP1 ≥6.5 SLCO1A2 solute carrier familyI4ZX T1 SUMO1P1 SLC24A3 ≥6.5 SLC24A3 solute carrier familyAC72 T1 TADA2A SLC25A19 ≥6.5 SLC25A19 solute carrier familyFYVH M1 TMEM182 SLC9A2 ≥6.5 SLC9A2 solute carrier family3b8237c TRPS1 SLC36A2 ≥8 SLC36A2 solute carrier family4R5V M1 TTC16 SLC12A7 ≥8 SLC12A7 solute carrier family
Continued on next page

160
Table S11 – continued from previous page
Sample ID Gene1 Gene2 Score Categorized gene Category
cfd2f24 YPEL2 SLC38A10 ≥8 SLC38A10 solute carrier familyYNSV T1 COG5 ARNT ≥8 ARNT HIF1 signalling pathway35XC M1 ERBB2 ACLY ≥6.5 ERBB2 HIF1 signalling pathway35XC M1 ERBB2 ALG6 ≥6.5 ERBB2 HIF1 signalling pathwayHY35 T1 IGF1R CCDC33 ≥8 IGF1R HIF1 signalling pathwayY5G9 T1 INSR FCER2 ≥6.5 INSR HIF1 signalling pathway35XC M1 MAD1L1 ERBB2 ≥6.5 ERBB2 HIF1 signalling pathwayB2HF T1 MTOR EXOSC10 ≥8 MTOR HIF1 signalling pathwayHY35 T1 MYEOV IGF1R ≥6.5 IGF1R HIF1 signalling pathwayH9F4 M1 NEBL HK1 ≥8 HK1 HIF1 signalling pathwayHMXT T1 PFKFB2 CEP192 ≥8 PFKFB2 HIF1 signalling pathwayHMXT T1 PFKFB3 AKR1C1 ≥8 PFKFB3 HIF1 signalling pathwayTX2S T1 PFKL PCNT ≥8 PFKL HIF1 signalling pathwayYNSV T1 PRKCA BEND5 ≥8 PRKCA HIF1 signalling pathwaySR1R M1 PRKCB ARFGEF2 ≥6.5 PRKCB HIF1 signalling pathwayHMXT T1 RAD51B PLCG2 ≥8 PLCG2 HIF1 signalling pathwayB2HF T1 RPS6KB1 BCAS3 ≥8 RPS6KB1 HIF1 signalling pathwayJVRW M1 RPS6KB1 BAG4 ≥6.5 RPS6KB1 HIF1 signalling pathwayQ6FY T1 RPS6KB1 CAMSAP2 ≥8 RPS6KB1 HIF1 signalling pathwayFYVH M1 SGCZ EIF4EBP1 ≥6.5 EIF4EBP1 HIF1 signalling pathwayHY35 T1 SHANK2 IGF1R ≥8 IGF1R HIF1 signalling pathwayY5G9 T1 SIAH1 INSR ≥6.5 INSR HIF1 signalling pathwayT6Z1 M1 STAT3 CDK12 ≥8 STAT3 HIF1 signalling pathwaycb6c764 TANC2 RPS6KB1 ≥8 RPS6KB1 HIF1 signalling pathwaydd3c42e TFRC SLC51A ≥8 TFRC HIF1 signalling pathwayF11Y T1 TMEM104 PRKCA ≥8 PRKCA HIF1 signalling pathwaycfd2f24 TRIM37 RPS6KB1 ≥8 RPS6KB1 HIF1 signalling pathwayE65C M1 UBR4 CAMK2D ≥6.5 CAMK2D HIF1 signalling pathwaycfd2f24 USP32 PRKCA ≥8 PRKCA HIF1 signalling pathwayQ6FY T1 USP32 RPS6KB1 ≥8 RPS6KB1 HIF1 signalling pathwayB2HF T1 VMP1 RPS6KB1 ≥8 RPS6KB1 HIF1 signalling pathwayF7FD M1 CTD-2033D24.2 CACNG5 ≥6.5 CACNG5 MAPK signalling pathwayWL6X M1 DUSP4 CDCA2 ≥6.5 DUSP4 MAPK signalling pathway4c03c03 FGF14 DNM2 ≥6.5 FGF14 MAPK signalling pathway4R5V M1 FGF14 COL4A1 ≥8 FGF14 MAPK signalling pathwaySR1R M1 FGF14 DNAJC3 ≥6.5 FGF14 MAPK signalling pathwayL50R T1 FGF19 EHD1 ≥6.5 FGF19 MAPK signalling pathwayHWX7 M1 LAMTOR1 ARRB1 ≥8 ARRB1 MAPK signalling pathwaySR1R M1 MAP2K4 IFT122 ≥8 MAP2K4 MAPK signalling pathway4R5V T1 MAP3K1 ENC1 ≥8 MAP3K1 MAPK signalling pathwayOLIZ T1 MAP3K5 LRRC16A ≥8 MAP3K5 MAPK signalling pathwayYNSV T1 MAPK8 FRMPD2 ≥6.5 MAPK8 MAPK signalling pathwayQ6FY T1 MAPKAPK2 DENND1B ≥8 MAPKAPK2 MAPK signalling pathwayHMXT T1 MAPKAPK3 HEMK1 ≥6.5 MAPKAPK3 MAPK signalling pathwayNF9D M1 MECOM GOLIM4 ≥6.5 MECOM MAPK signalling pathwaySR1R M1 MECOM EGFEM1P ≥8 MECOM MAPK signalling pathwayTX2S T1 MFSD6 MAPK10 ≥8 MAPK10 MAPK signalling pathway2RR2 T1 NF1 GNA13 ≥8 NF1 MAPK signalling pathwayQ6FY T1 NIT1 DUSP10 ≥6.5 DUSP10 MAPK signalling pathway
Continued on next page

161
Table S11 – continued from previous page
Sample ID Gene1 Gene2 Score Categorized gene Category
2RR2 T1 NLK LRRC37A3 ≥8 NLK MAPK signalling pathway3fcb2f6 NLK ADAP2 ≥6.5 NLK MAPK signalling pathwayT6Z1 M1 NLK KRT18P55 ≥8 NLK MAPK signalling pathwayNL3B T1 NPEPPS NF1 ≥8 NF1 MAPK signalling pathwayT6Z1 M1 NXPH3 CACNA1G ≥6.5 CACNA1G MAPK signalling pathwayHY35 T1 PAK1 C11orf49 ≥6.5 PAK1 MAPK signalling pathwayTX2S T1 PAK1 CYP4Z1 ≥6.5 PAK1 MAPK signalling pathwayZQC5 T1 PAK1 CPT1A ≥6.5 PAK1 MAPK signalling pathwayZQC5 T1 PAK1 MTL5 ≥8 PAK1 MAPK signalling pathway35XC M1 PDE4B GNG12 ≥6.5 GNG12 MAPK signalling pathwayWHDD M1 PGAM1P2 PAK1 ≥6.5 PAK1 MAPK signalling pathwaydd3c42e PHF20 FGF3 ≥6.5 FGF3 MAPK signalling pathwayY5G9 T1 PICALM MAPK10 ≥8 MAPK10 MAPK signalling pathwayB91A M1 PPP3CA CISD2 ≥8 PPP3CA MAPK signalling pathway231B T1 PPP6R2 MAPK12 ≥6.5 MAPK12 MAPK signalling pathwayL50R T1 PRKACB ATE1 ≥8 PRKACB MAPK signalling pathwayYNSV T1 PRKCA BEND5 ≥8 PRKCA MAPK signalling pathwaySR1R M1 PRKCB ARFGEF2 ≥6.5 PRKCB MAPK signalling pathwayTW0Z T1 PTPRC GNG12 ≥8 GNG12 MAPK signalling pathwayaf07947 PTPRG CACNA1D ≥8 CACNA1D MAPK signalling pathwayTW0Z T1 RAF1 CHD1L ≥8 RAF1 MAPK signalling pathway8H0R M1 RAP1A PIGS ≥8 RAP1A MAPK signalling pathway8H0R M1 RARA NLK ≥8 NLK MAPK signalling pathwayQ6FY T1 RNFT1 GRB2 ≥8 GRB2 MAPK signalling pathwaycb6c764 RP11-64C1.1 FLNB ≥6.5 FLNB MAPK signalling pathwayL50R T1 RPS15AP5 FGFR2 ≥6.5 FGFR2 MAPK signalling pathwayDMG3 T1 RPS6KA1 KIAA1522 ≥6.5 RPS6KA1 MAPK signalling pathwayJVRW M1 RPS6KA4 KDM2A ≥6.5 RPS6KA4 MAPK signalling pathwayLRU2 M1 RPTOR NF1 ≥6.5 NF1 MAPK signalling pathwayAC72 T1 SEPT9 GRB2 ≥8 GRB2 MAPK signalling pathwayb46aa5c SOS1 RP6-65G23.3 ≥8 SOS1 MAPK signalling pathwayTX2S T1 SOS1 ARFGEF2 ≥8 SOS1 MAPK signalling pathwayEDTK T1 SOS2 NGDN ≥8 SOS2 MAPK signalling pathwayT6Z1 M1 SPAG9 NF1 ≥6.5 NF1 MAPK signalling pathway7FNO M1 TAOK1 PCTP ≥8 TAOK1 MAPK signalling pathway8MNH T1 TAOK1 C17orf79 ≥8 TAOK1 MAPK signalling pathwayHMXT T1 TAOK1 KAT6A ≥6.5 TAOK1 MAPK signalling pathwayIUCQ T1 TAOK1 CDK12 ≥8 TAOK1 MAPK signalling pathwayTW0Z T1 TAOK3 RNFT2 ≥8 TAOK3 MAPK signalling pathwayWL6X M1 TBC1D3G NTF4 ≥6.5 NTF4 MAPK signalling pathwayHMXT T1 TEAD4 CACNA1C ≥8 CACNA1C MAPK signalling pathwayF11Y T1 TMEM104 PRKCA ≥8 PRKCA MAPK signalling pathwayQYXQ M1 TOP2A CACNB1 ≥6.5 CACNB1 MAPK signalling pathwayTX2S T1 TP53BP2 PLA2G4A ≥8 PLA2G4A MAPK signalling pathway7FNO M1 TSEN54 GRB2 ≥8 GRB2 MAPK signalling pathwayHMXT T1 TULP3 CACNA1C ≥8 CACNA1C MAPK signalling pathwayTW0Z T1 UCHL5 GADD45A ≥6.5 GADD45A MAPK signalling pathwaycfd2f24 USP32 PRKCA ≥8 PRKCA MAPK signalling pathway8MNH T1 UTP6 TAOK1 ≥8 TAOK1 MAPK signalling pathway
Continued on next page
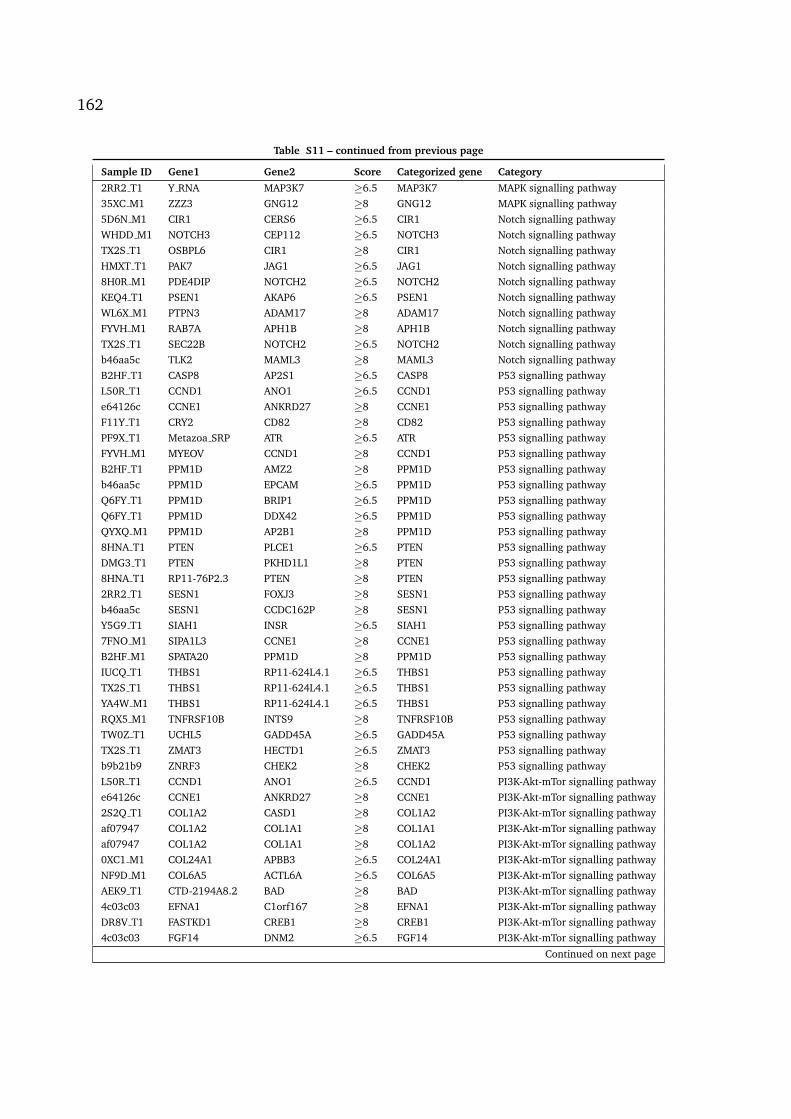
162
Table S11 – continued from previous page
Sample ID Gene1 Gene2 Score Categorized gene Category
2RR2 T1 Y RNA MAP3K7 ≥6.5 MAP3K7 MAPK signalling pathway35XC M1 ZZZ3 GNG12 ≥8 GNG12 MAPK signalling pathway5D6N M1 CIR1 CERS6 ≥6.5 CIR1 Notch signalling pathwayWHDD M1 NOTCH3 CEP112 ≥6.5 NOTCH3 Notch signalling pathwayTX2S T1 OSBPL6 CIR1 ≥8 CIR1 Notch signalling pathwayHMXT T1 PAK7 JAG1 ≥6.5 JAG1 Notch signalling pathway8H0R M1 PDE4DIP NOTCH2 ≥6.5 NOTCH2 Notch signalling pathwayKEQ4 T1 PSEN1 AKAP6 ≥6.5 PSEN1 Notch signalling pathwayWL6X M1 PTPN3 ADAM17 ≥8 ADAM17 Notch signalling pathwayFYVH M1 RAB7A APH1B ≥8 APH1B Notch signalling pathwayTX2S T1 SEC22B NOTCH2 ≥6.5 NOTCH2 Notch signalling pathwayb46aa5c TLK2 MAML3 ≥8 MAML3 Notch signalling pathwayB2HF T1 CASP8 AP2S1 ≥6.5 CASP8 P53 signalling pathwayL50R T1 CCND1 ANO1 ≥6.5 CCND1 P53 signalling pathwaye64126c CCNE1 ANKRD27 ≥8 CCNE1 P53 signalling pathwayF11Y T1 CRY2 CD82 ≥8 CD82 P53 signalling pathwayPF9X T1 Metazoa SRP ATR ≥6.5 ATR P53 signalling pathwayFYVH M1 MYEOV CCND1 ≥8 CCND1 P53 signalling pathwayB2HF T1 PPM1D AMZ2 ≥8 PPM1D P53 signalling pathwayb46aa5c PPM1D EPCAM ≥6.5 PPM1D P53 signalling pathwayQ6FY T1 PPM1D BRIP1 ≥6.5 PPM1D P53 signalling pathwayQ6FY T1 PPM1D DDX42 ≥6.5 PPM1D P53 signalling pathwayQYXQ M1 PPM1D AP2B1 ≥8 PPM1D P53 signalling pathway8HNA T1 PTEN PLCE1 ≥6.5 PTEN P53 signalling pathwayDMG3 T1 PTEN PKHD1L1 ≥8 PTEN P53 signalling pathway8HNA T1 RP11-76P2.3 PTEN ≥8 PTEN P53 signalling pathway2RR2 T1 SESN1 FOXJ3 ≥8 SESN1 P53 signalling pathwayb46aa5c SESN1 CCDC162P ≥8 SESN1 P53 signalling pathwayY5G9 T1 SIAH1 INSR ≥6.5 SIAH1 P53 signalling pathway7FNO M1 SIPA1L3 CCNE1 ≥8 CCNE1 P53 signalling pathwayB2HF M1 SPATA20 PPM1D ≥8 PPM1D P53 signalling pathwayIUCQ T1 THBS1 RP11-624L4.1 ≥6.5 THBS1 P53 signalling pathwayTX2S T1 THBS1 RP11-624L4.1 ≥6.5 THBS1 P53 signalling pathwayYA4W M1 THBS1 RP11-624L4.1 ≥6.5 THBS1 P53 signalling pathwayRQX5 M1 TNFRSF10B INTS9 ≥8 TNFRSF10B P53 signalling pathwayTW0Z T1 UCHL5 GADD45A ≥6.5 GADD45A P53 signalling pathwayTX2S T1 ZMAT3 HECTD1 ≥6.5 ZMAT3 P53 signalling pathwayb9b21b9 ZNRF3 CHEK2 ≥8 CHEK2 P53 signalling pathwayL50R T1 CCND1 ANO1 ≥6.5 CCND1 PI3K-Akt-mTor signalling pathwaye64126c CCNE1 ANKRD27 ≥8 CCNE1 PI3K-Akt-mTor signalling pathway2S2Q T1 COL1A2 CASD1 ≥8 COL1A2 PI3K-Akt-mTor signalling pathwayaf07947 COL1A2 COL1A1 ≥8 COL1A1 PI3K-Akt-mTor signalling pathwayaf07947 COL1A2 COL1A1 ≥8 COL1A2 PI3K-Akt-mTor signalling pathway0XC1 M1 COL24A1 APBB3 ≥6.5 COL24A1 PI3K-Akt-mTor signalling pathwayNF9D M1 COL6A5 ACTL6A ≥6.5 COL6A5 PI3K-Akt-mTor signalling pathwayAEK9 T1 CTD-2194A8.2 BAD ≥8 BAD PI3K-Akt-mTor signalling pathway4c03c03 EFNA1 C1orf167 ≥8 EFNA1 PI3K-Akt-mTor signalling pathwayDR8V T1 FASTKD1 CREB1 ≥8 CREB1 PI3K-Akt-mTor signalling pathway4c03c03 FGF14 DNM2 ≥6.5 FGF14 PI3K-Akt-mTor signalling pathway
Continued on next page
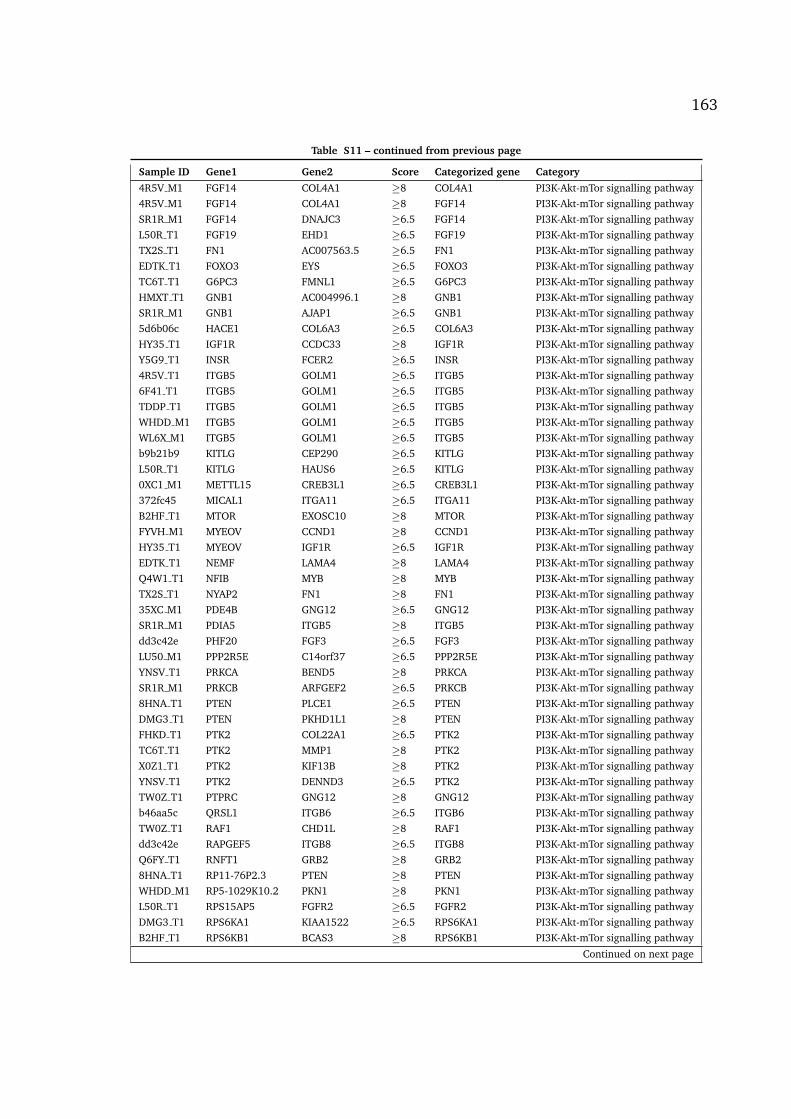
163
Table S11 – continued from previous page
Sample ID Gene1 Gene2 Score Categorized gene Category
4R5V M1 FGF14 COL4A1 ≥8 COL4A1 PI3K-Akt-mTor signalling pathway4R5V M1 FGF14 COL4A1 ≥8 FGF14 PI3K-Akt-mTor signalling pathwaySR1R M1 FGF14 DNAJC3 ≥6.5 FGF14 PI3K-Akt-mTor signalling pathwayL50R T1 FGF19 EHD1 ≥6.5 FGF19 PI3K-Akt-mTor signalling pathwayTX2S T1 FN1 AC007563.5 ≥6.5 FN1 PI3K-Akt-mTor signalling pathwayEDTK T1 FOXO3 EYS ≥6.5 FOXO3 PI3K-Akt-mTor signalling pathwayTC6T T1 G6PC3 FMNL1 ≥6.5 G6PC3 PI3K-Akt-mTor signalling pathwayHMXT T1 GNB1 AC004996.1 ≥8 GNB1 PI3K-Akt-mTor signalling pathwaySR1R M1 GNB1 AJAP1 ≥6.5 GNB1 PI3K-Akt-mTor signalling pathway5d6b06c HACE1 COL6A3 ≥6.5 COL6A3 PI3K-Akt-mTor signalling pathwayHY35 T1 IGF1R CCDC33 ≥8 IGF1R PI3K-Akt-mTor signalling pathwayY5G9 T1 INSR FCER2 ≥6.5 INSR PI3K-Akt-mTor signalling pathway4R5V T1 ITGB5 GOLM1 ≥6.5 ITGB5 PI3K-Akt-mTor signalling pathway6F41 T1 ITGB5 GOLM1 ≥6.5 ITGB5 PI3K-Akt-mTor signalling pathwayTDDP T1 ITGB5 GOLM1 ≥6.5 ITGB5 PI3K-Akt-mTor signalling pathwayWHDD M1 ITGB5 GOLM1 ≥6.5 ITGB5 PI3K-Akt-mTor signalling pathwayWL6X M1 ITGB5 GOLM1 ≥6.5 ITGB5 PI3K-Akt-mTor signalling pathwayb9b21b9 KITLG CEP290 ≥6.5 KITLG PI3K-Akt-mTor signalling pathwayL50R T1 KITLG HAUS6 ≥6.5 KITLG PI3K-Akt-mTor signalling pathway0XC1 M1 METTL15 CREB3L1 ≥6.5 CREB3L1 PI3K-Akt-mTor signalling pathway372fc45 MICAL1 ITGA11 ≥6.5 ITGA11 PI3K-Akt-mTor signalling pathwayB2HF T1 MTOR EXOSC10 ≥8 MTOR PI3K-Akt-mTor signalling pathwayFYVH M1 MYEOV CCND1 ≥8 CCND1 PI3K-Akt-mTor signalling pathwayHY35 T1 MYEOV IGF1R ≥6.5 IGF1R PI3K-Akt-mTor signalling pathwayEDTK T1 NEMF LAMA4 ≥8 LAMA4 PI3K-Akt-mTor signalling pathwayQ4W1 T1 NFIB MYB ≥8 MYB PI3K-Akt-mTor signalling pathwayTX2S T1 NYAP2 FN1 ≥8 FN1 PI3K-Akt-mTor signalling pathway35XC M1 PDE4B GNG12 ≥6.5 GNG12 PI3K-Akt-mTor signalling pathwaySR1R M1 PDIA5 ITGB5 ≥8 ITGB5 PI3K-Akt-mTor signalling pathwaydd3c42e PHF20 FGF3 ≥6.5 FGF3 PI3K-Akt-mTor signalling pathwayLU50 M1 PPP2R5E C14orf37 ≥6.5 PPP2R5E PI3K-Akt-mTor signalling pathwayYNSV T1 PRKCA BEND5 ≥8 PRKCA PI3K-Akt-mTor signalling pathwaySR1R M1 PRKCB ARFGEF2 ≥6.5 PRKCB PI3K-Akt-mTor signalling pathway8HNA T1 PTEN PLCE1 ≥6.5 PTEN PI3K-Akt-mTor signalling pathwayDMG3 T1 PTEN PKHD1L1 ≥8 PTEN PI3K-Akt-mTor signalling pathwayFHKD T1 PTK2 COL22A1 ≥6.5 PTK2 PI3K-Akt-mTor signalling pathwayTC6T T1 PTK2 MMP1 ≥8 PTK2 PI3K-Akt-mTor signalling pathwayX0Z1 T1 PTK2 KIF13B ≥8 PTK2 PI3K-Akt-mTor signalling pathwayYNSV T1 PTK2 DENND3 ≥6.5 PTK2 PI3K-Akt-mTor signalling pathwayTW0Z T1 PTPRC GNG12 ≥8 GNG12 PI3K-Akt-mTor signalling pathwayb46aa5c QRSL1 ITGB6 ≥6.5 ITGB6 PI3K-Akt-mTor signalling pathwayTW0Z T1 RAF1 CHD1L ≥8 RAF1 PI3K-Akt-mTor signalling pathwaydd3c42e RAPGEF5 ITGB8 ≥6.5 ITGB8 PI3K-Akt-mTor signalling pathwayQ6FY T1 RNFT1 GRB2 ≥8 GRB2 PI3K-Akt-mTor signalling pathway8HNA T1 RP11-76P2.3 PTEN ≥8 PTEN PI3K-Akt-mTor signalling pathwayWHDD M1 RP5-1029K10.2 PKN1 ≥8 PKN1 PI3K-Akt-mTor signalling pathwayL50R T1 RPS15AP5 FGFR2 ≥6.5 FGFR2 PI3K-Akt-mTor signalling pathwayDMG3 T1 RPS6KA1 KIAA1522 ≥6.5 RPS6KA1 PI3K-Akt-mTor signalling pathwayB2HF T1 RPS6KB1 BCAS3 ≥8 RPS6KB1 PI3K-Akt-mTor signalling pathway
Continued on next page

164
Table S11 – continued from previous page
Sample ID Gene1 Gene2 Score Categorized gene Category
JVRW M1 RPS6KB1 BAG4 ≥6.5 RPS6KB1 PI3K-Akt-mTor signalling pathwayQ6FY T1 RPS6KB1 CAMSAP2 ≥8 RPS6KB1 PI3K-Akt-mTor signalling pathwaycfd2f24 RPTOR DUS1L ≥8 RPTOR PI3K-Akt-mTor signalling pathwayLRU2 M1 RPTOR NF1 ≥6.5 RPTOR PI3K-Akt-mTor signalling pathway2S2Q T1 RRAGC MACF1 ≥6.5 RRAGC PI3K-Akt-mTor signalling pathwayAC72 T1 SEPT9 GRB2 ≥8 GRB2 PI3K-Akt-mTor signalling pathwayFYVH M1 SGCZ EIF4EBP1 ≥6.5 EIF4EBP1 PI3K-Akt-mTor signalling pathwayb9b21b9 SH2D4A KITLG ≥8 KITLG PI3K-Akt-mTor signalling pathwayHY35 T1 SHANK2 IGF1R ≥8 IGF1R PI3K-Akt-mTor signalling pathwayY5G9 T1 SIAH1 INSR ≥6.5 INSR PI3K-Akt-mTor signalling pathway7FNO M1 SIPA1L3 CCNE1 ≥8 CCNE1 PI3K-Akt-mTor signalling pathway231B T1 SKI PRKCZ ≥8 PRKCZ PI3K-Akt-mTor signalling pathwayb46aa5c SOS1 RP6-65G23.3 ≥8 SOS1 PI3K-Akt-mTor signalling pathwayTX2S T1 SOS1 ARFGEF2 ≥8 SOS1 PI3K-Akt-mTor signalling pathwayEDTK T1 SOS2 NGDN ≥8 SOS2 PI3K-Akt-mTor signalling pathwaycb6c764 TANC2 RPS6KB1 ≥8 RPS6KB1 PI3K-Akt-mTor signalling pathwayIUCQ T1 THBS1 RP11-624L4.1 ≥6.5 THBS1 PI3K-Akt-mTor signalling pathwayTX2S T1 THBS1 RP11-624L4.1 ≥6.5 THBS1 PI3K-Akt-mTor signalling pathwayYA4W M1 THBS1 RP11-624L4.1 ≥6.5 THBS1 PI3K-Akt-mTor signalling pathwayF11Y T1 TMEM104 PRKCA ≥8 PRKCA PI3K-Akt-mTor signalling pathwayb9b21b9 TMTC3 KITLG ≥8 KITLG PI3K-Akt-mTor signalling pathwaycfd2f24 TRIM37 RPS6KB1 ≥8 RPS6KB1 PI3K-Akt-mTor signalling pathway7FNO M1 TSEN54 GRB2 ≥8 GRB2 PI3K-Akt-mTor signalling pathway8MNH T1 TUBE1 LAMA4 ≥8 LAMA4 PI3K-Akt-mTor signalling pathwaycfd2f24 USP32 PRKCA ≥8 PRKCA PI3K-Akt-mTor signalling pathwayQ6FY T1 USP32 RPS6KB1 ≥8 RPS6KB1 PI3K-Akt-mTor signalling pathwayB2HF T1 VMP1 RPS6KB1 ≥8 RPS6KB1 PI3K-Akt-mTor signalling pathwayL50R T1 ZNF548 CREB5 ≥8 CREB5 PI3K-Akt-mTor signalling pathway35XC M1 ZZZ3 GNG12 ≥8 GNG12 PI3K-Akt-mTor signalling pathwayAEK9 T1 CTD-2194A8.2 BAD ≥8 BAD Ras signalling pathway4c03c03 EFNA1 C1orf167 ≥8 EFNA1 Ras signalling pathway4R5V T1 EXOC2 EFHC1 ≥6.5 EXOC2 Ras signalling pathway4c03c03 FGF14 DNM2 ≥6.5 FGF14 Ras signalling pathway4R5V M1 FGF14 COL4A1 ≥8 FGF14 Ras signalling pathwaySR1R M1 FGF14 DNAJC3 ≥6.5 FGF14 Ras signalling pathwayL50R T1 FGF19 EHD1 ≥6.5 FGF19 Ras signalling pathwayHMXT T1 GNB1 AC004996.1 ≥8 GNB1 Ras signalling pathwaySR1R M1 GNB1 AJAP1 ≥6.5 GNB1 Ras signalling pathwayD988 M1 HTR7 CYP7B1 ≥8 HTR7 Ras signalling pathwayHY35 T1 IGF1R CCDC33 ≥8 IGF1R Ras signalling pathwayY5G9 T1 INSR FCER2 ≥6.5 INSR Ras signalling pathwayb9b21b9 KITLG CEP290 ≥6.5 KITLG Ras signalling pathwayL50R T1 KITLG HAUS6 ≥6.5 KITLG Ras signalling pathwayTW0Z T1 KSR2 FBXO21 ≥6.5 KSR2 Ras signalling pathwayYNSV T1 MAPK8 FRMPD2 ≥6.5 MAPK8 Ras signalling pathwayTX2S T1 MFSD6 MAPK10 ≥8 MAPK10 Ras signalling pathwayHY35 T1 MYEOV IGF1R ≥6.5 IGF1R Ras signalling pathway2RR2 T1 NF1 GNA13 ≥8 NF1 Ras signalling pathwayNL3B T1 NPEPPS NF1 ≥8 NF1 Ras signalling pathway
Continued on next page

165
Table S11 – continued from previous page
Sample ID Gene1 Gene2 Score Categorized gene Category
HY35 T1 PAK1 C11orf49 ≥6.5 PAK1 Ras signalling pathwayTX2S T1 PAK1 CYP4Z1 ≥6.5 PAK1 Ras signalling pathwayZQC5 T1 PAK1 CPT1A ≥6.5 PAK1 Ras signalling pathwayZQC5 T1 PAK1 MTL5 ≥8 PAK1 Ras signalling pathwayHMXT T1 PAK7 JAG1 ≥6.5 PAK7 Ras signalling pathway35XC M1 PDE4B GNG12 ≥6.5 GNG12 Ras signalling pathwayWHDD M1 PGAM1P2 PAK1 ≥6.5 PAK1 Ras signalling pathwaydd3c42e PHF20 FGF3 ≥6.5 FGF3 Ras signalling pathwayY5G9 T1 PICALM MAPK10 ≥8 MAPK10 Ras signalling pathwayZS4T T1 PLA2G10 NDE1 ≥8 PLA2G10 Ras signalling pathwayTX2S T1 PLD1 JHDM1D ≥8 PLD1 Ras signalling pathwayL50R T1 PRKACB ATE1 ≥8 PRKACB Ras signalling pathwayYNSV T1 PRKCA BEND5 ≥8 PRKCA Ras signalling pathwaySR1R M1 PRKCB ARFGEF2 ≥6.5 PRKCB Ras signalling pathway8HNA T1 PTEN PLCE1 ≥6.5 PLCE1 Ras signalling pathwayTW0Z T1 PTPRC GNG12 ≥8 GNG12 Ras signalling pathwayHMXT T1 RAD51B PLCG2 ≥8 PLCG2 Ras signalling pathwayTW0Z T1 RAF1 CHD1L ≥8 RAF1 Ras signalling pathway4R5V M1 RALB AC062020.2 ≥8 RALB Ras signalling pathway8H0R M1 RAP1A PIGS ≥8 RAP1A Ras signalling pathwaydd3c42e RAPGEF5 ITGB8 ≥6.5 RAPGEF5 Ras signalling pathwayL50R T1 RASAL2 GATC ≥8 RASAL2 Ras signalling pathwayQ6FY T1 RNFT1 GRB2 ≥8 GRB2 Ras signalling pathwayL50R T1 RPS15AP5 FGFR2 ≥6.5 FGFR2 Ras signalling pathwayLRU2 M1 RPTOR NF1 ≥6.5 NF1 Ras signalling pathwaydd3c42e RUFY1 RAPGEF5 ≥6.5 RAPGEF5 Ras signalling pathwayAC72 T1 SEPT9 GRB2 ≥8 GRB2 Ras signalling pathwayb9b21b9 SH2D4A KITLG ≥8 KITLG Ras signalling pathwayHY35 T1 SHANK2 IGF1R ≥8 IGF1R Ras signalling pathwayY5G9 T1 SIAH1 INSR ≥6.5 INSR Ras signalling pathwayY5G9 T1 SMARCA4 PLA2G6 ≥8 PLA2G6 Ras signalling pathwayb46aa5c SOS1 RP6-65G23.3 ≥8 SOS1 Ras signalling pathwayTX2S T1 SOS1 ARFGEF2 ≥8 SOS1 Ras signalling pathwayEDTK T1 SOS2 NGDN ≥8 SOS2 Ras signalling pathwayT6Z1 M1 SPAG9 NF1 ≥6.5 NF1 Ras signalling pathway8MNH T1 STEAP1B RAPGEF5 ≥8 RAPGEF5 Ras signalling pathwayF11Y T1 TMEM104 PRKCA ≥8 PRKCA Ras signalling pathwayb9b21b9 TMTC3 KITLG ≥8 KITLG Ras signalling pathwayTX2S T1 TP53BP2 PLA2G4A ≥8 PLA2G4A Ras signalling pathway7FNO M1 TSEN54 GRB2 ≥8 GRB2 Ras signalling pathwaycfd2f24 USP32 PRKCA ≥8 PRKCA Ras signalling pathway35XC M1 ZZZ3 GNG12 ≥8 GNG12 Ras signalling pathwayB2HF T1 BCAS3 AC005682.8 ≥6.5 BCAS3 oncogene (UniProt)Q6FY T1 BCAS3 ABCA8 ≥8 BCAS3 oncogene (UniProt)QYXQ M1 BRIP1 BCAS3 ≥6.5 BCAS3 oncogene (UniProt)L50R T1 CCND1 ANO1 ≥6.5 CCND1 oncogene (UniProt)cfd2f24 CYTH1 ASPSCR1 ≥8 ASPSCR1 oncogene (UniProt)HMXT T1 DDX6 CTD-2216M2.1 ≥6.5 DDX6 oncogene (UniProt)L50R T1 EPS15 ABCA4 ≥8 EPS15 oncogene (UniProt)
Continued on next page

166
Table S11 – continued from previous page
Sample ID Gene1 Gene2 Score Categorized gene Category
HMXT T1 ETV6 BCL2L14 ≥6.5 ETV6 oncogene (UniProt)I4ZX T1 ETV6 ANKS1B ≥8 ETV6 oncogene (UniProt)EDTK T1 FOXO3 EYS ≥6.5 FOXO3 oncogene (UniProt)cfd2f24 FYN CDK12 ≥6.5 FYN oncogene (UniProt)NF9D M1 MECOM GOLIM4 ≥6.5 MECOM oncogene (UniProt)SR1R M1 MECOM EGFEM1P ≥8 MECOM oncogene (UniProt)Q6FY T1 MERTK C2orf15 ≥8 MERTK oncogene (UniProt)Y5G9 T1 MLLT1 CATSPERD ≥8 MLLT1 oncogene (UniProt)TW0Z T1 MSI2 BCAS3 ≥8 BCAS3 oncogene (UniProt)FYVH M1 MYEOV CCND1 ≥8 CCND1 oncogene (UniProt)FYVH M1 MYEOV CCND1 ≥8 MYEOV oncogene (UniProt)HY35 T1 MYEOV IGF1R ≥6.5 MYEOV oncogene (UniProt)b46aa5c NCOA1 ABCA10 ≥8 NCOA1 oncogene (UniProt)Q4W1 T1 NFIB MYB ≥8 MYB oncogene (UniProt)B2HF M1 NPLOC4 HLF ≥6.5 HLF oncogene (UniProt)B2HF T1 NPLOC4 HLF ≥6.5 HLF oncogene (UniProt)WL6X M1 PACSIN2 MKL1 ≥6.5 MKL1 oncogene (UniProt)SR1R M1 PBX1 CDC73 ≥8 PBX1 oncogene (UniProt)SR1R M1 PBX1 F11R ≥8 PBX1 oncogene (UniProt)dd3c42e PHF20 FGF3 ≥6.5 FGF3 oncogene (UniProt)Y5G9 T1 PICALM MAPK10 ≥8 PICALM oncogene (UniProt)HMXT T1 PLEKHM2 ETV6 ≥8 ETV6 oncogene (UniProt)T6Z1 M1 PNPO MLLT6 ≥8 MLLT6 oncogene (UniProt)YNSV T1 PRKCA BEND5 ≥8 PRKCA oncogene (UniProt)HMXT T1 PROCA1 ETV6 ≥8 ETV6 oncogene (UniProt)007M M1 PRRC2B NUP214 ≥8 NUP214 oncogene (UniProt)b46aa5c QRSL1 BCAS3 ≥8 BCAS3 oncogene (UniProt)TW0Z T1 RAF1 CHD1L ≥8 RAF1 oncogene (UniProt)8H0R M1 RARA NLK ≥8 RARA oncogene (UniProt)cfd2f24 RARA ABCA5 ≥8 RARA oncogene (UniProt)I4ZX T1 RARA LINC00365 ≥6.5 RARA oncogene (UniProt)I4ZX T1 RARA NBEA ≥6.5 RARA oncogene (UniProt)8HNA T1 RB1 ENOX1 ≥8 RB1 oncogene (UniProt)TX2S T1 RB1 FREM2 ≥8 RB1 oncogene (UniProt)86DK M1 RNF213 ENDOV ≥8 RNF213 oncogene (UniProt)f1ae704 RNF213 AC026188.1 ≥8 RNF213 oncogene (UniProt)Q6FY T1 RNF213 OGT ≥8 RNF213 oncogene (UniProt)TW0Z T1 RNPEP BCL9 ≥6.5 BCL9 oncogene (UniProt)Q6FY T1 RP11-101O21.1 BCAS3 ≥8 BCAS3 oncogene (UniProt)2S2Q T1 RP11-522N14.1 BCAS3 ≥8 BCAS3 oncogene (UniProt)L50R T1 RP3-486B10.1 MYEOV ≥8 MYEOV oncogene (UniProt)L50R T1 RPS15AP5 FGFR2 ≥6.5 FGFR2 oncogene (UniProt)B2HF T1 RPS6KB1 BCAS3 ≥8 BCAS3 oncogene (UniProt)2S2Q T1 RUNX1 PPM1H ≥6.5 RUNX1 oncogene (UniProt)b46aa5c RUNX1 CCDC58 ≥8 RUNX1 oncogene (UniProt)b46aa5c RUNX1 KPNA1 ≥8 RUNX1 oncogene (UniProt)HMXT T1 RUNX1 BRE ≥8 RUNX1 oncogene (UniProt)SR1R M1 RUNX1 FARSB ≥8 RUNX1 oncogene (UniProt)SR1R M1 RUNX1 MOGAT1 ≥6.5 RUNX1 oncogene (UniProt)
Continued on next page

167
Table S11 – continued from previous page
Sample ID Gene1 Gene2 Score Categorized gene Category
X0Z1 T1 RUNX1 AGPAT3 ≥6.5 RUNX1 oncogene (UniProt)HY35 T1 SEMA4B AKAP13 ≥6.5 AKAP13 oncogene (UniProt)4R5V M1 SH3GL1 LRBA ≥8 SH3GL1 oncogene (UniProt)cfd2f24 SKA2 RNF213 ≥6.5 RNF213 oncogene (UniProt)231B T1 SKI PRKCZ ≥8 SKI oncogene (UniProt)4R5V M1 SLC25A17 MKL1 ≥8 MKL1 oncogene (UniProt)Q6FY T1 SLC39A11 BCAS3 ≥8 BCAS3 oncogene (UniProt)46DP M1 SRC METTL2B ≥6.5 SRC oncogene (UniProt)HMXT T1 TAOK1 KAT6A ≥6.5 KAT6A oncogene (UniProt)QYXQ M1 TBC1D16 SPECC1 ≥6.5 SPECC1 oncogene (UniProt)DBBB M1 TFG GPR128 ≥8 TFG oncogene (UniProt)NF9D M1 TFG GPR128 ≥8 TFG oncogene (UniProt)Y5G9 T1 TFG GPR128 ≥8 TFG oncogene (UniProt)F11Y T1 TMEM104 PRKCA ≥8 PRKCA oncogene (UniProt)X0Z1 T1 TRAPPC10 ERG ≥8 ERG oncogene (UniProt)2RR2 T1 TRIM37 FLJ37644 ≥8 TRIM37 oncogene (UniProt)b9b21b9 TRIM37 MARCH10 ≥6.5 TRIM37 oncogene (UniProt)cfd2f24 TRIM37 LINC00511 ≥8 TRIM37 oncogene (UniProt)cfd2f24 TRIM37 RARA ≥6.5 RARA oncogene (UniProt)cfd2f24 TRIM37 RARA ≥6.5 TRIM37 oncogene (UniProt)cfd2f24 TRIM37 RPS6KB1 ≥8 TRIM37 oncogene (UniProt)cfd2f24 TRIM37 SNHG16 ≥8 TRIM37 oncogene (UniProt)JVRW M1 TRIM37 HOXB-AS3 ≥8 TRIM37 oncogene (UniProt)Q6FY T1 TRIM37 PPM1E ≥8 TRIM37 oncogene (UniProt)Q6FY T1 TRIM37 TBC1D7 ≥8 TRIM37 oncogene (UniProt)4R5V M1 TTC17 SS18 ≥8 SS18 oncogene (UniProt)Q6FY T1 TTYH2 BCAS3 ≥8 BCAS3 oncogene (UniProt)DR8V T1 UCP2 MYEOV ≥6.5 MYEOV oncogene (UniProt)B2HF M1 USP32 BCAS3 ≥8 BCAS3 oncogene (UniProt)B2HF T1 USP32 BCAS3 ≥8 BCAS3 oncogene (UniProt)cfd2f24 USP32 PRKCA ≥8 PRKCA oncogene (UniProt)cfd2f24 USP32 RARA ≥8 RARA oncogene (UniProt)JVRW M1 USP6 MIPEP ≥8 USP6 oncogene (UniProt)LU50 M1 USP6 RPAIN ≥8 USP6 oncogene (UniProt)cfd2f24 VMP1 TRIM37 ≥6.5 TRIM37 oncogene (UniProt)DMG3 M1 VPS8 SET ≥8 SET oncogene (UniProt)YNSV T1 WDR11 FAM157B ≥6.5 WDR11 oncogene (UniProt)YNSV T1 WDR11 FAM157C ≥6.5 WDR11 oncogene (UniProt)b9b21b9 WHSC1L1 RGS20 ≥8 WHSC1L1 oncogene (UniProt)2S2Q T1 WIF1 RNF213 ≥8 RNF213 oncogene (UniProt)TW0Z T1 ZFC3H1 TRIM37 ≥8 TRIM37 oncogene (UniProt)8H0R M1 ZNF346 NSD1 ≥8 NSD1 oncogene (UniProt)E65C M1 CYLD CNEP1R1 ≥6.5 CYLD gene ssuppressor (UniProt)51CU M1 DCP2 APC ≥8 APC gene ssuppressor (UniProt)4c03c03 EFNA1 C1orf167 ≥8 EFNA1 gene ssuppressor (UniProt)F7FD M1 FLCN BTC ≥8 FLCN gene ssuppressor (UniProt)HMXT T1 hsa-mir-4763 PDCD4 ≥6.5 PDCD4 gene ssuppressor (UniProt)TW0Z T1 IL12RB2 CDC73 ≥6.5 CDC73 gene ssuppressor (UniProt)HMXT T1 INPP5K DPH1 ≥6.5 DPH1 gene ssuppressor (UniProt)
Continued on next page

168
Table S11 – continued from previous page
Sample ID Gene1 Gene2 Score Categorized gene Category
8H0R M1 IVD BUB1B ≥8 BUB1B gene ssuppressor (UniProt)WL6X M1 MFHAS1 CHD9 ≥6.5 MFHAS1 gene ssuppressor (UniProt)WL6X M1 MFHAS1 GPT2 ≥8 MFHAS1 gene ssuppressor (UniProt)dd3c42e MTUS1 FAM86A ≥8 MTUS1 gene ssuppressor (UniProt)2RR2 T1 NF1 GNA13 ≥8 NF1 gene ssuppressor (UniProt)51CU M1 NF2 MTMR3 ≥8 NF2 gene ssuppressor (UniProt)NL3B T1 NPEPPS NF1 ≥8 NF1 gene ssuppressor (UniProt)SR1R M1 PBX1 CDC73 ≥8 CDC73 gene ssuppressor (UniProt)HMXT T1 PDCD4 CITF22-92A6.1 ≥6.5 PDCD4 gene ssuppressor (UniProt)8HNA T1 PTEN PLCE1 ≥6.5 PTEN gene ssuppressor (UniProt)DMG3 T1 PTEN PKHD1L1 ≥8 PTEN gene ssuppressor (UniProt)8H0R M1 RAP1A PIGS ≥8 RAP1A gene ssuppressor (UniProt)dd3c42e RB1CC1 EFCAB4B ≥6.5 RB1CC1 gene ssuppressor (UniProt)HMXT T1 RERE ERRFI1 ≥8 ERRFI1 gene ssuppressor (UniProt)3fcb2f6 RP11-1407O15.2 BRMS1 ≥8 BRMS1 gene ssuppressor (UniProt)YNSV T1 RP11-330L19.4 BUB1B ≥6.5 BUB1B gene ssuppressor (UniProt)8HNA T1 RP11-76P2.3 PTEN ≥8 PTEN gene ssuppressor (UniProt)dd3c42e RP11-93K22.11 MTUS1 ≥6.5 MTUS1 gene ssuppressor (UniProt)QYXQ M1 RP3-453D15.1 FRK ≥6.5 FRK gene ssuppressor (UniProt)LRU2 M1 RPTOR NF1 ≥6.5 NF1 gene ssuppressor (UniProt)T6Z1 T1 SASH1 PCMT1 ≥8 SASH1 gene ssuppressor (UniProt)T6Z1 M1 SPAG9 NF1 ≥6.5 NF1 gene ssuppressor (UniProt)TW0Z T1 UFL1 AIM1 ≥8 UFL1 gene ssuppressor (UniProt)YA4W M1 ZMYND11 CSMD3 ≥8 ZMYND11 gene ssuppressor (UniProt)46DP M1 ZNF595 PINX1 ≥8 PINX1 gene ssuppressor (UniProt)b9b21b9 ZNRF3 CHEK2 ≥8 CHEK2 gene ssuppressor (UniProt)AEK9 T1 ZUFSP MTUS1 ≥6.5 MTUS1 gene ssuppressor (UniProt)
Note: The order of fusion partner 5′ and 3′ is ignored to simplify comparison.

169
Table S12: Mutations of CYP, SULT and UGT family genes.
Gene Sample ID Chromosome Position Reference Alternative
CYP11B2 E65C M1 8 143995706 C TCYP21A2 DBBB M1 6 32007327 A GCYP24A1 TM97 T1 20 52775638 G CCYP26C1 E65C M1 10 94821792 G CCYP26C1 T2VO M1 10 94828310 G CCYP26C1 0E5B T1 10 94828310 G CCYP27A1 b9b21b9 2 219646928 G CCYP2C8 ZS4T T1 10 96800708 T ACYP2R1 9HTD T1 11 14900848 T ACYP2U1 E65C M1 4 108853211 G CCYP3A5 E65C M1 7 99264265 C GCYP51A1 EDTK T1 7 91743002 G ASULT1A1 E65C M1 16 28619801 G ASULT1C4 8HNA T1 2 108999642 G TUGT1A7 3b8237c 2 234590789 C TUGT2B17 4R5V M1 4 69431337 C TUGT2B7 AC72 T1 4 69964380 T A
“ T1” indicates primary tumors and the remaining are refractory tumors.

170
Bibliography
[1] Bert Vogelstein and Kenneth W Kinzler. The multistep nature of cancer. Trends in genetics,
9(4):138–141, 1993. 1.1
[2] Carlo M Croce. Oncogenes and cancer. New England Journal of Medicine, 358(5):502–511,
2008. 1.1
[3] Felix Mitelman, Bertil Johansson, and Fredrik Mertens. The impact of translocations and
gene fusions on cancer causation. Nature Reviews Cancer, 7(4):233–245, 2007. 1.1
[4] Fredrik Mertens, Bertil Johansson, Thoas Fioretos, and Felix Mitelman. The emerging
complexity of gene fusions in cancer. Nature Reviews Cancer, 15(6):371–381, 2015. 1.1,
1.4, 1.7, 1.3, 1.4, 1.6, 4.2
[5] Cancer Genome Atlas Network et al. Comprehensive molecular portraits of human breast
tumours. Nature, 490(7418):61–70, 2012. 1.2
[6] Weiyi Toy, Yang Shen, Helen Won, Bradley Green, Rita A Sakr, Marie Will, Zhiqiang Li,
Kinisha Gala, Sean Fanning, Tari A King, et al. ESR1 ligand-binding domain mutations in
hormone-resistant breast cancer. Nature genetics, 45(12):1439–1445, 2013. 1.2, 1.2, 1.2,
1.6
[7] Dan R Robinson, Yi-Mi Wu, Pankaj Vats, Fengyun Su, Robert J Lonigro, Xuhong Cao,
Shanker Kalyana-Sundaram, Rui Wang, Yu Ning, Lynda Hodges, et al. Activating ESR1
mutations in hormone-resistant metastatic breast cancer. Nature genetics, 45(12):1446–
1451, 2013. 1.2, 1.2, 1.6, 3.1.2, 4.3.2, 4.3.3
[8] William D Foulkes, Ian E Smith, and Jorge S Reis-Filho. Triple-negative breast cancer. New
England journal of medicine, 363(20):1938–1948, 2010. 1.2
[9] Steven A Narod. Breast cancer in young women. Nature reviews Clinical oncology, 9(8):460–
470, 2012. 1.2
171

172 BIBLIOGRAPHY
[10] Aron Goldhirsch, Eric P Winer, AS Coates, RD Gelber, Martine Piccart-Gebhart, B Thurli-
mann, H-J Senn, Kathy S Albain, Fabrice Andre, Jonas Bergh, et al. Personalizing the
treatment of women with early breast cancer: highlights of the St Gallen International
Expert Consensus on the Primary Therapy of Early Breast Cancer 2013. Annals of oncology,
24(9):2206–2223, 2013. 1.2
[11] Christina Curtis, Sohrab P Shah, Suet-Feung Chin, Gulisa Turashvili, Oscar M Rueda, Mark
J Dunning, Doug Speed, Andy G Lynch, Shamith Samarajiwa, Yinyin Yuan, et al. The
genomic and transcriptomic architecture of 2,000 breast tumours reveals novel subgroups.
Nature, 486(7403):346–352, 2012. 1.2
[12] Shantanu Banerji, Kristian Cibulskis, Claudia Rangel-Escareno, Kristin K Brown, Scott L
Carter, Abbie M Frederick, Michael S Lawrence, Andrey Y Sivachenko, Carrie Sougnez,
Lihua Zou, et al. Sequence analysis of mutations and translocations across breast cancer
subtypes. Nature, 486(7403):405–409, 2012. 1.2, 1.2, 1.4
[13] Matthew J Ellis, Li Ding, Dong Shen, Jingqin Luo, Vera J Suman, John W Wallis, Brian A Van
Tine, Jeremy Hoog, Reece J Goiffon, Theodore C Goldstein, et al. Whole-genome analysis
informs breast cancer response to aromatase inhibition. Nature, 486(7403):353–360,
2012. 1.2
[14] Michael S Lawrence, Petar Stojanov, Craig H Mermel, James T Robinson, Levi A Garraway,
Todd R Golub, Matthew Meyerson, Stacey B Gabriel, Eric S Lander, and Gad Getz. Discovery
and saturation analysis of cancer genes across 21 tumour types. Nature, 505(7484):495–
501, 2014. 1.2, 3.1.2
[15] Philip J Stephens, Patrick S Tarpey, Helen Davies, Peter Van Loo, Chris Greenman, David
C Wedge, Serena Nik-Zainal, Sancha Martin, Ignacio Varela, Graham R Bignell, et al.
The landscape of cancer genes and mutational processes in breast cancer. Nature,
486(7403):400–404, 2012. 1.2
[16] Kornelia Polyak and Otto Metzger Filho. Snapshot: Breast cancer. Cancer Cell, 22(4):562 –
562.e1, 2012. 1.1
[17] Steffi Oesterreich and Nancy E Davidson. The search for ESR1 mutations in breast cancer.
Nature genetics, 45(12):1415–1416, 2013. 1.3
[18] Shuzhen Liu, Judy-Anne W Chapman, Margot J Burnell, Mark N Levine, Kathleen I
Pritchard, Timothy J Whelan, Hope S Rugo, Kathy S Albain, Edith A Perez, Shakeel
Virk, et al. Prognostic and predictive investigation of PAM50 intrinsic subtypes in the

BIBLIOGRAPHY 173
NCIC CTG MA. 21 phase III chemotherapy trial. Breast cancer research and treatment,
149(2):439–448, 2015. 1.2
[19] Joel S Parker, Michael Mullins, Maggie CU Cheang, Samuel Leung, David Voduc, Tammi
Vickery, Sherri Davies, Christiane Fauron, Xiaping He, Zhiyuan Hu, et al. Supervised
risk predictor of breast cancer based on intrinsic subtypes. Journal of clinical oncology,
27(8):1160–1167, 2009. 1.2
[20] Soonmyung Paik, Steven Shak, Gong Tang, Chungyeul Kim, Joffre Baker, Maureen Cronin,
Frederick L Baehner, Michael G Walker, Drew Watson, Taesung Park, et al. A multigene
assay to predict recurrence of tamoxifen-treated, node-negative breast cancer. New
England Journal of Medicine, 351(27):2817–2826, 2004. 1.2
[21] Soonmyung Paik, Gong Tang, Steven Shak, Chungyeul Kim, Joffre Baker, Wanseop Kim,
Maureen Cronin, Frederick L Baehner, Drew Watson, John Bryant, et al. Gene expression
and benefit of chemotherapy in women with node-negative, estrogen receptor–positive
breast cancer. Journal of clinical oncology, 24(23):3726–3734, 2006. 1.2
[22] Laura J Van’t Veer, Hongyue Dai, Marc J Van De Vijver, Yudong D He, Augustinus AM
Hart, Mao Mao, Hans L Peterse, Karin van der Kooy, Matthew J Marton, Anke T Witteveen,
et al. Gene expression profiling predicts clinical outcome of breast cancer. nature,
415(6871):530–536, 2002. 1.2
[23] Laura J van’t Veer, Soonmyung Paik, and Daniel F Hayes. Gene expression profiling of
breast cancer: a new tumor marker. Journal of clinical oncology, 23(8):1631–1635, 2005.
1.2
[24] Christos Sotiriou and Lajos Pusztai. Gene-expression signatures in breast cancer. New
England Journal of Medicine, 360(8):790–800, 2009. 1.2
[25] H Raza Ali, Oscar M Rueda, Suet-Feung Chin, Christina Curtis, Mark J Dunning, SAJR
Aparicio, and Carlos Caldas. Genome-driven integrated classification of breast cancer
validated in over 7,500 samples. Genome Biol, 15(8):431, 2014. 1.2
[26] Minju Ha and V Narry Kim. Regulation of microrna biogenesis. Nature reviews Molecular
cell biology, 15(8):509–524, 2014. 1.2
[27] Eleni van Schooneveld, Hans Wildiers, Ignace Vergote, Peter B Vermeulen, Luc Y Dirix, and
Steven J Van Laere. Dysregulation of microRNAs in breast cancer and their potential role
as prognostic and predictive biomarkers in patient management. Breast Cancer Research,
17(1):21, 2015. 1.2

174 BIBLIOGRAPHY
[28] Li Ma, Julie Teruya-Feldstein, and Robert A Weinberg. Tumour invasion and metastasis
initiated by microRNA-10b in breast cancer. Nature, 449(7163):682–688, 2007. 1.2
[29] Galina Gabriely, Nadiya M Teplyuk, and Anna M Krichevsky. Context effect: microRNA-10b
in cancer cell proliferation, spread and death. Autophagy, 7(11):1384–1386, 2011. 1.2
[30] Heidi Dvinge, Anna Git, Stefan Graf, Mali Salmon-Divon, Christina Curtis, Andrea Sot-
toriva, Yongjun Zhao, Martin Hirst, Javier Armisen, Eric A Miska, et al. The shaping
and functional consequences of the microRNA landscape in breast cancer. Nature,
497(7449):378–382, 2013. 1.2
[31] Tatiana Borodina, James Adjaye, and Marc Sultan. A strand-specific library preparation
protocol for RNA sequencing. Methods Enzymol, 500:79–98, 2011. 1.2, 2.1
[32] Marc Sultan, Simon Dokel, Vyacheslav Amstislavskiy, Daniela Wuttig, Holger Sultmann,
Hans Lehrach, and Marie-Laure Yaspo. A simple strand-specific RNA-Seq library prepara-
tion protocol combining the Illumina TruSeq RNA and the dUTP methods. Biochemical
and biophysical research communications, 422(4):643–646, 2012. 1.2, 2.1
[33] O Alejandro Balbin, Rohit Malik, Saravana M Dhanasekaran, John R Prensner, Xuhong
Cao, Yi-Mi Wu, Dan Robinson, Rui Wang, Guoan Chen, David G Beer, et al. The landscape
of antisense gene expression in human cancers. Genome research, 25(7):1068–1079, 2015.
1.2
[34] Douglas L Black. Mechanisms of alternative pre-messenger RNA splicing. Annual review of
biochemistry, 72(1):291–336, 2003. 1.2
[35] Jeyanthy Eswaran, Anelia Horvath, Sucheta Godbole, Sirigiri Divijendra Reddy, Prakriti
Mudvari, Kazufumi Ohshiro, Dinesh Cyanam, Sujit Nair, Suzanne AW Fuqua, Kornelia
Polyak, et al. RNA sequencing of cancer reveals novel splicing alterations. Scientific reports,
3, 2013. 1.2
[36] Dimitrios Zardavas, Jose Baselga, and Martine Piccart. Emerging targeted agents in
metastatic breast cancer. Nature Reviews Clinical Oncology, 10(4):191–210, 2013. 1.2, 1.4
[37] Marta Persson, Ywonne Andren, Joachim Mark, Hugo M Horlings, Fredrik Persson, and
Goran Stenman. Recurrent fusion of MYB and NFIB transcription factor genes in carci-
nomas of the breast and head and neck. Proceedings of the National Academy of Sciences,
106(44):18740–18744, 2009. 1.2, 3.3.7.16, 3.17
[38] Marick Lae, Paul Freneaux, Xavier Sastre-Garau, Olfa Chouchane, Brigitte Sigal-Zafrani,
and Anne Vincent-Salomon. Secretory breast carcinomas with ETV6-NTRK3 fusion gene

BIBLIOGRAPHY 175
belong to the basal-like carcinoma spectrum. Modern Pathology, 22(2):291–298, 2009.
1.2
[39] Dan R Robinson, Shanker Kalyana-Sundaram, Yi-Mi Wu, Sunita Shankar, Xuhong Cao,
Bushra Ateeq, Irfan A Asangani, Matthew Iyer, Christopher A Maher, Catherine S Grasso,
et al. Functionally recurrent rearrangements of the MAST kinase and Notch gene families
in breast cancer. Nature medicine, 17(12):1646–1651, 2011. 1.2, 1.6, 3.3.7.4, 4.3.2
[40] Jamunarani Veeraraghavan, Ying Tan, Xi-Xi Cao, Jin Ah Kim, Xian Wang, Gary C Chamness,
Sourindra N Maiti, Laurence JN Cooper, Dean P Edwards, Alejandro Contreras, et al.
Recurrent ESR1–CCDC170 rearrangements in an aggressive subset of oestrogen receptor-
positive breast cancers. Nature communications, 5, 2014. 1.2, 3.3.7.6, 4.3.3
[41] Juan-Miguel Mosquera, Sonal Varma, Chantal Pauli, Theresa Y MacDonald, Jossie J
Yashinskie, Zsuzsanna Varga, Andrea Sboner, Holger Moch, Mark A Rubin, and Sandra J
Shin. MAGI3-AKT3 fusion in breast cancer amended. Nature, 520(7547):E11–E12, 2015.
1.2
[42] Francesco Abate, Sakellarios Zairis, Elisa Ficarra, Andrea Acquaviva, Chris H Wiggins,
Veronique Frattini, Anna Lasorella, Antonio Iavarone, Giorgio Inghirami, and Raul
Rabadan. Pegasus: a comprehensive annotation and prediction tool for detection of
driver gene fusions in cancer. BMC systems biology, 8(1):97, 2014. 1.3, 1.3, 1.6
[43] Thomas Helleday, Saeed Eshtad, and Serena Nik-Zainal. Mechanisms underlying mu-
tational signatures in human cancers. Nature Reviews Genetics, 15(9):585–598, 2014.
1.3
[44] Karin G Hermans, Ronald van Marion, Herman van Dekken, Guido Jenster, Wytske M van
Weerden, and Jan Trapman. TMPRSS2: ERG fusion by translocation or interstitial deletion
is highly relevant in androgen-dependent prostate cancer, but is bypassed in late-stage
androgen receptor–negative prostate cancer. Cancer research, 66(22):10658–10663, 2006.
1.3
[45] Sven Perner, Francesca Demichelis, Rameen Beroukhim, Folke H Schmidt, Juan-Miguel
Mosquera, Sunita Setlur, Joelle Tchinda, Scott A Tomlins, Matthias D Hofer, Kenneth
G Pienta, et al. TMPRSS2: ERG fusion-associated deletions provide insight into the
heterogeneity of prostate cancer. Cancer research, 66(17):8337–8341, 2006. 1.3
[46] Sameer Jhavar, Alison Reid, Jeremy Clark, Zsofia Kote-Jarai, Timothy Christmas, Alan
Thompson, Christopher Woodhouse, Christopher Ogden, Cyril Fisher, Cathy Corbishley, et
al. Detection of TMPRSS2-ERG translocations in human prostate cancer by expression

176 BIBLIOGRAPHY
profiling using GeneChip Human Exon 1.0 ST arrays. The Journal of Molecular Diagnostics,
10(1):50–57, 2008. 1.3
[47] Anthony JF Griffiths, Susan R Wessler, Richard C Suzuki, Lewontin, William M Gelbart,
David T, Jeffrey H Miller, et al. An introduction to genetic analysis. 8th edition, 2005. 1.5
[48] Yuesheng Jin, Fredrik Mertens, Carl-Magnus Kullendorff, et al. Fusion of the tumor-
suppressor gene CHEK2 and the gene for the regulatory subunit B of protein phosphatase
2 PPP2R2A in childhood teratoma. Neoplasia, 8(5):413–418, 2006. 1.3
[49] Peter J Campbell, Philip J Stephens, Erin D Pleasance, Sarah O’Meara, Heng Li, Thomas
Santarius, Lucy A Stebbings, Catherine Leroy, Sarah Edkins, Claire Hardy, et al. Identifi-
cation of somatically acquired rearrangements in cancer using genome-wide massively
parallel paired-end sequencing. Nature genetics, 40(6):722–729, 2008. 1.4
[50] Andrew McPherson, Fereydoun Hormozdiari, Abdalnasser Zayed, Ryan Giuliany, Gavin Ha,
Mark GF Sun, Malachi Griffith, Alireza Heravi Moussavi, Janine Senz, Nataliya Melnyk, et
al. deFuse: an algorithm for gene fusion discovery in tumor RNA-Seq data. PLoS Comput
Biol. 1.4, 1.1, 1.5, 1.9, 1.10, 1.11, 2.2.3, 3.2.3
[51] Somasekar Seshagiri, Eric W Stawiski, Steffen Durinck, Zora Modrusan, Elaine E Storm,
Caitlin B Conboy, Subhra Chaudhuri, Yinghui Guan, Vasantharajan Janakiraman, Bijay S
Jaiswal, et al. Recurrent R-spondin fusions in colon cancer. Nature, 488(7413):660–664,
2012. 1.4
[52] Christian Steidl, Sohrab P Shah, Bruce W Woolcock, Lixin Rui, Masahiro Kawahara, Pedro
Farinha, Nathalie A Johnson, Yongjun Zhao, Adele Telenius, Susana Ben Neriah, et al.
MHC class II transactivator CIITA is a recurrent gene fusion partner in lymphoid cancers.
Nature, 471(7338):377–381, 2011. 1.4, 2.3
[53] Joachim Weischenfeldt, Ronald Simon, Lars Feuerbach, Karin Schlangen, Dieter Weichen-
han, Sarah Minner, Daniela Wuttig, Hans-Jorg Warnatz, Henning Stehr, Tobias Rausch, et
al. Integrative genomic analyses reveal an androgen-driven somatic alteration landscape
in early-onset prostate cancer. Cancer cell, 23(2):159–170, 2013. 1.4, 3.3.2, 3.8
[54] Julio C Ricarte-Filho, Sheng Li, Maria ER Garcia-Rendueles, Cristina Montero-Conde,
Francesca Voza, Jeffrey A Knauf, Adriana Heguy, Agnes Viale, Tetyana Bogdanova, Geral-
dine A Thomas, et al. Identification of kinase fusion oncogenes in post-Chernobyl radiation-
induced thyroid cancers. The Journal of clinical investigation, 123(11):4935, 2013. 1.4,
3.2

BIBLIOGRAPHY 177
[55] Zhao-Shi Bao, Hui-Min Chen, Ming-Yu Yang, Chuan-Bao Zhang, Kai Yu, Wan-Lu Ye, Bo-
Qiang Hu, Wei Yan, Wei Zhang, Johnny Akers, et al. RNA-seq of 272 gliomas revealed
a novel, recurrent PTPRZ1-MET fusion transcript in secondary glioblastomas. Genome
research, 24(11):1765–1773, 2014. 1.4, 3.2
[56] Henrik Lilljebjorn, Helena Agerstam, Christina Orsmark Pietras, Marianne Rissler, Hans
Ehrencrona, L Nilsson, Johan Richter, and Thoas Fioretos. RNA-seq identifies clinically
relevant fusion genes in leukemia including a novel MEF2D/CSF1R fusion responsive to
imatinib. Leukemia, 28(4):977–979, 2014. 1.4
[57] Cancer Genome Atlas Research Network et al. Comprehensive molecular characterization
of clear cell renal cell carcinoma. Nature, 499(7456):43–49, 2013. 1.4, 2.3
[58] Saravana M Dhanasekaran, O Alejandro Balbin, Guoan Chen, Ernest Nadal, Shanker
Kalyana-Sundaram, Jincheng Pan, Brendan Veeneman, Xuhong Cao, Rohit Malik, Pankaj
Vats, et al. Transcriptome meta-analysis of lung cancer reveals recurrent aberrations in
NRG1 and Hippo pathway genes. Nature communications, 5, 2014. 1.4
[59] Juliann Chmielecki, Aimee M Crago, Mara Rosenberg, Rachael O’Connor, Sarah R Walker,
Lauren Ambrogio, Daniel Auclair, Aaron McKenna, Michael C Heinrich, David A Frank, et
al. Whole-exome sequencing identifies a recurrent NAB2-STAT6 fusion in solitary fibrous
tumors. Nature genetics, 45(2):131–132, 2013. 1.4
[60] Daehwan Kim and Steven L Salzberg. TopHat-Fusion: an algorithm for discovery of novel
fusion transcripts. Genome Biol, 12(8):R72, 2011. 1.1
[61] Marcus Kinsella, Olivier Harismendy, Masakazu Nakano, Kelly A Frazer, and Vineet Bafna.
Sensitive gene fusion detection using ambiguously mapping RNA-Seq read pairs. Bioinfor-
matics, 27(8):1068–1075, 2011. 1.1
[62] Yang Li, Jeremy Chien, David I Smith, and Jian Ma. FusionHunter: identifying fusion
transcripts in cancer using paired-end RNA-seq. Bioinformatics, 27(12):1708–1710, 2011.
1.1
[63] Andrea Sboner, Lukas Habegger, Dorothee Pflueger, Stephane Terry, David Z Chen, Joel
S Rozowsky, Ashutosh K Tewari, Naoki Kitabayashi, Benjamin J Moss, Mark S Chee, et
al. FusionSeq: a modular framework for finding gene fusions by analyzing paired-end
RNA-sequencing data. Genome Biol, 11(10):R104, 2010. 1.1
[64] Richard W Francis, Katherine Thompson-Wicking, Kim W Carter, Denise Anderson, Ursula
R Kees, and Alex H Beesley. FusionFinder: a software tool to identify expressed gene
fusion candidates from RNA-Seq data. PloS one, 7(6):e39987, 2012. 1.1

178 BIBLIOGRAPHY
[65] Huanying Ge, Kejun Liu, Todd Juan, Fang Fang, Matthew Newman, and Wolfgang Hoeck.
FusionMap: detecting fusion genes from next-generation sequencing data at base-pair
resolution. Bioinformatics, 27(14):1922–1928, 2011. 1.1, 2.2.3
[66] Wenlong Jia, Kunlong Qiu, Minghui He, Pengfei Song, Quan Zhou, Feng Zhou, Yuan Yu,
Dandan Zhu, Michael L Nickerson, Shengqing Wan, et al. SOAPfuse: an algorithm for
identifying fusion transcripts from paired-end RNA-Seq data. Genome Biol, 14:R12, 2013.
1.1, 2.2.3
[67] Matthew K Iyer, Arul M Chinnaiyan, and Christopher A Maher. ChimeraScan: a tool for
identifying chimeric transcription in sequencing data. Bioinformatics, 27(20):2903–2904,
2011. 1.1
[68] Ken Chen, John W Wallis, Cyriac Kandoth, Joelle M Kalicki, Karen L Mungall, Andrew J
Mungall, Steven J Jones, Marco A Marra, Timothy J Ley, Elaine R Mardis, et al. BreakFusion:
targeted assembly-based identification of gene fusions in whole transcriptome paired-end
sequencing data. Bioinformatics, 28(14):1923–1924, 2012. 1.1
[69] Yan W Asmann, Asif Hossain, Brian M Necela, Sumit Middha, Krishna R Kalari, Zhifu
Sun, High-Seng Chai, David W Williamson, Derek Radisky, Gary P Schroth, et al. A novel
bioinformatics pipeline for identification and characterization of fusion transcripts in
breast cancer and normal cell lines. Nucleic acids research, 39(15):e100–e100, 2011. 1.1
[70] Rocco Piazza, Alessandra Pirola, Roberta Spinelli, Simona Valletta, Sara Redaelli, Vera
Magistroni, and Carlo Gambacorti-Passerini. FusionAnalyser: a new graphical, event-
driven tool for fusion rearrangements discovery. Nucleic acids research, page gks394, 2012.
1.1
[71] Wandaliz Torres-Garcıa, Siyuan Zheng, Andrey Sivachenko, Rahulsimham Vegesna,
Qianghu Wang, Rong Yao, Michael F Berger, John N Weinstein, Gad Getz, and Roel GW
Verhaak. PRADA: pipeline for RNA sequencing data analysis. Bioinformatics, 30(15):2224–
2226, 2014. 1.1, 1.4, 2.3
[72] K Yoshihara, Q Wang, W Torres-Garcia, S Zheng, R Vegesna, H Kim, and RGW Verhaak.
The landscape and therapeutic relevance of cancer-associated transcript fusions. Oncogene,
2014. 1.4, 1.2, 1.8, 3.2.5, 4.3.3
[73] Matteo Carrara, Marco Beccuti, Fulvio Lazzarato, Federica Cavallo, Francesca Cordero,
Susanna Donatelli, and Raffaele A Calogero. State-of-the-art fusion-finder algorithms
sensitivity and specificity. BioMed research international, 2013, 2013. 1.4

BIBLIOGRAPHY 179
[74] Ben Langmead, Cole Trapnell, Mihai Pop, and Steven L Salzberg. Ultrafast and memory-
efficient alignment of short DNA sequences to the human genome. Genome Biol, 10(3):R25,
2009. 1.5
[75] Jianmin Wang, Charles G Mullighan, John Easton, Stefan Roberts, Sue L Heatley, Jing
Ma, Michael C Rusch, Ken Chen, Christopher C Harris, Li Ding, et al. CREST maps
somatic structural variation in cancer genomes with base-pair resolution. Nature methods,
8(8):652–654, 2011. 2.2.1
[76] Tobias Rausch, Thomas Zichner, Andreas Schlattl, Adrian M Stutz, Vladimir Benes, and
Jan O Korbel. DELLY: structural variant discovery by integrated paired-end and split-read
analysis. Bioinformatics, 28(18):i333–i339, 2012. 2.2.1
[77] Heng Li and Richard Durbin. Fast and accurate long-read alignment with Burrows-Wheeler
transform. Bioinformatics, 26(5):589–595, March 2010. 2.2.2
[78] Heng Li, Bob Handsaker, Alec Wysoker, Tim Fennell, Jue Ruan, Nils Homer, and Gabor
Marth et al. The Sequence Alignment/Map (SAM) Format and SAMtools. Bioinformatics,
25(16):2078–2079, Aug 2009. 2.2.2
[79] David TW Jones, Natalie Jager, Marcel Kool, Thomas Zichner, Barbara Hutter, Marc Sultan,
Yoon-Jae Cho, Trevor J Pugh, Volker Hovestadt, Adrian M Stutz, et al. Dissecting the
genomic complexity underlying medulloblastoma. Nature, 488(7409):100–105, 2012.
2.2.2
[80] Daniel C Koboldt, Qunyuan Zhang, David E Larson, Dong Shen, Michael D McLellan, Ling
Lin, Christopher A Miller, Elaine R Mardis, Li Ding, and Richard K Wilson. VarScan 2:
somatic mutation and copy number alteration discovery in cancer by exome sequencing.
Genome research, 22(3):568–576, 2012. 2.2.2
[81] Andy Rimmer, Hang Phan, Iain Mathieson, Zamin Iqbal, Stephen RF Twigg, Andrew OM
Wilkie, Gil McVean, Gerton Lunter, WGS500 Consortium, et al. Integrating mapping-
, assembly-and haplotype-based approaches for calling variants in clinical sequencing
applications. Nature genetics, 46(8):912–918, 2014. 2.2.2
[82] David S DeLuca, Joshua Z Levin, Andrey Sivachenko, Timothy Fennell, Marc-Danie Nazaire,
Chris Williams, Michael Reich, Wendy Winckler, and Gad Getz. RNA-SeQC: RNA-seq
metrics for quality control and process optimization. Bioinformatics, 28(11):1530–1532,
2012. 2.2.3
180 BIBLIOGRAPHY
[83] Alexander Dobin, Carrie A Davis, Felix Schlesinger, Jorg Drenkow, Chris Zaleski, Sonali
Jha, Philippe Batut, Mark Chaisson, and Thomas R Gingeras. STAR: ultrafast universal
RNA-seq aligner. Bioinformatics, 29(1):15–21, 2013. 2.2.3
[84] Simon Anders, Paul Theodor Pyl, and Wolfgang Huber. HTSeq–A Python framework to
work with high-throughput sequencing data. Bioinformatics, page btu638, 2014. 2.2.3
[85] Andreas Untergasser, Ioana Cutcutache, Triinu Koressaar, Jian Ye, Brant C Faircloth, Maido
Remm, and Steven G Rozen. Primer3-new capabilities and interfaces. Nucleic acids research,
40(15):e115–e115, 2012. 2.2.3
[86] Nasim Ahmadiyeh, Mark M Pomerantz, Chiara Grisanzio, Paula Herman, Li Jia, Vanessa
Almendro, Housheng Hansen He, Myles Brown, X Shirley Liu, Matt Davis, et al. 8q24
prostate, breast, and colon cancer risk loci show tissue-specific long-range interaction with
MYC. Proceedings of the National Academy of Sciences, 107(21):9742–9746, 2010. 3.1.1
[87] Sarina Sulong, Anthony V Moorman, Julie AE Irving, Jonathan C Strefford, Zoe J Konn,
Marian C Case, Lynne Minto, Kerry E Barber, Helen Parker, Sarah L Wright, et al. A
comprehensive analysis of the CDKN2A gene in childhood acute lymphoblastic leukemia
reveals genomic deletion, copy number neutral loss of heterozygosity, and association
with specific cytogenetic subgroups. Blood, 113(1):100–107, 2009. 3.1.1
[88] Cynthia X Ma, Tomas Reinert, Izabela Chmielewska, and Matthew J Ellis. Mechanisms of
aromatase inhibitor resistance. Nature Reviews Cancer, 15(5):261–275, 2015. 3.1.1, 4.3.3
[89] Yoshiaki Ito, Suk-Chul Bae, and Linda Shyue Huey Chuang. The RUNX family: develop-
mental regulators in cancer. Nature Reviews Cancer, 15(2):81–95, 2015. 3.1.1
[90] Genevieve Deblois and Vincent Giguere. Oestrogen-related receptors in breast cancer:
control of cellular metabolism and beyond. Nature Reviews Cancer, 13(1):27–36, 2013.
3.1.1
[91] Giovanni Ciriello, Michael L Gatza, Andrew H Beck, Matthew D Wilkerson, Suhn K Rhie,
Alessandro Pastore, Hailei Zhang, Michael McLellan, Christina Yau, Cyriac Kandoth, et al.
Comprehensive Molecular Portraits of Invasive Lobular Breast Cancer. Cell, 163(2):506–
519, 2015. 3.1.2
[92] C Palmieri, B Rudraraju, M Monteverde, L Lattanzio, O Gojis, R Brizio, O Garrone, M
Merlano, N Syed, C Lo Nigro, et al. Methylation of the calcium channel regulatory subunit
α2δ-3 (CACNA2D3) predicts site-specific relapse in oestrogen receptor-positive primary
breast carcinomas. British journal of cancer, 107(2):375–381, 2012. 3.1.2
BIBLIOGRAPHY 181
[93] Young Seok Ju, Won-Chul Lee, Jong-Yeon Shin, Seungbok Lee, Thomas Bleazard, Jae-
Kyung Won, Young Tae Kim, Jong-Il Kim, Jin-Hyoung Kang, and Jeong-Sun Seo. A
transforming KIF5B and RET gene fusion in lung adenocarcinoma revealed from whole-
genome and transcriptome sequencing. Genome research, 22(3):436–445, 2012. 3.2
[94] Xiaoke Wang, Krista L Bledsoe, Rondell P Graham, Yan W Asmann, David S Viswanatha,
Jean E Lewis, Jason T Lewis, Margaret M Chou, Michael J Yaszemski, Jin Jen, et al. Recur-
rent PAX3-MAML3 fusion in biphenotypic sinonasal sarcoma. Nature genetics, 46(7):666–
668, 2014. 3.2
[95] David TW Jones, Barbara Hutter, Natalie Jager, Andrey Korshunov, Marcel Kool, Hans-Jorg
Warnatz, Thomas Zichner, Sally R Lambert, Marina Ryzhova, Dong Anh Khuong Quang, et
al. Recurrent somatic alterations of FGFR1 and NTRK2 in pilocytic astrocytoma. Nature
genetics, 45(8):927–932, 2013. 3.2
[96] Kristian W Pajtler, Hendrik Witt, Martin Sill, David TW Jones, Volker Hovestadt, Fabian
Kratochwil, Khalida Wani, Ruth Tatevossian, Chandanamali Punchihewa, Pascal Johann,
et al. Molecular Classification of Ependymal Tumors across All CNS Compartments,
Histopathological Grades, and Age Groups. Cancer cell, 27(5):728–743, 2015. 3.2, 3.3.6
[97] Jeong-Sun Seo, Young Seok Ju, Won-Chul Lee, Jong-Yeon Shin, June Koo Lee, Thomas
Bleazard, Junho Lee, Yoo Jin Jung, Jung-Oh Kim, Jung-Young Shin, et al. The transcrip-
tional landscape and mutational profile of lung adenocarcinoma. Genome research, 2012.
3.2
[98] Feng-Yang Zong, Xing Fu, Wen-Juan Wei, Ya-Ge Luo, Monika Heiner, Li-Juan Cao,
Zhaoyuan Fang, Rong Fang, Daru Lu, Hongbin Ji, et al. The RNA-binding protein QKI
suppresses cancer-associated aberrant splicing. PLoS Genet, 10(4):e1004289, 2014. 3.2.5
[99] Helen R Dawe, Helen Farr, Neil Portman, Michael K Shaw, and Keith Gull. The Parkin co-
regulated gene product, PACRG, is an evolutionarily conserved axonemal protein that func-
tions in outer-doublet microtubule morphogenesis. Journal of cell science, 118(23):5421–
5430, 2005. 3.2.5
[100] M Trautmann, E Sievers, S Aretz, D Kindler, S Michels, N Friedrichs, M Renner, J Kirfel,
S Steiner, S Huss, et al. SS18-SSX fusion protein-induced Wnt/β-catenin signaling is a
therapeutic target in synovial sarcoma. Oncogene, 33(42):5006–5016, 2014. 3.3.1
[101] Melker Goransson, Mattias K Andersson, C Forni, Anders Stahlberg, Carola Andersson,
A Olofsson, R Mantovani, and Pierre Aman. The myxoid liposarcoma FUS-DDIT3 fusion

182 BIBLIOGRAPHY
oncoprotein deregulates NF-κB target genes by interaction with NFKBIZ. Oncogene,
28(2):270–278, 2009. 3.3.1
[102] Nele Vanlangenakker, T Vanden Berghe, and Peter Vandenabeele. Many stimuli pull the
necrotic trigger, an overview. Cell Death & Differentiation, 19(1):75–86, 2012. 3.3.4
[103] Arthur Lau, Karim Khan, Alex Pavlosky, Ziqin Yin, Xuyan Huang, Aaron Haig, Weihua
Liu, Bhagi Singh, Zhu-Xu Zhang, and Anthony M Jevnikar. Serine Protease Inhibitor-6
Inhibits Granzyme B–Mediated Injury of Renal Tubular Cells and Promotes Renal Allograft
Survival. Transplantation, 98(4):402–410, 2014. 3.3.4
[104] Yu-Zhang Jiang, Qian-Hui Li, Jian-Qiang Zhao, and Jun-Ji Lv. Identification of a novel fu-
sion gene (HLA-E and HLA-B) by RNA-seq analysis in esophageal squamous cell carcinoma.
Asian Pacific journal of cancer prevention: APJCP, 15(5):2309–2312, 2013. 3.3.4
[105] Pedro G Ferreira, Pedro Jares, Daniel Rico, Gonzalo Gomez-Lopez, Alejandra Martınez-
Trillos, Neus Villamor, Simone Ecker, Abel Gonzalez-Perez, David G Knowles, Jean Mon-
long, et al. Transcriptome characterization by RNA sequencing identifies a major molecular
and clinical subdivision in chronic lymphocytic leukemia. Genome research, 24(2):212–226,
2014. 3.3.5
[106] Richard Pearson, Jacqueline Fleetwood, Sally Eaton, Merlin Crossley, and Shisan Bao.
Kruppel-like transcription factors: a functional family. The international journal of bio-
chemistry & cell biology, 40(10):1996–2001, 2008. 3.3.5
[107] Matthew Parker, Kumarasamypet M Mohankumar, Chandanamali Punchihewa, Ricardo
Weinlich, James D Dalton, Yongjin Li, Ryan Lee, Ruth G Tatevossian, Timothy N Phoenix,
Radhika Thiruvenkatam, et al. C11orf95-RELA fusions drive oncogenic NF-[kgr] B sig-
nalling in ependymoma. Nature, 506(7489):451–455, 2014. 3.3.6
[108] Wei Ma, Claudia Baumann, and Maria M Viveiros. NEDD1 is crucial for meiotic spindle
stability and accurate chromosome segregation in mammalian oocytes. Developmental
biology, 339(2):439–450, 2010. 3.3.6
[109] Anne Beghin, Stephane Belin, Rouba Hage Sleiman, Stephanie Brunet Manquat, Sophie
Goddard, Eric Tabone, Lars P Jordheim, Isabelle Treilleux, Marie-France Poupon, Jean-
Jacques Diaz, et al. ADP ribosylation factor like 2 (Arl2) regulates breast tumor aggressivity
in immunodeficient mice. PloS one, 4(10), 2009. 3.3.7.1
[110] Anne Beghin, Eva-Laure Matera, Stephanie Brunet-Manquat, and Charles Dumontet.
Expression of Arl2 is associated with p53 localization and chemosensitivity in a breast
cancer cell line. Cell Cycle, 7(19):3074–3082, 2008. 3.3.7.1

BIBLIOGRAPHY 183
[111] YX Yin, F Shen, H Pei, Y Ding, Hua Zhao, Min Zhao, and Q Chen. Increased expression of
Rab25 in breast cancer correlates with lymphatic metastasis. Tumor Biology, 33(5):1581–
1587, 2012. 3.3.7.1
[112] Qing Li and Yan Shu. Role of solute carriers in response to anticancer drugs. Molecular
and Cellular Therapies, 2(1):15, 2014. 3.3.7.2, 4.3.3
[113] Manuele Rebsamen, Lorena Pochini, Taras Stasyk, Mariana EG de Araujo, Michele Galluc-
cio, Richard K Kandasamy, Berend Snijder, Astrid Fauster, Elena L Rudashevskaya, Manuela
Bruckner, et al. SLC38A9 is a component of the lysosomal amino acid sensing machinery
that controls mTORC1. Nature, 519(7544):477–481, 2015. 3.3.7.2
[114] Tayebeh Oghabi Bakhshaiesh, Marzie Armat, Dariush Shanehbandi, Simin Sharifi, Behzad
Baradaran, Mohammad Saeed Hejazi, and Nasser Samadi. Arsenic Trioxide Promotes
Paclitaxel Cytotoxicity in Resistant Breast Cancer Cells. Asian Pacific journal of cancer
prevention: APJCP, 16(13):5191, 2015. 3.3.7.5
[115] Umberto Galderisi, Francesco Paolo Jori, and Antonio Giordano. Cell cycle regulation and
neural differentiation. Oncogene, 22(33):5208–5219, 2003. 3.3.7.5
[116] Yu Zhang, Jian Yao, Lin Huan, Junwei Lian, Chuanyang Bao, Yan Li, Chao Ge, Jinjun Li,
Ming Yao, Linhui Liang, et al. GNAI3 inhibits tumor cell migration and invasion and is
post-transcriptionally regulated by miR-222 in hepatocellular carcinoma. Cancer letters,
356(2):978–984, 2015. 3.3.7.6
[117] Nguyen Thi Thuy Phuong, Sung Chul Lim, Young Mi Kim, and Keon Wook Kang. Aro-
matase induction in tamoxifen-resistant breast cancer: Role of phosphoinositide 3-kinase-
dependent CREB activation. Cancer letters, 351(1):91–99, 2014. 3.3.7.6
[118] Jun-Yang Lou, Fernanda Laezza, Benjamin R Gerber, Maolei Xiao, Kathryn A Yamada, Hali
Hartmann, Ann Marie Craig, Jeanne M Nerbonne, and David M Ornitz. Fibroblast growth
factor 14 is an intracellular modulator of voltage-gated sodium channels. The Journal of
physiology, 569(1):179–193, 2005. 3.3.7.7
[119] Srivatcha Naragoni, Shireesha Sankella, Kinesha Harris, and Wesley G Gray. Phytoestro-
gens regulate mRNA and protein levels of guanine nucleotide-binding protein, beta-1
subunit (GNB1) in MCF-7 cells. Journal of cellular physiology, 219(3):584–594, 2009.
3.3.7.7
[120] Kelley C Larson, Michael P Draper, Maciej Lipko, and Michal Dabrowski. Gng12 is a
novel negative regulator of LPS-induced inflammation in the microglial cell line BV-2.
Inflammation research, 59(1):15–22, 2010. 3.3.7.7

184 BIBLIOGRAPHY
[121] Johan Lennartsson and Lars Ronnstrand. Stem cell factor receptor/c-Kit: from basic
science to clinical implications. Physiological reviews, 92(4):1619–1649, 2012. 3.3.7.7
[122] OO Seminog and MJ Goldacre. Age-specific risk of breast cancer in women with neurofi-
bromatosis type 1. British journal of cancer, 112(9):1546–1548, 2015. 3.3.7.7
[123] Zahi Mitri, Tina Constantine, and Ruth O’Regan. The HER2 receptor in breast cancer:
pathophysiology, clinical use, and new advances in therapy. Chemotherapy research and
practice, 2012, 2012. 3.3.7.8
[124] Hoiseon Jeong, Jinkyoung Kim, Youngseok Lee, Jae Hong Seo, Sung Ran Hong, and Aeree
Kim. Neuregulin-1 induces cancer stem cell characteristics in breast cancer cell lines.
Oncology reports, 32(3):1218–1224, 2014. 3.3.7.8
[125] WY Leung, Ioannis Roxanis, Helen Sheldon, Francesca M Buffa, Ji-Liang Li, Adrian L
Harris, and Anthony Kong. Combining lapatinib and pertuzumab to overcome lapatinib
resistance due to NRG1-mediated signalling in HER2-amplified breast cancer. Oncotarget,
6(8):5678–5694, 2015. 3.3.7.8
[126] YH Park, HT Shin, HH Jung, YL Choi, T Ahn, K Park, A Lee, IG Do, JY Kim, JS Ahn, et
al. Role of HER2 mutations in refractory metastatic breast cancers: targeted sequencing
results in patients with refractory breast cancer. Oncotarget, 2015. 3.3.7.8
[127] Sangmin Kim, Jeongmin Lee, Se Kyung Lee, Soo Youn Bae, Jiyoung Kim, Minkuk Kim,
Won Ho Kil, Seok Won Kim, Jeong Eon Lee, and Seok Jin Nam. Protein kinase C-α
downregulates estrogen receptor-α by suppressing c-Jun phosphorylation in estrogen
receptor-positive breast cancer cells. Oncology reports, 31(3):1423–1428, 2014. 3.3.7.8
[128] Christy C Ong, Sarah Gierke, Cameron Pitt, Meredith Sagolla, Christine K Cheng, Wei
Zhou, Adrian M Jubb, Laura Strickland, Maike Schmidt, Sergio G Duron, et al. Small
molecule inhibition of group I p21-activated kinases in breast cancer induces apoptosis
and potentiates the activity of microtubule stabilizing agents. Breast Cancer Research,
17(1):59, 2015. 3.3.7.8
[129] Daniel Lietha, Xinming Cai, Derek FJ Ceccarelli, Yiqun Li, Michael D Schaller, and Michael
J Eck. Structural basis for the autoinhibition of focal adhesion kinase. Cell, 129(6):1177–
1187, 2007. 3.3.7.8
[130] Farnaz Bahrami-B, Parvin Ataie-Kachoie, Mohammad H Pourgholami, and David L Morris.
p70 Ribosomal protein S6 kinase (Rps6kb1): an update. Journal of clinical pathology,
pages jclinpath–2014, 2014. 3.3.7.9
BIBLIOGRAPHY 185
[131] Rachel L Yamnik, Alla Digilova, Daphne C Davis, Z Nilly Brodt, Christopher J Murphy, and
Marina K Holz. S6 kinase 1 regulates estrogen receptor α in control of breast cancer cell
proliferation. Journal of Biological Chemistry, 284(10):6361–6369, 2009. 3.3.7.9
[132] Karin Beelen, Mark Opdam, Tesa M Severson, Rutger HT Koornstra, Andrew D Vincent,
Jelle Wesseling, Jettie J Muris, EM Berns, Jan B Vermorken, Paul J van Diest, et al.
Phosphorylated p-70S6K predicts tamoxifen resistance in postmenopausal breast cancer
patients randomized between adjuvant tamoxifen versus no systemic treatment. Breast
Cancer Res, 16(1):R6, 2014. 3.3.7.9
[133] Gray Pearson, Fred Robinson, Tara Beers Gibson, Bing-e Xu, Mahesh Karandikar, Kevin
Berman, and Melanie H Cobb. Mitogen-activated protein (MAP) kinase pathways: regula-
tion and physiological functions 1. Endocrine reviews, 22(2):153–183, 2001. 3.3.7.10
[134] Manabu Futamura, Hirofumi Arakawa, Koichi Matsuda, Toyomasa Katagiri, Shigetoyo
Saji, Yoshio Miki, and Yusuke Nakamura. Potential role of BRCA2 in a mitotic checkpoint
after phosphorylation by hBUBR1. Cancer research, 60(6):1531–1535, 2000. 3.3.7.11
[135] Darren J Baker, Meelad M Dawlaty, Tobias Wijshake, Karthik B Jeganathan, Liviu Malure-
anu, Janine H van Ree, Ruben Crespo-Diaz, Santiago Reyes, Lauren Seaburg, Virginia
Shapiro, et al. Increased expression of BubR1 protects against aneuploidy and cancer and
extends healthy lifespan. Nature cell biology, 15(1):96–102, 2013. 3.3.7.11
[136] Anupama E Gururaj, Caroline Holm, Goran Landberg, and Rakesh Kumar. Breast Cancer–
Amplified Sequence 3, a Target of Metastasis-Associated Protein 1, Contributes to Tamox-
ifen Resistance in Premenopausal Patients with Breast Cancer. Cell cycle, 5(13):1407–1410,
2006. 3.3.7.12
[137] Anupama E Gururaj, Rajesh R Singh, Suresh K Rayala, Caroline Holm, Petra den Hollander,
Hao Zhang, Seetharaman Balasenthil, Amjad H Talukder, Goran Landberg, and Rakesh
Kumar. MTA1, a transcriptional activator of breast cancer amplified sequence 3. Proceedings
of the National Academy of Sciences, 103(17):6670–6675, 2006. 3.3.7.12
[138] Aaron G Lewis, James Flanagan, Anna Marsh, Gulietta M Pupo, Graham Mann, Amanda B
Spurdle, Geoffrey J Lindeman, Jane E Visvader, Melissa A Brown, Georgia Chenevix-Trench,
et al. Mutation analysis of FANCD2, BRIP1/BACH1, LMO4 and SFN in familial breast
cancer. Breast Cancer Research, 7(6):R1005, 2005. 3.3.7.13
[139] Dimitrios Balafoutas, Axel Zur Hausen, Sebastian Mayer, Marc Hirschfeld, Markus Jaeger,
Dominik Denschlag, Gerald Gitsch, Achim Jungbluth, and Elmar Stickeler. Cancer testis

186 BIBLIOGRAPHY
antigens and NY-BR-1 expression in primary breast cancer: prognostic and therapeutic
implications. BMC cancer, 13(1):271, 2013. 3.3.7.14
[140] Wenwen Wu, Ko Sato, Ayaka Koike, Hiroyuki Nishikawa, Hirotaka Koizumi, Ashok R
Venkitaraman, and Tomohiko Ohta. HERC2 is an E3 ligase that targets BRCA1 for
degradation. Cancer research, 70(15):6384–6392, 2010. 3.3.7.14
[141] Daniel J Klein, Caroline F Thorn, Zeruesenay Desta, David A Flockhart, Russ B Altman,
and Teri E Klein. PharmGKB summary: tamoxifen pathway, pharmacokinetics. Pharmaco-
genetics and genomics, 23(11):643–647, 2013. 3.3.7.15, S8
[142] M Whirl-Carrillo, EM McDonagh, JM Hebert, Li Gong, K Sangkuhl, CF Thorn, RB Altman,
and Teri E Klein. Pharmacogenomics knowledge for personalized medicine. Clinical
Pharmacology & Therapeutics, 92(4):414–417, 2012. 3.3.7.15, S7
[143] Jan A Burger, Meike Burger, and Thomas J Kipps. Chronic lymphocytic leukemia B
cells express functional CXCR4 chemokine receptors that mediate spontaneous migration
beneath bone marrow stromal cells. Blood, 94(11):3658–3667, 1999. 4.2
[144] Bikash Debnath, Shili Xu, Fedora Grande, Antonio Garofalo, and Nouri Neamati. Small
molecule inhibitors of CXCR4. Theranostics, 3(1):47, 2013. 4.2
[145] Paul Labhart, Sudipan Karmakar, Eleni M Salicru, Brian S Egan, Vassilios Alexiadis, Bert W
O’Malley, and Carolyn L Smith. Identification of target genes in breast cancer cells directly
regulated by the SRC-3/AIB1 coactivator. Proceedings of the National Academy of Sciences
of the United States of America, 102(5):1339–1344, 2005. 4.3.2
[146] Loren W Runnels, Lixia Yue, and David E Clapham. The TRPM7 channel is inactivated by
PIP2 hydrolysis. Nature cell biology, 4(5):329–336, 2002. 4.3.2
[147] Jeroen Middelbeek, Arthur J Kuipers, Linda Henneman, Daan Visser, Ilse Eidhof, Remco
van Horssen, Be Wieringa, Sander V Canisius, Wilbert Zwart, Lodewyk F Wessels, et al.
TRPM7 is required for breast tumor cell metastasis. Cancer research, 72(16):4250–4261,
2012. 4.3.2
[148] Lidia Nieto, Inga M Tharun, Mark Balk, Hans Wienk, Rolf Boelens, Christian Ottmann,
Lech-Gustav Milroy, and Luc Brunsveld. Estrogen receptor folding modulates csrc kinase
sh2 interaction via a helical binding mode. ACS chemical biology, 2015. 4.3.3
[149] Nissim Hay and Nahum Sonenberg. Upstream and downstream of mTOR. Genes &
development, 18(16):1926–1945, 2004. 4.3.3

BIBLIOGRAPHY 187
[150] Eijiro Yamada, Shuichi Okada, Tsugumichi Saito, Kihachi Ohshima, Minoru Sato, Takafumi
Tsuchiya, Yutaka Uehara, Hiroyuki Shimizu, and Masatomo Mori. Akt2 phosphorylates
Synip to regulate docking and fusion of GLUT4-containing vesicles. The Journal of cell
biology, 168(6):921–928, 2005. 4.3.3
[151] Pablo Garrido, Javier Moran, Ana Alonso, Segundo Gonzalez, and Celestino Gonzalez.
17β-estradiol activates glucose uptake via GLUT4 translocation and PI3K/Akt signaling
pathway in MCF-7 cells. Endocrinology, 154(6):1979–1989, 2013. 4.3.3
[152] Veronica Wendy Setiawan, Susan E Hankinson, Graham A Colditz, David J Hunter, and
Immaculata De Vivo. HSD17B1 gene polymorphisms and risk of endometrial and breast
cancer. Cancer Epidemiology Biomarkers & Prevention, 13(2):213–219, 2004. 4.3.3
[153] Simon Anders and Wolfgang Huber. Differential expression analysis for sequence count
data. Genome biol, 11(10):R106, 2010. S3

188 BIBLIOGRAPHY

List of Figures
1.1 Key signalling pathways in breast cancer based on somatically mutated genes . . 3
1.2 Top mutated and amplified genes in metastatic breast cancers . . . . . . . . . . . 4
1.3 ESR1 mutation in metastatic breast cancer . . . . . . . . . . . . . . . . . . . . . . 5
1.4 Targeting agents under clinical development . . . . . . . . . . . . . . . . . . . . . 8
1.5 Different types of chromosomal rearrangements . . . . . . . . . . . . . . . . . . . 9
1.6 Different categories of gene fusions . . . . . . . . . . . . . . . . . . . . . . . . . . 10
1.7 Number of newly reported fusions from 1982 to 2014 . . . . . . . . . . . . . . . 12
1.8 Copy number variance of each fusion partner gene identified by PRADA . . . . . 14
1.9 Method of fusion detection in deFuse . . . . . . . . . . . . . . . . . . . . . . . . . 16
1.10 Relative importance of 11 features in deFuse adaboost classifier . . . . . . . . . . 16
1.11 ROC curve of adaboost probability in deFuse . . . . . . . . . . . . . . . . . . . . . 17
2.1 Example of quality control of an RNA-seq sample . . . . . . . . . . . . . . . . . . 21
2.2 Overview of data flow in RNA-seq analysis . . . . . . . . . . . . . . . . . . . . . . 22
2.3 171 paired-end RNA-seq samples from 15 different entities. . . . . . . . . . . . . 24
3.1 Copy number variance in primary and refractory breast tumors . . . . . . . . . . 28
3.2 Distribution of base substitutions in breast cancer . . . . . . . . . . . . . . . . . . 28
3.3 SNVs and Indels in primary breast tumors . . . . . . . . . . . . . . . . . . . . . . 29
3.4 SNVs and Indels in refractory breast tumors . . . . . . . . . . . . . . . . . . . . . 30
3.5 SNVs and Indels in list of genes from estrogen pathway in breast primary and
refractory tumors . . . . . . . . . . . . . . . . . . . . . . . . . . . . . . . . . . . . 32
3.6 Tumor DNA allele variance and tumor allele expression . . . . . . . . . . . . . . . 33
3.7 The number of recurrent fusions in 15 different entities . . . . . . . . . . . . . . . 34
3.8 Identified fusion genes and recovery rate of validated fusions among different tools 36
189
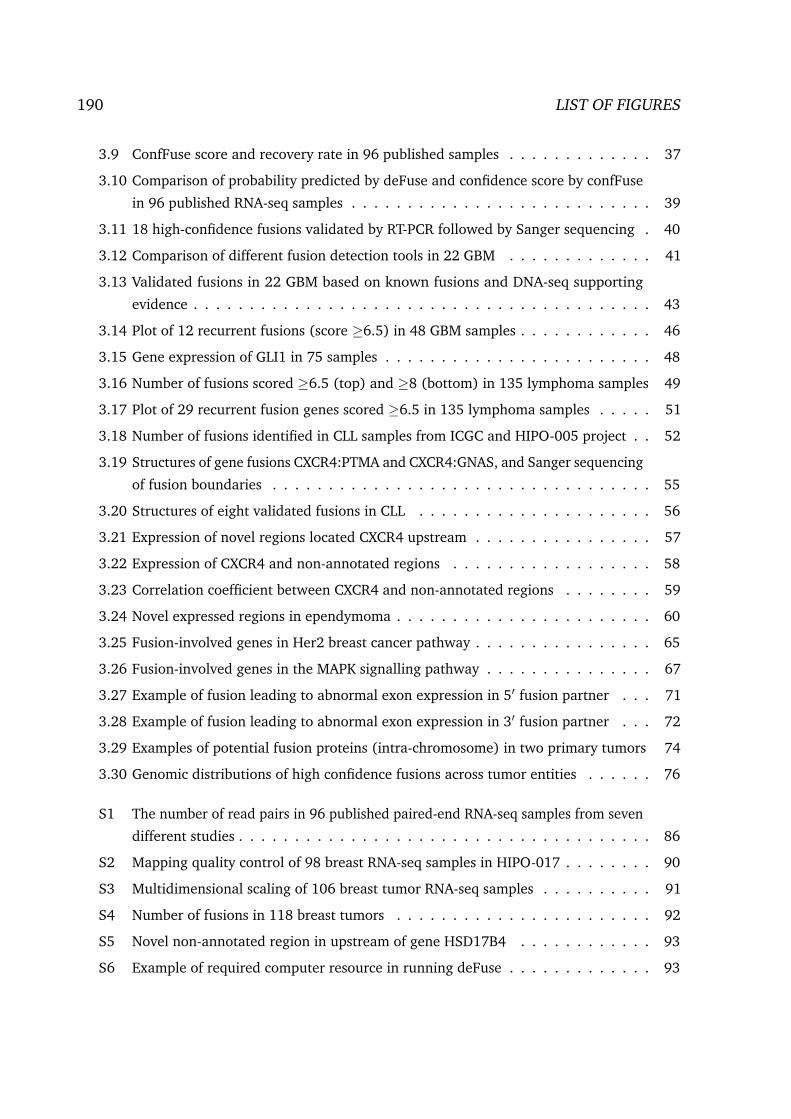
190 LIST OF FIGURES
3.9 ConfFuse score and recovery rate in 96 published samples . . . . . . . . . . . . . 37
3.10 Comparison of probability predicted by deFuse and confidence score by confFuse
in 96 published RNA-seq samples . . . . . . . . . . . . . . . . . . . . . . . . . . . 39
3.11 18 high-confidence fusions validated by RT-PCR followed by Sanger sequencing . 40
3.12 Comparison of different fusion detection tools in 22 GBM . . . . . . . . . . . . . 41
3.13 Validated fusions in 22 GBM based on known fusions and DNA-seq supporting
evidence . . . . . . . . . . . . . . . . . . . . . . . . . . . . . . . . . . . . . . . . . 43
3.14 Plot of 12 recurrent fusions (score ≥6.5) in 48 GBM samples . . . . . . . . . . . . 46
3.15 Gene expression of GLI1 in 75 samples . . . . . . . . . . . . . . . . . . . . . . . . 48
3.16 Number of fusions scored ≥6.5 (top) and ≥8 (bottom) in 135 lymphoma samples 49
3.17 Plot of 29 recurrent fusion genes scored ≥6.5 in 135 lymphoma samples . . . . . 51
3.18 Number of fusions identified in CLL samples from ICGC and HIPO-005 project . . 52
3.19 Structures of gene fusions CXCR4:PTMA and CXCR4:GNAS, and Sanger sequencing
of fusion boundaries . . . . . . . . . . . . . . . . . . . . . . . . . . . . . . . . . . 55
3.20 Structures of eight validated fusions in CLL . . . . . . . . . . . . . . . . . . . . . 56
3.21 Expression of novel regions located CXCR4 upstream . . . . . . . . . . . . . . . . 57
3.22 Expression of CXCR4 and non-annotated regions . . . . . . . . . . . . . . . . . . 58
3.23 Correlation coefficient between CXCR4 and non-annotated regions . . . . . . . . 59
3.24 Novel expressed regions in ependymoma . . . . . . . . . . . . . . . . . . . . . . . 60
3.25 Fusion-involved genes in Her2 breast cancer pathway . . . . . . . . . . . . . . . . 65
3.26 Fusion-involved genes in the MAPK signalling pathway . . . . . . . . . . . . . . . 67
3.27 Example of fusion leading to abnormal exon expression in 5′ fusion partner . . . 71
3.28 Example of fusion leading to abnormal exon expression in 3′ fusion partner . . . 72
3.29 Examples of potential fusion proteins (intra-chromosome) in two primary tumors 74
3.30 Genomic distributions of high confidence fusions across tumor entities . . . . . . 76
S1 The number of read pairs in 96 published paired-end RNA-seq samples from seven
different studies . . . . . . . . . . . . . . . . . . . . . . . . . . . . . . . . . . . . . 86
S2 Mapping quality control of 98 breast RNA-seq samples in HIPO-017 . . . . . . . . 90
S3 Multidimensional scaling of 106 breast tumor RNA-seq samples . . . . . . . . . . 91
S4 Number of fusions in 118 breast tumors . . . . . . . . . . . . . . . . . . . . . . . 92
S5 Novel non-annotated region in upstream of gene HSD17B4 . . . . . . . . . . . . 93
S6 Example of required computer resource in running deFuse . . . . . . . . . . . . . 93

LIST OF FIGURES 191
S7 Estrogen metabolism in the liver . . . . . . . . . . . . . . . . . . . . . . . . . . . 94
S8 Tamoxifen metabolism in the liver . . . . . . . . . . . . . . . . . . . . . . . . . . 95

192 LIST OF FIGURES

List of Tables
1.1 An overview of different fusion detection tools based on RNA-seq data . . . . . . 11
1.2 RNA-seq data set from 13 different tumor types in TCGA . . . . . . . . . . . . . . 12
1.3 Number of known/identified gene fusions in different neoplasia subtypes . . . . . 13
2.1 The weights of single and combined features in confFuse scoring algorithm. . . . 25
3.1 Mutations of calcium channel, voltage-dependent, alpha subunits (CACNA) . . . 31
3.2 The recovery of validated fusions for deFuse, confFuse-6.5 and confFuse-8 . . . . 35
3.3 The recovery of validated fusions in fusionMap . . . . . . . . . . . . . . . . . . . 36
3.4 The recovery of validated fusions in soapFuse. . . . . . . . . . . . . . . . . . . . . 37
3.5 High-confidence fusion genes in 27 INFORM samples . . . . . . . . . . . . . . . . 42
3.6 Recurrent fusion genes identified in HIPO-028 sarcoma samples. . . . . . . . . . 43
3.7 Fusions with recurrent partners (score ≥8) in 83 sarcoma samples . . . . . . . . 44
3.8 24 high-confidence fusion genes identified in 11 early-onset prostate cancer . . . 45
3.9 Recurrent fusions (n=12, score ≥6.5) in 48 GBM samples . . . . . . . . . . . . . 47
3.10 29 recurrent fusion genes (score ≥6.5) in 135 lymphoma samples . . . . . . . . . 50
3.11 Nine validated fusion in lymphoma samples . . . . . . . . . . . . . . . . . . . . . 50
3.12 Recurrent fusions in CLL samples from HIPO-005 and ICGC projects . . . . . . . . 53
3.13 15 fusions validated by RT-PCR and Sanger sequencing in three CLL samples . . . 55
3.14 Distribution of fusion genes identified in 118 breast tumors across 13 different
functional categories . . . . . . . . . . . . . . . . . . . . . . . . . . . . . . . . . . 61
3.15 Recurrent rearrangements of fusion partner genes found in the list of census genes
(COSMIC) . . . . . . . . . . . . . . . . . . . . . . . . . . . . . . . . . . . . . . . . 68
3.16 Recurrent fusions in 118 breast tumor samples . . . . . . . . . . . . . . . . . . . 69
3.17 Potential fusion proteins (inter-chromosome) identified by confFuse in 118 breast
tumor samples . . . . . . . . . . . . . . . . . . . . . . . . . . . . . . . . . . . . . 70
193

194 LIST OF TABLES
3.18 Potential fusion proteins (intra-chromosome) identified by confFuse in 118 breast
tumor samples . . . . . . . . . . . . . . . . . . . . . . . . . . . . . . . . . . . . . 73
S1 Sequenced-read length of seven published studies . . . . . . . . . . . . . . . . . . 86
S2 Validated fusions from 96 paired-end RNA-seq samples in seven published studies 86
S3 Validation results of three breast tumor samples . . . . . . . . . . . . . . . . . . . 96
S4 Fusions identified in 83 sarcoma samples . . . . . . . . . . . . . . . . . . . . . . . 98
S5 Fusions identified in 84 prostate cancer . . . . . . . . . . . . . . . . . . . . . . . . 112
S6 Fusions identified in 48 GBM samples . . . . . . . . . . . . . . . . . . . . . . . . 116
S7 Fusions identified in 135 lymphomas samples . . . . . . . . . . . . . . . . . . . . 121
S8 Fusions identified in 114 CLL samples from HIPO-005 . . . . . . . . . . . . . . . 125
S9 Fusions identified in 25 ependymoma samples . . . . . . . . . . . . . . . . . . . . 133
S10 Fusions identified in 118 breast tumor samples . . . . . . . . . . . . . . . . . . . 134
S11 Fusions identified across 13 different categories . . . . . . . . . . . . . . . . . . . 153
S12 Mutations of CYP, SULT and UGT family genes . . . . . . . . . . . . . . . . . . . . 169