Rupali Annual Report 2014rupaligroup.com/pdf_files/2014/Annual/Rupali Annual... · 2018-03-29 ·...
63
Rupali Polyester Limited A nnual Report 2014
Transcript of Rupali Annual Report 2014rupaligroup.com/pdf_files/2014/Annual/Rupali Annual... · 2018-03-29 ·...

Rupali Polyester Limited
Annual Report 2014

CORPORATE DATA
OUR VISION
OUR MISSION
OUR CORE VALUES
FINANCIAL HIGHLIGHTS
DIRECTORS’ REPORT TO THE SHAREHOLDERS
NOTICE OF MEETING
STATEMENT OF COMPLIANCE WITH THE CODE
OF CORPORATE GOVERNANCE
REVIEW REPORT TO THE MEMBERS ON STATEMENT
OF COMPLIANCE WITH THE BEST PRACTICES OF
THE CODE OF CORPORATE GOVERNANCE
AUDITORS’ REPORT TO THE MEMBERS
BALANCE SHEET
PROFIT AND LOSS ACCOUNT
STATEMENT OF COMPREHENSIVE INCOME
CASH FLOW STATEMENT
STATEMENT OF CHANGES IN EQUITY
NOTES TO THE FINANCIAL STATEMENTS
PATTERN OF SHAREHOLDING
FORM OF PROXY
03
04
05
06
08
12
17
20
22
23
24
25
26
27
28
29
57
-
Contents


Corporate Data
Chairman
Directors
Jafferali M. Feerasta - Non-Executive
Muhammad Rashid Zahir - Non-Executive
Muhammad Ali H. Sayani - Non-Executive
Sultan Ali Rajwany - Non-Executive
Amin A. Feerasta - Non-Executive
Abdul Hayee - Executive
Chief Financial Officer
Ayub Saqib
Chief Executive Officer
Committees of Board of Directors
Nooruddin Feerasta - Executive
Bankers
Bank Alfalah Limited
Bank Al-Habib Limited
Faysal Bank Limited
Habib Bank Ltd
MCB Bank Limited
NIB Bank Limited
Soneri Bank Limited
Auditors
Qavi & Co.
Chartered Accountants
Registered Office
Rupali House, 241-242 Upper Mall Scheme,
Anand Road, Lahore - 54000 PAKISTAN
Plant
30.2 Kilometer Lahore - Sheikhupura Road
Sheikhupura - 39350 PAKISTAN
Audit Committee
Sultan Ali Rajwany - Chairman
Muhammad Rashid Zahir - Member
Amin A. Feerasta - Member
Jafferali M. Feerasta - Chairman
Nooruddin Feerasta - Member
Amin A. Feerasta - Member
Human Resource & Remuneration Committee
Company Secretary
S. Ghulam Shabbir Gilani
Board of Directors
03RUPALI POLYESTER LIMITED

To consistently maintain the Company’s leading status of producing
high quality products being first preference of our customers. Also to
maintain the standards of performance excellence with long term
plans of expansion and diversification.
Our Vision
04 RUPALI POLYESTER LIMITED

05RUPALI POLYESTER LIMITED
Our MissionTo develop the Company on sound technical and financial footings with better
productivity, excellence in quality and operational efficiencies at lower
operating costs by utilizing blend of high professionalism.
To accomplish targeted results through increased earnings for maximum
benefit to the Company stakeholders.
To be an equal opportunity employer taking utmost care of the employees for
their career progression with better reward and recognition
of their abilities and performance.
To fulfill general obligations towards the society, particularly safety, security
and other environmental protections.

06 RUPALI POLYESTER LIMITED
Our Core ValuesAn Organization with well disciplined and professionally managed operational and administrative functions
Pioneering status in Polyester Fiber manufacturing
High quality manufacturing standards
Our products enjoy first preference of downstream users
Performance excellence in all areas of operations
Integrity in all our dealings based on commitments
Very sound internal controls and highly disciplined financial management
An excellent image and repute amongst corporate sector of the country and worldwide recognition
High importance to stakeholders with historical background of dividend payouts to shareholders

RUPALI POLYESTER LIMITED was incorporated at Karachi in May 1980 as a Public Limited Company and is listed on all stock exchanges of Pakistan. It owns and operates composite facilities to manufacture Polyester Staple Fiber and Polyester Filament Yarn. It produces quality products by using latest technology and best quality of raw materials. The Company has the privilege of being one of the pioneers in Pakistan for manufacture of Staple Fiber of highest quality. Since its inception, the Company has been growing steadily through expansion and diversified operations. The assets of the Company have increased to Rs. 4,055 million from the initial capital outlay of Rs.150 million.
The Company has a Polymerization Unit with a capacity of 105 metric tons per day, Polyester Filament Yarn capacity of 30 metric tons per day and a Polyester Staple Fiber capacity of 65 metric tons per day. The various products of Rupali are in fact import substitution as these were previously imported from Japan, Indonesia, Taiwan and Korea. Now the Company is importing the basic raw materials only and through value addition is producing the highest quality products locally.
Since inception, the philosophy of the Company’s management is to grow on the strength of quality and reliability. To achieve this objective, it is maintaining a well equipped Research & Development Centre for standard maintenance, innovative improvements in its products and achieving economies in production techniques without compromising on standard and quality of products. Products and services offered by the Company are acknowledged by the customers as quality and reliable products and are the first preference of customers.
The Company gives high priority to customers’ satisfaction, tries to maintain uninterrupted supply of its products and provides after sales services, technical support for trouble shooting.
AL HAMDO LILLAH, the Company enjoys high prestige and reputation in the business community, banks, financial institutions and customers. It is also amongst major contributors to the national exchequer.
Company Profile
A N N U A L R E P O R T 2 0 1 4
07RUPALI POLYESTER LIMITED

RUPALI POLYESTER LIMITED
A N N U A L R E P O R T 2 0 1 4
08
Financial HighlightsUOM 2014 2013 2012
Profit and Loss Account
Gross Profit
Dividend
Balance Sheet
Total liabilitiesTotal Assets
Ratios Analysis
Production volume
Employees
Sales - NetCost of Goods Sold
Operating profitProfit before taxProfit after taxIncome tax - current
- prior years- deferred
Cash dividendCash dividend rate
Share capitalReservesUnappropriated profitShareholders equityNo. of ordinary sharesNon-current liabilitiesCurrent liabilitiesProperty, Plant and EquipmentCapital work-in-progressLong term investments/loans/depositsCurrent assetsNet current assets
Gross profitNet profitInventory turnoverCash dividend per shareDebt : equity ratioBreak-up value per shareMarket value per share at the end of the year
Production capacityProduction achievedCapacity utilization
Rs. in thousand Rs. in thousand Rs. in thousand Rs. in thousand Rs. in thousand Rs. in thousand Rs. in thousand Rs. in thousand Rs. in thousand
Rs. in thousand Percentage
Rs. in thousand Rs. in thousand Rs. in thousand Rs. in thousand Numbers Rs. in thousand Rs. in thousand Rs. in thousand Rs. in thousand Rs. in thousand Rs. in thousand Rs. in thousand Rs. in thousand Rs. in thousand
Percentage Percentage TimesRupees
Rupees Rupees
M. Tons M. Tons Percentage Numbers
6,390,9226,175,904
215,018125,266
81,75020,93963,909(33,233)30,135
34,06810
340,6851,735,615
259,6572,335,957
34,068,514365,068
1,400,0791,311,704
226,9094,281
2,558,2101,158,1314,101,1044,101,104
3.360.33
41.00
0 : 10068.4025.66
22,10034,957
1581,238
5,952,6596,219,222(266,563)(361,421)(479,858)(403,284)
-(30,459)(46,115)
--
340,6851,735,615(613,511)1,462,789
34,068,514516,553
2,075,7111,630,402
98,3244,361
2,420,290344,579
4,055,0534,055,053
(4.47)(6.77)
7-
9 : 9142.9417.10
22,10028,491
129968
6,091,8026,317,322
(225,520)(275,782)(357,747)(436,600)
30,459565
47,829
--
340,6851,735,615
(210,227)1,866,073
34,068,514411,166
1,393,4611,578,010
37,1104,281
2,088,409694,948
3,670,7003,670,700
(3.70)(7.17)
6-
0 : 10054.7723.30
22,10030,855
1401,001

A N N U A L R E P O R T 2 0 1 4
09RUPALI POLYESTER LIMITED
2010 2009 2008 2007
4,115,381 3,910,332
205,049 167,705 165,044 103,038
19,879 -
42,127
85,171 25
340,685 1,495,615
212,708 2,049,008
34,068,514 219,965 457,856 847,485
96,470 124,606
1,658,268 1,200,412 2,726,829 2,726,829
4.98 2.50
5 2.50
0 : 100 60.14 42.50
22,100 36,334
164 1,256
4,224,019 3,965,886
258,133 229,752 227,539 171,023
56,428 (52,002) 52,090
102,206 30
340,685 1,495,615
298,560 2,134,860
34,068,514 279,678 516,869 986,262
6,271 133,427
1,805,447 1,288,578 2,931,407 2,931,407
6.11 4.05
5 3.00
0 : 100 62.66 42.00
22,100 35,072
159 1,288
4,237,268 3,937,467
299,801 264,307 261,092 196,632
90,972 (4,210)
(22,302)
136,274 40
340,685 1,735,615
152,986 2,229,286
34,068,514 263,293 230,032 969,334
2,845 140,984
1,609,448 1,379,416 2,722,611 2,722,611
7.08 4.64
5 4.00
0 : 100 65.44 29.45
22,100 34,318
155 1,249
4,774,324 4,301,276
473,048 288,930 286,005 207,802 107,860 (22,197)
(7,460)
136,274 40
340,685 1,735,615
224,514 2,300,814
34,068,514 261,634 240,394 907,586 300,143
36,334 1,558,779
1,318,385 2,802,842 2,802,842
9.91 4.35
7 4.00
0 : 100 67.53 33.00
22,100 33,991
154 1,186
2011
6,455,848 5,804,892
650,956 515,795 503,881 332,262 116,219
(3,230) 58,630
187,377 55
340,685 1,735,615
420,502 2,496,802
34,068,514 329,253
1,146,577 1,192,889
26,9984,281
2,748,464 1,601,8873,972,6323,972,632
10.08 5.15
4 5.50
0 : 100 73.2941.50
22,100 35,250
160 1,239

Graphical Presentation
Sales(Rs. in Million)
Gross Assets Employed(Rs. in Million)
0
500
1,000
1,500
2,000
2,500
3,000
3,500
4,000
2009 2010 2011 2012 2013 2014
2,7202,503
3,946 3,8743,634
0 1,000 2,000 3,000 4,000 5,000 6,000 7,000
2009
2010
2011
2012
2013
2014
Production(M. Tons)
2009
Polyester Filament Yarn Polyester Staple Fiber
5,000
10,000
15,000
20,000
25,000
30,000
35,000
40,000
02010 2011 2012 2013 2014
4,51
823
,973
10,4
72
10,9
91
11,1
11
10,4
78
24,4
85
24,2
59
22,8
80
23,8
40
9,98
220
,873
4,237
4,774
6,456
6,391
6,092
5,953
3,957
Profitability(Rs. in Million)
0
1,000
1,000
2,000
3,000
4,000
5,000
6,000
7,000
Turnover
Cost of Sales
Admn, Selling Exp.
Other Expenses
Taxation
Profit/(Loss) After Tax
2009 2010 2011 2012 2013 2014
4,326
3,937
4,851
4,301
6,506
5,805
6,444
6,176
102
26 64 197
235
28 78 209
150
47 172
332
135
51 61 21
6,1846,317
143
82 79 (437
)
6,0026,219
144
118
(77)
(403
)
A N N U A L R E P O R T 2 0 1 4
10 RUPALI POLYESTER LIMITED

Balance Sheet 2014(Rs. in Million)
Equity
Non Current Liabilities
Current Liabilities
Fixed Assets
Long Term Deposits
Current Assets
345
Shareholders Equity(Rs. in Million)
2014
2,500
2,000
1,500
1,000
500
0
2009 2010 2011 2012 2013
0
200
400
600
800
1,000
1,200
1,400
1,600
1,800
Net Current Assets(Rs. in Million)
201420132009 2010 2011 2012
695
1,158
1,379 1,318
1,602
1,866
2,4972,3012,229
2,330
1,463
1,463
516
2,0761,631
4
2,420
A N N U A L R E P O R T 2 0 1 4
11RUPALI POLYESTER LIMITED
Directors’ Reportto the Shareholders
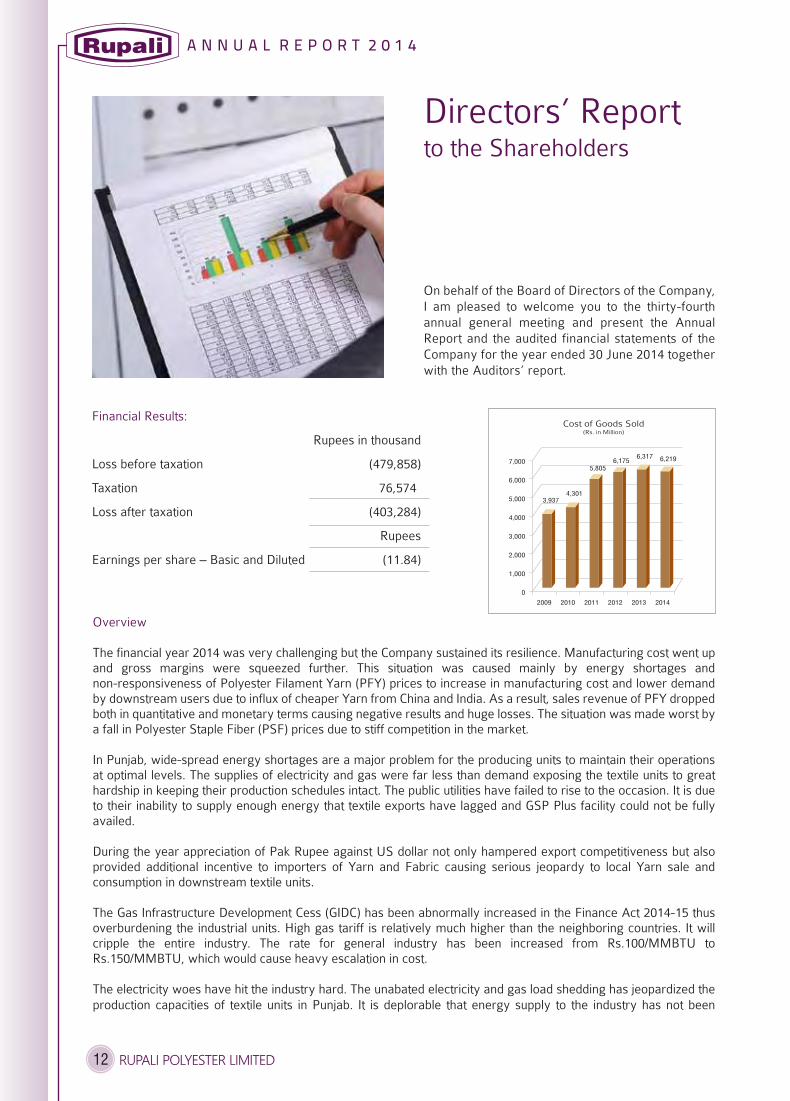
Cost of Goods Sold(Rs. in Million)
0
1,000
2,000
3,000
4,000
5,000
6,000
7,000
2009 2010 2011 2012 2013 2014
3,9374,301
5,8056,175
6,317 6,219
Overview
The financial year 2014 was very challenging but the Company sustained its resilience. Manufacturing cost went up and gross margins were squeezed further. This situation was caused mainly by energy shortages and non-responsiveness of Polyester Filament Yarn (PFY) prices to increase in manufacturing cost and lower demand by downstream users due to influx of cheaper Yarn from China and India. As a result, sales revenue of PFY dropped both in quantitative and monetary terms causing negative results and huge losses. The situation was made worst by a fall in Polyester Staple Fiber (PSF) prices due to stiff competition in the market.
In Punjab, wide-spread energy shortages are a major problem for the producing units to maintain their operations at optimal levels. The supplies of electricity and gas were far less than demand exposing the textile units to great hardship in keeping their production schedules intact. The public utilities have failed to rise to the occasion. It is due to their inability to supply enough energy that textile exports have lagged and GSP Plus facility could not be fully availed.
During the year appreciation of Pak Rupee against US dollar not only hampered export competitiveness but also provided additional incentive to importers of Yarn and Fabric causing serious jeopardy to local Yarn sale and consumption in downstream textile units.
The Gas Infrastructure Development Cess (GIDC) has been abnormally increased in the Finance Act 2014-15 thus overburdening the industrial units. High gas tariff is relatively much higher than the neighboring countries. It will cripple the entire industry. The rate for general industry has been increased from Rs.100/MMBTU to Rs.150/MMBTU, which would cause heavy escalation in cost.
The electricity woes have hit the industry hard. The unabated electricity and gas load shedding has jeopardized the production capacities of textile units in Punjab. It is deplorable that energy supply to the industry has not been
prioritized resulting in closure of a significant segment of this vital industry. The electricity load shedding was merely four hours a day in 2011 against 10 hours a day in 2014. The gas load shedding was only seven hours a day in 2011 which has jumped to 16 hours a day in 2014. Textile industry is the mainstay of Pakistan’s economy and apart from its major contribution to manufacturing, GDP and exports, millions of work force is directly and indirectly connected with this industry. The Punjab-based industry is being discriminated. Textile sector’s operations are in limbo. There has been no acceptable improvement towards protecting the local industry. The concerned quarters should address the structural problems plaguing the economy.
In a bid to explore alternate energy-efficient ways we have installed imported coal fired steam boilers to replace existing boilers. These coal fired steam boilers have become operational this year which have reduced the steam cost considerably. We are further planning to convert our present heating plant based on furnace oil to coal. It is hoped that this investment will contribute in reducing our production cost.
The raw material prices during the year 2014 remained erratic. The MEG price which in July 2013 was US$1,020 per M.Ton showed a soaring trend till April 2014 when it declined to US$975 per M.Ton and in June 2014 it was US$985 per M.Ton. The price of PTA in July 2013 was US$1,110 per M.Ton which was softened in March 2014 to US$940 but again rose to US$1,025 in June 2014.
The Company posted a gross loss of Rs.266.563 million as against Rs.225.520 million in 2013. Operating loss grew to Rs.361.421 million from Rs.275.782 million in the last year owing to inflationary pressure. Other income also decreased to Rs.48.887 million from Rs.92.368 million in 2013. Before tax loss rose to Rs.479.858 million from Rs.357.747 million in the year 2013 and after tax loss clocked in at Rs.403.284 million compared to Rs.436.600 million in the last year. Finance cost for the year rose in line with KIBOR rates adding extra stress on bottom line. The main reasons for losses are decline in sales and higher input cost led by fuel cost due to severe energy crisis and high prices of raw material i.e. PTA and MEG.
Future Outlook
The future of Fiber and Yarn industry is co-related with the activity in downstream textile chain which is damaged by the energy and other issues. Dumping of PSF from China is extensively injurious to local PSF industry. We had filed an application with the National Tariff Commission (NTC) for imposing anti-dumping duty on PSF dumped from China which is still pending
with NTC. This is a matter of high significance, therefore, NTC should consider it on preference basis because any further delay will affect the sustainability of the Polyester Staple Fiber producers. Recent rains and floods in northern and central Pakistan have devastated the roads and infra- structure particularly in Punjab and its impact on standing crops especially cotton crop as well as the rehabilitation of flood-ravaged population will adversely affect the country’s economy. Cotton production may diminish and its price to go up. This may increase the Polyester demand. Besides, political uncertainty during preceding months deepened poverty and exacerbated un-employment in the country.
New taxation structure in the National Budget 2014-15 has increased problems for manufacturing industries. A major budgetary measure to restrict the input tax adjustment only to the extent of goods and services actually used in manufacturing / sales of the taxable activity has created misunderstanding between the FBR and the manufacturers. This regime will give rise to several practical difficulties as seeking input tax adjustment only on goods directly consumed for manufacturing process would be very difficult for the businessmen. Our huge amount of over Rs.137 million is pending with FBR on account of Sales Tax refunds since December 2012 and further delay in these refunds is also adding to cash crunch.
Apart from above concerns, the illegal dumping of Fiber, Yarn and Fabrics in the country has made the local Yarn and Fiber totally uncompetitive and local
industry is at the brink of total collapse. Energy constraints have halted the industrial wheel and high production cost has affected the competitive edge of textile exports in international market.
Even though the profitability for last 2-3 years has been swallowed, the Company has optimistic BMR and energy related plans for the coming times which will serve as a catalyst for cost savings and earnings of the Company. Rupali’s expansion plans and up-gradation projects include refurbishment of production lines and coal-based operations.
The Company is ensuring consistent production of excellent quality products through vigorous technological development and innovative efforts. However, lingering power crises still remain a concerning factor for the Company and might result in further shrinking of margins. The Management is determined in arresting the energy-related cost factors exploring the best and optimally workable solutions. Efforts are also being made to explore new customer base by emphasizing market as well as product development.
Board of Directors
Since election held in 2012, there was no change in composition of the Board of Directors of the Company.
Auditors
The present auditors M/s. Qavi & Co., Chartered Accountants retire and being eligible offer themselves for re-appointment.
The Board has received recommendations from its Audit Committee for re-appointment of M/s. Qavi & Co., Chartered Accountants as Auditors of the Company for the year 2014-15.
Pattern of Shareholding
A statement showing the pattern of shareholding in the Company as at 30 June 2014 appears on Page 57.
Disclosure Requirements as per Code of Corporate Governance
Good Corporate Governance has always been the focal point of the Board of Directors of the Company. I am happy to report that your Company by the Grace of ALLAH, meets the standard set in the guidelines for good corporate governance and is in compliance with the relevant regulations and following specific statements are being given hereunder:
The Company has maintained its books of account as per statutory requirements.
The Company’s financial statements fully present state of affairs fairly, its results of operations, cash flows and changes in equity.
Appropriate accounting policies and applicable International Accounting Standards and International Financial Reporting Standards were applied in preparation of financial statements and accounting estimates are based on reasonable and prudent judgment and any departures there from have been adequately disclosed and explained.
There is no inconsistency in these policies and no material departure from the best practices of corporate governance is allowed.
These accounts have been prepared on going concern basis and the Management is satisfied regarding going concern status of the Company.
The system of internal controls of the Company is significantly sound in design and has been effectively implemented and monitored.
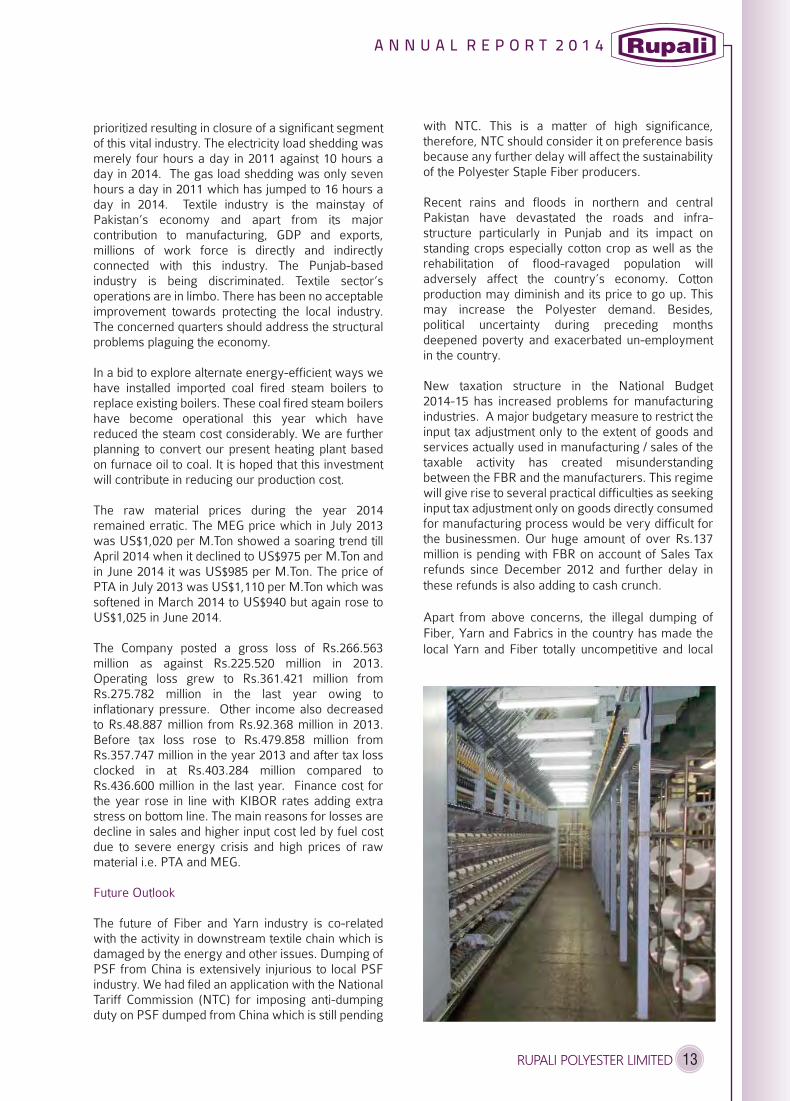
Plant operations remained normal throughout the year. However, the gas and power shortages disturbed our targeted production and sales schedules. The reasons for decline in operating results have been highlighted and explained.
There is no statutory payment on account of taxes, duties, levies and charges outstanding other than those in normal business related transactions.
Company is neither in default nor likely to default any loans, short term borrowings or any sort of debt instruments.
Investment of Provident Fund
The value of investment in Provident Fund Trust Account inclusive of profit accrued thereon is as under:
Audit Committee Meetings and Attendance by each member
Total number of Audit Committee Meetings held during the year under review: 4
Attendance by each Member:
H.R and Remuneration Committee Meetings and Attendance by each member
Total number of HR and Remuneration Committee Meetings held during the year under review: 4
Attendance by each Member:
Board Meetings held and Attendance by each Director
Total number of Board Meetings held during the year under review: 4
Attendance by each Director:
Corporate Social Responsibility (CSR)
Your Company gives high priority to its social
responsibilities and is committed to the highest
standards of corporate behavior. The Company’s
CSR responsibilities are fulfilled through monetary
contributions in the areas of health care, education,
environment protection, water and sanitation, child
welfare, infrastructure development and other social
welfare activities as deemed preferred and surplus
funds availability. Our CSR may include the
contributions to hospitals and education programs
engaged in assisting the under-privileged patients,
students and children of various walks of life.
Health Safety and Environment
The Company is strongly committed towards all aspects of Safety, Health and Environment connected with our business operations.
The Company fully recognizes safety as the key component of operational excellence and gives vital importance to training of employees and contractors to enhance safety awareness and actively incorporate industry best practices in the overall operational set-up.
Our commitment to environment, health and safety is manifested in our operational activities as no major accident was reported in the year 2014.
There was no reportable occupational illness to our employees or contracted manpower in 2014.
Labor Management Relations
Like previous years, cordial relations were maintained between the Management and labor during this year and we wish to place on record our appreciation for the dedication and hard work demonstrated by employees at every level for the progress and growth of the Company.
Approval of Financial Statements
The financial statements for the year 2014 were approved and authorized for their issuance by the Board of Directors on 27 September 2014.
Investment in Associated Company
The shareholders in their last annual general meeting had given approval for an investment upto Rs.200 million in Associated Company namely Rupafil PowerGen (Pvt.) Limited under Section 208 of the Companies Ordinance, 1984 with validity of three years. However, owing to some alternate energy- related plans, including BMR of in-house power generation facilities and other workable solutions for energy cost control, the Company kept the investment in Associated Company in abeyance and during the year ended 30 June 2014 no funds were released to the Associated Company.
A Note of Gratitude
The Directors wish to place on record their appreciation for the cooperation extended by the Ministries of Finance, Industries and Production,
On behalf of the Board of Directors of the Company, I am pleased to welcome you to the thirty-fourth annual general meeting and present the Annual Report and the audited financial statements of the Company for the year ended 30 June 2014 together with the Auditors’ report.
Commerce, Communication and Textile Industry. We also owe our thanks to the Departments of Customs, Central Excise and Government of the Punjab for their cooperation. We appreciate the patronage and confidence placed in the Company by the Development Financial Institutions and commercial banks. We are thankful to our valued customers and expect growing business relationship with them. To our stakeholders we are grateful for their faith in the Company. We greatly value their trust. We also greatly appreciate the continued hard work by the management and staff of the Company.
On behalf of the Board
Jafferali M. FeerastaChairman
Lahore:
27 September 2014
Financial Results:
Rupees in thousand
Loss before taxation (479,858)
Taxation 76,574
Loss after taxation (403,284)
Rupees
Earnings per share – Basic and Diluted (11.84)
A N N U A L R E P O R T 2 0 1 4
12 RUPALI POLYESTER LIMITED
Overview
The financial year 2014 was very challenging but the Company sustained its resilience. Manufacturing cost went up and gross margins were squeezed further. This situation was caused mainly by energy shortages and non-responsiveness of Polyester Filament Yarn (PFY) prices to increase in manufacturing cost and lower demand by downstream users due to influx of cheaper Yarn from China and India. As a result, sales revenue of PFY dropped both in quantitative and monetary terms causing negative results and huge losses. The situation was made worst by a fall in Polyester Staple Fiber (PSF) prices due to stiff competition in the market.
In Punjab, wide-spread energy shortages are a major problem for the producing units to maintain their operations at optimal levels. The supplies of electricity and gas were far less than demand exposing the textile units to great hardship in keeping their production schedules intact. The public utilities have failed to rise to the occasion. It is due to their inability to supply enough energy that textile exports have lagged and GSP Plus facility could not be fully availed.
During the year appreciation of Pak Rupee against US dollar not only hampered export competitiveness but also provided additional incentive to importers of Yarn and Fabric causing serious jeopardy to local Yarn sale and consumption in downstream textile units.
The Gas Infrastructure Development Cess (GIDC) has been abnormally increased in the Finance Act 2014-15 thus overburdening the industrial units. High gas tariff is relatively much higher than the neighboring countries. It will cripple the entire industry. The rate for general industry has been increased from Rs.100/MMBTU to Rs.150/MMBTU, which would cause heavy escalation in cost.
The electricity woes have hit the industry hard. The unabated electricity and gas load shedding has jeopardized the production capacities of textile units in Punjab. It is deplorable that energy supply to the industry has not been
prioritized resulting in closure of a significant segment of this vital industry. The electricity load shedding was merely four hours a day in 2011 against 10 hours a day in 2014. The gas load shedding was only seven hours a day in 2011 which has jumped to 16 hours a day in 2014. Textile industry is the mainstay of Pakistan’s economy and apart from its major contribution to manufacturing, GDP and exports, millions of work force is directly and indirectly connected with this industry. The Punjab-based industry is being discriminated. Textile sector’s operations are in limbo. There has been no acceptable improvement towards protecting the local industry. The concerned quarters should address the structural problems plaguing the economy.
In a bid to explore alternate energy-efficient ways we have installed imported coal fired steam boilers to replace existing boilers. These coal fired steam boilers have become operational this year which have reduced the steam cost considerably. We are further planning to convert our present heating plant based on furnace oil to coal. It is hoped that this investment will contribute in reducing our production cost.
The raw material prices during the year 2014 remained erratic. The MEG price which in July 2013 was US$1,020 per M.Ton showed a soaring trend till April 2014 when it declined to US$975 per M.Ton and in June 2014 it was US$985 per M.Ton. The price of PTA in July 2013 was US$1,110 per M.Ton which was softened in March 2014 to US$940 but again rose to US$1,025 in June 2014.
The Company posted a gross loss of Rs.266.563 million as against Rs.225.520 million in 2013. Operating loss grew to Rs.361.421 million from Rs.275.782 million in the last year owing to inflationary pressure. Other income also decreased to Rs.48.887 million from Rs.92.368 million in 2013. Before tax loss rose to Rs.479.858 million from Rs.357.747 million in the year 2013 and after tax loss clocked in at Rs.403.284 million compared to Rs.436.600 million in the last year. Finance cost for the year rose in line with KIBOR rates adding extra stress on bottom line. The main reasons for losses are decline in sales and higher input cost led by fuel cost due to severe energy crisis and high prices of raw material i.e. PTA and MEG.
Future Outlook
The future of Fiber and Yarn industry is co-related with the activity in downstream textile chain which is damaged by the energy and other issues. Dumping of PSF from China is extensively injurious to local PSF industry. We had filed an application with the National Tariff Commission (NTC) for imposing anti-dumping duty on PSF dumped from China which is still pending
with NTC. This is a matter of high significance, therefore, NTC should consider it on preference basis because any further delay will affect the sustainability of the Polyester Staple Fiber producers. Recent rains and floods in northern and central Pakistan have devastated the roads and infra- structure particularly in Punjab and its impact on standing crops especially cotton crop as well as the rehabilitation of flood-ravaged population will adversely affect the country’s economy. Cotton production may diminish and its price to go up. This may increase the Polyester demand. Besides, political uncertainty during preceding months deepened poverty and exacerbated un-employment in the country.
New taxation structure in the National Budget 2014-15 has increased problems for manufacturing industries. A major budgetary measure to restrict the input tax adjustment only to the extent of goods and services actually used in manufacturing / sales of the taxable activity has created misunderstanding between the FBR and the manufacturers. This regime will give rise to several practical difficulties as seeking input tax adjustment only on goods directly consumed for manufacturing process would be very difficult for the businessmen. Our huge amount of over Rs.137 million is pending with FBR on account of Sales Tax refunds since December 2012 and further delay in these refunds is also adding to cash crunch.
Apart from above concerns, the illegal dumping of Fiber, Yarn and Fabrics in the country has made the local Yarn and Fiber totally uncompetitive and local
industry is at the brink of total collapse. Energy constraints have halted the industrial wheel and high production cost has affected the competitive edge of textile exports in international market.
Even though the profitability for last 2-3 years has been swallowed, the Company has optimistic BMR and energy related plans for the coming times which will serve as a catalyst for cost savings and earnings of the Company. Rupali’s expansion plans and up-gradation projects include refurbishment of production lines and coal-based operations.
The Company is ensuring consistent production of excellent quality products through vigorous technological development and innovative efforts. However, lingering power crises still remain a concerning factor for the Company and might result in further shrinking of margins. The Management is determined in arresting the energy-related cost factors exploring the best and optimally workable solutions. Efforts are also being made to explore new customer base by emphasizing market as well as product development.
Board of Directors
Since election held in 2012, there was no change in composition of the Board of Directors of the Company.
Auditors
The present auditors M/s. Qavi & Co., Chartered Accountants retire and being eligible offer themselves for re-appointment.
The Board has received recommendations from its Audit Committee for re-appointment of M/s. Qavi & Co., Chartered Accountants as Auditors of the Company for the year 2014-15.
Pattern of Shareholding
A statement showing the pattern of shareholding in the Company as at 30 June 2014 appears on Page 57.
Disclosure Requirements as per Code of Corporate Governance
Good Corporate Governance has always been the focal point of the Board of Directors of the Company. I am happy to report that your Company by the Grace of ALLAH, meets the standard set in the guidelines for good corporate governance and is in compliance with the relevant regulations and following specific statements are being given hereunder:
The Company has maintained its books of account as per statutory requirements.
The Company’s financial statements fully present state of affairs fairly, its results of operations, cash flows and changes in equity.
Appropriate accounting policies and applicable International Accounting Standards and International Financial Reporting Standards were applied in preparation of financial statements and accounting estimates are based on reasonable and prudent judgment and any departures there from have been adequately disclosed and explained.
There is no inconsistency in these policies and no material departure from the best practices of corporate governance is allowed.
These accounts have been prepared on going concern basis and the Management is satisfied regarding going concern status of the Company.
The system of internal controls of the Company is significantly sound in design and has been effectively implemented and monitored.
Plant operations remained normal throughout the year. However, the gas and power shortages disturbed our targeted production and sales schedules. The reasons for decline in operating results have been highlighted and explained.
There is no statutory payment on account of taxes, duties, levies and charges outstanding other than those in normal business related transactions.
Company is neither in default nor likely to default any loans, short term borrowings or any sort of debt instruments.
Investment of Provident Fund
The value of investment in Provident Fund Trust Account inclusive of profit accrued thereon is as under:
Audit Committee Meetings and Attendance by each member
Total number of Audit Committee Meetings held during the year under review: 4
Attendance by each Member:
H.R and Remuneration Committee Meetings and Attendance by each member
Total number of HR and Remuneration Committee Meetings held during the year under review: 4
Attendance by each Member:
Board Meetings held and Attendance by each Director
Total number of Board Meetings held during the year under review: 4
Attendance by each Director:
Corporate Social Responsibility (CSR)
Your Company gives high priority to its social
responsibilities and is committed to the highest
standards of corporate behavior. The Company’s
CSR responsibilities are fulfilled through monetary
contributions in the areas of health care, education,
environment protection, water and sanitation, child
welfare, infrastructure development and other social
welfare activities as deemed preferred and surplus
funds availability. Our CSR may include the
contributions to hospitals and education programs
engaged in assisting the under-privileged patients,
students and children of various walks of life.
Health Safety and Environment
The Company is strongly committed towards all aspects of Safety, Health and Environment connected with our business operations.
The Company fully recognizes safety as the key component of operational excellence and gives vital importance to training of employees and contractors to enhance safety awareness and actively incorporate industry best practices in the overall operational set-up.
Our commitment to environment, health and safety is manifested in our operational activities as no major accident was reported in the year 2014.
There was no reportable occupational illness to our employees or contracted manpower in 2014.
Labor Management Relations
Like previous years, cordial relations were maintained between the Management and labor during this year and we wish to place on record our appreciation for the dedication and hard work demonstrated by employees at every level for the progress and growth of the Company.
Approval of Financial Statements
The financial statements for the year 2014 were approved and authorized for their issuance by the Board of Directors on 27 September 2014.
Investment in Associated Company
The shareholders in their last annual general meeting had given approval for an investment upto Rs.200 million in Associated Company namely Rupafil PowerGen (Pvt.) Limited under Section 208 of the Companies Ordinance, 1984 with validity of three years. However, owing to some alternate energy- related plans, including BMR of in-house power generation facilities and other workable solutions for energy cost control, the Company kept the investment in Associated Company in abeyance and during the year ended 30 June 2014 no funds were released to the Associated Company.
A Note of Gratitude
The Directors wish to place on record their appreciation for the cooperation extended by the Ministries of Finance, Industries and Production,
Commerce, Communication and Textile Industry. We also owe our thanks to the Departments of Customs, Central Excise and Government of the Punjab for their cooperation. We appreciate the patronage and confidence placed in the Company by the Development Financial Institutions and commercial banks. We are thankful to our valued customers and expect growing business relationship with them. To our stakeholders we are grateful for their faith in the Company. We greatly value their trust. We also greatly appreciate the continued hard work by the management and staff of the Company.
On behalf of the Board
Jafferali M. FeerastaChairman
Lahore:
27 September 2014
A N N U A L R E P O R T 2 0 1 4
13RUPALI POLYESTER LIMITED

Overview
The financial year 2014 was very challenging but the Company sustained its resilience. Manufacturing cost went up and gross margins were squeezed further. This situation was caused mainly by energy shortages and non-responsiveness of Polyester Filament Yarn (PFY) prices to increase in manufacturing cost and lower demand by downstream users due to influx of cheaper Yarn from China and India. As a result, sales revenue of PFY dropped both in quantitative and monetary terms causing negative results and huge losses. The situation was made worst by a fall in Polyester Staple Fiber (PSF) prices due to stiff competition in the market.
In Punjab, wide-spread energy shortages are a major problem for the producing units to maintain their operations at optimal levels. The supplies of electricity and gas were far less than demand exposing the textile units to great hardship in keeping their production schedules intact. The public utilities have failed to rise to the occasion. It is due to their inability to supply enough energy that textile exports have lagged and GSP Plus facility could not be fully availed.
During the year appreciation of Pak Rupee against US dollar not only hampered export competitiveness but also provided additional incentive to importers of Yarn and Fabric causing serious jeopardy to local Yarn sale and consumption in downstream textile units.
The Gas Infrastructure Development Cess (GIDC) has been abnormally increased in the Finance Act 2014-15 thus overburdening the industrial units. High gas tariff is relatively much higher than the neighboring countries. It will cripple the entire industry. The rate for general industry has been increased from Rs.100/MMBTU to Rs.150/MMBTU, which would cause heavy escalation in cost.
The electricity woes have hit the industry hard. The unabated electricity and gas load shedding has jeopardized the production capacities of textile units in Punjab. It is deplorable that energy supply to the industry has not been
prioritized resulting in closure of a significant segment of this vital industry. The electricity load shedding was merely four hours a day in 2011 against 10 hours a day in 2014. The gas load shedding was only seven hours a day in 2011 which has jumped to 16 hours a day in 2014. Textile industry is the mainstay of Pakistan’s economy and apart from its major contribution to manufacturing, GDP and exports, millions of work force is directly and indirectly connected with this industry. The Punjab-based industry is being discriminated. Textile sector’s operations are in limbo. There has been no acceptable improvement towards protecting the local industry. The concerned quarters should address the structural problems plaguing the economy.
In a bid to explore alternate energy-efficient ways we have installed imported coal fired steam boilers to replace existing boilers. These coal fired steam boilers have become operational this year which have reduced the steam cost considerably. We are further planning to convert our present heating plant based on furnace oil to coal. It is hoped that this investment will contribute in reducing our production cost.
The raw material prices during the year 2014 remained erratic. The MEG price which in July 2013 was US$1,020 per M.Ton showed a soaring trend till April 2014 when it declined to US$975 per M.Ton and in June 2014 it was US$985 per M.Ton. The price of PTA in July 2013 was US$1,110 per M.Ton which was softened in March 2014 to US$940 but again rose to US$1,025 in June 2014.
The Company posted a gross loss of Rs.266.563 million as against Rs.225.520 million in 2013. Operating loss grew to Rs.361.421 million from Rs.275.782 million in the last year owing to inflationary pressure. Other income also decreased to Rs.48.887 million from Rs.92.368 million in 2013. Before tax loss rose to Rs.479.858 million from Rs.357.747 million in the year 2013 and after tax loss clocked in at Rs.403.284 million compared to Rs.436.600 million in the last year. Finance cost for the year rose in line with KIBOR rates adding extra stress on bottom line. The main reasons for losses are decline in sales and higher input cost led by fuel cost due to severe energy crisis and high prices of raw material i.e. PTA and MEG.
Future Outlook
The future of Fiber and Yarn industry is co-related with the activity in downstream textile chain which is damaged by the energy and other issues. Dumping of PSF from China is extensively injurious to local PSF industry. We had filed an application with the National Tariff Commission (NTC) for imposing anti-dumping duty on PSF dumped from China which is still pending
with NTC. This is a matter of high significance, therefore, NTC should consider it on preference basis because any further delay will affect the sustainability of the Polyester Staple Fiber producers. Recent rains and floods in northern and central Pakistan have devastated the roads and infra- structure particularly in Punjab and its impact on standing crops especially cotton crop as well as the rehabilitation of flood-ravaged population will adversely affect the country’s economy. Cotton production may diminish and its price to go up. This may increase the Polyester demand. Besides, political uncertainty during preceding months deepened poverty and exacerbated un-employment in the country.
New taxation structure in the National Budget 2014-15 has increased problems for manufacturing industries. A major budgetary measure to restrict the input tax adjustment only to the extent of goods and services actually used in manufacturing / sales of the taxable activity has created misunderstanding between the FBR and the manufacturers. This regime will give rise to several practical difficulties as seeking input tax adjustment only on goods directly consumed for manufacturing process would be very difficult for the businessmen. Our huge amount of over Rs.137 million is pending with FBR on account of Sales Tax refunds since December 2012 and further delay in these refunds is also adding to cash crunch.
Apart from above concerns, the illegal dumping of Fiber, Yarn and Fabrics in the country has made the local Yarn and Fiber totally uncompetitive and local
industry is at the brink of total collapse. Energy constraints have halted the industrial wheel and high production cost has affected the competitive edge of textile exports in international market.
Even though the profitability for last 2-3 years has been swallowed, the Company has optimistic BMR and energy related plans for the coming times which will serve as a catalyst for cost savings and earnings of the Company. Rupali’s expansion plans and up-gradation projects include refurbishment of production lines and coal-based operations.
The Company is ensuring consistent production of excellent quality products through vigorous technological development and innovative efforts. However, lingering power crises still remain a concerning factor for the Company and might result in further shrinking of margins. The Management is determined in arresting the energy-related cost factors exploring the best and optimally workable solutions. Efforts are also being made to explore new customer base by emphasizing market as well as product development.
Board of Directors
Since election held in 2012, there was no change in composition of the Board of Directors of the Company.
Auditors
The present auditors M/s. Qavi & Co., Chartered Accountants retire and being eligible offer themselves for re-appointment.
The Board has received recommendations from its Audit Committee for re-appointment of M/s. Qavi & Co., Chartered Accountants as Auditors of the Company for the year 2014-15.
Pattern of Shareholding
A statement showing the pattern of shareholding in the Company as at 30 June 2014 appears on Page 57.
Disclosure Requirements as per Code of Corporate Governance
Good Corporate Governance has always been the focal point of the Board of Directors of the Company. I am happy to report that your Company by the Grace of ALLAH, meets the standard set in the guidelines for good corporate governance and is in compliance with the relevant regulations and following specific statements are being given hereunder:
The Company has maintained its books of account as per statutory requirements.
The Company’s financial statements fully present state of affairs fairly, its results of operations, cash flows and changes in equity.
Appropriate accounting policies and applicable International Accounting Standards and International Financial Reporting Standards were applied in preparation of financial statements and accounting estimates are based on reasonable and prudent judgment and any departures there from have been adequately disclosed and explained.
There is no inconsistency in these policies and no material departure from the best practices of corporate governance is allowed.
These accounts have been prepared on going concern basis and the Management is satisfied regarding going concern status of the Company.
The system of internal controls of the Company is significantly sound in design and has been effectively implemented and monitored.
Plant operations remained normal throughout the year. However, the gas and power shortages disturbed our targeted production and sales schedules. The reasons for decline in operating results have been highlighted and explained.
There is no statutory payment on account of taxes, duties, levies and charges outstanding other than those in normal business related transactions.
Company is neither in default nor likely to default any loans, short term borrowings or any sort of debt instruments.
Investment of Provident Fund
The value of investment in Provident Fund Trust Account inclusive of profit accrued thereon is as under:
Audit Committee Meetings and Attendance by each member
Total number of Audit Committee Meetings held during the year under review: 4
Attendance by each Member:
H.R and Remuneration Committee Meetings and Attendance by each member
Total number of HR and Remuneration Committee Meetings held during the year under review: 4
Attendance by each Member:
Board Meetings held and Attendance by each Director
Total number of Board Meetings held during the year under review: 4
Attendance by each Director:
Corporate Social Responsibility (CSR)
Your Company gives high priority to its social
responsibilities and is committed to the highest
standards of corporate behavior. The Company’s
CSR responsibilities are fulfilled through monetary
contributions in the areas of health care, education,
environment protection, water and sanitation, child
welfare, infrastructure development and other social
welfare activities as deemed preferred and surplus
funds availability. Our CSR may include the
contributions to hospitals and education programs
engaged in assisting the under-privileged patients,
students and children of various walks of life.
Health Safety and Environment
The Company is strongly committed towards all aspects of Safety, Health and Environment connected with our business operations.
The Company fully recognizes safety as the key component of operational excellence and gives vital importance to training of employees and contractors to enhance safety awareness and actively incorporate industry best practices in the overall operational set-up.
Our commitment to environment, health and safety is manifested in our operational activities as no major accident was reported in the year 2014.
There was no reportable occupational illness to our employees or contracted manpower in 2014.
Labor Management Relations
Like previous years, cordial relations were maintained between the Management and labor during this year and we wish to place on record our appreciation for the dedication and hard work demonstrated by employees at every level for the progress and growth of the Company.
Approval of Financial Statements
The financial statements for the year 2014 were approved and authorized for their issuance by the Board of Directors on 27 September 2014.
Investment in Associated Company
The shareholders in their last annual general meeting had given approval for an investment upto Rs.200 million in Associated Company namely Rupafil PowerGen (Pvt.) Limited under Section 208 of the Companies Ordinance, 1984 with validity of three years. However, owing to some alternate energy- related plans, including BMR of in-house power generation facilities and other workable solutions for energy cost control, the Company kept the investment in Associated Company in abeyance and during the year ended 30 June 2014 no funds were released to the Associated Company.
A Note of Gratitude
The Directors wish to place on record their appreciation for the cooperation extended by the Ministries of Finance, Industries and Production,
Commerce, Communication and Textile Industry. We also owe our thanks to the Departments of Customs, Central Excise and Government of the Punjab for their cooperation. We appreciate the patronage and confidence placed in the Company by the Development Financial Institutions and commercial banks. We are thankful to our valued customers and expect growing business relationship with them. To our stakeholders we are grateful for their faith in the Company. We greatly value their trust. We also greatly appreciate the continued hard work by the management and staff of the Company.
On behalf of the Board
Jafferali M. FeerastaChairman
Lahore:
27 September 2014
A N N U A L R E P O R T 2 0 1 4
14 RUPALI POLYESTER LIMITED

Overview
The financial year 2014 was very challenging but the Company sustained its resilience. Manufacturing cost went up and gross margins were squeezed further. This situation was caused mainly by energy shortages and non-responsiveness of Polyester Filament Yarn (PFY) prices to increase in manufacturing cost and lower demand by downstream users due to influx of cheaper Yarn from China and India. As a result, sales revenue of PFY dropped both in quantitative and monetary terms causing negative results and huge losses. The situation was made worst by a fall in Polyester Staple Fiber (PSF) prices due to stiff competition in the market.
In Punjab, wide-spread energy shortages are a major problem for the producing units to maintain their operations at optimal levels. The supplies of electricity and gas were far less than demand exposing the textile units to great hardship in keeping their production schedules intact. The public utilities have failed to rise to the occasion. It is due to their inability to supply enough energy that textile exports have lagged and GSP Plus facility could not be fully availed.
During the year appreciation of Pak Rupee against US dollar not only hampered export competitiveness but also provided additional incentive to importers of Yarn and Fabric causing serious jeopardy to local Yarn sale and consumption in downstream textile units.
The Gas Infrastructure Development Cess (GIDC) has been abnormally increased in the Finance Act 2014-15 thus overburdening the industrial units. High gas tariff is relatively much higher than the neighboring countries. It will cripple the entire industry. The rate for general industry has been increased from Rs.100/MMBTU to Rs.150/MMBTU, which would cause heavy escalation in cost.
The electricity woes have hit the industry hard. The unabated electricity and gas load shedding has jeopardized the production capacities of textile units in Punjab. It is deplorable that energy supply to the industry has not been
prioritized resulting in closure of a significant segment of this vital industry. The electricity load shedding was merely four hours a day in 2011 against 10 hours a day in 2014. The gas load shedding was only seven hours a day in 2011 which has jumped to 16 hours a day in 2014. Textile industry is the mainstay of Pakistan’s economy and apart from its major contribution to manufacturing, GDP and exports, millions of work force is directly and indirectly connected with this industry. The Punjab-based industry is being discriminated. Textile sector’s operations are in limbo. There has been no acceptable improvement towards protecting the local industry. The concerned quarters should address the structural problems plaguing the economy.
In a bid to explore alternate energy-efficient ways we have installed imported coal fired steam boilers to replace existing boilers. These coal fired steam boilers have become operational this year which have reduced the steam cost considerably. We are further planning to convert our present heating plant based on furnace oil to coal. It is hoped that this investment will contribute in reducing our production cost.
The raw material prices during the year 2014 remained erratic. The MEG price which in July 2013 was US$1,020 per M.Ton showed a soaring trend till April 2014 when it declined to US$975 per M.Ton and in June 2014 it was US$985 per M.Ton. The price of PTA in July 2013 was US$1,110 per M.Ton which was softened in March 2014 to US$940 but again rose to US$1,025 in June 2014.
The Company posted a gross loss of Rs.266.563 million as against Rs.225.520 million in 2013. Operating loss grew to Rs.361.421 million from Rs.275.782 million in the last year owing to inflationary pressure. Other income also decreased to Rs.48.887 million from Rs.92.368 million in 2013. Before tax loss rose to Rs.479.858 million from Rs.357.747 million in the year 2013 and after tax loss clocked in at Rs.403.284 million compared to Rs.436.600 million in the last year. Finance cost for the year rose in line with KIBOR rates adding extra stress on bottom line. The main reasons for losses are decline in sales and higher input cost led by fuel cost due to severe energy crisis and high prices of raw material i.e. PTA and MEG.
Future Outlook
The future of Fiber and Yarn industry is co-related with the activity in downstream textile chain which is damaged by the energy and other issues. Dumping of PSF from China is extensively injurious to local PSF industry. We had filed an application with the National Tariff Commission (NTC) for imposing anti-dumping duty on PSF dumped from China which is still pending
with NTC. This is a matter of high significance, therefore, NTC should consider it on preference basis because any further delay will affect the sustainability of the Polyester Staple Fiber producers. Recent rains and floods in northern and central Pakistan have devastated the roads and infra- structure particularly in Punjab and its impact on standing crops especially cotton crop as well as the rehabilitation of flood-ravaged population will adversely affect the country’s economy. Cotton production may diminish and its price to go up. This may increase the Polyester demand. Besides, political uncertainty during preceding months deepened poverty and exacerbated un-employment in the country.
New taxation structure in the National Budget 2014-15 has increased problems for manufacturing industries. A major budgetary measure to restrict the input tax adjustment only to the extent of goods and services actually used in manufacturing / sales of the taxable activity has created misunderstanding between the FBR and the manufacturers. This regime will give rise to several practical difficulties as seeking input tax adjustment only on goods directly consumed for manufacturing process would be very difficult for the businessmen. Our huge amount of over Rs.137 million is pending with FBR on account of Sales Tax refunds since December 2012 and further delay in these refunds is also adding to cash crunch.
Apart from above concerns, the illegal dumping of Fiber, Yarn and Fabrics in the country has made the local Yarn and Fiber totally uncompetitive and local
industry is at the brink of total collapse. Energy constraints have halted the industrial wheel and high production cost has affected the competitive edge of textile exports in international market.
Even though the profitability for last 2-3 years has been swallowed, the Company has optimistic BMR and energy related plans for the coming times which will serve as a catalyst for cost savings and earnings of the Company. Rupali’s expansion plans and up-gradation projects include refurbishment of production lines and coal-based operations.
The Company is ensuring consistent production of excellent quality products through vigorous technological development and innovative efforts. However, lingering power crises still remain a concerning factor for the Company and might result in further shrinking of margins. The Management is determined in arresting the energy-related cost factors exploring the best and optimally workable solutions. Efforts are also being made to explore new customer base by emphasizing market as well as product development.
Board of Directors
Since election held in 2012, there was no change in composition of the Board of Directors of the Company.
Auditors
The present auditors M/s. Qavi & Co., Chartered Accountants retire and being eligible offer themselves for re-appointment.
The Board has received recommendations from its Audit Committee for re-appointment of M/s. Qavi & Co., Chartered Accountants as Auditors of the Company for the year 2014-15.
Pattern of Shareholding
A statement showing the pattern of shareholding in the Company as at 30 June 2014 appears on Page 57.
Disclosure Requirements as per Code of Corporate Governance
Good Corporate Governance has always been the focal point of the Board of Directors of the Company. I am happy to report that your Company by the Grace of ALLAH, meets the standard set in the guidelines for good corporate governance and is in compliance with the relevant regulations and following specific statements are being given hereunder:
The Company has maintained its books of account as per statutory requirements.
The Company’s financial statements fully present state of affairs fairly, its results of operations, cash flows and changes in equity.
Appropriate accounting policies and applicable International Accounting Standards and International Financial Reporting Standards were applied in preparation of financial statements and accounting estimates are based on reasonable and prudent judgment and any departures there from have been adequately disclosed and explained.
There is no inconsistency in these policies and no material departure from the best practices of corporate governance is allowed.
These accounts have been prepared on going concern basis and the Management is satisfied regarding going concern status of the Company.
The system of internal controls of the Company is significantly sound in design and has been effectively implemented and monitored.
Plant operations remained normal throughout the year. However, the gas and power shortages disturbed our targeted production and sales schedules. The reasons for decline in operating results have been highlighted and explained.
There is no statutory payment on account of taxes, duties, levies and charges outstanding other than those in normal business related transactions.
Company is neither in default nor likely to default any loans, short term borrowings or any sort of debt instruments.
Investment of Provident Fund
The value of investment in Provident Fund Trust Account inclusive of profit accrued thereon is as under:
Audit Committee Meetings and Attendance by each member
Total number of Audit Committee Meetings held during the year under review: 4
Attendance by each Member:
H.R and Remuneration Committee Meetings and Attendance by each member
Total number of HR and Remuneration Committee Meetings held during the year under review: 4
Attendance by each Member:
Board Meetings held and Attendance by each Director
Total number of Board Meetings held during the year under review: 4
Attendance by each Director:
(Rupees in thousand)
30 June 2014 30 June 2013
(Unaudited) (Audited)
24,640 23,809
Corporate Social Responsibility (CSR)
Your Company gives high priority to its social
responsibilities and is committed to the highest
standards of corporate behavior. The Company’s
CSR responsibilities are fulfilled through monetary
contributions in the areas of health care, education,
environment protection, water and sanitation, child
welfare, infrastructure development and other social
welfare activities as deemed preferred and surplus
funds availability. Our CSR may include the
contributions to hospitals and education programs
engaged in assisting the under-privileged patients,
students and children of various walks of life.
Health Safety and Environment
The Company is strongly committed towards all aspects of Safety, Health and Environment connected with our business operations.
The Company fully recognizes safety as the key component of operational excellence and gives vital importance to training of employees and contractors to enhance safety awareness and actively incorporate industry best practices in the overall operational set-up.
Our commitment to environment, health and safety is manifested in our operational activities as no major accident was reported in the year 2014.
There was no reportable occupational illness to our employees or contracted manpower in 2014.
Labor Management Relations
Like previous years, cordial relations were maintained between the Management and labor during this year and we wish to place on record our appreciation for the dedication and hard work demonstrated by employees at every level for the progress and growth of the Company.
Approval of Financial Statements
The financial statements for the year 2014 were approved and authorized for their issuance by the Board of Directors on 27 September 2014.
Investment in Associated Company
The shareholders in their last annual general meeting had given approval for an investment upto Rs.200 million in Associated Company namely Rupafil PowerGen (Pvt.) Limited under Section 208 of the Companies Ordinance, 1984 with validity of three years. However, owing to some alternate energy- related plans, including BMR of in-house power generation facilities and other workable solutions for energy cost control, the Company kept the investment in Associated Company in abeyance and during the year ended 30 June 2014 no funds were released to the Associated Company.
A Note of Gratitude
The Directors wish to place on record their appreciation for the cooperation extended by the Ministries of Finance, Industries and Production,
1.
2.
3.
4.
5.
6.
7.
Mr. Jafferali M. Feerasta (Non-executive)
Mr. Nooruddin Feerasta (Chief Executive Officer)
Mr. Muhammad Rashid Zahir (Non-executive)
Mr. Muhammad Ali H. Sayani (Non-executive)
Mr. Sultan Ali Rajwany (Independent & Non-executive)
Mr. Amin A. Feerasta (Non-executive)
Mr. Abdul Hayee (Executive)
4
4
3
4
4
4
4
1.
2.
3.
Mr. Jafferali M. Feerasta
Mr. Nooruddin Feerasta
Mr. Amin A. Feerasta
Chairman
Member
Member
4
4
4
Commerce, Communication and Textile Industry. We also owe our thanks to the Departments of Customs, Central Excise and Government of the Punjab for their cooperation. We appreciate the patronage and confidence placed in the Company by the Development Financial Institutions and commercial banks. We are thankful to our valued customers and expect growing business relationship with them. To our stakeholders we are grateful for their faith in the Company. We greatly value their trust. We also greatly appreciate the continued hard work by the management and staff of the Company.
On behalf of the Board
Jafferali M. FeerastaChairman
Lahore:
27 September 2014
1.
2.
3.
Mr. Sultan Ali Rajwany
Mr. Muhammad Rashid Zahir
Mr. Amin A. Feerasta
Chairman
Member
Member
4
3
4
A N N U A L R E P O R T 2 0 1 4
15RUPALI POLYESTER LIMITED
Overview
The financial year 2014 was very challenging but the Company sustained its resilience. Manufacturing cost went up and gross margins were squeezed further. This situation was caused mainly by energy shortages and non-responsiveness of Polyester Filament Yarn (PFY) prices to increase in manufacturing cost and lower demand by downstream users due to influx of cheaper Yarn from China and India. As a result, sales revenue of PFY dropped both in quantitative and monetary terms causing negative results and huge losses. The situation was made worst by a fall in Polyester Staple Fiber (PSF) prices due to stiff competition in the market.
In Punjab, wide-spread energy shortages are a major problem for the producing units to maintain their operations at optimal levels. The supplies of electricity and gas were far less than demand exposing the textile units to great hardship in keeping their production schedules intact. The public utilities have failed to rise to the occasion. It is due to their inability to supply enough energy that textile exports have lagged and GSP Plus facility could not be fully availed.
During the year appreciation of Pak Rupee against US dollar not only hampered export competitiveness but also provided additional incentive to importers of Yarn and Fabric causing serious jeopardy to local Yarn sale and consumption in downstream textile units.
The Gas Infrastructure Development Cess (GIDC) has been abnormally increased in the Finance Act 2014-15 thus overburdening the industrial units. High gas tariff is relatively much higher than the neighboring countries. It will cripple the entire industry. The rate for general industry has been increased from Rs.100/MMBTU to Rs.150/MMBTU, which would cause heavy escalation in cost.
The electricity woes have hit the industry hard. The unabated electricity and gas load shedding has jeopardized the production capacities of textile units in Punjab. It is deplorable that energy supply to the industry has not been
prioritized resulting in closure of a significant segment of this vital industry. The electricity load shedding was merely four hours a day in 2011 against 10 hours a day in 2014. The gas load shedding was only seven hours a day in 2011 which has jumped to 16 hours a day in 2014. Textile industry is the mainstay of Pakistan’s economy and apart from its major contribution to manufacturing, GDP and exports, millions of work force is directly and indirectly connected with this industry. The Punjab-based industry is being discriminated. Textile sector’s operations are in limbo. There has been no acceptable improvement towards protecting the local industry. The concerned quarters should address the structural problems plaguing the economy.
In a bid to explore alternate energy-efficient ways we have installed imported coal fired steam boilers to replace existing boilers. These coal fired steam boilers have become operational this year which have reduced the steam cost considerably. We are further planning to convert our present heating plant based on furnace oil to coal. It is hoped that this investment will contribute in reducing our production cost.
The raw material prices during the year 2014 remained erratic. The MEG price which in July 2013 was US$1,020 per M.Ton showed a soaring trend till April 2014 when it declined to US$975 per M.Ton and in June 2014 it was US$985 per M.Ton. The price of PTA in July 2013 was US$1,110 per M.Ton which was softened in March 2014 to US$940 but again rose to US$1,025 in June 2014.
The Company posted a gross loss of Rs.266.563 million as against Rs.225.520 million in 2013. Operating loss grew to Rs.361.421 million from Rs.275.782 million in the last year owing to inflationary pressure. Other income also decreased to Rs.48.887 million from Rs.92.368 million in 2013. Before tax loss rose to Rs.479.858 million from Rs.357.747 million in the year 2013 and after tax loss clocked in at Rs.403.284 million compared to Rs.436.600 million in the last year. Finance cost for the year rose in line with KIBOR rates adding extra stress on bottom line. The main reasons for losses are decline in sales and higher input cost led by fuel cost due to severe energy crisis and high prices of raw material i.e. PTA and MEG.
Future Outlook
The future of Fiber and Yarn industry is co-related with the activity in downstream textile chain which is damaged by the energy and other issues. Dumping of PSF from China is extensively injurious to local PSF industry. We had filed an application with the National Tariff Commission (NTC) for imposing anti-dumping duty on PSF dumped from China which is still pending
with NTC. This is a matter of high significance, therefore, NTC should consider it on preference basis because any further delay will affect the sustainability of the Polyester Staple Fiber producers. Recent rains and floods in northern and central Pakistan have devastated the roads and infra- structure particularly in Punjab and its impact on standing crops especially cotton crop as well as the rehabilitation of flood-ravaged population will adversely affect the country’s economy. Cotton production may diminish and its price to go up. This may increase the Polyester demand. Besides, political uncertainty during preceding months deepened poverty and exacerbated un-employment in the country.
New taxation structure in the National Budget 2014-15 has increased problems for manufacturing industries. A major budgetary measure to restrict the input tax adjustment only to the extent of goods and services actually used in manufacturing / sales of the taxable activity has created misunderstanding between the FBR and the manufacturers. This regime will give rise to several practical difficulties as seeking input tax adjustment only on goods directly consumed for manufacturing process would be very difficult for the businessmen. Our huge amount of over Rs.137 million is pending with FBR on account of Sales Tax refunds since December 2012 and further delay in these refunds is also adding to cash crunch.
Apart from above concerns, the illegal dumping of Fiber, Yarn and Fabrics in the country has made the local Yarn and Fiber totally uncompetitive and local
industry is at the brink of total collapse. Energy constraints have halted the industrial wheel and high production cost has affected the competitive edge of textile exports in international market.
Even though the profitability for last 2-3 years has been swallowed, the Company has optimistic BMR and energy related plans for the coming times which will serve as a catalyst for cost savings and earnings of the Company. Rupali’s expansion plans and up-gradation projects include refurbishment of production lines and coal-based operations.
The Company is ensuring consistent production of excellent quality products through vigorous technological development and innovative efforts. However, lingering power crises still remain a concerning factor for the Company and might result in further shrinking of margins. The Management is determined in arresting the energy-related cost factors exploring the best and optimally workable solutions. Efforts are also being made to explore new customer base by emphasizing market as well as product development.
Board of Directors
Since election held in 2012, there was no change in composition of the Board of Directors of the Company.
Auditors
The present auditors M/s. Qavi & Co., Chartered Accountants retire and being eligible offer themselves for re-appointment.
The Board has received recommendations from its Audit Committee for re-appointment of M/s. Qavi & Co., Chartered Accountants as Auditors of the Company for the year 2014-15.
Pattern of Shareholding
A statement showing the pattern of shareholding in the Company as at 30 June 2014 appears on Page 57.
Disclosure Requirements as per Code of Corporate Governance
Good Corporate Governance has always been the focal point of the Board of Directors of the Company. I am happy to report that your Company by the Grace of ALLAH, meets the standard set in the guidelines for good corporate governance and is in compliance with the relevant regulations and following specific statements are being given hereunder:
The Company has maintained its books of account as per statutory requirements.
The Company’s financial statements fully present state of affairs fairly, its results of operations, cash flows and changes in equity.
Appropriate accounting policies and applicable International Accounting Standards and International Financial Reporting Standards were applied in preparation of financial statements and accounting estimates are based on reasonable and prudent judgment and any departures there from have been adequately disclosed and explained.
There is no inconsistency in these policies and no material departure from the best practices of corporate governance is allowed.
These accounts have been prepared on going concern basis and the Management is satisfied regarding going concern status of the Company.
The system of internal controls of the Company is significantly sound in design and has been effectively implemented and monitored.
Plant operations remained normal throughout the year. However, the gas and power shortages disturbed our targeted production and sales schedules. The reasons for decline in operating results have been highlighted and explained.
There is no statutory payment on account of taxes, duties, levies and charges outstanding other than those in normal business related transactions.
Company is neither in default nor likely to default any loans, short term borrowings or any sort of debt instruments.
Investment of Provident Fund
The value of investment in Provident Fund Trust Account inclusive of profit accrued thereon is as under:
Audit Committee Meetings and Attendance by each member
Total number of Audit Committee Meetings held during the year under review: 4
Attendance by each Member:
H.R and Remuneration Committee Meetings and Attendance by each member
Total number of HR and Remuneration Committee Meetings held during the year under review: 4
Attendance by each Member:
Board Meetings held and Attendance by each Director
Total number of Board Meetings held during the year under review: 4
Attendance by each Director:
Corporate Social Responsibility (CSR)
Your Company gives high priority to its social
responsibilities and is committed to the highest
standards of corporate behavior. The Company’s
CSR responsibilities are fulfilled through monetary
contributions in the areas of health care, education,
environment protection, water and sanitation, child
welfare, infrastructure development and other social
welfare activities as deemed preferred and surplus
funds availability. Our CSR may include the
contributions to hospitals and education programs
engaged in assisting the under-privileged patients,
students and children of various walks of life.
Health Safety and Environment
The Company is strongly committed towards all aspects of Safety, Health and Environment connected with our business operations.
The Company fully recognizes safety as the key component of operational excellence and gives vital importance to training of employees and contractors to enhance safety awareness and actively incorporate industry best practices in the overall operational set-up.
Our commitment to environment, health and safety is manifested in our operational activities as no major accident was reported in the year 2014.
There was no reportable occupational illness to our employees or contracted manpower in 2014.
Labor Management Relations
Like previous years, cordial relations were maintained between the Management and labor during this year and we wish to place on record our appreciation for the dedication and hard work demonstrated by employees at every level for the progress and growth of the Company.
Approval of Financial Statements
The financial statements for the year 2014 were approved and authorized for their issuance by the Board of Directors on 27 September 2014.
Investment in Associated Company
The shareholders in their last annual general meeting had given approval for an investment upto Rs.200 million in Associated Company namely Rupafil PowerGen (Pvt.) Limited under Section 208 of the Companies Ordinance, 1984 with validity of three years. However, owing to some alternate energy- related plans, including BMR of in-house power generation facilities and other workable solutions for energy cost control, the Company kept the investment in Associated Company in abeyance and during the year ended 30 June 2014 no funds were released to the Associated Company.
A Note of Gratitude
The Directors wish to place on record their appreciation for the cooperation extended by the Ministries of Finance, Industries and Production,
Commerce, Communication and Textile Industry. We also owe our thanks to the Departments of Customs, Central Excise and Government of the Punjab for their cooperation. We appreciate the patronage and confidence placed in the Company by the Development Financial Institutions and commercial banks. We are thankful to our valued customers and expect growing business relationship with them. To our stakeholders we are grateful for their faith in the Company. We greatly value their trust. We also greatly appreciate the continued hard work by the management and staff of the Company.
On behalf of the Board
Jafferali M. FeerastaChairman
Lahore:
27 September 2014
A N N U A L R E P O R T 2 0 1 4
16 RUPALI POLYESTER LIMITED

A N N U A L R E P O R T 2 0 1 4
17RUPALI POLYESTER LIMITED
By order of the Board
S. Ghulam Shabbir Gilani
Company Secretary
Lahore
27 September 2014
Notice is hereby given that the Thirty Fourth Annual General Meeting of Rupali Polyester Limited (“the Company”)
will be held at Rupali House, 241-242 Upper Mall Scheme, Anand Road, Lahore on Friday, 31 October 2014 at
10:00 a.m. to transact the following business:
Ordinary Business:
1) To confirm the minutes of Thirty Third Annual General Meeting of the Company held on 31 October 2013.
2) To receive, consider and adopt Annual Audited Accounts of the Company together with the Directors and
Auditors Reports thereon for the year ended 30 June 2014.
3) To appoint Auditors of the Company and to fix their remuneration. The retiring Auditors M/s. Qavi & Co.,
Chartered Accountants being eligible have offered themselves for reappointment.
4) To transact such other ordinary business as may be placed before the meeting with the permission of the Chair.
Notice of Meeting
Notes:
1) Share transfer books of the Company will remain closed from 22 October 2014 to 31 October 2014 (both
days inclusive).
2) A member entitled to attend and vote at this meeting may appoint another member as his or her proxy to
attend and vote. Proxies in order to be effective must be received at the registered office of the Company
not less than 48 hours before the time of holding the meeting.
3) Accountholders/sub-accountholders holding book entry securities of the Company in Central Depository
System (CDS) of Central Depository Company of Pakistan Limited (CDC) who wish to attend the Annual
General Meeting are requested to please bring their original Computerized National Identity Card (CNIC)
or original passport with a photocopy duly attested by their bankers alongwith participant’s I.D. number
and their account number in CDS for identification purposes.
In case of corporate entity, the Board of Directors’ resolution/power of attorney with specimen signature
of the nominee together with the original proxy form duly filled in must be received at the registered office
of the Company not less than 48 hours before the time of holding the meeting. The nominees shall produce
their original CNIC or original passport at the time of attending the meeting for identification purpose.
4) Submission of copy of CNIC (Mandatory):
In order to comply with the directives of the Securities and Exchange Commission of Pakistan (SECP)
issued from time to time, the shareholders are requested to kindly send photocopy of their CNICs to us
immediately at our address “Rupali House, 241-242 Upper Mall Scheme, Anand Road, Lahore-54000 or
our Share Registrar M/s. THK Associates (Pvt.) Limited, Ground Floor, State Life Building No. 3,
Dr. Ziauddin Ahmed Road, Karachi – 75530”. The shareholders who have already provided CNIC number
to us need not re-submit it unless the CNIC is expired. Corporate shareholders are requested to provide
their National Tax Numbers (NTN).
5) Shareholders are requested to notify any change in their addresses immediately.
A N N U A L R E P O R T 2 0 1 4
18 RUPALI POLYESTER LIMITED

Statement under Rule 4(2) of the Companies
(Investment in Associated Companies or Associated Undertakings)
Regulations, 2012
Name of the investee Company
Total Investment Approved
Amount of investment made to date
Reason for not having made complete investment so
far where resolution required it to be implemented in
specified time.
Material Change in financial statement of associated
company or associated undertaking since date of the
resolution passed for approval of investment in such
company.
Rupafil PowerGen (Pvt.) Limited
Upto Rupees Two Hundred Million was approved by
the members in their meeting held on 31 October
2013 for a period of three (3) years.
NIL
Owing to some alternate energy-related plans,
including BMR of in-house power generation facilities
and other workable solutions for energy cost control,
the Company kept the investment in Associated
Company in abeyance and during the year ended
30 June 2014 no funds were released to the
Associated Company.
NIL
A N N U A L R E P O R T 2 0 1 4
19RUPALI POLYESTER LIMITED

RUPALI POLYESTER LIMITED
A N N U A L R E P O R T 2 0 1 4
20
Name of Company -
Year Ended -
This statement is being presented to comply with the Code of Corporate Governance contained in RegulationNo. 35 of listing regulations of Karachi, Lahore and Islamabad Stock Exchanges for the purpose of establishinga framework of good governance, whereby a listed company is managed in compliance with the best practicesof corporate governance. The Company has applied the principles contained in the CCG in the followingmanner:
1. The Company encourages representation of independent non-executive directors and directorsrepresenting minority interests on its board of directors. At present the Board includes:
Independent Directors Mr. Sultan Ali Rajwany
Executive Directors Mr. Nooruddin Feerasta
Mr. Abdul Hayee
Non-Executive Directors Mr. Jafferali M. Feerasta
Mr. Muhammad Rashid Zahir
Mr. Muhammad Ali H. Sayani
Mr. Amin A. Feerasta
The independent director meets the criteria of independence under clause i(b) of CCG.
2. The directors have confirmed that none of them is serving as a director in more than seven listedcompanies, including this Company (excluding the listed subsidiaries of listed holding Companies whereapplicable).
3. All the resident directors of the Company are registered as taxpayers and none of them has defaulted inpayment of any loan to a banking company, a DFI or an NBFI or, being a member of a stock exchange, hasbeen declared as a defaulter by that stock exchange.
4. During the year no casual vacancy occurred on the Board.
5. The Company has prepared a “Code of Conduct” and has ensured that appropriate steps have been takento disseminate it throughout the Company along with its supporting policies and procedures.
6. The board has developed a vision/mission statement, overall corporate strategy and significant policies ofthe Company. A complete record of particulars of significant policies along with the dates on which theywere approved or amended has been maintained.
7. All the powers of the board have been duly exercised and decisions on material transactions, includingappointment and determination of remuneration and terms and conditions of employment of the CEO,other executive and non-executive directors have been taken by the board/shareholders.
8. The meetings of the Board were presided over by the Chairman, and in his absence, by a director electedby the board for this purpose and the board met at least once in every quarter. Written notices of the boardmeetings, along with agenda and working papers, were circulated at least seven days before themeetings. The minutes of the meetings were appropriately recorded and circulated.
9. The directors are fully in compliance with the provision with regard to their training programs.
Rupali Polyester Limited
30 June 2014
Category Names
Statement of Compliancewith the Code of Corporate Governance

10. The board has approved appointment of CFO, Company Secretary and Head of Internal Audit, includingtheir remuneration and terms and conditions of employment.
11. The directors' report for this year has been prepared in compliance with the requirements of the CCG andfully describes the salient matters required to be disclosed.
12. The financial statements of the Company were duly endorsed by the CEO and CFO before approval of theboard.
13. The directors, CEO and executives do not hold any interest in the shares of the Company other than thatdisclosed in the pattern of shareholding.
14. The Company has complied with all the corporate and financial reporting requirements of the CCG.
15. The board has formed an audit committee. It comprises 3 members, all of whom are non-executivedirectors and the Chairman of the committee is an independent director.
16. The meetings of the audit committee were held at least once every quarter prior to approval of interim andfinal results of the Company and as required by the CCG. The terms of reference of the committee havebeen formed and advised to the committee for compliance.
17. The board has formed an HR and Remuneration Committee. It comprises 3 members, majority of whomare non-executive directors and the Chairman of the committee is a non-executive director.
18. The board has set-up an effective internal audit function.
19. The statutory auditors of the Company have confirmed that they have been given a satisfactory ratingunder the quality control review program of the ICAP, that they or any of the partners of the firm, theirspouses and minor children do not hold shares of the Company and that the firm and all its partners are incompliance with International Federation of Accountants (IFAC) guidelines on code of ethics as adopted bythe ICAP.
20. The statutory auditors or the persons associated with them have not been appointed to provide otherservices except in accordance with the listing regulations and the auditors have confirmed that they haveobserved IFAC guidelines in this regard.
21. The 'closed period', prior to the announcement of interim/final results, and business decisions, which maymaterially affect the market price of Company's securities, was determined and intimated to directors,employees and stock exchanges.
22. Material/price sensitive information has been disseminated among all market participants at once throughstock exchanges.
23. The board evaluation is being implemented.
24. We confirm that all other material principles enshrined in the CCG have been complied with.
For and on behalf of the Board of Directors
Nooruddin Feerasta
Chief Executive Officer
Lahore:
27 September 2014
A N N U A L R E P O R T 2 0 1 4
21RUPALI POLYESTER LIMITED
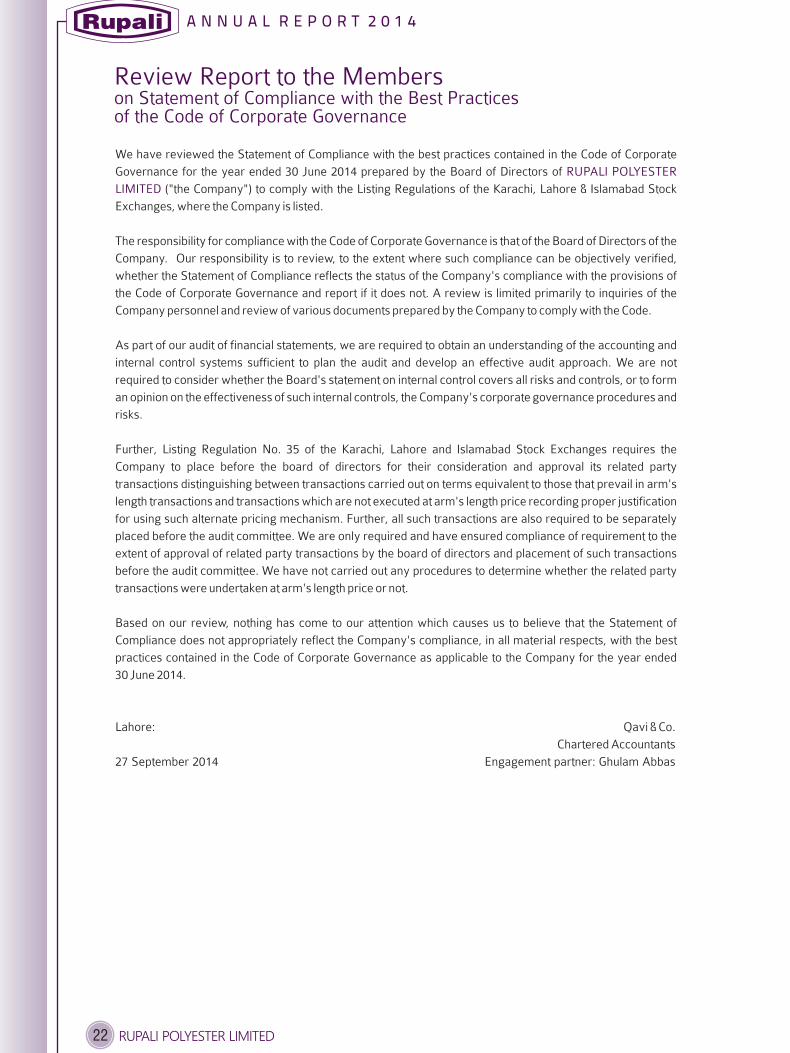
Review Report to the Memberson Statement of Compliance with the Best Practicesof the Code of Corporate Governance
We have reviewed the Statement of Compliance with the best practices contained in the Code of Corporate
Governance for the year ended 30 June 2014 prepared by the Board of Directors of
("the Company") to comply with the Listing Regulations of the Karachi, Lahore & Islamabad Stock
Exchanges, where the Company is listed.
The responsibility for compliance with the Code of Corporate Governance is that of the Board of Directors of the
Company. Our responsibility is to review, to the extent where such compliance can be objectively verified,
whether the Statement of Compliance reflects the status of the Company's compliance with the provisions of
the Code of Corporate Governance and report if it does not. A review is limited primarily to inquiries of the
Company personnel and review of various documents prepared by the Company to comply with the Code.
As part of our audit of financial statements, we are required to obtain an understanding of the accounting and
internal control systems sufficient to plan the audit and develop an effective audit approach. We are not
required to consider whether the Board's statement on internal control covers all risks and controls, or to form
an opinion on the effectiveness of such internal controls, the Company's corporate governance procedures and
risks.
Further, Listing Regulation No. 35 of the Karachi, Lahore and Islamabad Stock Exchanges requires the
Company to place before the board of directors for their consideration and approval its related party
transactions distinguishing between transactions carried out on terms equivalent to those that prevail in arm's
length transactions and transactions which are not executed at arm's length price recording proper justification
for using such alternate pricing mechanism. Further, all such transactions are also required to be separately
placed before the audit committee. We are only required and have ensured compliance of requirement to the
extent of approval of related party transactions by the board of directors and placement of such transactions
before the audit committee. We have not carried out any procedures to determine whether the related party
transactions were undertaken at arm's length price or not.
Based on our review, nothing has come to our attention which causes us to believe that the Statement of
Compliance does not appropriately reflect the Company's compliance, in all material respects, with the best
practices contained in the Code of Corporate Governance as applicable to the Company for the year ended
30 June 2014.
Lahore: Qavi & Co.
Chartered Accountants
27 September 2014 Engagement partner: Ghulam Abbas
RUPALI POLYESTER
LIMITED
A N N U A L R E P O R T 2 0 1 4
22 RUPALI POLYESTER LIMITED

Auditors' Report to the Members
We have audited the annexed balance sheet of as at 30 June 2014 and the
related profit and loss account, statement of comprehensive income, cash flow statement and statement
of changes in equity together with the notes forming part thereof, for the year then ended and we state
that we have obtained all the information and explanations which, to the best of our knowledge and belief,
were necessary for the purposes of our audit.
It is the responsibility of the Company’s management to establish and maintain a system of internal
control, and prepare and present the above said statements in conformity with the approved accounting
standards and the requirements of the Companies Ordinance, 1984. Our responsibility is to express an
opinion on these statements based on our audit.
We conducted our audit in accordance with the auditing standards as applicable in Pakistan. These
standards require that we plan and perform the audit to obtain reasonable assurance about whether the
above said statements are free of any material misstatement. An audit includes examining, on a test basis,
evidence supporting the amounts and disclosures in the above said statements. An audit also includes
assessing the accounting policies and significant estimates made by management, as well as, evaluating
the overall presentation of the above said statements. We believe that our audit provides a reasonable
basis for our opinion and, after due verification, we report that:
a) in our opinion, proper books of account have been kept by the Company as required by the
Companies Ordinance, 1984;
b) in our opinion:
i) the balance sheet and profit and loss account together with the notes thereon have been
drawn up in conformity with the Companies Ordinance, 1984, and are in agreement with the
books of account and are further in accordance with accounting policies consistently applied
;
ii) the expenditure incurred during the year was for the purpose of the Company's business;
and
iii) the business conducted, investments made and the expenditure incurred during the year
were in accordance with the objects of the Company;
c) in our opinion and to the best of our information and according to the explanations given to us, the
balance sheet, profit and loss account, statement of comprehensive income, cash flow statement
and statement of changes in equity together with the notes forming part thereof conform with
approved accounting standards as applicable in Pakistan, and give the information required by
the Companies Ordinance, 1984 in the manner so required and respectively give a true and fair
view of the state of the Company’s affairs as at 30 June 2014 and of the loss, total
comprehensive income, its cash flows and changes in the equity for the year then ended; and
d) in our opinion Zakat deductible at source under the Zakat and Ushr Ordinance, 1980 (XVIII of
1980), was deducted by the Company and deposited in the Central Zakat Fund established under
Section 7 of that Ordinance.
Lahore: Qavi & Co.Chartered Accountants
27 September 2014 Engagement partner: Ghulam Abbas
RUPALI POLYESTER LIMITED
A N N U A L R E P O R T 2 0 1 4
23RUPALI POLYESTER LIMITED
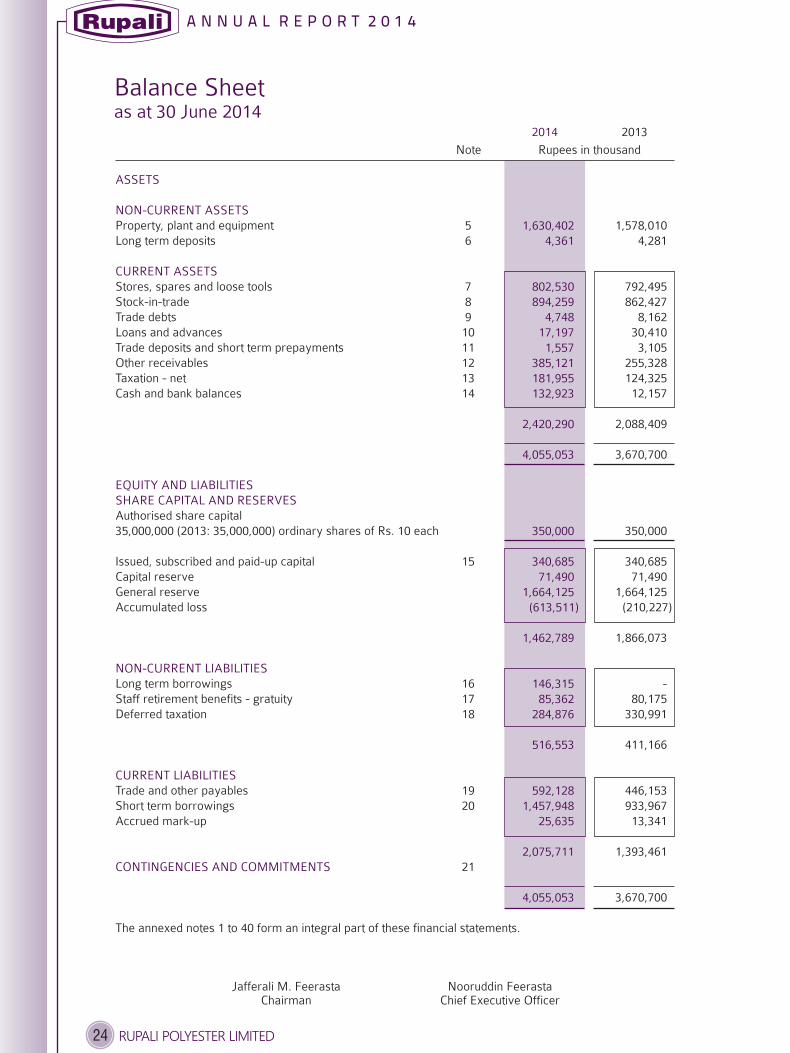
Balance Sheetas at 30 June 2014
A N N U A L R E P O R T 2 0 1 4
24 RUPALI POLYESTER LIMITED
Note Rupees in thousand
2014 2013
ASSETS
NON-CURRENT ASSETS1,630,402
4,361
CURRENT ASSETS802,530894,259
4,74817,1971,557
385,121181,955132,923
2,420,290
4,055,053
EQUITY AND LIABILITIESSHARE CAPITAL AND RESERVES
350,000
340,68571,490
1,664,125(613,511)
1,462,789
NON-CURRENT LIABILITIES146,31585,362
284,876
516,553
CURRENT LIABILITIES592,128
1,457,94825,635
2,075,711CONTINGENCIES AND COMMITMENTS
4,055,053
Property, plant and equipment 5 1,578,010Long term deposits 6 4,281
Stores, spares and loose tools 7 792,495Stock-in-trade 8 862,427Trade debts 9 8,162Loans and advances 10 30,410Trade deposits and short term prepayments 11 3,105Other receivables 12 255,328Taxation - net 13 124,325Cash and bank balances 14 12,157
2,088,409
3,670,700
Authorised share capital35,000,000 (2013: 35,000,000) ordinary shares of Rs. 10 each 350,000
Issued, subscribed and paid-up capital 15 340,685Capital reserve 71,490General reserve 1,664,125Accumulated loss (210,227)
1,866,073
Long term borrowings 16 -Staff retirement benefits - gratuity 17 80,175Deferred taxation 18 330,991
411,166
Trade and other payables 19 446,153Short term borrowings 20 933,967Accrued mark-up 13,341
1,393,46121
3,670,700
The annexed notes 1 to 40 form an integral part of these financial statements.
Jafferali M. FeerastaChairman
Nooruddin FeerastaChief Executive Officer

A N N U A L R E P O R T 2 0 1 4
25RUPALI POLYESTER LIMITED
Profit and Loss Accountfor the year ended 30 June 2014
Note Rupees in thousand
2014 2013
Sales 22 6,091,802
Cost of goods sold 23 (6,317,322)
(225,520)
Selling and distribution expenses 24 (15,706)
Administrative and general expenses 25 (126,904)
Other operating charges 26 (20)
Other operating income 27 92,368
(275,782)
Finance cost 28 (81,965)
(357,747)
Taxation 29 (78,853)
(436,600)
Rupees
30 (12.82)
The annexed notes 1 to 40 form an integral part of these financial statements.
5,952,659
(6,219,222)
Gross loss (266,563)
(10,538)
(133,207)
-
48,887
Operating loss (361,421)
(118,437)
Loss before taxation (479,858)
76,574
Loss after taxation (403,284)
Earnings per share - basic and diluted (11.84)
Jafferali M. FeerastaChairman
Nooruddin FeerastaChief Executive Officer
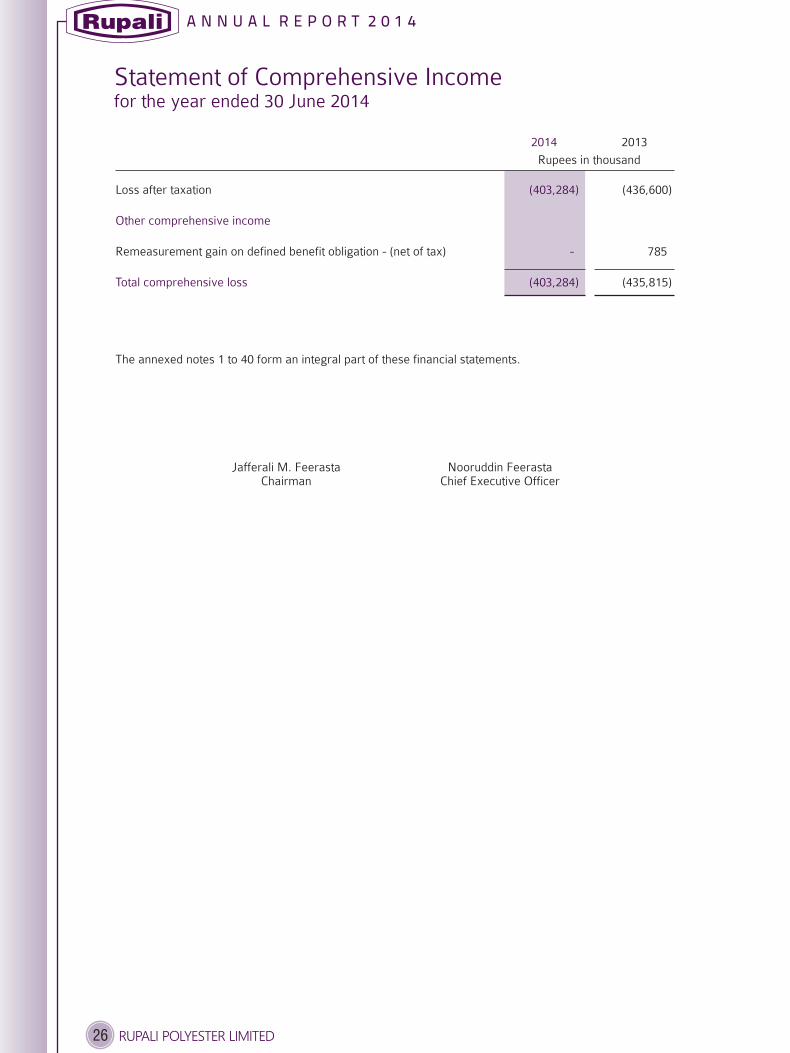
A N N U A L R E P O R T 2 0 1 4
26 RUPALI POLYESTER LIMITED
Statement of Comprehensive Incomefor the year ended 30 June 2014
Rupees in thousand
2014 2013
Loss after taxation (436,600)
Remeasurement gain on defined benefit obligation - (net of tax) 785
(435,815)
The annexed notes 1 to 40 form an integral part of these financial statements.
(403,284)
Other comprehensive income
-
Total comprehensive loss (403,284)
Jafferali M. FeerastaChairman
Nooruddin FeerastaChief Executive Officer
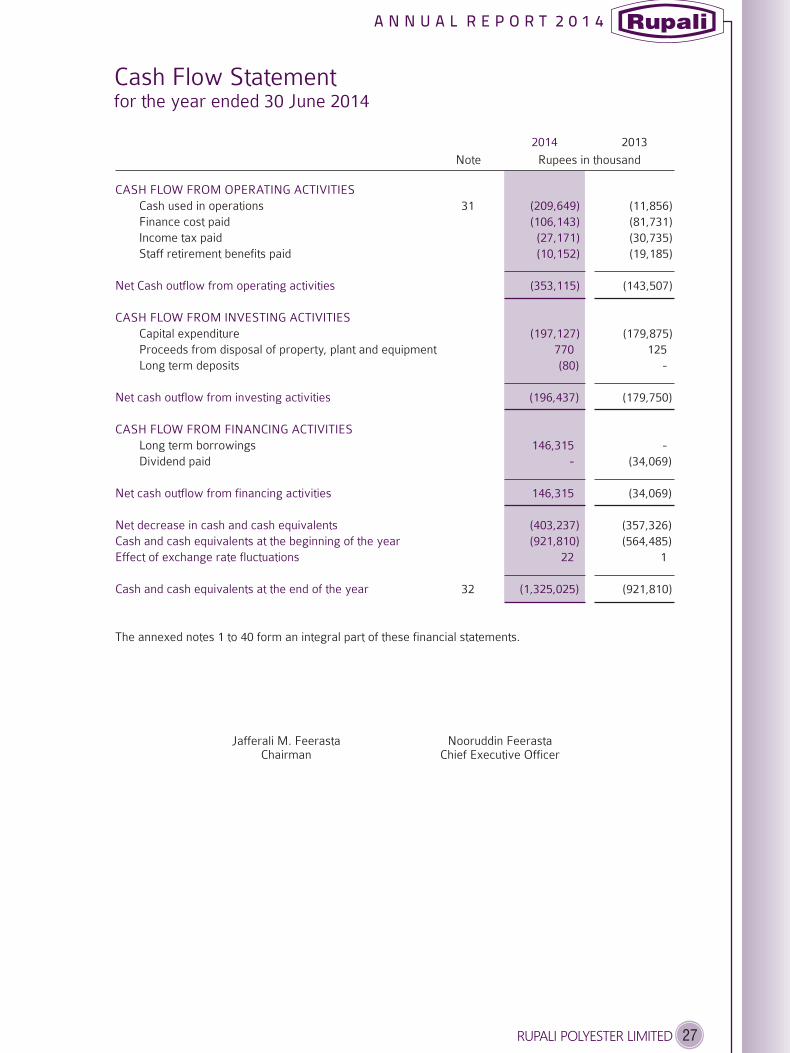
A N N U A L R E P O R T 2 0 1 4
27RUPALI POLYESTER LIMITED
Cash Flow Statementfor the year ended 30 June 2014
Note Rupees in thousand
2014 2013
CASH FLOW FROM OPERATING ACTIVITIES
(209,649)
(106,143)
(27,171)
(10,152)
Net Cash outflow from operating activities (353,115)
CASH FLOW FROM INVESTING ACTIVITIES
(197,127)
770
(80)
Net cash outflow from investing activities (196,437)
CASH FLOW FROM FINANCING ACTIVITIES
146,315
-
Net cash outflow from financing activities 146,315
Net decrease in cash and cash equivalents (403,237)
Cash and cash equivalents at the beginning of the year (921,810)
Effect of exchange rate fluctuations 22
Cash and cash equivalents at the end of the year (1,325,025)
Cash used in operations 31 (11,856)
Finance cost paid (81,731)
Income tax paid (30,735)
Staff retirement benefits paid (19,185)
(143,507)
Capital expenditure (179,875)
Proceeds from disposal of property, plant and equipment 125
Long term deposits -
(179,750)
Long term borrowings -
Dividend paid (34,069)
(34,069)
(357,326)
(564,485)
1
32 (921,810)
The annexed notes 1 to 40 form an integral part of these financial statements.
Jafferali M. FeerastaChairman
Nooruddin FeerastaChief Executive Officer
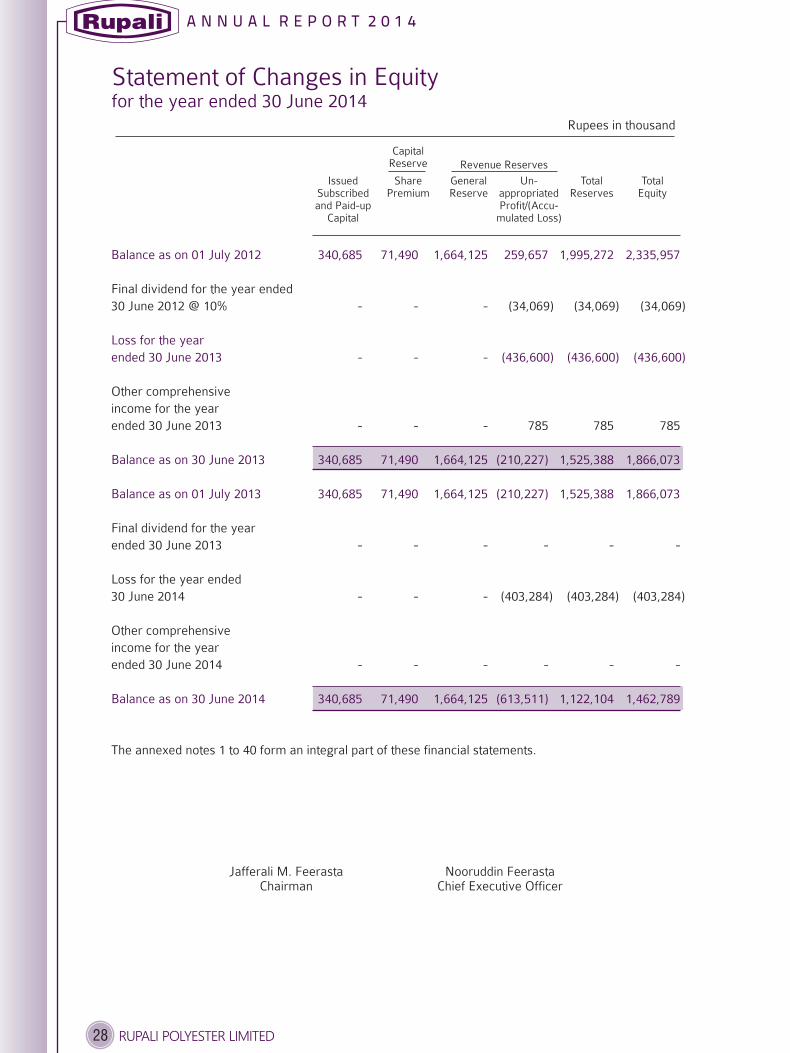
A N N U A L R E P O R T 2 0 1 4
28 RUPALI POLYESTER LIMITED
Statement of Changes in Equityfor the year ended 30 June 2014
Rupees in thousand
CapitalReserve
IssuedSubscribedand Paid-up
Capital
SharePremium
GeneralReserve
Un-appropriatedProfit/(Accu-
mulated Loss)
TotalReserves
TotalEquity
Revenue Reserves
Balance as on 01 July 2012 340,685 71,490 1,664,125 259,657 1,995,272 2,335,957
Loss for the year
ended 30 June 2013 - - - (436,600) (436,600) (436,600)
Balance as on 30 June 2013 340,685 71,490 1,664,125 (210,227) 1,525,388 1,866,073
Balance as on 01 July 2013 340,685 71,490 1,664,125 (210,227) 1,525,388 1,866,073
Balance as on 30 June 2014 340,685 71,490 1,664,125 (613,511) 1,122,104 1,462,789
Final dividend for the year ended
30 June 2012 @ 10% - - - (34,069) (34,069) (34,069)
Other comprehensive
income for the year
ended 30 June 2013 - - - 785 785 785
Final dividend for the year
ended 30 June 2013 - - - - - -
Loss for the year ended
30 June 2014 - - - (403,284) (403,284) (403,284)
Other comprehensive
income for the year
ended 30 June 2014 - - - - - -
The annexed notes 1 to 40 form an integral part of these financial statements.
Jafferali M. FeerastaChairman
Nooruddin FeerastaChief Executive Officer

Notes to the Financial Statementsfor the year ended 30 June 20141. Legal status and nature of business
RUPALI POLYESTER LIMITED
2. Basis of preparation
2.1
2.2 Initial application of standards, amendments or an interpretation to existing standards
2.2.1 Standards, amendments to published standards and interpretations that become effective
during the year ended 30 June 2014
2.3 The International Accounting Standards Board (IASB) has also issued the following standards which
have not been adopted locally by the Securities and Exchange Commission of Pakistan (SECP):
Effective for
Periods Beginning
on or after
2.4
("the Company") was incorporated in Pakistan on 24 May 1980 under the
Companies Act, 1913 (now the Companies Ordinance, 1984) as a Public Limited Company and is quoted
on the Karachi, Lahore and Islamabad Stock Exchanges. The registered office of the Company is situated
at 241-242 Upper Mall Scheme, Anand Road, Lahore. It is principally engaged in the manufacture and sale
of polyester products.
These financial statements have been prepared in accordance with approved accounting standards
as applicable in Pakistan and requirements of Companies Ordinance, 1984. Approved accounting
standards comprise of such International Financial Reporting Standards (IFRS) issued by the
International Accounting Standards Board (IASB) as are notified under the Companies Ordinance,
1984, provisions of and directives issued under the Companies Ordinance, 1984. Wherever the
requirements of the Companies Ordinance, 1984 or directives issued by Securities and Exchange
Commission of Pakistan differ with the requirements of IFRS, the requirements of the Companies
Ordinance, 1984 or the requirements of the said directives shall prevail.
There were certain new amendments to the approved accounting standards and a new
interpretation issued by the International Financial Reporting Interpretations Committee
(IFRIC) which became effective during the year but are considered not to be relevant or have
any significant effect on the Company's operations and are, therefore, not disclosed in these
financial statements.
IFRS 1 - First Time Adoption of International Financial Reporting Standards 01 January 2013
IFRS 9 - Financial Instruments 01 January 2015
IFRIC 21 - Levies 01 January 2014
The following interpretations issued by IASB have been waived off by Securities and Exchange
Commission of Pakistan (SECP) effective 16 January 2012:
IFRIC 4 - Determining whether an arrangement contains lease
IFRIC 12 - Service concession arrangements
3. Basis of measurement
3.1 These financial statements have been prepared under the historical cost convention.
A N N U A L R E P O R T 2 0 1 4
29RUPALI POLYESTER LIMITED

The Company's significant accounting policies are stated in note 4. Not all of these significant policies
require the management to make difficult, subjective or complex judgments or estimates. The
following is intended to provide an understanding of the policies the management considers critical
because of their complexity, judgment of estimation involved in their application and their impact on
these financial statements. Estimates and judgments are continually evaluated and are based on
historical experience, including expectations of future events that are believed to be reasonable under
the circumstances. These judgments involve assumptions or estimates in respect of future events and
the actual results may differ from these estimates. The areas involving a higher degree of judgments
or complexity or areas where assumptions and estimates are significant to the financial statements
are as follows:
The Company takes into account the current income tax law and the decisions taken by
appellate authorities. Instances where the Company's view differs from the view taken by the
income tax department at the assessment stage and where the Company considers that its
views on items of material nature are in accordance with law, the amounts are disclosed as
contingent liabilities.
The Company reviews the useful lives of property, plant and equipment on regular basis. Any
change in estimates in future years might affect the carrying amounts of the respective items of
property, plant and equipment with a corresponding effect on the depreciation charge and
impairment.
The significant accounting policies adopted in the preparation of these financial statements are set out
below. These policies have been consistently applied to all years presented, unless otherwise stated.
The Company operates an Unfunded Defined Benefit Gratuity Scheme for all its permanent
employees who attain the minimum qualification period for entitlement to gratuity. The
provision is made on the basis of actuarial recommendation to cover the obligation under the
scheme for all employees eligible to gratuity benefits. The Company conducts actuarial
valuation after every two years and the latest actuarial valuation being carried out at
30 June 2013 (refer note 17).
3.2
a) Provision for taxation
b) Useful lives and residual values of property, plant and equipment
4. Significant accounting policies
4.1 Staff Retirement Benefits
4.1.1 Defined Benefit Plan - Gratuity
The Company operates an approved provident fund scheme which covers all permanent
employees. Equal monthly contributions are made by the Company and employees.
Contribution is made by the Company at the rate of 8.33 % of basic salary.
4.1.2 Defined Contribution Plan - Provident Fund
A N N U A L R E P O R T 2 0 1 4
30 RUPALI POLYESTER LIMITED

Provision for current taxation is based on taxable income at the current rates of taxation after
taking into account tax credits and rebates available, if any. The charge for the current tax also
includes adjustments where necessary, relating to prior years which arise from assessments
framed / finalised during the year.
Deferred tax is provided in full using the balance sheet liability method on all temporary
differences arising at the balance sheet date, between the tax bases of assets and the liabilities
and their carrying amounts. Deferred tax liabilities are generally recognised for all taxable
temporary differences and deferred tax assets are recognised for all deductible temporary
differences, unused tax losses and unused tax credits to the extent that it is probable that future
taxable profits will be available against which these can be utilised.
Deferred tax is calculated at the rates that are expected to apply to the period when the
differences reverse based on tax rates that have been enacted or substantively enacted by the
balance sheet date. In this regard, the effects on the deferred taxation of the portion of income
expected to be subject to final tax regime is adjusted in accordance with the requirement of
Accounting Technical Release - 27 of the Institute of Chartered Accountants of Pakistan.
Deferred tax is charged or credited to income.
The Company accounts for compensated absences in the accounting period in which these are
earned.
Liabilities for trade and other amounts payable are recognized and carried at cost which is the fair
value of the consideration to be paid in the future for goods and services received, whether or not
billed to the Company.
A provision is recognized in the balance sheet when the Company has a present legal or constructive
obligation as a result of past event, it is probable that an outflow of resources embodying economic
benefits will be required to settle the obligation and a reliable estimate can be made of the amount of
the obligation. Provisions are determined by discounting future cash flows and appropriate discount
rate wherever required. Provisions are reviewed at each balance sheet date and adjusted to reflect
current best estimate.
Borrowings are recorded at the proceeds received. Financial charges are accounted for on an accrual
basis and are disclosed as ‘Mark-up Accrued’ to the extent of the amount remaining unpaid.
4.2 Taxation
4.2.1 Current
4.2.2 Deferred
4.3 Compensated Absences
4.4 Trade and Other Payables
4.5 Provisions
4.6 Borrowings and Borrowing Cost
A N N U A L R E P O R T 2 0 1 4
31RUPALI POLYESTER LIMITED

All mark-up, interest and other charges on long term and short term borrowings are charged to profit
in the period in which they are incurred.
Borrowing cost directly attributable to the acquisition, construction or production of qualifying assets,
which are assets that necessarily take a substantial period of time to get ready for their intended use
are added to the cost of those assets, until such time as the assets are ready for their intended use.
These are stated at cost less accumulated depreciation less accumulated impairment losses, if
any, except for freehold land and leasehold land which are stated at cost.
Depreciation on Operating Fixed Assets is calculated on reducing balance method. Full
month's depreciation is charged in the month of addition, whereas no depreciation is charged
in the month of disposal or deletion of assets. Rates of depreciation, which are disclosed in note
5, are determined to allocate the cost of an asset less estimated residual value, if significant,
over its useful life.
The assets' residual values and useful lives are reviewed, and adjusted if significant, at each
balance sheet date.
Disposal of assets is recognised when significant risks and reward incidental to the ownership
have been transferred to buyers. Gains/losses on disposal of assets are recognised in
income/expense in the year of disposal.
Normal repairs and maintenance costs are charged to the profit and loss account as and when
incurred. Major renewals and improvements are capitalized and the assets so replaced, if any,
are retired.
Capital Work-in-progress is stated at cost and consists of expenditure incurred, advances
made and other directly attributable costs in respect of operating fixed assets in the course of
their construction and installation. Transfers are made to relevant operating fixed assets
category as and when assets are available for use.
The carrying amounts of the Company's assets are reviewed at each balance sheet date to determine
whether there is any indication of impairment loss. If any such indication exists, the asset's
recoverable amount is estimated to determine the extent of impairment loss, if any. An impairment
loss is recognized for the amount by which the assets carrying amount exceeds its recoverable
amount. The recoverable amount is the higher of an assets fair value less costs to sell and value in use.
Impairment losses are charged to profit and loss.
4.7 Property, Plant and Equipment
4.7.1 Operating Fixed Assets
4.7.2 Capital Work-in-Progress
4.8 Impairment
A N N U A L R E P O R T 2 0 1 4
32 RUPALI POLYESTER LIMITED

An impairment loss is reversed if there has been a change in the estimates used to determine the
recoverable amount. An impairment loss is reversed only to the extent that the asset carrying amount
does not exceed the carrying amount that would have been determined, net of depreciation or
amortization, if no impairment loss had been recognized.
The Company classifies its financial assets in the following categories:
- at fair value through profit or loss;
- loans and receivables;
- available for sale; and
- held to maturity.
The classification depends on the purpose for which the financial assets were acquired.
Management determines the classification of its financial assets at the time of initial
recognition.
Financial assets at fair value through profit or loss are financial assets held for trading and
financial assets designated upon initial recognition as at fair value through profit or loss. A
financial asset is classified as held for trading if acquired principally for the purpose of
selling in the short term. Assets in this category are classified as current assets.
Loans and receivables are non-derivative financial assets with fixed or determinable
payments that are not quoted in an active market. They are included in current assets,
except for maturities greater than twelve months after the balance sheet date, which are
classified as non-current assets. Loans and receivables comprise advances, deposits and
other receivables and cash and cash equivalents in the balance sheet.
Available-for-sale financial assets are non-derivatives that are either designated in this
category or not classified in any of the other categories. They are included in non-current
assets unless management intends to dispose off the investments within twelve months
from the balance sheet date.
Financial assets with fixed or determinable payments and fixed maturity, where
management has the intention and ability to hold till maturity are classified as held to
maturity and are stated at amortised cost.
4.9 Financial instruments
4.9.1 Financial assets
a) At fair value through profit or loss
b) Loans and receivables
c) Available-for-sale financial assets
d) Held to maturity
A N N U A L R E P O R T 2 0 1 4
33RUPALI POLYESTER LIMITED

All financial assets are recognised at the time when the Company becomes a party to the
contractual provisions of the instrument. Regular purchases and sales of investments are
recognised on trade-date – the date on which the Company commits to purchase or sell the
asset. Financial assets are initially recognised at fair value plus transaction costs for all financial
assets not carried at fair value through profit or loss. Financial assets carried at fair value
through profit or loss are initially recognised at fair value and transaction costs are expensed in
the profit and loss account. Financial assets are derecognised when the rights to receive cash
flows from the assets have expired or have been transferred and the Company has transferred
substantially all the risks and rewards of ownership. Available-for-sale financial assets and
financial assets at fair value through profit or loss are subsequently carried at fair value. Loans
and receivables and held-to-maturity investments are carried at amortised cost using the
effective interest rate method.
Gains or losses arising from changes in the fair value of the 'financial assets at fair value
through profit or loss' category are presented in the profit and loss account in the period in
which they arise. Dividend income from financial assets at fair value through profit or loss is
recognised in the profit and loss account as part of other income when the Company's right to
receive payments is established.
Changes in the fair value of securities classified as available-for-sale are recognised in equity.
When securities classified as available-for-sale are sold or impaired, the accumulated fair
value adjustments recognised in equity are included in the profit and loss account as gains and
losses from investment securities. Interest on available-for-sale securities calculated using the
effective interest method is recognised in the profit and loss account. Dividends on available-
for-sale equity instruments are recognised in the profit and loss account when the Company’s
right to receive payments is established.
The fair values of quoted investments are based on current prices. If the market for a financial
asset is not active (and for unlisted securities), the Company measures the investments at cost
less impairment in value, if any.
The Company assesses at each balance sheet date whether there is objective evidence that a
financial asset or a group of financial assets is impaired. If any such evidence exists for
available-for-sale financial assets, the cumulative loss is removed from equity and recognised
in the profit and loss account. Impairment losses recognised in the profit and loss account on
equity instruments are not reversed through the profit and loss account.
All financial liabilities are recognised at the time when the Company becomes a party to the
contractual provisions of the instrument.
A financial liability is derecognised when the obligation under the liability is discharged or
cancelled or expired. Where an existing financial liability is replaced by another from the same
lender on substantially different terms, or the terms of an existing liability are substantially
modified, such an exchange or modification is treated as a derecognition of the original liability
and the recognition of a new liability, and the difference in respective carrying amounts is
recognised in the profit and loss account.
4.9.2 Financial liabilities
A N N U A L R E P O R T 2 0 1 4
34 RUPALI POLYESTER LIMITED

Financial assets and financial liabilities are offset and the net amount is reported in the financial
statements only when there is a legally enforceable right to set off the recognized amount and
the Company intends either to settle on a net basis or to realize the assets and to settle the
liabilities simultaneously.
These are stated at cost which represents the fair value of consideration given.
Stores, spares and loose tools are valued at lower of moving average cost and net realizable value.
Items-in-transit are valued at cost comprising invoice value plus other charges paid thereon.
Provision is made for slow moving and obsolete items.
Stock-in-trade, except for those in transit, are valued at lower of weighted average cost and net
realizable value. Items-in-transit are valued at cost comprising invoice value plus other charges
paid thereon. Cost of work-in-process and finished goods comprises direct material, labour and
appropriate manufacturing overheads.
Provision is made for slow moving and obsolete items.
Net realizable value signifies the estimated selling price in the ordinary course of business less cost
of completion and costs necessarily to be incurred in order to make a sale.
Trade debts and other receivables are stated at original invoice amount less provision for doubtful
debts, if any. Provision for doubtful debt / receivables is based on the management's assessment
of customers' outstanding balances and creditworthiness. Bad debts are written-off when
identified.
Other receivables and receivables from related parties are recognized and carried at cost.
Cash and cash equivalents are carried in the balance sheet at cost. For the purpose of cash flow
statement, cash and cash equivalents comprise cash in hand and cash with banks in current and
saving accounts.
Revenue from sales is recognized on dispatch of goods to customers and in case of export when
the goods are shipped.
4.9.3 Offsetting of financial assets and financial liabilities
4.10 Advances, deposits and prepayments
4.11 Stores, spares and loose tools
4.12 Stock-in-trade
4.13 Trade debts and other receivables
4.14 Cash and cash equivalents
4.15 Revenue recognition
A N N U A L R E P O R T 2 0 1 4
35RUPALI POLYESTER LIMITED

Revenue on bank deposits is recognized on a time proportion basis on the principal amount
outstanding and at the rate applicable.
Dividend income, if any, on equity investments is recognized as income when the right of receipt is
established.
Dividend declared and transferred between reserves made subsequent to the balance sheet date
are considered as non-adjusting events and are recognized in the financial statements in the period
in which such dividends are declared / transfers made.
All transactions with related parties are entered into at arm's length basis as disclosed in note 34
(as defined in the Companies Ordinance, 1984).
Items included in the financial statements of the Company are measured using the currency of
the primary economic environment in which the Company operates (the functional currency).
The financial statements are presented in Pak Rupees, which is the Company's functional and
presentation currency.
Foreign currency transactions are translated into Pak Rupees using the exchange rates
prevailing at the dates of the transactions. Foreign exchange gains and losses resulting from
the settlement of such transactions and from the translation at year-end exchange rates of
monetary assets and liabilities denominated in foreign currencies are recognized in the profit
and loss account.
4.16 Proposed dividend and transfer between reserves
4.17 Transactions with related parties
4.18 Foreign currency transactions and translation
a) Functional and presentation currency
b) Transactions and balances
A N N U A L R E P O R T 2 0 1 4
36 RUPALI POLYESTER LIMITED
5. Property, plant and equipment
1,532,078
98,324
1,630,402
Operating fixed assets 5.1 1,540,900
Capital work -in- progress 5.4 37,110
1,578,010
Rupees in thousand
30 June2014
30 June2013
Note

A N N U A L R E P O R T 2 0 1 4
37RUPALI POLYESTER LIMITED
5.2
Th
e d
ep
recia
tion
charg
e h
as
been
allo
cate
d a
s follo
ws:
130,2
58
721
13,7
09
144,6
88
Co
st of G
oo
ds S
old
23
125,4
67
Sellin
g a
nd
Distrib
utio
n E
xpen
ses
24
743
Ad
min
istrative
an
d G
en
era
l Exp
en
ses
25
14,1
23
140,3
33
Op
era
ting
Fix
ed
Assets
Rup
ees in
tho
usan
d
Facto
ry o
n fre
eh
old
lan
d
Offic
e o
n fre
eh
old
lan
dO
ffice o
n le
aseh
old
lan
d
Net c
arry
ing
valu
e b
asis
Year e
nd
ed
30
Jun
e 2
01
4
Op
en
ing
net b
oo
k v
alu
e (N
BV
)
Ad
ditio
ns (a
t co
st)
Dis
po
sals
/ write
offs
(at N
BV
)
Dep
recia
tion
Ch
arg
e
Clo
sin
g n
et b
oo
k v
alu
e (N
BV
)
Gro
ss c
arry
ing
valu
e b
asis
As a
t 30
Jun
e 2
01
4
Co
st
Accum
ula
ted
dep
recia
tion
Net b
oo
k v
alu
e (N
BV
)
Dep
recia
tion
rate
p.a
(%)
Net c
arry
ing
valu
e b
asis
Year e
nd
ed
30
Jun
e 2
01
3
Op
en
ing
net b
oo
k v
alu
e (N
BV
)
Ad
ditio
ns (a
t co
st)
Dis
po
sals
/ write
offs
(at N
BV
)
Dep
recia
tion
Ch
arg
e
Clo
sin
g n
et b
oo
k v
alu
e (N
BV
)
Gro
ss c
arry
ing
valu
e b
asis
As a
t 30
Jun
e 2
01
3
Co
st
Accum
ula
ted
dep
recia
tion
Net b
oo
k v
alu
e (N
BV
)
Dep
recia
tion
rate
p.a
(%)
Offic
eeq
uip
men
tO
ther
assets
Fre
eh
old
Lan
d
Build
ing
Ro
ad
sV
eh
icle
sF
urn
iture
&fittin
gs
Pla
nt a
nd
mach
inery
No
teR
up
ees in
tho
usa
nd
20
14
20
13
27,7
84---
27,7
84
27,7
84-
27,7
84-
27,7
84---
27,7
84
27,7
84-
27,7
84-
66,9
86
396-
(6,7
12)
60,6
70
218,4
76
(157,8
06)
60,6
70
10
74,1
65
253-
(7,4
32)
66,9
86
218,0
80
(151,0
94)
66,9
86
10
16,4
63--
(823)
15,6
40
25,1
88
(9,5
48)
15,6
405
17,3
30--
(867)
16,4
63
25,1
88
(8,7
25)
16,4
635
169,9
65
481-
(8,5
08)
161,9
38
220,8
73
(58,9
35)
161,9
385
178,9
11--
(8,9
46)
169,9
65
220,3
92
(50,4
27)
169,9
655
1,6
44--
(82)
1,5
62
4,8
38
(3,2
76)
1,5
625
1,7
31--
(87)
1,6
44
4,8
38
(3,1
94)
1,6
445
1,2
12,8
69
128,9
10-
(123,1
69)
1,2
18,6
10
3,0
72,2
62
(1,8
53,6
52)
1,2
18,6
10
10
963,5
88
366,9
08(1
)
(117,6
26)
1,2
12,8
69
2,9
43,3
52
(1,7
30,4
83)
1,2
12,8
69
10
13,3
65
122-
(1,3
40)
12,1
47
30,1
58
(18,0
11)
12,1
47
10
14,3
04
521-
(1,4
60)
13,3
65
30,0
36
(16,6
71)
13,3
65
10
3,9
62
2,8
89
(37)
(1,1
39)
5,6
75
17,7
29
(12,0
54)
5,6
75
20
4,8
83
136
(97)
(960)
3,9
62
15,9
48
(11,9
86)
3,9
62
20
24,9
65
3,0
25
(10)
(2,6
20)
25,3
60
75,2
87
(49,9
27)
25,3
60
10
25,7
84
1,8
56
(42)
(2,6
33)
24,9
65
72,3
41
(47,3
76)
24,9
65
10
2,8
97
90-
(295)
2,6
92
6,8
01
(4,1
09)
2,6
92
10
3,2
24-(5
)
(322)
2,8
97
6,7
11
(3,8
14)
2,8
97
10
5.1
To
tal
1,5
40,9
00
135,9
13
(47)
(144,6
88)
1,5
32,0
78
3,6
99,3
96
(2,1
67,3
18)
1,5
32,0
78-
1,3
11,7
04
369,6
74
(145)
(140,3
33)
1,5
40,9
00
3,5
64,6
70
(2,0
23,7
70)
1,5
40,9
00-

A N N U A L R E P O R T 2 0 1 4
38 RUPALI POLYESTER LIMITED
Vehicles
Office equipment
2014 1,186 1,139 47 770 723
Mazda van 699 684 15 450 435 Negotiation Muhammad Faraz
Coure Car 409 387 22 320 298 Negotiation Muhammad Shakeel
1,108 1,071 37 770 733
Air conditioners 62 57 5 - (5) Salvage -
Electric water cooler 16 11 5 - (5) Salvage -
78 68 10 - (10)
2013 567 422 145 125 (20)
Rupees in thousand
2014 2013
5.3 Disposal of Operating Fixed Assets:
The following assets were disposed off during the year: Rupees in thousand
Particulars of Assets
Gain /
(Loss) on
Disposal
Mode of
DisposalParticulars of BuyersCost
Accumu-
lated
Depreciation
Book
Value
Sale
Proceeds
5.4 Capital work-in-progress
12,810
85,173
111
230
-
98,324
-
-
98,324
6. Long term deposits
4,361
7. Stores, spares and loose tools
126,042
5,002
131,044
656,890
8,696
665,586
5,900
802,530
4,361
Civil works -
Plant and machinery 1,877
Office equipment 647
Furniture and fixture 70
Other assets 43
2,637
Advances for plant and machinery 33,434
Advances for civil works 1,039
37,110
Security Deposits 4,281
Stores
- In hand 131,814
- In transit 4,222
136,036
Spares
- In hand 633,803
- In transit 16,648
650,451
Loose tools
- In hand 6,008
792,495
4,281
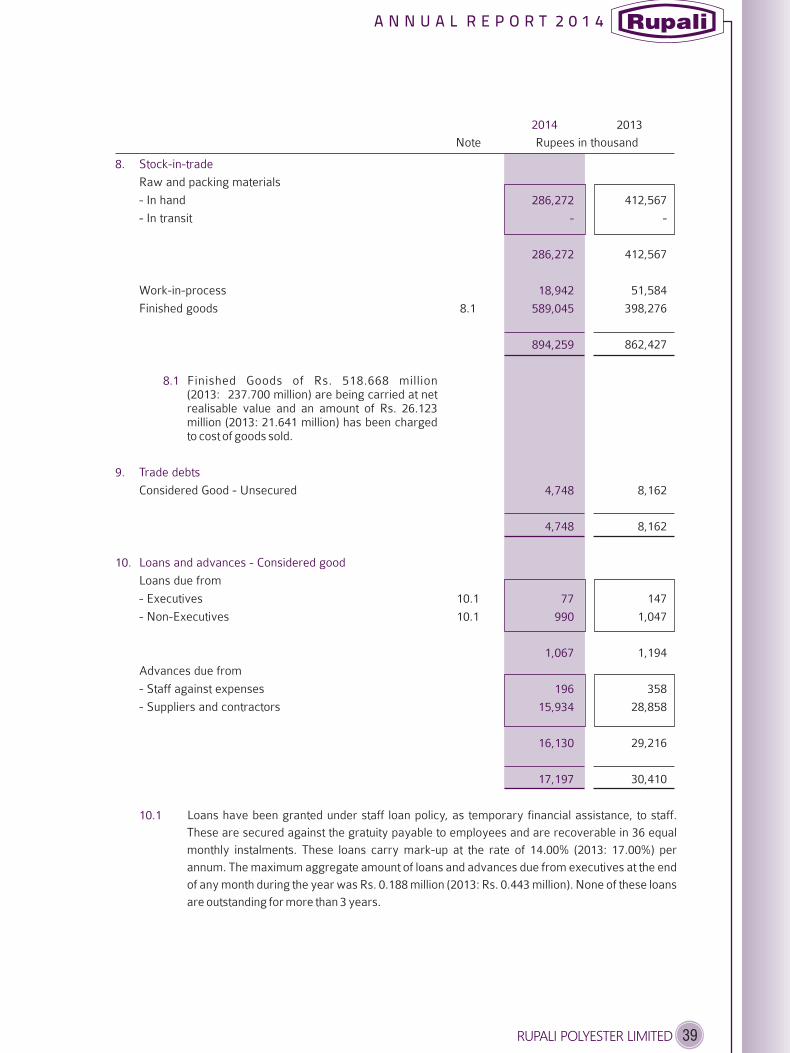
A N N U A L R E P O R T 2 0 1 4
39RUPALI POLYESTER LIMITED
8. Stock-in-trade
286,272
-
286,272
18,942
589,045
894,259
8.1
9. Trade debts
4,748
10. Loans and advances - Considered good
77
990
1,067
196
15,934
16,130
17,197
10.1
4,748
Raw and packing materials
- In hand 412,567
- In transit -
412,567
Work-in-process 51,584
Finished goods 8.1 398,276
862,427
Finished Goods of Rs. 518.668 million(2013: 237.700 million) are being carried at netrealisable value and an amount of Rs. 26.123million (2013: 21.641 million) has been chargedto cost of goods sold.
Considered Good - Unsecured 8,162
Loans due from
- Executives 10.1 147
- Non-Executives 10.1 1,047
1,194
Advances due from
- Staff against expenses 358
- Suppliers and contractors 28,858
29,216
30,410
Loans have been granted under staff loan policy, as temporary financial assistance, to staff.
These are secured against the gratuity payable to employees and are recoverable in 36 equal
monthly instalments. These loans carry mark-up at the rate of 14.00% (2013: 17.00%) per
annum. The maximum aggregate amount of loans and advances due from executives at the end
of any month during the year was Rs. 0.188 million (2013: Rs. 0.443 million). None of these loans
are outstanding for more than 3 years.
8,162
Note Rupees in thousand
2014 2013
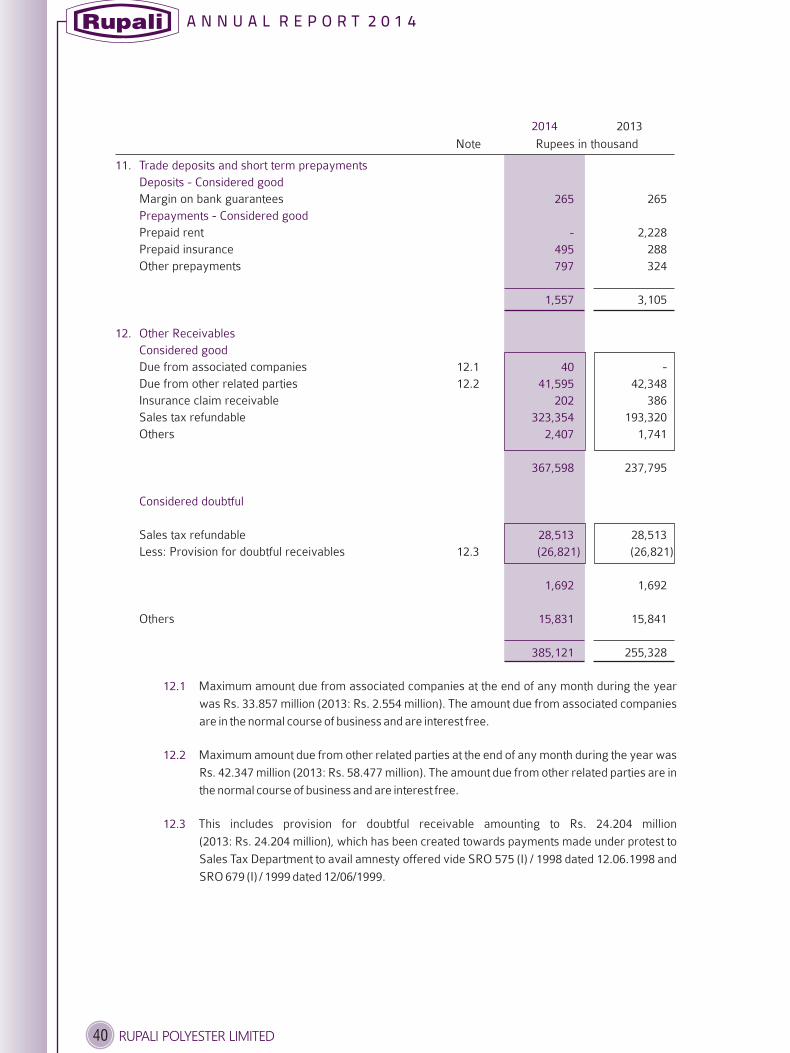
A N N U A L R E P O R T 2 0 1 4
40 RUPALI POLYESTER LIMITED
Note Rupees in thousand
2014 2013
11. Trade deposits and short term prepayments
Deposits - Considered good
265
Prepayments - Considered good
-
495
797
1,557
12. Other Receivables
Considered good
40
41,595
202
323,354
2,407
367,598
Considered doubtful
28,513
(26,821)
1,692
15,831
385,121
12.1
12.2
12.3
Margin on bank guarantees 265
Prepaid rent 2,228
Prepaid insurance 288
Other prepayments 324
3,105
Due from associated companies 12.1 -
Due from other related parties 12.2 42,348
Insurance claim receivable 386
Sales tax refundable 193,320
Others 1,741
237,795
Sales tax refundable 28,513
Less: Provision for doubtful receivables 12.3 (26,821)
1,692
Others 15,841
255,328
Maximum amount due from associated companies at the end of any month during the year
was Rs. 33.857 million (2013: Rs. 2.554 million). The amount due from associated companies
are in the normal course of business and are interest free.
Maximum amount due from other related parties at the end of any month during the year was
Rs. 42.347 million (2013: Rs. 58.477 million). The amount due from other related parties are in
the normal course of business and are interest free.
This includes provision for doubtful receivable amounting to Rs. 24.204 million
(2013: Rs. 24.204 million), which has been created towards payments made under protest to
Sales Tax Department to avail amnesty offered vide SRO 575 (I) / 1998 dated 12.06.1998 and
SRO 679 (I) / 1999 dated 12/06/1999.

13. Taxation - Net
181,955
-
181,955
14. Cash and bank balances
90,292
42,540
18
132,850
61
12
73
132,923
14.1
14.2
15. Issued, subscribed and paid-up capital
9,690,900
96,909
19,933,895
199,339
4,443,719
44,437
34,068,514 340,685
16. Long term borrowings
146,315
146,315
Advance Tax 154,784
Provision for Taxation 29 (30,459)
124,325
Balance with banks
- Current accounts 3,704
- PLS Accounts
- Local currency 14.1 8,408
- Foreign currency 14.2 11
12,123
Cash in hand
- Local currency 30
- Foreign currency 4
34
12,157
The balances in PLS accounts carry mark-up rate ranging between 6.00% to 9.80% (2013: 5.00% to10.50%) for local currency and Nil (2013: Nil) for foreign currency.
Cash at banks in PLS accounts include US $ 181.12 (2013: US $ 111.12).
9,690,900 Shares allotted for
consideration paid in cash 96,909
19,933,895 Shares issued against non -
repatriable investment 199,339
4,443,719 Shares allotted as
Bonus Shares 44,437
34,068,514 340,685
Long term finance 16.1 -
-
Rupees in thousandOrdinary Shares of Rs. 10 each
2014 20132014 2013
A N N U A L R E P O R T 2 0 1 4
41RUPALI POLYESTER LIMITED
Note Rupees in thousand
2014 2013
Note
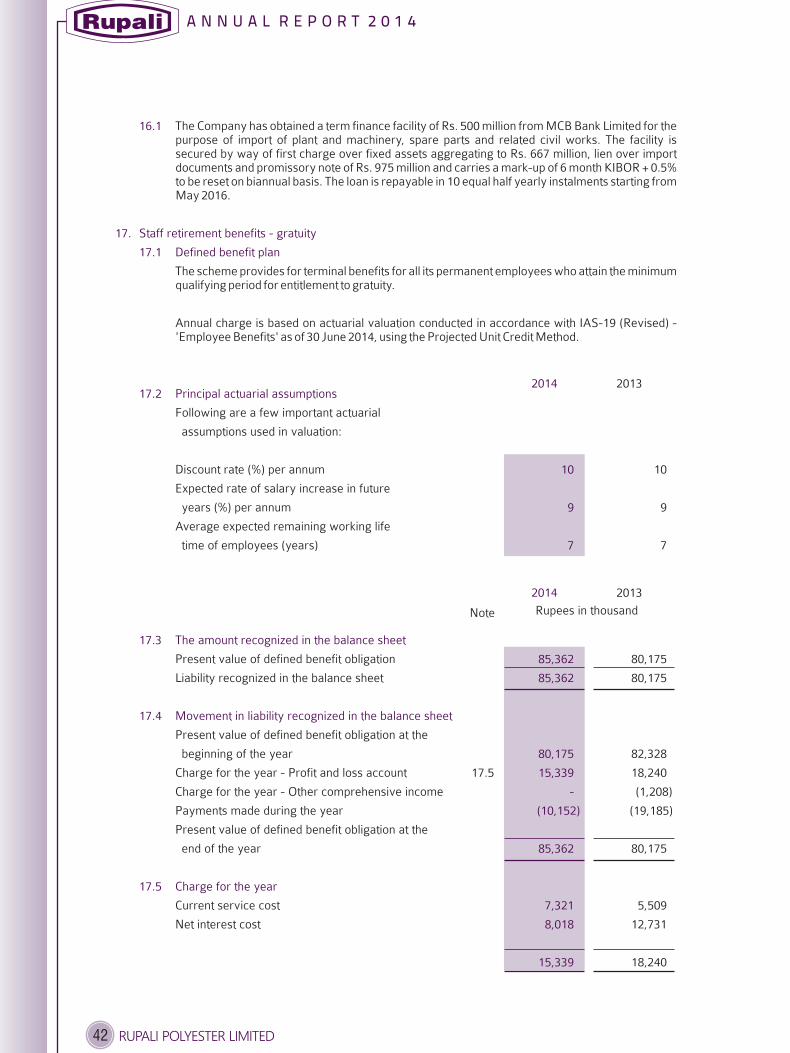
A N N U A L R E P O R T 2 0 1 4
42 RUPALI POLYESTER LIMITED
16.1
17. Staff retirement benefits - gratuity
17.1 Defined benefit plan
17.2 Principal actuarial assumptions
10
9
7
17.3 The amount recognized in the balance sheet
85,362
85,362
17.4 Movement in liability recognized in the balance sheet
80,175
15,339
-
(10,152)
85,362
17.5 Charge for the year
7,321
8,018
15,339
The Company has obtained a term finance facility of Rs. 500 million from MCB Bank Limited for thepurpose of import of plant and machinery, spare parts and related civil works. The facility issecured by way of first charge over fixed assets aggregating to Rs. 667 million, lien over importdocuments and promissory note of Rs. 975 million and carries a mark-up of 6 month KIBOR + 0.5%to be reset on biannual basis. The loan is repayable in 10 equal half yearly instalments starting fromMay 2016.
The scheme provides for terminal benefits for all its permanent employees who attain the minimumqualifying period for entitlement to gratuity.
Annual charge is based on actuarial valuation conducted in accordance with IAS-19 (Revised) -'Employee Benefits' as of 30 June 2014, using the Projected Unit Credit Method.
Following are a few important actuarial
assumptions used in valuation:
Discount rate (%) per annum 10
Expected rate of salary increase in future
years (%) per annum 9
Average expected remaining working life
time of employees (years) 7
Present value of defined benefit obligation 80,175
Liability recognized in the balance sheet 80,175
Present value of defined benefit obligation at the
beginning of the year 82,328
Charge for the year - Profit and loss account 17.5 18,240
Charge for the year - Other comprehensive income (1,208)
Payments made during the year (19,185)
Present value of defined benefit obligation at the
end of the year 80,175
Current service cost 5,509
Net interest cost 12,731
18,240
2014 2013
Rupees in thousand
2014 2013
Note

A N N U A L R E P O R T 2 0 1 4
43RUPALI POLYESTER LIMITED
Cost of goods sold 23 12,531Selling and distribution expenses 24 222Administrative and general expenses 25 5,487
18,240
Deferred tax liability on taxable temporary differencesAccelerated tax depreciation allowance 330,991Deferred tax asset on unused tax losses 18.1 -
330,991
The Company has unutilised tax losses ofRs. 935.362 million to be off set against futuretaxable profits and deferred tax asset arisingthereon amounts to Rs. 318.023 million. Based onthe forecast provided by the management deferredtax asset of Rs. 29.023 million, only to the extent ofanticipated future taxable profits of Rs. 85.362million, has been recognised.
Creditors 364,894Due to associated companies 19.1 5,382Accrued liabilities 51,208Advances from customers 2,817Retention money 267Payable to provident fund 289Income tax deducted at source 846Workers’ profit participation fund 19.2 7,538Workers’ welfare fund 11,229Unclaimed dividend 1,115Other payables 568
446,153
These are in the normal course ofbusiness and are interest free.
Balance at the beginning of the year 11,163Allocation for the year -
11,163
Less: Amount paid to the trustees of the fund 3,625Deposited with the government -
3,625
Balance at the end of the year 7,538
17.6 Charge for the year has been allocated as follows:10,538
2404,561
15,339
18. Deferred taxation
313,899(29,023)
284,876
18.1
19. Trade and other payables537,008
3939,4491,0392,135
345280
7,508-
1,1143,211
592,128
19.1 Due to associated companies
19.2 Workers’ profit participation fund7,538
-
7,538
30-
30
7,508
Note Rupees in thousand
2014 2013
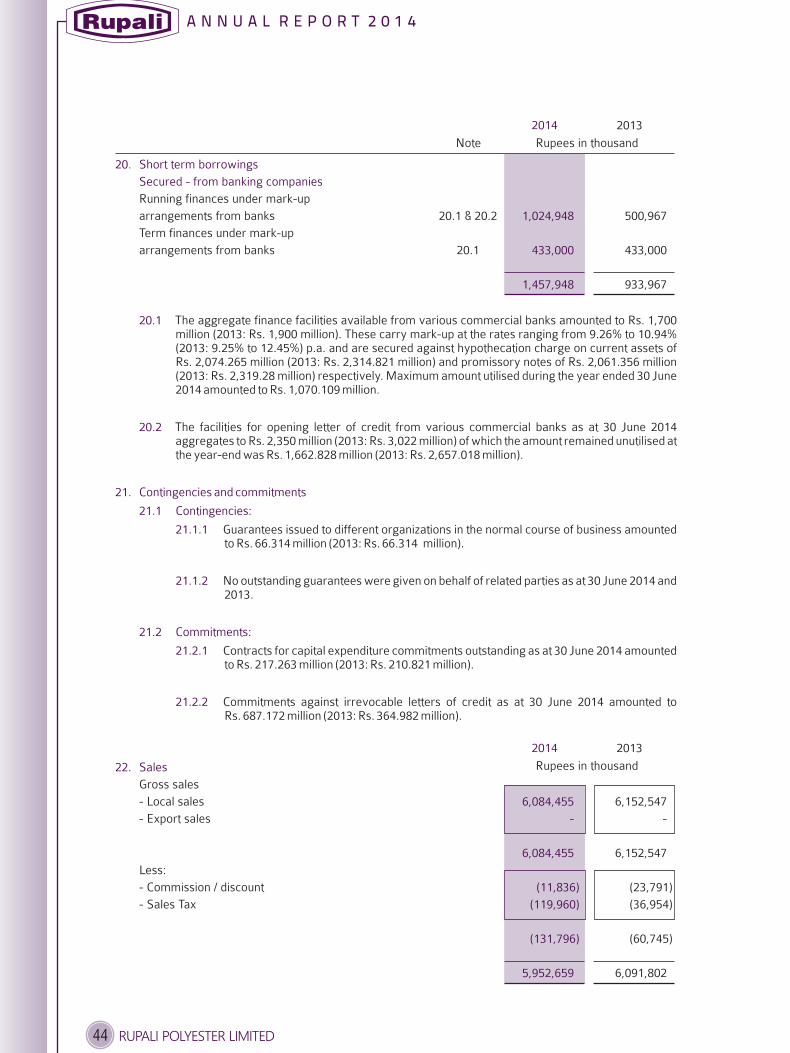
A N N U A L R E P O R T 2 0 1 4
44 RUPALI POLYESTER LIMITED
20. Short term borrowings
Secured - from banking companies
1,024,948
433,000
1,457,948
20.1
20.2
21. Contingencies and commitments
21.1 Contingencies:
21.1.1
21.1.2
21.2 Commitments:
21.2.1
21.2.2
22. Sales
6,084,455
-
6,084,455
(11,836)
(119,960)
(131,796)
5,952,659
Running finances under mark-up
arrangements from banks 20.1 & 20.2 500,967
Term finances under mark-up
arrangements from banks 20.1 433,000
933,967
The aggregate finance facilities available from various commercial banks amounted to Rs. 1,700million (2013: Rs. 1,900 million). These carry mark-up at the rates ranging from 9.26% to 10.94%(2013: 9.25% to 12.45%) p.a. and are secured against hypothecation charge on current assets ofRs. 2,074.265 million (2013: Rs. 2,314.821 million) and promissory notes of Rs. 2,061.356 million(2013: Rs. 2,319.28 million) respectively. Maximum amount utilised during the year ended 30 June2014 amounted to Rs. 1,070.109 million.
The facilities for opening letter of credit from various commercial banks as at 30 June 2014aggregates to Rs. 2,350 million (2013: Rs. 3,022 million) of which the amount remained unutilised atthe year-end was Rs. 1,662.828 million (2013: Rs. 2,657.018 million).
Guarantees issued to different organizations in the normal course of business amountedto Rs. 66.314 million (2013: Rs. 66.314 million).
No outstanding guarantees were given on behalf of related parties as at 30 June 2014 and2013.
Contracts for capital expenditure commitments outstanding as at 30 June 2014 amountedto Rs. 217.263 million (2013: Rs. 210.821 million).
Commitments against irrevocable letters of credit as at 30 June 2014 amounted toRs. 687.172 million (2013: Rs. 364.982 million).
Gross sales
- Local sales 6,152,547
- Export sales -
6,152,547
Less:
- Commission / discount (23,791)
- Sales Tax (36,954)
(60,745)
6,091,802
Note Rupees in thousand
2014 2013
2014
Rupees in thousand
2013

Note Rupees in thousand
2014 2013
23. Cost of goods sold
5,029,799
52,863
198,279
906,721
26,110
14,687
15,610
130,258
859
2,163
6,377,349
51,584
(18,942)
6,409,991
398,276
(589,045)
6,219,222
23.1
24. Selling and distribution expenses
4,011
152
267
95
157
29
109
162
226
44
85
721
4,480
10,538
24.1
Raw and packing materials consumed 4,407,474
Stores and spares consumed 86,416
Salaries, wages and amenities 23.1 202,848
Fuel and power 957,615
Repair and maintenance 4,546
Running and maintenance of vehicles 14,979
Insurance 14,006
Depreciation 5.2 125,467
Rent, rates and taxes 528
Other expenses 2,627
5,816,506
Add: Opening work-in-process 106,639
Less: Closing work-in-process (51,584)
5,871,561
Add: Opening finished goods 844,037
Less: Closing finished goods (398,276)
6,317,322
Salaries, wages and amenities include Rs. 10.538million (2013: Rs. 12.531 million) in respect ofstaff retirement benefits and Rs. 0.704 million(2013: Rs. 0.664 million) in respect of provident fundcontribution.
Salaries, wages and amenities 24.1 3,816
Rent, rates and taxes 139
Electricity, gas and water charges 287
Postage, telephone and fax 105
Printing and stationery 209
Books and subscription 42
Running and maintenance of vehicles 85
Repair and maintenance 190
Travelling expenses 100
Entertainment 44
Insurance 102
Depreciation 5.2 743
Freight and forwarding 9,844
15,706
Salaries, wages and amenities include Rs. 0.240 million (2013: Rs. 0.222 million) in respect ofstaff retirement benefits and Rs. 0.048 million (2013: Rs. 0.041 million) in respect of providentfund contribution.
A N N U A L R E P O R T 2 0 1 4
45RUPALI POLYESTER LIMITED

Note Rupees in thousand
2014 2013
25. Administrative and general expenses
78,781
4,967
2,878
5,065
1,807
2,988
544
2,063
3,087
9,191
4,300
841
800
1,609
370
13,709
207
133,207
25.1
25.2 Auditor's remuneration
475
85
240
-
800
26. Other operating charges
-
-
-
Salaries, wages and amenities 25.1 72,507
Director's remuneration 4,722
Rent, rates and taxes 2,635
Electricity, gas and water charges 5,449
Postage, telephone and fax 1,997
Printing and stationery 3,968
Books and subscription 792
Running and maintenance of vehicles 1,615
Repair and maintenance 3,619
Legal and professional charges 9,384
Travelling expenses 1,901
Entertainment 831
Auditor's remuneration 25.2 800
Insurance 1,937
Advertisement 324
Depreciation 5.2 14,123
Miscellaneous expenses 300
126,904
Salaries, wages and amenities include Rs. 4.561
million (2013:Rs.5.487 million) in respect of
staff retirement benefits and Rs.0.912 million
(2013:Rs.0.783 million) in respect of provident fund
contribution.
Audit fee 475
Certification and review 85
Taxation services 240
Other professional services -
800
Workers' profit participation fund 19.2 -
Loss on disposal of operating fixed assets 5.3 20
20
A N N U A L R E P O R T 2 0 1 4
46 RUPALI POLYESTER LIMITED
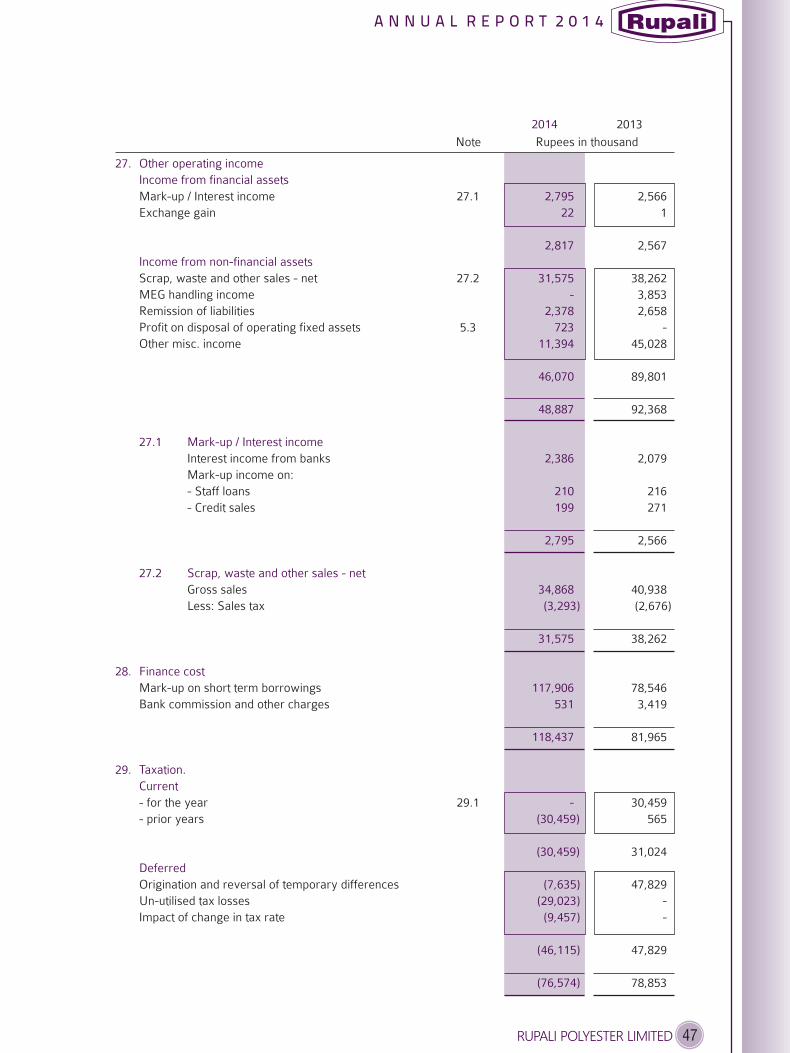
Note Rupees in thousand
2014 2013
27. Other operating income
Income from financial assets
2,795
22
2,817
Income from non-financial assets
31,575
-
2,378
723
11,394
46,070
48,887
27.1 Mark-up / Interest income
2,386
210
199
2,795
27.2 Scrap, waste and other sales - net
34,868
(3,293)
31,575
28. Finance cost
117,906
531
118,437
29. Taxation.
Current
-
(30,459)
(30,459)
Deferred
(7,635)
(29,023)
(9,457)
(46,115)
(76,574)
Mark-up / Interest income 27.1 2,566
Exchange gain 1
2,567
Scrap, waste and other sales - net 27.2 38,262
MEG handling income 3,853
Remission of liabilities 2,658
Profit on disposal of operating fixed assets 5.3 -
Other misc. income 45,028
89,801
92,368
Interest income from banks 2,079
Mark-up income on:
- Staff loans 216
- Credit sales 271
2,566
Gross sales 40,938
Less: Sales tax (2,676)
38,262
Mark-up on short term borrowings 78,546
Bank commission and other charges 3,419
81,965
- for the year 29.1 30,459
- prior years 565
31,024
Origination and reversal of temporary differences 47,829
Un-utilised tax losses -
Impact of change in tax rate -
47,829
78,853
A N N U A L R E P O R T 2 0 1 4
47RUPALI POLYESTER LIMITED

According to the Income Tax Ordinance, 2001 if the Company has declared gross loss before set offof depreciation and other inadmissible expenses, minimum income tax is not chargeable to theCompany. Since the company is incurring losses and minimum tax is not chargeable to theCompany, provision for current taxation is, therefore, nil.
Reconciliation between the applicable tax rate and average effective tax rate is as follows:
2013
%
Applicable tax rate 29.1 35.00
Tax effect of:
- Change in prior year tax (0.16)
- Change in deferred tax liability (13.37)
- Change in statutory tax rate for next year -
- Non-deductible expenses in determining taxable profit (43.51)
(57.04)
Average effective tax rate (22.04)
Loss for the year after taxation attributable to
ordinary shareholders (Rupees in thousand) (436,600)
Weighted average ordinary shares in issue
during the year (No. of shares) 15 34,068,514
(12.82)
There is no dilutive potential ordinary shares outstanding as at 30 June 2014 and 2013.
- Un-utilised tax losses -
29.1
29.2
2014
%
-
6.35
1.59
1.97
-
15.96
15.96
30. Earnings per share
30.1 Earnings per share - basic
(403,284)
34,068,514
Basic earnings per share (Rupees) (11.84)
30.2 Earnings per share - diluted
6.05
A N N U A L R E P O R T 2 0 1 4
48 RUPALI POLYESTER LIMITED
Note
2014 2013
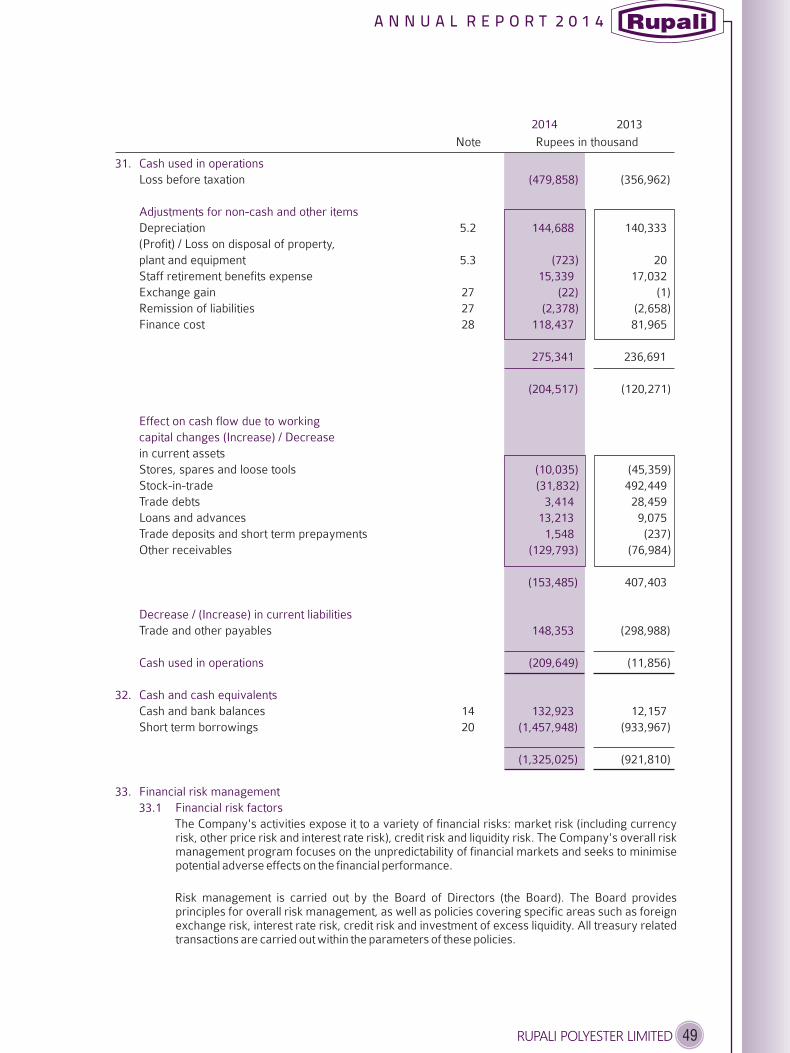
A N N U A L R E P O R T 2 0 1 4
49RUPALI POLYESTER LIMITED
Note Rupees in thousand
2014 2013
31. Cash used in operations
(479,858)
Adjustments for non-cash and other items
144,688
(723)
15,339
(22)
(2,378)
118,437
275,341
(204,517)
Effect on cash flow due to working
capital changes (Increase) / Decrease
(10,035)
(31,832)
3,414
13,213
1,548
(129,793)
(153,485)
Decrease / (Increase) in current liabilities
148,353
Cash used in operations (209,649)
32. Cash and cash equivalents
132,923
(1,457,948)
(1,325,025)
33. Financial risk management
33.1 Financial risk factors
Loss before taxation (356,962)
Depreciation 5.2 140,333
(Profit) / Loss on disposal of property,
plant and equipment 5.3 20
Staff retirement benefits expense 17,032
Exchange gain 27 (1)
Remission of liabilities 27 (2,658)
Finance cost 28 81,965
236,691
(120,271)
in current assets
Stores, spares and loose tools (45,359)
Stock-in-trade 492,449
Trade debts 28,459
Loans and advances 9,075
Trade deposits and short term prepayments (237)
Other receivables (76,984)
407,403
Trade and other payables (298,988)
(11,856)
Cash and bank balances 14 12,157
Short term borrowings 20 (933,967)
(921,810)
The Company's activities expose it to a variety of financial risks: market risk (including currencyrisk, other price risk and interest rate risk), credit risk and liquidity risk. The Company's overall riskmanagement program focuses on the unpredictability of financial markets and seeks to minimisepotential adverse effects on the financial performance.
Risk management is carried out by the Board of Directors (the Board). The Board providesprinciples for overall risk management, as well as policies covering specific areas such as foreignexchange risk, interest rate risk, credit risk and investment of excess liquidity. All treasury relatedtransactions are carried out within the parameters of these policies.

A N N U A L R E P O R T 2 0 1 4
50 RUPALI POLYESTER LIMITED
Currency risk is the risk that the fair value or future cash flows of a financial instrumentwill fluctuate because of changes in foreign exchange rates. Currency risk arises mainlyfrom future commercial transactions or receivables and payables that exist due totransactions in foreign currencies.
The Company is exposed to currency risk arising from various currency exposures,primarily with respect to the United States Dollar (USD), Japanese Yen and Euro.Currently, the Company's foreign exchange risk exposure is restricted to bank balancesand the amounts receivable from / payable to the foreign entities.
5% strengthening of Pak rupees against the following currencies at 30 June 2014 wouldhave decreased the equity and profit or loss by the amount shown below. The analysisassumes that all other variables, in particular interest rates, remain constant.
Rupees in thousandEquity Profit or
(Loss)
US Dollar (160) (242)Japanese Yen (13) (19)Euro (28) (43)
5 % weakening of Pak rupee against the above currencies at period end would have hadthe equal but opposite effect on the above currencies to the amounts shown above on thebasis that all other variables remain constant.
Interest rate risk represents the risk that the fair value or future cash flows of a financialinstrument will fluctuate because of changes in market interest rates.
The Company has no significant long-term interest-bearing assets. The Company'sinterest rate risk arises from short term borrowings. Borrowings obtained at variablerates expose the Company to cash flow interest rate risk.
At the balance sheet date, the interest rate profile of the Company's interest bearingfinancial instruments was:
2013Rupees in thousand
Loan against instalments 1,194
-
Bank balances - savings accounts 8,419
Short term borrowings (933,967)
(925,548)
1,194
(a) Market risk(i) Currency risk
(ii) Interest rate risk
2014
Fixed rate instrumentsFinancial assets
1,067
Financial liabilities -
Net exposure
Floating rate instrumentsFinancial assets
42,558
Financial liabilities
(1,457,948)
Net exposure (1,415,390)
1,067
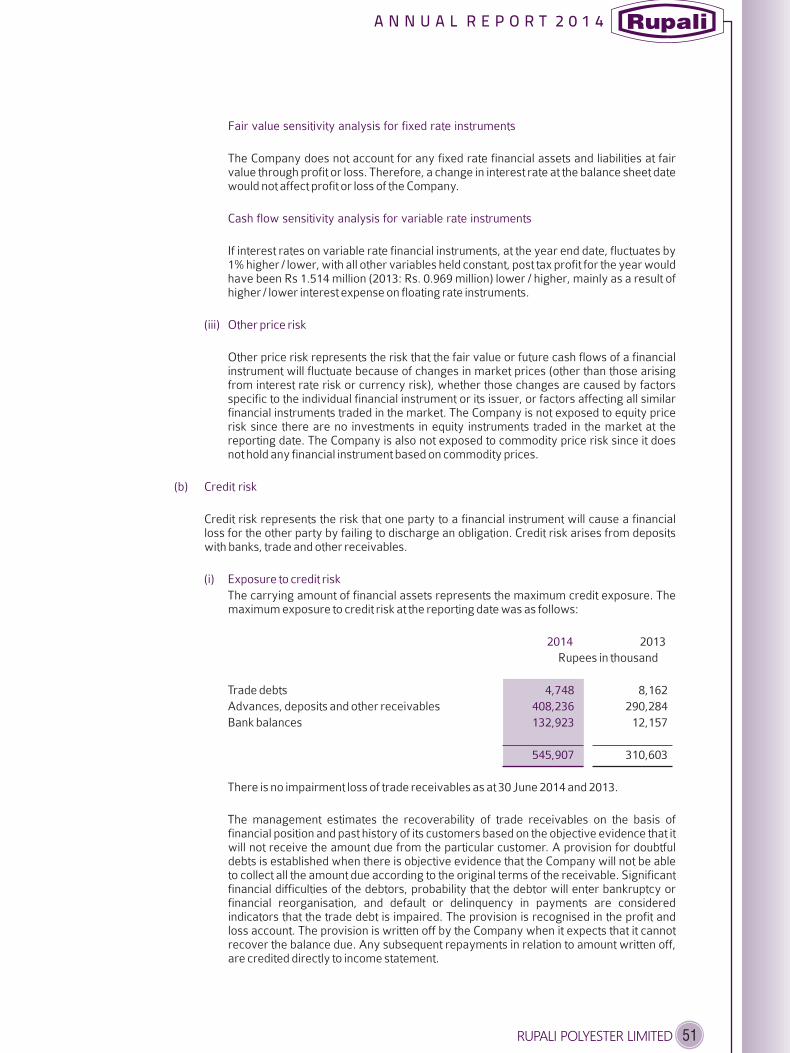
A N N U A L R E P O R T 2 0 1 4
51RUPALI POLYESTER LIMITED
Fair value sensitivity analysis for fixed rate instruments
Cash flow sensitivity analysis for variable rate instruments
(iii) Other price risk
(b) Credit risk
(i) Exposure to credit risk
2014
4,748
408,236
132,923
545,907
The Company does not account for any fixed rate financial assets and liabilities at fairvalue through profit or loss. Therefore, a change in interest rate at the balance sheet datewould not affect profit or loss of the Company.
If interest rates on variable rate financial instruments, at the year end date, fluctuates by1% higher / lower, with all other variables held constant, post tax profit for the year wouldhave been Rs 1.514 million (2013: Rs. 0.969 million) lower / higher, mainly as a result ofhigher / lower interest expense on floating rate instruments.
Other price risk represents the risk that the fair value or future cash flows of a financialinstrument will fluctuate because of changes in market prices (other than those arisingfrom interest rate risk or currency risk), whether those changes are caused by factorsspecific to the individual financial instrument or its issuer, or factors affecting all similarfinancial instruments traded in the market. The Company is not exposed to equity pricerisk since there are no investments in equity instruments traded in the market at thereporting date. The Company is also not exposed to commodity price risk since it doesnot hold any financial instrument based on commodity prices.
Credit risk represents the risk that one party to a financial instrument will cause a financialloss for the other party by failing to discharge an obligation. Credit risk arises from depositswith banks, trade and other receivables.
The carrying amount of financial assets represents the maximum credit exposure. Themaximum exposure to credit risk at the reporting date was as follows:
2013
Rupees in thousand
Trade debts 8,162
Advances, deposits and other receivables 290,284
Bank balances 12,157
310,603
There is no impairment loss of trade receivables as at 30 June 2014 and 2013.
The management estimates the recoverability of trade receivables on the basis offinancial position and past history of its customers based on the objective evidence that itwill not receive the amount due from the particular customer. A provision for doubtfuldebts is established when there is objective evidence that the Company will not be ableto collect all the amount due according to the original terms of the receivable. Significantfinancial difficulties of the debtors, probability that the debtor will enter bankruptcy orfinancial reorganisation, and default or delinquency in payments are consideredindicators that the trade debt is impaired. The provision is recognised in the profit andloss account. The provision is written off by the Company when it expects that it cannotrecover the balance due. Any subsequent repayments in relation to amount written off,are credited directly to income statement.

A N N U A L R E P O R T 2 0 1 4
52 RUPALI POLYESTER LIMITED
The credit quality of major financial assets that are neither past due nor impaired can beassessed by reference to external credit ratings (if available) or to historical informationabout counterparty default rate:
Rating Rating 2013
Short term Long term Agency Rupees in thousand
Efu General Life
Insurance Limited - AA+ JCR-VIS 288
Citibank N.A. P-2 A3 Moody's 437
Habib Bank Limited A1+ AAA JCR-VIS 1,884
National Bank of Pakistan A1+ AAA JCR-VIS 336
NIB Bank Limited A1+ AA- PACRA -
Faysal Bank Limited A1+ AA PACRA 143
Bank Al-Habib Limited A1+ AA+ PACRA 904
MCB Bank Limited A1+ AAA PACRA 1
Soneri Bank Limited A1+ AA- PACRA 8,420
Bank Al-Falah Limited A1+ AA PACRA -
12,413
Due to the Company's long standing business relationships with these counter partiesand after giving due consideration to their strong financial standing, management doesnot expect non-performance by these counter parties on their obligations to theCompany. Accordingly, the credit risk is minimal.
Liquidity risk is the risk that an entity will encounter difficulty in meeting obligationsassociated with financial liabilities.
Prudent liquidity risk management implies maintaining sufficient cash and marketablesecurities, the availability of funding through an adequate amount of committed creditfacilities. Due to the dynamic nature of the Company's business, the Board maintainsflexibility in funding by maintaining availability under committed credit lines.
Management monitors the forecasts of the Company's cash and cash equivalents (note 31)on the basis of expected cash flow. This is generally carried out in accordance with practiceand limits set by the Company. The Company's liquidity management policy involvesprojecting cash flows and considering the level of liquid assets necessary to meet itsliabilities, monitoring balance sheet liquidity ratios against internal and external regulatoryrequirements, and maintaining debt financing plans.
The table below analyses the Company's financial liabilities and net-settled derivativefinancial liabilities into relevant maturity groupings based on the remaining period at thebalance sheet date to the contractual maturity date. The amounts disclosed in the table arethe contractual undiscounted cash flows as the impact of discounting is not significant.
(ii) Credit quality of major financial assets
2014
203
-
471
321
-
-
43,404
46,099
42,559
-
133,057
(c) Liquidity risk

A N N U A L R E P O R T 2 0 1 4
53RUPALI POLYESTER LIMITED
Carrying Less than One to More then
amount one year five years five years
Rupees in thousand
Short term borrowings 1,457,948 1,457,948 - -
Trade and other payables 592,128 592,128 - -
At 30 June 2013
Short term borrowings 933,967 933,967 - -
Trade and other payables 446,153 446,153 - -
1,380,120 1,380,120 - -
The fair value of financial instruments traded in active markets is based on quoted market prices atthe balance sheet date. However, the Company does not hold any quoted financial instrument.
The financial instruments that are not traded in active market are carried at cost and are tested forimpairment according to IAS 39 'Financial Instruments: Recognition and Measurement'.
The carrying amount less impairment provision of trade receivables and payables are assumed toapproximate their fair values. The fair value of financial liabilities for disclosure purposes isestimated by discounting the future contractual cash flows at the current market interest rate that isavailable to the Company for similar financial instruments.
2013
Rupees in thousand
Trade debts 8,162
Advances, deposits and other receivables 290,284
Cash and bank balances 12,157
310,603
Liabilities as per balance sheet
Short term borrowings 933,967
Trade and other payables 446,153
1,380,120
At 30 June 2014
2,050,0762,050,076 - -
33.2 Fair value estimation
33.3 Financial instruments by categories
(a) Loans and receivables
2014
Assets as per balance sheet
4,748
408,236
132,923
545,907
(b) Financial liabilities at amortised cost
1,457,948
592,128
2,050,076

A N N U A L R E P O R T 2 0 1 4
54 RUPALI POLYESTER LIMITED
The carrying values of all financial assets and liabilities reflected in the financial statements
approximate their fair values. Fair value is determined on the basis of objective evidence at each
reporting date.
The Company's objectives when managing capital are to safeguard the Company's ability to
continue as a going concern in order to provide returns for shareholders and benefits for other
stakeholders and to maintain an optimal capital structure to reduce the cost of capital.
In order to maintain or adjust the capital structure, the Company may adjust the amount of
dividends paid to shareholders, return capital to shareholders or issue new shares, obtain long
term debt or sell assets to reduce debt.
Consistent with others in the industry, the Company manages its capital risk by monitoring its debt
levels and liquid assets and keeping in view future investments requirements and expectation of
the shareholders.
During the year, the Company reviewed its capital risk management policy and obtained a long
term finance to adjust its capital structure. The Company believe that such policy will help minimize
its overall cost of capital and better utilisation of funds.
The aggregate amount charged in the financial statements for remuneration including all benefits to the
Chief Executive, Directors and the Executives of the Company are as follows:
33.4 Fair values of financial assets and liabilities
33.5 Capital risk management
34. Remuneration of directors and executives
Managerial remuneration - 3,073 20,802
House rent - 922 6,240
Utilities - 307 2,080
Medical expenses - 307 2,080
Retirement benefits - - 383
Others - 28 768
- 4,637 32,353
Number of person(s) 1 1 23
Chief Executive Officer of the Company is provided with free use of Company maintained car.
- 3,297 25,111
- 989 7,533
- 330 2,511
- 330 2,511
- - 569
- 21 478
- 4,967 38,713
1 1 27
34.1
Ru pees in th ousan d
Directors Execu t ives
2 0 1 4 2 0 1 3 2 0 1 4 2 0 1 3 2 0 1 4 2 0 13
Ch ief Execu t iveOfficer

A N N U A L R E P O R T 2 0 1 4
55RUPALI POLYESTER LIMITED
35. Transactions with related parties
35.1 Details of transactions with related parties 2014
Name Nature of Nature of
Relationship Transactions
898,811
707,533
-
4,921
2,368
-
4,126
1,664
The related parties comprises Associated Undertakings, Other Related Group Companies, Directors of the
Company, Key Management Personnel and Defined Contribution Plan (Provident Fund). The Company in
the normal course of business carries out transactions with various related parties. Amounts due from and
to the related parties are shown under receivables and payables, amounts due from key management
personnel are shown under receivables and remuneration of directors and key management personnel is
disclosed in (note 33). Other significant transactions with the related parties are as follows:
2013
Rupees in thousand
Rupafil Limited Associated
undertaking and services 66,037
- Purchase of goods
and services 1,296,961
Rupali Nylon
(Pvt.) Limited undertaking and services -
- Purchase of goods
and services 4,661
Soneri Bank Associated
undertaking deposits 2,079
Spintex Limited Other related party - Sales of goods
and services -
- Purchase of goods
and services 963
Provident Fund Defined
contribution plan Provident Fund 1,489
The Company continues to have a policy whereby all transactions with Related Parties and
Associated Undertakings are entered into at arm's length prices using comparable un-controlled
price method and cost plus method, wherever, appropriate. Further, contributions to the Defined
Contribution Plan (Provident Fund) are made as per the terms of employment.
- Sales of goods
Associated - Sales of goods
- Profit on bank
Limited
- Contribution to
Trust

A N N U A L R E P O R T 2 0 1 4
56 RUPALI POLYESTER LIMITED
35.2 Amount due from/(outstanding to) related parties
Rupafil Limited
21
-
-
(39)
41,595
36. Plant capacity and actual production 2014
10,100
12,000
4,518
23,973
37. Staff strength
968
38. Date of authorization for issue
39. Corresponding figures
39.1
39.2
40. General
2014
- Sale of goods and services -
- Purchase of goods and services (5,345)
Rupali Nylon (Pvt.) Limited
- Sale of goods and services -
- Purchase of goods and services (37)
Spintex Limited
- Sale of goods and services 42,348
2013
In Metric Tons
Annual capacity (in three shifts)
- Yarn 10,100
- Fiber 12,000
Actual production
- Yarn 9,982
- Fiber 20,873
Number of Employees
Number of employees as at 30 June 1,001
These financial statements were authorized for issue on 27 September 2014 by the Board of Directors of
the Company.
Corresponding figures have been re-arranged, wherever necessary, for the purposes of comparison.
However, significant reclassifications in these financial statements are as follows:
Capital work in progress has been reclassified .
In Auditor's remuneration, certifcation and review charges has been reclassified from audit fee.
Figures have been rounded off to the nearest thousand rupees unless otherwise stated.
2013
from face of balance sheet to note 5.4
Rupees in thousand
2014 2013
Jafferali M. FeerastaChairman
Nooruddin FeerastaChief Executive Officer

Pattern of Shareholdingas at 30 June 2014
Number ofShareholders From
S h a r e h o l d i n g TotalShares heldTo
184
116
97
93
21
7
1
4
2
2
1
1
2
1
1
1
1
1
1
1
1
2
1
1
1
1
1
1
1
1
1
1
1
552
1
101
501
1,001
5,001
10,001
15,001
20,001
25,001
30,001
75,001
85,001
110,001
140,001
145,001
150,001
205,001
215,001
225,001
285,001
350,001
430,001
470,001
480,001
485,001
815,001
1,085,001
1,260,001
1,315,001
2,240,001
4,510,001
8,515,001
9,060,001
-
-
-
-
-
-
-
-
-
-
-
-
-
-
-
-
-
-
-
-
-
-
-
-
-
-
-
-
-
-
-
-
-
Total
100
500
1,000
5,000
10,000
15,000
20,000
25,000
30,000
35,000
80,000
90,000
115,000
145,000
150,000
155,000
210,000
220,000
230,000
290,000
355,000
435,000
475,000
485,000
490,000
820,000
1,090,000
1,265,000
1,320,000
2,245,000
4,515,000
8,520,000
9,065,000
6,575
37,215
68,705
213,991
156,230
86,701
20,000
91,689
56,379
69,000
80,000
89,500
230,000
142,500
146,482
153,045
209,490
216,223
230,000
286,000
352,811
863,323
472,022
483,918
488,010
816,483
1,085,316
1,260,500
1,319,582
2,240,641
4,511,760
8,519,800
9,064,623
34,068,514
A N N U A L R E P O R T 2 0 1 4
57RUPALI POLYESTER LIMITED
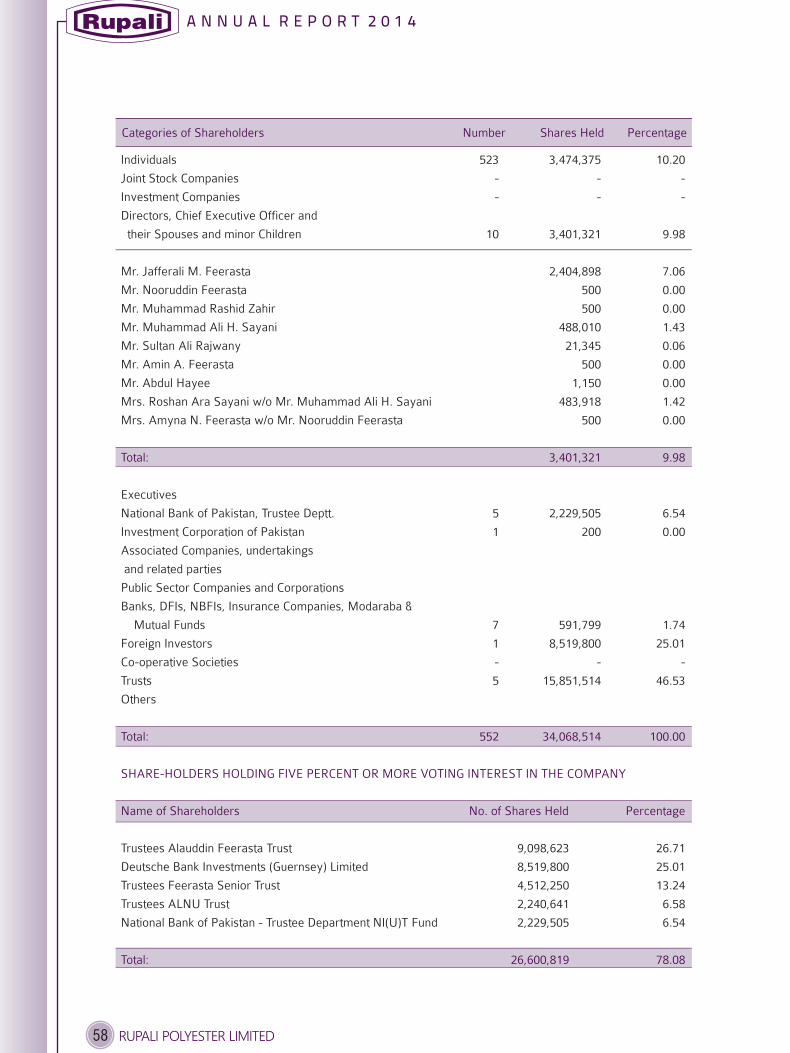
Individuals 523 3,474,375 10.20
Joint Stock Companies - - -
Investment Companies - - -
Directors, Chief Executive Officer and
their Spouses and minor Children 10 3,401,321 9.98
Mr. Jafferali M. Feerasta 2,404,898 7.06
Mr. Nooruddin Feerasta 500 0.00
Mr. Muhammad Rashid Zahir 500 0.00
Mr. Muhammad Ali H. Sayani 488,010 1.43
Mr. Sultan Ali Rajwany 21,345 0.06
Mr. Amin A. Feerasta 500 0.00
Mr. Abdul Hayee 1,150 0.00
Mrs. Roshan Ara Sayani w/o Mr. Muhammad Ali H. Sayani 483,918 1.42
Mrs. Amyna N. Feerasta w/o Mr. Nooruddin Feerasta 500 0.00
Executives
National Bank of Pakistan, Trustee Deptt. 5 2,229,505 6.54
Investment Corporation of Pakistan 1 200 0.00
Associated Companies, undertakings
and related parties
Public Sector Companies and Corporations
Banks, DFIs, NBFIs, Insurance Companies, Modaraba &
Mutual Funds 7 591,799 1.74
Foreign Investors 1 8,519,800 25.01
Co-operative Societies - - -
Trusts 5 15,851,514 46.53
Others
Trustees Alauddin Feerasta Trust 9,098,623 26.71
Deutsche Bank Investments (Guernsey) Limited 8,519,800 25.01
Trustees Feerasta Senior Trust 4,512,250 13.24
Trustees ALNU Trust 2,240,641 6.58
National Bank of Pakistan - Trustee Department NI(U)T Fund 2,229,505 6.54
Total: 3,401,321 9.98
Total: 552 34,068,514 100.00
SHARE-HOLDERS HOLDING FIVE PERCENT OR MORE VOTING INTEREST IN THE COMPANY
Name of Shareholders No. of Shares Held Percentage
Total: 26,600,819 78.08
Categories of Shareholders Number Shares Held Percentage
A N N U A L R E P O R T 2 0 1 4
58 RUPALI POLYESTER LIMITED

A N N U A L R E P O R T 2 0 1 4
59RUPALI POLYESTER LIMITED
IMPORTANT:
I / We o f
being member(s) of RUPALI POLYESTER LIMITED
Ordinary Shares.and holder of
Sub-Account No:
or Passport No:
hereby appoint of or failing him / her
of who is / are also member(s) of
RUPALI POLYESTER LIMITED as my / our proxy to attend and vote for me / on our behalf at the 34th
Annual General Meeting of the Company to be held on 31 October 2014 or at any adjournment thereof.
(Signatures should agree with thespecimen signature registeredwith the Company)
Signature of Shareholder
Signature of Proxy
CNIC No:
RevenueStamp
Register Folio No.
CDC participant I.D. No:
Dated this day of October 2014
1. WITNESS
Signature:
Name:
Address:
CNIC No:
or Passport No:
2. WITNESS
Signature:
Name:
Address:
CNIC No:
or Passport No:
Proxy Form 34th Annual General Meeting
1. RUPALI POLYESTERLIMITED,
2.
3.
4.
5.
This Proxy Form, duly completed and signed, must be received at the Registered Office of the CompanyRupali House, 241-242 Upper Mall Scheme, Anand Road, Lahore-54000 not less than 48 hours before the time of
holding the meeting.
No person shall act as Proxy unless he / she himself / herself is a member of the Company, except that a corporation may appointa person who is not a member.
If a member appoints more than one proxy and more than one instruments of proxy are deposited by a member with theCompany, all such instruments of proxy shall be rendered invalid.
CDC Shareholders and their Proxies should attach an attested photocopy of their Computerized National Identity Card (CNIC) orPassport with the proxy form before submission to the Company. (Original CNIC / Passport is required to be produced at the timeof the meeting).
In case of corporate entity, the Board of Directors' resolution / power of attorney with specimen signature of the nominee shall besubmitted along with proxy form to the Company.

AFFIX
CORRECT
POSTAGEThe Company Secretary
Rupali Polyester LimitedRupali House,
241-242 Upper Mall Scheme, Anand Road,
Lahore-54000
A N N U A L R E P O R T 2 0 1 4
60 RUPALI POLYESTER LIMITED

Rupali Polyester Limited
Des
igne
d,
www.rupaligroup.com