Runtime Tools - erlang.orgerlang.org/documentation/doc-6.2/lib/runtime_tools-1.8.14/doc/pdf/... ·...
36
Runtime_Tools Copyright © 1999-2014 Ericsson AB. All Rights Reserved. Runtime_Tools 1.8.14 September 16, 2014
Transcript of Runtime Tools - erlang.orgerlang.org/documentation/doc-6.2/lib/runtime_tools-1.8.14/doc/pdf/... ·...

Runtime_ToolsCopyright © 1999-2014 Ericsson AB. All Rights Reserved.
Runtime_Tools 1.8.14September 16, 2014

Copyright © 1999-2014 Ericsson AB. All Rights Reserved.The contents of this file are subject to the Erlang Public License, Version 1.1, (the "License"); you may not usethis file except in compliance with the License. You should have received a copy of the Erlang Public Licensealong with this software. If not, it can be retrieved online at http://www.erlang.org/. Software distributed under theLicense is distributed on an "AS IS" basis, WITHOUT WARRANTY OF ANY KIND, either express or implied. Seethe License for the specific language governing rights and limitations under the License. Ericsson AB. All RightsReserved..
September 16, 2014

Ericsson AB. All Rights Reserved.: Runtime_Tools | 1

1.1 DTrace and Erlang/OTP
2 | Ericsson AB. All Rights Reserved.: Runtime_Tools
1 Runtime Tools User's Guide
Runtime Tools
1.1 DTrace and Erlang/OTP1.1.1 HistoryThe first implementation of DTrace probes for the Erlang virtual machine was presented at the 2008 ErlangUser Conference. That work, based on the Erlang/OTP R12 release, was discontinued due to what appears to bemiscommunication with the original developers.
Several users have created Erlang port drivers, linked-in drivers, or NIFs that allow Erlang code to try to activate aprobe, e.g. foo_module:dtrace_probe("message goes here!").
1.1.2 Goals• Annotate as much of the Erlang VM as is practical.
• The initial goal is to trace file I/O operations.
• Support all platforms that implement DTrace: OS X, Solaris, and (I hope) FreeBSD and NetBSD.
• To the extent that it's practical, support SystemTap on Linux via DTrace provider compatibility.
• Allow Erlang code to supply annotations.
1.1.3 Supported platforms• OS X 10.6.x / Snow Leopard, OS X 10.7.x / Lion and probably newer versions.
• Solaris 10. I have done limited testing on Solaris 11 and OpenIndiana release 151a, and both appear to work.
• FreeBSD 9.0 and 10.0.
• Linux via SystemTap compatibility. Please see $ERL_TOP/HOWTO/SYSTEMTAP.md for more details.
Just add the --with-dynamic-trace=dtrace option to your command when you run the configure script.If you are using systemtap, the configure option is --with-dynamic-trace=systemtap
1.1.4 StatusAs of R15B01, the dynamic trace code is included in the OTP source distribution, although it's considered experimental.The main development of the dtrace code still happens outside of Ericsson, but there is no need to fetch a patchedversion of the OTP source to get the basic funtionality.
1.1.5 Implementation summarySo far, most effort has been focused on the efile_drv.c code, which implements most file I/O on behalf of theErlang virtual machine. This driver also presents a big challenge: its use of an I/O worker pool (enabled by using theerl +A 8 flag, for example) makes it much more difficult to trace I/O activity because each of the following maybe executed in a different Pthread:
• I/O initiation (Erlang code)
• I/O proxy process handling, e.g. read/write when file is not opened in raw mode, operations executed by thecode & file server processes. (Erlang code)

1.1 DTrace and Erlang/OTP
Ericsson AB. All Rights Reserved.: Runtime_Tools | 3
• efile_drv command setup (C code)
• efile_drv command execution (C code)
• efile_drv status return (C code)
Example output from lib/runtime_tools/examples/efile_drv.d while executingfile:rename("old-name", "new-name"):
efile_drv enter tag={3,84} user tag some-user-tag | RENAME (12) | args: old-name new-name ,\ 0 0 (port #Port<0.59>)async I/O worker tag={3,83} | RENAME (12) | efile_drv-int_entryasync I/O worker tag={3,83} | RENAME (12) | efile_drv-int_returnefile_drv return tag={3,83} user tag | RENAME (12) | errno 2
... where the following key can help decipher the output:
• {3,83} is the Erlang scheduler thread number (3) and operation counter number (83) assigned to this I/Ooperation. Together, these two numbers form a unique ID for the I/O operation.
• 12 is the command number for the rename operation. See the definition for FILE_RENAME in the sourcecode file efile_drv.c or the BEGIN section of the D script lib/runtime_tools/examples/efile_drv.d.
• old-name and new-name are the two string arguments for the source and destination of the rename(2)system call. The two integer arguments are unused; the simple formatting code prints the arguments anyway, 0and 0.
• The worker pool code was called on behalf of Erlang port #Port<0.59>.
• The system call failed with a POSIX errno value of 2: ENOENT, because the path old-name does not exist.
• The efile_drv-int_entry and efile_drv_int_return probes are provided in case the user isinterested in measuring only the latency of code executed by efile_drv asynchronous functions by I/Oworker pool threads and the OS system call that they encapsulate.
So, where does the some-user-tag string come from?
At the moment, the user tag comes from code like the following:
dyntrace:put_tag("some-user-tag"),file:rename("old-name", "new-name"),
This method of tagging I/O at the Erlang level is subject to change.
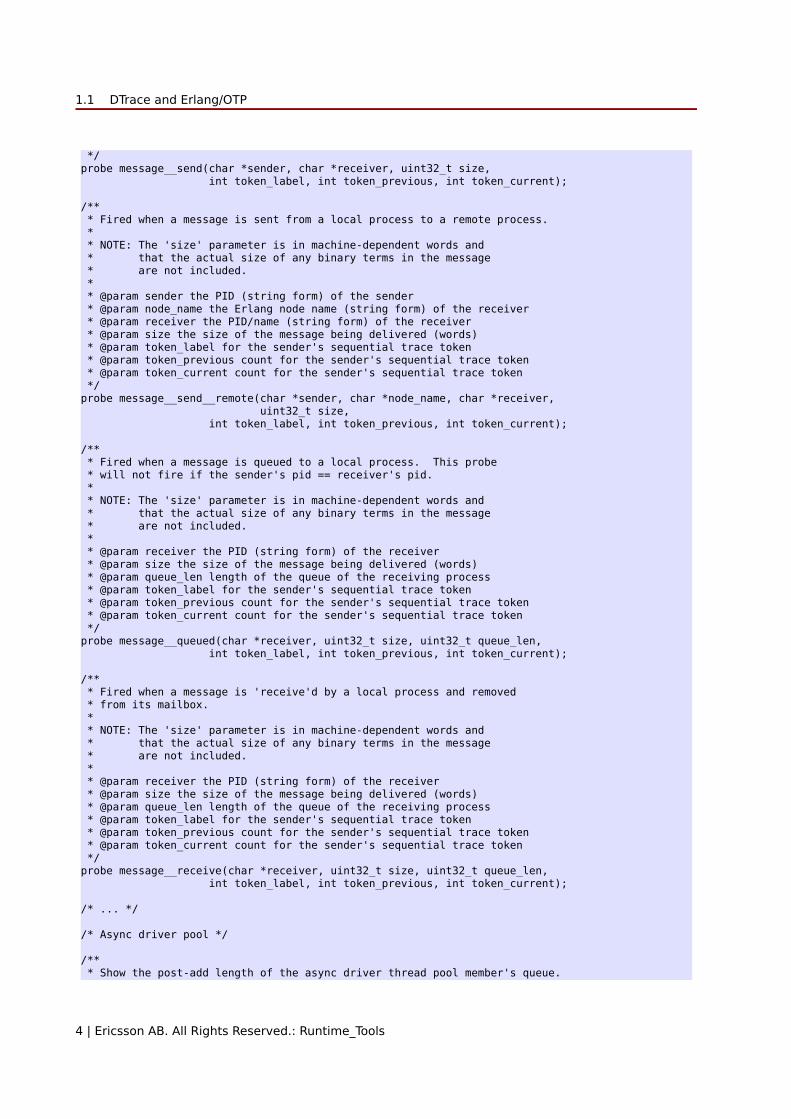
1.1.6 Example DTrace probe specification
/** * Fired when a message is sent from one local process to another. * * NOTE: The 'size' parameter is in machine-dependent words and * that the actual size of any binary terms in the message * are not included. * * @param sender the PID (string form) of the sender * @param receiver the PID (string form) of the receiver * @param size the size of the message being delivered (words) * @param token_label for the sender's sequential trace token * @param token_previous count for the sender's sequential trace token * @param token_current count for the sender's sequential trace token
1.1 DTrace and Erlang/OTP
4 | Ericsson AB. All Rights Reserved.: Runtime_Tools
*/probe message__send(char *sender, char *receiver, uint32_t size, int token_label, int token_previous, int token_current);
/** * Fired when a message is sent from a local process to a remote process. * * NOTE: The 'size' parameter is in machine-dependent words and * that the actual size of any binary terms in the message * are not included. * * @param sender the PID (string form) of the sender * @param node_name the Erlang node name (string form) of the receiver * @param receiver the PID/name (string form) of the receiver * @param size the size of the message being delivered (words) * @param token_label for the sender's sequential trace token * @param token_previous count for the sender's sequential trace token * @param token_current count for the sender's sequential trace token */probe message__send__remote(char *sender, char *node_name, char *receiver, uint32_t size, int token_label, int token_previous, int token_current);
/** * Fired when a message is queued to a local process. This probe * will not fire if the sender's pid == receiver's pid. * * NOTE: The 'size' parameter is in machine-dependent words and * that the actual size of any binary terms in the message * are not included. * * @param receiver the PID (string form) of the receiver * @param size the size of the message being delivered (words) * @param queue_len length of the queue of the receiving process * @param token_label for the sender's sequential trace token * @param token_previous count for the sender's sequential trace token * @param token_current count for the sender's sequential trace token */probe message__queued(char *receiver, uint32_t size, uint32_t queue_len, int token_label, int token_previous, int token_current);
/** * Fired when a message is 'receive'd by a local process and removed * from its mailbox. * * NOTE: The 'size' parameter is in machine-dependent words and * that the actual size of any binary terms in the message * are not included. * * @param receiver the PID (string form) of the receiver * @param size the size of the message being delivered (words) * @param queue_len length of the queue of the receiving process * @param token_label for the sender's sequential trace token * @param token_previous count for the sender's sequential trace token * @param token_current count for the sender's sequential trace token */probe message__receive(char *receiver, uint32_t size, uint32_t queue_len, int token_label, int token_previous, int token_current);
/* ... */
/* Async driver pool */
/** * Show the post-add length of the async driver thread pool member's queue.
1.1 DTrace and Erlang/OTP
Ericsson AB. All Rights Reserved.: Runtime_Tools | 5
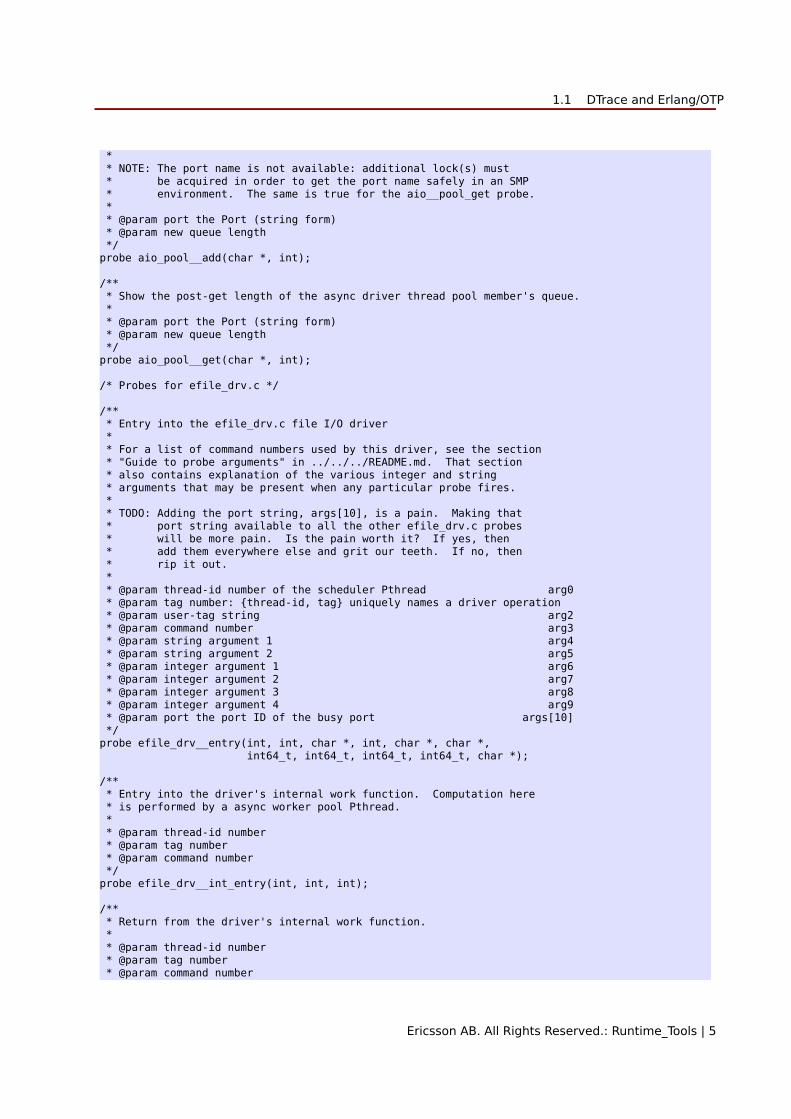
* * NOTE: The port name is not available: additional lock(s) must * be acquired in order to get the port name safely in an SMP * environment. The same is true for the aio__pool_get probe. * * @param port the Port (string form) * @param new queue length */probe aio_pool__add(char *, int);
/** * Show the post-get length of the async driver thread pool member's queue. * * @param port the Port (string form) * @param new queue length */probe aio_pool__get(char *, int);
/* Probes for efile_drv.c */
/** * Entry into the efile_drv.c file I/O driver * * For a list of command numbers used by this driver, see the section * "Guide to probe arguments" in ../../../README.md. That section * also contains explanation of the various integer and string * arguments that may be present when any particular probe fires. * * TODO: Adding the port string, args[10], is a pain. Making that * port string available to all the other efile_drv.c probes * will be more pain. Is the pain worth it? If yes, then * add them everywhere else and grit our teeth. If no, then * rip it out. * * @param thread-id number of the scheduler Pthread arg0 * @param tag number: {thread-id, tag} uniquely names a driver operation * @param user-tag string arg2 * @param command number arg3 * @param string argument 1 arg4 * @param string argument 2 arg5 * @param integer argument 1 arg6 * @param integer argument 2 arg7 * @param integer argument 3 arg8 * @param integer argument 4 arg9 * @param port the port ID of the busy port args[10] */probe efile_drv__entry(int, int, char *, int, char *, char *, int64_t, int64_t, int64_t, int64_t, char *);
/** * Entry into the driver's internal work function. Computation here * is performed by a async worker pool Pthread. * * @param thread-id number * @param tag number * @param command number */probe efile_drv__int_entry(int, int, int);
/** * Return from the driver's internal work function. * * @param thread-id number * @param tag number * @param command number
1.1 DTrace and Erlang/OTP
6 | Ericsson AB. All Rights Reserved.: Runtime_Tools
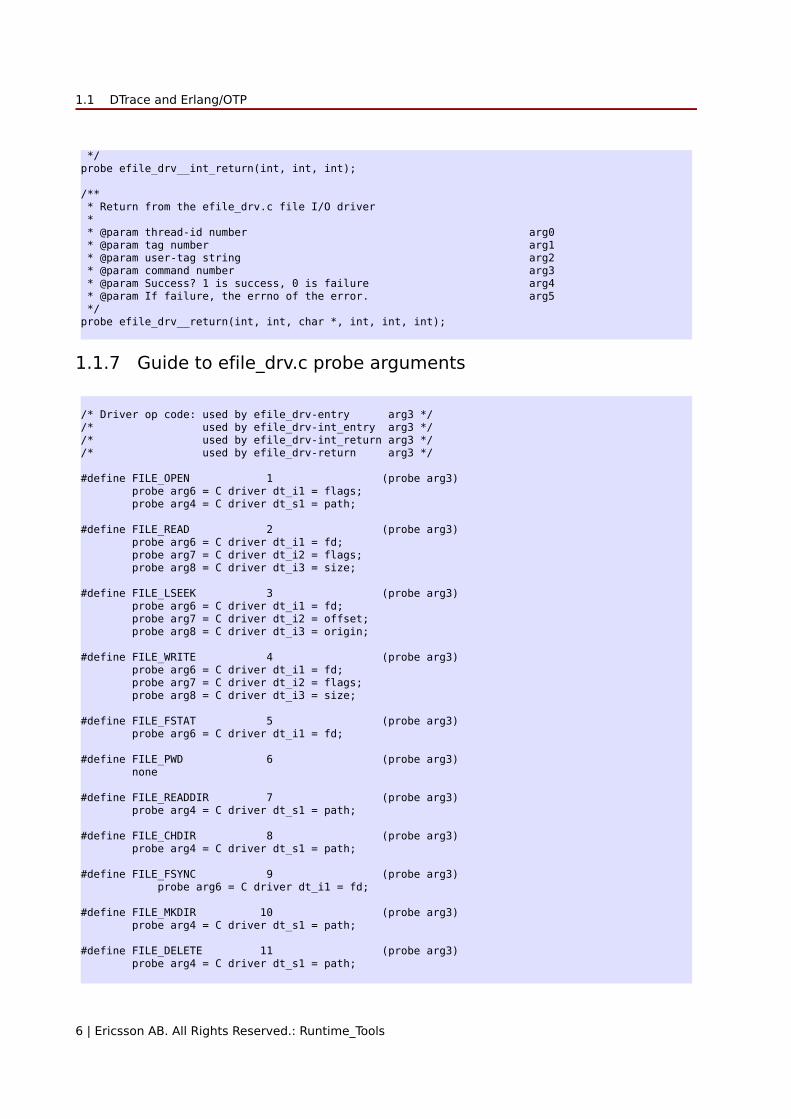
*/probe efile_drv__int_return(int, int, int);
/** * Return from the efile_drv.c file I/O driver * * @param thread-id number arg0 * @param tag number arg1 * @param user-tag string arg2 * @param command number arg3 * @param Success? 1 is success, 0 is failure arg4 * @param If failure, the errno of the error. arg5 */probe efile_drv__return(int, int, char *, int, int, int);
1.1.7 Guide to efile_drv.c probe arguments
/* Driver op code: used by efile_drv-entry arg3 *//* used by efile_drv-int_entry arg3 *//* used by efile_drv-int_return arg3 *//* used by efile_drv-return arg3 */
#define FILE_OPEN 1 (probe arg3) probe arg6 = C driver dt_i1 = flags; probe arg4 = C driver dt_s1 = path;
#define FILE_READ 2 (probe arg3) probe arg6 = C driver dt_i1 = fd; probe arg7 = C driver dt_i2 = flags; probe arg8 = C driver dt_i3 = size;
#define FILE_LSEEK 3 (probe arg3) probe arg6 = C driver dt_i1 = fd; probe arg7 = C driver dt_i2 = offset; probe arg8 = C driver dt_i3 = origin;
#define FILE_WRITE 4 (probe arg3) probe arg6 = C driver dt_i1 = fd; probe arg7 = C driver dt_i2 = flags; probe arg8 = C driver dt_i3 = size;
#define FILE_FSTAT 5 (probe arg3) probe arg6 = C driver dt_i1 = fd;
#define FILE_PWD 6 (probe arg3) none
#define FILE_READDIR 7 (probe arg3) probe arg4 = C driver dt_s1 = path;
#define FILE_CHDIR 8 (probe arg3) probe arg4 = C driver dt_s1 = path;
#define FILE_FSYNC 9 (probe arg3) probe arg6 = C driver dt_i1 = fd;
#define FILE_MKDIR 10 (probe arg3) probe arg4 = C driver dt_s1 = path;
#define FILE_DELETE 11 (probe arg3) probe arg4 = C driver dt_s1 = path;
1.1 DTrace and Erlang/OTP
Ericsson AB. All Rights Reserved.: Runtime_Tools | 7
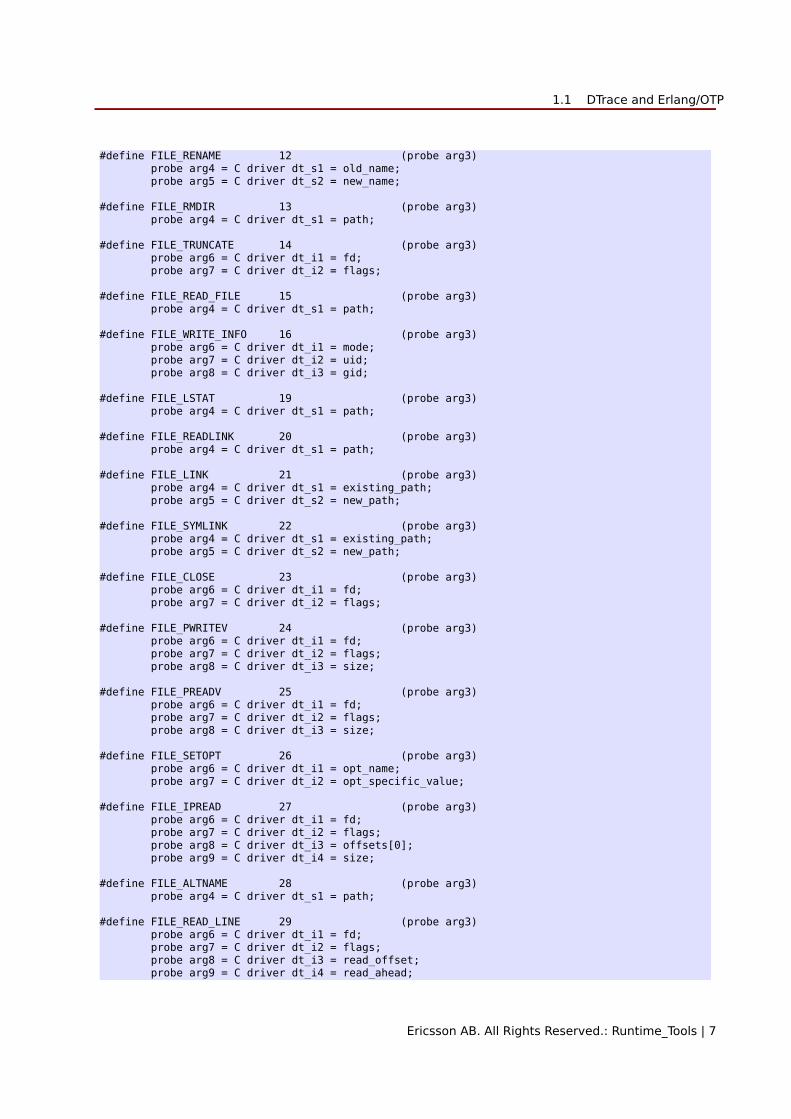
#define FILE_RENAME 12 (probe arg3) probe arg4 = C driver dt_s1 = old_name; probe arg5 = C driver dt_s2 = new_name;
#define FILE_RMDIR 13 (probe arg3) probe arg4 = C driver dt_s1 = path;
#define FILE_TRUNCATE 14 (probe arg3) probe arg6 = C driver dt_i1 = fd; probe arg7 = C driver dt_i2 = flags;
#define FILE_READ_FILE 15 (probe arg3) probe arg4 = C driver dt_s1 = path;
#define FILE_WRITE_INFO 16 (probe arg3) probe arg6 = C driver dt_i1 = mode; probe arg7 = C driver dt_i2 = uid; probe arg8 = C driver dt_i3 = gid;
#define FILE_LSTAT 19 (probe arg3) probe arg4 = C driver dt_s1 = path;
#define FILE_READLINK 20 (probe arg3) probe arg4 = C driver dt_s1 = path;
#define FILE_LINK 21 (probe arg3) probe arg4 = C driver dt_s1 = existing_path; probe arg5 = C driver dt_s2 = new_path;
#define FILE_SYMLINK 22 (probe arg3) probe arg4 = C driver dt_s1 = existing_path; probe arg5 = C driver dt_s2 = new_path;
#define FILE_CLOSE 23 (probe arg3) probe arg6 = C driver dt_i1 = fd; probe arg7 = C driver dt_i2 = flags;
#define FILE_PWRITEV 24 (probe arg3) probe arg6 = C driver dt_i1 = fd; probe arg7 = C driver dt_i2 = flags; probe arg8 = C driver dt_i3 = size;
#define FILE_PREADV 25 (probe arg3) probe arg6 = C driver dt_i1 = fd; probe arg7 = C driver dt_i2 = flags; probe arg8 = C driver dt_i3 = size;
#define FILE_SETOPT 26 (probe arg3) probe arg6 = C driver dt_i1 = opt_name; probe arg7 = C driver dt_i2 = opt_specific_value;
#define FILE_IPREAD 27 (probe arg3) probe arg6 = C driver dt_i1 = fd; probe arg7 = C driver dt_i2 = flags; probe arg8 = C driver dt_i3 = offsets[0]; probe arg9 = C driver dt_i4 = size;
#define FILE_ALTNAME 28 (probe arg3) probe arg4 = C driver dt_s1 = path;
#define FILE_READ_LINE 29 (probe arg3) probe arg6 = C driver dt_i1 = fd; probe arg7 = C driver dt_i2 = flags; probe arg8 = C driver dt_i3 = read_offset; probe arg9 = C driver dt_i4 = read_ahead;
1.2 SystemTap and Erlang/OTP
8 | Ericsson AB. All Rights Reserved.: Runtime_Tools
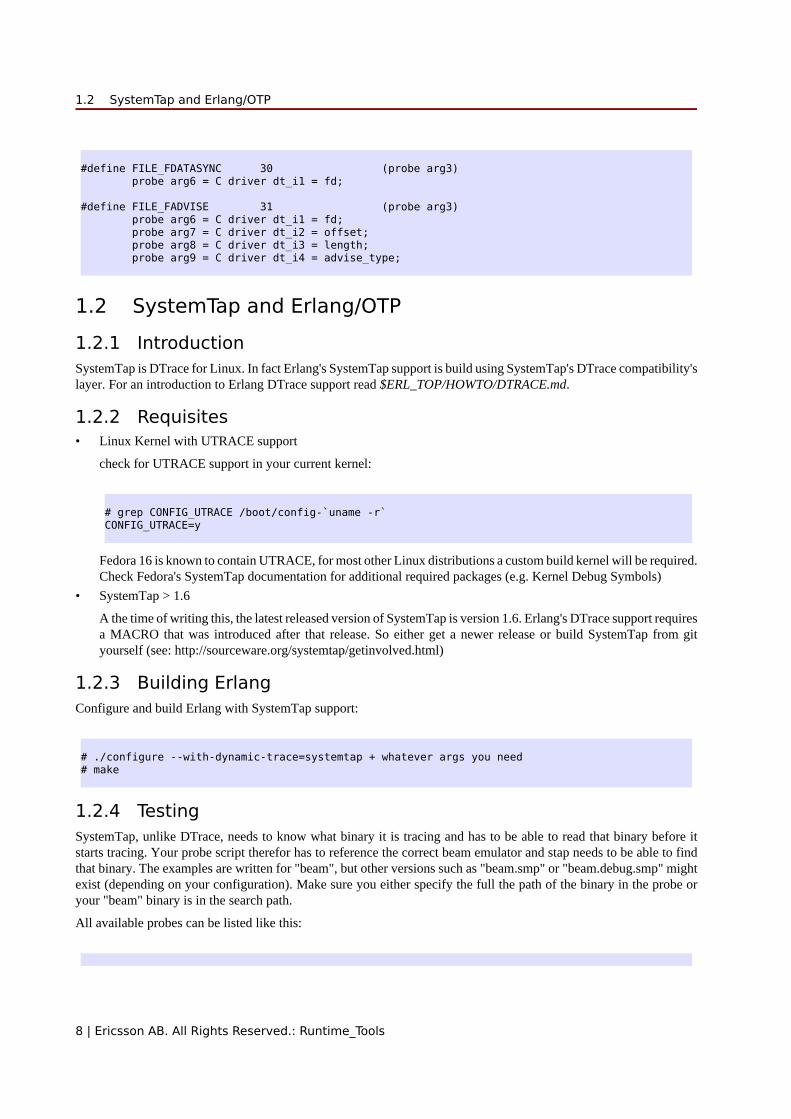
#define FILE_FDATASYNC 30 (probe arg3) probe arg6 = C driver dt_i1 = fd;
#define FILE_FADVISE 31 (probe arg3) probe arg6 = C driver dt_i1 = fd; probe arg7 = C driver dt_i2 = offset; probe arg8 = C driver dt_i3 = length; probe arg9 = C driver dt_i4 = advise_type;
1.2 SystemTap and Erlang/OTP1.2.1 IntroductionSystemTap is DTrace for Linux. In fact Erlang's SystemTap support is build using SystemTap's DTrace compatibility'slayer. For an introduction to Erlang DTrace support read $ERL_TOP/HOWTO/DTRACE.md.
1.2.2 Requisites• Linux Kernel with UTRACE support
check for UTRACE support in your current kernel:
# grep CONFIG_UTRACE /boot/config-`uname -r`CONFIG_UTRACE=y
Fedora 16 is known to contain UTRACE, for most other Linux distributions a custom build kernel will be required.Check Fedora's SystemTap documentation for additional required packages (e.g. Kernel Debug Symbols)
• SystemTap > 1.6
A the time of writing this, the latest released version of SystemTap is version 1.6. Erlang's DTrace support requiresa MACRO that was introduced after that release. So either get a newer release or build SystemTap from gityourself (see: http://sourceware.org/systemtap/getinvolved.html)
1.2.3 Building ErlangConfigure and build Erlang with SystemTap support:
# ./configure --with-dynamic-trace=systemtap + whatever args you need# make
1.2.4 TestingSystemTap, unlike DTrace, needs to know what binary it is tracing and has to be able to read that binary before itstarts tracing. Your probe script therefor has to reference the correct beam emulator and stap needs to be able to findthat binary. The examples are written for "beam", but other versions such as "beam.smp" or "beam.debug.smp" mightexist (depending on your configuration). Make sure you either specify the full the path of the binary in the probe oryour "beam" binary is in the search path.
All available probes can be listed like this:

1.2 SystemTap and Erlang/OTP
Ericsson AB. All Rights Reserved.: Runtime_Tools | 9
# stap -L 'process("beam").mark("*")'
or:
# PATH=/path/to/beam:$PATH stap -L 'process("beam").mark("*")'
Probes in the dtrace.so NIF library like this:
# PATH=/path/to/dtrace/priv/lib:$PATH stap -L 'process("dtrace.so").mark("*")'
1.2.5 Running SystemTap scriptsAdjust the process("beam") reference to your beam version and attach the script to a running "beam" instance:
# stap /path/to/probe/script/port1.systemtap -x <pid of beam>

1.2 SystemTap and Erlang/OTP
10 | Ericsson AB. All Rights Reserved.: Runtime_Tools
2 Reference Manual
Runtime_Tools provides low footprint tracing/debugging tools suitable for inclusion in a production system.
runtime_tools
Ericsson AB. All Rights Reserved.: Runtime_Tools | 11
runtime_toolsApplication
This chapter describes the Runtime_Tools application in OTP, which provides low footprint tracing/debugging toolssuitable for inclusion in a production system.
ConfigurationThere are currently no configuration parameters available for this application.
SEE ALSOapplication(3)

dbg
12 | Ericsson AB. All Rights Reserved.: Runtime_Tools
dbgErlang module
This module implements a text based interface to the trace/3 and the trace_pattern/2 BIFs. It makes itpossible to trace functions, processes and messages on text based terminals. It can be used instead of, or as complementto, the pman module.
For some examples of how to use dbg from the Erlang shell, see the simple example section.
The utilities are also suitable to use in system testing on large systems, where other tools have too much impact on thesystem performance. Some primitive support for sequential tracing is also included, see the advanced topics section.
Exports
fun2ms(LiteralFun) -> MatchSpecTypes:
LiteralFun = fun() literal
MatchSpec = term()
Pseudo function that by means of a parse_transform translates the literalfun() typed as parameter in thefunction call to a match specification as described in the match_spec manual of ERTS users guide. (with literal Imean that the fun() needs to textually be written as the parameter of the function, it cannot be held in a variablewhich in turn is passed to the function).
The parse transform is implemented in the module ms_transform and the source must include the filems_transform.hrl in STDLIB for this pseudo function to work. Failing to include the hrl file in the sourcewill result in a runtime error, not a compile time ditto. The include file is easiest included by adding the line -include_lib("stdlib/include/ms_transform.hrl"). to the source file.
The fun() is very restricted, it can take only a single parameter (the parameter list to match), a sole variable or alist. It needs to use the is_XXX guard tests and one cannot use language constructs that have no representation ina match_spec (like if, case, receive etc). The return value from the fun will be the return value of the resultingmatch_spec.
Example:
1> dbg:fun2ms(fun([M,N]) when N > 3 -> return_trace() end).[{['$1','$2'],[{'>','$2',3}],[{return_trace}]}]
Variables from the environment can be imported, so that this works:
2> X=3.33> dbg:fun2ms(fun([M,N]) when N > X -> return_trace() end).[{['$1','$2'],[{'>','$2',{const,3}}],[{return_trace}]}]
The imported variables will be replaced by match_spec const expressions, which is consistent with the static scopingfor Erlang fun()s. Local or global function calls can not be in the guard or body of the fun however. Calls to builtinmatch_spec functions of course is allowed:
dbg
Ericsson AB. All Rights Reserved.: Runtime_Tools | 13
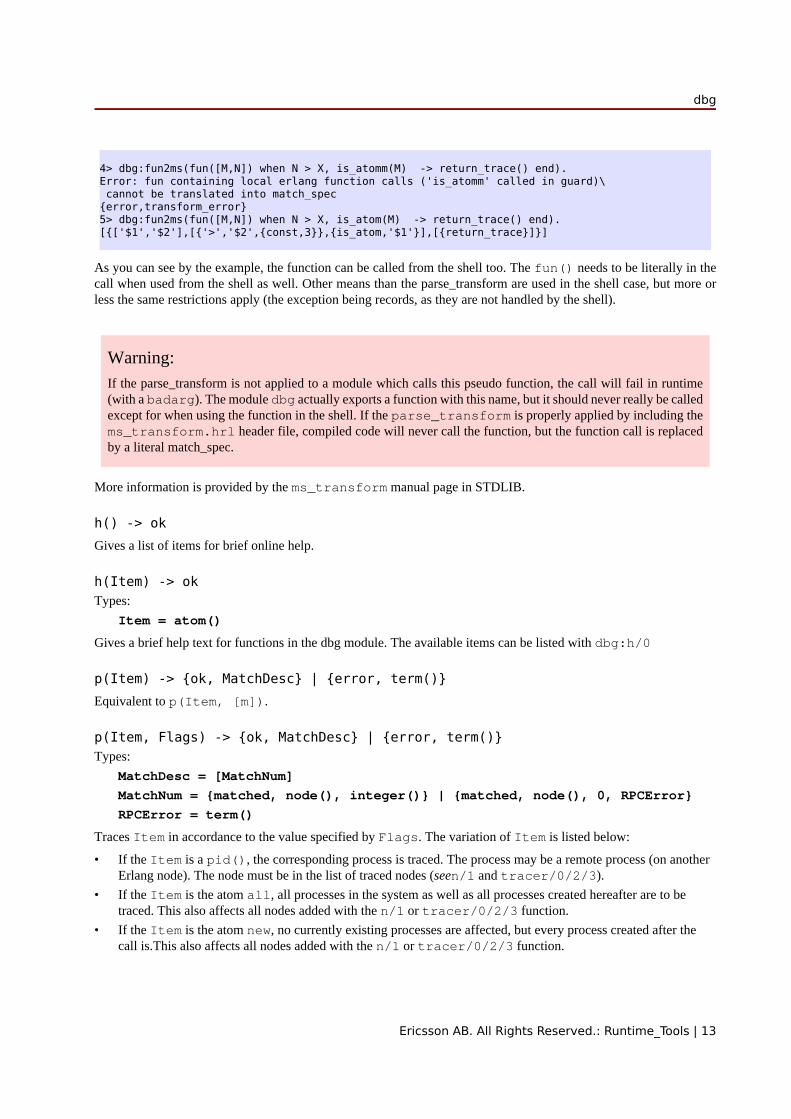
4> dbg:fun2ms(fun([M,N]) when N > X, is_atomm(M) -> return_trace() end).Error: fun containing local erlang function calls ('is_atomm' called in guard)\ cannot be translated into match_spec{error,transform_error}5> dbg:fun2ms(fun([M,N]) when N > X, is_atom(M) -> return_trace() end).[{['$1','$2'],[{'>','$2',{const,3}},{is_atom,'$1'}],[{return_trace}]}]
As you can see by the example, the function can be called from the shell too. The fun() needs to be literally in thecall when used from the shell as well. Other means than the parse_transform are used in the shell case, but more orless the same restrictions apply (the exception being records, as they are not handled by the shell).
Warning:If the parse_transform is not applied to a module which calls this pseudo function, the call will fail in runtime(with a badarg). The module dbg actually exports a function with this name, but it should never really be calledexcept for when using the function in the shell. If the parse_transform is properly applied by including thems_transform.hrl header file, compiled code will never call the function, but the function call is replacedby a literal match_spec.
More information is provided by the ms_transform manual page in STDLIB.
h() -> okGives a list of items for brief online help.
h(Item) -> okTypes:
Item = atom()
Gives a brief help text for functions in the dbg module. The available items can be listed with dbg:h/0
p(Item) -> {ok, MatchDesc} | {error, term()}Equivalent to p(Item, [m]).
p(Item, Flags) -> {ok, MatchDesc} | {error, term()}Types:
MatchDesc = [MatchNum]
MatchNum = {matched, node(), integer()} | {matched, node(), 0, RPCError}
RPCError = term()
Traces Item in accordance to the value specified by Flags. The variation of Item is listed below:
• If the Item is a pid(), the corresponding process is traced. The process may be a remote process (on anotherErlang node). The node must be in the list of traced nodes (seen/1 and tracer/0/2/3).
• If the Item is the atom all, all processes in the system as well as all processes created hereafter are to betraced. This also affects all nodes added with the n/1 or tracer/0/2/3 function.
• If the Item is the atom new, no currently existing processes are affected, but every process created after thecall is.This also affects all nodes added with the n/1 or tracer/0/2/3 function.
dbg
14 | Ericsson AB. All Rights Reserved.: Runtime_Tools
• If the Item is the atom existing, all existing processes are traced, but new processes will not beaffected.This also affects all nodes added with the n/1 or tracer/0/2/3 function.
• If the Item is an atom other than all, new or existing, the process with the corresponding registered nameis traced.The process may be a remote process (on another Erlang node). The node must be added with the n/1or tracer/0/2/3 function.
• If the Item is an integer, the process <0.Item.0> is traced.
• If the Item is a tuple {X, Y, Z}, the process <X.Y.Z> is traced.
• If the Item is a string "<X.Y.Z>" as returned from pid_to_list/1, the process <X.Y.Z> is traced.
Flags can be a single atom, or a list of flags. The available flags are:
s (send)
Traces the messages the process sends.
r (receive)
Traces the messages the process receives.
m (messages)
Traces the messages the process receives and sends.
c (call)
Traces global function calls for the process according to the trace patterns set in the system (see tp/2).
p (procs)
Traces process related events to the process.
sos (set on spawn)
Lets all processes created by the traced process inherit the trace flags of the traced process.
sol (set on link)
Lets another process, P2, inherit the trace flags of the traced process whenever the traced process links to P2.
sofs (set on first spawn)
This is the same as sos, but only for the first process spawned by the traced process.
sofl (set on first link)
This is the same as sol, but only for the first call to link/1 by the traced process.
all
Sets all flags except silent.
clear
Clears all flags.
The list can also include any of the flags allowed in erlang:trace/3
The function returns either an error tuple or a tuple {ok, List}. The List consists of specifications of how manyprocesses that matched (in the case of a pure pid() exactly 1). The specification of matched processes is {matched,Node, N}. If the remote processor call,rpc, to a remote node fails, the rpc error message is delivered as a fourthargument and the number of matched processes are 0. Note that the result {ok, List} may contain a list where rpccalls to one, several or even all nodes failed.
c(Mod, Fun, Args)Equivalent to c(Mod, Fun, Args, all).
dbg
Ericsson AB. All Rights Reserved.: Runtime_Tools | 15
c(Mod, Fun, Args, Flags)Evaluates the expression apply(Mod, Fun, Args) with the trace flags in Flags set. This is a convenient wayto trace processes from the Erlang shell.
i() -> okDisplays information about all traced processes.
tp(Module,MatchSpec)Same as tp({Module, '_', '_'}, MatchSpec)
tp(Module,Function,MatchSpec)Same as tp({Module, Function, '_'}, MatchSpec)
tp(Module, Function, Arity, MatchSpec)Same as tp({Module, Function, Arity}, MatchSpec)
tp({Module, Function, Arity}, MatchSpec) -> {ok, MatchDesc} | {error, term()}Types:
Module = atom() | '_'
Function = atom() | '_'
Arity = integer() |'_'
MatchSpec = integer() | Built-inAlias | [] | match_spec()
Built-inAlias = x | c | cx
MatchDesc = [MatchInfo]
MatchInfo = {saved, integer()} | MatchNum
MatchNum = {matched, node(), integer()} | {matched, node(), 0, RPCError}
This function enables call trace for one or more functions. All exported functions matching the {Module,Function, Arity} argument will be concerned, but the match_spec() may further narrow down the set offunction calls generating trace messages.
For a description of the match_spec() syntax, please turn to the User's guide part of the online documentationfor the runtime system (erts). The chapter Match Specification in Erlang explains the general match specification"language".
The Module, Function and/or Arity parts of the tuple may be specified as the atom '_' which is a "wild-card" matchingall modules/functions/arities. Note, if the Module is specified as '_', the Function and Arity parts have to be specifiedas '_' too. The same holds for the Functions relation to the Arity.
All nodes added with n/1 or tracer/0/2/3 will be affected by this call, and if Module is not '_' the modulewill be loaded on all nodes.
The function returns either an error tuple or a tuple {ok, List}. The List consists of specifications of how manyfunctions that matched, in the same way as the processes are presented in the return value of p/2.
There may be a tuple {saved, N} in the return value, if the MatchSpec is other than []. The integer N may then beused in subsequent calls to this function and will stand as an "alias" for the given expression. There are also a coupleof built-in aliases for common expressions, see ltp/0 below for details.
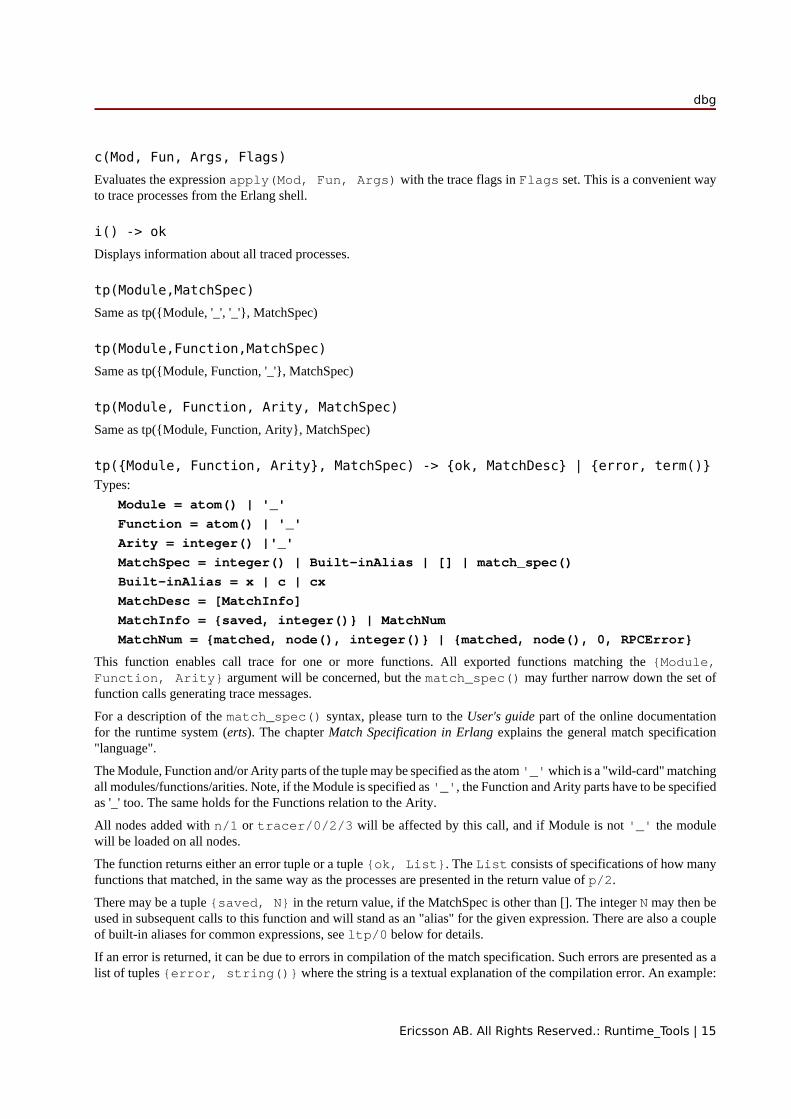
If an error is returned, it can be due to errors in compilation of the match specification. Such errors are presented as alist of tuples {error, string()} where the string is a textual explanation of the compilation error. An example:
dbg
16 | Ericsson AB. All Rights Reserved.: Runtime_Tools
(x@y)4> dbg:tp({dbg,ltp,0},[{[],[],[{message, two, arguments}, {noexist}]}]).{error, [{error,"Special form 'message' called with wrong number of arguments in {message,two,arguments}."}, {error,"Function noexist/1 does_not_exist."}]}
tpl(Module,MatchSpec)Same as tpl({Module, '_', '_'}, MatchSpec)
tpl(Module,Function,MatchSpec)Same as tpl({Module, Function, '_'}, MatchSpec)
tpl(Module, Function, Arity, MatchSpec)Same as tpl({Module, Function, Arity}, MatchSpec)
tpl({Module, Function, Arity}, MatchSpec) -> {ok, MatchDesc} | {error,term()}This function works as tp/2, but enables tracing for local calls (and local functions) as well as for global calls (andfunctions).
ctp()Same as ctp({'_', '_', '_'})
ctp(Module)Same as ctp({Module, '_', '_'})
ctp(Module, Function)Same as ctp({Module, Function, '_'})
ctp(Module, Function, Arity)Same as ctp({Module, Function, Arity})
ctp({Module, Function, Arity}) -> {ok, MatchDesc} | {error, term()}Types:
Module = atom() | '_'
Function = atom() | '_'
Arity = integer() | '_'
MatchDesc = [MatchNum]
MatchNum = {matched, node(), integer()} | {matched, node(), 0, RPCError}
This function disables call tracing on the specified functions. The semantics of the parameter is the same as for thecorresponding function specification in tp/2 or tpl/2. Both local and global call trace is disabled.
The return value reflects how many functions that matched, and is constructed as described in tp/2. No tuple{saved, N} is however ever returned (for obvious reasons).
dbg
Ericsson AB. All Rights Reserved.: Runtime_Tools | 17
ctpl()Same as ctpl({'_', '_', '_'})
ctpl(Module)Same as ctpl({Module, '_', '_'})
ctpl(Module, Function)Same as ctpl({Module, Function, '_'})
ctpl(Module, Function, Arity)Same as ctpl({Module, Function, Arity})
ctpl({Module, Function, Arity}) -> {ok, MatchDesc} | {error, term()}This function works as ctp/1, but only disables tracing set up with tpl/2 (not with tp/2).
ctpg()Same as ctpg({'_', '_', '_'})
ctpg(Module)Same as ctpg({Module, '_', '_'})
ctpg(Module, Function)Same as ctpg({Module, Function, '_'})
ctpg(Module, Function, Arity)Same as ctpg({Module, Function, Arity})
ctpg({Module, Function, Arity}) -> {ok, MatchDesc} | {error, term()}This function works as ctp/1, but only disables tracing set up with tp/2 (not with tpl/2).
ltp() -> okUse this function to recall all match specifications previously used in the session (i. e. previously saved during callsto tp/2, and built-in match specifications. This is very useful, as a complicated match_spec can be quite awkward towrite. Note that the match specifications are lost if stop/0 is called.
Match specifications used can be saved in a file (if a read-write file system is present) for use in later debuggingsessions, see wtp/1 and rtp/1
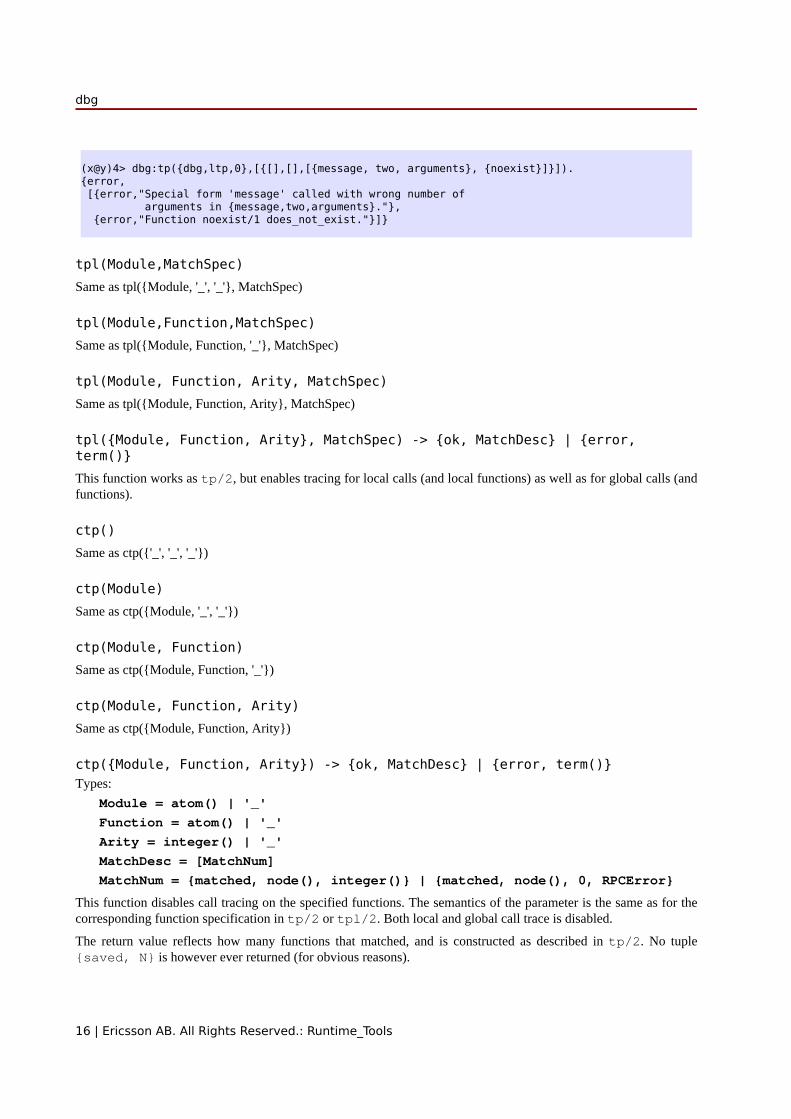
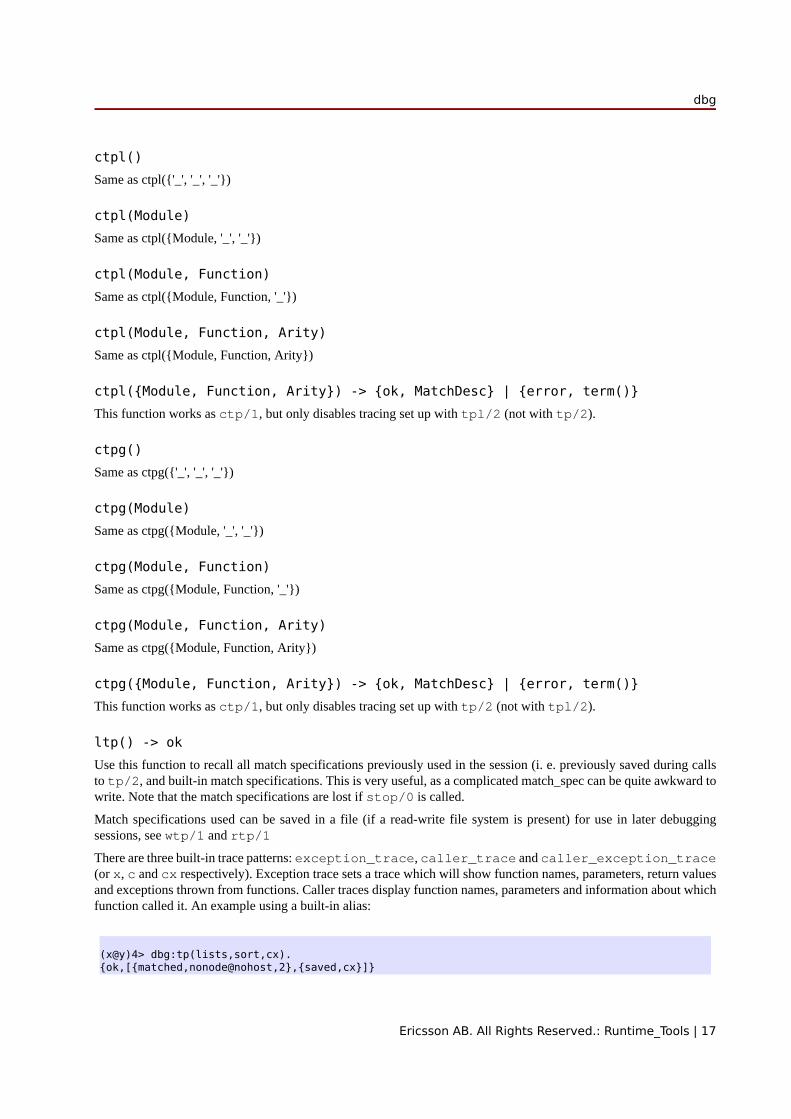
There are three built-in trace patterns: exception_trace, caller_trace and caller_exception_trace(or x, c and cx respectively). Exception trace sets a trace which will show function names, parameters, return valuesand exceptions thrown from functions. Caller traces display function names, parameters and information about whichfunction called it. An example using a built-in alias:
(x@y)4> dbg:tp(lists,sort,cx).{ok,[{matched,nonode@nohost,2},{saved,cx}]}
dbg
18 | Ericsson AB. All Rights Reserved.: Runtime_Tools
(x@y)4> lists:sort([2,1]).(<0.32.0>) call lists:sort([2,1]) ({erl_eval,do_apply,5})(<0.32.0>) returned from lists:sort/1 -> [1,2][1,2]
dtp() -> okUse this function to "forget" all match specifications saved during calls to tp/2. This is useful when one wants torestore other match specifications from a file with rtp/1. Use dtp/1 to delete specific saved match specifications.
dtp(N) -> okTypes:
N = integer()
Use this function to "forget" a specific match specification saved during calls to tp/2.
wtp(Name) -> ok | {error, IOError}Types:
Name = string()
IOError = term()
This function will save all match specifications saved during the session (during calls to tp/2) and built-in matchspecifications in a text file with the name designated by Name. The format of the file is textual, why it can be editedwith an ordinary text editor, and then restored with rtp/1.
Each match spec in the file ends with a full stop (.) and new (syntactically correct) match specifications can be addedto the file manually.
The function returns ok or an error tuple where the second element contains the I/O error that made the writingimpossible.
rtp(Name) -> ok | {error, Error}Types:
Name = string()
Error = term()
This function reads match specifications from a file (possibly) generated by the wtp/1 function. It checks the syntaxof all match specifications and verifies that they are correct. The error handling principle is "all or nothing", i. e. if someof the match specifications are wrong, none of the specifications are added to the list of saved match specificationsfor the running system.
The match specifications in the file are merged with the current match specifications, so that no duplicates aregenerated. Use ltp/0 to see what numbers were assigned to the specifications from the file.
The function will return an error, either due to I/O problems (like a non existing or non readable file) or due to fileformat problems. The errors from a bad format file are in a more or less textual format, which will give a hint to what'scausing the problem.
n(Nodename) -> {ok, Nodename} | {error, Reason}Types:
Nodename = atom()
Reason = term()

dbg
Ericsson AB. All Rights Reserved.: Runtime_Tools | 19
The dbg server keeps a list of nodes where tracing should be performed. Whenever a tp/2 call or a p/2 call is made,it is executed for all nodes in this list including the local node (except for p/2 with a specific pid() as first argument,in which case the command is executed only on the node where the designated process resides).
This function adds a remote node (Nodename) to the list of nodes where tracing is performed. It starts a tracerprocess on the remote node, which will send all trace messages to the tracer process on the local node (via the Erlangdistribution). If no tracer process is running on the local node, the error reason no_local_tracer is returned. Thetracer process on the local node must be started with the tracer/0/2 function.
If Nodename is the local node, the error reason cant_add_local_node is returned.
If a trace port (seetrace_port/2) is running on the local node, remote nodes can not be traced with a tracer process.The error reason cant_trace_remote_pid_to_local_port is returned. A trace port can however be startedon the remote node with the tracer/3 function.
The function will also return an error if the node Nodename is not reachable.
cn(Nodename) -> okTypes:
Nodename = atom()
Clears a node from the list of traced nodes. Subsequent calls to tp/2 and p/2 will not consider that node, but tracingalready activated on the node will continue to be in effect.
Returns ok, cannot fail.
ln() -> okShows the list of traced nodes on the console.
tracer() -> {ok, pid()} | {error, already_started}This function starts a server on the local node that will be the recipient of all trace messages. All subsequent calls top/2 will result in messages sent to the newly started trace server.
A trace server started in this way will simply display the trace messages in a formatted way in the Erlang shell (i. e.use io:format). See tracer/2 for a description of how the trace message handler can be customized.
To start a similar tracer on a remote node, use n/1.
tracer(Type, Data) -> {ok, pid()} | {error, Error}Types:
Type = port | process
Data = PortGenerator | HandlerSpec
HandlerSpec = {HandlerFun, InitialData}
HandlerFun = fun() (two arguments)
InitialData = term()
PortGenerator = fun() (no arguments)
Error = term()
This function starts a tracer server with additional parameters on the local node. The first parameter, the Type, indicatesif trace messages should be handled by a receiving process (process) or by a tracer port (port). For a descriptionabout tracer ports see trace_port/2.
If Type is a process, a message handler function can be specified (HandlerSpec). The handler function, whichshould be a fun taking two arguments, will be called for each trace message, with the first argument containing the
dbg
20 | Ericsson AB. All Rights Reserved.: Runtime_Tools
message as it is and the second argument containing the return value from the last invocation of the fun. The initialvalue of the second parameter is specified in the InitialData part of the HandlerSpec. The HandlerFunmay choose any appropriate action to take when invoked, and can save a state for the next invocation by returning it.
If Type is a port, then the second parameter should be a fun which takes no arguments and returns a newly openedtrace port when called. Such a fun is preferably generated by calling trace_port/2.
If an error is returned, it can either be due to a tracer server already running ({error,already_started}) ordue to the HandlerFun throwing an exception.
To start a similar tracer on a remote node, use tracer/3.
tracer(Nodename, Type, Data) -> {ok, Nodename} | {error, Reason}Types:
Nodename = atom()
This function is equivalent to tracer/2, but acts on the given node. A tracer is started on the node (Nodename)and the node is added to the list of traced nodes.
Note:This function is not equivalent to n/1. While n/1 starts a process tracer which redirects all trace informationto a process tracer on the local node (i.e. the trace control node), tracer/3 starts a tracer of any type which isindependent of the tracer on the trace control node.
For details, seetracer/2.
trace_port(Type, Parameters) -> fun()Types:
Type = ip | file
Parameters = Filename | WrapFilesSpec | IPPortSpec
Filename = string() | [string()] | atom()
WrapFilesSpec = {Filename, wrap, Suffix} | {Filename, wrap, Suffix,WrapSize} | {Filename, wrap, Suffix, WrapSize, WrapCnt}
Suffix = string()
WrapSize = integer() >= 0 | {time, WrapTime}
WrapTime = integer() >= 1
WrapCnt = integer() >= 1
IpPortSpec = PortNumber | {PortNumber, QueSize}
PortNumber = integer()
QueSize = integer()
This function creates a trace port generating fun. The fun takes no arguments and returns a newly opened traceport. The return value from this function is suitable as a second parameter to tracer/2, i.e. dbg:tracer(port,dbg:trace_port(ip, 4711)).
A trace port is an Erlang port to a dynamically linked in driver that handles trace messages directly, without theoverhead of sending them as messages in the Erlang virtual machine.
Two trace drivers are currently implemented, the file and the ip trace drivers. The file driver sends all trace messagesinto one or several binary files, from where they later can be fetched and processed with the trace_client/2
dbg
Ericsson AB. All Rights Reserved.: Runtime_Tools | 21
function. The ip driver opens a TCP/IP port where it listens for connections. When a client (preferably started bycalling trace_client/2 on another Erlang node) connects, all trace messages are sent over the IP network forfurther processing by the remote client.
Using a trace port significantly lowers the overhead imposed by using tracing.
The file trace driver expects a filename or a wrap files specification as parameter. A file is written with a high degreeof buffering, why all trace messages are not guaranteed to be saved in the file in case of a system crash. That is theprice to pay for low tracing overhead.
A wrap files specification is used to limit the disk space consumed by the trace. The trace is written to a limited numberof files each with a limited size. The actual filenames are Filename ++ SeqCnt ++ Suffix, where SeqCntcounts as a decimal string from 0 to WrapCnt and then around again from 0. When a trace term written to the currentfile makes it longer than WrapSize, that file is closed, if the number of files in this wrap trace is as many as WrapCntthe oldest file is deleted then a new file is opened to become the current. Thus, when a wrap trace has been stopped,there are at most WrapCnt trace files saved with a size of at least WrapSize (but not much bigger), except for thelast file that might even be empty. The default values are WrapSize = 128*1024 and WrapCnt = 8.
The SeqCnt values in the filenames are all in the range 0 through WrapCnt with a gap in the circular sequence.The gap is needed to find the end of the trace.
If the WrapSize is specified as {time, WrapTime}, the current file is closed when it has been open more thanWrapTime milliseconds, regardless of it being empty or not.
The ip trace driver has a queue of QueSize messages waiting to be delivered. If the driver cannot deliver messagesas fast as they are produced by the runtime system, a special message is sent, which indicates how many messages thatare dropped. That message will arrive at the handler function specified in trace_client/3 as the tuple {drop,N} where N is the number of consecutive messages dropped. In case of heavy tracing, drop's are likely to occur, andthey surely occur if no client is reading the trace messages.
flush_trace_port()Equivalent to flush_trace_port(node()).
flush_trace_port(Nodename) -> ok | {error, Reason}Equivalent to trace_port_control(Nodename,flush).
trace_port_control(Operation)Equivalent to trace_port_control(node(),Operation).
trace_port_control(Nodename,Operation) -> ok | {ok, Result} | {error, Reason}Types:
Nodename = atom()
This function is used to do a control operation on the active trace port driver on the given node (Nodename). Whichoperations are allowed as well as their return values depend on which trace driver is used.
Returns either ok or {ok, Result} if the operation was successful, or {error, Reason} if the current traceris a process or if it is a port not supporting the operation.
The allowed values for Operation are:
flush
This function is used to flush the internal buffers held by a trace port driver. Currently only the file trace driversupports this operation. Returns ok.
dbg
22 | Ericsson AB. All Rights Reserved.: Runtime_Tools
get_listen_port
Returns {ok, IpPort} where IpPortis the IP port number used by the driver listen socket. Only the ip tracedriver supports this operation.
trace_client(Type, Parameters) -> pid()Types:
Type = ip | file | follow_file
Parameters = Filename | WrapFilesSpec | IPClientPortSpec
Filename = string() | [string()] | atom()
WrapFilesSpec = see trace_port/2
Suffix = string()
IpClientPortSpec = PortNumber | {Hostname, PortNumber}
PortNumber = integer()
Hostname = string()
This function starts a trace client that reads the output created by a trace port driver and handles it in mostly the sameway as a tracer process created by the tracer/0 function.
If Type is file, the client reads all trace messages stored in the file named Filename or specified byWrapFilesSpec (must be the same as used when creating the trace, see trace_port/2) and let's the default handlerfunction format the messages on the console. This is one way to interpret the data stored in a file by the file traceport driver.
If Type is follow_file, the client behaves as in the file case, but keeps trying to read (and process) more datafrom the file until stopped by stop_trace_client/1. WrapFilesSpec is not allowed as second argument forthis Type.
If Type is ip, the client connects to the TCP/IP port PortNumber on the host Hostname, from where it reads tracemessages until the TCP/IP connection is closed. If no Hostname is specified, the local host is assumed.
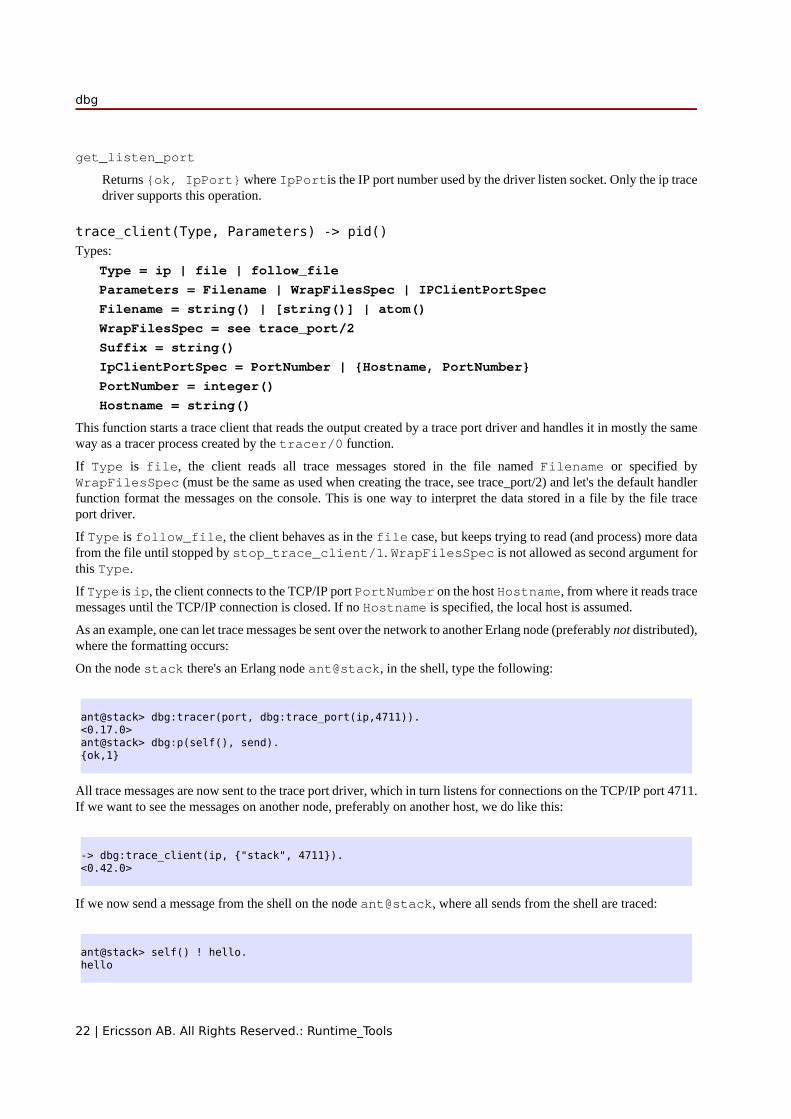
As an example, one can let trace messages be sent over the network to another Erlang node (preferably not distributed),where the formatting occurs:
On the node stack there's an Erlang node ant@stack, in the shell, type the following:
ant@stack> dbg:tracer(port, dbg:trace_port(ip,4711)).<0.17.0>ant@stack> dbg:p(self(), send).{ok,1}
All trace messages are now sent to the trace port driver, which in turn listens for connections on the TCP/IP port 4711.If we want to see the messages on another node, preferably on another host, we do like this:
-> dbg:trace_client(ip, {"stack", 4711}).<0.42.0>
If we now send a message from the shell on the node ant@stack, where all sends from the shell are traced:
ant@stack> self() ! hello.hello

dbg
Ericsson AB. All Rights Reserved.: Runtime_Tools | 23
The following will appear at the console on the node that started the trace client:
(<0.23.0>) <0.23.0> ! hello(<0.23.0>) <0.22.0> ! {shell_rep,<0.23.0>,{value,hello,[],[]}}
The last line is generated due to internal message passing in the Erlang shell. The process id's will vary.
trace_client(Type, Parameters, HandlerSpec) -> pid()Types:
Type = ip | file | follow_file
Parameters = Filename | WrapFilesSpec | IPClientPortSpec
Filename = string() | [string()] | atom()
WrapFilesSpec = see trace_port/2
Suffix = string()
IpClientPortSpec = PortNumber | {Hostname, PortNumber}
PortNumber = integer()
Hostname = string()
HandlerSpec = {HandlerFun, InitialData}
HandlerFun = fun() (two arguments)
InitialData = term()
This function works exactly as trace_client/2, but allows you to write your own handler function. The handlerfunction works mostly as the one described in tracer/2, but will also have to be prepared to handle trace messagesof the form {drop, N}, where N is the number of dropped messages. This pseudo trace message will only occurif the ip trace driver is used.
For trace type file, the pseudo trace message end_of_trace will appear at the end of the trace. The return valuefrom the handler function is in this case ignored.
stop_trace_client(Pid) -> okTypes:
Pid = pid()
This function shuts down a previously started trace client. The Pid argument is the process id returned from thetrace_client/2 or trace_client/3 call.
get_tracer()Equivalent to get_tracer(node()).
get_tracer(Nodename) -> {ok, Tracer}Types:
Nodename = atom()
Tracer = port() | pid()
Returns the process or port to which all trace messages are sent.
dbg
24 | Ericsson AB. All Rights Reserved.: Runtime_Tools
stop() -> okStops the dbg server and clears all trace flags for all processes and all trace patterns for all functions. Also shuts downall trace clients and closes all trace ports.
Note that no trace patterns are affected by this function.
stop_clear() -> okSame as stop/0, but also clears all trace patterns on local and global functions calls.
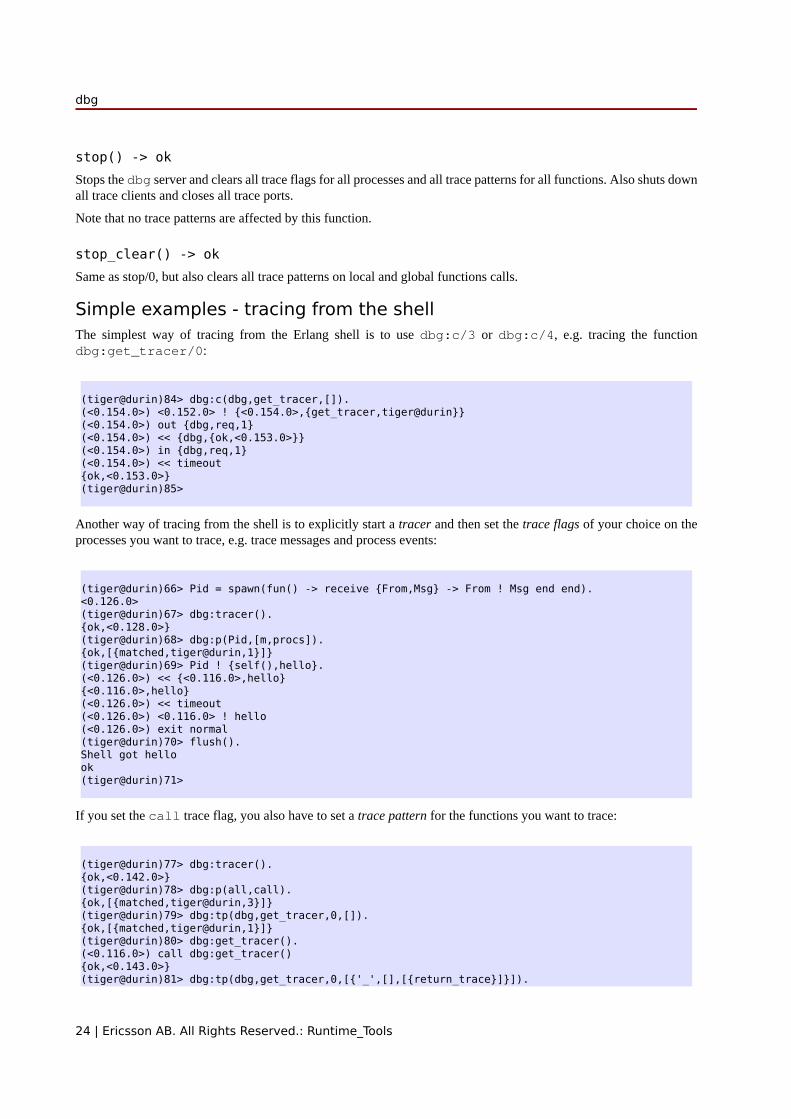
Simple examples - tracing from the shellThe simplest way of tracing from the Erlang shell is to use dbg:c/3 or dbg:c/4, e.g. tracing the functiondbg:get_tracer/0:
(tiger@durin)84> dbg:c(dbg,get_tracer,[]).(<0.154.0>) <0.152.0> ! {<0.154.0>,{get_tracer,tiger@durin}}(<0.154.0>) out {dbg,req,1}(<0.154.0>) << {dbg,{ok,<0.153.0>}}(<0.154.0>) in {dbg,req,1}(<0.154.0>) << timeout{ok,<0.153.0>}(tiger@durin)85>
Another way of tracing from the shell is to explicitly start a tracer and then set the trace flags of your choice on theprocesses you want to trace, e.g. trace messages and process events:
(tiger@durin)66> Pid = spawn(fun() -> receive {From,Msg} -> From ! Msg end end).<0.126.0>(tiger@durin)67> dbg:tracer().{ok,<0.128.0>}(tiger@durin)68> dbg:p(Pid,[m,procs]).{ok,[{matched,tiger@durin,1}]}(tiger@durin)69> Pid ! {self(),hello}.(<0.126.0>) << {<0.116.0>,hello}{<0.116.0>,hello}(<0.126.0>) << timeout(<0.126.0>) <0.116.0> ! hello(<0.126.0>) exit normal(tiger@durin)70> flush().Shell got hellook(tiger@durin)71>
If you set the call trace flag, you also have to set a trace pattern for the functions you want to trace:
(tiger@durin)77> dbg:tracer().{ok,<0.142.0>}(tiger@durin)78> dbg:p(all,call).{ok,[{matched,tiger@durin,3}]}(tiger@durin)79> dbg:tp(dbg,get_tracer,0,[]).{ok,[{matched,tiger@durin,1}]}(tiger@durin)80> dbg:get_tracer().(<0.116.0>) call dbg:get_tracer(){ok,<0.143.0>}(tiger@durin)81> dbg:tp(dbg,get_tracer,0,[{'_',[],[{return_trace}]}]).
dbg
Ericsson AB. All Rights Reserved.: Runtime_Tools | 25
{ok,[{matched,tiger@durin,1},{saved,1}]}(tiger@durin)82> dbg:get_tracer().(<0.116.0>) call dbg:get_tracer()(<0.116.0>) returned from dbg:get_tracer/0 -> {ok,<0.143.0>}{ok,<0.143.0>}(tiger@durin)83>
Advanced topics - combining with seq_traceThe dbg module is primarily targeted towards tracing through the erlang:trace/3 function. It is sometimesdesired to trace messages in a more delicate way, which can be done with the help of the seq_trace module.
seq_trace implements sequential tracing (known in the AXE10 world, and sometimes called "forlopp tracing").dbg can interpret messages generated from seq_trace and the same tracer function for both types of tracing canbe used. The seq_trace messages can even be sent to a trace port for further analysis.
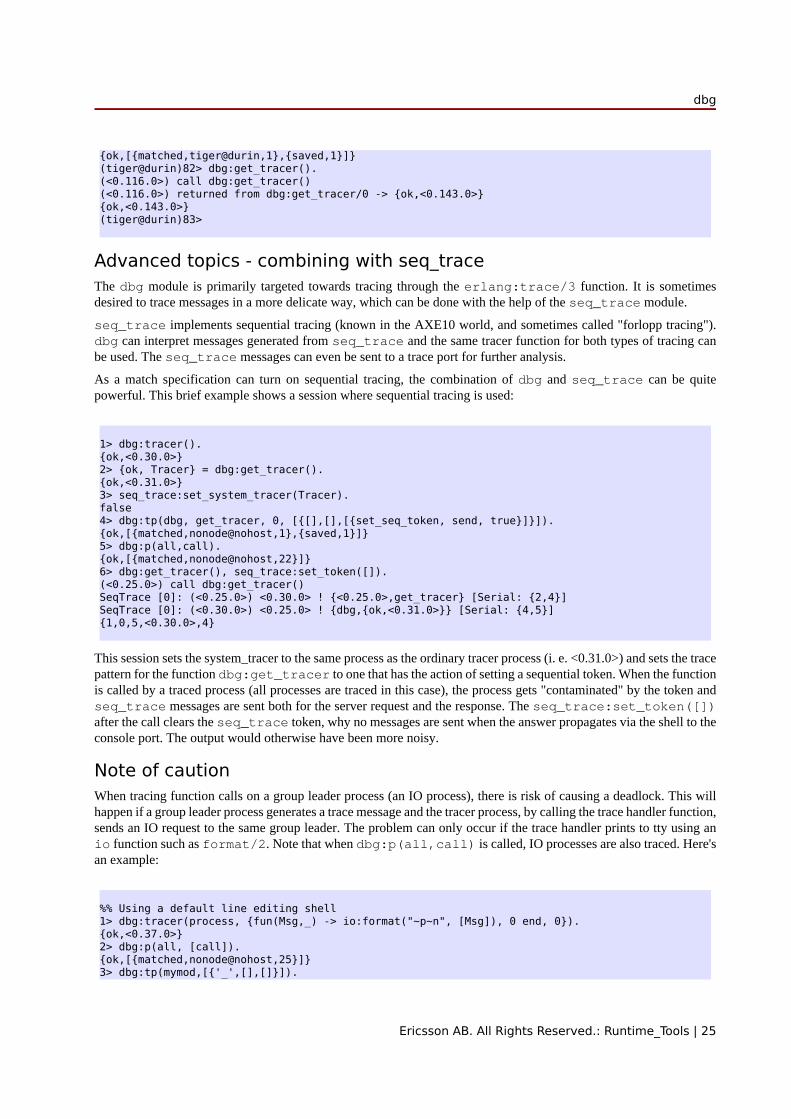
As a match specification can turn on sequential tracing, the combination of dbg and seq_trace can be quitepowerful. This brief example shows a session where sequential tracing is used:
1> dbg:tracer().{ok,<0.30.0>}2> {ok, Tracer} = dbg:get_tracer().{ok,<0.31.0>}3> seq_trace:set_system_tracer(Tracer).false4> dbg:tp(dbg, get_tracer, 0, [{[],[],[{set_seq_token, send, true}]}]).{ok,[{matched,nonode@nohost,1},{saved,1}]}5> dbg:p(all,call).{ok,[{matched,nonode@nohost,22}]}6> dbg:get_tracer(), seq_trace:set_token([]).(<0.25.0>) call dbg:get_tracer()SeqTrace [0]: (<0.25.0>) <0.30.0> ! {<0.25.0>,get_tracer} [Serial: {2,4}]SeqTrace [0]: (<0.30.0>) <0.25.0> ! {dbg,{ok,<0.31.0>}} [Serial: {4,5}]{1,0,5,<0.30.0>,4}
This session sets the system_tracer to the same process as the ordinary tracer process (i. e. <0.31.0>) and sets the tracepattern for the function dbg:get_tracer to one that has the action of setting a sequential token. When the functionis called by a traced process (all processes are traced in this case), the process gets "contaminated" by the token andseq_trace messages are sent both for the server request and the response. The seq_trace:set_token([])after the call clears the seq_trace token, why no messages are sent when the answer propagates via the shell to theconsole port. The output would otherwise have been more noisy.
Note of cautionWhen tracing function calls on a group leader process (an IO process), there is risk of causing a deadlock. This willhappen if a group leader process generates a trace message and the tracer process, by calling the trace handler function,sends an IO request to the same group leader. The problem can only occur if the trace handler prints to tty using anio function such as format/2. Note that when dbg:p(all,call) is called, IO processes are also traced. Here'san example:
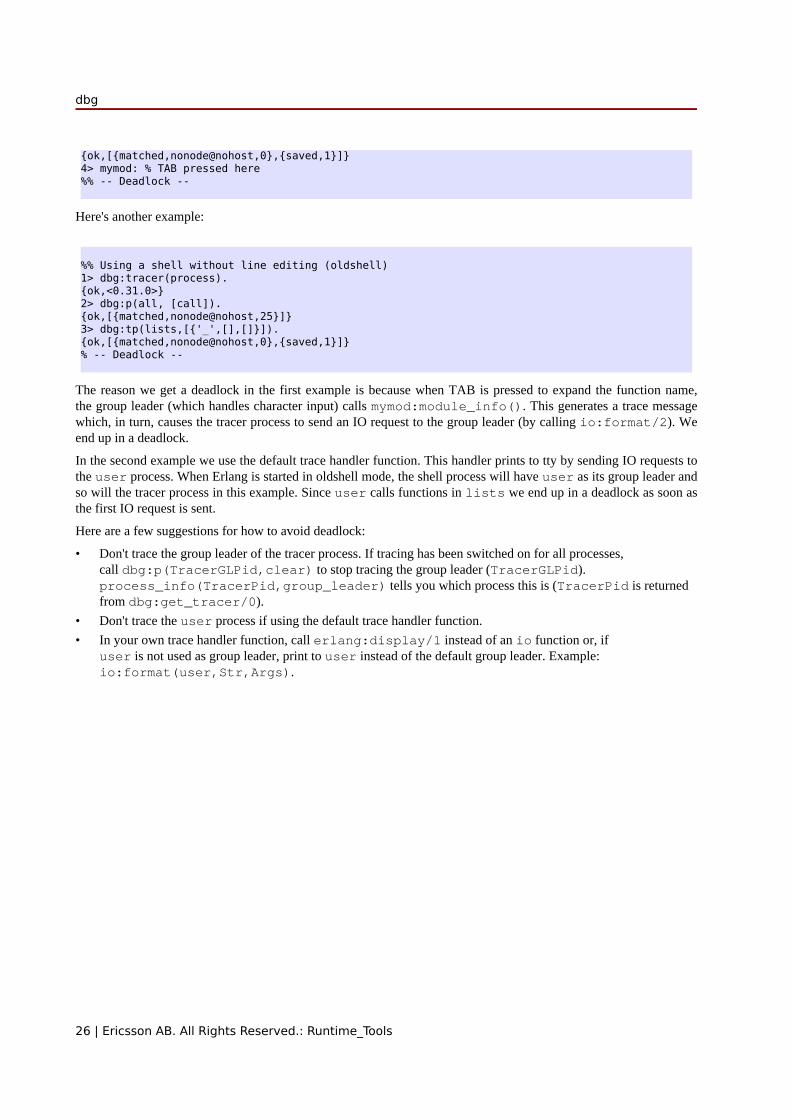
%% Using a default line editing shell1> dbg:tracer(process, {fun(Msg,_) -> io:format("~p~n", [Msg]), 0 end, 0}).{ok,<0.37.0>}2> dbg:p(all, [call]).{ok,[{matched,nonode@nohost,25}]}3> dbg:tp(mymod,[{'_',[],[]}]).
dbg
26 | Ericsson AB. All Rights Reserved.: Runtime_Tools
{ok,[{matched,nonode@nohost,0},{saved,1}]}4> mymod: % TAB pressed here%% -- Deadlock --
Here's another example:
%% Using a shell without line editing (oldshell)1> dbg:tracer(process).{ok,<0.31.0>}2> dbg:p(all, [call]).{ok,[{matched,nonode@nohost,25}]}3> dbg:tp(lists,[{'_',[],[]}]).{ok,[{matched,nonode@nohost,0},{saved,1}]}% -- Deadlock --
The reason we get a deadlock in the first example is because when TAB is pressed to expand the function name,the group leader (which handles character input) calls mymod:module_info(). This generates a trace messagewhich, in turn, causes the tracer process to send an IO request to the group leader (by calling io:format/2). Weend up in a deadlock.
In the second example we use the default trace handler function. This handler prints to tty by sending IO requests tothe user process. When Erlang is started in oldshell mode, the shell process will have user as its group leader andso will the tracer process in this example. Since user calls functions in lists we end up in a deadlock as soon asthe first IO request is sent.
Here are a few suggestions for how to avoid deadlock:
• Don't trace the group leader of the tracer process. If tracing has been switched on for all processes,call dbg:p(TracerGLPid,clear) to stop tracing the group leader (TracerGLPid).process_info(TracerPid,group_leader) tells you which process this is (TracerPid is returnedfrom dbg:get_tracer/0).
• Don't trace the user process if using the default trace handler function.
• In your own trace handler function, call erlang:display/1 instead of an io function or, ifuser is not used as group leader, print to user instead of the default group leader. Example:io:format(user,Str,Args).
dyntrace
Ericsson AB. All Rights Reserved.: Runtime_Tools | 27
dyntraceErlang module
This module implements interfaces to dynamic tracing, should such be compiled into the virtual machine. For astandard and/or commercial build, no dynamic tracing is available, in which case none of the functions in this moduleis usable or give any effect.
Should dynamic tracing be enabled in the current build, either by configuring with ./configure --with-dynamic-trace=dtrace or with ./configure --with-dynamic-trace=systemtap, the module canbe used for two things:
• Trigger the user-probe user_trace_i4s4 in the NIF library dyntrace.so by calling dyntrace:p/{1,2,3,4,5,6,7,8}.
• Set a user specified tag that will be present in the trace messages of both the efile_drv and the user-probementioned above.
Both building with dynamic trace probes and using them is experimental and unsupported by Erlang/OTP. It is includedas an option for the developer to trace and debug performance issues in their systems.
The original implementation is mostly done by Scott Lystiger Fritchie as an Open Source Contribution and it should beviewed as such even though the source for dynamic tracing as well as this module is included in the main distribution.However, the ability to use dynamic tracing of the virtual machine is a very valuable contribution which OTP hasevery intention to maintain as a tool for the developer.
How to write d programs or systemtap scripts can be learned from books and from a lot of pages on the Internet.This manual page does not include any documentation about using the dynamic trace tools of respective platform.The examples directory of the runtime_tools application however contains comprehensive examples of bothd and systemtap programs that will help you get started. Another source of information is the dtrace and systemtapchapters in the Runtime Tools Users' Guide.
Exports
available() -> boolean()This function uses the NIF library to determine if dynamic tracing is available. Usually calling erlang:system_info/1is a better indicator of the availability of dynamic tracing.
The function will throw an exception if the dyntrace NIF library could not be loaded by the on_load function ofthis module.
p() -> true | false | error | badargCalling this function will trigger the "user" trace probe user_trace_i4s4 in the dyntrace NIF module, sending a tracemessage only containing the user tag and zeroes/empty strings in all other fields.
p(integer() | string()) -> true | false | error | badargCalling this function will trigger the "user" trace probe user_trace_i4s4 in the dyntrace NIF module, sending a tracemessage containing the user tag and the integer or string parameter in the first integer/string field.
dyntrace
28 | Ericsson AB. All Rights Reserved.: Runtime_Tools
p(integer() | string(), integer() | string()) -> true | false | error |badargCalling this function will trigger the "user" trace probe user_trace_i4s4 in the dyntrace NIF module, sending atrace message containing the user tag and the integer() or string() parameters as the first fields of respective type.integer() parameters should be put before any string() parameters. I.e. p(1,"Hello") is ok, as is p(1,1) andp("Hello","Again"), but not p("Hello",1).
p(integer() | string(), integer() | string(), integer() | string()) -> true |false | error | badargCalling this function will trigger the "user" trace probe user_trace_i4s4 in the dyntrace NIF module, sending a tracemessage containing the user tag and the integer() or string() parameters as the first fields of respective type. integer()parameters should be put before any string() parameters, as in p/2.
p(integer() | string(), integer() | string(), integer() | string(), integer()| string()) -> true | false | error | badargCalling this function will trigger the "user" trace probe user_trace_i4s4 in the dyntrace NIF module, sending a tracemessage containing the user tag and the integer() or string() parameters as the first fields of respective type. integer()parameters should be put before any string() parameters, as in p/2.
p(integer(), integer() | string(), integer() | string(), integer() |string(), string()) -> true | false | error | badargCalling this function will trigger the "user" trace probe user_trace_i4s4 in the dyntrace NIF module, sending a tracemessage containing the user tag and the integer() or string() parameters as the first fields of respective type. integer()parameters should be put before any string() parameters, as in p/2.
There can be no more than four parameters of any type (integer() or string()), so the first parameter has to be aninteger() and the last a string().
p(integer(), integer(), integer() | string(), integer() | string(), string(),string()) -> true | false | error | badargCalling this function will trigger the "user" trace probe user_trace_i4s4 in the dyntrace NIF module, sending a tracemessage containing the user tag and the integer() or string() parameters as the first fields of respective type. integer()parameters should be put before any string() parameters, as in p/2.
There can be no more than four parameters of any type (integer() or string()), so the first two parameters has to beinteger()'s and the last two string()'s.
p(integer(), integer(), integer(), integer() | string(), string(), string(),string()) -> true | false | error | badargCalling this function will trigger the "user" trace probe user_trace_i4s4 in the dyntrace NIF module, sending a tracemessage containing the user tag and the integer() or string() parameters as the first fields of respective type. integer()parameters should be put before any string() parameters, as in p/2.
There can be no more than four parameters of any type (integer() or string()), so the first three parameters has to beinteger()'s and the last three string()'s.
dyntrace
Ericsson AB. All Rights Reserved.: Runtime_Tools | 29
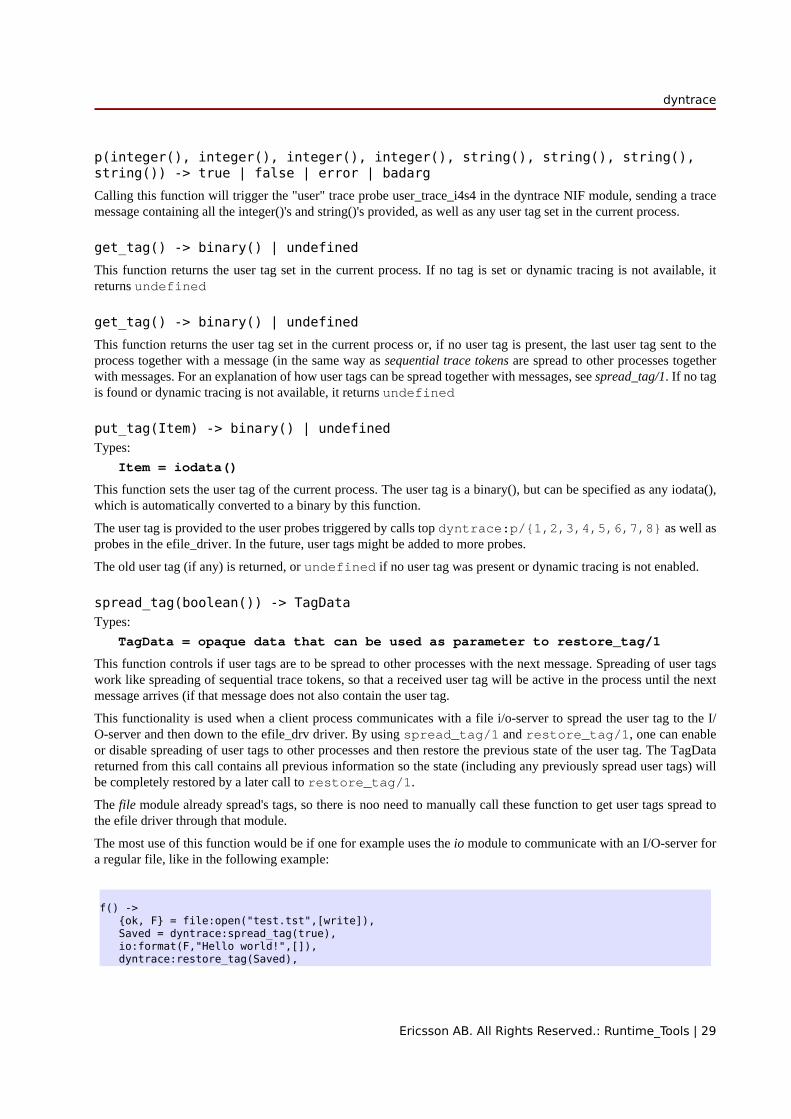
p(integer(), integer(), integer(), integer(), string(), string(), string(),string()) -> true | false | error | badargCalling this function will trigger the "user" trace probe user_trace_i4s4 in the dyntrace NIF module, sending a tracemessage containing all the integer()'s and string()'s provided, as well as any user tag set in the current process.
get_tag() -> binary() | undefinedThis function returns the user tag set in the current process. If no tag is set or dynamic tracing is not available, itreturns undefined
get_tag() -> binary() | undefinedThis function returns the user tag set in the current process or, if no user tag is present, the last user tag sent to theprocess together with a message (in the same way as sequential trace tokens are spread to other processes togetherwith messages. For an explanation of how user tags can be spread together with messages, see spread_tag/1. If no tagis found or dynamic tracing is not available, it returns undefined
put_tag(Item) -> binary() | undefinedTypes:
Item = iodata()
This function sets the user tag of the current process. The user tag is a binary(), but can be specified as any iodata(),which is automatically converted to a binary by this function.
The user tag is provided to the user probes triggered by calls top dyntrace:p/{1,2,3,4,5,6,7,8} as well asprobes in the efile_driver. In the future, user tags might be added to more probes.
The old user tag (if any) is returned, or undefined if no user tag was present or dynamic tracing is not enabled.
spread_tag(boolean()) -> TagDataTypes:
TagData = opaque data that can be used as parameter to restore_tag/1
This function controls if user tags are to be spread to other processes with the next message. Spreading of user tagswork like spreading of sequential trace tokens, so that a received user tag will be active in the process until the nextmessage arrives (if that message does not also contain the user tag.
This functionality is used when a client process communicates with a file i/o-server to spread the user tag to the I/O-server and then down to the efile_drv driver. By using spread_tag/1 and restore_tag/1, one can enableor disable spreading of user tags to other processes and then restore the previous state of the user tag. The TagDatareturned from this call contains all previous information so the state (including any previously spread user tags) willbe completely restored by a later call to restore_tag/1.
The file module already spread's tags, so there is noo need to manually call these function to get user tags spread tothe efile driver through that module.
The most use of this function would be if one for example uses the io module to communicate with an I/O-server fora regular file, like in the following example:
f() -> {ok, F} = file:open("test.tst",[write]), Saved = dyntrace:spread_tag(true), io:format(F,"Hello world!",[]), dyntrace:restore_tag(Saved),
dyntrace
30 | Ericsson AB. All Rights Reserved.: Runtime_Tools
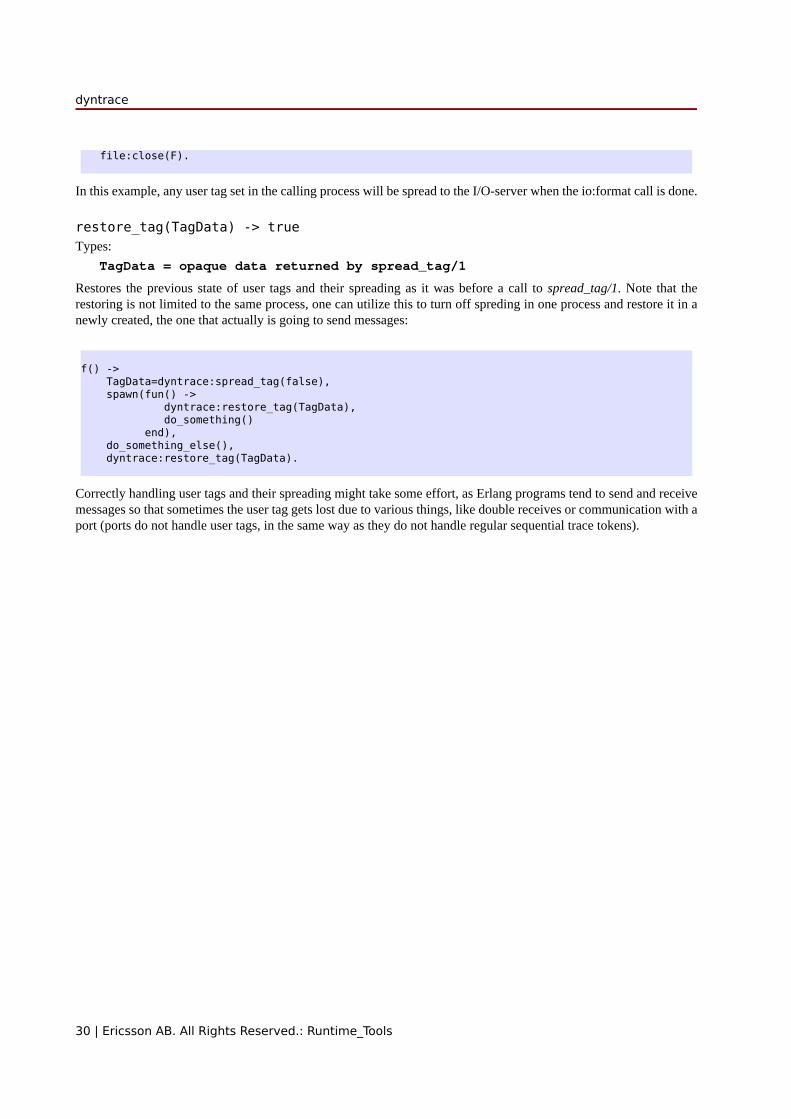
file:close(F).
In this example, any user tag set in the calling process will be spread to the I/O-server when the io:format call is done.
restore_tag(TagData) -> trueTypes:
TagData = opaque data returned by spread_tag/1
Restores the previous state of user tags and their spreading as it was before a call to spread_tag/1. Note that therestoring is not limited to the same process, one can utilize this to turn off spreding in one process and restore it in anewly created, the one that actually is going to send messages:
f() -> TagData=dyntrace:spread_tag(false), spawn(fun() -> dyntrace:restore_tag(TagData), do_something() end), do_something_else(), dyntrace:restore_tag(TagData).
Correctly handling user tags and their spreading might take some effort, as Erlang programs tend to send and receivemessages so that sometimes the user tag gets lost due to various things, like double receives or communication with aport (ports do not handle user tags, in the same way as they do not handle regular sequential trace tokens).
erts_alloc_config
Ericsson AB. All Rights Reserved.: Runtime_Tools | 31
erts_alloc_configErlang module
Note:erts_alloc_config is currently an experimental tool and might be subject to backward incompatiblechanges.
erts_alloc(3) is an Erlang Run-Time System internal memory allocator library. erts_alloc_config is intendedto be used to aid creation of an erts_alloc(3) configuration that is suitable for a limited number of runtime scenarios.The configuration that erts_alloc_config produce is intended as a suggestion, and may need to be adjustedmanually.
The configuration is created based on information about a number of runtime scenarios. It is obviously impossible toforesee every runtime scenario that can occur. The important scenarios are those that cause maximum or minimumload on specific memory allocators. Load in this context is total size of memory blocks allocated.
The current implementation of erts_alloc_config concentrate on configuration of multi-block carriers.Information gathered when a runtime scenario is saved is mainly current and maximum use of multi-block carriers. Ifa parameter that change the use of multi-block carriers is changed, a previously generated configuration is invalid anderts_alloc_config needs to be run again. It is mainly the single block carrier threshold that effects the use ofmulti-block carriers, but other single-block carrier parameters might as well. If another value of a single block carrierparameter than the default is desired, use the desired value when running erts_alloc_config.
A configuration is created in the following way:
• Pass the +Mea config command-line flag to the Erlang runtime system you are going to use for creation of theallocator configuration. It will disable features that prevent erts_alloc_config from doing its job. Note,you should not use this flag when using the created configuration. Also note that it is important that you use thesame amount of schedulers when creating the configuration as you are going the use on the system using theconfiguration.
• Run your applications with different scenarios (the more the better) and save information about each scenario bycalling save_scenario/0. It may be hard to know when the applications are at an (for erts_alloc_config)important runtime scenario. A good approach may therefore be to call save_scenario/0 repeatedly, e.g. once everytenth second. Note that it is important that your applications reach the runtime scenarios that are important forerts_alloc_config when you are saving scenarios; otherwise, the configuration may perform bad.
• When you have covered all scenarios, call make_config/1 in order to create a configuration. The configuration iswritten to a file that you have chosen. This configuration file can later be read by an Erlang runtime-system atstartup. Pass the command line argument -args_file FileName to the erl(1) command.
• The configuration produced by erts_alloc_config may need to be manually adjusted as already stated.Do not modify the file produced by erts_alloc_config; instead, put your modifications in another file andload this file after the file produced by erts_alloc_config. That is, put the -args_file FileName argumentthat reads your modification file later on the command-line than the -args_file FileName argument that readsthe configuration file produced by erts_alloc_config. If a memory allocation parameter appear multipletimes, the last version of will be used, i.e., you can override parameters in the configuration file produced byerts_alloc_config. Doing it this way simplifies things when you want to rerun erts_alloc_config.

erts_alloc_config
32 | Ericsson AB. All Rights Reserved.: Runtime_Tools
Note:The configuration created by erts_alloc_config may perform bad, ever horrible, for runtime scenariosthat are very different from the ones saved when creating the configuration. You are, therefore, advised torerun erts_alloc_config if the applications run when the configuration was made are changed, or ifthe load on the applications have changed since the configuration was made. You are also advised to rerunerts_alloc_config if the Erlang runtime system used is changed.
erts_alloc_config saves information about runtime scenarios and performs computations in a server that isautomatically started. The server register itself under the name '__erts_alloc_config__'.
Exports
save_scenario() -> ok | {error, Error}Types:
Error = term()
save_scenario/0 saves information about the current runtime scenario. This information will later be used whenmake_config/0, or make_config/1 is called.
The first time save_scenario/0 is called a server will be started. This server will save runtime scenarios. Allsaved scenarios can be removed by calling stop/0.
make_config() -> ok | {error, Error}Types:
Error = term()
This is the same as calling make_config(group_leader()).
make_config(FileNameOrIODev) -> ok | {error, Error}Types:
FileNameOrIODev = string() | io_device()
Error = term()
make_config/1 uses the information previously saved by save_scenario/0 in order to produce an erts_allocconfiguration. At least one scenario have had to be saved. All scenarios previously saved will be used when creatingthe configuration.
If FileNameOrIODev is a string(), make_config/1 will use FileNameOrIODev as a filename. A filenamed FileNameOrIODev is created and the configuration will be written to that file. If FileNameOrIODev isan io_device() (see the documentation of the module io), the configuration will be written to the io device.
stop() -> ok | {error, Error}Types:
Error = term()
Stops the server that saves runtime scenarios.
See Alsoerts_alloc(3), erl(1), io(3)
system_information
Ericsson AB. All Rights Reserved.: Runtime_Tools | 33
system_informationErlang module
Exports
sanity_check() -> ok | {failed, Failures}Types:
Application = atom()ApplicationVersion = string()MissingRuntimeDependencies = {missing_runtime_dependencies, ApplicationVersion, [ApplicationVersion]}InvalidApplicationVersion = {invalid_application_version, ApplicationVersion}InvalidAppFile = {invalid_app_file, Application}Failure = MissingRuntimeDependencies | InvalidApplicationVersion | InvalidAppFileFailures = [Failure]
Performs a sanity check on the system. If no issues were found, ok is returned. If issues were found, {failed,Failures} is returned. All failures found will be part of the Failures list. Currently defined Failure elementsin the Failures list:
InvalidAppFile
An application has an invalid .app file. The second element identifies the application which has the invalid.app file.
InvalidApplicationVersion
An application has an invalid application version. The second element identifies the application version that isinvalid.
MissingRuntimeDependencies
An application is missing runtime dependencies. The second element identifies the application (with version) thathas missing dependencies. The third element contains the missing dependencies.
Note that this check use application versions that are loaded, or will be loaded when used. You might haveapplication versions that satisfies all dependencies installed in the system, but if those are not loaded this checkwill fail. The system will of course also fail when used like this. This may happen when you have multiplebranched versions of the same application installed in the system, but you do not use a boot script identifing thecorrect application version.
Currently the sanity check is limited to verifying runtime dependencies found in the .app files of all applications.More checks will be introduced in the future. This implies that the return type will change in the future.

system_information
34 | Ericsson AB. All Rights Reserved.: Runtime_Tools
Note:An ok return value only means that sanity_check/0 did not find any issues, not that no issues exist.
to_file(FileName) -> ok | {error, Reason}Types:
FileName = file:name_all()Reason = file:posix() | badarg | terminated | system_limit
Writes miscellaneous system information to file. This information will typically be requested by the Erlang/OTP teamat Ericsson AB when reporting an issue.