Running Out of Time - Economic Roundtable Out of Time ... Peter Chavez Denisse de la Concha Peter...
160
Running Out of Time Voices of Parents Struggling to Move from Welfare to Work Summer 2002 Commissioned by the Los Angeles County Children’s Planning Council Foundation Daniel Flaming Patricia Kwon Patrick Burns Gerald Sumner Sampling Statistician Data Entry Manuel Hernandez Katrina Sampson Focus Group Recorders Shannon Barnes Yunah Chung Axel Montepeque Noah Bubman Esther Cittadino France Nguyen Peter Chavez Denisse de la Concha Peter Tran Margarita Casteneda Aurora Braun-Hassett Andrew Wainer ECONOMIC ROUNDTABLE A Nonprofit, Public Policy Research Organization 315 West Ninth Street, Suite 1209, Los Angeles, California 90015 www.economicrt.org
-
Upload
hoangduong -
Category
Documents
-
view
217 -
download
0
Transcript of Running Out of Time - Economic Roundtable Out of Time ... Peter Chavez Denisse de la Concha Peter...

Running Out of Time
Voices of Parents Struggling to Move from Welfare to Work
Summer 2002
Commissioned by the
Los Angeles County Children’s Planning Council Foundation
Daniel Flaming Patricia Kwon Patrick Burns
Gerald Sumner Sampling Statistician
Data Entry Manuel Hernandez
Katrina Sampson
Focus Group Recorders Shannon Barnes Yunah Chung Axel MontepequeNoah Bubman Esther Cittadino France NguyenPeter Chavez Denisse de la Concha Peter TranMargarita Casteneda Aurora Braun-Hassett Andrew Wainer
ECONOMIC ROUNDTABLE A Nonprofit, Public Policy Research Organization
315 West Ninth Street, Suite 1209, Los Angeles, California 90015 www.economicrt.org

This report has been prepared by the Economic Roundtable, which assumes all responsibility for its contents. Data, interpretations and conclusions contained in this report are not necessarily those of the Los Angeles County Children’s Planning Council or the volunteers
and organizations that conducted the family needs survey.
This report can be downloaded from the following web sites:
Los Angeles County Children’s Planning Council: www.childrensplanningcouncil.org
Economic Roundtable: www.economicrt.org

Acknowledgements We would like to thank the volunteers listed below who carried out the survey and led focus groups.
For those who are not listed, we apologize and thank you also.
Community Delegates
Bob Erlenbusch, Los Angeles Coalition to End Hunger and Homelessness Kate Meiss, Neighborhood Legal Services Yolanda Arias, Legal Aid Foundation
Nancy Au, Asian Pacific Policy and Planning Council Colleen Mooney, SPA 8 Convener
Cyd Spikes, South Bay Workforce Investment Board Margo Wainwright, SPA 6
Service Planning Area (SPA) Leads
Brenda Bouche, SPA 1 (Antelope Valley) Karen Durell, SPA 2 (San Fernando) Liza Hirsch Medina, SPA 3 (San Gabriel) Eric Rodriguez, SPA 3 (San Gabriel) Monica Houston, SPA 3 (San Gabriel) Matt Horton, SPA 4 (Metro)
Pamela Garcia, SPA 5 (West) Clotill Ray, SPA 5 (West)
Mikki Jenkins, SPA 6 (Central) Robert Argomaniz, SPA 7 (East)
Cynthia Robledo, SPA 7 (East) Elia Rocha, SPA 8 (South)
Survey and Focus Group Volunteers
Chioma Agbahiwe Julia Alexander Michelle Almanza Moses Almanza Lorrie Arbuckle Yolanda Arias Melva Atayde Graciela Avila Roseanna Barilla Shannon Barnes Rosana Barrillos Maria Bonilla Barbara Brightman Helene Brookins Saundra Bryant Tina Bugrin Noel Burcelis Carol Burke Maria Bustamante Lee Butterfield Erica Byrd Karen Carillo Rachel Chavez Esther Cittadino Lorna Coleman Tracy Colunga- Hollingsworth Rev. Kathy Cooper- Ledesma Mark Deese Denisse de la Concha Krista Donahey
Jay Duke Erica Hoffmeister Winder
Silvia Esqueda Veronica Federovsky
Diana Garcia Teresa Garza
Armando Gonzalez Vicki Grant
Amanda Hardy Regina Hardy Lesbia Henao Elena Herrera Corinne Hicks Matthew Hicks Suzanne Hock Sylvia Houston Monica Hurtdo
Michele Ike Zakiyah Islam Teresa Jacobo Yolanda James Jose Joaquin
Felicia Johnson Robert Jones
Shaunette Jordan Loaretta Keith
Jehuti Lakeshore Susan Lee
Vanessa Lee Tracy Levine
Ping Luh
Betty Lui Isabel Madrigal Leticia Martinez Mark Masaoka
Elizabeth Mendias John Minato
Mrs. Lillian Mobley Stephanie Montanez
Axel Montepeque Josie Montgomery
Lupe Navarro An Nguyen
William C. Nichols Sylvia Nichols
Elva Ortiz Cristina Pacheco Paulina Palamino
Marijka Pantus Susan Rabinovitz
Elisia Ramirez Aileen Ramis Jose Ramos
Rebecca Winder Bryan Reeves
Cary Robertson Cynthia Robledo Margie Robledo
Cindy Robles Rene Rothrock Ibrahim Salaam Elba Sanchez
Johanna Sanchez Maria Elena Sanchez
Lee Schmidt Judy See
Carol Shauger Deborah Shelton
Tanya Smith Carmen Solis
Adrianne Solis Cyd Spikes Cindy Tang Janee Tichy
Rev. Earl Thompson Isabell Trujillo
Fannie Upshaw Monica Varner Sonya Vasquez
Nicol Villalobos Pat Vining
Margo Wainwright Alesia Wesley
Jo Carol White Kitty White
Renee’ Williams Beverly Williams
Phyliss Willis Roxie Wilson
Stephanie Winlock John Wolfkill
Stephanie Yamada Kossal Yang
Children’s Planning Council Staff Support Cori Shepherd
Sponsors
Children’s Planning Council Foundation, Inc. Los Angeles County Department of Public Social Services, Long Term Family Self Sufficiency Plan


Table of Contents EXECUTIVE SUMMARY ................................................................................1 1 OVERVIEW...................................................................................................3 Introduction ..................................................................................................3 Methodology.................................................................................................4 Overview of Report.......................................................................................4 2 PROFILE OF SURVEY RESPONSES ...............................................................5 Overview ......................................................................................................5 Populations in Poverty, CalWORKs and the Survey.......................................7 3 BARRIERS TO GOOD JOBS........................................................................11 Overview ....................................................................................................11 Barriers to Employment ...............................................................................11 Effect of Respondent Characteristics on Barriers Reported ...........................13 Probability of Women Reporting Barriers to Employment............................15 Major Ethnic Groups ...................................................................................16 Small Linguistic and Ethnic Groups .............................................................18 4 PRIORITIES FOR ACHIEVING SELF-SUFFICIENCY .....................................21 Overview ....................................................................................................21 Priorities for Achieving Self-Sufficiency .......................................................21 Effect of Respondent Characteristics on Priorities Identified.........................23 Probability of Women Identifying Specific Priorities for Services.................25 Major Ethnic Groups ...................................................................................26 Small Linguistic and Ethnic Groups .............................................................27 Conclusion..................................................................................................28 5 EMPLOYMENT AND EDUCATION ............................................................29 Overview ....................................................................................................29 Strength of Labor Force Connections...........................................................29 Employment Outcomes...............................................................................30 Distribution by Duration of Employment Last Year
for those Who Worked Then ....................................................................36 Level of Education.......................................................................................38 6 SURVEY COMMENTS.................................................................................39 Overview ....................................................................................................39 Categories of Comments .............................................................................39 Specific Comments .....................................................................................39

7 FOCUS GROUP ISSUES .............................................................................47 Overview ....................................................................................................47 Findings About Key Priorities ......................................................................48 Need for Affordable Childcare ....................................................................49 Meeting Program Eligibility Requirements...................................................51 Need for Affordable Housing ......................................................................53 Program Staff Seen as Disrespectful .............................................................55 More Education and Training Programs to Obtain Better Jobs .....................56 Greater Awareness of Program Services ......................................................57 Other Concerns...........................................................................................57 Conclusion..................................................................................................58 8 FINDINGS ..................................................................................................59 Employment Rate ........................................................................................59 Level of Education and Employment Outcomes ..........................................59 Effect of CalWORKs on Education...............................................................60 Barriers and Priorities ..................................................................................60 Needs of Different Groups ..........................................................................60 APPENDICES ..............................................................................................61 Focus Group Appendix ...............................................................................63 Survey Methodology Appendix .................................................................111 Survey Locations Appendix .......................................................................123 Data Appendix ..........................................................................................127

List of Tables and Figures TABLES 1 Odds Ratio that Respondents will Report Specific Barriers to Employment ............ 13 2 Probability that Mothers with Various Characteristics will Report
Specific Barriers to Employment ........................................................................ 16 3 Barriers to Employment Identified by the Three Largest Ethnic Groups .................. 17 4 Number of Ethnic and Linguistic Minority Respondents to Survey......................... 18 5 Barriers to Employment Reported by Ethnic and Linguistic Minorities ................... 19 6 Odds Ratio that Respondents will Identify Specific Service Priorities ..................... 24 7 Probability that Mothers with Various Characteristics will Identify
Specific Service Priorities................................................................................... 25 8 Service Priorities Identified by the Three Largest Ethnic Groups ............................ 26 9 Service Priorities for Achieving Self-Sufficiency Identified by
Ethnic and Linguistic Minorities ......................................................................... 27 10 Geographic Distribution of Focus Groups ............................................................. 47 11 Key Priorities of Focus Groups .............................................................................. 48 APPENDIX TABLES A-1 Key Points by Focus Group................................................................................. 105 A-2 Family Needs Survey Sites .................................................................................. 123 A-3 Number of Survey Respondents by Subgroup ..................................................... 127 A-4 Number of Respondents Selecting Each Item ...................................................... 129 A-5 Percent of Respondents Selecting Each Item........................................................ 135 A-6 Confidence Limits for Barriers to Employment – Female Respondents ................. 141 A-7 Confidence Limits for Service Priorities - Female Respondents ........................... 143 A-8 Barriers and Priorities of Ethnic and Linguistic Minorities .................................... 145 A-9 Education and Employment Profile of Survey Respondents ................................. 147 A-10 Open-Ended Survey Comments .......................................................................... 149 A-11 Open-Ended Survey Comments Grouped by Major Categories............................ 151 FIGURES 1 Distribution of Poverty and CalWORKs Caseload by Ethnicity ................................ 5 2 Geography and Ethnicity of Survey Respondents Compared to
All CalWORKs Parents......................................................................................... 6 3 Family Profile of Survey Respondents and CalWORKs Parents ................................ 7 4 Barriers to Employment ........................................................................................ 12 5 Number of Services Identified as Priorities in Response to Question 1................... 21 6 Priorities for Achieving Self-Sufficiency................................................................. 22 7 Strength of Labor Force Connections .................................................................... 29 8 Current Employment Rate of Survey Respondents ................................................. 32 9 Employment Rate Last Year................................................................................... 33 10 Weeks Worked Last Year by Those Employed Then.............................................. 34 11 Distribution by Duration of Employment .............................................................. 36 12 Years of Education of Survey Respondents ............................................................ 37 13 All Survey Comments Groups by Major Category ................................................. 40 14 Most Frequent Specific Survey Comments ............................................................ 41


Executive Summary
WHAT WAS THE SCOPE OF THE SURVEY? • The family needs survey was conducted over a three-week period from April 25
through May 15, 2002, at 230 different events in 124 different locations throughout Los Angeles County.
• Nearly 60 percent of the surveys were completed in welfare offices, the rest in adult education classes and community agencies.
• The survey database contains information from 8,536 respondents. The survey was augmented by 22 focus groups.
WHO RESPONDED TO THE SURVEY? • Of the 8,536 survey responses, 50 percent were from current CalWORKs
recipients, 8 percent from past CalWORKs recipients, and 41 percent from non-recipients.
• Of the 4,346 surveys completed in welfare offices, 45 percent were from parents who were not receiving CalWORKs. Survey responses were drawn from the county’s overall poverty population as well as CalWORKs parents.
• Because of the very large sample of respondents the survey supports a reliable analysis of the needs and priorities of CalWORKs parents as well as other groups of working poor parents who are beneficiaries of other assistance programs such as Medi-Cal.
WHAT BARRIERS TO EMPLOYMENT WERE IDENTIFIED MOST FREQUENTLY? • The seven barriers to employment most frequently identified by CalWORKs
parents and the percent of parents identifying each barrier is as follows: o Lack of childcare during the day or the night – 44 percent o Limited education – 38 percent o Limited job experience – 37 percent o Lack of housing – 36 percent o Lack of transportation – 35 percent o Limited job skills – 33 percent o Limited English – 32 percent
• Only 9 percent of current CalWORKs parents reported that they had no problem getting a good paying job.
WHAT SERVICES DID RESPONDENTS SAY WERE MOST IMPORTANT FOR HELPING THEM BECOME SELF-SUFFICIENT? • The five services identified as important priorities by over half of all CalWORKs
(and other groups of) respondents and the percent of CalWORKs parents identifying each service priority are as follows:

2 Running Out of Time
o Creating good jobs – 70 percent o Childcare – 68 percent o Education – 65 percent o Health care – 58 percent o Information for finding good jobs – 57 percent
• These priorities correspond closely with the most frequently reported barriers to employment.
HOW MANY CALWORKS PARENTS HAD JOBS? • 26 percent of CalWORKs recipients were employed at the time of the survey. • 43 percent had worked during the previous year. • The average duration of employment during the past year among CalWORKS
parents who had jobs then was 30 weeks. • 12 percent of CalWORKs parents were currently employed and had worked 26
or more weeks in the past year. WAS THERE A RELATIONSHIP BETWEEN SURVEY RESPONDENTS’ LEVEL OF EDUCATION AND THEIR EMPLOYMENT OUTCOMES? • Respondents who worked last year had typically had more years of schooling
than those who were unemployed (average of 10.6 vs. 9.6 years). • Respondents who were employed at the time of the survey typically had more
years of schooling than those who were unemployed (average of 10.5 vs. 9.9 years).
• There was no difference between the levels of education of current and former CalWORKs recipients (both 9.8 years). Enrollment in CalWORKs does not appear to be associated with increases in parents’ level of education.
WHAT COMMENTS DID RESPONDENTS MAKE ABOUT THE WELFARE-TO-WORK PROGRAM? • 1,198 survey respondents provided written comments. The six largest categories
accounted for 69 percent of all comments. o Problems encountered in interacting with welfare staff (13 percent). o The need for education and training programs (13 percent). o Problems finding a job (12 percent). o Safety and security issues (12 percent). o Childcare needs (10 percent). o Housing needs (9 percent)
• Similar themes emerged from the focus group sessions.

Chapter 1
Overview
INTRODUCTION How do people change their lives? What kinds of help do working poor parents need to lift their families out of poverty? What obstacles do they face in trying to get a sustaining job? More than 8,500 people answered these questions through a survey undertaken to learn directly from working welfare parents and other poor families about the problems they face and the kinds of help they need to become self-sufficient. The prospect that Los Angeles County may face a $100 million shortfall in its welfare budget in the 2002-2003 fiscal year at the same time that federal regulations may require improved employment outcomes galvanized community and county agencies to undertake this survey. The survey was commissioned by the Los Angeles County Children’s Planning Council and carried out by a broad coalition of community organizations, following a request for this information by the Los Angeles County Board of Supervisors. Surveys were conducted over a three-week period from April 25 through May 15, 2002 at 230 different events in 124 different locations. Nearly 60 percent of the surveys were completed in welfare offices, the rest in adult education classes and community agencies. The survey questionnaire was designed to be self administered in public settings by adults with average and below-average levels of education (a copy is included in the Appendix). To be successful it was kept simple, clear, and short. It covered three broad areas:
1. Priorities for how the county should use welfare-to-work resources to help parents become self-sufficient.
2. Immediate barriers to employment. 3. Background information about respondents for identifying priorities and
needs of different groups, and assessing the survey’s representativeness.
The remarkable outpouring of effort by community organizations and volunteers in organizing and conducting this large-scale survey, the willingness of parents to complete the survey, and the county’s interest in learning the results all demonstrate a similar expectation. This expectation is that families can build better futures for their children and that those who are stakeholders in their success can learn from these families about how to more effectively help them move into sustaining jobs.

4 Running Out of Time
METHODOLOGY The survey was a one-page questionnaire developed together with the community organizations that helped carryout the survey. It went through 13 drafts and then was pilot tested with two groups of current and former CalWORKS parents, one of which was English-speaking and the other Cambodians who spoke Khmer. Results from both pilot tests were used in preparing the final questionnaire.
The survey was managed to ensure the integrity of information from respondents. Each of the county’s eight Service Planning Area Councils had a survey coordinator who worked with local agencies to conduct the survey. Questionnaires were produced separately for each survey event on different colors of paper, with the date and location of the event identified on the questionnaire. Completed questionnaires were returned to the Children’s Planning Council, which was the logistical center of the survey, stamped with a unique number, and transmitted to the Economic Roundtable for analysis. Staff at the Roundtable reviewed questionnaires to ensure that duplicate surveys from the same respondents were not entered into the database, and that only surveys from welfare or working-poor parents were included in the final data set of 8,536 responses.
Information from the survey was augmented by 22 focus groups with CalWORKs parents. These sessions provided in-depth, open-ended information that adds context and completeness to survey data. Focus group facilitators were given seven broad questions (listed in the Appendix) to investigate. Some of these questions touched upon sensitive topics and required sensitivity and empathy on the part of facilitators. A note taker produced a succinct summary of each session, including detailed examples from the statements of participants to illustrate significant issues. Summaries of all 22 sessions are included in the Appendix. Three training sessions were conducted for survey administrators, focus group facilitators, and focus group recorders. The sessions provided cross training in each of the three survey roles so that each person in the process could support the integrity and effectiveness of the overall effort. Training topics included the purpose, procedures and schedule for the survey; understanding and minimizing bias; and practice in survey implementation. OVERVIEW OF REPORT The following chapters profile survey respondents, report on obstacles to employment, service priorities and employment histories, and summarize focus group discussions. The Appendix provides detailed supporting information.

Chapter 2
Profile of Survey Responses OVERVIEW The survey was designed to reach welfare parents and learn about their needs and priorities. In this process it also obtained information from many working poor parents who do not receive cash grants from the county. In this chapter we provide an overview of the overlapping, but not identical, populations of families in poverty, families receiving CalWORKs (which provides cash grants to needy families with children), and families receiving other forms of public assistance. In many cases the immigration status of parents and their children prevents them from obtaining cash grants but allows them to seek health care or food assistance.
The social and economic reality of Los Angeles is that poor parents receive a variety of types of public assistance, and families receiving cash grants live, work, learn, and obtain services together with other working poor parents. The survey data enables us to break out the responses of CalWORKs parents, however responses from all groups of working poor parents are valuable because the county is the primary social safety net for many of these families. An example is the urgent health care services that many of these families receive at county hospitals and clinics.
Of the 8,536 survey responses, 50 percent were from current CalWORKs recipients, 8 percent from past CalWORKs recipients, and 41 percent from non-
Figure 1
Distribution of Los Angeles County Poverty Population and
CalWORKs Caseload by Ethnicity
0% 20% 40% 60% 80%
Latino
EuropeanAmerican
Asian Pacific
NativeAmerican
AfricanAmerican
Percent of Los Angeles County Totals
Poverty Population
CalWORKS Caseload

6 Running Out of Time
recipients. Similarly, of the 4,346 surveys completed in welfare offices, 45 percent were from parents who were not receiving CalWORKs.1
Post-survey
questionnaires distributed to clients at two Department of Public Social Services offices confirmed that everyone in those offices had come for aid-related reasons, but in many cases the reason had to do with Medi-Cal or Food Stamps rather than CalWORKs. Similarly, post-survey questionnaires distributed at two adult education classes that had participated in the survey showed that of those not receiving CalWORKs, 59 percent were receiving assistance from another county aid program, and an additional 19 percent were in the process of applying for aid.
1 The caseload report from Los Angeles County’s Department of Public Social Services for January 2000 shows that CalWORKs cases made up only 21 percent of its total caseload. The share of the caseload accounted for by other assistance programs was as follows: Medi-Cal 56 percent, In-home Support Services 13 percent, Food Stamps 5 percent, General Relief 5 percent, and CAPI 0.6 percent.
Figure 2Ethnicity and Primary Language of
Survey Respondents Compared to All CalWORKs Parents
0% 20% 40% 60% 80%
Other
Vietnamese
Spanish
Russian
Korean
English
Chineselanguages
Cambodian
Armenian
PRIMARYLANGUAGE
NativeAmerican/Other
EuropeanAmerican
Latino
African American
Asian/PacificIslander
ETHNICITY
Percent of Each Group's Population
Survey Respondents
All CalWORKs Parents

Profile of Survey Responses 7
POPULATIONS IN POVERTY, CALWORKS AND THE SURVEY The county’s CalWORKs caseload is compared to its poverty population in Figure 1 (this comparison includes both children and adults). Latinos make up about three-quarters of the county’s poverty population2 but only about half of its CalWORKs caseload. Many of these very poor Latino families that are not in CalWORKs receive Medi-Cal and utilize the same educational and social services as CalWORKs recipients. When we look at the comparison of survey respondents and CalWORKs parents in Figures 2 and 3 (which show only adults) we see that in some ways the survey sample resembles the county’s poverty population more closely than its CalWORKs caseload, particularly in representing Latino families.
2 This information about the county’s poverty population is from “United Way ZIP Code Data Book for Service Planning Areas, 1999.”
Figure 3
Family Profile of Survey Respondents Compared to All CalWORKs Parents
0% 20% 40% 60% 80% 100%
Employed
Unemployed
EMPLOYMENT
Single Parent
Two-Parent
FAMILY
Some College
High School
Some High School
No High School
EDUCATION
65+
45 -64
40-44
35-39
30-34
25-29
21-24
< 21
AGE
Male
Female
SEX
Percent of Each Group's Population
Survey Respondents
All CalWORKs Parents

8 Running Out of Time
CalWORKs families are a subset of the larger population of working poor families that responded to the survey. Most of these families have shared problems of precarious employment, economic vulnerability and varying forms of dependency on public assistance. Because survey respondents were drawn from the county’s overall poverty population the sample of respondents differs from the CalWORKs caseload in the following respects:
• More Latinos (57 percent in the survey, 48 percent in the caseload). • More Latinos whose primary language is Spanish (68 vs. 58 percent). • More two-parent families (37 vs. 22 percent) • Bi-modal educational distribution (comparatively more survey respondents
without high school education as well as more people with exposure to college, and fewer people with high school education than in the CalWORKs caseload). These attributes of the survey sample affect the aggregate survey responses,
however the survey data makes it possible to identify CalWORKs participants, and in presenting findings in the following chapters we distinguish between CalWORKs recipients and other respondents.
Overall, survey respondents are quite similar to the CalWORKs caseload in terms of gender, age distribution, and employment status, as can be seen in Figures 2 and 3. An initial concern in analyzing the data was that it might under-represent CalWORKs recipients who are characterized by a sense of defeat and futility, and who might be less likely to be found in schools and community agencies where many surveys were conducted. To assess the cohesiveness of the total sample of survey respondents as well as the half of all respondents who are CalWORKs recipients we used a core group of recipients as a standard for comparison.
Single mothers surveyed at Department of Public Social Services (DPSS) offices can be used as a standard for assessing the representativeness of the overall sample of survey respondents and as a point of departure for identifying distinctive needs and priorities of different subgroups because single mothers are the largest group of CalWORKs recipients, accounting for about four-fifths of the CalWORKs caseload. Furthermore, it is reasonable to assume that the single mothers surveyed at DPSS offices were not a self-selected population, but rather were there for regularly scheduled, required visits and represented a cross section of the overall caseload.
The pattern of needs and priorities identified by single mothers surveyed at DPSS offices is quite similar to our total group of 4,075 current CalWORKs recipients surveyed at all venues. This similarity can be seen in Table A-5 in the Data Appendix. The 3,329 respondents who were neither past nor current

Profile of Survey Responses 9
CalWORKs recipients also resonate the pattern of responses of the benchmark CalWORKs group, except in areas where limited English ability, lower levels of education, or the presence of two parents are relevant to responses.
It is possible that the completion of 12 percent of surveys at adult education classes for immigrants learning English as a second language might skew the sample toward working poor parents who are upwardly mobile. Alternatively, the completion of 30 percent of surveys at community based social service agencies might skew the sample toward parents with a disproportionately high incidence of problems. It is our assessment that with over half of the very large survey sample made up of CalWORKs recipients, the survey supports a reliable analysis of the needs and priorities of this population. Additionally the inclusion of a large number of low-income parents who do not receive cash grants makes it possible to extend this analysis to the larger population of working poor parents in the county. There is significant similarity in the most difficult problems and highest priorities for services reported by all groups of respondents. Should there prove to be any skew of the survey sample toward energized and hopeful working-poor persons, this is compatible with the need to understand the support systems needed by welfare parents who are striving to become self-sufficient.

10 Running Out of Time

Chapter 3
Barriers to Good Jobs OVERVIEW
The heart of the survey was two questions with lists of multiple-choice options that asked:
1. What are the most important things the County should do so that you can get a job that will support your family?
2. Please identify any problems you have right now that keep you from having a good paying job?
The multiple-choice options for the first question represented program
categories for 46 projects proposed under the county’s “Long-Term Family Self-Sufficiency Plan.” The options for the second question represented a spectrum of potential barriers to employment. In this chapter we present the responses to the second of these questions, reporting on barriers to employment. BARRIERS TO EMPLOYMENT We grouped survey respondents by those who were currently receiving CalWORKs, those who received CalWORKs in the past two years, and working poor parents who have not received CalWORKs. There were seven barriers to employment that were reported by over 30 percent of current CalWORKs recipients. These were also the barriers most frequently reported by other groups. Lack of childcare stands out in these responses as by far the most significant barrier to employment for CalWORKs recipients. The rank order in which CalWORKs recipients reported these seven most frequent barriers to employment is as follows:
1. Lack of childcare during the day or the night – 44 percent 2. Limited education – 38 percent 3. Limited job experience – 37 percent 4. Lack of housing – 36 percent 5. Lack of transportation – 35 percent 6. Limited job skills – 33 percent 7. Limited English – 32 percent
Only 9 percent of current CalWORKs recipients reported that they had no
problem getting a good paying job.

12 Running Out of Time
Figure 4
Barriers to Employment
0% 10% 20% 30% 40% 50%
Other
No problems
Family caretakingresponsibilities
Serious familydysfunctions
Health problems
Older children might getinto trouble
Inability to gain access toservices
Lack of proper clothing
Lack of information aboutservices
Lack of afterschool carefor children
Limited English
Limited job skills
Lack of transportation
Lack of housing
Limited job experience
Limited education
Lack of day or night carefor children
Percent of Each Group of Respondents that Identified Barrier
Current CalWORKsRecipients
Past CalWORKsRecipients
Other Working Poor

Barriers to Employment 13
The frequency with which all 15 potential barriers to employment listed in question 2 were reported, as well as the percent reporting “no problems” or commenting on other barriers, is shown in Figure 4.
EFFECT OF RESPONDENT CHARACTERISTICS ON BARRIERS REPORTED The odds that respondents with particular characteristics will report specific barriers to employment are shown in Table 1. For example, a female respondent is 1.49 times (i.e., 49 percent) more likely than a male to report that childcare is a
Table 1 Odds Ratio that Respondents will Report Specific Barriers to Employment
Values Greater Than 1.0 Signify Above-Average Odds, Less Than 1.0 Below-Average Odds All of the odds shown are significant at .95 level. Boldface indicates significance at .99 level.
Barriers to Employment
Respondent Characteristics N
o pr
oble
ms
Lim
ited
job
skill
s
Lim
ited
educ
atio
n
Lim
ited
Eng
lish
Lim
ited
job
expe
rienc
e
Lack
of c
hild
car
e
Lack
of a
fter s
choo
l car
e
Lack
of t
rans
porta
tion
Lack
of h
ousi
ng
Hea
lth p
robl
ems
Fam
ily c
are
taki
ng re
spon
sibi
litie
s
Fam
ily d
ysfu
nctio
ns
Old
er c
hild
ren
getti
ng in
to tr
oubl
e
Lack
of p
rope
r clo
thin
g
Lack
of i
nfor
mat
ion
abou
t ser
vice
s
Nee
d he
lp g
ettin
g se
rvic
es
CalWORKs recipient 1.23 1.25 1.45 Female 1.49 0.76
Another home language 2.00 0.76 Level of English fluency 1.26 1.26 0.18 0.81 0.88 0.81 0.82 0.80 0.73 1.24 0.84 0.80
Single parent 1.17 1.22 1.42 1.37 Labor force connection 1.38 0.85 0.88 0.86 0.85 0.92 0.82 Surveyed in community 1.57 1.60 1.46 1.41
Surveyed at school 1.40 1.60 Respondent <25 years 1.37 1.37 0.70 0.76 0.67
Respondent 35-44years 1.45 Respondent 45+ years 1.34 1.32 1.31 2.36 1.28 1.43 1.64
Have Child < 6 years 1.70 1.19 0.77 0.82 Have Child 6-11 years 0.68 1.16 1.31 1.66 1.33 1.16
Have Child 12-17 years 1.30 1.30 1.16 1.24 1.45 2.18 1.36 Have Child 18+ years 1.25 1.50
Some high school 1.28 1.19 0.80High school diploma 0.49 1.32 0.79
Some college 0.49 0.28 0.65 0.75African American 0.63 1.54 1.56 2.22 1.75 1.54 2.05 1.47 1.91 2.03
Latino 0.72 0.62 1.52 1.77 1.66 1.96 1.46 1.67 1.74

14 Running Out of Time
barrier to employment. Part of the explanation for this difference probably lies in the fact that male respondents were much more likely than females to be in two-parent families (67 vs. 32 percent among respondents). The odds ratio simply shows how much the likelihood of a respondent reporting a particular barrier to employment changes if just one characteristic of the respondent changes, for example if the respondent is a female instead of a male.3
All except two of the respondent characteristics shown in Table 1 are binary (e.g., the respondent either is or is not a female). The two exceptions are level of English fluency and labor force connection, both ordinal variables. In the case of English fluency, each respondent was classified as speaking (a) fluent English, (b) good English, (c) limited English, or (d) no English. The odds ratio measures the amount of change in odds as one moves from one level of fluency to the next level up. For example, referring to Table 1, the odds that good-English speakers will cite "No Problem" are 26 percent higher than those for limited English speakers.
Similarly, each respondent’s labor force connection was classified as (a) strong - currently employed and worked 26 or more weeks last year, (b) moderate - other currently employed persons, (c) tenuous - not currently employed but worked last year, or (d) non-worker – unemployed and did not work last year. The odds ratio measures the amount of change in odds as one moves from one level of labor force connection to the next level up.
Respondent attributes that have the strongest effects on the likelihood of a parent reporting a particular barrier to employment include:
• Parents speaking a language other than English at home were 100 percent
more likely to identify limited English as a barrier. • Parents with “fluent” English were 82 percent less likely than those with
“good” English to report that Limited English was a barrier. • Parents who were 45 years of age or older were 136 percent more likely
those 25 to 34 years of age to report that health problems were a barrier.
3 All of the odds shown in Table 1 are significant at .95 level. Boldface indicates significance at .99. These results are from logistic regressions on the full survey dataset, using the same set of independent variables (survey respondent characteristics) for each dependent variable (possible barriers to employment). Odds ratios below 1.0 are scaled differently than those above 1.0 because the maximum range is between 0.0 and 1.0. To compare the “strength” of a negative ratio (i.e., a value less than 1.0) to a positive ratio it is best to look at the reciprocal of the odds for the negative effect. In other words, an odds ratio of 0.5 represents a negative effect that is reciprocal to a positive ratio of 2.0. Each of the odds ratios uses a particular group within the ratio category as a point of reference for comparison in calculating the ratio. These comparison groups, which are also applicable to Table 6 in the next chapter, are as follows:
• For African Americans and Latinos, respondents identifying their race/ethnicity as “other.” • For age groups of respondents, respondents 25 to 34 years of age. • For the community and survey venue comparisons, respondents surveyed at welfare offices. • For age groups of children at home, households with no children at home. • For level of education, respondents with no high school.

Barriers to Employment 15
• Parents with any level of college education were 51 percent less likely than those with no high school to identify skill deficiencies and 72 percent less likely to identify limited education as barriers.
• African American parents were 122 percent more likely than parents of “other” ethnicity to identify lack of transportation, 105 percent more likely to identify the risk of older children getting into trouble, 91 percent more likely to identify lack of information about county services, and 103 percent more likely to identify difficulty getting connected to services as barriers.
• Latino parents were 96 percent more likely than parents of “other” ethnicity to identify the risk of older children getting into trouble as a barrier.
PROBABILITY OF WOMEN REPORTING BARRIERS TO EMPLOYMENT One of the most straightforward ways of using the survey data is to identify the probability that welfare and working poor parents with specific combinations of characteristics will have specific barriers to employment. In Table 2 we look at respondents who were mothers and identify the probability that they will be impacted by each barrier to employment based on all possible combinations of the following three key variables: whether or not they are a single parent, whether or not they have a strong labor force connection,4 and whether or not they have had any college education. The numbers in Table 2 can be read as percentages, for example, 14 percent of single mothers with a strong labor force connection who have some college education are likely to report that they have no problem getting a good paying job.5 Looking at this data we see that:
• Mothers with any college education were much less likely to report that lack of skills, education or job experience was a barrier to employment.
• Single mothers were more likely than mothers in two-parent families to report that childcare and after school care were employment barriers.
• Mothers with a strong labor force connection were less likely to report that lack of transportation or health problems were barriers to employment.
It bears repeating that for all mothers, regardless of whether they are in one-
or two-parent households, whether or not they have strong labor force connections, and whether or not they have any college education, lack of child care is by far the most frequent barrier to employment.
4 The variable for strength of labor force connection was described earlier. In this analysis respondents with strong and moderate labor force connections are compared to those with tenuous and nonexistent connections. 5 The confidence limits for these probabilities are shown in Table A-6 in the Data Appendix.

16 Running Out of Time
Table 2 Percent of Mothers with Various Characteristics Who Are
Likely to Report Specific Barriers to Employment
Respondent
Characteristics Barriers to Employment
Percent of Mothers in Each Group Likely to Identify Each Barrier to Employment
Sing
le P
aren
t
Stro
ng L
abor
For
ce C
onne
ctio
n
Som
e C
olle
ge E
duca
tion
No
prob
lem
s
Lim
ited
job
skill
s
Lim
ited
educ
atio
n
Lim
ited
Eng
lish
Lim
ited
job
expe
rienc
e
Lack
of c
hild
car
e
Lack
of a
fter s
choo
l car
e
Lack
of t
rans
porta
tion
Lack
of h
ousi
ng
Hea
lth p
robl
ems
Fam
ily c
are
taki
ng re
spon
sibi
litie
s
Fam
ily d
ysfu
nctio
ns
Old
er c
hild
ren
getti
ng in
to tr
oubl
e
Lack
of p
rope
r clo
thin
g
Lack
of i
nfor
mat
ion
abou
t ser
vice
s
Nee
d he
lp g
ettin
g se
rvic
es
Yes Yes Yes 14 16 18 21 23 54 31 26 33 12 13 14 16 16 23 15
Yes Yes No 13 28 43 22 32 47 28 29 35 14 15 17 18 19 26 19
Yes No Yes 07 21 19 20 28 54 32 35 36 16 14 16 18 23 25 18
Yes No No 06 36 45 21 38 48 29 39 39 18 16 19 20 28 29 23
No Yes Yes 16 14 16 20 25 49 24 21 32 11 14 12 16 14 21 15
No Yes No 15 25 40 21 34 43 22 23 34 13 16 15 18 17 24 19
No No Yes 08 19 17 19 30 49 25 28 35 14 15 14 17 21 24 17
No No No 07 33 42 20 41 43 23 31 37 17 17 17 19 25 27 22
MAJOR ETHNIC GROUPS It is important to look at underlying rather than superficial factors associated with barriers to employment. Toward this end it is informative to examine whether some of the most familiar categories for grouping families are effective in capturing a single unified message, or whether these groups contain significantly divergent voices. The underlying issue is that we sometimes find more diversity within groups than between groups. Membership in a group with significant internal diversity about the importance of particular barriers to employment or particular services is, therefore, a poor predictor of the barriers to employment facing a parent in that group or the services she needs most. This diversity within groups is the reason why many of the cells in Table 1 are empty – for every group there are some issues on which the group does not offer a clear enough message to establish a reliable connection between being in that group and responding to the issue in a consistent way. An important challenge in helping parents become self-sufficient is to understand which traits provide the most useful information about the barriers they face and the services they need.

Barriers to Employment 17
One common criterion for defining groups is ethnicity. In this section we look at the three ethnic groups with the largest number of respondents: African Americans (1,971), European Americans (665), and Latinos (4,659). In the next section we look at seven smaller linguistic and ethnic groups. One possibility that we want to introduce in this discussion is that ethnicity alone may tell us comparatively little about the barriers that keep a parent from finding a sustaining job. It may well be, for example, that in terms of the barriers to employment, immigrant Chinese and Latino parents have more in common with each other than with their ethnic counterparts who were born in the United States. Each of the three largest ethnic groups can be broken out into smaller groups
based on years of schooling and English fluency. In most instances respondents with fluent English were born in the U.S., whereas those with limited English were immigrants. In terms of these two criteria, the largest number of respondents had completed just 12 years of school (26 percent), and spoke fluent English (42 percent). Barriers to employment identified by the three major ethnic groups, as well the subgroups who spoke English fluently and had 12 years of schooling (761 African Americans, 174 European Americans, and 399 Latinos), and also 656 Latinos who
Table 3 Barriers to Employment Identified by the
Three Largest Ethnic Groups
Percent of Respondents in Group Identifying Barrier
BARRIERS TO EMPLOYMENT Responses to Question 2 A
fric
an A
mer
ican
Afr.
Am
., 12
Yr.
Sch
, Fln
t. E
ng.
Euro
pean
Am
eric
an
Eur
. Am
., 12
Yr.
Sch
, Fln
t Eng
.
Latin
o
Latin
o, 1
2 Y
r. S
ch, F
luen
t Eng
.
Latin
o, 0
-8 Y
r. S
ch, N
o E
nglis
h
No problems 14 14 9 12 8 15 6Limited education 31 22 29 25 40 27 40Limited English 7 0 20 0 45 0 66Limited job skills 39 36 30 35 24 33 19Limited job experience 39 36 30 24 33 29 29Day or night care for children 36 33 36 32 45 33 48After school care for children 29 26 20 14 24 16 23Lack of transportation 37 36 21 25 33 23 39Lack of housing 32 29 23 29 42 22 49Health problems 16 13 22 22 21 11 24Family care taking responsibilities 15 12 15 10 17 9 19Serious family dysfunctions 14 11 14 16 23 11 25Older children might get into trouble 17 11 12 10 26 7 31Lack of proper clothing 29 29 21 26 22 21 19Lack of information about services 27 24 16 18 30 18 32Inability to gain access to services 20 18 13 13 25 11 30Other 3 3 5 4 4 6 4

18 Running Out of Time
did not speak English at all and had eight or fewer years of school are shown in Table 3. Highlights of ethnic group responses include: • There was a great deal of similarity in the barriers to employment identified by
respondents in all three ethnic groups with fluent English and 12 years of school. • The barrier they identified most frequently was limited job skills. • Overall, African Americans most frequently identified limited job skills, limited
job experience, lack of transportation, and lack of childcare as barriers. • Overall, European Americans most frequently identified lack of childcare,
limited job skills, limited job experience, and limited education as barriers. • Overall, Latinos most frequently identified limited English, lack of childcare, lack
of housing, and limited education as barriers. • Latinos present two distinct voices that identify different needs – one of recent
immigrants and the other of U.S.-born parents. • Recent Latino immigrants with limited English ability and eight or fewer years of
formal education, most of whom do not receive CalWORKs but many of whom do receive Medi-Cal, make up a significant share of the county’s struggling parents. They identify a distinctive set of barriers: limited English (66 percent), lack of housing (49 percent), lack of childcare (48 percent), limited education (40 percent), and lack of transportation (39 percent).
This examination of barriers to employment identified by major ethnic
groups, and the variation within ethnic groups based on level of education and English fluency, underscores the importance of recognizing the underlying factors affecting employment. These factors include education, English ability, and job experience. SMALL LINGUISTIC AND ETHNIC GROUPS The survey was successful in obtaining a sufficient number of responses to support analysis of barriers identified by seven comparatively small ethnic and linguistic groups. These groups, shown in Table 4 along with the number of respondents in each group, are Armenians, Cambodians, Chinese, Koreans, Native Americans and Alaskan Natives, Russians, and Vietnamese.
Table 4
Number of Ethnic and Linguistic Minority Respondents to Survey
Ethnicity NumberArmenian 169Cambodian 94Chinese 141Korean 50Native American/Alaskan Native 57Russian 53Vietnamese 50

Barriers to Employment 19
The percent of respondents in each group identifying each issue as a barrier to their employment is shown in Table 5. For all groups except Native Americans, limited English is by far the most frequently reported barrier. This is followed by limited job skills, limited job experience, and limited education.
Roughly 30 percent of Native Americans identify each of the following five issues as barriers to employment: limited job experience, limited education, limited job skills, lack of after school care for children, and lack of transportation. Armenians are the only one of the seven groups that identified childcare as a significant barrier to employment (46 percent). In contrast, only 7 percent of Cambodians identified childcare as a barrier. Koreans identified lack of education as a barrier to employment less frequently than any other group (14 percent). In contrast, 55 percent of Cambodians and 46 percent of Vietnamese identified lack of education as a barrier. Russians identified limited job experience as a barrier more frequently than any of the other groups (47 percent). Armenians identified health problems (24
Table 5 Percent of Respondents Reporting Barriers to Employment by Ethnic and Linguistic Group
The two barriers reported most frequently by each group are in boldface
Percent of Respondents in Group
Identifying Barrier
BARRIERS TO EMPLOYMENT Responses to Question 2 Ar
men
ian
Cam
bodi
an
Chi
nese
Kor
ean
Nat
ive
Am
er./A
lsk.
Nat
.
Rus
sian
Viet
nam
ese
Limited English 62 74 66 52 14 64 60Limited job skills 31 57 31 24 30 34 54Limited job experience 38 35 28 28 32 47 42Limited education 29 55 30 14 32 34 46Day or night care for children 46 7 12 26 23 30 12Lack of information about services 11 2 25 26 19 11 24After school care for children 27 0 9 14 30 17 4Lack of housing 11 3 19 14 28 6 10Inability to gain access to services 17 1 18 10 14 8 20Health problems 24 5 15 10 14 8 12Family care taking responsibilities 18 2 13 16 16 6 14Older children might get into trouble 17 6 7 6 11 8 16Lack of proper clothing 16 2 6 6 26 8 4Lack of transportation 8 3 11 10 30 2 4Serious family dysfunctions 11 1 4 8 19 4 18No problems 11 2 4 12 12 9 10Other 1 0 1 0 4 6 0

20 Running Out of Time
percent) and concern that older children might get into trouble (17 percent) as barriers more frequently than any other group.
Vietnamese identifyied inability to access services as a barrier to employment (20 percent) most frequently, and were second to Armenians in their frequency of concern about older children getting into trouble (16 percent).
Table A-8 in the Data Appendix shows the number of respondents in each
group reporting these barriers to employment.

Chapter 4
Priorities for Achieving Self-Sufficiency OVERVIEW The first question on the survey asked respondents to identify “the most important things the county should do so that you can get a job that will support your family.” This question format kept the survey comparatively simple and easy to complete, and most respondents used their “voting power” selectively and identified a comparatively small number of services as priorities. However, 13 percent of respondents identified all 13 service options in question 1 as priorities. As a respondent who completed her questionnaire this way in the pilot test explained, “All of these services are important for somebody. We need all of the help we can get.” As we look at the results for question 1 we can eliminate the effect of these nondiscriminate responses by mentally adjusting the survey response rate for each item downward by 13 percent. The residual expression of need for each service will reflect the prioritized choices made by respondents. PRIORITIES FOR ACHIEVING SELF-SUFFICIENCY
There is a high level of consistency in the service priorities identified by current CalWORKs recipients, past recipients, and working poor parents who do not receive cash grants. The priorities identified by all three groups are shown in Figure 6. Five services were identified as important priorities by over half of all three groups of respondents. The rank order in which CalWORKs recipients identified these five most frequently prioritized services was as follows:
Figure 5Number of Services Identified as
Priorities in Responses to Question 1
0%
2%
4%
6%
8%
10%
12%
14%
0 1 2 3 4 5 6 7 8 9 10 11 12 13Number of Priorities Identified
Perc
ent o
f Res
pond
ents

22 Running Out of Time
Figure 6
Priorities for Achieving Self-Sufficiency
0% 10% 20% 30% 40% 50% 60% 70% 80%
Other
Research about familyneeds
Training for welfarestaff
Programs to keepfamilies together
Clear information aboutCalWORKs
Counseling for familyproblems
Programs for teenagers
Transportation
Help for families facingeviction
Information for findinggood jobs
Health care
Education
Childcare
Creating good jobs
Percent of Each Group of Respondents that Identified Priority
Current CalWORKsRecipientsPast CalWORKsRecipientsOther Working Poor

Priorities for Self-Sufficiency 23
1. Creating good jobs – 70 percent 2. Childcare – 68 percent 3. Education – 65 percent 4. Health care – 58 percent 5. Information for finding good jobs – 57 percent
Six more services were identified as priorities by over 40 percent of
CalWORKs respondents: helping families facing eviction (48 percent), transportation (48 percent), programs for teenagers (46 percent), counseling for family problems (43 percent), clear information about CalWORKs (42 percent), and programs to help keep families together (42 percent).
Roughly half of respondents who were not CalWORKs recipients as well as
half of respondents who were immigrants identified two of these services as priorities. These are programs for teenagers and counseling for family problems. The examples of family problems presented on the survey questionnaire were domestic violence, mental health and substance abuse. The fact that half of these families indicated a need for help with these problems and that they were anxious about what would happen to their teenage children if they left their homes to go to work reflects the severe stresses experienced by immigrant families. Training for welfare staff was identified as a priority by 39 percent and research on family needs by 34 percent of current CalWORKs recipients. EFFECT OF RESPONDENT CHARACTERISTICS ON PRIORITIES IDENTIFIED
The odds that respondents with particular characteristics will identify specific services as priorities for helping them achieve self-sufficiency are shown in Table 6. The odds ratios shown here embody the same principles as those presented in the last chapter. They show how much the presence of a particular attribute such as sex, age, family status, English fluency, or level of education changes the likelihood that a person will identify a specific type of service as important for becoming self-sufficient. Respondent attributes that have the strongest effects on the likelihood of a parent identifying a particular service as a priority for achieving self-sufficiency include:
• Women were 73 percent more likely than men to identify childcare as a priority.
• CalWORKs recipients were 53 percent more likely than non-recipients to identify job creation as a priority.

24 Running Out of Time
Table 6 Odds Ratio that Respondents will Identify Specific Service Priorities
Values Greater Than 1.0 Signify Above-Average Odds, Less Than 1.0 Below-Average Odds All of the odds shown are significant at .95 level. Boldface indicates significance at .99 level.
Service Priorities
Survey Group Chi
ldca
re
Tran
spor
tatio
n
Job
crea
tion
Edu
catio
n an
d jo
b sk
ills
train
ing
Hea
lth c
are
Cou
nsel
ing
for f
amily
pro
blem
s
Pro
gram
s fo
r tee
nage
rs
Kee
ping
fam
ilies
toge
ther
Info
rmat
ion
abou
t job
s
Hel
p fa
mili
es fa
cing
evi
ctio
n
Cle
ar in
form
atio
n on
Cal
WO
RK
s
Res
earc
h on
fam
ily n
eeds
Trai
n w
elfa
re s
taff
CalWORKs recipients 1.53 0.76 0.84 0.81
Female 1.73
Another home language 1.28
English fluency 1.21 0.88
Single parent 1.22 1.24 1.17 1.19 0.86 1.25
Labor force connection 1.09
Surveyed in community
Surveyed at school 0.70 0.67
Respondent <25 years 1.27
Respondent 35-44years 0.85
Respondent 45+ years 1.42 1.58 1.32 1.34 1.46 1.53 1.37
Child < 6 years 1.54 1.19
Child 6-11 years 1.17 0.79 0.88 0.84
Child 12-17 years 1.20 1.35 1.53 1.20 1.17
Child 18+ years 1.42 1.35 1.38 1.30 1.21
Some high school
High school diploma
Some college 0.75 0.77
African American 1.62 2.11 2.75 1.58 1.87 1.58 2.33 2.46 1.72 2.17 2.13 2.22 2.36
Latino 1.39 1.52 1.65 1.69 1.42 1.52 1.50 1.45 1.62
• Parents 45 years of age or older were 58 percent more likely than parents 25
to 34 years of age to identify health care as a priority. • African American parents showed a heightened concern about the need for
services, with odds ratios 111 percent higher for transportations services, 175 percent higher for job creation, 133 percent higher for teen programs, 146 percent higher for programs to keep families together, 117 percent higher for programs to help families facing eviction, 113 percent higher for providing

Priorities for Self-Sufficiency 25
clear information about CalWORKs, 122 percent higher for research on family needs, and 136 percent higher on staff training for welfare workers.
PROBABILITY OF WOMEN IDENTIFYING SPECIFIC PRIORITIES FOR SERVICES We return again to respondents who were mothers and identify the probability that they will identify a service as a priority for achieving self-sufficiency based on all possible combinations of the following three key variables: whether or not they are a single parent, whether or not they have a strong labor force connection, and whether or not they have had any college education. The numbers in Table 7 can be read as percentages, for example, 77 percent of single mothers with a strong labor force connection who have some college education are likely to identify childcare as an important service for helping them become self-sufficient.6
Table 7 Percent of Mothers with Various Characteristics Who Are Likely to
Identify Specific Service Priorities
Respondent Characteristics
Service Priorities Percent of Mothers in Each Group Likely to Identify Each Service as a Priority
Sing
le P
aren
t
Stro
ng L
abor
For
ce C
onne
ctio
n
Som
e C
olle
ge E
duca
tion
Chi
ldca
re
Tran
spor
tatio
n
Job
crea
tion
Edu
catio
n an
d jo
b sk
ills
train
ing
Hea
lth c
are
Cou
nsel
ing
for f
amily
pro
blem
s
Pro
gram
s fo
r tee
nage
rs
Kee
ping
fam
ilies
toge
ther
Info
rmat
ion
abou
t job
s
Hel
p fa
mili
es fa
cing
evi
ctio
n
Cle
ar in
form
atio
n on
Cal
WO
RK
s
Res
earc
h on
fam
ily n
eeds
Trai
n w
elfa
re s
taff
Yes Yes Yes 77 44 61 69 61 44 48 38 53 49 38 32 39
Yes Yes No 74 46 68 67 59 46 51 42 56 50 44 36 39
Yes No Yes 74 45 65 72 59 43 44 40 55 51 37 30 38
Yes No No 71 47 71 69 57 45 46 43 58 51 43 34 39
No Yes Yes 73 39 58 65 64 44 51 40 57 48 33 32 40
No Yes No 70 41 65 63 62 46 53 44 60 48 39 36 40
No No Yes 70 40 61 68 62 43 46 42 59 50 32 30 40
No No No 67 42 68 66 60 45 48 45 62 50 38 34 40
6 The confidence limits for service priority probabilities are shown in Table A-7 in the Data Appendix.

26 Running Out of Time
Two of the strongest effects that variations in these three respondent attributes have on the probability that a woman will identify a service as a priority for achieving self-sufficiency are:
• Mothers without any college education are more likely to identify job creation and clear information about CalWORKs as priorities.
• Mothers without strong labor force connections are more likely to identify job creation as a priority.
Overall, there is a high degree of consistency in service needs identified as
priorities by all groups of mothers. Childcare stands out as the highest priority need shown in Table 7 for all groups of mothers. Major Ethnic Groups Priorities for services identified by the three major ethnic groups, the subgroup within each ethnic group that spoke English fluently and had 12 years of schooling, and also a subgroup of Latinos who did not speak English at all and had eight or fewer years of school are shown in Table 8. Highlights of ethnic group responses include: • The three highest
priorities of fluent English speakers with 12 years of schooling in all three ethnic groups were: childcare, education, and creating good jobs.
Table 8 Priorities for Services Identified by the
Three Largest Ethnic Groups
Percent of Respondents
Identifying Service
PRIORITIES FOR SELF-SUFFICIENCY Responses to Question 1 A
fric
an A
mer
ican
A
fr. A
m.,
12 Y
r. S
ch.,
Flnt
. Eng
. Eu
rope
an A
mer
ican
E
ur. A
m.,
12 Y
r. S
ch.,
Flnt
. Eng
. La
tino
Latin
o, 1
2 Y
rs S
ch.,
Flue
nt E
ng.
Latin
o, 0
-8 Y
rs S
ch.,
No
Eng
lish
Childcare 73 72 64 64 65 73 55Transportation 56 56 38 43 40 38 40Creating good jobs 73 74 57 55 64 58 71Education 66 63 58 63 69 69 70Health care 62 60 57 54 61 53 62Counseling for family problems 45 40 38 41 49 38 48Programs for teenagers 52 48 36 35 50 40 49Programs to keep families together 47 44 33 36 44 33 46Information for finding good jobs 60 60 54 49 58 54 55Help for families facing eviction 54 51 42 46 50 42 50Clear information about CalWORKs 46 43 31 33 41 34 40Research about family needs 37 34 29 28 35 27 37Training for welfare staff 44 40 27 26 38 33 36Other 5 4 6 5 4 5 2

Priorities for Self-Sufficiency 27
• These were also the three highest priorities for all respondents in all three ethnic groups (with an additional priority, health care, tying for third place among European Americans).
• Recent Latino immigrants with limited English ability and eight or fewer years of formal education identified a different set of priorities: creating good jobs (71 percent), education (70 percent), health care (62 percent), information for finding good jobs (55 percent), and childcare (55 percent).
SMALL LINGUISTIC AND ETHNIC GROUPS The most frequently identified service priorities of all 7 groups of ethnic and linguistic minorities fell within 5 types of services. In rank order they were: education, job creation, health care, childcare, and information for finding jobs (see Table 9). A much higher percent of Armenians identified job creation (72 percent), teen programs (48 percent), and research about family needs (41 percent) as priorities than any other group. The widely felt service priorities of Cambodians were captured by two types of programs – job creation (60 percent) and education (55 percent). Cambodians were unique in the scarcity of interest in services directed toward family needs, with only single-digit percents of respondents identifying health
Table 9 Percent of Respondents Identifying Service Priorities for
Achieving Self-Sufficiency by Ethnic and Linguistic GroupThe two barriers reported most frequently by each group are in boldface
Percent of Respondents in Group
Identifying Priority
PRIORITIES FOR SELF-SUFFICIENCY
Responses to Question 1 Arm
enia
n
Cam
bodi
an
Chi
nese
Kor
ean
Nat
ive
Am
er./A
lsk.
Nat
.
Rus
sian
Viet
nam
ese
Education 52 55 48 58 58 57 44Creating good jobs 72 60 33 26 63 64 48Health care 65 7 40 60 42 60 56Childcare 64 6 35 52 63 68 36Information for finding good jobs 54 36 43 34 44 72 42Transportation 39 10 28 30 56 26 30Programs for teenagers 48 9 31 50 40 21 20Help for families facing eviction 40 10 22 38 54 21 18Programs to keep families together 37 7 26 30 46 21 22Counseling for family problems 34 5 26 46 49 15 12Clear information about CalWORKs 35 4 21 16 42 21 10Research about family needs 41 12 16 16 21 25 18Training for welfare staff 28 3 23 16 35 13 26Other 2 2 4 2 7 0 0

28 Running Out of Time
care, childcare, teen programs, family programs, or counseling as priorities. The service priorities identified by Chinese respondents largely corresponded with the aggregated priorities of all seven linguistic and ethnic minority groups. The highest priority was education (48 percent) followed by information for finding good jobs (43 percent). The service priority identified most frequently by Korean respondents was health care (60 percent) followed by education (58 percent). This priority placed on education is interesting in light of the already high level of educational attainment for this group that is shown in the next chapter. This may reflect an interest in English as a second language classes. The highest priorities of Native Americans were job creation (63 percent), childcare (63 percent), education (58 percent), transportation (56 percent), and help for families facing eviction (54 percent). Russians had the highest interest of any group in getting information about obtaining good jobs (72 percent) and childcare (68 percent). The highest priorities of Vietnamese respondents were health care (56 percent) and creating good jobs (48 percent). CONCLUSION There is a strong correlation between the most significant barriers to employment reported in Chapter 3 and the highest priorities for services reported in this chapter. The three barriers to employment that were reported most frequently by CalWORKs recipients were:
1. Childcare 2. Limited education 3. Limited job experience
The three services that were identified most frequently as being important for
achieving self-sufficiency were:
1. Creating good jobs 2. Childcare 3. Education

Chapter 5
Employment and Education OVERVIEW Three of the questions asked on the survey provide a composite picture of survey respondents’ labor force connection. Another question provides information about level of education. One of the conclusions supported by this information is that higher levels of education are associated with higher levels of employment. The survey information allows us to explore this linkage by looking at both employment outcomes and levels of education for different groups of respondents. The question on the survey that provided information about level of education was: 9. How many years of schooling have you completed? ______ years The questions on the survey that provided information about strength of labor force connections were: 11. a. Are you currently employed? Yes No b. Did you work during any part of last year? Yes No
c. If yes, how many weeks did you work in the past year? ______ weeks STRENGTH OF LABOR FORCE CONNECTIONS We combined information about current employment status with responses about whether and how long individuals worked last year to classify respondents based on the strength of their labor force connections, as shown
Figure 7Strength of Labor Force Connections
0%
10%
20%
30%
40%
50%
60%
Strong Moderate Tenuous Non Worker
Current CalWORKs Former CalWORKs Non-CalWORKs

30 Running Out of Time
in Figure 7. Fewer than one-in-five of the total sample of survey respondents had strong labor force connections, as measured by being currently employed and working 26 or more weeks last year. Current CalWORKs recipients were significantly under-represented in this category – only 12 percent had strong labor force connections. Current CalWORKs recipients were significantly over-represented among non-workers, that is people who were not currently employed and who did not work last year. Fifty-seven percent of CalWORKs recipients were in this category, compared to 41 percent of former recipients and 43 percent of respondents who were neither current nor former recipients. Even when compared to a population that is at the fringes of the labor market, current CalWORKs recipients appear disproportionately disconnected from work. EMPLOYMENT OUTCOMES By combining information about current employment status with other self-descriptive information from the survey we can produce detailed point-in-time employment rate information for many groups of CalWORKs participants and working poor parents in Los Angeles County. This information is shown in Figure 8. Using responses about whether individuals worked at all last year we can produce detailed annual employment rate information, as shown in Figure 9. And using responses about how many weeks people worked last year if they were employed we can produce detailed breakouts of the duration of employment for those workers who had jobs, as shown in Figure 10. Highlights of what we see looking at all three of these Figures showing employment outcomes (this information is also provided in numerical form in Table A-9 in the Data Appendix) include the following outcomes for survey respondents grouped by: Survey Venue
• The employment rates of individuals surveyed at welfare offices were only about half as high as those of respondents surveyed at schools and community agencies (22 percent vs. 38 to 45 percent).
• People surveyed at all three venues had similar employment rates last year – all groups were in the 50 percent range.
• Individuals surveyed at welfare offices who worked last year had shorter durations of employment last year than respondents from the other two survey venues (31 weeks vs. 34 and 37 weeks).

Employment and Education 31
• This information supports the conclusion that many individuals surveyed in welfare offices were experiencing financial emergencies that began in the previous year because their employment rate was similar to that of the other two groups last year but much lower this year.
CalWORKs Status
• Outcomes based on CalWORKs status mirrored outcomes of respondents
surveyed at welfare offices when compared to individuals responding at other survey venues.
• CalWORKs recipients had lower current employment rates than former recipients and non-recipients (26 vs. 29 and 34 percent).
• Both current and previous recipients had lower employment rates and fewer weeks of work last year than other working-poor parents (43 and 44 vs. 56 percent, 30 and 31 vs.35 weeks).
Current Employment Status
• Respondents who were currently employed were much more likely to have
worked last year than those currently unemployed (80 vs. 36 percent).
Employment Status Last Year
• Respondents who were employed last year were much more likely to be currently employed than those who did not work last year (48 vs. 12 percent).
Sex
• Women (who are largely single mothers) had lower employment rates than
men (who are largely in two-parent families) at the time of the survey as well as last year (27 and 46 vs. 43 and 66 percent).
Family Status
• Single parents had lower employment rates than respondents in two-parent
families, both at the time of the survey and last year (27 and 48 vs. 33 and 51 percent).

32 Running Out of Time
Figure 8
Current Employment Rate of Survey Respondents
0% 10% 20% 30% 40% 50% 60% 70% 80%
All Respondents
TOTAL
Other
European American
Pacific Islander
Native American/Alaskan Native
Latino
Asian
African American
ETHNICITY
Vietnamese
Spanish
Russian
Mandarin/Cantonese
Korean
English
Khmer (Cambodian)
Armenian
SURVEY LANGUAGE
Not At All
Not Good
Good
Very Good
ENGLISH FLUENCY
13+
12
9-11
0-8
YEARS OF SCHOOL
45-64
40-44
35-39
30-34
25-29
21-24
<21
AGE
Two-Parent Family
Single Parent
FAMILY STATUS
Male
Female
SEX
Did Not Work
Worked
WORK STATUS LAST YEAR
Not CalWORKs Recipient
Previous CalWORKs Recipient
CalWORKs Recipient
CALWORKS STATUS
Welfare Office
School
Community Agency
SURVEY VENUE
Percent Currently Employed

Employment and Education 33
Figure 9
Employment Rate Last Year
0% 10% 20% 30% 40% 50% 60% 70% 80% 90%
All Respondents
TOTAL
Other
European American
Pacific Islander
Native American/Alaskan Native
Latino
Asian
African American
ETHNICITY
Vietnamese
Spanish
Russian
Mandarin/Cantonese
Korean
English
Khmer (Cambodian)
Armenian
SURVEY LANGUAGE
Not At All
Not Good
Good
Very Good
ENGLISH FLUENCY
13+
12
9-11
0-8
YEARS OF SCHOOL
45-64
40-44
35-39
30-34
25-29
21-24
<21
AGE
Two-Parent Family
Single Parent
FAMILY STATUS
Male
Female
SEX
Unemployed
Employed
CURRENT EMPLOYMENT STATUS
Not CalWORKs Recipient
Previous CalWORKs Recipient
CalWORKs Recipient
CALWORKS STATUS
Welfare Office
School
Community Agency
SURVEY VENUE
Percent of Respondents Employed Last Year

34 Running Out of Time
Figure 10
Weeks Worked Last Year by Those Employed Then
0 5 10 15 20 25 30 35 40 45 50
All Respondents
TOTAL
Other
European American
Pacific Islander
Native American/Alaskan Native
Latino
Asian
African American
ETHNICITY
Vietnamese
Spanish
Russian
Mandarin/Cantonese
Korean
English
Khmer (Cambodian)
Armenian
SURVEY LANGUAGE
Not At All
Not Good
Good
Very Good
ENGLISH FLUENCY
13+
12
9-11
0-8
YEARS OF SCHOOL
45-64
40-44
35-39
30-34
25-29
21-24
<21
AGE
Two-Parent Family
Single Parent
FAMILY STATUS
Male
Female
SEX
Unemployed
Employed
CURRENT EMPLOYMENT STATUS
Not CalWORKs Recipient
Previous CalWORKs Recipient
CalWORKs Recipient
CALWORKS STATUS
Welfare Office
School
Community Agency
SURVEY VENUE
Average Weeks Worked by Those Employed Last Year

Employment and Education 35
Age
• Employment rates at the time of the survey tended to be higher for older respondents, increasing from 27 percent for respondents under 21 years of age to 33 percent for respondents 45 years of age or older.
• Employment rates last year were similar among all age groups, but older workers held jobs longer when they worked last year – average duration of employment increased from 26 weeks for respondents under 21 to 37 weeks for those 45 years of age or older.
Years of School
• Current employment rates increased from 26 percent for those with primary
school educations to 38 percent for those with any exposure to college. • The association of higher employment rates with higher levels of education is
even stronger looking at work histories for last year. Forty percent of respondents with primary school educations worked last year, compared to 64 percent of respondents who had been exposed to college.
• Average duration of employment for those working last year increased from 31 weeks for those with primary school educations to 36 weeks for those who had some college education.
English Fluency
• The classification scheme for English fluency tends to classify respondents
born in the United States as “very good” and immigrants as “good, not good, or not at all.” The highest current employment rate was found among respondents with “good” English fluency (38 percent), followed by “not good” (31 percent), followed by “very good” (28 percent), and followed last by “not at all” (23 percent). This suggests that immigrants with any ability to speak English obtain jobs more frequently than native-born residents experiencing financial emergencies, but that immigrants with no English ability are employed least frequently of any of these four fluency groups.
• When we look at employment rates for last year, respondents with “good” and “very good” English fluency had the highest employment rates (55 and 54 percent), and those who spoke English “not good” or “not at all” had the lowest employment rates (45 and 37 percent).
• All four English fluency groups had similar durations of employment last year; interestingly, those whose English was “not good” and who succeeded in finding jobs worked the longest (an average of 35 weeks).

36 Running Out of Time
Language
• There was wide variation in the employment rates of respondents from different language groups, ranging from Armenians (73 percent at the time of the survey and 78 percent last year) to Cambodians (8 percent at the time of the survey and 9 percent last year). For respondents in all language groups, level of education, English fluency, and work history were critical determinants of employment outcomes. These factors, rather than language identity, underlie the differing employment outcomes of language groups.
• There was greater similarity in the duration of employment last year for those who worked then. Korean job finders were employed the longest (an average of 46 weeks).
Ethnicity
• The highest and lowest current employment rates were found among two of
the smallest ethnic groups (Pacific Islanders – 47 percent, Native Americans and Alaskan Natives – 25 percent). The small samples for these groups make their employment rates less reliable than the rates for major ethnic groups: African Americans – 31 percent, Asians 31 percent, Latinos – 29 percent, European Americans – 27 percent.
• Among those in the four largest ethnic groups that found jobs last year, Asians had the longest duration of employment – an average of 35 weeks.
All Respondents
• 30 percent were
employed at the time of the survey.
• 49 percent worked during the past year.
• The average duration of employment last year for those who worked was 33 weeks.
Distribution by Duration of Employment Last Year for those Who Worked Then
• CalWORKs recipients who worked last year were over-concentrated in the
group that worked 12 or fewer weeks - 25 percent, as shown in Figure 11. • CalWORKs recipients who worked last year were also under-concentrated in
the group that worked 49 or more weeks - 29 percent, Figure 11.
Figure 11Distribution by Duration of Employment
0%
10%
20%
30%
40%
50%
0-12 13-24 25-36 37-48 49+Number of Weeks Worked Last Year
CalWORKs Former CalWORKs Non-CalWORKs

Employment and Education 37
Figure 12
Years of Education of Survey Respondents
0 2 4 6 8 10 12 14
All Respondents
TOTAL
Other
European American
Pacific Islander
Native American/Alaskan Native
Latino
Asian
African American
ETHNICITY
Vietnamese
Spanish
Russian
Mandarin/Cantonese
Korean
English
Khmer (Cambodian)
Armenian
SURVEY LANGUAGE
Not At All
Not Good
Good
Very Good
ENGLISH FLUENCY
45-64
40-44
35-39
30-34
25-29
21-24
<21
AGE
Two-Parent Family
Single Parent
FAMILY STATUS
Male
Female
SEX
Did Not Work
Worked
EMPLOYED LAST YEAR
Unemployed
Employed
EMPLOYMENT STATUS
Not CalWORKs Recipient
Previous CalWORKs Recipient
CalWORKs Recipient
CALWORKS STATUS
Welfare Office
School
Community Agency
SURVEY VENUE
Average Number of Years of Education

38 Running Out of Time
LEVEL OF EDUCATION Information about the level of education within different groups of welfare and working poor parents is useful because there is a strong association between higher levels of education and better employment outcomes, and also because survey respondents have indicated that education is one of their highest priorities. Highlights from the information shown in Figure 12 about level of education in survey groups include:
• Respondents surveyed at welfare offices had lower average levels of education than respondents surveyed at school and community sites (9.7 vs. 10.3 and 10.5 years).
• There is not a difference in the level of education of current and former CalWORKs recipients (both 9.8 years). Enrollment in CalWORKs does not appear to be associated with increases in parents’ level of education.
• Respondents who worked last year had higher levels of education than those who did not work (10.6 vs. 9.6 years).
• Respondents who were employed at the time of the survey had higher levels of education than those who were unemployed (10.5 vs. 9.9 years).
• Men had higher average levels of education than women (10.8 vs. 9.9 years). • Respondents from two-parent families had higher average levels of education
than single parents (10.3 vs. 9.9 years). • Younger respondents were better educated than older respondents (under 21
years 10.7 years, 45 or older 9.9 years). This may be a hopeful sign – it may indicate that newer entrants into welfare have a stronger foundation in basic skills.
• Higher levels of English fluency were associated with higher levels of education: very good English – 11.7 years, good English - 10.3 years, English not good – 8.6 years, no English at all – 7.1 years.
• The greatest variation in levels of education is found among linguistic minorities, ranging from Koreans with an average of 13.9 years to Cambodians with an average of 2.5 years. This suggests a need for individualized service strategies that are tailored to the varying needs of different immigrant groups.
• Among major ethnic groups African Americans had the highest average levels of education (11.8 years) followed by European Americans (11.5 years), Asians (9.9 years), and Latinos (9.1 Years).
• Among all respondents to the survey the average level of education was 10.0 years.

Chapter 6
Survey Comments OVERVIEW The final item on the survey questionnaire was an invitation to respondents to comment on anything else that they wanted to discuss. Fourteen percent of respondents (1,198 people) accepted this invitation and provided comments. Volunteers from the survey program developed an open ended coding guide (see Appendix) and assigned 1,892 coding designations to respondent’s comments. Only about one in seven respondents made comments, but the extra effort they made in responding to the survey and articulating their experiences gives added significance to what they had to say. CATEGORIES OF COMMENTS
Comments are summarized by the major categories that their subject matter fell into in Figure 13. The six largest categories accounted for 69 percent of all comments. In rank order, these categories contained comments about:
1. Problems encountered in interacting with welfare staff (13 percent). 2. The need for education and training programs (13 percent). 3. Problems finding a job (12 percent). 4. Safety, security and well-being issues (12 percent). 5. Childcare needs (10 percent). 6. Housing needs (9 percent).
Positive references to CalWORKs accounted for 1 percent of comments. SPECIFIC COMMENTS The twenty specific coding classifications with the largest number of comments accounted for 58 percent of total comments, and are shown in Figure 14.
1. The six specific issues receiving the most comments accounted for 28 percent of all comments from respondents. In rank order these six issues were:

40 Running Out of Time
Figure 13All Survey Comments Grouped by Major Category
Categories shown in chart encompass all 1,892 issues identified inwritten comments made by 1,198 respondents
0 50 100 150 200 250 300
Domestic violence
Positive comments aboutCalWORKs
Senior citizen anddisability issues
Single parents needs
Counseling and mentalhealth needs
Issues about monthlygrant
Getting personallyinvolved
Transportation needs
General need tostrengthen program
Healthcare needs
Problems accessinngCalWORKs programs
Housing needs
Childcare needs
Safety, security, and well-being issues
Problems finding a job
Education and job trainingneeds
Problems interacting withwelfare staff
Number of Open Ended Comments in Category

Survey Comments 41
Figure 14Most Frequent Specific Survey Comments
0 20 40 60 80 100 120
Need to have permanentjobs
Help job seekers findemployers
General problems related tofamily well-being
Experience being deniedassistance by staff
General lack of housing
Need higher paying jobs
Information on benefits forimmigrants
Program requirements needto be clearer
Need health insurancecoverage
Need after school care forchildren
Need free or affordablechildcare
Program compliance needsto be easier
Difficulty finding a Job
Education for people withlimited English
Legalization for immigrants
Encountering incompetentstaff
Need affordable housing
General need to strengthenprogram
Need more education andtraining programs
Discourteous or disrespectfulwelfare staff
Number of Open Ended Comments on Issue

42 Running Out of Time
1. Encountering discourteous or disrespectful staff 6 percent) 2. Need more education and training programs (5 percent) 3. General need to strengthen program (5 percent) 4. Need affordable housing (5 percent) 5. Encountering incompetent staff (4 percent) 6. Legalization for immigrants (3 percent)
A sampling of comments on these issues is provided below. Tables A-9 and
A-10 in the Data Appendix show the number of respondents making each type of comment.
WELFARE STAFF
A 40-year-old African American single mother of one with thirteen years of schooling who was a CalWORKs recipient and who was unemployed at the time of the survey but who worked last year said:
I have fallen on very hard times. It is very difficult to be at a point in my life where I have to ask for assistance. If my worker had been more attentive to my individual case I wouldn’t be running around like a chicken with its head cut off and being delayed for the services that are crucial to my family’s survival. There are signs all over that say what you offer and what you can help with. When you try to access those services all you get is obstacles and excuses. I hope that in the future people that work for the county and clients can find common ground and respect each other as individuals.
A 24-year-old single European American mother of two with sixteen years of
schooling who was a CalWORKs recipient and who was employed at the time of the survey as well as last year said:
The experience at this office, from the clients’ perspective, is completely unacceptable. Not only do the employees speak to, or other wise treat, the clients condescendingly, but the “procedures” that need to be followed are tight and allow no room for urgency. Something must be done to streamline this office (the program, or the department as a whole) [so that it becomes] a more effective, positive experience for both employees and clients.
A 25-year-old African American single mother of one with fourteen years of
schooling who was a CalWORKs recipient and who was unemployed at the time of the survey but who worked last year said:
I think that people would be more comfortable talking to workers about special needs if the workers were nicer. There are very few who like their

Survey Comments 43
jobs and treat people nice. The rest are very rude and they rush you, so you never have a chance to say anything.
A 26-year-old European American single mother of one with fourteen years
of schooling who was a CalWORKs recipient and who was unemployed at the time of the survey but who worked last year said:
I had a lot of problems with my caseworker. She was always rude and I had problems getting a straight answer from her. She would hang up on me and put her personal matters over mine. I don’t care for her medical reasons of why she couldn’t help. Me and my children needed help. She gave me the run around and made working with anyone very difficult. She’d rarely return phone calls. I know she didn’t help in the way I deserved and she shows no respect. She is the reason today that I am dis-enrolling. I cannot handle the stress she put me and my family through. She was no help!!
A 31-year-old European American mother of one with a twelfth grade
education who was interviewed at a DPSS office but not a CalWORKs recipient and who was unemployed at the time of the survey but who worked last year said:
So far I have found the assistance I have received to be very helpful.
EDUCATION AND TRAINING
A 19-year-old single African American mother of three with an eleventh grade education who was receiving CalWORKs and was unemployed at the time of the survey but worked last year said:
I am a young mother of 3 children under the age of 4. I go to school when I can and wish I could maintain a stable job at the same time. It would be the goal I’ve been trying to reach since the birth of my 3-year-old at age 17.
A 25-year-old single Latina mother of one with a twelfth grade education
who was not receiving CalWORKs and was unemployed at the time of the survey as well as last year said:
Help those who want to go to college so they can pursue a career that will benefit the entire family and community in the long run.
A 24-year-old single European American mother of two with fourteen years
of education who was receiving CalWORKs and was unemployed at the time of the survey as well as last year said:
I would like to be put in a job-training program that pays you. I’ve been trying to get into a program that does that. It would help out a lot.

44 Running Out of Time
A 32-year-old African American single mother of two with fourteen years of education who was receiving CalWORKs and was unemployed at the time of the survey but employed last year said:
There should be more on-the-job training programs – earn while you learn programs.
A 42-year-old single mother of two who described her ethnicity as “other”
and had sixteen years of education who was receiving CalWORKs and was employed at the time of the survey as well as last year said:
I want to go to school for nursing but I cannot afford the tuition.
A 23-year-old single Latina mother of five with a ninth grade education who was receiving CalWORKs and was unemployed at the time of the survey but worked last year said:
I want to go to college and become a teacher but with GAIN they want me to get a job first and go to school at the same time. I personally don’t agree with that because I could go to school full time and get [into a] work-study [program]. I think that would be more than enough with work, school and the kids.
HOUSING
A 51-year-old Latina mother of three, one of whom was disabled, with a ninth grade education who was a CalWORKs recipient and who was unemployed at the time of the survey but worked last year said:
I need more information or resources on finding and getting a house or apartment. I have bad credit, not too much money (none to move in since they require first and last month’s rent). Then there’s a limit to how many people can live in a house. Let’s say I can only afford a single or a 1-bedroom. They won’t accept me because there’s 1 or 2 persons only [allowed in] a single. [But] there’s 5 or 6 in our family.
A 35-year-old Latina mother of four with a twelfth grade education who was
not a CalWORKs recipient and who was unemployed at the time of the survey as well as last year said:
Section 8/HUD [housing units] are very hard programs for families to enter. [I’m] not able to get in touch with anyone. [For] a family such as mine with 6 people, it is very difficult to find affordable housing.

Survey Comments 45
A 37-year-old Latina mother of three with a twelfth grade education who was a CalWORKs recipient and who was employed at the time of the survey as well as last year said:
I applied for AFDC because I didn’t have enough money for rent on October 3rd. In the interim I was evicted and given a notice to leave because it took welfare until the end of October to finally give me cash aid. The landlord didn’t have any choice but to file a judgment against me. As a result I became homeless and for 2 months myself and my children went to different homes – my sister’s is the 5th place. My family has been through much turmoil.
CHILDCARE A 31-year-old African American single mother of one with a tenth grade
education who was receiving CalWORKs and was employed at the time of the survey but not last year said:
I have worked in the past and present. I need more education and now [go] to school at night and work in the day. I need help with nighttime childcare.
A 29-year-old African American single mother of two with an eleventh grade
education who was receiving CalWORKs and was employed at the time of the survey as well as last year said:
I need childcare for [my children] 14 and up. They are still children in need of an adult in the house because if something happens then Children’s Services will step in.
A 32-year-old Latino single mother of two with a twelfth grade education
who was receiving CalWORKs and was unemployed at the time of the survey but worked last year said:
Why is the cutoff point [for childcare] at thirteen, exactly when they get into trouble? The main problem is childcare. Why is it that someone on AFDC cannot get paid for childcare since that constitutes a job?
A 26-year-old single Latina mother of six with an eighth grade education who
was receiving CalWORKs and was unemployed at the time of the survey but worked last year said:
I think that there should be more services that provide childcare so that people could work and make a living, so we won’t have to be on welfare.

46 Running Out of Time
DIFFICULTY FINDING A JOB
A 26-year-old Latina mother of two with an eighth grade education who was not a CalWORKs recipient and who was unemployed at the time of the survey but worked last year said:
I am a person who has a felony conviction, who is not eligible for many benefits or CalWORKs for that matter. It is really hard to get on my feet. All they offer me is minimum help [even though] I have already been through 2½ years of rehab and counseling.
A 38-year-old African American mother of four with a ninth grade education who was a CalWORKs recipient and who was unemployed at the time of the survey and did not work last year said:
I really would like to work! But it’s hard when they see you have not always worked. One time I put in close to 20 applications, but got only two interviews, and they didn’t call back.

Chapter 7
Focus Group Issues OVERVIEW
Focus groups were conducted throughout Los Angeles County to create a more complete picture of the hopes, efforts, and difficulties of CalWORKs parents. This information validates and helps explain the key barriers and priorities identified by the much larger group of CalWORKs parents and other low-income individuals who completed survey questionnaires.
The venues for focus groups included hospitals, churches, rehabilitation centers, homeless shelters, schools, and family resource centers. The majority of groups were conducted in English (16), with five in Spanish and one in Khmer (Cambodian). Twenty-two focus groups were conducted between April 28 and May 15, 2002 in the Service Planning Areas (SPAs) shown in Table 10. Eight questions provided the framework for focus groups:
1. In your experience, what are the most important services that the county’s welfare-to-work program provides for you?
2. What services do you need that the welfare-to-work program does not provide for you?
3. What experiences have you had while accessing services from your welfare- to-work program?
4. How is your relationship with the welfare-to-work staff? 5. Is the welfare-to-work program difficult to understand, or difficult to comply
with? 6. In your experience and
the experience of others you know well, what kinds of problems do people face in getting a job that can support their family?
7. Are there things in your personal life that you feel get in the way of holding down a job?
Table 10
Geographical Distribution of Focus Groups
Service Planning Area
Number of Focus Groups
3: San Gabriel Valley 2 4: Metro 7 6: South 4 7: East 6 8: South Bay 3 TOTAL 22

48 Running Out of Time
8. Is there anything else you would like to say that we haven’t talked about yet?
At the conclusion of these sessions participants were asked to identify and
rank the most important five issues. These rankings are presented later in this chapter. Focus groups facilitators were enlisted from Service Planning Area Councils and community-based organizations and were familiar to participants. The focus group recorders, who observed and took notes for each group, were generally graduate students recruited from local universities. FINDINGS ABOUT KEY PRIORITIES
Access to affordable childcare was identified as a top priority by most focus groups. Other key priorities included the perceived lack of respect and helpfulness from program staff, the need for more education and job training programs both in general and to obtain better paying jobs, making it more feasible to comply with program requirements, the need for more affordable housing, and the need for clear information about CalWORKs and the services it can provide. The service priorities identified most frequently in focus groups are listed in Table 11.
These key priorities were expressed consistently by all three language groups and across all Service Planning Areas, and suggest a general commonality of concern among CalWORKs parents. In addition to the detailed review of focus
Table 11
Key Priorities of Focus Groups
Rank Key Priority 1st 2nd 3rd 4th 5th
Total Number of Groups Identifying
Issue Affordable childcare 6 5 3 2 1 17 Program staff disrespectful/unhelpful 1 3 1 3 3 11 More education/job training 3 2 2 2 1 10 Make program requirements more feasible 1 2 5 8 Affordable housing 2 3 1 1 7 Provide clear information about CalWORKs 2 1 2 1 1 7 Need transportation assistance 1 2 2 5 Need counseling/mental health programs 2 2 1 5 Assist ex-felons/addicts to find jobs 1 2 1 4 Extend Medi-Cal to entire family 1 1 1 1 4

Focus Group Issues 49
group priorities presented next, the Appendix contains a complete table of priorities identified by each focus group as well as summaries of each group’s discussion. NEED FOR AFFORDABLE CHILDCARE
Access to affordable childcare services was cited as the “number one necessity” provided by the CalWORKs program, a “vital service for getting on your feet.” Affordable childcare enabled participants to go to work, to school, or to search for work. Without it focus group participants said they thought it would be impossible for them to maintain steady employment. The fact that CalWORKs parents are required to work in order to remain eligible for benefits makes access to affordable childcare all the more critical: “Childcare is really important. I just had a newborn. Job training and
education are important, but childcare is essential once you go out into the job world.”
“When I got childcare, it made me more determined to get a job. Childcare was really important. It was the only service I received.”
Although many participants were aware that childcare services were
available through CalWORKs, several focus group participants said they wished that their caseworkers had informed them that such services were available. As most participants work and also have children, they expressed an eagerness to find out about any available resources to help them with their children. During the focus group discussion, one mother asked the facilitator “Where can I find out about vouchers for day care?”
Several Cambodian focus group participants said that they felt “tied up” or “impeded” in their ability to find work or to attend school, while also having to pay for childcare services. “How am I going to find a job when I have to drop off and pick up my three
children that each have a different schedule?” “You are supposed to go to school, but who is going to take care of the
children?”
Some participants found it easy to qualify for childcare, while others found it difficult to receive childcare services. One mother commented: “Childcare was really easy; it came right away.” However, participants who were not able obtain childcare services expressed frustration about the difficulty of attending school or going to work. Some participants who did not qualify for childcare services and could not afford them on their own ended up staying at home and not working.

50 Running Out of Time
Some mothers said they were afraid that their childcare might suddenly be discontinued and wondered how they would be able to manage. “What to do if they don’t give money for childcare?” “How to get childcare while working or going to school?” “Friends who are on welfare and do not work can’t provide childcare
because they would lose their welfare checks.”
A number of participants reported that their caseworkers had made unfulfilled promises about childcare, that their calls were not returned, and that they did not receive useful assistance when making inquiries for help. They “felt a sense of impotence, of not having a way out.” Single parents indicated that they were particularly sensitive to the need for affordable childcare as they are required to work almost as many hours per week as a two-parent household (32 hours vs. 35 hours for a two parent household) but often lack the support of another helping adult.
Having a reliable source of childcare services provided by CalWORKs helped ensure that participants were able to maintain steady employment. Having childcare also made participants more attractive to employers. “Some employers don’t hire you if you don’t have childcare,” remarked one participant.
Some participants mentioned that there are several childcare facilities in their
communities, which is especially convenient while they are attending job training activities. However, other participants said they did not have the financial means to afford childcare in close proximity to CalWORKs program sites. One mother said that she had to spend three hours on a bus each way to leave her children with a sitter and go to the GAIN office. Another participant with a minimum wage job said that most of her money was spent on childcare. She stated: “The programs should pay for childcare or provide it.” Other participants concurred with her saying: “Childcare is absolutely number one.” Another participant cautioned: “Not just any childcare. It has to be safe, decent. I wouldn’t leave my kids in just any of those places.”
Because many participants had to travel outside of their communities to drop
off their children for childcare and to go to work or school, they reported a need for daycare centers with expanded hours from 7:30 a.m. to 6 p.m. They also said they need more after school programs, tutoring, and summer programs that their children could attend to keep them safe and away from the streets. And participants reported that finding affordable childcare for children younger than 2 or in their teenage years was very difficult.

Focus Group Issues 51
In some of the participants’ communities, daycare centers charge as much as $300 per week for childcare, which is a prohibitive cost for participants. The ability to work or go to school or ESL classes often hinged on whether these places provided free childcare services. One mother said: “We need day care centers that are affordable so that we can work and not spend all of our earnings in paying for childcare.”
Because teenagers over 13 years of age are not eligible for CalWORKs
childcare support, some participants said they were afraid to work and leave their teenage children home alone for fear they would get into trouble. They said it was a mistake for the county to stop childcare services when their children became teenagers, and said that they needed to have more quality programs designed for teenagers. Stated one woman: “[Teenage] children keep us from holding a job; we have to quit because of complications caused by them.” Participants said that they were unable to involve their teenage children in activities that would “keep them off the streets,” stating that it was difficult for teenagers to obtain jobs. Although teen programs are available, many participants were unaware of them.
Many of the focus group participants faced significant obstacles in their
everyday lives that made working, going to school, or looking for a job more challenging, including limited English proficiency, homelessness, participation in substance abuse rehabilitation, or having prior criminal records. All of the participants commented that having childcare made it possible for them to work or prepare themselves to work. Having to pay for childcare out of their own pocket was extremely difficult for participants, and several wondered aloud whether or not it made sense to pay other people to watch their children if this left so little money for their other monthly expenses. MEETING PROGRAM ELIGIBILITY REQUIREMENTS
Many focus group participants said that the Department of Public Social Service programs are difficult to maneuver through because of the large amount of paperwork, rigid regulations, and lack of program flexibility. Participants expressed frustration about the level of bureaucracy in these programs and said there was not enough assistance available for filling out paperwork: “For the amount of money they give you, it’s not worth it.” “I have gone through the process, and I still cannot understand it. There are
too many forms, and sometimes no help to fill them out.” “They make you fill out hundreds of forms in English, and then they [the
workers] don’t listen to you when you have a question or a problem.”

52 Running Out of Time
Several Latino participants said that they were discriminated against because of their ethnicity and limited English proficiency. Stated one participant, “We Latinos suffer from discrimination from both Blacks and Whites. They apply for help and get it right away. We apply and if we demand too much, they put us in jail.” Another participant claimed that even if the caseworkers do speak Spanish they pretend that they don’t and insist upon conducting conversations in English.
Focus group participants frequently cited the lack of flexibility in the
CalWORKs program. Sometimes the GAIN offices are located far from where participants live and it is difficult for them to make it to the office by public transportation. Many participants said it was difficult for them to keep appointments at their GAIN offices on short notice or during the workweek. Some participants expressed frustration that the program required them to meet with their caseworkers during hours in which they were supposed to be engaged in work or work related activities. They said that the program needed to be more flexible in accommodating their working schedules. “My GAIN office was far from me. Because I didn’t have transportation, it
was hard for me to get there.” “The program is not easy to comply with. They assume you can be
somewhere at anytime they ask.” “The letters they send are too short notice. We need at least a week.” “They schedule our medical appointments when we are supposed to be in
class. There is no flexibility to reschedule.” “They don’t take our individual circumstances into account. Caseworkers
need to better understand our circumstances.”
Another frustration about program inflexibility that was voiced concerned difficulty in gaining initial access to services. Some participants reported that if procedures were not followed exactly or if paperwork was missing, their requests for program services were denied. Since many participants reported having difficultly understanding program procedures this led to many delays in receiving service, and raised the possibility of having services curtailed. “It can be difficult to access services. Nothing can be missing; they give you
no leeway.” “I was unemployed for two months and applied for services. They sent me a
lot of paperwork and it took me a while to complete it, but I sent it back. Then they made me go through too many appointments before I finally got some help. But by the time it arrived, I already got a job and they made me pay it all back. It wasn’t fair.”
“I told the [case] workers I was permanently disabled and I had a doctor’s note to prove it, and the next month I was cut off because I didn’t go to

Focus Group Issues 53
GAIN. My [case] worker didn’t understand English very well. I spoke to the Deputy Director to have the issue resolved.”
Participants who were in temporary housing spoke of feeling “completely
abandoned and neglected by the system” because of not receiving services from CalWORKs. They said that the program services available to others were not being made available to them and that caseworkers were not sensitive to their particular needs. Participants also said that case workers did not sufficiently consider the difficulties of working or engaging in work related activities while they were homeless. “Social workers have blinders on. They see only one more person who
wants to get on welfare, but they don’t really listen to you or understand your needs. They don’t look at me, who I am now. They look at my past.”
“They tell you about the programs but they do not implement them. They say they’ll provide childcare but I have to pay outrageous fees for it.”
“There are people that are abusing the system and have been on welfare forever, but we who are really in need get turned down.”
Many of the difficulties that participants identified in remaining in
compliance with the program stemmed from their relationships with their caseworkers. Some participants said they felt “intimidated” by their caseworkers but several also mentioned that they were “very happy” with their caseworkers. Participants conceded while there are some case workers that are “rude and always in a hurry,” there are also “some good workers who are very helpful.” NEED FOR AFFORDABLE HOUSING
The lack of affordable housing was a significant concern to many focus group participants. There was a general consensus that the rent for unsubsidized housing was too expensive and that there was a shortage of subsidized units available for rent. One participant stated that without Section 8 (subsidized housing), “my whole check was rent.” Another participant mentioned: “Family housing that is stable is important. Today’s cost of living is high. I can’t afford to even get into a studio apartment.”
A number of participants said that the application process for subsidized housing was complicated and lengthy, making affordable housing even more difficult to obtain. Participants said they were forced to wait for an indefinite period of time to see if they could obtain subsidized housing. Vacancies for subsidized apartments were rare. This was identified as a source of considerable frustration for participants:

54 Running Out of Time
“Housing is important to me because I paid $720 for the apartment … I started working in September in Hollywood as a hostess and get $9 an hour. I don’t work 40 hours, but only 26 or 27… I apply for housing but they [case workers] don’t tell you how long you have to wait, so you feel like you are flying in the air.”
“The waiting list for affordable housing is too long! You would actually have to wait 5 to 10 years.”
“When I call, I don’t get calls back, or they’re already rented.”
When applying for housing, some focus group participants reported that they were discriminated against because of a past criminal record or for being on welfare. “They don’t give me the apartment because my son is in jail.” “Once you are on welfare, it’s difficult to find an apartment. If they know
that you are on welfare, they won’t give you the apartment.”
Some participants who were able to obtain Section 8 housing said that the apartments were not well maintained and some said they were putting their safety at risk by living in neighborhoods where they were able to find Section 8 housing. “The apartments that take Section 8 are hellholes. Is it worth it not feeling
safe and risking my kids’ lives?” “The places I can afford are in nasty areas. I don’t want to raise my children
there.”
For participants who were in rehabilitation, homeless, or living in temporary housing, access to affordable housing was stated as their main priority. Several participants who were living in shelters told of difficult experiences in their efforts to obtain permanent, affordable housing. One woman who tried to move in with her daughter was told it was “unlawful” to do so. Another participant had paid a fee for an apartment referral and key through an agency, only to find that the apartment was already rented. Living in temporary housing presented other challenges because they had to leave the shelter at 5 a.m. with their children and their belongings, and found it difficult to look for work under such circumstances. The lack of a permanent address also made it difficult to enroll their children in school. Some mothers said they were afraid that the county might take their children away from them for living in a shelter.
A number of participants expressed despair at the prospect of never being
able to obtain affordable housing because of discrimination and the inability of the CalWORKs program to provide enough financial assistance for affordable housing.

Focus Group Issues 55
PROGRAM STAFF SEEN AS DISRESPECTFUL
Many participants expressed frustration about their relationships with their caseworkers. Participants said that CalWORKs staff needed to improve their “customer service” skills and be more sensitive to the situations of their clients. Many said that their caseworkers were rude or condescending to them or had no idea who they were. Said one participant: “Every time I called him [case worker], he had no idea who I was.” “…you have to deal with rude receptionists. Supervisors are rude as well.” “They’re not sensitive to a person’s needs. They act like the money is
coming from their own pockets.” “I have my family help me with my problems rather than go to the DPSS
office. I know women who are treated badly by their workers and come out crying.”
“They should provide training for the workers to learn how to work with people, especially cross-culturally. Many of them treat people wrong by not respecting them as humans, are too aggressive, and sometimes are not patient.”
“The case workers haven’t been through the situations we have been through and they are very hard with people.”
“They treat us as if we we’re an ant.”
Participants often reported that staff was not available for help when needed. The difficulty of reaching their caseworkers by phone to answer questions about paperwork or the availability of program services was said to hamper the ability of participants to access program services effectively. The preponderant assessment of participants was that caseworkers were not sufficiently helpful and that more individualized assistance needed to be available. “They’re not accessible by phone; it’s always busy or no one answers.” “Two hours a day are the phone hours, and then she isn’t at her desk when
you call.” “My worker changes her office hours without even notifying me. Sometimes
I don’t find out from my new worker that my old worker is no longer helping me. I wish they would just pick up the phone and let me know these things.”
“They need to hire more people and give us more individual attention. There is always long lines and they never answer their phones.”
Participants expressed frustrated about not having their service requests
processed by staff in a timely fashion. Some reported experiences of caseworkers

56 Running Out of Time
who put them on hold for long periods of time and “act like you owe them something.” Delays by staff in processing paperwork were reported to have resulted in participants being unable to receive program services. “I would send him information, and he would lose it. He said he’d sign me
up for transportation, and he’d never do it.” “My worker constantly loses my paperwork. She expects me to just fill out
the forms time and time again—when she’s the irresponsible one.” “They should try to help us. It’s as if SSI doesn’t want us in the program. My
case worker didn’t process my papers for six months and I didn’t get any services after that because they said it was too late.”
Language barriers between participants and CalWORKs staff were said to be
a common problem. The inability to communicate effectively was said to sometimes make it difficult for participants to receive program services. “Sometimes I get a worker that cannot speak English. One time I got another
social worker to speak to my worker because I thought that maybe she could understand him better. But even she couldn’t understand what he said.”
MORE EDUCATION AND TRAINING PROGRAMS FOR OBTAINING BETTER JOBS
Focus group participants frequently said that extended education and training was the key to getting better paying jobs. Many said that their limited English language skills and job skills were obstacles to moving out of minimum wage jobs and into jobs that would support their families. “People want to go to work, but minimum wage doesn’t do much for you.
The [welfare-to-work] program works because they give education and good training.”
“My inability to understand and speak English has gotten in the way of me getting a job. I was mistreated at work because I couldn’t explain something in English. I would get scared because I couldn’t speak English.”
“It’s more important to have job training and education to maintain a well-paying job.”
Many participants said that they wanted extended educational training and
that the two years of educational training that is sometimes available is not enough for the types of jobs they would like to have. Some participants wanted to pursue jobs as fingerprint technicians, county workers, or alcohol abuse counselors. Some participants said they wanted to have the option to pursue college degrees or take college classes in specialized areas, such as child development. Stated one participant: “We want an opportunity to get a higher college degree.” Some wanted to continue their education during the summer months in order to retain the

Focus Group Issues 57
knowledge they had acquired: “We want to work straight through. Can’t you send us to other schools?”
One participant had been fired from a well paying job because of a lack of computer skills. Experiences of lacking competitive job skills were reported to have led participants to seek more specialized education and training that would provide the knowledge and experience needed to go after well paying work. “I was fired from a really good job because I had no computer skills.” “A lot of the employers want experienced workers.” “I wish we could get a list of companies that would give us that experience
and training.” “We need hands-on training.”
Focus group participants said that the expansion of existing educational and
vocational training programs, particularly the ability to fund participants to attend college and obtain a four-year degree, was very desirable. CLEAR INFORMATION ABOUT PROGRAM SERVICES
A common complaint expressed by focus group participants concerned the lack of available information on CalWORKs programs and benefits. One participant commented: “We have no information about the services. We need to be given a list.” Another said: “The information doesn’t arrive at people’s homes. We need the information in churches for example, and other places where people feel comfortable.”
Some mothers in focus groups said they had been unaware of the availability of childcare services and had lost the option of working. Some focus group participants said they were not aware that funds were available for transportation, car repairs, or daycare vouchers. Several participants said they wished their case workers had told them these of services were available because it would have been very helpful for getting work. OTHER CONCERNS
Although not as highly ranked by focus group participants, health insurance was a significant concern. Many participants were worried about the level of medical care in their neighborhoods, reporting that the existing clinics were storefronts set up by physicians and run by assistants. Participants dealing with substance use issues said that they needed better dental care because their teeth had

58 Running Out of Time
deteriorated as a result of their substance use. Participants said that Medi-Cal needed to be extended to cover the entire family. Even if they were working, participants said they needed to continue receiving Medi-Cal since many jobs do not provide medical benefits. Said one participant: “I want to find work, but once before when I got a job, they took the Medi-Cal away from me and asked me to pay for the insurance. But I don’t make enough money to pay for my children’s health insurance. So I would rather not work because health insurance is important for children.” SUMMARY
Programs such as childcare, education and vocational training, housing, transportation, and health insurance were identified as being critically important to parents. Without these crucial support services participants said they would be unable to remain in compliance with the CalWORKs program while also working and attending ESL classes or school. At the same time, there appeared to be a significant number of participants who were not fully aware of the different CalWORKs programs available to them but were clearly in need of them. This appeared to have been exacerbated by many participants’ difficulty in understanding various program procedures and compliance requirements, as well as problems encountered with CalWORKs program staff.
Some participants reported having very positive relationships with their
caseworkers, however a number of participants noted that program staff could be rude, insensitive to their needs, and unhelpful in administering program services for them. On a more affirmative note, a consensus emerged from the focus groups about the need to be allowed to pursue educational and vocational training, up to and beyond the two-year program limits. This is indicative of the desires of many participants to use program services effectively to obtain higher paying work and achieve economic self-sufficiency.

Chapter 8
Findings EMPLOYMENT RATE
Most current and former CalWORKs recipients appear unprepared for time limits. Employment rates of current CalWORKs recipients, former recipients, and working poor parents who were not receiving cash grants were as follows: Percent
Currently Employed
Percent Who Worked in the
Past Year
Number of Weeks Worked Last Year by Those Who had Jobs
Current Recipients 26% 43% 30 Former Recipients 29% 44% 31 Non-Recipients 34% 56% 35
It appears that after CalWORKs most recipients regain their former, albeit very tenuous, labor force connections. This means that 29 percent were employed at a given point in time, 44 percent during some part of the past year, and those who were employed work for 31 weeks during the year. Former CalWORKs recipients appeared to be less self-sufficient than other working poor parents who had not received cash grants. LEVEL OF EDUCATION AND EMPLOYMENT OUTCOMES Respondents with higher levels of education had substantially better employment outcomes than those with lower levels of education.
• The rate of employment at the time of the survey increased from 26 percent for those with only primary school educations to 38 percent for those with any exposure to college.
• Average duration of employment for those working last year increased from 31 weeks for those with primary school educations to 36 weeks for those who had some college education.
• Respondents who worked last year typically had more years of schooling than those who were unemployed (an average of 10.6 vs. 9.6 years).
• Respondents who were employed at the time of the survey typically had more years of schooling than those who were unemployed (an average of 10.5 vs. 9.9 years).

60 Running Out of Time
EFFECT OF CALWORKS ON EDUCATION
There was no difference between the levels of education of current and former CalWORKs recipients (both 9.8 years). Enrollment in CalWORKs does not appear to be associated with increases in parents’ level of education. BARRIERS AND PRIORITIES There is a strong convergence between the barriers CalWORKs parents identified, the services they said were important, the issues they raised in comments, and the problems they identified in focus groups. The three most frequently identified barriers to getting good jobs as well as the types of services most frequently identified as being important for achieving self-sufficiency were:
1. Childcare 2. Education, training and English skills 3. Jobs Only 9 percent of CalWORKs parents reported that they had no problem
getting a good job. NEEDS OF DIFFERENT GROUPS Different groups of welfare parents identified distinctly different barriers to employment as well as differing priorities for the services they need most. A few examples include:
• Parents speaking a language other than English at home were twice as likely as other parents to identify limited English as a barrier to employment.
• Parents who were 45 years of age or older were more than twice as likely as parents 25 to 34 years of age to identify health problems as a barrier.
• Recent immigrants were twice as likely to identify the risk of older children getting into trouble as a barrier to employment.
• Single parents were more likely to identify childcare as a barrier to employment.
Because of the large sample of survey respondents and the quality of the data
collected from them, the statistical model created for analyzing this data has proven to be quite robust. This model can be used to produce detailed information about the needs of different groups of CalWORKs parents in different areas of the county. This model and the survey data are freely available to the County of Los Angeles.

Appendices

62 Running Out of Time

Appendix 1
Focus Group Appendix INTRODUCTION
Each of the 22 focus groups was led by a volunteer facilitator and recorded by project staff who were typically graduate students in social welfare, and who prepared these discussion summaries. The focus group summaries are listed below in chronological order, followed by an overview table (Table A-1) that lists the focus groups by site. At the end of this appendix section is the list of seven questions that were used by the volunteer facilitator to guide the discussions.
Focus Group #1 Queen of the Valley Hospital, West Covina
April 28, 2002 NUMBER OF PARTICIPANTS
About 35 people were present, mostly Spanish speaking and evenly divided between men and women, with some children present. Many of the participants were immigrants. SUMMARY
Emotions ran high during the focus group and many of the participants expressed considerable anger. There was obvious discontent with CalWORKs that was expressed during the session. Some participants did make favorable remarks saying the caseworkers “did a good job” or “were helpful” but the general feeling was that CalWORKs was not as helpful as it could be.
Not all of the participants in the focus group spoke and it did tend to center on 6-10 individuals who were not afraid to speak. Other participants were not drawn into the discussion apart of a few grunts of approval. Nevertheless, many of the participants were happy to be part of the focus group and offered sincere and in-depth responses to the facilitator’s questions. KEY POINTS
The facilitator generally followed the seven-question guideline, but the discussion was free-ranging and sometimes went beyond the bounds of issues strictly related to CalWORKs.
FIRST – One of the prime issues or complaints mentioned by the focus group members was lack of information on CalWORKs programs and benefits. Several

64 Running Out of Time
participants said more information was needed on how to take advantage of educational, childcare and transportation opportunities offered through CalWORKs or other government agencies. “The information doesn’t arrive at people’s homes,” one participant said. “We need the information in churches for example, and other places where people feel comfortable.” Another participant said venues for dissemination of CalWORKs programs go untapped. “They don’t advertise everywhere they could,” she said. One of the consequences of the lack of information was that mothers who want to work are unable because they do not know where to find the information on childcare. “They don’t know where the social/community services are,” one participant said. SECOND – Another critique of the CalWORKs program involved poor service. This was a major complaint among many of the focus group participants. “It’s horrible dealing with them (social service personnel). It’s not easy dealing with them,” one participant said. “The caseworkers haven’t been through the situations we have been through and they are very hard with the people.” Participants complained of being treated condescendingly and indifferently. “They treat us as if we’re an ant,” said one participant. Some participant recommended better training for social service personnel who deal with clients. THIRD – The third major issue raised by focus group participants was labor difficulties. Participants complained about a variety of problems regarding the jobs they obtained through CalWORKs or other government agencies. One of the major complaints was that the jobs pay very little -- so little that they could not support their family with the money the earned. “Supporting three kids and paying the IRS, the money they pay us is not enough,” said one participant. Another complaint regarding labor was the fact that some clients could obtain only part-time jobs, with only 2 or 3 hours of work per day, limiting the amount of money they could earn. Another participant told a story of a mother of four who was offered a job doing ‘graveyard shift’, something that she could not do with so many children to watch. FOURTH – The difficulty mothers experience trying to access affordable childcare services was another important issue raised by participants. Many of the participants were themselves mothers who said they would like to work but were unable to obtain childcare services. One participant suggested putting together a group of mothers that would designate one mother at a time to take care of the group’s children for a day at a time so that they other mothers could work. They also stressed that it is important to find people who are qualified, “trustworthy, and responsible” to take care of the children. Participants said mothers want to work but they don’t know how to access childcare resources.

Focus Group Appendix 65
FIFTH – The final major issue identified by participants was the difficulty of citizenship documentation. From the conversation that ensured, it was obvious that many of the participants struggled with trying to make a living for themselves and their families in spite of being undocumented. Participants said that in spite of their work ethic and drive they were denied access to decent jobs and social services because of their immigration status. “The people can’t find a decent job,” one participant said. “The bosses want to exploit us for not having papers.” One participant said that residency restrictions have increased: “Before, you went to an agency and they found you a job,” he said. “Now they ask for your social security number.” Others said that social workers would not help clients who could not show proof of legal status. The problem of documentation also involved transportation, because those without licenses cannot legally drive. “What about the mothers who have to take their children to one place them pick them up?” asked one participant. “It all comes down to having a social security number.” One participant complained that some people who have papers receive benefits yet do not work and those who want to work most are unable to because they do not have the proper documentation. “Give the aid to the people who really need it,” said one participant. Many of the undocumented participants stated that government agency staffers brushed them aside because of their status. “They don’t want to help,” one participant said.
Focus Group #2 Virgil Middle School, Echo Park
May 2, 2002 NUMBER OF PARTICIPANTS
Twenty-six people were present, twenty women and six men, mostly Spanish speaking. SUMMARY
The focus group started out slow, but as the participants became more comfortable with the facilitator, they began to express their opinions more candidly. The facilitator followed the format and discussed all the focus group questions. The participants were sparsely seated in a large room, which made the focus group less intimate. Approximately half of the focus group participated in the discussion, and emotional tone/content varied depending on the topic. KEY POINTS
The general tone of the discussion was resignation, although some participants were animated when they said that they felt slighted by the CalWORKs system. There are a few issues that were raised were significant even though they

66 Running Out of Time
fell outside the major themes of the focus group discussion. A few explained that they have experienced delays in receiving aid or having application their processed – which can produce extreme anxiety. Also, some felt that the county really did not want to deliver services to the needy populations of Los Angeles because of how they fail to announce or advertise the services they provide. A couple of women noted that they have sensitive and helpful workers with whom they can talk comfortably; one mentioned that the caseworkers’ dispositions have gotten better over the last 2 years. FIRST – The participants stated that their children’s health insurance coverage was the most important issue for them, Medi-Cal in particular. Many explained that the provision of health insurance by the state truly helps them because children get sick often. One woman noted, “Medi-Cal is more important than food stamps to me. Sometimes I don’t receive all of my food stamps, but I don’t complain because I’m afraid they’ll find some way to take away my children’s health insurance. Another woman said that she feels trapped. “I want to find work, but once before when I got a job, they took the Medi-Cal away from me and asked me to pay for the insurance; but I don’t make enough money to pay for my children’s health insurance. So, I would rather not work because health insurance is important for children.” SECOND – The participants strongly felt that the jobs that CalWORKs helps them attain do not pay well enough to discontinue the services they receive. The discussion around this topic was heated and many participated. One man explained that, “sometimes paying the rent takes all of my check from work and leaves me with little to pay other expenses. My children need school uniforms and food, but what I make is not enough.” Another man said, “Once people get a job, they take away all the services. How are we supposed to make the transition to being on our own without any help? The services they provide are very valuable, which I cannot afford without CalWORKs.” One man suggested, “They should help us get better jobs. Many of us don’t have that much experience in employment. Others cannot speak English, which can keep them from being hired or are paid less sometimes because of it. We need some job training, like vocational or computer classes. Many of us also need to take English classes too. This would probably help us to get better paying jobs.” THIRD – Many of the participants said that the culture or environment in the DPSS office is not welcoming. One woman explained, “They’re not sensitive to a person’s needs. They act like the money is coming from their own pockets.” Another woman said, “I have my family help me with my problems rather than go to the DPSS office. I know women who are treated badly by their workers and come out crying.” One man suggested, “They should provide training for the workers to learn how to work with people, especially cross-culturally. Many of

Focus Group Appendix 67
them treat people wrong by not respecting them as humans, are too aggressive, and sometimes are not patient.” FOURTH – Another concern expressed by participants was that the bureaucracy of the CalWORKs program makes it difficult to access services. One woman explained, “I have gone through the process, and I still cannot understand it. There are too many forms, and sometimes no help to fill them out.” One man commented that, “It can be difficult to access services. Nothing can be missing, they give you no leeway.” Another man described his experience; “I was unemployed for two months and applied for services. They sent me a lot of paperwork and it took me a while to complete it, but I sent it back. Then they made me go through too many appointments before I finally got some help. But, by the time it arrived I already got a job, and they made me pay it all back. It wasn’t fair.” FIFTH – Participants noted that access to childcare services was a potential barrier to finding employment. One woman explained, “I have 4 kids, and they all attend a different track in the year-round schedule. This makes it difficult for me to take care of my children and work. The schools don’t help families by coordinating the tracks of the children.” Another man explained, “I must leave work to pick up my children from school at times. This lessens the amount of pay I receive in a day.”
Focus Group #3 Los Angeles City College, Los Angeles
May 7, 2002 NUMBER OF PARTICIPANTS
Nine women participated in the discussion, which was held in Spanish. SUMMARY
The meeting took place at the end of a domestic violence class provided by CalWORKs. The instructor remained in the classroom and participated in providing clarification and answers to questions. There was confusion expressed among the participants about the role of CalWORKs in relation to GAIN, or the relationship between the Section 8 housing program and CalWORKs.
Two women who had been silent during the class that preceded the focus group became interested in the session and participated actively. There were three or four dominant speakers. The classroom format seemed to create a sense of distance as the facilitator, the teacher and a second instructor were standing in front, while the participants were seated in the position of students. A somewhat animated discussion of the questions ensued, often diverting into anecdotic incidents that were sometimes unrelated to the main focus of the session.

68 Running Out of Time
KEY POINTS
The importance of receiving Medi-Cal, especially for the children, was mentioned by one of the participants. However, the topic wasn’t taken up by the facilitator or the other participants, so not much was heard about it. Mostly the interest veered towards training and employment. The pervasive tone of the group was a mix of resignation and frustration. Nevertheless determination and willingness to work hard and succeed was the underlying unspoken attitude of these women. FIRST – The participants spoke about the importance of receiving financial support while trying to improve their skills in an effort to obtain a job with better pay. A woman said, “Money is the most important (service provided by CalWORKs) to pay the rent and help us go to school and find a better job”. Another one felt the amount of taxes deducted from their pay was excessive, “The government takes it all away (the money) in taxes.” The need for low cost housing was one of the items most emphasized when asked to identify any services CalWORKs does not provide. There were comments about how difficult it was to get housing from Section 8, and once having obtained an apartment, how difficult it was to comply with all the documentation to qualify. A woman said her daughter had Section 8 but that she would rather not have it because of the difficulties in complying with the requirements. SECOND – The participants spoke about their frustration at not having access to childcare services that are affordable to them while they attend school or work. Several said they had received false promises from their workers. They said their calls are not answered and they are misled when inquiring for help. There was a sense of impotence, of not having a way out. “What to do if they don’t give money for childcare?” “How to get childcare while working or going to school?” “Friends who are on welfare and do not work, can’t provide childcare because they would lose their welfare checks.” “I have always worked and paid for a baby sitter,” said a woman who explained that she barely earns enough to make ends meet. THIRD – Many of the participants agreed that the DPSS posed many hurdles to them and had concern about their difficulty in accessing the programs. They complained about difficulties in applying for help. They indicated that the system is hard to understand and that it was discouraging to not get assistance on filling out the forms. One of the impediments mentioned was the lack of legal documentation. Several said they felt discriminated against as Latinos and limited because of the language barrier. One of the participants said, “ We Latinos suffer from discrimination from both the Black and the White. They apply for help and get it right away. We apply and if we demand too much, they put us in jail.” “Although

Focus Group Appendix 69
they speak Spanish, they pretend they don’t and try to make us speak in English.” Some reported that it was difficult and confusing to try to get information and gain access to supportive services. “Some workers are helpful, but it is not always so.” Some complained about the delays caused by the frequent change of staff assignments, “Cases get transferred from caseworker to caseworker, we turn in the papers, and there is no response.” FOURTH – The participants emphasized the need to improve their language skills in order to get the training necessary to obtain better employment. One said that she aspired to become a nurse assistant but didn’t feel confident enough to take the training until she improved her English skills. She said that taking ESL classes was her way out of frustration and disempowerment, “I feel stuck by not knowing English. I don’t have the chance to study what I want. I need to study more hours.” The participants appeared to be motivated and hopeful in their efforts to become qualified for better jobs. An older woman, who worked as a janitor for a MacDonald’s restaurant felt disadvantaged relative to younger workers. In describing her wish to work as a cashier she said, “I don’t have a problem finding a job, but I need training.”
Focus Group #4 LA City College, Los Angeles, CA
May 7, 2002 NUMBER OF PARTICIPANTS
Five participants took part in this discussion. SUMMARY
The participants had an informative discussion about childcare, education, problems with the services, and other issues that affect their lives. There were times that the facilitator had to involve other members of the group by calling upon them. However, as the meeting progressed, all of the participants appeared comfortable. One participant was especially open, sharing her views and experiences about what she likes and dislikes about the welfare system. All of the participants had numerous opportunities to communicate their concerns; they appeared sincere in their responses to questions. KEY POINTS The emotional tone of the meeting was a mix of satisfaction, frustration, and futility. The five main issues that were brought up during the group were:

70 Running Out of Time
FIRST – All participants indicated that education and good training would help them get a better job, instead of settling for a minimum wage job. When answering the sixth question “In your experience and the experiences of others you know well, what kinds of problems do people face in getting a job that can support their family,” one participant stated, “Not enough education. People want to go to work, but minimum wage doesn’t do much for you. The program (welfare-to-work) works because they give education and good training.”
Another participant stated her belief that taking courses (specifically a child development class) would make her more marketable and help her compete in a realistic way with other job applicants who were younger. All the other participants agreed and nodded their heads, supporting the idea that education and good training were critical to getting a well-paying job. One participant stressed the importance of education and good training a few times whenever she shared her thoughts. Most of the participants appeared satisfied with this aspect of the welfare-to-work program. SECOND – Lack of assistance in helping participants finding “good” housing was identified as a major problem with the program. Two participants brought up the issue of having difficulty finding “good” housing for themselves and their families. The others agreed. When responding to the second question, “What services do you need that the welfare-to-work program does not provide for you?” one participant said, “A good place to live.” She then described her situation. She said that she lives close to USC and had experienced discrimination. She stated, “It’s like some person are more stronger in the community than others. They don’t give me the apartment because my son is in jail.”
Another participant shared a similar concern, stating “Once you are on welfare, it’s difficult to find an apartment. If they know that you are on welfare, they won’t give you the apartment.” The other participants appeared to agree with these concerns. They appeared to have a strong desire for “good” housing, but at the same time they seemed to think that it would always be beyond their reach because of discrimination and because the welfare program simply could not provide it for them. THIRD – All the participants agree that the welfare program’s assistance with childcare had been extremely helpful. Answering the first question, “In your experience, what are the most important services that the County welfare-to-work program provides for you?” one participant stated, “If it weren’t for childcare, then I can’t pay for childcare to go to school.” Another participant agreed with her, naming “childcare” as an important service provided by the welfare program. All the other participants agreed and they appeared satisfied when they were discussing this service.

Focus Group Appendix 71
FOURTH – A few participants recounted problems they had experienced with their workers, while others are satisfied with their workers. One who had problems responded to the question, “What is your relationship with welfare-to-work staff?” by stating, “I have a bad experience. When they call me, say well ok, what do you prefer, then he send me here (to school) … sometimes he call me two or three times for the same thing.” Another participant shared a similar concern, stating that her friend has had problems with her worker as well. Three of the main complaints about caseworkers were: 1) The caseworkers often lose track of the participants’ paperwork, so they have to apply several times for the same service, 2) It takes the participants a long time to get their requests granted, and 3) When their requests are granted it is often less than the amount for which they had originally applied. FIFTH – Participants said that it added stress to their lives to be uncertain about whether their workers would authorize support services such as paying for books, which made it more difficult for them to concentrate on their academic work. One participant said, “It adds more stress when you have to worry about the other things, like childcare, books … it’s difficult to concentrate.” All of the participants agreed with her.
Focus Group #5 Castellar Elementary School, Los Angeles
May 7, 2002 NUMBER OF PARTICIPANTS
Seven women participated in this focus group; all spoke Khmer (Cambodian). SUMMARY
The participants spoke through an interpreter who interpreted for the facilitator as well. The responses from the participants came both through the interpreter and through an assistant who was also bilingual. The participants were quite willing to address the issues and had a lot to say. The group was divided around the two interpreters and there were simultaneous discussions going on after each of the questions posed by the facilitator. At times the responses came as a summary by one of the interpreters of what the group had discussed, and at times individual participants spoke either in broken English or through the aid of an interpreter. Several of the participants seemed reserved and most of the speaking was done by three of them. The majority indicated interest and wanted to be heard.

72 Running Out of Time
KEY POINTS At least three of the participants were recent immigrants and seemed to know
nothing or very little about welfare-to-work programs. Those who spoke in broken English seemed to have experienced frustration in their contact with the welfare system. The issue of low cost housing and the difficulty of obtaining Section 8 housing were mentioned briefly. FIRST – Participants said they needed access to more consistent financial aid. They explained that they did not understand the month-to-month fluctuations in the amount they received. They said that because their rent payment depended on this, the insecurity of not knowing how much they were going to get each month caused them considerable anxiety.
• “Every month the money gets cut, we don’t know why.” • “We ask (the workers) why does the money go up and down? They answer,
‘I don’t know.’” • A single mother pointed out that with financial aid, she would be able to stay
home and care for her own children. “All the money I earn goes to paying the baby sitter, so what is the point? I much rather care for my own children, and not pay a stranger to do it for me.”
• “If I go to work, they stop the welfare. I asked how do I get it back? They said, ‘don’t work!’”
SECOND – Access to subsidized or affordable childcare was one of the main concerns. Participants said that they felt tied up, impeded in their ability to find suitable employment or attend school while dealing with the cost or inaccessibility of childcare.
• “How am I going to find a job when I have to drop off and pick up my three children that have each a different schedule?”
• “You are supposed to go to school, but who is going to take care of the children?”
• Single mothers expressed frustration about being required to work 32 hours a week, noting that it was only slightly less than the 35 hours required of employed spouses in two-parent families.
THIRD – Participants said they need access to more comprehensive and inclusive Medi-Cal plans. They pointed out that the medical care they have access to includes only the children and not the whole family.
• They said that the age gap for those who do not receive Medi-Cal should be extended, raising it to age 21 and decreasing it to age 55 rather than age 62.
• Additionally the requirements to qualify seemed excessive to them. A 60-year-old woman who works full time and earns $1,000 a month said she

Focus Group Appendix 73
could not possibly afford the medical care she needed. She said, “They should increase the amount you can make to get full benefit.”
FOURTH – Lack of language skills was identified as a barrier to employment. The participants commented that their native language, Khmer, was an impediment even within the Asian community. They said they would need to learn Chinese or Vietnamese if not English, to increase their chances to get work.
• They said they needed orientation as to how to search for work. “We don’t know where to go.”
• “The economy is not good.” FIFTH – Participants expressed concern about their difficulty in obtaining consistent information through DPSS staff. They said the system was confusing and difficult to understand. They said that if the workers were better trained in customer service, the information needed to access the programs would be more available to them.
• “If you have a problem and ask the worker for help, he or she will tell you that they can’t help and send you to see somebody else.”
• Several participants emphasized that workers were “too strict and tight”. They said that at times they demanded documentation that was not relevant or that had already been provided.
• “They made me wait for two hours and then asked me for the report card from my child in high school. And I don’t have a child in high school!”
Focus Group #6 Downey Adult School, Downey
May 9, 2002 NUMBER OF PARTICIPANTS
There were approximately thirty participants in this focus group.
SUMMARY The focus group discussion proceeded smoothly, covering all questions
within the given format. The group started out with 30 participants but only half remained to the end. Around 5 to 6 participants did most of the talking with the rest responding with occasional nods. When questions were posed, the participants could not always respond immediately. Instead, they often responded to facilitator prompts (reading out examples listed in the survey). Overall, the group remained calm and collected, although strong emotions were exhibited when the issue of DPSS worker hostility was brought up.

74 Running Out of Time
KEY POINTS The participants found it difficult to rank their top concerns among those
listed below, but agreed that the sixth concern mentioned (lack of respect shown by CalWORKs eligibility workers) was less important than the first five. “I can live with people being mean to me, but I can’t live without housing or childcare.” Some participants stated that all of the first five concerns carried equal weight. Other concerns that were expressed but that were less important included access to legal services, assistance for documented as well as undocumented immigrants, job support and opportunities for handicapped participants, and jobs with higher pay. FIRST – Affordable housing or rent assistance: participants said that lack of affordable housing made it difficult for them to get by on their income. Most of the active participators commented on the lack of affordable housing. “The waiting list for affordable housing is too long! You would actually have to wait 5 to 10 years.” “I couldn’t afford a decent place on my own and so I’m now living in a 3 -bedroom apartment with 10 other people.” “The places I can afford are in nasty areas. I don’t want to raise my children there.” It appeared that the participants experienced anxiety and frustration over housing issues as evidenced by high-pitched tones and outbursts. SECOND – Childcare services: participants said that reliable childcare service is crucial for ensuring stable employment. Two women in the group emphasized the importance of childcare with remarks such as “If I don’t have childcare, I can’t go anywhere” “Some employers don’t hire you if you don’t have childcare”. It appeared that other women in the group agreed with the importance of this service judging from the nodding of heads. THIRD – Mental health services: several participants said that counseling services helped them cope with daily stresses. Most of the participants agreed that counseling is one of the most important services provided by the county. Although there was no mention of a lack of counseling services, the participants noted that a reduction of counseling services would affect them negatively as they rely heavily on these services. Some comments include, “I am always looking forward to my counseling sessions.” “Domestic violence counseling, family counseling, and parent trainings have been helpful.“ FOURTH – Job training (continuing education): participants said that being able to go to school and receive adequate training and experience is a key to advancement. Participants appeared to feel strongly about the need for job training. One participant stated, “I was fired from a really good job because I had no computer skills.” Another commented on the need for transitional programs that would give participants needed job experience. “A lot of the employers want experienced

Focus Group Appendix 75
workers.” “I wish we could get a list of companies that would give us that experience and training.” “We need hands-on training.” FIFTH – Transportation: participants reported that transportation costs can be burdensome. A dialogue took place between one participant and another regarding transportation costs after one woman discussed the approximate cost of transportation per week, another informed her of a channel through which she could get cheaper transportation. The participants agreed that transportation costs add up to be a burden and that they are dependent on the county to help offset the cost of transportation. SIXTH – Training for eligibility workers: several participants commented on the lack of respect with which eligibility workers treat CalWORKs participants, the lack of information provided, and encounters with eligibility workers who do not speak English well. Emotions ran high when the issue of eligibility worker hostility toward welfare recipients was addressed. A few participants shared personal experiences. “When I was pregnant with my second child I had to quit my job because I couldn’t work the long hours anymore. When I went to the welfare worker she asked if I was drunk when I got pregnant.” Some participants noted the lack of information provided by workers. “I know more about the program than my worker does because I’ve read the information booklet.” Others argued that complicated and punitive policies rather than worker inadequacy lead to inconveniences. “They would deduct money from my check because they didn’t get the information I mailed to them. They blame me for their mistakes.” This participant’s voice was filled with anger. One participant commented, “Most of the workers are Asian, and I can’t understand what they’re saying.”
Focus Group #7 La Casita De Las Mama, Downey
May 9, 2002 NUMBER OF PARTICIPANTS
This focus group consisted of twelve women. SUMMARY
La Casita is a residential Drug Rehabilitation Center. The participants are all in their late twenties or early thirties, three of them pregnant. Four of them have been involved in CalWORKs and at least five of them had never been on welfare. We all sat around a table, which facilitated a sense of intimacy. The majority were outspoken about their fears, hopes and frustrations. Some were quiet and did not participate in the discussion unless prompted by the facilitator or the other women.

76 Running Out of Time
There was a mix of apathy and interest among the members of the group, but the discussion was lively. KEY POINTS FIRST – A number of participants said they didn’t have the means to afford childcare or access to facilities that are in close proximity to their programs. Without access to affordable day care centers these women, mostly single mothers, said they were less likely to be able to attend the programs available to them, or to go out searching for jobs. One participant explained that to go to her GAIN office she first had to take a bus to leave her children with a sitter, pay her out of her pocket, and then take another bus. Total traveling time one way was three hours. Another participant said she had a minimum wage job and that practically all her money was spent on the baby sitter. This made her wonder whether it was worthwhile to work. “The programs should pay for childcare or provide it.” “Childcare is absolutely number one.” “Not just any childcare, it has to be safe, decent. I wouldn’t leave my kids in just any of those places.” SECOND – Financial assistance is essential for making it possible for women who are unemployed and in treatment for substance abuse and domestic violence to get clean and rehabilitated. “For the basic needs for the kids, cash really helps”. One woman complained that the system is such that even when their condition of poverty is obvious, it may still not be enough to meet the requirements. She went on to relate how she was forced to lie in order to get assistance. She said she had to deny that she knew her husband’s whereabouts, although he was sitting in the waiting room. She said that she feared the District Attorney’s office would file a case against him for child support. She explained that he earns just enough to pay his rent and support one of the children. Since she lives in the rehabilitation center with the younger of their children she needs assistance to pay the rent. Referring to her caseworkers she said, ”They don’t work with you, they just shut you down. They want you to lie so that you can get what you need, but if they find out then it’s welfare fraud.” This indignation about treatment by the workers was not unanimous. Some of the participants said that they had had positive experiences. THIRD – Some of the participants were pregnant and/or had children to care for, and complained that their access to affordable and available medical care was very limited. “We always end up in the General Hospital and have to wait many hours.” “We want better medical plans”. Because of the deterioration of their teeth caused by substance abuse, some of the participants said they needed dental care. “They don’t fix your teeth, they just pull them out, and when you go to look for work you are not presentable.” “Even if you work behind the scenes, like in a warehouse, you still need to be presentable for self-esteem”. There was an animated discussion

Focus Group Appendix 77
about this topic. All of the participants indicated concern about their physical appearance and fear of humiliation. FOURTH – All these participants had experience with substance abuse, domestic abuse/violence, anger management, or battered women programs, and all indicated that they were important. One of the participants made a point of emphasizing how helpful these programs had been for her, and several others echoed this. “It is very important to have this help. Substance abuse is a huge problem,” said one of the women who was a victim of domestic violence and used to spend all of her money on drugs. “In low income communities selling drugs, that’s how you make your money, but if a drug offender has a choice when they come out, that makes a difference”. “Counseling at La Casita helps us raise our self-esteem.” FIFTH – Several of the participants voiced concern about having criminal records and/or being on probation, and said that this was a barrier to getting a job. They said that felonies could not be expunged from their records. “They should have special programs for convicted felons to find a job and get out of AFDC”. Several expressed fear about being perceived as a stereotype when applying for jobs. They wanted to know if help was available to remove tattoos. One of the participants voiced the opinion that on-the-job training was preferable to go to school first and then trying to find a job. That seemed to be a popular idea in the group. However, one participant expressed appreciation for the chance to go to school, “GAIN sent me to college and paid for my books. GAIN is really helpful.” “At the beginning I had a hard time because I had to find a baby sitter. But they do help you a lot.”
Focus Group #8
Epiphany Catholic Church, El Monte May 11, 2002
NUMBER OF PARTICIPANTS There were eight participants, all female, seven of whom are CalWORKS or former CalWORKS participants. SUMMARY The focus group meeting was conducted in Spanish. All but two of the participants were from Mexico. One participant was an undocumented immigrant from El Salvador, five were single mothers, and the others were married. Two were high school graduates; the remainder had completed between eight and eleven years of school.

78 Running Out of Time
KEY POINTS The four who had had some job skills training liked the feeling of going to
school, but were finding no particular market for the preparation they were getting, save for liking the ESL classes several of them were taking. FIRST - Those who had received the childcare benefit were the most enthusiastic about its value (but did point out a dearth of resources in the San Gabriel Valley). Two people disagreed strongly, one of whom said (to general agreement) that she had good children and knew she was doing a good job raising her children despite little education and no English. She said that the CalWORKS rules could ruin her years of good work at parenting, without there being any guarantee that outside childcare would provide as much or as well. Another participant’s experience with the childcare system had been very positive; she stated she was learning about little children and how they learn with her third child and wished she had had the same resource for her older children, adding that it was helping her handle all three of her children better. SECOND - Except for bus coupons, none of the participants had received any transportation benefits. Several pointed out that the only jobs reachable without transportation were sweatshop garment manufacturers in South El Monte. They said that public transportation was cumbersome and time-consuming, while owning their own vehicles required that they pay for the maintenance of the car, fuel and insurance. Neither option offered an economical solution to the problem, but rather force them to choose between losing three to four hours daily while using public transportation or suffering a drastic loss in their income due to the expenses related to owning a vehicle. Several of the participants pointed out that CalWORKs had promised they would provide an economical form of transportation, but that no viable option had yet been provided. THIRD - Lack of affordable housing for a number of participants. Some expressed a sense of futility about ever earning enough to afford decent space and they could see nothing on the horizon or in the Cal WORKS program that would relieve this problem. FOURTH – Participants described inadequacies in the personal service provided by CalWORKs staff. They said they deserved to be listened to when they were being interviewed, especially when one takes into consideration the time that they had invested in obtaining the interview. Some reported that during interviews they felt as if they were taking precious time from the social worker, who seemed to only be interested in finishing the interview as quickly as possible. They unanimously agreed that the time limit for interviews should be extended so that they could actually understand what would be required of them in CalWORKs. In conjunction

Focus Group Appendix 79
with these statements, they pointed out that the job-training classes that they were sent to were often irrelevant to improving their economic situation. In fact, they said that many times they were sent to a class simply to fill a requirement that the social worker must mark off on his/her checklist. This did not help them in any concrete manner but rather exacerbated their economic hardship, because CalWORKs counted those classes in the job-placement process. FIFTH - One participant stated that her benefits had been reduced because CalWORKs argued that she had not enrolled in one of the required classes. Unfortunately for her it took a significant amount of time to prove to CalWORKs that she had enrolled in and completed the course even though she had proof of completion. In the meantime her benefits had been significantly curtailed causing her to undergo additional monetary worries. Other participants voiced similar concerns about the efficacy of the program, saying that many times it seemed impossible to rectify a simple error, regardless of whether the error was caused by the recipient or the CalWORKs staff.
Focus Group #9
Goodwill Industries, Lincoln Heights Monday, May 13, 2002
NUMBER OF PARTICIPANTS
This focus group had five participants, four females and one male. SUMMARY
The focus group started a little late since there was confusion on the scheduling. All but one of the focus group members actively participated, freely expressed themselves, and were engaged in the discussion. KEY POINTS
The overall tone throughout the focus group was of frustration due issues such as errors made by the CalWORKs system and lack of capable and experienced staff to handle the participants’ cases. Many participants indicated that the system continually made mistakes because of miscommunication with case managers and errors associated with the computer system. FIRST – The participants expressed strong feelings about instances when the CalWORKs system did not work properly for them. One of the main problems they identified was inconsistencies and errors. Some participants reported that they had received “Notice of Action” forms that were not relevant because they were based

80 Running Out of Time
on outdated information. They then had to deal with correcting the computer’s mistakes. Other participants reported that the computer system does not keep accurate records of changes in their income status. They said that the amount of their cash grants had been reduced because of inaccurate information, putting them into a bind. Several clients also reported that problems had been created when they changed programs and were assigned to new offices that were far away. One participant noted, “My wife has been dead for over four years, and they are sending me notices even now about her.” Another person had a similar experience and added that, “It is tough, too, when you receive a notice about him (her deceased husband) because it brings up memories of him and it’s hard.” Yet another participant shared her frustration by saying, “Why is it that when we get into a new program, they send us far away to a new person. There is a closer office nearby. I had to go to El Monte, and that is hard since I am a single parent and they want us there by 8 a.m. when I have to take public transportation.” SECOND – The second salient point was about staff of the CalWORKs program, in particular case managers. Participants complained that they had a difficult time to communicate with their case managers. Participants said that case managers often had limited English skills. There appeared to be a general perception that welfare workers were not helpful and that was a need for workers who would be more helpful and empathic. One participant did note that the mentor she was given through the GAIN program had really helped her. Overall, they indicated that some workers were better than others at helping the clients, and that who they got assigned (i.e., luck) determined whether their needs would be met. In reference to the abilities of the DPSS workers who are handling the cases, one focus group member stated, “It depends on who you get. It all comes down to if the person who you are assigned to and has your file has a heart. We just need someone to listen to us and help us get help.” Another member added, “some (workers) don’t speak English. They have our file, and how can they say they don’t know our situation. It is their job.” THIRD – A majority of the participants were single parents. Several suggested that the circumstances of single parents needed to be taken into account. One participant said that she needed help with childcare when she had to go to an appointment, especially when it was far away. Another participant suggested, “How about getting help for single parents like me who do not have a GED?” Fourth – Participants discussed the difficulty of transitioning straight into a job. Several pointed out that it was useless to receive training and have a certificate, but then find out that employers require applicants to have experience before they consider hiring them. Participants suggested that there should be assistance with

Focus Group Appendix 81
job or work experience placements for CalWORKs recipients after they complete job training. One person who participated recommended, “Why don’t they (CalWORKs) offer to help us find a job? They should have something for us after we finish so we don’t have to go looking for ourselves. Sometimes I go to an interview and I have the certificate saying I have the skills, but they (employer) want me to have experience. How can I get that?” Fifth – Several participants said the CalWORKs system punished clients who were doing better. For instance, when they become employed, they received fewer benefits. Some said that the reduction in benefits was not fully offset by their increased earnings, and that clients were better off when they only received aid.
One participant expressed her concern as a single-parent by stating, “Why is it that because I receive child support or work, I receive less? This amount is not enough, and I need both (child support and check). Or when I work, they take more out. So I would be getting more if I just got the check without working.”
Focus Group #10 Alma Family Services, Pico Rivera
May 13, 2002 NUMBER OF PARTICIPANTS
Six women attended this focus group, all Spanish-speaking. SUMMARY
All but one participant was very active in the discussion. At times, there was dialogue between participants on specific issues. The facilitator observed that the participants were worried -- but not overly concerned -- about the prospect of cuts in funding for CalWORKs. KEY POINTS
The general emotional tone of the group was of worry and concern. Participants also conveyed frustration when they discussed interactions with their workers and fraud investigations. A few stated that their caseworkers constantly asked them if they had other sources of income. Participants stated that they were not “cheating” the system and that it was not fair that they had been investigated for fraud. They suggested that the program should focus on finding those who are truly “cheating” the system. FIRST – Participants said that the benefits of mental health services extended into other areas of their lives including education and employment. One participant

82 Running Out of Time
noted that it was a significant barrier “not being able to recognize that you have depression. It’s all related … your job, work, mental health. I wished I came to this agency a long time ago.” Another participant added, “Coming here to Alma Family Services … I’m getting my confidence back.” One participant stated, “Mental health services are important, like coming here. The services that you get here prepare you for the real world.” Another participant agreed that mental health services are important and described her experience: “Receiving counseling helps me with remembering and identifying important things that have to be done. I have a bad memory and counseling helps me.” The facilitator reported that the participants were worried about the cutbacks, especially how they will affect the mental health services. He also related that according to the participants, therapy has been helpful in terms of helping them understand instructions at their jobs. SECOND – Participants said that education is crucial for obtaining a job that pays well. Throughout the discussion participants commented on the importance of education and good training for getting and maintaining a well-paying job. One said, “More English training would be important and more education to maintain a well-paying job.” Another participant agreed, stating, “It’s more important to have job training and education to maintain a well-paying job.” They also said that limited English and limited education were the things that kept them from getting a job that would support their families. One participant described how she has been mistreated because she did not know English well, “My inability to understand and speak English has gotten in the way of me getting a job. I was mistreated at work because I couldn’t explain something in English. I would get scared because I couldn’t speak English.” THIRD – Participants said that childcare is a helpful service that has assisted them in obtaining and maintaining employment. A participant stated, “Childcare is really important. I just had a newborn. Job training and education are important, but childcare is essential once you go out in the job world.” All the other participants agreed with her. FOURTH – Medical care was a concern for most participants. Several said that the welfare-to-work program does not provide adequate medical coverage and that something needs to be done about it. One participant explained, “The medical services should be extended. We need more time for our medical coverage. I’m in the TANF program and half of the people are falling asleep in there. A lot of mothers are worried about medical services. I think it’s one of the most important services. Anybody could go get a Target job, but will they get benefits? I need to have some sort of co-payments to keep the medical services.” Another participant shared, “My kids have their own kids and they have a difficult time getting medical

Focus Group Appendix 83
coverage. I wish there was a program to let grandparents get access to the medical benefits on their grandchildren’s behalf.” FIFTH – Participants stated that job training is important in obtaining and maintaining a well-paying job.
Focus Group #11 All Peoples Christian Center, Los Angeles
May 13, 2002 NUMBER OF PARTICIPANTS
Twenty-two people participated in this focus group, equally divided between men and women, ranging in age from 20 to 50 years of age. SUMMARY
The group was convened at a weekly parenting class, and the general mood was attentive but mostly unresponsive, and not very emotional. This may have been due to the fact that the participants were there to attend the parenting class and were not fully prepared to answer questions regarding CalWORKs services. KEY POINTS
The main concerns of the group were childcare and tutoring, medical help, and sources of information about obtaining services. Although participants were not very emotional about the issues, there were several outspoken individuals who seemed to reflect the mood of the group. There was consensus about the need for more assistance with medical insurance, finding a doctor, and receiving information on program services. FIRST – Childcare was the most significant concern. When asked what programs and/or services are most important in their lives, the participants stated that more childcare and tutoring is needed. Almost everyone in the room worked and raised children. They seemed eager to find out what resources were available to help care for their children. Five participants said that they need tutoring for their children. One mother asked, “Where can I find out about vouchers for day care?” Only five participants knew that funding was available for childcare. SECOND – Obtaining health care was another significant concern, with access to medical help and clinics mentioned most often. Three or four participants mentioned making visits to county hospitals for emergencies. One woman explained she waits many hours just to see a doctor. Several participants stated that many existing clinics in the community are storefront operations set up by

84 Running Out of Time
physicians and run by assistants. Not only was the quality of care at these clinics uncertain, but people had to pay for their visits.
One man who lived nearby said he did not know where the nearest clinic was located. Two women stated they had good experiences receiving help from the Department of Health Services and the Hubert Humphrey Medical Center. THIRD – Access to information about services was a major concern. Only one participant in the focus group knew that funds were available for transportation and car repairs. One participant asked where she could receive information about day care vouchers. One man stated that there are not enough people serving as liaisons for governmental organizations. Another man stated there was a need for more information to help in finding jobs. He noted that recently he had tried to apply for a job with the county and found that he did not qualify for any of the positions.
Focus Group #12 All People’s Christian Center, Los Angeles
May 14, 2002 NUMBER OF PARTICIPANTS
The focus group had nine participants: two women and seven men. SUMMARY
The meeting lasted approximately 45 minutes. Initially, only four or five participants shared their ideas and thoughts. The rest were uninvolved and sat listening. The morale of the group seemed low. By the end of the meeting the level of participation had increased slightly, but never to the point that the participants appeared to volunteer and discuss their ideas comfortably. Although some participants seemed interested in the discussion and were involved, others were indifferent and apathetic. At times, participants digressed and talked about other concerns, such as the activities of the police in their community. KEY POINTS
This was a parenting group whose members were mandated by the court to be present. This may have contributed to the low morale and limited participation. FIRST – The participants were not aware of available programs and services to help their families. One participant stated, “A lot of people don’t know about the kinship program. A lot of people don’t accept their own people (being involved in their problems) because it’s money out of their pocket.”

Focus Group Appendix 85
SECOND – Participants indicated that childcare was an important service to have available. The facilitator described how one participant was not able to afford childcare, so she had to stay home from work. THIRD – Participants indicated that they were aware of services such as Healthy Family, but that they were fearful of losing their Medi-Cal coverage. FOURTH – Three participants identified food stamps as an important program. Two participants rated food stamps as the most important service they received.
Focus Group #13 City Council Meeting Room, City of Bell
May 14, 2002 NUMBER OF PARTICIPANTS
Eight women participated in this focus group, which was conducted in Spanish and English. SUMMARY
The meeting took place in an auditorium used for City Council meetings. The group was small, but in the later part of the meeting a few more people walked in and gave their opinions on the issues discussed. Only one of the participants had received CalWORKs. At some points responses from the group were not easily forthcoming for issues raised by the facilitator. The number of volunteers and support for the group was almost equal to the number of participants. KEY POINTS
Among the issues mentioned most often was the need for more accessible public transportation. Most of the participants did not own a car and were entirely dependent upon public transit. One woman said that it was helpful for her to have a bus pass that she could use for her commute to work. FIRST – The need for extended Medi-Cal coverage was raised by a number of participants. They expressed concern about the limited access to health care that they had for all of the members of their families. Participants said that did not have any other viable alternative because the cost of private health insurance was far beyond their reach. More than one of the participants said that Medi-Cal coverage should be extended to include older children and working adults. “One has to go to Tijuana to be able to buy medication, we cannot afford prescription medication”. An unemployed woman, whose husband was incarcerated, said she could not get health coverage for both of her daughters. Only one of them was covered. She said

86 Running Out of Time
she did not know where to go for help for her sick daughter. She tried to obtain help through a radio program, and did not succeed. They were told she didn’t qualify. “ I don’t know where to go, I am all alone.” One of the young mothers said that the care received after child delivery is too short. “Health insurance covers the baby but not me.” SECOND – Access to affordable childcare services for working mothers or mothers attending programs or school was, according to the participants an important necessity. A young working mother said that day care centers are only open from 8 a.m. to 5 p.m., but because of her work and commute schedule she needed childcare from 7:30 a.m. to 6 p.m. Participants said that there were several childcare facilities available in their community and that they were indispensable, especially during the time the mother is training for a job. Teenage children were identified as a cause of great concern. A participant said she didn’t work for fear of leaving her 16-year-old boy alone at home. Another woman said, “(Teenage) children keep us from holding a job, we have to quit because of complications caused by them.” Participants said parents of teenagers had much difficulty getting a keeping a job, no matter how much effort they put into it. These mothers expressed concern their children might get involved in criminal activity and said they needed a program to keep teens off the streets. THIRD – The participant who had been in the welfare-to-work program said the training period was not long enough. She said that one week after receiving training she was told she needed to begin working 32 hours a week or she would not be able to stay in the program. She said she felt pressured to accept a job that wasn’t appropriate for her. Additionally she was instructed to fill out applications to obtain childcare while she was working. She said she worked and worked and never received the childcare. Later on she suffered a work-related accident and received disability. She went back to GAIN and was told that she didn’t qualify for the program anymore. Another participant said that it would be more helpful to have an on-the-job-training program. “It is very frustrating”, one participant said, “when you leave applications day after day and get no replies. They should help us get work.” The language barrier, limited work experience and lack of education and training, they all agreed, constituted the main obstacles in their effort to obtain employment. FOURTH – Participants said that the programs in themselves were not difficult to understand, but that the application process was fraught with obstacles. “They make you fill out hundreds of forms in English, and then they (the workers) don’t listen to you when you have a question or a problem”. Several participants said they felt intimidated by the DPSS bureaucracy and the hostile attitude sometimes

Focus Group Appendix 87
displayed by the caseworkers. “They are rude, always in a hurry.” “But there are some good workers who are very helpful, too.”
Focus Group #14 Catholic Charities, Los Angeles
May 14, 2002 NUMBER OF PARTICIPANTS
Three people participated in the focus group, two women and one man. SUMMARY
The focus group started out slow, because the participants were a little wary about how their comments would be used. However, as soon as the facilitator reassured them that all the information was to remain confidential they began to discuss the topics without restraint. Since there were only 3 participants, the discussion was one in which a rapport was soon established and became very animated. The women carried most of the discussion. KEY POINTS One participant said that she wished her caseworker would tell her more about the services available in the CalWORKs program. Another said that finding childcare for a child younger than two years old was difficult, and she suggested that some help be provided to locate suitable childcare services. FIRST – Participants described having unpleasant relationships with their worker. One participant stated, “My worker constantly loses my paperwork. She expects me to just fill out the forms time and time again – when she’s the irresponsible one.” Another explained, “Sometimes I get a worker that cannot speak English. One time I got another social worker to speak to my worker because I thought that maybe she could understand him better. But, even she couldn’t understand what he said.” The participants agreed that oftentimes caseworkers can be so “mean” that they make women cry. They also said that their workers put them on hold for too long and “act like you owe them something.” One of the participants described the difficulty of having a new caseworker assigned to her, “My worker changes her office hours without even notifying me. Sometimes I don’t find out from my new worker that my old worker is no longer helping me. I wish they would just pick up the phone and let me know these things.” SECOND – Participants said they often received conflicting messages from their worker about the rules of the CalWORKs program. They said this makes it difficult for them to understand the CalWORKs system. One participant said, “She told me

88 Running Out of Time
that they can help with paying for school for people who want to go to school. But when I told her that I already go to school she said that she couldn’t help with childcare. It doesn’t make sense if they want to encourage people to go to school.… They only help with certain schooling like cosmetology, but if you want to study something else they limit the kind of education they offer.” Another said, “My worker told me to find a job and that it was okay. So, I was working and they just cut me off. They tell me I’m gonna get childcare if I get work, but then it turns out worse because they take almost everything away. I never got childcare while I was working either.” THIRD – Participants said that their financial situation was unstable because the cash amount they received was not enough to “live off of.” One participant explained, “I need help with my bills. That’s something I would request from the program. I have a lot of bills in collection right now because even if I work, and get a little bit aid, it’s still hard to make it work.” Another participant stated, “It’s hard to pay for all your bills, your rent, and childcare on a low-budget. People think that people on welfare get a lot of money, but its not enough to live off.”
Focus Group #15 Centinela Valley Adult School Parenting Center, Lawndale
May 14, 2002 NUMBER OF PARTICIPANTS
Ten parenting center students participated in this focus group. All were either current or former CalWORKs recipients. SUMMARY
Participants prioritized childcare, job training/job search, and transportation as the services that were most important to them. Some participants said that the structure, guidance and motivation provided by welfare-to-work program was beneficial. As one person put it, “participants have to learn to be on time for appointments, dress appropriately, and learn to be job ready.”
Many participants agreed that affordable housing was a significant concern not addressed by the welfare-to-work program. There was general consensus that rents were too high in unsubsidized housing, and there were too few subsidized housing units available. Qualifying for and finally obtaining subsidized housing was said to be a complicated and lengthy process. Some participants said that job development services offered through the county were inadequate. They said it was difficult to access resources and information while job searching. Lastly, participants suggested that counseling services should be enhanced and expanded, particularly in languages other than English.

Focus Group Appendix 89
Participants cited several areas of concern about accessing services. In particular, they said it was very difficult to get adequate assistance if one could not speak English. They described waiting for help for hours while people who came in after them were seen. They also described being transferred from worker to worker if they called in, and not having their calls returned if they left messages. Some participants said it was unfair that low-income families, who do not receive cash aid, are not eligible for key services such as transportation and childcare.
Some participants described feeling discriminated against by county staff because of race, ethnicity, or language needs. One person described accompanying an aunt who needed services but spoke no English. They waited as others went ahead of them and had to strongly advocate for themselves before they were seen. The staff was not equipped to provide assistance in the language the aunt spoke, but seemed reluctant to allow the aunt her own interpreter. Others felt that many county offices were understaffed. Some felt that case managers lacked professionalism; that they took client concerns “too personally.”
While most of the participants said that the Welfare-to-work program was not difficult to understand, they did express concern over the lengthy paperwork process and the lack of flexibility that case managers or eligibility workers had. One participant described finding it difficult to comply with the many appointments and reports that participants needed to complete, and said that county staff should take a client’s work and school schedule into consideration when scheduling appointments. Because lack of transportation is an issue, some participants suggested that county services should be localized.
Participants described a number of obstacles to getting and keeping a well paying job. Some said that a college degree was necessary to move ahead and stressed that more financial support was needed to obtain that goal. The majority indicated that race/ethnicity impacted their ability to get a good job. Some stressed that lack of dependable childcare makes it very hard for them to work. Most participants cited difficulty in accessing information about job opportunities and training programs, and suggested doing outreach in community churches, schools, and local newspapers.
While participants agreed that family problems exist that get in the way of holding down a job, specifically domestic violence issues, no personal experiences were relayed. KEY POINTS FIRST – Participants strongly urged that clients should be treated as individuals. Case managers and eligibility workers should look at a client’s specific situation before imposing requirements or setting payments.

90 Running Out of Time
SECOND – Participants agreed there should be more oversight to make sure people who receive aid really need it, are using the services or funds received appropriately, and are in compliance with program requirements. Many participants shared that they knew of people who were “taking advantage” of the system. THIRD – Continued financial aid for those who want to continue their education resonated very strongly among a majority of participants. As stated earlier, many felt they needed a degree to become successful in the workplace. FOURTH – Participants said that county workers needed better training to work with a diverse cultural, and ethnic population. They stressed the need for bilingual case managers. Participants recounted how many monolingual people they know do not try to obtain services because they feel their needs will not be met, or they are unwilling to deal with the difficulty of trying to access services.
Focus Group #16 East Los Angeles Community Corporation, Los Angeles
May 14, 2002 NUMBER OF PARTICIPANTS
Sixteen English-speaking Latino women attended this focus group. SUMMARY
The participants appeared happy and eager to answer any questions, and wanted to voice their concerns over the CalWORKs program. The focus group went well, and followed the format laid out by the facilitator. Prior to the focus group the participants had a pizza party and appeared to be a close group. At the end of the focus group the facilitator had the recorder read back the notes to the group and had the participants rank the key points. KEY POINTS
Participants in the focus group generally appreciated the program and said that they benefited greatly from the educational services provided by CalWORKs but that they would benefit more from additional educational training. They seemed motivated to continue their education.
A major concern was the treatment they received from the county caseworkers. They recalled instances where their aid was lowered without any prior notice and when they approached their county caseworker about it, the caseworker’s response was delayed and often offered no useful information to help the participants. One participant has been waiting three months to receive her

Focus Group Appendix 91
financial aid. Participants did acknowledge that their GAIN caseworkers were very helpful and understanding. They also identified a need for a better housing program. FIRST – Participants Said they needed extended educational training. Although educational services were accessible, participants said that the two years of education was not enough for the types of jobs they wanted to pursue. Some of the jobs these participants wanted to pursue included fingerprint technician, county worker, alcohol abuse counselor, and child development. One participant said, “We want an opportunity to get a higher college degree.” Participants also expressed concerns over getting textbooks. They said that students often have to share textbooks and some have failed their classes because of this. Consequently, if a student fails a subject during their GED program the student then has to pay for that class her/himself. Participants also said that the current three-month vacation was too long and they begin to forget all that they had learned. One participant said, “We want to work straight through. Can’t you send us to other schools?” SECOND – The participants said childcare should be extended to their older children. Participants said it was very difficult for them to find supervision for their children while they are in class. One participant said, “My kids stress me out. Now that they are older they are not eligible for childcare and they are beginning to run around with the wrong crowd. We need more programs for teenagers. I’m in class until 6:00 p.m. and I can’t supervise my kids.” Another participant said, “Sometimes I have to work on the weekends and I have no one to watch my baby.” One woman said, “I need help with my kids. Two of them are on medication and another one has cystic fibrosis.” THIRD – Participants said that lack of transportation made it difficult to attend their meetings and classes. One woman said, “I have to walk 40 minutes to attend a meeting.” Another participant said that she had to pay for transportation on the bus herself. While another participant said she frequently had to look for a ride to meetings and classes. FOURTH – Participants said there was a need for more flexibility in CalWORKs. One person said, “They don’t take our individual circumstances into account. Caseworkers need to better understand our circumstances.” Another woman said “They schedule our medical appointments when we are supposed to be in class. There is no flexibility to reschedule.” FIFTH – Participants said they had a good understanding of the program procedures but acknowledged that some people might feel intimidated and don’t know their rights and are afraid to ask questions.

92 Running Out of Time
Focus Group #17
Fresh Start, Los Angeles May 14, 2002
NUMBER OF PARTICIPANTS
Six male participants attended this focus group. SUMMARY
The focus group conveyed a sense of general frustration. Although the facilitator tried to keep the group focused on the questions, the discussions tended to drift into other areas. These other discussions seemed to express the overall frustration of the participants. In addition, one participant dominated the discussions, as the other participants seemed to lack interest or felt reluctant to participate. The men participating in this focus group were ex-felons. KEY POINTS
When specifically asked about the CalWORKs, the participants were not well informed about the services it provided, nor did they appear to be receiving any kind of aid or training directly from CalWORKs. This may have led to their confusion and lack of responsiveness when questions were asked about CalWORKs. FIRST – Participants were most concerned about job training and access to employment. One participant said, “They don’t help me get a job. They just tell me (that) I better find one. The department of rehab couldn’t do anything for me. I wanted to work with computers.” Another participant said, “I haven’t had any vocational or educational training. I don’t know where to find these services.” One participant suggested, “CalWORKs should have training in different types of unskilled labor such as truck driving, training in forklifts and warehouse work.” One participant expressed, “Felons with disabilities like me can’t get jobs. We need training and a chance to work. Some of us can’t read or write. We need to be educated.” One participant said, “I had a job for two years and when the company was bought out I was laid off. I couldn’t get a job anywhere so I had to start hustling again. After September 11 a lot of ex-felons in job programs got laid off especially those that worked in security.” Another participant said, “Many employers don’t know about the federal programs that let them hire ex-felons as tax write-offs.” SECOND – Another major concern was the quality of service and attention they received from county workers. One participant said, “County workers need to be trained in how to deal with people. They need training in courtesy. When we ask them for financial aid they act as if we’re taking their money.” Another participant

Focus Group Appendix 93
commented, “They shouldn’t be telling us what to do. They should try to help us. It’s as if SSI doesn’t want us in the program. My caseworker didn’t process my papers for six months and I didn’t get any services after that because they said it was too late.” Yet another participant said, “They need to hire more people and give us more individual attention. There is always long lines and they never answer their phones.” THIRD – Participants expressed concern about the lack of information available to them regarding services for which they are eligible. A participant said, “We have no information about the services. We need to be given a list.” FOURTH – Participants were also concerned with their responsibility to pay child support. One participant suggested, “There should be a program that finds us a job and automatically deducts the child support from our paychecks. Incarceration is not the answer. I can’t pay child support and take care of my son from jail.”
Focus Group #18 Pacific Clinic, Santa Fe Springs
May 14, 2002 NUMBER OF PARTICIPANTS
Sixteen people participated in this focus group, all female. SUMMARY
The focus group discussion started out quickly, with many participants actively engaged in offering their views about the CalWORKs program. However, in the middle of the session, the group slowed down, with only three or four of them still actively involved with the discussion. The group had a livelier ending when a few other participants joined in the discussion. On several occasions, the participants expressed thoughts that were irrelevant to the questions, venting their emotions. KEY POINTS
In general, the focus group went well. There were times participants digressed and talked about matters that were unrelated to the facilitator’s questions. However, much information was obtained. The overall emotional tone of the group was a mix of frustration with the way the system is run, along with a high level of satisfaction with the quality of mental health services they were receiving. Several participants cried or came close to tears while sharing stories about their past.
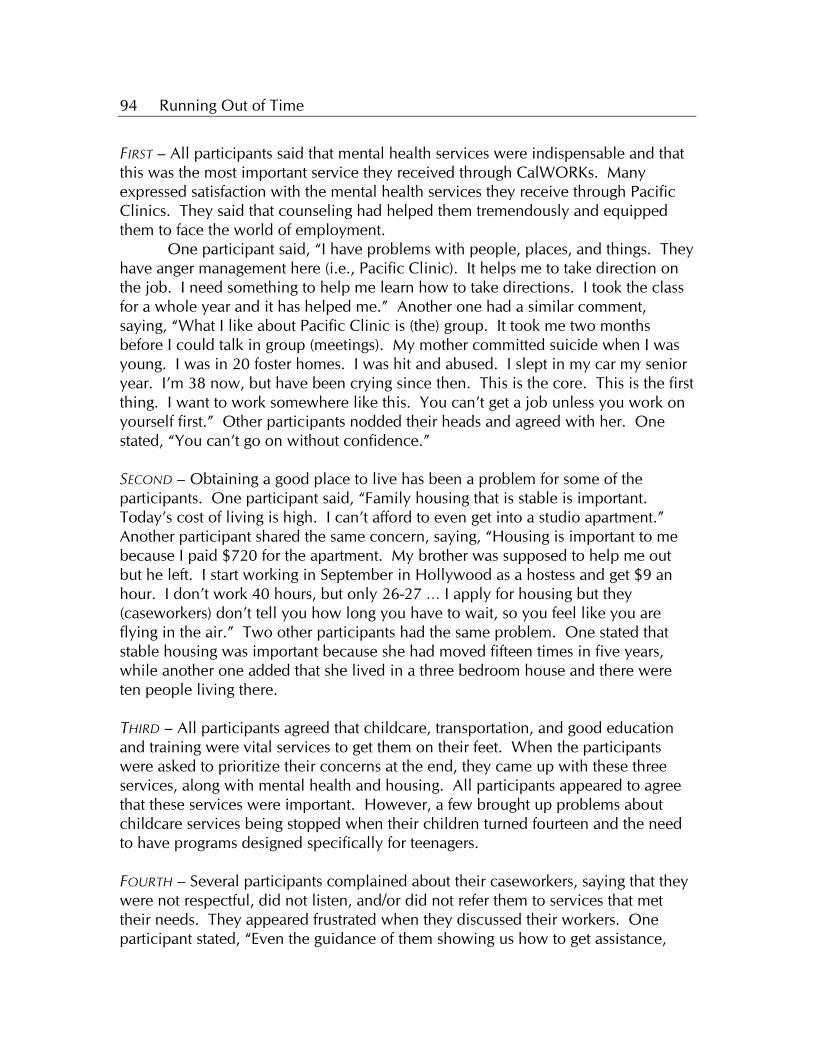
94 Running Out of Time
FIRST – All participants said that mental health services were indispensable and that this was the most important service they received through CalWORKs. Many expressed satisfaction with the mental health services they receive through Pacific Clinics. They said that counseling had helped them tremendously and equipped them to face the world of employment.
One participant said, “I have problems with people, places, and things. They have anger management here (i.e., Pacific Clinic). It helps me to take direction on the job. I need something to help me learn how to take directions. I took the class for a whole year and it has helped me.” Another one had a similar comment, saying, “What I like about Pacific Clinic is (the) group. It took me two months before I could talk in group (meetings). My mother committed suicide when I was young. I was in 20 foster homes. I was hit and abused. I slept in my car my senior year. I’m 38 now, but have been crying since then. This is the core. This is the first thing. I want to work somewhere like this. You can’t get a job unless you work on yourself first.” Other participants nodded their heads and agreed with her. One stated, “You can’t go on without confidence.” SECOND – Obtaining a good place to live has been a problem for some of the participants. One participant said, “Family housing that is stable is important. Today’s cost of living is high. I can’t afford to even get into a studio apartment.” Another participant shared the same concern, saying, “Housing is important to me because I paid $720 for the apartment. My brother was supposed to help me out but he left. I start working in September in Hollywood as a hostess and get $9 an hour. I don’t work 40 hours, but only 26-27 … I apply for housing but they (caseworkers) don’t tell you how long you have to wait, so you feel like you are flying in the air.” Two other participants had the same problem. One stated that stable housing was important because she had moved fifteen times in five years, while another one added that she lived in a three bedroom house and there were ten people living there. THIRD – All participants agreed that childcare, transportation, and good education and training were vital services to get them on their feet. When the participants were asked to prioritize their concerns at the end, they came up with these three services, along with mental health and housing. All participants appeared to agree that these services were important. However, a few brought up problems about childcare services being stopped when their children turned fourteen and the need to have programs designed specifically for teenagers. FOURTH – Several participants complained about their caseworkers, saying that they were not respectful, did not listen, and/or did not refer them to services that met their needs. They appeared frustrated when they discussed their workers. One participant stated, “Even the guidance of them showing us how to get assistance,

Focus Group Appendix 95
education helps. I didn’t know a lot of things until I came here (to Pacific Clinic), such as programs offered through the Department of Housing and Urban Development. The social worker don’t tell you nothing.” Another participant said, “I tried going through the GAIN program, sitting in the office and making phone calls, but I said, wait a minute, my husband has cancer and I wanted time off, but they didn’t care … my worker just send me to a drug rehab program and I don’t have a drug problem.” Another participant said, “You call the same person in for the same thing. They say that I’m not eligible because my vehicle was running. But I needed to repair my car. I figure that they would give me the money to help me fix my car.” Other comments regarding the participants’ workers include: “They don’t give you the right information,” “They don’t give you respect,” and “It’s the attitude.” FIFTH – Several participants expressed their concerns about not being able to get “ahead” by working. Some described what they perceived as shortcomings in the “Job Club” program. Others recounted the reduction in financial assistance that occurred once they started working. Regarding Job Club, a participant stated, “Job Club is a joke. They are sitting there saying we don’t care what you get. They say you can get whatever. Job club is not a training program; it’s stressful.” Another one added, saying “Instead of putting it (the resources) in Job Club, why don’t they put it here.” One participant further stated, “Job Club acts as if you are stupid. They teach you how to brush your teeth, apply for a job and it turns out you don’t have the education for them to hire you.”
Participants voiced similar concerns regarding the theme of reductions in financial assistance. One participant shared, “They go by your gross income and they don’t go by what she makes and reduce what’s in her gross income. We get worse when we work. That’s kind of hard when you make $7 an hour.” Another one said, “When I didn’t work, I had good money. Now that I’m working, I got a letter in the mail telling me that I’m going to get $80 in food stamp when I used to get $200.”
Focus Group #19 Freedom 101, Los Angeles
May 15, 2002 NUMBER OF PARTICIPANTS
Six people, including five women, attended this focus group. SUMMARY
The focus group was made up of former and current welfare recipients. The meeting site was a small office. Participants and facilitator were seated around a

96 Running Out of Time
table. Participants spoke passionately about their experiences with welfare-to-work and the needs of their families and their community. KEY POINTS
Participants seemed comfortable and relaxed during the discussion. Though the subject matter was serious, most participants accented their comments with a certain amount of humor and levity. Participants discussed a few other issues in addition to the recommended questions. Some said that the lack of affordable housing was a serious issue. They described a 20-year backlog for Section 8 vouchers and the poor living conditions they experience in public housing. Others suggested that additional counseling services should be made available to families. One participant discussed the need for additional support for caretakers of family members. FIRST – Medi-Cal services and Food Stamps were a priority among most of the participants. One woman explained she couldn't survive without food stamps: "Without the food stamps I couldn't buy food because all my money went to rent and bills.” Another woman described her vital need for Medi-Cal: "I was able to get both hips replaced and have surgery on one foot. Without county, I wouldn't have received those services." Many participants are the primary caretakers for their grandchildren. One woman stated, "I need the Medi-Cal to keep them healthy."
SECOND – Participants stated strongly that programs for families with teenagers should be expanded and improved on. One participant said of the existing youth programs: "Some of these programs are so bad, I wouldn't leave my dog there." Another participant recounted, "a lot of parents will come and fill up the bus (of a neighborhood youth program) and they don't care where the kids are going. They just want them out of the neighborhood." Some participants listed some of the services families with teenagers needed: "Counseling, help with drug problems, activities, tutoring, services for kids with special needs." THIRD – In general, participants said it was difficult to maneuver through DPSS, because of the amount of paperwork required, the rigid rules they had to follow, and conflicts with staff. One person described her frustration with DPSS paperwork: "For the amount of money they give you, it's not worth it." Another complained that DPSS doesn't try to keep pace with the economy: "They don't even give you a cost of living increase with your check." Others said the phone hours DPSS of workers were insufficient: "They're not accessible by phone; it's always busy or no one answers." One participant described a problem she had with DPSS: "I told the worker I was permanently disabled and I had a doctor's note to prove it, and the next month I was cut off because I didn't go to GAIN. My worker didn't understand English

Focus Group Appendix 97
very well. I spoke to the Deputy Director to have the issue resolved." Another described her long wait for an appointment: "I had an appointment at 11 a.m. By 11:30 a.m. my worker hadn't come out. I knew she took her lunch at 12:00 p.m. I had to wait until she got back from lunch before I could see her." FOURTH – Participants were very concerned about the challenges of finding and keeping a job. One person stated a key problem to getting a job was, "A lot of people have felonies or misdemeanors, and we need programs to help them find work." Another was concerned that, "There aren't enough jobs in this area. We need to develop jobs, not just job skills." Others felt a big obstacle to getting a job was the low reading levels of many adults. "We need literacy programs for adults." One person discussed the need for job search training: "Most people do not know how to interview. They have to [learn to] sell themselves." FIFTH – Participants agreed that DPSS should be more accessible to local communities. A suggestion made by one person that all participants agreed with was: "I would like to see DPSS workers located in our community, so we can have access to them with specific needs and questions." Another described a benefit of having more localized workers: "Workers can get more information on families in their area and provide the right services." In general, participants said DPSS would have a more "hands on" approach by working in the community they serve.
Focus Group #20 Hathaway Family Resource Center, Los Angeles
May 15, 2002 NUMBER OF PARTICIPANTS
Twelve women attended this focus group, which was held in Spanish. SUMMARY
The group was composed of women who were beneficiaries of a food bank program. They also participated in ESL classes in the same facility. Unfortunately they had been waiting some time for the meeting to start. The meeting was short and they were rushed to get on with their day. Their participation was nevertheless animated and they seemed willing to share their concerns. The contact person from Hathaway was very helpful in facilitating the responses.
KEY POINTS
The participants’ main concerns were getting help in obtaining education (including English proficiency), job training, and employment opportunities, as well as getting more information about available service programs. They made it clear

98 Running Out of Time
that Medi-Cal benefits and childcare services were fundamental in supporting their effort to become contributing members of society. FIRST – Access to affordable childcare for working mothers was one of the main concerns voiced by several of the participants. They explained that in their community a day care center charged as much as $300 a week, an absolutely prohibitive amount. The reason they were able to attend ESL classes was that Hathaway provided childcare. They said they would not mind having to travel a longer distance to have access to it. “We need day care centers that are affordable so that we can work and not spend all of our earnings in paying for childcare.” They also said that after school programs to keep their children safe and away from the streets as well as summer programs that they could attend during the vacations would be a great help for working parents. SECOND – Participants said access to Medi-Cal benefits, in particular for the elderly and children was essential. A young undocumented mother of two children said that she was only getting Medi-Cal for one of her children, who was born here. The other one was in more need of medical assistance but did not receive it. When she applied she was turned down with no explanation. THIRD – Learning English and acquiring more education, they said, were fundamental for their ability to obtain employment. One of the participants who worked as an accountant in Mexico said she was qualified to take an accounting job, but because her English is deficient, she had been turned down. Another one commented on the fact that before the events of 9-11, it was easier to get a job not speaking the language, especially if it was manual labor or janitorial work. She said that it had become more difficult to get jobs that did not require language skills.
Another participant said that she needed help in obtaining employment. Private employment agencies charge unaffordable fees, but the participants said that they nonetheless needed assistance with job placement. “I have applied many times, spend the day going from place to place looking for work, and I don’t find anything. They don’t call me back.” A participant said that some work available in factories involves training on the use of machines. She said that they would not hire workers that had no previous experience. “I don’t understand why, when you can learn how to operate the machine in one day. It is more difficult now, it wasn’t like this before.” The lack of documentation, a driver’s license, or a high school diploma were also mentioned as impediments. FOURTH – Participants emphasized that they needed more information about how to access assistance programs. They noted that they felt intimidated by most workers. One of the women said she was very happy with her caseworker. Others retorted that there were some very good workers but the majority were rude and treated

Focus Group Appendix 99
them with disrespect. “They don’t tell us the reason why the cut the benefits. They say, you are out. I want to know what is it that I am not in compliance, but they will not tell me.” One of the participants talked about the “thousands of forms” they have to fill out. They are in English and it takes them many days before they can get help to fill them out. “Even when we find out about a program, we don’t know where to go or how to apply.”
Focus Group #21 Shelter First, Los Angeles
May 15, 2002 NUMBER OF PARTICIPANTS
This focus group was composed of eight women, and was held in English. SUMMARY
Shelter First is a reconditioned hotel that provides temporary housing for the homeless. The meeting took place in a meager lobby where the group could hear noise coming from the street and there was a constant stream of people coming in and out. A few feet away from the group people were making calls on a pay telephone. The emotional tone was charged. These women were angry, resentful, depressed. There was an effort to obtain responses from all of them but three or four of the participants did most of the talking. KEY POINTS FIRST – Access to available low-cost housing was the highest priority. Participants expressed the hope that they would be able to leave the hotel at some point, but said they see no viable way out. Most said that rent was out of their reach and shelters only accommodated them for part of the day. One woman related that she could afford to rent a single-room apartment and had tried to move out from the hotel, but that the landlord wouldn’t let her move in with her daughter on grounds that it was unlawful. She was frustrated to the point of tears wanting an answer, “How come they make us stay here, where we only have a room and a sink?” Another participant bitterly remarked that the kind of referrals they get through the government agencies are “worse places than were we are at now”. Another one related how after she had paid a fee for an apartment referral and having received a key, she found out that the apartment was already taken. She claimed that most of the agencies were a scam.
Visibly resentful, one of the women related how the shelters put them out in the street at 5 a.m. with their children and all their belongings. They were expected to send the children to school and spend the day searching for a job. They were

100 Running Out of Time
allowed back in at about 4 p.m., when the children got back from school. She mentioned that there was only one shelter that housed six women that allowed them to keep their belongings inside. Additionally, getting children enrolled in school without having a permanent address was often a problem. The young teenage mother said she was in constant fear that the Department of Children and Family Services would take her child away from her. ”They want to take them (the children) away just because we stay down here.” SECOND – Participants voiced a lack of trust in the system, describing difficulties they had encountered in obtaining assistance based on their true needs. Several said they felt abandoned and neglected by the public assistance system. “They tell you about the programs but they do not implement them. They say they’ll provide childcare but I have to pay outrageous fees for it,” said one of them. Another participant expressed her despondency saying, “There are people that are abusing the system and have been on welfare forever, but we who really are in need get turned down.” “Social workers have blinders on, they only see one more person who wants to get on welfare, but they don’t really listen to you or understand your needs. They don’t look at me, who I am now. They look at my past, now I am willing to work.” Another one noted that social workers don’t have the skills to deal with people. “Some of them are of a different nationality and can’t understand what we are saying.” A participant said she was holding a job while living in a park, she complained that her caseworker sanctioned her and got her out of the program when she got sick and was given disability by a doctor. ”They sanction you even when you are in compliance, they cut you off with no explanation.” Another one said that the GAIN program was like working for free. “You don’t get anything out of it.” In order to qualify for the program one of the women said that she had to lie and get in a domestic violence program, which she did not need. She said the rules were such that they were forced to lie in order to obtain assistance. THIRD – One of the mothers identified mental health services for herself as well as counseling and therapy for their children as much needed services. “These children suffer a lot”. “They are under a lot of stress” She said that they would benefit having access to an after- school programs for the children. One of the women said the reason she wasn’t able to hold a job was because of depression, difficulty in concentrating, emotional problems. “I can’t even fill out an application, I’m a nervous wreck”. The need to get help in gaining self-esteem was also expressed, “People treat me as if I am less than them, and I lose my temper. That is why I have trouble keeping a job. I sound like I am tough, but I am not going to hurt anyone, I just have trouble controlling myself,” said another participant.

Focus Group Appendix 101
FOURTH – The participants said that access to affordable childcare and transportation, were essential for enabling them to go out searching for a job. They also pointed out that the time frame that they were given to find a job was too short. They said they could not possibly be ready and get all their needs taken care of in the time limit they were given. A mother of seven children said she would be willing to take a night job but that it was difficult to go out job searching without being able to afford childcare. The fact that some of them had criminal records posed an additional obstacle in their effort to find a job. ”You get a job, and when you are about to get promoted, they find out and you are fired. We need employers that will take us in spite of our criminal record.”
Focus Group #22 South Bay Center for Counseling, El Segundo
May 15, 2002 NUMBER OF PARTICIPANTS
Twelve people participated in this focus group, including four women. SUMMARY
The focus group was comprised of recent welfare recipients. The facilitator asked all of the suggested focus group questions and allowed time for each participant to contribute. The group was held in a small meeting room, with participants seated in a circle. KEY POINTS
Participants all shared their opinions openly and seemed to have a clear sense of what had been helpful to them, and what services not available to them would have made a difference. Additionally, some participants expressed the need for more counseling services, parenting classes and support groups. Other participants described the difficulty of getting employment despite having a criminal record. FIRST – Participants all agreed that childcare services, and to a lesser degree transportation services, were most important to them. One woman stated, "When I got childcare, it made me more determined to get a job. Childcare was really important; it was the only service I received." Another woman was impressed by how easy childcare was to obtain, "Childcare was really easy, it came right away. They took care of it right away." Transportation aid proved very helpful to one: "I got a bus pass, and then I got a check every month for gas." One participant pointed out that other types of transportation assistance would be more helpful: "There should be programs that help me get my own transportation, because I was
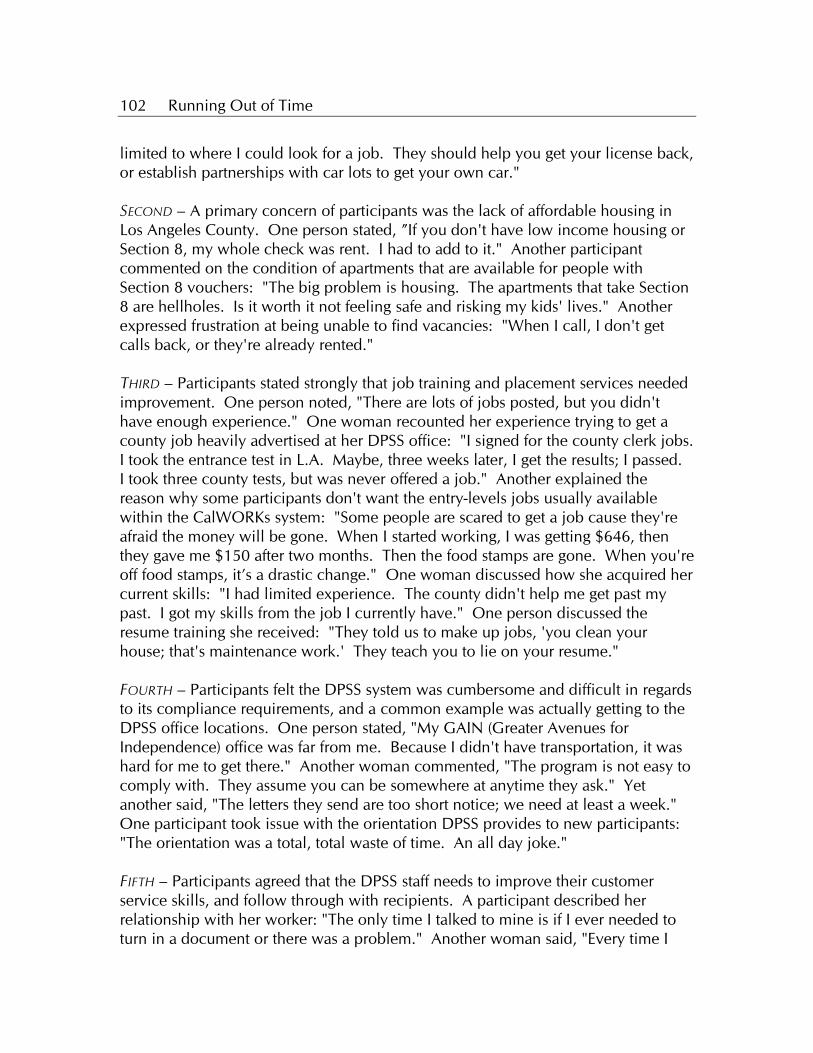
102 Running Out of Time
limited to where I could look for a job. They should help you get your license back, or establish partnerships with car lots to get your own car." SECOND – A primary concern of participants was the lack of affordable housing in Los Angeles County. One person stated, ”If you don't have low income housing or Section 8, my whole check was rent. I had to add to it." Another participant commented on the condition of apartments that are available for people with Section 8 vouchers: "The big problem is housing. The apartments that take Section 8 are hellholes. Is it worth it not feeling safe and risking my kids' lives." Another expressed frustration at being unable to find vacancies: "When I call, I don't get calls back, or they're already rented." THIRD – Participants stated strongly that job training and placement services needed improvement. One person noted, "There are lots of jobs posted, but you didn't have enough experience." One woman recounted her experience trying to get a county job heavily advertised at her DPSS office: "I signed for the county clerk jobs. I took the entrance test in L.A. Maybe, three weeks later, I get the results; I passed. I took three county tests, but was never offered a job." Another explained the reason why some participants don't want the entry-levels jobs usually available within the CalWORKs system: "Some people are scared to get a job cause they're afraid the money will be gone. When I started working, I was getting $646, then they gave me $150 after two months. Then the food stamps are gone. When you're off food stamps, it’s a drastic change." One woman discussed how she acquired her current skills: "I had limited experience. The county didn't help me get past my past. I got my skills from the job I currently have." One person discussed the resume training she received: "They told us to make up jobs, 'you clean your house; that's maintenance work.' They teach you to lie on your resume." FOURTH – Participants felt the DPSS system was cumbersome and difficult in regards to its compliance requirements, and a common example was actually getting to the DPSS office locations. One person stated, "My GAIN (Greater Avenues for Independence) office was far from me. Because I didn't have transportation, it was hard for me to get there." Another woman commented, "The program is not easy to comply with. They assume you can be somewhere at anytime they ask." Yet another said, "The letters they send are too short notice; we need at least a week." One participant took issue with the orientation DPSS provides to new participants: "The orientation was a total, total waste of time. An all day joke."
FIFTH – Participants agreed that the DPSS staff needs to improve their customer service skills, and follow through with recipients. A participant described her relationship with her worker: "The only time I talked to mine is if I ever needed to turn in a document or there was a problem." Another woman said, "Every time I

Focus Group Appendix 103
called him, he had no idea who I was. I would send him information, and he would lose it. He said he'd sign me up for transportation, and he'd never do it. He was always nice, but he didn't know who I was." One woman felt workers weren't available to their participants: "Two hours a day are the phone hours, and then she isn't at her desk when you call. Then you have to deal with rude receptionists. Supervisors are rude as well."

104 Running Out of Time

Focus Group Appendix 105
TABLE A-1
Key Points by Focus Group Site Location, Key Points, Language, and Service Planning Area of Focus Groups
Location Key Points Language Service
Planning Area
All Peoples Christian Affordable childcare English 6 Los Angeles Lack of healthcare in poor communities May 13, 2002 Unaware of program services All Peoples Christian Lack of healthcare in poor communities English 6 Los Angeles Affordable childcare May 14, 2002 Fearful of losing Medi-Cal Food stamps Community policing programs Alma Family Services Counseling/mental health programs Spanish 7 Pico Rivera Need education for better jobs May 13, 2002 Affordable childcare Extend Medi-Cal to entire family More education/job training City of Bell Extend Medi-Cal to entire family Spanish/ 7 Bell Affordable childcare English May 14, 2002 More education/job training Easier to meet program requirements Need transportation to go to school Catholic Charities Staff disrespectful/unhelpful English 6 Los Angeles Program difficult to understand May 14, 2002 Cash amount not enough Unaware of program services Lack of childcare services Castellar Elementary Miscalculations in grant amount Cambodian 4 Los Angeles Affordable childcare May 7, 2002 Extend Medi-Cal to entire family Help limited English speakers find jobs Program difficult to understand Centinela Valley Affordable childcare English 8 Lawndale More education/job training May 14, 2002 Improve public transportation Affordable housing Better job development Downey Adult School Affordable housing English 7 Downey Affordable childcare May 9, 2002 Counseling/mental health programs Need education for better jobs Need transportation to go to school Staff disrespectful

106 Running Out of Time
KEY POINTS BY FOCUS GROUP (CONTINUED)
Location Key Points Language Service
Planning Area
Epiphany Catholic Church, El Monte May 11, 2002
Affordable childcare Need transportation assistance Affordable housing Program staff disrespectful Program staff unhelpful
Spanish 3
ELACC CalWORKs Need education for better jobs English 7 Monterey Park Need teen programs May 14, 2002 Need transportation to go to school Easier to meet program requirements Don’t know rights; afraid to ask Freedom 101 Food stamps English 8 Los Angeles Need teen programs May 15, 2002 Easier to meet program requirements Assist ex-felons/addicts to find jobs Have staff in local community Fresh Start More education/job training English 6 Los Angeles Program staff disrespectful May 14, 2002 Unaware of program services Assist ex-felons/addicts to find jobs Goodwill Industries Program difficult to understand English 4 Los Angeles Program staff unhelpful May 13, 2002 Address needs of single parents Need job experience directly related to
training
Benefit reduction disincentive to work 4
Hathaway Family Center, Los Angeles May 15, 2002
Affordable childcare Extend Medi-Cal to entire family More education programs for non-English speakers Easier to meet program requirements
English
LACC Need education for better jobs English 4 Los Angeles Affordable housing May 7, 2002 Affordable childcare Program staff disrespectful Financial support to pursue education LACC Financial support to pursue education Spanish 4 Los Angeles Affordable childcare May 7, 2002 Easier to meet program requirements More education programs non-English
speaker
La Casita Affordable childcare English 7 Downey May 9, 2002
Need financial assistance while in rehabilitation

Focus Group Appendix 107
KEY POINTS BY FOCUS GROUP (CONTINUED)
Location Key Points Language Service
Planning Area
Lack of healthcare in poor communities Need counseling/mental health programs Assist ex-felons/addicts to find jobs Pacific Clinic Need counseling/mental health programs English 7 Santa Fe Springs Affordable housing May 14, 2002 Affordable childcare Program staff disrespectful Benefit reduction disincentive to work Queen of the Valley Unaware of program services English 3 Hospital Program staff disrespectful West Covina Need to find higher paying jobs April 28, 2002 Affordable childcare Legalization issues for immigrants Shelter First Affordable housing English 4 Los Angeles Easier to meet program requirements May 15, 2002 Counseling/mental health programs Affordable childcare Need financial assistance while in
rehabilitation
South Bay Center Affordable childcare English 8 El Segundo Affordable housing May 15, 2002 Assist ex-felons/addicts to find jobs Easier to meet program requirements Program staff disrespectful Virgil Middle School Fearful of losing Medi-Cal insurance Spanish 4 Los Angeles Benefit reduction disincentive to work May 2, 2002 Program staff disrespectful Easier to meet program requirements Need childcare for non-traditional work
hours

108 Running Out of Time

Focus Group Appendix 109
FOCUS GROUP QUESTIONS
The following questions were suggested as focus group discussion topics, and were reviewed during the training for focus group facilitators. 1. In your experience, what are the most important services that the County
Welfare to Work program provides for you? Helping with childcare? Helping with transportation? Helping with education and job skills training? What about some examples of ways in which the Welfare-to-work
program has helped you? 2. What services do you need that the Welfare-to-work program does not provide
for you? Affordable housing? Job development services? Counseling services? Mental health services?
3. What experiences have you had while accessing services from your Welfare-
to-work program? How accessible are these services? Are some services easier to get than others? Do you receive services in a timely manner?
4. How is your relationship with the Welfare-to-work staff?
With your case manager? Do you trust or feel comfortable with your case manager? If no, why
not? Do you feel your case manager listens to you and is effective in
addressing your concerns? 5. Is the Welfare-to-work program difficult to understand, or difficult to comply
with? 6. In your experience and the experience of others you know well, what kinds of
problems do people face in getting a job that can support their family? Are there any other major problems or obstacles that prevent you from
getting and keeping a good job? Limited education or ability to speak English?

110 Running Out of Time
Limited job skills? Limited job experience or ability to get the necessary job experience?
7. Are there things in your personal life that you feel get in the way of holding
down a job? Care-taking duties for family members that prevent you from working? Family problems?
8. Is there anything else you would like to say that we haven’t talked about yet?

Appendix 2
Survey Methodology Appendix BACKGROUND
The community survey initiative was developed by a broad coalition of community organizations as an instrument for learning directly from families who receive public assistance about the kinds of help they need to become economically self-sufficient. Many stakeholders had a voice in this process and substantial effort was made to arrive at a consensus about what should be in the survey.
There were two components to this effort: (1) a survey questionnaire, (2)
focus groups with CalWORKS parents. SURVEY QUESTIONNAIRE
The survey questionnaire was designed to be self administered in public settings by adults with average and below-average levels of education. To be workable in this context it was designed to be simple, clear, and short. The three broad areas it covered were:
1. Priorities for how the county should use welfare-to-work resources to help parents become self-sufficient.
2. Immediate barriers to employment. 3. Background information about the respondents for identifying the
priorities and needs of different groups of people, and also for assessing the representativeness of the survey respondents.
Survey collection at each site began with an introductory statement by the
person distributing the questionnaire that informed respondents that the survey taker was from a community organization and not from a county department. The questionnaire (attached below) began with an introductory statement explaining that the survey was voluntary and confidential. The survey questions consisted of two extensive multiple option questions and ten brief self-descriptive questions. The purpose of the self-descriptive questions was to obtain information, without being intrusive, that characterized respondents in terms of major factors that predict employment outcomes, as well demographic diversity within the county. Wording for the self-descriptive questions was adapted from the US Census questionnaire. Most survey questionnaires were distributed through one-on-one contacts between survey takers and respondents, so the return rate on distributed questionnaires was close to 100 percent.

112 Running Out of Time
The survey questionnaire was pilot tested with two groups of current and
former CalWORKS parents, one of which spoke English and the other Cambodian. Results from both pilot tests were used to fine-tune the final questionnaire.
The two multiple option questions were kept as simple as possible and did
not include instructions to provide prioritized responses or to select a fixed number of options because past experience as well as the pilot tests have shown that these constraints reduce the number and consistency of completed responses. When seeking self-administered survey responses from people who have average and below-average levels of education, it is important that any list of choices be succinct and allow for simple responses. When respondents are asked to identify priorities some people will do it, some people will check everything that they think is important, and some people will skip the question because it seems too hard. Analysis of these kinds of inconsistent and incomplete responses becomes problematic, with much information discarded, or else inconsistent information used together with questionable validity.
The final survey questionnaire was validated through consultations with stakeholders, pilot tests with CalWORKS parents, and training sessions with individuals who were responsible for conducting the survey.
Each of the eight Service Planning Area Councils was asked to survey a cross section of at least 300 local CalWORKS parents. The survey process was also open to working poor parents who were not CalWORKS parents. Two questions on the survey made it possible to analyze these non-recipient respondents separately from CalWORKS parents.
The Los Angeles Children’s Planning Council provided central control for the survey process. Questionnaires were produced separately for each survey event on different colors of paper, with the date and location of the event identified atop the questionnaire. Completed questionnaires were returned to the Council within 24 hours. The Council then stamped each questionnaire with a unique number, photocopied it, and transmitted the original copies to the Economic Roundtable for analysis.
Completed questionnaires were reviewed at intermediate points during the survey process to assess the representativeness of the survey sample as well as major trends that began to emerge in the responses. This information enabled mid-course corrections to be made in the selection of survey sites and respondents, ensuring representativeness as well as identifying issues worthy of being explored in greater depth in focus groups.

Survey Methodology Appendix 113
Date Survey Location
Family Needs Survey This survey of family needs will be used to plan social service programs.
This survey is voluntary and your answers will be kept completely confidential
1. What are the most important things the County should do so that you can get a job that will support your family? (mark the MOST important things)
Help working parents pay for child care. Help working families get safe and reliable transportation. Create good paying jobs for welfare parents. Provide education and job skills training programs. Make sure people receive health care if they qualify for
insurance or Medi-Cal. Provide counseling for domestic violence, mental health,
substance abuse, and other family problems. Provide programs to help teenagers. Provide programs to help families stay together. Provide information about where to find good paying jobs. Provide emergency help for families facing eviction. Give clear information about CalWORKS requirements. Provide research on needs of families. Provide staff training for welfare workers. Other ______________________________________
2. Please identify any problems you have right now that
keep you from having a good paying job? No problems. Limited education. Limited English. Limited job skills. Limited job experience. Lack of day or night care for children 1 to 13 years old. Lack of after school care for children 1 to 13 years old. Lack of affordable, safe and reliable transportation. Lack of affordable, decent housing. Personal health problems. Responsibilities for family members who cannot take care
of themselves. Family problems such as domestic violence, depression
or substance abuse. Risk of older children getting into trouble. Lack of proper clothing for a job. Need information about services the county can provide. Need help getting connected with county services. Other ______________________________________
3. Do you receive CalWORKs welfare benefits now? Yes No
4. Have you received CalWORKs benefits in the past 2 years? Yes No
5. What is your sex? Female Male 6. What is your age? ________ years 7. a. How many children live with you? _____
b. Mark the ages of children living with you 5 years or younger 6 to 11 years 12 to 17 years 18 years or older 8. a. Do you speak a language other than
English at home? Yes No Skip to 9
b. If yes, what is this language? _____________________________________
c. How well do you speak English? Very well Well Not well Not at all 9. How many years of schooling have you
completed? ___________ years 10. Are you a single parent? Yes
No 11. a. Are you currently employed? Yes No b. Did you work during any part of last year? Yes No c. If yes, how many weeks did you work in
the past year? ____________ weeks
12. What is your race or ethnicity? African American Asian Latino Native American or Alaskan Native Pacific Islander White Other _________________________
Are there other needs you would like to talk about? _____________________________________ _________________________________________________________ (Please continue on other side)

114 Running Out of Time
FOCUS GROUPS
Information from the survey questionnaire was augmented by 22 focus groups with CalWORKS parents. The purpose of the focus groups was to obtain in-depth, open-ended information that added context and completeness to survey data. The focus groups used a semi-structured interview format. Focus group facilitators were provided with seven broad questions (contained in the Focus Group Appendix) to investigate based on input provided from stakeholders. The questions could be adapted to the interests and needs of specific focus groups. Each focus group was recorded by a note taker (the “recorder”) who produced a summary of the discussion, listed the five most important issues discussed, and provided detailed examples from the statements of participants to illustrate each issue. Recorders also gave feedback on how successful the focus group was in obtaining the genuine views and experiences of participants. TRAINING
Three training sessions were conducted for survey administrators, focus group facilitators, and focus group recorders. The sessions provided cross training in each of the three survey roles (survey administrators, focus group facilitators, focus group recorders) so that each person in this process can support the integrity and effectiveness of the overall effort. Topics covered in the training included:
Survey questionnaire administration Focus group facilitators Focus group recorders
1. Overview of the survey.
2. Uniformity in survey administration.
3. Avoiding introduction of bias.
4. Neutral presentation of material.
5. Practice administering the survey.
6. Discussion of questions likely to arise.
1. Being a good conversation leader who gets other people talking.
2. Creating trust and openness.
3. Allowing people to tell their own stories.
4. Giving everybody a chance to talk.
5. Covering all seven focus group topics.
6. Making sure that the session is recorded.
1. Taking detailed notes.
2. Being respectful, neutral, unobtrusive, and objective.
3. Conferring with the focus group facilitator afterwards.
4. Producing a 2-page summary describing the 5 most important issues discussed.
5. Returning the summary to the Economic Roundtable within 48 hours.

Survey Methodology Appendix 115
OPEN-ENDED QUESTION CODING SYSTEM The survey questionnaire contained three open-ended questions where respondents could offer further feedback than the initial choices listed. (See the last check boxes for questions one and two, plus space for comment at the bottom of the survey). The following coding system was developed in order to capture these responses, and was prepared by Vanessa Lee, a project volunteer. 1 General need to strengthen program/increase funding to program 10 Childcare
11 General lack of 12 Needs free or affordable childcare 13 Problems with payment to care providers being on-time 14 Need childcare hours for non-traditional work schedules 15 After school care/programs for children/youth 16 Teen programs 17 Maintain status quo availability of childcare
20 Transportation
21 General lack of 22 Need in order to get to school (for the adult) 23 Need in order to get to counseling services 24 Need better transportation for children 25 Need assistance in getting a driver’s license 26 Improving bus/public transportation 27 Need affordable car insurance
30 Education/Job Training
28 Wants relaxed time limits on education 29 Needs to have continued support for costs in pursuing
education/training (e.g., supplies being paid for) 30 Needs more education/training programs 31 Wants education rather than work first 32 Experienced the tensions of pursuing education vs. work 33 Believes that education/attaining a degree will lead to getting better
jobs 34 Need more education/training programs for limited English proficient
persons (e.g., computer courses)

116 Running Out of Time
40 Finding a Job 41 Needs better connection between job seekers and employers 42 Needs better connection for job seekers to find jobs in the community
where they live 43 Needs programs to find better jobs for those with limited English skills 44 Needs jobs that have flexible schedules to accommodate caring for
children 45 Higher paying jobs 46 Experienced age discrimination 47 Disability causes a barrier 48 Experiencing harassment/discrimination on the job 49 Need to have permanent jobs
50 Counseling/mental health 51 Needs programs for family counseling
52 Improving self esteem 53 Provide counseling/information on family planning 54 Need for substance abuse counseling
60 Overall CalWORKs Program Access
61 Understanding requirements of the program needs to be clearer 62 Meeting the requirements of the program needs to be easier 63 Wants to eliminate time limits 64 Office accessibility
70 Housing
71 General lack of 72 Needs affordable housing 73 Needs permanent housing 74 Experienced discrimination by landlords due to children in the family 75 Difficulty in getting section 8 76 Believes that housing and welfare should go hand-in-hand
80 Healthcare
81 Needs health insurance coverage 82 Concerned over Medi-Cal eligibility 83 Problems with Medi-Cal always being denied 84 Lack of available healthcare within poor communities
90 Interaction with workers
91 Encountering discourteous/disrespectful staff 92 Encountering incompetent staff

Survey Methodology Appendix 117
93 Experience being denied assistance by staff 94 Workers are being changed frequently 95 Increase bilingual staffing
100 Monthly grant
101 Needs an increase in grant allotment 102 Experienced miscalculations in grant amounts (over and
underpayment) 103 Concern over children’s eligibility being maintained 104 Receive proper notice of changes to grant size
110 Getting personally involved
111 Interested in becoming politically involved 112 Wants a supportive system of participants (buddy system) 113 Wants to help/information on helping immigrants receive benefits
120 Safety, Security and Well-being
121 Criminal justice system issues (i.e., assisting felons) 122 Child support: District attorneys need to work harder to locate fathers 123 Food stamps/programs related (i.e., maintaining eligibility) 124 Legalization for immigrants 125 General family well-being 126 Improve quality of education and schools 127 Concern over growing gang violence 128 Concern over the safety of schools 129 Wants programs to get homeless/mentally ill people off the streets 130 Single parents needs
140 Domestic violence
141 Family law counseling 150 Senior citizen/disability
151 Income maintenance 152 Access to SSI benefits 153 Help with disabled children
200 General positives of the program
201 Likes the enforcement mechanisms of the program

118 Running Out of Time
Some of the materials used to train survey questionnaire administrators, focus group facilitators and focus group recorders are included below to further document how this survey was carried out.
FAMILY NEEDS SURVEY BACKGROUND
The Family Needs Survey will be administered to get an overview of the current state of the CalWORKs program in Los Angeles County. The survey will make it possible for the procurement of information about CalWORKs’ participants concerns about the program.
The Family Needs Survey was constructed so that it meets the following requirements:
• The questions cover all of the desired subjects. • The survey is not too long so that people feel they can finish the survey in a
reasonable amount of time. • The survey is understandable for those taking it. • The survey asks questions in a sensitive and unbiased way.
Many organizations and individuals with interests in community concerns gave feedback to the survey questionnaire. As much as possible, given the constraints of time and limited resources, their concerns were incorporated into the survey. Once the survey format was finalized, the survey was field tested with groups of people who are the same as those who would be taking it, or as similar to those people as possible. This feedback was important in determining if the survey was appropriate to be given to a larger population of CalWORKS participants.
The initial intended outreach of the survey questionnaire is 1,000 CalWORKS participants in Los Angeles County. There will be an attempt to sample based on matching survey participants with Los Angeles County CalWORKS participants on characteristics of geography, ethnicity, and gender. This will allow for better generalization of survey results to reflect the issues and concerns of the entire CalWORKS population in Los Angeles County. All attempts to minimize bias in the sampling and survey administration procedures will be employed by the appropriate training of all project personnel, to include focus group facilitators, survey administrators and focus group recorders.

Survey Methodology Appendix 119
SURVEY QUESTIONNAIRE ADMINISTRATION PROCEDURES • Service Planning Area Council leaders will contact Cori Shepherd at the
Children’s Planning Council (CPC) to let her know which events they plan to survey and the number of surveys needed. Survey batches for each event will be preprinted with the event, Service Planning Area number, date, and person to be administering the survey. The survey batches will be copied onto different colored sheets of paper for separate events, for easy identification.
• Cori Shepherd at the CPC will be keeping a master calendar of all events at which surveys will be administered. She will also keep a master contact list of Service Planning Area Council lead persons and survey administrators. These will be computerized files that can be updated and emailed. Service Planning Area Council lead persons will need to tell them at least 48 hours in advance (preferably longer) of any events and give them the following information: time, location, number of surveys needed, Service Planning Area number, person administering the surveys, and any additional personnel that would be needed to help in the administration of surveys.
• Cori Shepherd at the CPC will give the Economic Roundtable and all Service Planning Area Council leaders updated copies of the master calendar of events and a survey administration contact sheet. Any errors will be reported to and corrected by the CPC.
• Survey batches will be delivered to Service Planning Area Council leaders by Cori Shepherd at the CPC, or can be picked up at a mutually agreed upon site.
• Service Planning Area Council leaders will deliver the survey batches to survey administrators prior to the event, and confirm both before and after the event that the survey administration did take place. They will report this information to Cori Shepherd at the CPC.
• Survey administrators will pick up the surveys prior to the event, checking in with Service Planning Area Council leaders if any information about the event has changed. They will either provide or make arrangements for any additional personnel needed to administer the survey. This can be arranged via the Service Planning Area Council leaders, who will contact CPC if necessary.
• Survey administrators will briefly introduce the survey and explain why they would like people to fill it out. They will check to make sure that surveys are predominantly filled out by Welfare to Work participants in Los Angeles County. If necessary, survey administrators will read questions aloud to the audience or answer questions individually.
• As surveys are turned in, survey administrators will check to see that all questions are answered as completely as possible. If there are missing answers, survey administrators will politely request that participants answer all questions and offer to explain any questions that are not easily understood.

120 Running Out of Time
• These tasks can also be delegated to other persons helping to administer the survey, if the survey administrator is occupied.
• All of the surveys will be collected. If the date or location of the event has changed, please write the new date or location on the survey forms. Count to see that the number of surveys collected (with any blank surveys) is the same as the number of surveys originally received. If not, please attach an explanation.
• Survey administrators should check in with the Service Planning Area Council leaders to let them know if the event took place and of any problems with administering the survey. Survey administrators should deliver the surveys to Service Planning Area Council leaders within 24 hours.
• Service Planning Area Council leaders should contact Cori Shepherd at the CPC to let her know the event took place and the number of surveys received. They should deliver the original surveys to CPC within 24 hours at a mutually agreed upon site. They should also let CPC know of any problems in survey administration as soon as possible.
• Cori Shepherd at the CPC will log in any surveys received from Service Planning Area Council leaders and number the surveys. The CPC staff should copy the surveys received and keep the copies filed at the CPC office.
• CPC should deliver the original surveys to the Economic Roundtable for data entry within 48 hours of receiving the surveys, letting Economic Roundtable know of any issues in survey administration with any particular survey batch.
• Economic Roundtable will keep CPC updated on survey batches they have received and entered and let them know of any missing survey batches immediately.
ROLE OF THE FOCUS GROUP FACILITATOR
Before the Focus Group • Contact the recorder before the focus group and exchange information about the
date, time and location of the focus group. Let the recorder know about where parking is available and any possible safety concerns.
• Give the recorder contact phone numbers where you can be reached the evening before, the day of, and the time of the focus group in case the recorder needs to contact you regarding any problems. If you have a cell phone, please give the recorder your cell phone number.
• Discuss with the recorder your knowledge of the participants attending the focus group and of any issues to which the recorder should be particularly sensitive. Let the recorder know what type of clothing would be most appropriate for the focus group.
• Get to know your recorder.

Survey Methodology Appendix 121
During the Focus Group • Be aware of the dynamics of the conversation. • Keep track of time to ensure that participants will have time to answer all
questions completely. • Be a good conversationalist who gets other people talking. • Create trust and openness. • Allow people to tell their own stories. • Explore participants’ feelings in depth and avoid vague generalizations. • Ensure the full participation of everyone in the focus group. • Keep the conversation running smoothly and give everybody a chance to talk. • Develop rapport with participants and put them at their ease. • Cover all 7 focus group topics. • Do not try to influence the content of the conversation by indicating any
personal opinions. • Make sure that the session is recorded. Ask the recorder to summarize the major
points of discussion at the end of the session and gave participants a chance to give feedback about defining the most important points of the discussion.
After the Focus Group • Find a suitable location away from the focus group participants and debrief with
the recorder about how the focus group went and the key points that were covered.
• Discuss anything that did not go as anticipated and make sure that the recorder understands your concerns.
ROLE OF THE FOCUS GROUP RECORDER
Before the Focus Group • Contact the facilitator before the focus group and exchange information about
the date, time and location of the focus group. • Give the facilitator contact phone numbers where you can be reached the
evening before and the day of the focus group in case the facilitator needs to contact you regarding any problems. If you have a cell phone, please give the facilitator your cell phone number.
• Discuss with the facilitator any knowledge they might have about the participants attending the focus group and of any issues to which you should be particularly sensitive. Have the facilitator let you know what type of clothing would be most appropriate for the focus group.
• Dress, present and conduct yourself in a way that conveys respect for focus group participants.

122 Running Out of Time
• Get to know your facilitator. • If you have any problems that would prevent you from acting as recorder for the
focus group, contact the facilitator and contact Patricia Kwon immediately so that arrangements can be made to have another recorder take your place.
During the Focus Group • Write down the content of the conversation in participants’ own words as much
as possible. • Keep track of the major concerns of focus group participants. • If anything is unclear, please ask for clarification from the focus group
participant(s). • Be aware of the dynamics of the conversation. • Develop rapport with participants and put them at their ease. • Do not try to influence the content of the conversation by indicating any
personal opinions. • If anything is unclear, please ask for clarification from the focus group
participant(s). • Be an observer, not a participant, in the focus group. • Convey empathy for the participants without intruding into the discussion. • Be prepared to summarize the major points of discussion at the end of the
session and gave participants a chance to give feedback about defining the most important points of the discussion.
After the Focus Group • Find a suitable location away from the focus group participants and debrief with
the facilitator as to how the focus group went. • Discuss anything that did not go as anticipated and make sure to ask for
clarification on anything that is unclear. • Write-up your notes organizing focus group materials under the major (5 or less)
concerns of the participants. Also include a one-paragraph summary of how the focus group went and any concerns about how the focus group was conducted or if there were any problems during the focus group.
• E-mail your notes to Economic Roundtable within 48 hours of the focus group. Do not give your notes to anyone other than Economic Roundtable staff.

Appendix 3
Survey Location Appendix
Table A-2
Family Needs Survey Sites Survey Sites by Service Planning Area, Name of Location, and Venue Category
Service
Planning Area
Location Category
1 Antelope Valley Hospital Community 1 Child Advocates Office Community 1 Health Start Community 1 Latino Community Action Network Community 1 Newhall School Fair Community 1 Youth Services Community 2 El Nido Family Center Community 2 Glendale Com. College School 2 Glendale DPSS Welfare 2 Glendale DPSS Welfare 2 Industrial Areas Foundation Assembly Community 2 Neighborhood Legal Services Community 2 Pacoima Partners Community 2 Panorama City DPSS Welfare 2 Providers Collaborative Community 2 Santa Clarita Valley DPSS Welfare 2 Spring Health Community 2 Spring Health Expo Community 2 Valley Child & Family Clinic Community 2 Valley Child Guidance Clinic Community 2 Valley College School 2 Van Nuys Safety Fair Community 2 West Valley DPSS Welfare 3 Alhambra Adult School School 3 Basset School School 3 DPSS Telstar Welfare 3 El Monte City School School 3 El Monte Fair Community 3 GEM Community 3 Grandview Community 3 Hacienda School School 3 Industrial Areas Foundation Assembly Community 3 Our Savior Center Community 3 Parents Place Community

124 Running Out of Time
Service Planning
Area Location Category
3 Parents Place Info Fair Community 3 Pasadena College School 3 Rosemead High School School 3 San Gabriel High School School 3 Wilkerson School School 3 Worksource Community 4 Armenian Social Services Community 4 Bresse Foundation Community 4 Children’s Bureau Community 4 Chinatown Service Center Community 4 Community Counseling Community 4 DPSS Welfare 4 DPSS Lincoln Heights Welfare 4 DPSS Metro Welfare 4 Echo Park Silver Lake Peoples Center Community 4 El Centro Community 4 GAIN Welfare 4 Goodwill Lincoln Heights Community 4 Hathaway Family Resource Center Community 4 KYCC Community 4 LA Center of Law Community 4 LA Coalition Community 4 LACC School 4 SEIU Local 1877 Community 4 WIC Community 5 DPSS Welfare 5 DPSS Welfare 5 DPSS WLA Welfare 5 DST Head Start Community 5 GAIN Welfare 5 Oakwood Community 5 SMC School 5 Tutorial Program School 5 Venice Outreach Community 5 West LA College School 5 WIC La Cienega Community 5 WLA Com. College and Check Cashing Center School 6 All Peoples Christian Center Community 6 Catholic Charities Community 6 Compton Community College School 6 Compton DAC Meeting Community

Survey Locations Appendix 125
Service Planning
Area Location Category
6 Compton One Stop Community 6 DELACO School 6 Didi Hirsch Community 6 DPSS Welfare 6 DPSS Office Welfare 6 Fresh Start Community 6 Gethsemane Baptist Church Community 6 Girls Club of LA Community 6 His Sheltering Arms Community 6 Kepher Institute Community 6 Lynwood One Stop Community 6 Multipurpose Senior Center Community 6 South Central One Stop Community 6 Southwest College School 6 Youth Intervention Project Community 7 Alma Family Services Community 7 AltaMed Community 7 Annual Society Run/AICC Community 7 Bell Healthy Start Community 7 Belvedere DPSS Welfare 7 Downey Adult School School 7 DPSS Welfare 7 DPSS Cudahy Welfare 7 DPSS Norwalk Welfare 7 ELACC School 7 Helpline Community 7 La Casita Community 7 Legal Aid East LA Community 7 Metro East Welfare 7 Pacific Care Community 7 WIC Office Community 7 WIC Office Community 8 Beach Cities Health District Community 8 Centinela Adult School Parent Center School 8 Children’s Day, Little Tokyo Community 8 Compton DPSS Welfare 8 Crenshaw DPSS Welfare 8 DPSS Region 5 Welfare 8 First Church of God Community 8 HK Market Community 8 Roosevelt Elementary School Healthy Start School

126 Running Out of Time
Service Planning
Area Location Category
8 Seafood City Grocery Community 8 South Bay WIB One Stop Community 8 Stevenson Elementary School 8 Thai Health Fair Community 8 WIC Office Community 8 Willard Elementary School 8 WRAP Community

Appendix 4
Data Appendix
Table A-3 Number of Survey Respondents by Subgroup
Not all respondents answered all questions so some subgroups show fewer than the total of 8,536 respondents
CALWORKS STATUS SINGLE MOTHERS RECEIVING
CALWORKS 4,075 Current CalWORKs Recipients 737 Surveyed at Community
675 Received CalWORKS in Past 2 Years but Not Now 207 Surveyed at Schools 3,329 No CalWORKs Past or Present 1,721 Surveyed at DPSS Offices
SURVEYED AT DPSS OFFICES SURVEY VENUE 2,280 Current CalWORKs Recipients 2,556 Surveyed at Community 2,066 Not Current CalWORKs Recipients 1,041 Surveyed at Schools 4,939 Surveyed at DPSS Offices
ENGLISH FLUENCY YEARS OF SCHOOL 3,571 Very Good English 1,952 0-8 Years 1,351 Good English 1,957 9-11 Years 2,085 Limited English 2,249 12 Years 1,529 No English 1,168 13+ Years
EMPLOYMENT STATUS AGE 1,063 Currently Employed and Worked 26+ Weeks Last Year 1,721 18-24 1,325 Other Currently Employed 2,891 25-34 1,986 Not Currently Employed But Worked Last Year 2,201 35-44 3,501 Unemployed and Did Not Work Last Year 1,140 45+
FAMILY STATUS SEX 4,936 Single-Parent Respondents 6,836 Women 2,960 Respondents from Two-Parent Families 1,245 Men
AGE OF YOUNGEST CHILD NUMBER OF CHILDREN 4,253 5 or Younger 1,998 1 Child 1,987 6 to 11 Years 2,196 2 Children
838 12 to 17 Years 1,504 3 Children 1,376 4+ Children
ETHNICITY 1,971 African American
503 Asian 665 European American
4,659 Latino 57 Native American/Alaskan Native 47 Pacific Islander
219 Other

128 Running Out of Time

Data Appendix 129
Table A-4 – Page 1 of 6 Number of Respondents Selecting Each Item
Questions 1 and 2 of Family Needs Survey
ALL CALWORKS STATUSSINGLE MOTHERS RECEIVING
CALWORKS
PRIORITIES FOR SELF-SUFFICIENCY Responses to Question 1 Al
l Res
pond
ents
Cur
rent
Cal
WO
RK
s R
ecip
ient
s
Cal
WO
RK
S in
Pas
t 2
Yea
rs b
ut N
ot N
ow
No
Cal
WO
RK
s P
ast o
r P
rese
nt
Sur
veye
d at
Com
mun
ity
Agen
cies
Sur
veye
d at
Sch
ools
Sur
veye
d at
DP
SS
Offi
ces
All
Sin
gle
Mot
hers
R
ecei
ving
Cal
WO
RKs
Childcare 5,484 2,772 438 2,027 531 143 1,362 2,036Transportation 3,678 1,946 281 1,272 408 110 922 1,440Creating good jobs 5,464 2,868 436 1,913 532 140 1,384 2,056Education 5,610 2,650 458 2,227 502 120 1,279 1,901Health care 5,100 2,375 400 2,050 430 118 1,113 1,661Counseling for family problems 3,904 1,754 280 1,655 332 82 844 1,258Programs for teenagers 4,095 1,893 304 1,669 353 84 916 1,353Programs to keep families together 3,673 1,704 262 1,490 320 83 823 1,226Information for finding good jobs 4,799 2,311 384 1,864 436 103 1,090 1,629Help for families facing eviction 4,107 1,973 332 1,594 365 87 985 1,437Clear information about CalWORKs 3,373 1,713 268 1,228 321 95 841 1,257Research about family needs 2,898 1,401 204 1,134 271 67 669 1,007Training for welfare staff 3,201 1,589 231 1,221 294 80 792 1,166Other 353 177 29 133 27 6 96 129 BARRIERS TO EMPLOYMENT Responses to Question 2 No problems 842 365 70 373 55 19 169 243Limited education 3,081 1,565 256 1,163 336 79 677 1,092Limited English 2,853 1,319 197 1,183 217 55 553 825Limited job skills 2,443 1,332 193 846 347 84 548 979Limited job experience 2,882 1,501 227 1,051 336 99 630 1,065Day or night care for children 3,367 1,807 256 1,152 327 90 926 1,343After school care for children 2,056 1,155 164 653 253 70 547 870Lack of transportation 2,655 1,427 203 899 291 86 690 1,067Lack of housing 3,080 1,458 258 1,186 260 70 700 1,030Health problems 1,622 767 121 644 136 30 341 507Family care taking responsibilities 1,389 665 93 551 131 36 291 458Serious family dysfunctions 1,638 755 116 672 159 33 333 525Older children might get into trouble 1,802 857 153 684 176 47 381 604Lack of proper clothing 1,942 1,101 171 584 232 56 534 822Lack of information about services 2,294 1,108 172 916 233 47 495 775Inability to gain access to services 1,871 884 144 758 176 44 390 610Other 300 147 26 118 21 6 85 112

130 Running Out of Time
Table A-4 – Page 2 of 6
Number of Respondents Selecting Each Item Questions 1 and 2 of Family Needs Survey
SURVEYED AT DPSS OFFICE SURVEY VENUE ENGLISH FLUENCY
PRIORITIES FOR SELF-SUFFICIENCY Responses to Question 1 C
urre
nt C
alW
OR
Ks
Rec
ipie
nts
Not
Cur
rent
Cal
WO
RK
s R
ecip
ient
s
Com
mun
ity A
genc
ies
Scho
ols
DP
SS
Offi
ces
Ver
y G
ood
Eng
lish
Goo
d En
glis
h
Lim
ited
Eng
lish
No
Engl
ish
Childcare 1,688 1,360 1,674 549 3,261 2,470 924 1,232 858Transportation 1,119 791 1,196 422 2,060 1,676 565 828 609Creating good jobs 1,768 1,253 1,659 558 3,247 2,297 847 1,317 1,003Education 1,631 1,369 1,699 668 3,243 2,298 904 1,361 1,047Health care 1,422 1,252 1,580 609 2,911 2,037 825 1,270 968Counseling for family problems 1,088 958 1,204 461 2,239 1,504 665 995 740Programs for teenagers 1,163 969 1,295 471 2,329 1,573 688 1,067 767Programs to keep families together 1,062 892 1,112 421 2,140 1,430 571 960 712Information for finding good jobs 1,414 1,199 1,418 553 2,828 1,956 755 1,217 871Help for families facing eviction 1,256 1,058 1,184 408 2,515 1,702 622 1,018 765Clear information about CalWORKs 1,039 829 976 373 2,024 1,372 532 856 613Research about family needs 845 695 900 313 1,685 1,095 472 759 572Training for welfare staff 987 750 942 373 1,886 1,304 517 804 576Other 121 86 93 40 220 206 51 61 35
BARRIERS TO EMPLOYMENT Responses to Question 2 No problems 229 205 287 98 457 454 161 143 84Limited education 871 718 1,043 349 1,689 1,054 575 874 578Limited English 776 653 854 436 1,563 0 469 1,333 1,051Limited job skills 658 505 916 301 1,226 1,212 433 508 290Limited job experience 788 634 983 381 1,518 1,154 534 717 477Day or night care for children 1,140 832 942 312 2,113 1,161 580 892 734After school care for children 633 445 680 210 1,166 777 417 504 358Lack of transportation 834 592 823 284 1,548 1,042 388 664 561Lack of housing 920 792 861 342 1,877 989 474 869 748Health problems 457 396 497 190 935 508 257 480 377Family care taking responsibilities 370 308 468 168 753 408 253 410 318Serious family dysfunctions 428 415 516 191 931 436 301 511 390Older children might get into trouble 480 432 562 222 1,018 409 303 620 470Lack of proper clothing 652 427 611 164 1,167 907 331 403 301Lack of information about services 637 524 736 307 1,251 769 378 644 503Inability to gain access to services 501 457 582 246 1,043 541 334 549 447Other 111 79 76 25 199 159 39 55 47

Data Appendix 131
Table A-4 – Page 3 of 6
Number of Respondents Selecting Each Item Questions 1 and 2 of Family Needs Survey
LEVEL OF EDUCATION EMPLOYMENT STATUS
PRIORITIES FOR SELF-SUFFICIENCY Responses to Question 1 0-
8 Y
ears
9-11
Yea
rs
12 Y
ears
13+
Yea
rs
Empl
oyed
& W
orke
d 26
+ W
ks L
ast Y
r
Oth
er C
urre
ntly
Em
ploy
ed
Not
Em
ploy
ed B
ut W
orke
d La
st Y
r
Une
mpl
oyed
& D
id N
ot
Wor
k La
st Y
r
Childcare 1,148 1,321 1,569 753 676 885 1,323 2,227Transportation 789 870 1,031 486 440 568 837 1,560Creating good jobs 1,328 1,275 1,455 685 673 808 1,292 2,291Education 1,323 1,286 1,476 787 706 852 1,397 2,250Health care 1,185 1,176 1,312 699 659 818 1,170 2,049Counseling for family problems 977 896 957 517 486 627 912 1,567Programs for teenagers 989 986 1,022 521 554 667 916 1,624Programs to keep families together 907 832 917 471 452 548 860 1,512Information for finding good jobs 1,126 1,151 1,267 604 575 740 1,169 1,980Help for families facing eviction 987 971 1,046 538 481 636 1,000 1,689Clear information about CalWORKs 836 788 871 411 399 526 811 1,374Research about family needs 714 689 733 340 340 471 662 1,186Training for welfare staff 772 725 827 428 383 509 746 1,311Other 69 89 90 71 41 41 106 147 BARRIERS TO EMPLOYMENT Responses to Question 2 No problems 140 169 277 143 168 153 176 283Limited education 893 895 667 238 376 483 705 1,329Limited English 1,061 635 434 233 352 469 535 1,260Limited job skills 495 678 755 270 278 311 562 1,129Limited job experience 652 753 776 318 321 429 613 1,310Day or night care for children 836 833 861 394 370 498 821 1,452After school care for children 477 489 546 260 248 313 487 859Lack of transportation 679 633 669 301 257 349 653 1,201Lack of housing 881 673 704 347 341 464 767 1,270Health problems 459 343 356 198 160 223 341 741Family care taking responsibilities 382 305 308 158 166 218 285 596Serious family dysfunctions 508 331 344 172 168 259 348 709Older children might get into trouble 592 373 351 169 221 282 362 776Lack of proper clothing 423 493 553 220 167 231 483 905Lack of information about services 630 524 559 267 269 338 564 950Inability to gain access to services 566 398 426 199 211 278 470 765Other 59 54 82 77 34 33 89 129

132 Running Out of Time
Table A-4 – Page 4 of 6
Number of Respondents Selecting Each Item Questions 1 and 2 of Family Needs Survey
FAMILY STATUS SEX AGE
PRIORITIES FOR SELF-SUFFICIENCY Responses to Question 1 S
ingl
e-P
aren
t Fam
ilies
Two-
Par
ent F
amilie
s
Wom
en
Men
18-2
4
25-3
4
35-4
4
45+
Childcare 3,430 1,709 4,588 645 1,212 1,946 1,350 653Transportation 2,323 1,113 3,001 497 784 1,192 974 520Creating good jobs 3,369 1,732 4,485 746 1,058 1,845 1,501 750Education 3,314 1,910 4,547 820 1,108 1,886 1,515 774Health care 2,919 1,804 4,108 760 1,034 1,650 1,350 756Counseling for family problems 2,272 1,336 3,166 577 742 1,296 1,047 575Programs for teenagers 2,389 1,403 3,332 602 792 1,299 1,127 624Programs to keep families together 2,149 1,259 2,971 551 655 1,222 1,037 537Information for finding good jobs 2,823 1,647 3,916 667 997 1,602 1,268 653Help for families facing eviction 2,508 1,317 3,377 581 799 1,361 1,107 596Clear information about CalWORKs 2,129 1,007 2,759 463 676 1,106 913 484Research about family needs 1,732 962 2,347 435 535 931 804 454Training for welfare staff 1,955 1,022 2,625 455 590 1,052 885 474Other 211 125 286 56 77 99 98 67 BARRIERS TO EMPLOYMENT Responses to Question 2 No problems 469 316 627 168 205 259 185 124Limited education 1,849 1,032 2,532 406 615 1,051 841 401Limited English 1,459 1,175 2,312 410 375 941 879 481Limited job skills 1,527 779 1,960 382 562 823 601 346Limited job experience 1,686 1,014 2,327 426 676 974 701 364Day or night care for children 2,176 1,015 2,913 308 706 1,322 868 287After school care for children 1,391 546 1,757 205 374 791 575 204Lack of transportation 1,715 744 2,209 319 578 881 694 340Lack of housing 1,846 1,008 2,522 440 541 1,061 843 446Health problems 945 558 1,281 271 195 453 493 368Family care taking responsibilities 797 487 1,123 212 183 449 415 251Serious family dysfunctions 960 542 1,345 234 242 559 457 262Older children might get into trouble 1,063 590 1,494 232 191 572 623 295Lack of proper clothing 1,273 530 1,625 253 417 673 499 248Lack of information about services 1,365 786 1,834 375 408 767 628 368Inability to gain access to services 1,092 648 1,487 305 311 601 507 338Other 186 96 239 52 68 95 79 47

Data Appendix 133
Table A-4 – Page 5 of 6
Number of Respondents Selecting Each Item Questions 1 and 2 of Family Needs Survey
AGE OF YOUNGEST
CHILD NUMBER OF CHILDREN
PRIORITIES FOR SELF-SUFFICIENCY Responses to Question 1 5
or Y
oung
er
6 to
11
Yea
rs
12 to
17
Yea
rs
1 C
hild
2 C
hild
ren
3 C
hild
ren
4+ C
hild
ren
Childcare 3,018 1,276 462 1,357 1,445 1,018 888Transportation 1,863 887 377 891 920 663 614Creating good jobs 2,761 1,328 590 1,256 1,457 1,014 937Education 2,781 1,333 571 1,315 1,442 1,016 910Health care 2,528 1,161 544 1,250 1,319 906 773Counseling for family problems 1,919 913 405 925 994 698 630Programs for teenagers 1,919 992 501 925 1,019 767 692Programs to keep families together 1,792 880 392 826 939 691 616Information for finding good jobs 2,432 1,115 506 1,140 1,245 873 803Help for families facing eviction 2,063 976 436 998 1,025 738 714Clear information about CalWORKs 1,749 798 354 826 854 626 580Research about family needs 1,457 678 330 689 752 525 484Training for welfare staff 1,582 768 351 746 811 593 563Other 172 74 43 104 72 53 59 BARRIERS TO EMPLOYMENT Responses to Question 2 No problems 388 155 103 215 200 125 96Limited education 1,569 781 336 675 774 610 612Limited English 1,349 751 338 554 806 564 527Limited job skills 1,233 543 286 597 619 426 412Limited job experience 1,471 662 315 673 747 506 519Day or night care for children 2,114 828 197 793 953 703 653After school care for children 1,158 581 163 405 591 446 428Lack of transportation 1,415 650 255 635 705 477 470Lack of housing 1,612 726 318 678 783 603 582Health problems 644 427 227 378 392 281 270Family care taking responsibilities 640 355 184 263 343 274 286Serious family dysfunctions 807 416 169 319 412 334 318Older children might get into trouble 804 543 262 308 419 409 442Lack of proper clothing 1,053 440 209 443 498 374 365Lack of information about services 1,148 554 249 507 597 440 410Inability to gain access to services 913 443 218 400 459 363 353Other 148 72 27 79 79 49 43

134 Running Out of Time
Table A-4 – Page 6 of 6
Number of Respondents Selecting Each Item Questions 1 and 2 of Family Needs Survey
Ethnicity
PRIORITIES FOR SELF-SUFFICIENCY Responses to Question 1 A
frica
n A
mer
ican
Asia
n
Eur
opea
n A
mer
ican
Latin
o
Nat
. Am
er/A
lsk.
Nat
.
Pac
ific
Isla
nder
Oth
er
Childcare 1,442 175 426 3,012 36 34 144Transportation 1,108 130 254 1,884 32 22 100Creating good jobs 1,448 211 376 2,984 36 25 144Education 1,303 262 389 3,194 33 31 149Health care 1,230 209 380 2,865 24 28 139Counseling for family problems 889 126 255 2,299 28 18 106Programs for teenagers 1,023 140 239 2,341 23 20 106Programs to keep families together 927 116 221 2,073 26 17 109Information for finding good jobs 1,176 201 361 2,679 25 25 125Help for families facing eviction 1,057 115 276 2,307 31 22 115Clear information about CalWORKs 904 90 208 1,889 24 20 87Research about family needs 739 86 196 1,639 12 15 81Training for welfare staff 868 95 179 1,785 20 20 90Other 100 10 39 176 4 1 18 BARRIERS TO EMPLOYMENT Responses to Question 2 No problems 271 42 62 387 7 3 32Limited education 617 170 191 1,872 18 22 75Limited English 137 276 130 2,091 8 17 51Limited job skills 764 186 202 1,115 17 21 69Limited job experience 759 163 199 1,541 18 17 73Day or night care for children 709 84 240 2,078 13 20 90After school care for children 564 49 132 1,128 17 13 61Lack of transportation 720 52 137 1,527 17 16 73Lack of housing 637 74 155 1,948 16 18 78Health problems 306 63 144 956 8 11 47Family care taking responsibilities 304 53 100 811 9 9 35Serious family dysfunctions 279 34 95 1,071 11 11 38Older children might get into trouble 332 42 80 1,193 6 7 44Lack of proper clothing 580 30 137 1,010 15 12 65Lack of information about services 524 90 104 1,388 11 15 57Inability to gain access to services 394 62 86 1,174 8 11 53Other 68 8 32 165 2 2 14

Data Appendix 135
Table A-5 – Page 1 of 6
Percent of Respondents Selecting Each Item Questions 1 and 2 of Family Needs Survey
ALL CALWORKS
STATUS SINGLE MOTHERS RECEIVING
CALWORKS
PRIORITIES FOR SELF-SUFFICIENCY Responses to Question 1 Al
l Res
pond
ents
Cur
rent
Cal
WO
RK
s R
ecip
ient
s
Cal
WO
RK
S in
Pas
t 2
Yea
rs b
ut N
ot N
ow
No
Cal
WO
RK
s P
ast o
r P
rese
nt
Sur
veye
d at
Com
mun
ity
Agen
cies
Sur
veye
d at
Sch
ools
Sur
veye
d at
DP
SS
Offi
ces
All
Sin
gle
Mot
hers
R
ecei
ving
Cal
WO
RKs
Childcare 64% 68% 65% 61% 72% 69% 79% 76%Transportation 43% 48% 42% 38% 55% 53% 54% 54%Creating good jobs 64% 70% 65% 57% 72% 68% 80% 77%Education 66% 65% 68% 67% 68% 58% 74% 71%Health care 60% 58% 59% 62% 58% 57% 65% 62%Counseling for family problems 46% 43% 41% 50% 45% 40% 49% 47%Programs for teenagers 48% 46% 45% 50% 48% 41% 53% 51%Programs to keep families together 43% 42% 39% 45% 43% 40% 48% 46%Information for finding good jobs 56% 57% 57% 56% 59% 50% 63% 61%Help for families facing eviction 48% 48% 49% 48% 50% 42% 57% 54%Clear information about CalWORKs 40% 42% 40% 37% 44% 46% 49% 47%Research about family needs 34% 34% 30% 34% 37% 32% 39% 38%Training for welfare staff 38% 39% 34% 37% 40% 39% 46% 44%Other 4% 4% 4% 4% 4% 3% 6% 5% BARRIERS TO EMPLOYMENT Responses to Question 2 No problems 10% 9% 10% 11% 7% 9% 10% 9%Limited education 36% 38% 38% 35% 46% 38% 39% 41%Limited English 33% 32% 29% 36% 29% 27% 32% 31%Limited job skills 29% 33% 29% 25% 47% 41% 32% 37%Limited job experience 34% 37% 34% 32% 46% 48% 37% 40%Day or night care for children 39% 44% 38% 35% 44% 43% 54% 50%After school care for children 24% 28% 24% 20% 34% 34% 32% 33%Lack of transportation 31% 35% 30% 27% 39% 42% 40% 40%Lack of housing 36% 36% 38% 36% 35% 34% 41% 39%Health problems 19% 19% 18% 19% 18% 14% 20% 19%Family care taking responsibilities 16% 16% 14% 17% 18% 17% 17% 17%Serious family dysfunctions 19% 19% 17% 20% 22% 16% 19% 20%Older children might get into trouble 21% 21% 23% 21% 24% 23% 22% 23%Lack of proper clothing 23% 27% 25% 18% 31% 27% 31% 31%Lack of information about services 27% 27% 25% 28% 32% 23% 29% 29%Inability to gain access to services 22% 22% 21% 23% 24% 21% 23% 23%Other 4% 4% 4% 4% 3% 3% 5% 4%

136 Running Out of Time
Table A-5 – Page 2 of 6
Percent of Respondents Selecting Each Item Questions 1 and 2 of Family Needs Survey
SURVEYED AT DPSS OFFICE SURVEY VENUE ENGLISH FLUENCY
PRIORITIES FOR SELF-SUFFICIENCY Responses to Question 1 C
urre
nt C
alW
OR
Ks
Rec
ipie
nts
Not
Cur
rent
Cal
WO
RK
s R
ecip
ient
s
Com
mun
ity A
genc
ies
Scho
ols
DP
SS
Offi
ces
Ver
y G
ood
Eng
lish
Goo
d En
glis
h
Lim
ited
Eng
lish
No
Engl
ish
Childcare 74% 66% 65% 53% 66% 69% 68% 59% 56%Transportation 49% 38% 47% 41% 42% 47% 42% 40% 40%Creating good jobs 78% 61% 65% 54% 66% 64% 63% 63% 66%Education 72% 66% 66% 64% 66% 64% 67% 65% 68%Health care 62% 61% 62% 59% 59% 57% 61% 61% 63%Counseling for family problems 48% 46% 47% 44% 45% 42% 49% 48% 48%Programs for teenagers 51% 47% 51% 45% 47% 44% 51% 51% 50%Programs to keep families together 47% 43% 44% 40% 43% 40% 42% 46% 47%Information for finding good jobs 62% 58% 55% 53% 57% 55% 56% 58% 57%Help for families facing eviction 55% 51% 46% 39% 51% 48% 46% 49% 50%Clear information about CalWORKs 46% 40% 38% 36% 41% 38% 39% 41% 40%Research about family needs 37% 34% 35% 30% 34% 31% 35% 36% 37%Training for welfare staff 43% 36% 37% 36% 38% 37% 38% 39% 38%Other 5% 4% 4% 4% 4% 6% 4% 3% 2%
BARRIERS TO EMPLOYMENT Responses to Question 2 No problems 10% 10% 11% 9% 9% 13% 12% 7% 5%Limited education 38% 35% 41% 34% 34% 30% 43% 42% 38%Limited English 34% 32% 33% 42% 32% 0% 35% 64% 69%Limited job skills 29% 24% 36% 29% 25% 34% 32% 24% 19%Limited job experience 35% 31% 38% 37% 31% 32% 40% 34% 31%Day or night care for children 50% 40% 37% 30% 43% 33% 43% 43% 48%After school care for children 28% 22% 27% 20% 24% 22% 31% 24% 23%Lack of transportation 37% 29% 32% 27% 31% 29% 29% 32% 37%Lack of housing 40% 38% 34% 33% 38% 28% 35% 42% 49%Health problems 20% 19% 19% 18% 19% 14% 19% 23% 25%Family care taking responsibilities 16% 15% 18% 16% 15% 11% 19% 20% 21%Serious family dysfunctions 19% 20% 20% 18% 19% 12% 22% 25% 26%Older children might get into trouble 21% 21% 22% 21% 21% 11% 22% 30% 31%Lack of proper clothing 29% 21% 24% 16% 24% 25% 25% 19% 20%Lack of information about services 28% 25% 29% 29% 25% 22% 28% 31% 33%Inability to gain access to services 22% 22% 23% 24% 21% 15% 25% 26% 29%Other 5% 4% 3% 2% 4% 4% 3% 3% 3%

Data Appendix 137
Table A-5 – Page 3 of 6
Percent of Respondents Selecting Each Item Questions 1 and 2 of Family Needs Survey
LEVEL OF EDUCATION EMPLOYMENT STATUS
PRIORITIES FOR SELF-SUFFICIENCY Responses to Question 1 0-
8 Y
ears
9-11
Yea
rs
12 Y
ears
13+
Yea
rs
Empl
oyed
& W
orke
d 26
+ W
ks L
ast Y
r
Oth
er C
urre
ntly
Em
ploy
ed
Not
Em
ploy
ed B
ut W
orke
d La
st Y
r
Une
mpl
oyed
& D
id N
ot
Wor
k La
st Y
r
Childcare 59% 68% 70% 64% 64% 67% 67% 64%Transportation 40% 44% 46% 42% 41% 43% 42% 45%Creating good jobs 68% 65% 65% 59% 63% 61% 65% 65%Education 68% 66% 66% 67% 66% 64% 70% 64%Health care 61% 60% 58% 60% 62% 62% 59% 59%Counseling for family problems 50% 46% 43% 44% 46% 47% 46% 45%Programs for teenagers 51% 50% 45% 45% 52% 50% 46% 46%Programs to keep families together 46% 43% 41% 40% 43% 41% 43% 43%Information for finding good jobs 58% 59% 56% 52% 54% 56% 59% 57%Help for families facing eviction 51% 50% 47% 46% 45% 48% 50% 48%Clear information about CalWORKs 43% 40% 39% 35% 38% 40% 41% 39%Research about family needs 37% 35% 33% 29% 32% 36% 33% 34%Training for welfare staff 40% 37% 37% 37% 36% 38% 38% 37%Other 4% 5% 4% 6% 4% 3% 5% 4%
BARRIERS TO EMPLOYMENT Responses to Question 2 No problems 7% 9% 12% 12% 16% 12% 9% 8%Limited education 46% 46% 30% 20% 35% 36% 35% 38%Limited English 54% 32% 19% 20% 33% 35% 27% 36%Limited job skills 25% 35% 34% 23% 26% 23% 28% 32%Limited job experience 33% 38% 35% 27% 30% 32% 31% 37%Day or night care for children 43% 43% 38% 34% 35% 38% 41% 41%After school care for children 24% 25% 24% 22% 23% 24% 25% 25%Lack of transportation 35% 32% 30% 26% 24% 26% 33% 34%Lack of housing 45% 34% 31% 30% 32% 35% 39% 36%Health problems 24% 18% 16% 17% 15% 17% 17% 21%Family care taking responsibilities 20% 16% 14% 14% 16% 16% 14% 17%Serious family dysfunctions 26% 17% 15% 15% 16% 20% 18% 20%Older children might get into trouble 30% 19% 16% 14% 21% 21% 18% 22%Lack of proper clothing 22% 25% 25% 19% 16% 17% 24% 26%Lack of information about services 32% 27% 25% 23% 25% 26% 28% 27%Inability to gain access to services 29% 20% 19% 17% 20% 21% 24% 22%Other 3% 3% 4% 7% 3% 2% 4% 4%

138 Running Out of Time
Table A-5 – Page 4 of 6
Percent of Respondents Selecting Each Item Questions 1 and 2 of Family Needs Survey
FAMILY STATUS SEX AGE
PRIORITIES FOR SELF-SUFFICIENCY Responses to Question 1 S
ingl
e-P
aren
t Fam
ilies
Two-
Par
ent F
amilie
s
Wom
en
Men
18-2
4
25-3
4
35-4
4
45+
Childcare 69% 58% 67% 52% 70% 67% 61% 57%Transportation 47% 38% 44% 40% 46% 41% 44% 46%Creating good jobs 68% 59% 66% 60% 61% 64% 68% 66%Education 67% 65% 67% 66% 64% 65% 69% 68%Health care 59% 61% 60% 61% 60% 57% 61% 66%Counseling for family problems 46% 45% 46% 46% 43% 45% 48% 50%Programs for teenagers 48% 47% 49% 48% 46% 45% 51% 55%Programs to keep families together 44% 43% 43% 44% 38% 42% 47% 47%Information for finding good jobs 57% 56% 57% 54% 58% 55% 58% 57%Help for families facing eviction 51% 44% 49% 47% 46% 47% 50% 52%Clear information about CalWORKs 43% 34% 40% 37% 39% 38% 41% 42%Research about family needs 35% 33% 34% 35% 31% 32% 37% 40%Training for welfare staff 40% 35% 38% 37% 34% 36% 40% 42%Other 4% 4% 4% 4% 4% 3% 4% 6%
BARRIERS TO EMPLOYMENT Responses to Question 2 No problems 10% 11% 9% 13% 12% 9% 8% 11%Limited education 37% 35% 37% 33% 36% 36% 38% 35%Limited English 30% 40% 34% 33% 22% 33% 40% 42%Limited job skills 31% 26% 29% 31% 33% 28% 27% 30%Limited job experience 34% 34% 34% 34% 39% 34% 32% 32%Day or night care for children 44% 34% 43% 25% 41% 46% 39% 25%After school care for children 28% 18% 26% 16% 22% 27% 26% 18%Lack of transportation 35% 25% 32% 26% 34% 30% 32% 30%Lack of housing 37% 34% 37% 35% 31% 37% 38% 39%Health problems 19% 19% 19% 22% 11% 16% 22% 32%Family care taking responsibilities 16% 16% 16% 17% 11% 16% 19% 22%Serious family dysfunctions 19% 18% 20% 19% 14% 19% 21% 23%Older children might get into trouble 22% 20% 22% 19% 11% 20% 28% 26%Lack of proper clothing 26% 18% 24% 20% 24% 23% 23% 22%Lack of information about services 28% 27% 27% 30% 24% 27% 29% 32%Inability to gain access to services 22% 22% 22% 24% 18% 21% 23% 30%Other 4% 3% 3% 4% 4% 3% 4% 4%

Data Appendix 139
Table A-5 – Page 5 of 6
Percent of Respondents Selecting Each Item Questions 1 and 2 of Family Needs Survey
AGE OF YOUNGEST
CHILD NUMBER OF CHILDREN
PRIORITIES FOR SELF-SUFFICIENCY Responses to Question 1 5
or Y
oung
er
6 to
11
Yea
rs
12 to
17
Yea
rs
1 C
hild
2 C
hild
ren
3 C
hild
ren
4+ C
hild
ren
Childcare 71% 64% 55% 68% 66% 68% 65%Transportation 44% 45% 45% 45% 42% 44% 45%Creating good jobs 65% 67% 70% 63% 66% 67% 68%Education 65% 67% 68% 66% 66% 68% 66%Health care 59% 58% 65% 63% 60% 60% 56%Counseling for family problems 45% 46% 48% 46% 45% 46% 46%Programs for teenagers 45% 50% 60% 46% 46% 51% 50%Programs to keep families together 42% 44% 47% 41% 43% 46% 45%Information for finding good jobs 57% 56% 60% 57% 57% 58% 58%Help for families facing eviction 49% 49% 52% 50% 47% 49% 52%Clear information about CalWORKs 41% 40% 42% 41% 39% 42% 42%Research about family needs 34% 34% 39% 34% 34% 35% 35%Training for welfare staff 37% 39% 42% 37% 37% 39% 41%Other 4% 4% 5% 5% 3% 4% 4%
BARRIERS TO EMPLOYMENT Responses to Question 2 No problems 9% 8% 12% 11% 9% 8% 7%Limited education 37% 39% 40% 34% 35% 41% 44%Limited English 32% 38% 40% 28% 37% 38% 38%Limited job skills 29% 27% 34% 30% 28% 28% 30%Limited job experience 35% 33% 38% 34% 34% 34% 38%Day or night care for children 50% 42% 24% 40% 43% 47% 47%After school care for children 27% 29% 19% 20% 27% 30% 31%Lack of transportation 33% 33% 30% 32% 32% 32% 34%Lack of housing 38% 37% 38% 34% 36% 40% 42%Health problems 15% 21% 27% 19% 18% 19% 20%Family care taking responsibilities 15% 18% 22% 13% 16% 18% 21%Serious family dysfunctions 19% 21% 20% 16% 19% 22% 23%Older children might get into trouble 19% 27% 31% 15% 19% 27% 32%Lack of proper clothing 25% 22% 25% 22% 23% 25% 27%Lack of information about services 27% 28% 30% 25% 27% 29% 30%Inability to gain access to services 21% 22% 26% 20% 21% 24% 26%Other 3% 4% 3% 4% 4% 3% 3%

140 Running Out of Time
Table A-5 – Page 6 of 6
Percent of Respondents Selecting Each Item Questions 1 and 2 of Family Needs Survey
ETHNICITY
PRIORITIES FOR SELF-SUFFICIENCY Responses to Question 1 A
frica
n A
mer
ican
Asia
n
Eur
opea
n A
mer
ican
Latin
o
Nat
. Am
er/A
lsk.
Nat
.
Pac
ific
Isla
nder
Oth
er
Childcare 73% 35% 64% 65% 63% 72% 66% Transportation 56% 26% 38% 40% 56% 47% 46% Creating good jobs 73% 42% 57% 64% 63% 53% 66% Education 66% 52% 58% 69% 58% 66% 68% Health care 62% 42% 57% 61% 42% 60% 63% Counseling for family problems 45% 25% 38% 49% 49% 38% 48% Programs for teenagers 52% 28% 36% 50% 40% 43% 48% Programs to keep families together 47% 23% 33% 44% 46% 36% 50% Information for finding good jobs 60% 40% 54% 58% 44% 53% 57% Help for families facing eviction 54% 23% 42% 50% 54% 47% 53% Clear information about CalWORKs 46% 18% 31% 41% 42% 43% 40% Research about family needs 37% 17% 29% 35% 21% 32% 37% Training for welfare staff 44% 19% 27% 38% 35% 43% 41% Other 5% 2% 6% 4% 7% 2% 8%
BARRIERS TO EMPLOYMENT Responses to Question 2 No problems 14% 8% 9% 8% 12% 6% 15% Limited education 31% 34% 29% 40% 32% 47% 34% Limited English 7% 55% 20% 45% 14% 36% 23% Limited job skills 39% 37% 30% 24% 30% 45% 32% Limited job experience 39% 32% 30% 33% 32% 36% 33% Day or night care for children 36% 17% 36% 45% 23% 43% 41% After school care for children 29% 10% 20% 24% 30% 28% 28% Lack of transportation 37% 10% 21% 33% 30% 34% 33% Lack of housing 32% 15% 23% 42% 28% 38% 36% Health problems 16% 13% 22% 21% 14% 23% 21% Family care taking responsibilities 15% 11% 15% 17% 16% 19% 16% Serious family dysfunctions 14% 7% 14% 23% 19% 23% 17% Older children might get into trouble 17% 8% 12% 26% 11% 15% 20% Lack of proper clothing 29% 6% 21% 22% 26% 26% 30% Lack of information about services 27% 18% 16% 30% 19% 32% 26% Inability to gain access to services 20% 12% 13% 25% 14% 23% 24% Other 3% 2% 5% 4% 4% 4% 6%

Data Appendix 141
Table A-6
Confidence Limits for Barriers to Employment Identified by Female Survey Respondents
Confidence Limits for Three Benchmark Groups of Female Survey Respondents
Barriers to Employment
Predicted Probabilities N
o pr
oble
ms
Lim
ited
job
skill
s
Lim
ited
educ
atio
n
Lim
ited
Eng
lish
Lim
ited
job
expe
rienc
e
Lack
of c
hild
car
e
Lack
of a
fter s
choo
l car
e
Lack
of t
rans
porta
tion
Lack
of h
ousi
ng
Hea
lth p
robl
ems
Fam
ily c
are
taki
ng re
spon
sibi
litie
s
Fam
ily d
ysfu
nctio
ns
Old
er c
hild
ren
getti
ng in
to tr
oubl
e
Lack
of p
rope
r Clo
thin
g
Lack
of i
nfor
mat
ion
abou
t ser
vice
s
Nee
d he
lp g
ettin
g se
rvic
es
"Average" Female 0.08 0.31 0.39 0.21 0.35 0.48 0.27 0.34 0.37 0.16 0.15 0.18 0.19 0.24 0.27 0.21lower .95 confidence bound 0.07 0.28 0.37 0.18 0.33 0.44 0.24 0.30 0.33 0.15 0.13 0.15 0.16 0.21 0.24 0.18
upper .95 confidence bound 0.09 0.34 0.42 0.24 0.38 0.51 0.31 0.37 0.41 0.18 0.18 0.20 0.22 0.27 0.31 0.24
Young Single Female with Young Children 0.07 0.36 0.47 0.19 0.42 0.55 0.31 0.42 0.38 0.13 0.12 0.16 0.14 0.28 0.28 0.22lower .95 confidence bound 0.05 0.31 0.43 0.15 0.37 0.50 0.25 0.36 0.32 0.10 0.08 0.12 0.11 0.23 0.23 0.18
upper .95 confidence bound 0.09 0.41 0.51 0.23 0.47 0.60 0.37 0.49 0.45 0.17 0.17 0.20 0.18 0.33 0.34 0.27
Not-Young, Not-Single Female without Young Children 0.11 0.17 0.16 0.22 0.27 0.41 0.23 0.24 0.33 0.16 0.15 0.14 0.20 0.17 0.22 0.16lower .95 confidence bound 0.08 0.12 0.12 0.16 0.22 0.34 0.18 0.19 0.28 0.12 0.12 0.11 0.16 0.12 0.18 0.12
upper .95 confidence bound 0.14 0.23 0.21 0.29 0.33 0.48 0.29 0.31 0.39 0.20 0.20 0.18 0.25 0.23 0.28 0.21
Predicted probabilities for 'benchmark types': (1) Female who is average on all attributes of female respondents identified through survey. (2) Single female under 25 with one or more children under 6 years of age. (3) Older (over 24), not-single female with no children under 6.

142 Running Out of Time

Data Appendix 143
Table A-7
Confidence Limits for Service Priorities Identified by Female Survey Respondents
Confidence Limits for Three Benchmark Groups of Female Survey Respondents
Service Priorities
Predicted Probabilities Chi
ldca
re
Tran
spor
tatio
n
Job
crea
tion
Edu
catio
n an
d jo
b sk
ills
train
ing
Hea
lth c
are
Cou
nsel
ing
for f
amily
pro
blem
s
Pro
gram
s fo
r tee
nage
rs
Kee
ping
fam
ilies
toge
ther
Info
rmat
ion
abou
t job
s
Hel
p fa
mili
es fa
cing
evi
ctio
n
Cle
ar in
form
atio
n on
Cal
WO
RK
s
Res
earc
h on
fam
ily n
eeds
Trai
n w
elfa
re s
taff
"Average" Female 0.71 0.45 0.68 0.68 0.59 0.45 0.48 0.43 0.58 0.50 0.41 0.34 0.39
lower .95 confidence bound 0.67 0.41 0.65 0.63 0.54 0.40 0.43 0.38 0.54 0.45 0.36 0.30 0.35
upper .95 confidence bound 0.74 0.50 0.72 0.72 0.64 0.50 0.53 0.48 0.63 0.56 0.46 0.38 0.43Young Single Female with Young Children 0.75 0.52 0.70 0.68 0.57 0.45 0.47 0.41 0.61 0.51 0.47 0.33 0.39
lower .95 confidence bound 0.70 0.46 0.66 0.62 0.51 0.38 0.41 0.35 0.55 0.45 0.41 0.28 0.33
upper .95 confidence bound 0.80 0.58 0.75 0.73 0.63 0.52 0.53 0.48 0.65 0.58 0.53 0.39 0.46
Not-Young, Not-Single Female without Young Children 0.64 0.37 0.59 0.68 0.62 0.43 0.49 0.41 0.56 0.48 0.30 0.29 0.39
lower .95 confidence bound 0.56 0.30 0.52 0.61 0.54 0.36 0.42 0.35 0.48 0.42 0.24 0.24 0.32
upper .95 confidence bound 0.72 0.45 0.66 0.73 0.69 0.50 0.55 0.48 0.64 0.55 0.36 0.36 0.46
Predicted probabilities for 'benchmark types': (1) Female who is average on all attributes of female respondents identified through survey. (2) Single female under 25 with one or more children under 6 years of age. (3) Older (over 24), not-single female with no children under 6.

144 Running Out of Time

Data Appendix 145
Table A-8
Barriers and Priorities of Ethnic and Linguistic Minorities Number and Percent of Responses to Questions 1 and 2
Number of Responses Percent of Respondents in Group
PRIORITIES FOR SELF-SUFFICIENCY Responses to Question 1 Ar
men
ian
Cam
bodi
an
Chi
nese
Kor
ean
Nat
ive
Am
er./A
lsk.
Nat
.
Rus
sian
Viet
nam
ese
Arm
enia
n
Cam
bodi
an
Chi
nese
Kor
ean
Nat
ive
Am
er./A
lsk.
Nat
.
Rus
sian
Viet
nam
ese
Childcare 109 6 49 26 36 36 18 64% 6% 35% 52% 63% 68% 36%Transportation 66 9 39 15 32 14 15 39% 10% 28% 30% 56% 26% 30%Creating good jobs 121 56 46 13 36 34 24 72% 60% 33% 26% 63% 64% 48%Education 88 52 68 29 33 30 22 52% 55% 48% 58% 58% 57% 44%Health care 110 7 57 30 24 32 28 65% 7% 40% 60% 42% 60% 56%Counseling for family problems 58 5 37 23 28 8 6 34% 5% 26% 46% 49% 15% 12%Programs for teenagers 81 8 44 25 23 11 10 48% 9% 31% 50% 40% 21% 20%Programs to keep families together 63 7 37 15 26 11 11 37% 7% 26% 30% 46% 21% 22%Information for finding good jobs 91 34 60 17 25 38 21 54% 36% 43% 34% 44% 72% 42%Help for families facing eviction 68 9 31 19 31 11 9 40% 10% 22% 38% 54% 21% 18%Clear information about CalWORKs 59 4 29 8 24 11 5 35% 4% 21% 16% 42% 21% 10%Research about family needs 69 11 22 8 12 13 9 41% 12% 16% 16% 21% 25% 18%Training for welfare staff 48 3 33 8 20 7 13 28% 3% 23% 16% 35% 13% 26%Other 4 2 5 1 4 0 0 2% 2% 4% 2% 7% 0% 0%
BARRIERS TO EMPLOYMENT Responses to Question 2 No problems 19 2 6 6 7 5 5 11% 2% 4% 12% 12% 9% 10%Limited education 49 52 42 7 18 18 23 29% 55% 30% 14% 32% 34% 46%Limited English 105 70 93 26 8 34 30 62% 74% 66% 52% 14% 64% 60%Limited job skills 53 54 44 12 17 18 27 31% 57% 31% 24% 30% 34% 54%Limited job experience 64 33 39 14 18 25 21 38% 35% 28% 28% 32% 47% 42%Day or night care for children 77 7 17 13 13 16 6 46% 7% 12% 26% 23% 30% 12%After school care for children 45 0 13 7 17 9 2 27% 0% 9% 14% 30% 17% 4%Lack of transportation 13 3 15 5 17 1 2 8% 3% 11% 10% 30% 2% 4%Lack of housing 18 3 27 7 16 3 5 11% 3% 19% 14% 28% 6% 10%Health problems 40 5 21 5 8 4 6 24% 5% 15% 10% 14% 8% 12%Family care taking responsibilities 31 2 19 8 9 3 7 18% 2% 13% 16% 16% 6% 14%Serious family dysfunctions 18 1 6 4 11 2 9 11% 1% 4% 8% 19% 4% 18%Older children might get into trouble 29 6 10 3 6 4 8 17% 6% 7% 6% 11% 8% 16%Lack of proper clothing 27 2 8 3 15 4 2 16% 2% 6% 6% 26% 8% 4%Lack of information about services 19 2 35 13 11 6 12 11% 2% 25% 26% 19% 11% 24%Inability to gain access to services 29 1 26 5 8 4 10 17% 1% 18% 10% 14% 8% 20%Other 1 0 1 0 2 3 0 1% 0% 1% 0% 4% 6% 0%

146 Running Out of Time

Data Appendix 147
Table A-9 Education and Employment Profile of Survey Respondents
Edu-
cation Current
Employment Status Employment Status
Last Year Weeks Wkd.
Avg. Years
Pct. Empl. Employed
Unem-ployed
Pct. Wkd. Worked No Work Last Year
SURVEY VENUE Community Agency 10.5 38% 920 1,488 52% 1,208 1,126 34 School 10.3 45% 439 544 48% 457 493 37 Welfare Office 9.7 22% 1,028 3,645 48% 2,179 2,386 31 CALWORKS STATUS CalWORKs Recipient 9.8 26% 1,009 2,887 43% 1,638 2,181 30 Previous CalWORKs Recipient 9.8 29% 983 2,365 44% 1,436 1,839 31 Not CalWORKs Recipient 10.5 34% 996 1,972 56% 1,629 1,258 35.5 EMPLOYMENT STATUS Worked Last Year 10.6 48% 1,806 1,986 n.a. n.a. n.a. n.a. Did Not Work Last Year 9.6 12% 457 3,501 n.a. n.a. n.a. n.a. Currently Employed 10.5 n.a. n.a. n.a. 80% 1,806 457 40 Currently Unemployed 9.9 n.a. n.a. n.a. 36% 1,986 3,501 27 SEX Female 9.9 27% 1,764 4,776 46% 2,933 3,447 32 Male 10.8 43% 509 686 66% 750 393 35 FAMILY STATUS Single Parent 9.9 27% 1,289 3,482 48% 2,248 2,438 32 Two-Parent Family 10.3 33% 950 1,906 51% 1,408 1,362 34 AGE <21 10.7 27% 170 465 47% 291 327 26 21-24 10.5 25% 258 782 51% 527 501 30 25-29 10.2 27% 402 1,072 49% 714 734 32 30-34 10.0 28% 372 950 46% 587 690 34 35-39 9.7 34% 408 780 51% 589 570 33 40-44 9.7 33% 298 601 49% 426 447 35 45-64 9.9 33% 323 649 53% 502 443 37 65+ 9.2 8% 8 87 16% 14 74 39 YEARS OF SCHOOL 0-8 n.a. 26% 473 1,373 40% 713 1,058 31 9-11 n.a. 25% 482 1,414 45% 836 1,033 31 12 n.a. 31% 679 1,520 54% 1,181 991 33 13+ n.a. 38% 431 701 64% 719 397 36 ENGLISH FLUENCY Very Good 11.7 28% 975 2,465 54% 1,828 1,574 32 Good 10.3 38% 494 802 55% 697 561 34 Not Good 8.6 31% 594 1,308 45% 825 1,013 35 Not At All 7.1 23% 324 1,102 37% 494 857 30 SURVEY LANGUAGE Armenian 10.7 73% 61 22 78% 49 14 34 Khmer (Cambodian) 2.5 8% 5 59 9% 6 58 33 English 11.4 29% 1,311 3,175 52% 2,326 2,118 32 Korean 13.9 65% 17 9 76% 19 6 46 Mandarin/Cantonese 9.8 27% 22 61 38% 31 51 39 Russian 10.4 44% 21 27 51% 23 22 40 Spanish 8.0 29% 938 2,311 44% 1,377 1,727 33 Vietnamese 7.7 48% 12 13 59% 13 9 37 ETHNICITY African American 11.8 31% 591 1,319 52% 975 914 32 Asian 9.9 31% 151 339 43% 205 276 35 Latino 9.1 29% 1,348 3,248 48% 2,154 2,305 33 Native American/Alaskan Native 10.9 25% 14 42 56% 30 24 27 Pacific Islander 10.6 47% 21 24 52% 23 21 29 European American 11.5 27% 174 460 52% 319 292 32 Other 11.0 28% 58 149 50% 100 100 35 TOTAL All Respondents 10.0 30% 2,387 5,677 49% 3,844 4,005 33

148 Running Out of Time

Data Appendix 149
Table A-10
Open-Ended Survey Comments Listed by Frequency of Comments
Code Issue Number of Comments
91 Encountering discourteous or disrespectful staff 10833 Need more education and training programs 99
1 General need to strengthen program 9372 Need affordable housing 8792 Encountering incompetent staff 84
124 Legalization for immigrants 6537 Need education programs for people with limited English 4840 Difficulties finding a Job 4562 Complying with the program needs to be easier 4412 Need free or affordable childcare 4315 Need After school programs for children 4281 Need health insurance coverage 4161 Requirements of the program need to be clearer 4045 Higher paying jobs 39
113 Information on helping immigrants receive benefits 3971 General lack of housing 3893 Experience being denied assistance by staff 37
125 General family well-being 3641 Needs better connection between job seekers and employers 3549 Need to have permanent jobs 3432 Needs to have continued support for costs in pursuing education/training e.g.,
supplies being paid for) 31
126 Improve quality of education and schools 30130 Single parents needs 30
11 General lack of childcare 2916 Teen programs 27
123 Food stamps/programs related (i.e., maintaining eligibility) 2543 Needs programs to find better jobs for those with limited English skills 2310 Childcare 2230 Education/Job Training 2270 Housing 2280 Healthcare 2282 Concerned over Medi-Cal eligibility 19
101 Needs an increase in grant allotment 1960 Overall CalWORKs Program Access 1884 Lack of available healthcare within poor communities 18
121 Criminal justice system issues (i.e., assisting felons) 1844 Needs jobs that have flexible schedules to accommodate caring for children 1614 Need childcare hours for non-traditional work schedules 1542 Needs better connection for job seekers to find jobs in the community where
they live 15
51 Needs programs for family counseling 1564 Office accessibility 1547 Disability causes a barrier 1350 Counseling/mental health 1275 Difficulty in getting section 8 12

150 Running Out of Time
Code Issue Number of Comments
90 Interaction with workers 12103 Concern over children's eligibility being maintained 12127 Concern over growing gang violence 12
21 General lack of 1125 Need assistance in getting a driver's license 1136 Believes that education/attaining a degree will lead to getting better jobs 11
150 Senior citizen/disability 11201 Likes the enforcement mechanisms of the program 11
26 Improving bus/public transportation 1031 Wants relaxed time limits on education 10
128 Concern over the safety of schools 1073 Needs permanent housing 9
120 Issues/barriers that raise concern... 920 Transportation 834 Wants education rather than work first 835 Experienced the tensions of pursuing education vs. work 8
200 General positives of the program 874 Experienced discrimination by landlords due to children in the family 7
122 Child support: District attorneys need to work harder to locate fathers 724 Need better transportation for children 663 Wants to eliminate time limits 6
102 Experienced miscalculations in grant amounts (over and underpayment) 6112 Wants a supportive system of participants (buddy system) 6129 Wants programs to get homeless/mentally ill people off the streets 6152 Access to SSI benefits 6
13 Problems with payment to care providers being on-time 546 Experienced age discrimination 548 Experiencing harassment/discrimination on the job 583 Problems with Medi-Cal always being denied 595 Increase bilingual staffing 5
104 Receive proper notice of changes to grant size 5111 Interested in becoming politically involved 5140 Domestic violence 5151 Income maintenance 5153 Help with disabled children 5
17 Maintain status quo availability of childcare 452 Improving self esteem 453 Provide counseling/information on family planning 494 Workers are being changed frequently 4
141 Family law counseling 427 Need affordable car insurance 354 Need for substance abuse counseling 376 Believes that housing and welfare should go hand-in-hand 3
100 Monthly grant 322 Need in order to get to school (for the adult) 223 Need in order to get to counseling services 1
110 Getting personally involved 1

Data Appendix 151
Table A-11
Open-Ended Survey Comments Grouped by Major Categories
Listed by Frequency of Comments
Code Issue Number of Comments
90 Problems interacting with welfare staff 250 30 Education and job training needs 237 40 Problems finding a job 230
120 Safety, security and well-being issues 218 10 Childcare needs 187 70 Housing needs 178 60 Problems accessing CalWORKs programs 123 80 Healthcare needs 105
1 General need to strengthen program 93 20 Transportation needs 52
110 Getting personally involved 51 100 Issues about monthly grant 45
50 Counseling and mental health needs 38 130 Single parents needs 30 150 Senior citizen and disability issues 27 200 Positive comments about CalWORKs 19 140 Domestic violence 9

152 Running Out of Time