Running-In and Scuffing Studies - IDEALS
97
Running-In and Scuffing Studies M. P. Cavatorta, J. Whittenhall, N. Stokes, and C. Cusano ACRC TR-157 For additional information: Air Conditioning and Refrigeration Center University of Illinois Mechanical & Industrial Engineering Dept. 1206 West Green Street Urbana,IL 61801 (217) 333-3115 September 1999 Prepared as part of ACRC Project 82 Compressor-Lubrication, Friction and Wear C. Cusano, Principal Investigator
Transcript of Running-In and Scuffing Studies - IDEALS

Running-In and Scuffing Studies
M. P. Cavatorta, J. Whittenhall, N. Stokes, and C. Cusano
ACRC TR-157
For additional information:
Air Conditioning and Refrigeration Center University of Illinois Mechanical & Industrial Engineering Dept. 1206 West Green Street Urbana,IL 61801
(217) 333-3115
September 1999
Prepared as part of ACRC Project 82 Compressor-Lubrication, Friction and Wear
C. Cusano, Principal Investigator

The Air Conditioning and Refrigeration Center was founded in 1988 with a grant from the estate of Richard W. Kritzer, the founder of Peerless of America Inc. A State of Illinois Technology Challenge Grant helped build the laboratory facilities. The ACRC receives continuing support from the Richard W. Kritzer Endowment and the National Science Foundation. The following organizations have also become sponsors of the Center.
Amana Refrigeration, Inc. Brazeway, Inc. Carrier Corporation Chrysler Corporation Copeland Corporation Delphi Harrison Thermal Systems Frigidaire Company General Electric Company Hill PHOENIX Honeywell, Inc. Hussmann Corporation Hydro Aluminum Adrian, Inc. Indiana Tube Corporation Lennox International, Inc. Modine Manufacturing Co. Parker Hannifin Corporation Peerless of America, Inc. The Trane Company Thermo King Corporation Visteon Automotive Systems Whirlpool Corporation York International, Inc.
For additional information:
Air Conditioning & Refrigeration Center Mechanical & Industrial Engineering Dept. University of Illinois 1206 West Green Street Urbana IL 61801
2173333115

Foreword
This report contains data obtained during the past two years, which have been requested
by various ACRC members. The work is in addition to that originally proposed in Project #82.
The report includes data on the running-in of 390-T6 Al against 1018 carburized steel and its
effects on scuffing with Maria Pia Cavatorta (a visiting graduate student from Italy), scuffing
behavior of 330 brass and DHT4 aluminum with John Whittenhall (an undergraduate student),
and preliminary work on scuffing of 390-T6 aluminum, slidng against 52100 shoes with a
dimple, lubricated with a COiPAG mixture with Nicholas Stokes (an undergraduate student).
All the results are obtained under starved lubrication conditions. We hope that you will find the
information useful.


RUNNING-IN OF ALUMINUM/STEEL CONTACTS UNDER STARVED
LUBRICATION - PART I: SURFACE MODIFICATIONS
Maria Pia Cavatortat , Cris Cusano
Department of Mechanical and Industrial Engineering.
University of Illinois at Urbana-Champaign
Urbana, Illinois
ABSTRACT
In Part I of this two part paper, extensive surface analysis is done to examine surface changes
caused by different run-in procedures on 390-T6 aluminum pins sliding against 1018
carburized steel disks. The area contact is lubricated by a base polyalkylene glycol (P AG)
lubricant mist carried by a tetrafluoroethane (R134a) refrigerant gas under starved lubrication
conditions. Run-in pressure, velocity and time as well as the effect of the friction coefficient
during run-in are examined. Limited data are also obtained for different degrees of starvation.
Surface traces of the pin specimens show that changes in the profile are limited to the first
minutes of sliding. Longer run-in times allow for the formation of iron oxides as well as AI-Fe
intermetallic compounds on the aluminum pins. The iron transfer to the pin is due to the
abrasive action of the silicon particles on the steel disk.
Keywords: Running-in, Aluminum, Starved lubrication, Surface film formation
t Present Address: Department of Mechanical Engineering - Politecnico di Torino. Torino
Italy

INTRODUCTION
Run-in can be defined as a process where rubbing parts are subjected to an initial load/speed
condition before they are placed in service. In practice, run-in is often connected with surface
finish and geometric conformity and most industrial run-in procedures are structured and
evaluated on the basis of achieving a specified surface finish. More rarely other criteria are
applied. These may include achieving a specific level of friction in steady state, a constant
operating temperature or a linear wear rate, or developing a uniform surface layer.
Run-in procedures are often empirically determined, as there is little knowledge of how the
sliding surfaces actually respond to run-in. The lack of accurate, predictive models for the
process has often led to a "trial and error" approach.
In the open literature, there is still a controversy about the main purpose of run-in procedures.
Many investigators believe that topographical modifications of the surfaces are the rationale
behind ruIming-in. These modifications include changes in surface roughness, waviness,
roughness distribution characteristics, and lay of scratches. All lead to an increase of the real
area of contact with a corresponding reduction in local stresses and better conformity of the
surfaces. In lubricated systems, such conformity has been shown to result in improved
lubrication. Other investigators indicate surface film formation as the crucial factor to the
success of run-in procedures. Running-in studies are usually based on steel components and
surface films are associated with the formation of iron oxides. A brief review of the
topographical modification and film formation literature is given below.
2

Running-in and Topographical Modifications
The Russians were among the first researchers to study the run-in process in detail. In the 70's,
the concept of equilibrium surface roughness was particularly emphasized. In the Russian
literature. the term equilibrium roughness is used to indicate the reproducible roughness
established at the sliding contact under constant sliding conditions after run-in [1]. The
equilibrium roughness represents the optimum value of roughness for the given sliding
condition, which ensures minimal wear.
Starting from the early 80's, several papers have appeared in the Russian tribology literature
questioning the concept of equilibrium surface roughness. According to Blau [2], this concept
may be valid only if the steady-state regime is characterized by mild wear. For systems in a
more severe wear regime, sequential surface deterioration and cyclic changes in the surface
roughness are more likely to occur [3].
Even if the Russian work is somewhat controversial, it represents one of the very few
systematic approaches which helps to understand the role of the run-in parameters on the
changes of surface roughness. One of the more significant findings was that step-loading
procedures could decrease the run-in time by several orders of magnitude. Works by Bushe
and coworkers [4] suggest that, at any time, the run-in load should be approximately equal to
the load carrying capacity of the surface, i.e. to the maximum load possible without seizure. In
[1], load is indicated as the most important run-in parameter. Up to a critical level, increasing
run-in loads can decrease surface roughness. Above the critical level, the equilibrium
roughness increases. This critical nominal load is mainly related to the yield strength and the
Poisson ratio of the softer material. Above this load, a portion of the real area of contact is
thought to experience plastic deformation.
Calculations for the equilibrium roughness are based on the hypothesis that run-in leads to an
asperity configuration in which an elastic contact is produced [5]. In 1971, Vyatkin [6] studied
3

the friction threshold in initial plastic contacts under conditions of variable contact area, using
a rectangular steel prism sliding along the axis of a steel shaft under boundary lubrication
conditions. He showed that, after run-in, the main roughness characteristics of the sliding pair
are stabilized and that the end of run-in corresponds to a transition into the elastic state of the
asperities. In 1985, Mikhin [7] presented a possible run-in mechanism for materials having
high elastic modulus, primarily metals, for which the initial deformations in the actual contact
area are plastic. The model considers the initial plastic contact between a rigid asperity and an
elastoplastic, perfectly smooth semi-infinite body. The surface asperities are simulated by a
set of hemispheres of the same radius. The run-in process is characterized by a redistribution
of the state of the contact area and ends when the area of elastic deformation equals the area of
plastic deformation.
The idea that run-in causes a gradual increase in the elastic component of deformation of the
contact area and a decrease in the proportion of plastic deformation is also at the basis of the
model suggested by Johnson and coworkers [8]. In particular, it is proposed that run-in be
viewed as a shakedown process. In initially plastic sliding contacts, repeated passages of a
single soft asperity on a hard counterface cause flattening of the asperity by either plastic flow
or wear of the prominent topographic features of the softer surface [9]. The flattening of the
asperities causes the contact area to grow and the corresponding contact pressures to decrease.
When the contact pressures drop to the shakedown limit, further sliding involve no more
plastic flow. Run-in is completed when the height and curvature of the plastically deformed
asperities are reduced such that, in the run-in state, the local contact pressures are equal to or
less than the shakedown pressure.
The asperity shakedown pressure is directly proportional to the yield stress of the softer
surface and is a function of the coefficient of friction. The value of the shakedown pressure
can increase during sliding if the material strain hardens [10-11]. On a global scale, the limit
4

to shakedown is when all the softer asperities are deformed to a flat profile. In this condition.
the two surfaces carry the maximum possible shakedown load. Above this load. the softer
material will experience continuous plastic deformation.
Running-in and Film Formation
In 1947, Sakmann [12] reported the results of run-in tests performed on chromium-steel flats
under conditions of boundary lubrication. Together with surface smoothing, he observed the
formation of a carbide-rich phase on the steel surface. The carbon is set free from thermal
decomposition of the lubricant during run-in. A few years later, Shchedrov [13] stated that the
mechanical changes in the surface of a material associated with any wear phenomenon lead to
a physical state and structure in which the surface layer has the minimum potential energy.
After run-in, the surface microstructure is a stable system that, under the given conditions,
permits the minimum dissipation of energy. Rigney and Hirth [14] argue that an ideal material
should have a low-hardening rate near the surface and a much higher rate in the bulk to force
deformation towards the surface, reduce friction and minimize the size of wear debris. The
primary function of run-in is the formation of a very fine microstructure, capable of sustaining
the extensive plastic deformations that occur in sliding.
Lyubarskii [15] showed that the wear resistance of steel is essentially determined by the layer
formed during run-in. The hardness of surface layers may exceed that of martensite. The
increased hardness of surface layers has been associated with extensive plastic deformation
[16] and oxide formation [17]. Garbar [18] suggested that during run-in the changes of the
profile and the structure of metal surfaces occur simultaneously and that the equilibrium
surface roughness and the equilibrium structure of the surface layer are achieved at the same
time.
5

In [19-20], Christensen reported that, after run-in, the softer surface tends to conform to the
roughness of the harder surface. He also observed that, during run-in, surface roughness is not
greatly altered although tribological properties may be greatly enhanced. In 1967, Fein [21]
showed that changes in the surface topography of radially loaded steel disks were limited to
the beginning of the run-in process and could not account for the observed effect that more
gradual and longer step-loading procedures could significantly improve scuffing resistance.
Surface etching of the disk did not reveal any metallurgical transformation, while infrared
spectroscopy and X-ray diffraction, respectively, indicate the presence of a "friction polymer"
and iron oxides.
Formation of oxides has been reported in a number of papers. Montgomery [22] ascribed the
smoothing during run-in of cylinder liners made of cast iron to the covering of asperities with
glaze, consisting mainly of graphite and iron oxide (Fe304). Kang and Ludema [23] reported
the formation of Fe304 on lubricated steel cylinders slid against flat steel surfaces. They
indicated that proper break-in of a surface is achieved when the film is about 400 A. Works by
Eyre and coworkers [24-25] show the formation of hard surface layers in aluminum alloys run
in against steel. X-ray diffraction indicates that the surface layer consists of both aluminum
oxide and AI-Fe intermetallic compounds. Konishi et al. [26] observed that the scuffing
resistance of aluminum-silicon alloys increased when running in water. X-ray photoelectron
spectroscopy reveals the presence of aluminum oxide and silicon oxide on the aluminum
silicon surface.
Literature works on run-in usually refer to topographical modifications or to film formation
alone. In very few papers, the two aspects are considered together. The most notable example
is a paper published by Fein [21] in 1967 on the running in of steel surfaces lubricated by
mineral oil. To the authors' knowledge, no similar work has been carried out for an
6

aluminum/steel contact. In addition, no data are available in the literature on the running in of
mating surfaces under starved lubrication conditions.
The aim of the present paper is to examine topographical modifications and film formation as
a consequence of different run-in procedures. Effects of run-in pressure, velocity and time are
evaluated. Limited data on the effect of the degree of contact starvation are also obtained. The
material combination used is 390-T6 aluminum pins sliding on 1018 carburized steel disks.
The contact is lubricated by a base polyalkylene glycol (PAG) lubricant mist carried by a
tetrafluoroethane (RI34a) refrigerant gas under starved conditions. The material combination,
lubricant and refrigerant are chosen to approximately simulate critical contacts in compressors
for air conditioning and refrigeration system. It is felt, however, that the results obtained are
applicable to other systems composed of similar materials and operating under starved
lubrication conditions.
EXPERIMENTAL SETUP
Tribometer
A schematic of the test chamber of the tribometer is shown in Figure 1. The chamber can be
pressurized to values up to 1.72 MPa, while the environmental temperature can be raised up to
120 DC by cartridge heaters. The desired temperature of the contact is obtained by pumping
heat transfer fluid through the spindle. The temperature of the fluid is controlled within a
0.1 DC accuracy by an external unit which is capable of maintaining constant temperatures
from -10 to l30D C. The lower specimen is secured in place by a specimen holder and the
upper specimen is attached to the rotating spindle. The force transducer, which is outfitted
with an intricate array of strain gages, is used to measure the applied normal load and
7

frictional torque during a test. A contact load up to 4.45 kN can be applied to the specimens.
Control boards and a set of solid-state relays allows for computer control of the axial load and
of the angular velocity of the spindle. A software program provides the desired load and
velocity sequences.
Indirect information about the regime of lubrication, the formation of protective surface films
and the extent of metal-to-metal contact can be obtained by means of an apparatus for electric
contact resistance measurement between the test specimens. The measurement range of the
circuit used is 10.6 - 10+4 Q. This sensitivity was achieved by the development of a special
four-terminal measurement circuit incorporating methods of noise suppression and data
processing. A more detailed description of the circuit is given elsewhere [27].
Geometry of Contact
A pin-on-disk area contact was used in the study. A schematic of the geometry of the contact
is given in Figure 2. The spherical socket in which the aluminum pin is positioned allows for
self-alignment of the pin/disk interface and, therefore, should produce a global even pressure
distribution. The subsurface temperature is measured by a miniature thermocouple implanted
2 mm below the sliding surface of the pin.
Materials Tested
In all the experiments the disk was made of 1018 carburized steel with an average hardness of
62 HRC, while the pin specimen was made of 390-T6 aluminum (72 HRB). 390-T6
aluminum is widely used in combination with steel in tribological applications. In particular,
such material combination is found in automotive swashplate compressors. Data for the
chemical composition of 390-T6 aluminum are provided in Table 1.
8

The tests were conducted with an average surface roughness for the disk of 0.05 !Jm Ra. Three
values of surface rouglmess for the pin specimen were tested (0.03 !Jm Ra, 0.15 !Jm Ra. and
0.80 ~lm Ra). Most of the tests were conducted with the 0.15 !Jm Ra pin specimens. In all
tests. a 6.35 mm diameter pin was used.
Test Conditions
The environmental temperature and the sliding velocity were kept constant for each run-in
procedure. Most of the run-in tests were conducted at a constant load. In a limited number of
tests, the run-in load was increased stepwise.
Starved lubrications were obtained by applying various amounts of an uncapped PAG
lubricant on the surface of the upper specimen (disk) through the lubricant delivery system
shown in Fig.I. Data for the PAG lubricant used are given in Table 2. A pre-determined
weight proportion of P AG was added to the liquid refrigerant in the pressure vessel. The
desired amount of lubricant was fed to the contact region through a nozzle by heating the
pressure vessel. The one-phase lubricant/refrigerant mixture flows through the nozzle and, due
to the environmental conditions in the test chamber, a lubricant mist is carried to the contact
by the refrigerant gas. The average lubricant supply rate (LSR) was determined based on the
weight difference of the lubricant divided by the test duration. The carrier gas used for the
lubricant and the test environment is R134a refrigerant. Note that, for all the tests conducted,
the separation between the top of the nozzle and the upper specimen (disk) is such as to make
the diameter of the base of the spray cone approximately equal to the diameter of the test pins
(Fig. 1).
In order to approximately simulate the environmental conditions at the plate/shoe contact of
an automotive swashplate compressor, all tests were conducted at an environmental
temperature and pressure of 121°C and 0.17 MPa, respectively. The test chamber was initially
9
purged to a vacuum of 0.2 torr to remove as much oxygen and water vapor as possible from
the chamber. This vacuum is more than adequate for air-conditioning and refrigeration
systems. After purging, the test is initiated with continuous spraying of a lubricant/refrigerant
mixture. The chamber pressure was kept constant during the test by means of a pressure
release valve.
RESUL TS AND DISCUSSION
All pin and disk specimens were traced before and after run-in. Data for the disks are not
reported since there was no significant difference in the traces between run-in procedures. The
profilometer used is a Dektak with a 2.5 ).tm conical diamond stylus. Some of the pin
specimens were analyzed through Auger Electron Spectroscopy (AES), X-ray Photoelectron
Spectroscopy (XPS) and X-ray diffraction to determine the chemical composition of the
surface layer. Ellipsometry was used to study the thin surface films in terms of homogeneity
and thickness, while Scanning Electron Microscopy (SEM) was used to look at both the
surface and subsurface of the pin specimens.
As previously stated, this paper focuses on the effect of the different parameters (pressure,
velocity and time) on the topographical modifications and film formation during run-in. Three
different roughness levels for the aluminum specimen are considered. For the two smoother
sets of pins, the Kapoor and Johnson maps [9] predict that the sliding pair is in the elastic state
at the initiation of run-in. For the rougher specimens, repeated plastic flow is believed to occur
in the initial stages of run-in.
Results are first given for the 0.15 ).tm Ra pins, as most of the tests were run for this roughness
value. The effect of roughness on run-in is discussed separately at the end of this section.
10

Effect of Pressure
Table 3 provides average data for the roughness and skewness values of the pin specimen
before and after run-in. Data are for a run-in velocity of 1.86 mls and a run-in time of 10
minutes. The LSR is 40 mg/min.
As pointed out in [28], when the run-in conditions do not cause significant wear loss, the
major effect to monitor is the loss of symmetry of the asperity height distribution during
running. In this work, the loss of symmetry is measured by the surface skewness. If the
surface has deeper valleys than peaks, the skewness will be some negative value. Run in
surfaces generally exhibit negative skewness. It is known that, in some tribological
applications, surfaces with a negative skewness are beneficial under mixed or boundary
lubrication conditions.
Table 3 reports average roughness and skewness values as a function of run-in pressure for a
sliding velocity of 1.86 m/s. It is seen that the roughness decreases slightly as the run-in
pressure increases. A similar trend was observed for other sliding velocities. In Table 3,
pressure levels higher than 10.5 MPa were not considered since extensive surface damage was
observed on the specimen.
An AES chemical analysis of the run in pins shows that, for a given run-in velocity, the main
effect of an increased run-in pressure is to increase the percentage of iron on the surface
(Fig.3). Observation through SEM reveals the presence of white patches on the run in
specimens (Fig.4). The AES analysis shows that, on these patches, the iron content is very
high (around 45% to a depth of tenths of microns). A XPS analysis indicates that the iron is
present in part as an iron oxide, in part either as an element or as an intermetallic AI-Fe
compound.
The transfer of iron from the counterface is most likely due to the abrasion of the steel disk by
the silicon particles in the aluminum pins. For these run-in procedures, the amount of wear
11

debris is very limited. Transfer of iron from steel disks sliding against aluminum-silicon
alloys was also reported by Razavizadeh and Eyre [29]. The higher the content of silicon in
the alloy, the higher was the observed transfer of iron to the aluminum pins. In aluminum
alloy matrix composites sliding against steel, iron was found to transfer to the aluminum
counterface due to the micro cutting of the steel by the SiC particles [30].
According to Razavizadeh and Eyre [29], the iron transferred diffuses into the pm and
increases the stability of the oxide film formed on the aluminum surface by blocking the
movement of dislocations, thus increasing the yield strength of the layer. In a paper on the
fi·iction and wear of aluminum alloys containing copper and zinc sliding against steel
counterfaces, Beesley and Eyre also reported the formation of intermetallic AI-Fe compounds
on the aluminum surface [24]. It is known that iron diffuses quite slowly into aluminum.
Frictional heating may enhance the rate of diffusion [31]. It is also possible that the iron is
mixed within the very thin surface layer through a process similar to that of mechanical
alloying, as seen for the dry case [32].
If the load is increased stepwise, a pressure higher than 10.5 MPa can be applied for a speed
of 1.86 m/s without causing extensive surface damage. Figure 5 shows a SEM picture of a pin
specimen run in up to 28 MPa with a load step equivalent to 7 MPa and a time step of 10
minutes, at a velocity of 1.86 m/s and a LSR of 40 mg/min. Instead of isolated patches, the
build-up of a uniform surface layer is observed. An AES analysis indicates that the surface
layer is a few micron thick and is rich in oxygen and iron. XPS shows the presence of
aluminum oxide, iron oxide (presumably in the form of Fe304) and iron, probably as AI-Fe
intermetallic compounds. The results are confirmed by X-ray diffraction. The intermetallic
compound is believed to be either AIFe3 or A12Fe. Ellipsometry confirms the presence of a
uniform surface layer (uniform optical properties).
12

Effect of VeJocity
The effect of run-in velocity is not straightforward. It is generally acknowledged that higher
velocities increase the severity of run-in due to aggravated thermal conditions but higher
velocities may also accelerate oxide formation.
Table 4 provides average data for the roughness and skewness values of the pins before and
after run-in. Data are for a run-in load of3.5 MPa and a run-in time of 10 minutes. The LSR is
40 mg/min. The smoothing effect is very limited at all velocities. Pins run in at higher
velocity seem to exhibit slightly more negative skewness.
An AES chemical analysis of the run in pin specimens shows that higher run-in velocities
increase the amount of oxygen on the surface (Fig.6). Higher velocities cause higher flash
temperatures as well as higher number of cycles for a given run-in time. However, the higher
level of oxygen is limited to the surface and does not seem to playa significant role in film
formation.
Effect of Time
Surface traces indicate that most of the changes in the profile occurs within the first minutes
of sliding and that little, if any, additional changes take place with further running. At all
velocities, no significant differences were observed in the roughness and skewness for
specimens run in for 2, 5, 10 and 20 minutes. Table 5 provides average data for the roughness
and skewness values of the pins before and after run-in for a sliding velocity of 1.86 m/s.
Results agree substantially with data obtained by Fein [21].
An AES chemical analysis indicates that the amount of iron transferred from the pin to the
disk increases significantly between pins run for 2, 5 and 10 minutes. No appreciable
difference was, on the contrary, observed in the number and size of iron patches in pins run
for 10 or 20 minutes.
13

Effect of Friction
The fonner results suggest that the run-in pressure is very important to the formation and
strength characteristics of the surface layer. The higher the pressure, the higher is the amount
of iron transferred to the surface of the aluminum pin.
It is clear that the run-in pressure, and in general the severity of the sliding conditions, can be
increased only if no significant damage is done to the surface. Results indicate that the level of
friction during run-in affects the degree of damage of the surface and, therefore, the
effectiveness of the run-in procedure. This result is not surprising since the level of friction
affects both the stress state and the surface and subsurface temperatures.
For a given run-in velocity, a transition in the coefficient of friction was observed as the run
in pressure is increased. For increasing run-in velocity, the value of the run-in pressure at
which high friction conditions occur was seen to decrease. The transition between low friction
and high friction conditions can be roughly described by a PV= constant relationship, where P
is the apparent contact run-in pressure and V is the run-in velocity. Increasing lubricant supply
rates were seen to increase the value of the PV product at transition, i.e. the PV product at
which high friction conditions are first observed.
Figure 7 shows the transition regions as a function of P and V. For velocities above 3.30 mis,
run-in procedures were characterized by low coefficients of friction (f= 0.04 - 0.06) up to run
in pressures that caused extensive surface damage. In the latter case, the friction coefficient
during run-in was above 0.1"5 and would remain high for the whole run-in duration, when not
causing seizure. Run in pins would be rougher and the surface damage extensive.
For velocities up to 3.30 mis, between the region of low friction (no significant surface
damage) and the region of high friction (extensive surface damage) an intermediate region
exists, where conditions of moderate-high friction (f == 0.1), as well as of low friction were
observed for the same run-in procedure. In both cases, the coefficient of friction decreased
14

with time to reach a steady state value and did not remain high for the whole run-in duration
as in the high friction case (Fig.8). The surface of pin specimens run in under conditions of
moderate-high friction appears smooth; only a careful examination through SEM showed
local surface damage (Fig.9).
The reason behind the existence of the intermediate region, i.e. the existence of a region in the
PV plane where specimens run in under the same conditions exhibit a different friction level,
is still not completely clear. Surface traces did not reveal any significant difference in the
topography of the various pins and disks used in the study, except for a limited difference in
the skewness of the pins. The average skewness for pins that exhibited a low friction behavior
was minus 0.7, while for moderate-high friction pins the average skewness was around zero.
Other factors which could contribute to the existence of the intermediate region include: (a)
slope of the asperities on the disk, (b) crowning of pins, (c) small changes in the LSR during
the test, (d) surface porosity of pins, ( e) number and size of silicon particles on the surface of
the pins and (f) parallelism of the contacting surfaces. After a careful examination, none of
these factors could be correlated to the results obtained. As such, it was concluded that
skewness was the major contributor to the observed behavior. Negative values for the
skewness are known to increase the lubrication effectiveness, especially under starved
lubrication conditions.
Effect of Lubricant Supply Rate
Figure 10 shows the effect of LSR on the friction conditions during run-in at different PV
values. Most of the data presented in Fig. 10 are based on a sliding velocity of 1.86 m/s. It is
felt, however, that the results are representative of a wider range of velocities, as indicated in
Fig. 7, which shows that friction transitions are approximately governed by a PV= constant
relationship.
15

As previously indicated, a higher LSR allows for higher run-in pressures and velocities under
conditions of low friction. The increase in the PV product at transition is particularly
significant between 20 mg/min and 30 mg/min. For higher LSR, the value of the PV product
at transition seems to still increase with the LSR but at a smaller rate.
No intermediate region of low and moderate-high friction was observed at 20 mg/min. Pins
either scuff or were severely damaged unless the run-in pressure was kept very low. However,
an intermediate region was observed for LSR above or equal to 30 mg/min.
If low friction conditions can be obtained at a given LSR, a higher LSR generally results in
less iron transfer for the same run-in procedure. No significant difference was observed in the
surface profile of the pin specimens for the different lubricant supply rates.
Effect of Roughness
For the 0.03 ).lm Ra pin specimens, results reproduce the trend observed for the 0.15 ).lm Ra
pins. As expected, surface traces indicate no appreciable change in the profile after run-in. An
AES chemical analysis shows that iron is still transferred from the disk to the pin but at a
slower rate. In the 0.03 ).lm Ra pins, silicon particles cause less abrasion on the disk.
For the 0.80 ).lm Ra pin specimens, surface traces indicate that the smoothing during run-in is
more significant (Table 6). In particular, increased run-in pressures cause a smoother surface
of the pin after run-in. The extent of surface smoothing is shown in Figure 11. In the process of
smoothing, the surface layer is known to work harden [2]. This highly deformed surface layer
may explain why rough surfaces are generally believed to be more successfully run in [33].
Again, changes in surface roughness seem to be limited to the first minutes of operation
(Table 7).
For the 0.80 ).lm Ra pin specimens, the AES chemical analysis can no longer be carried out on
large areas (order of millimiters) due to the higher sensitivity to carbon of the Auger
16

instrument in the presence of rough surfaces or any type of surface irregularities. Only by
limiting the area of analysis to few microns can the surface roughness and voids be avoided
and the results of the elemental analysis become significant. A comparison with the previous
data is therefore very difficult, as results depend largely on the area chosen and do not
represent average data.
Figure 12 is an optical microphotograph of a 0.80 f.lm Ra run in specimen which shows the
presence of dark dots. These dots are the tips of the asperities that become black after run-in
as a consequence of film formation. For the 0.80 f.lm Ra specimens, film formation is
therefore limited to the tips of the asperities and does not involve the surface as seen for
smoother pins.
For both 0.03 f.lm Ra and 0.80 f.lm Ra pins, the value of the PV product during run-in can be
used as a guideline to distinguish between low friction and high friction run-in procedures.
Higher lubricant supply rates cause an increase in the value of the PV product at transition.
For these roughness values, no intermediate region was found where conditions of low
friction or moderate-high friction could be observed for the same run-in procedure. In
particular, for run-in conditions that did not lead to extensive surface damage, the level of
friction during run-in was always in the 0.02 to 0.04 range for the 0.03 f.lm Ra pins and in the
0.08 to 0.1 range for the 0.80 f.lm Ra pins. It is believed that the intermediate region did not
exist since, for the 0.03 f.lm Ra pins, differences in the value of the skewness were extremely
limited, while the differences observed among the 0.80 f.lm Ra pins were greater than for the
0.03 f.lm Ra pins but still quite limited (Table 6).
17

SUMMARY OF THE RESULTS
Different run-in procedures are analyzed for 390-T6 aluminum pins sliding against 1018
carburized steel disks. The contact is lubricated with a PAG lubricant mist carried by R 134a
refrigerant gas under starved lubrication conditions. Effects of run-in pressure, velocity, time
as well as surface roughness are evaluated. The experimental results can be summarized as
follows:
1. For the three roughness values tested, smoothing increased for increasing run-in pressure.
Higher velocities produce a more negative skewness. Surface traces indicate that most of
the changes in the surface profile occur within the first minutes of sliding and that little, if
any, additional changes take place with further running.
2. Formation of aluminum and iron oxides, as well as of AI-Fe intermetallic compounds, was
observed on the surface of the aluminum pins. In particular, iron was observed to transfer
from the disk to the pin during run-in. The transfer is due to the abrasive action of the
silicon particles on the steel disk.
3. The amount of iron transferred was observed to increase for increasing run-in pressure.
For a given run-in velocity, it was observed that the run-in pressure could be increased as
long as the coefficient of friction during run-in remains low (f::s; O.l). Higher coefficients
of friction were observed to cause local surface damage on the run in surface.
4. The transfer of iron was observed to increase for increasing run-in time, eventually
reaching a constant level. Smoother pins seem to need longer run-in time to reach the
asymptote.
5. Higher run-in velocities were found to increase the percentage of oxygen on the surface.
The penetration of the oxygen, however, was limited and did not seem to significantly
affect film formation.
18

6. For all pins tested. the value of the PV product during nill-in could be used as a guideline
to distinguish between conditions of low friction (no significant surface damage) and of
high friction (extensive surface damage). By increasing the LSR, low friction conditions
were still possible at higher PV values.
7. For the 0.15 I-lm Ra pins which exhibited significant initial skewness difference, an
intermediate region was found where conditions of low friction and moderate-high friction
existed for the same run-in procedure. Under conditions of moderate-high friction, run in
pins would remain smooth but local surface damage was observed. In this intermediate
region, negative values for the skewness seem to favor the low friction conditions.
ACKNOWLEDGMENT
The authors are grateful for the financial support by the Air Conditioning and Refrigeration
Center, Mechanical and Industrial Engineering at the University of Illinois at Urbana
Champaign.
19
REFERENCES
[1] I.V. Kragelsky, M.N. Dobychin, V.S. Kombalov, Friction and Wear Calculation Methods.
Pergamon Press, New York, 1982.
[2] P.ol. Blau, Friction and Wear Transitions of Materials, Noyes Publications, Park Ridge,
New Jersey, 1989.
[3] PJ. Blau, Wear, 72 (1981), 55-66.
[4] N.A. Bushe, 1.1. Karasik, N.M. Alekseev, Soviet Journal of Friction and Wear, 1:3 (1980),
4-10.
[5] LV. Kragelsky, V.S. Kombalov, Wear, 14 (1969), 137-140.
[6] LA. Vyatkin, The Nature of Friction between Solids, Nauka and Tekhnika Press, Minsk,
1971, p. 362-366.
[7] N.M. Mikhin, Soviet Journal of Friction and Wear, 6:5 (1985), 27-30.
[8] K.L. Johnson, Wear, 190 (1995), 162-170.
[9] A. Kapoor, J.A. Williams, K.L. Johnson, Wear, 175 (1994), 81-92.
[10] A. Kapoor, K.L. Johnson, Int. J. Mech. Sci., 34 (1992), 223-239.
[11] K.L. Johnson, H.R. Shercliff, Int. J. Mech. Sci., 34 (1992), 375-394.
[12] B.W. Sakmann, J. Appl. Mechs., 14 (1947), 43-52.
[13] V.S. Shchedrov, Friction and Wear of Machines, Acad. Sci. USSR, Moscow- Leningrad,
1950,3-12.
[14] D.A. Rigney, J.P. Hirth, Wear, 53 (1979), 345-370.
[15] LM. Lyubarskii, Increasing the Wear Resistance of Heavily Loaded Gears,
Maskinostroenie Press, Moscow, 1965.
[16] B.L Kostetskiy, Wear Resistance of Machine Components, Mashgiz Press, Moscow-
Kiev, 1950.
[17] P.K. Topekha, Types of Wear, Mashgiz Press, Moscow- Kiev, 1952.
[18] 1.1. Garbar, Soviet Journal of Friction and Wear, 6:3 (1985), 56-62.
[19] H. Christensen, Acta. Poly tech. Scand.Mech. Eng. Ser. No 25, 1966.
[20] R. Ostvik, H. Christensen, Proc. Inst. Mech. Eng., 183: 3P (1968), 57-66.
[21] R.S. Fein, ASLE Transactions, 10 (1967), 373-385.
20

[22] R.S. Montgomery, Wear, 14 (1969), 99-105.
[23] S.c. Kang, K.c. Ludema, Wear, 108 (1986), 375-384.
[24] C. Beesley, T.S. Eyre, Tribology International, 9 (1976), 63-69.
[25] T.S. Eyre, in: Vander Voort and McCall (eds), Microstructural Science, Stevens, 8
(1980),141-151.
[26] T. Konishi, E.E. Klaus, 1.L. Duda, Tribology Transactions, 39 (1996),111-118.
[27] T.K. Sheiretov, Scuffing of Aluminum/Steel Contacts under Dry Sliding Conditions,
Ph.D. Thesis, University of Illinois at Urbana-Champaign, 1997.
[28] T.R. Thomas in: D. Dowson (ed), Surface Roughness Effects in Lubrication, Proceedings
of 4th Leeds-Lyon Symposium on Tribology, Tribology Series, Elsevier Science,
Amsterdam, 1977,99-108.
[29] K. Razavizadeh, T.S. Eyre, Wear, 87 (1982), 261-271.
[30] Q.Wang, H.S. Cheng, c.A. Caracostas, M.E. Fine, STLE Tribology Transactions, 31
(1993), 735-742.
[31] T.F.J. Quinn, Tribology International, 16 (1983), 257-305.
[32] T.K. Sheiretov, H.K. Yoon, C. Cusano, STLE Tribology Transactions, 41:4 (1998), 435-
446.
[33] A.V. Sreenath, N. Raman, Wear, 38 (1976), 271-289.
21

Table 1 - Chemical composition of390-T6 aluminum
Alloying elements, % by weight
Al Si Cu Fe Mn Mg Zn Ti
76.0 16.0-18.5 3.0-4.0 1.0 0.5 0.4-1.0 1.0 0.25
Table 2 - Data for the lubricant tested
Designation Lubricant Type Family Additives Density Viscosity, cS (g/ml) at 40 DC at 100 DC
PAG Polyalkylene glycol Uncapped NO 0.990 49.5 I 9.8
Table 3 - Average roughness and skewness values of 0.15 /lm Ra pins before and after run-in, as a function of run-in pressure.
Run-in velocity= 1.86 mis, Run-in time= 600 s, LSR= 40 mgl min
Run-in Pressure Ra before (/lm) Ra after (/lm) Skewness before Skewness after
(MPa)
3.5 0.13-0.18 0.10-0.14 + 0.18- (- 0.90) - 0.20 - (-0.90)
7.0 0.13-0.18 0.09-0.11 + 0.18- (- 0.90) - 0.20 - (-1.00)
10.5 0.13-0.18 0.08-0.11 + 0.18- (- 0.90) - 0.40 - (-0.90)
Table 4 - Average roughness and skewness values of 0.15 /lm Ra pins before and after run-in, as a function of run-in velocity.
Run-in pressure= 3.5 MPa, Run-in time= 600 s, LSR= 40 mgl min
Run-in Velocity Ra before (/lm) Ra after (/lm) Skewness before Skewness after
(m/s)
0.93 0.13-0.18 0.13-0.16 + 0.18- (- 0.90) - 0.20 - (-0.90)
1.44 0.13-0.18 0.10-0.15 + 0.18- (- 0.90) - 0.20 - (-0.90)
1.86 0.13-0.18 0.10-0.14 + 0.18- (- 0.90) - 0.20 - (-0.90)
3.30 0.13-0.18 0.10-0.13 + 0.18- (- 0.90) - 0.60 - (-1.20)
3.72 0.13-0.18 0.11-0.18 + 0.18- (- 0.90) -0.80-(-1.40)
22

Table 5 - Average roughness and skewness values of 0.15 !lm Ra pins before and after run-in, as a function of run-in time.
Run-in Pressure= 7 MPa, Run-in velocity= 1.86 mis, LSR= 40 mgl min
Run-in Time (s) Ra before (!lm) Ra after (!lm) Skewness before Skewness after
120 0.13-0.18 0.10-0.11 + 0.18- (- 0.90) - 0.20 - (-0.90)
300 0.13-0.18 0.09-0.11 + 0.18- (- 0.90) - 0.20 - (-0.90)
600 0.13-0.18 0.09-0.11 + 0.18- (- 0.90) - 0.20 - (-1.00)
1200 0.13-0.18 0.OS-0.11 + O.1S- (- 0.90) - 0.20 - (-1.00)
Table 6 - Average roughness and skewness values of 0.80 !lm Ra pins before and after run-in, as a function of run-in pressure.
Run-in velocity= 1.86 mis, Run-in time= 600 s, LSR= 40 mgl min
Run-in Pressure Ra before (!lm) Ra after (!lm) Skewness before Skewness after
(MPa) '1 0.75-0.85 0.65-0.70 + 0.15- (- 0.20) 0.0 - (-0.30) -'
5 0.75-0.85 0.55-0.70 + 0.15- (- 0.20) 0.0 - (-0.40)
7 0.75-0.85 0.55-0.65 + 0.15- (- 0.20) 0.0 - (-0.40)
Table 7 - Average roughness and skewness values ofO.SO !lm Ra pins before and after run-in, as a function of run-in time.
Run-in pressure= 5 MPa, Run-in velocity= 1.86 mis, LSR= 40 mgl min
Run-in Time (s) Ra before (!lm) Ra after (!lm) Skewness before Skewness after
120 0.75-0.85 0.60-0.70 + 0.15- (- 0.20) 0.0 - (-0.40)
300 0.75-0.85 0.55-0.70 + 0.15- (- 0.20) 0.0 - (-0.40)
600 0.75-0.85 0.55-0.70 + 0.15- (- 0.20) 0.0 - (-0.40)
23

Fluid Pressure Vessel -10° to 13
5 Amp Variac (0 - 120 V)
Heater Nozzle
Load
Lower Specimen
Fig.! - Schematic of the test chamber and a lubricant/ refrigerant delivery system
24

76.2 mm -------I~
---I.~I 22.2 mm .---
1018 Carburized Steel Disc (Rotating)
06.35 mm 390-T6 Aluminum
Pin (Stationary)
Miniature Thermocouple
Contact Resistance Measurement
Fig. 2 - Geometry of contact
25

Fig. 4 - Surface of a 0.15 J.lm Ra run in pin. Run-in pressure= 7 MPa,
Run-in velocity= 1.86 mis, Run-in time= 600 s, LSR= 40 mg/ min.
(left) 200 X (right) 800 X
Fig. 5 - Surface of a 0.15 J.lm Ra run in under steploading.
Final run-in pressure= 28 MPa, Step-pressure= 7 MPa, Run-in velocity= 1.86 mis,
Step time= 600 s, LSR= 40 mg/ min, (left) 200 X, (right) 800 X
27

Run-in conditions 70 ~-,--c---'-r-T-"-'-rc--,!"-,, ,I ,I -----"11---r1--.-r'l-"'~;;;; __ ;;:;;_;;:I:=-~:;::3n=o.5""rMu""n;;;'p-;::;;;ian;;;, ::;:;:1 ;;;;.a""e=m""/""s· ;;;:;;;:;;"" .. , Tl-~
:N eo t------~------------------'----------'---- --~ 50 ~\-------~----------;----------------------~---. 3.5 MPa, 3.72 m/s
8 ; : 1 c o
C) 40
()
'E o ~ c <J) OJ
5<' o
30
20
10 0-,-
,
a 0 0.05 0.1 0.15 0.2 0.25 0.3 0.35 0.4
Depth, )J.m
Fig.6 --- AES chemical analysis on 0.15 ).lm Ra run in pin specimens.
Run-in time= 600 S, LSR= 40 mg/min
28

25
~ 20 r····int:l~~~··I············.······················· ..•....................... 0.. 15 l _____ --- regIQrl\ __ -.~--- --- ----- -:---- ---------:--- --- -- -- ---:- ---- ----- -- --- --- -- ---~ t -: '-~ :high fricti~n conditidns ~ t- • : ,_ _. (f>.1.5) _____ '-______1 ~ 10 c.----------~-------- -G-.------~--:------------:---- --1 ~ ! ~
5 [ ··(~~~~~~~t~)·c;~;~~:::!-~<cm~~-~1 c
"
C ::::l
oc
a LL_' I I I I .L I I I I I I '~ __ L_l._L __ L._-' I I I ' ___ LJ
0.5 1 1.5 2 2.5 3 3.5 4 Run-in Velocity, V (m/s)
Fig. 7 - Friction map as a function of run-in pressure and velocity. Ra= 0.15 flm, LSR= 40 mg/min
29

0.20 ~~·~,·-~c
o 100
0
[!
140 ·--r (>
130
0 120 (1)- 11" ... ::; 110 ~
m ill 100 0.. E (1)
90 I-~
"5 80 co
60
0 100
low friction (P=1 0.5 MPa, v=1.44 m/s) moderate-high friction (P=1 0.5 MPa, v=1.44 m/s) high friction (P=15 MPa, v= 1.44 m/s)
200 300 Time, S
400
low friction (P=1 0.5 MPa, v=1.44 m/s)
500
moderate-high friction (P=10.5 MPa, v=1.44 m/s) high friction (P:::15 MPa, v=1.44 m/s)
,.....-mz.-.-.--::*~::;.~~~~~-~~~~
I I I I I i I
200 300 400 500 Time, s
600
'~-i
i .J
I j
600
Fig. 8 - Friction and bulk temperature data plots for different friction conditions
during run-in. Ra= 0.15 /-lm, LSR= 40 mg/min.
30

Fig.9 - Surface of a 0.15 J.lm Ra pin run in under conditions of moderate-high friction.
Run-in pressure= 10.5 MPa, Run-in velocity= 1.44 mis, Run-in time= 1200 s,
LSR= 40 mg/ min. (left) 100 X, (right) 800 X
31

en --E co
0...
6-> 0... c ·T C :J 0::
35 L , ;-
30 I~
I 25 I
I t
20 [-
15
10
5
0 ,
10
I I
,
20
i I iii ii,
high friction condifion$
. : intermediate: -t) --- ...... : --- ----- -region-- -----
_. __ lowfr'i<;:~i9n ___ ,._ .. __ conditions
30 40 50 60 70 Lubricant Supply Rate, LSR (mg/min)
80
Fig.l0 - Friction map as a function of run-in pressure and velocity and lubricant supply rate. Ra= 0.15 ~m
32
90

Fig.IIa- Surface of a virgin 0.80 J.1m Ra pin. (left) 200 X, (right) 800 X
Fig. I I b - Surface of a 0.80 J.1m Ra pin run in for 10 minutes.
Run-in pressure= 5 MPa, Run-in velocity= 1.86 mis, LSR= 40 mg/min.
(left) 200 X, (right) 800 X
33

Fig.12 - Optical microphotograph of a 0.80 J..lm Ra run in specimen. 1.5 x.
Run-in pressure= 5 MPa, Run-in velocity= 1.86 mis, Run-in time= 600 s,
LSR= 40 mg/min
34
RUNNING-IN OF ALUMINUM/STEEL CONTACTS UNDER STARVED
LUBRICA TION - PART II: EFFECTS ON SCUFFING
Maria Pia Cavatorta t, Cris Cusano
Department of Mechanical and Industrial Engineering.
University of Illinois at Urbana-Champaign
Urbana, Illinois
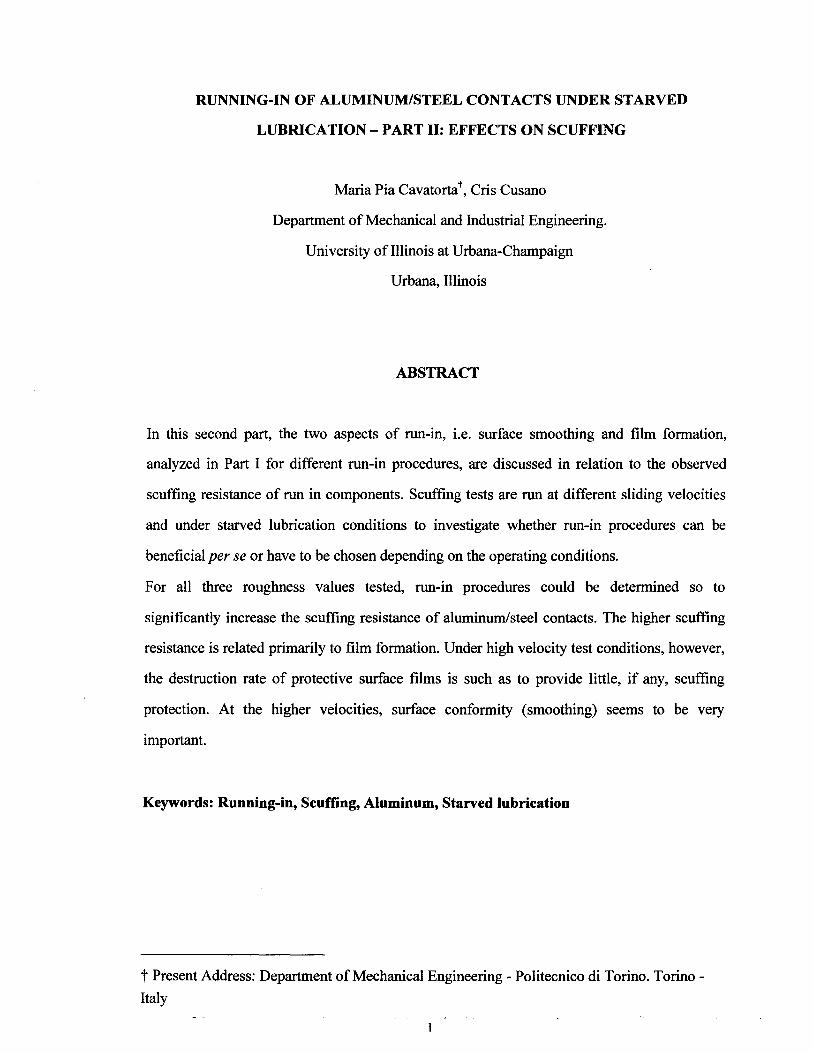
ABSTRACT
In this second part, the two aspects of run-in, i.e. surface smoothing and film formation,
analyzed in Part I for different run-in procedures, are discussed in relation to the observed
scuffing resistance of run in components. Scuffing tests are run at different sliding velocities
and under starved lubrication conditions to investigate whether run-in procedures can be
beneficial per se or have to be chosen depending on the operating conditions.
For all three roughness values tested, run-in procedures could be determined so to
significantly increase the scuffing resistance of aluminum/steel contacts. The higher scuffing
resistance is related primarily to film formation. Under high velocity test conditions, however,
the destruction rate of protective surface films is such as to provide little, if any, scuffing
protection. At the higher velocities, surface conformity (smoothing) seems to be very
important.
Keywords: Running-in, Scuffing, Aluminum, Starved lubrication
t Present Address: Department of Mechanical Engineering - Politecnico di Torino. Torino
Italy

INTRODUCTION
The literature on the effects of run-in on scuffing is very limited. Few works indicate that
surface smoothing is the main reason for running in surfaces to reduce scuffing failures.
Christensen [1] reported that after a successful run-in, surfaces may end up working under
pure, or almost pure, hydrodynamic conditions. In a series of experiments on scuffing of steel
disks, the electric resistance of the oil film was measured to monitor the effect of run-in
procedures on the number of asperity contacts. It was found that the level of asperity
interaction decreases with running time and that such decrease is particularly significant at the
beginning of the run-in process or immediately after a load increase. More recently, Kelly et
al. [2] showed that prior running at lower than test sliding velocity enhances scuffing
resistance of case hardened steel disks lubricated with mineral oil. No significant layer
formation was observed in the specimens prior to scuffing and smoothing was proposed as the
dominant effect in the run-in process. Jinno et al. [3] indicated that the development of micro
conformity at the asperity level improves lubrication. They showed that an optimum level of
roughness exist which improves the scuffing resistance of run in cast iron. In the case of very
smooth surfaces and low lubricant supply rates, they claimed that "polishing" of the surface
occurred, which resulted in lower scuffing loads.
The existence of an "optimum surface roughness" for running-in was also suggested by Kang
and Ludema [4]. Working with steel cylinders slid against flat steel surfaces, they showed that
surface roughness of about 0.1 J..Lm Ra might offer the highest degree of protection against
failure. They claim that at this roughness, asperities plastically deform at a rate that is too slow
for fast progression to low cycle fatigue failure, but sufficient to accelerate the formation of
oxides. The view that run-in can enhance scuffing resistance due to surface film formation has
been reported in a number of papers [5-9]. Most notably is the work of Fein [9], who
investigated different run-in procedures in radially loaded steel disks with combined rolling
and sliding. He showed that more gradual and longer step-loading procedures could
significantly improve scuffing resistance. Lower slide-to-roll ratios and lower sliding
velocities during run-in also had a beneficial effect, even if less significant. Surface profiles
showed that the shortest run-in at the minimum load completely eliminated most of the sharp
2

asperities and that little, if any, additional changes took place with further running. Since
neither metallurgical transformations nor changes in surface finish could account for the
observed effects, chemical reactions were suggested to take place. In particular, X-ray
diffraction indicated the presence of iron oxides on the disk surface.
The present research focuses on the effect of run-in procedures on the scuffing resistance of
390-T6 aluminum pins sliding against a 10 18 carburized steel disk. The area contact is
lubricated with a base uncapped P AG lubricant mist carried by R134a refrigerant gas under
starved lubrication conditions (see Part I [10] for lubricant properties). As stated in Part I, the
aluminum/steel material combination is widely used in swashplate compressors of automotive
air conditioning systems. The plate/shoe contact in these compressors is lubricated with a mist
of oil carried by the refrigerant gas, often resulting in starved lubrication conditions. Again, it
is believed that the results to be presented are not limited to refrigerant compressors, but can
also be used as a guide for other tribocontacts made up of the same material combination and
operating under starved lubrication conditions.
In this second part, the two aspects of run-in described in Part I, i.e. surface smoothing and
film formation, are investigated in relation to the observed scuffing resistance of the run in
specimens. In particular, the effect of run-in load, velocity and time on the scuffing resistance
is evaluated. Three different roughness levels for the aluminum specimen are considered.
Subsequent scuffing tests are run at different sliding velocities. Limited data are also obtained
at different lubricant supply rates.
EXPERIMENTAL SETUP
For the experimental setup, the materials used and the run-in procedures, the reader is referred
to Part I. The environmental conditions of all run-in as well as subsequent scuffing tests
approximate the nominal conditions found at the plate/shoe contact of an automotive
swashplate compressor. All tests are run at 121°C environmental temperature, at a constant
chamber pressure of 0.17 MPa. The test environment is R134a gas.
3

Following the run-in procedure, for a given constant sliding velocity, the load was increased
stepwise until scuffing occurred. Step duration of 15 seconds was used since a steady state
temperature for the pin was reached after approximately 10 seconds. The load step was chosen
depending on the test velocity so that the PV product at each step was kept constant for all
tests. The contact pressure P is based on the apparent area of contact and V is the sliding
velocity. For the contact pair under study, scuffing data were shown to fall closely to a PV=
constant curve [11,12]. By keeping the step PV constant for all tests, the number of steps to
failure was comparable at all test velocities. A PV step of 13 MPa mls was used.
For the majority of the tests, run-in and scuffing test were run at different times to look at the
surface of both pin and disk after run-in. In a few cases, the scuffing test was run right after
the run-in without stopping the machine. No significant difference was observed in the
scuffing load between the two cases, provided that the run-in and test conditions were the
same.
RESULTS AND DISCUSSION
A sharp transitions in the electrical contact resistance (indicating the destruction of surface
films), friction coefficient and subsurface temperature (2 mm below the surface) of the pin
specimens were used as indicators for scuffing (Fig. 1 ). During scuffing, there generally is
some material transferred from the pin to the disk.
Scuffing Data for Virgin Pins
Scuffing data for the virgin (not run in) pins are shown in Figure 2. The lines represent curve
fits of the data points. The LSR is chosen somewhat arbitrarily at 40 mg/min. Unless
otherwise stated, this LSR is used to obtain all subsequent results. As expected, for all the
roughness values tested, the scuffing pressure decreases as the sliding velocity increases. The
data points slightly deviate from a PV= constant relationship. Note that, for a given surface
roughness, the subsurface temperatures just before scuffing are approximately constant.
4

Higher temperatures are observed for smoother pins due to the higher value of the PV product
at scuffing.
Effect of Run-in Parameters
In this first series of tests, the test velocity and LSR were set equal to the run-in velocity and
LSR. Unless otherwise stated, data are for a run-in time of 10 minutes. Results are first given
for the 0.15 )lm Ra pins, as most of the tests were run for this roughness value. The effect of
roughness is discussed separately at the end of this section.
1. Effect of Friction
In Part I, it was observed that the level of friction during run-in affects the degree of surface
damage and, therefore, the effectiveness of the run-in procedure. Depending on the
pressure/velocity conditions during run-in, three characteristic regions were observed: a region
of low friction (f= 0.04- 0.06), an intermediate region where conditions of moderate-high
friction (f= 0.1) as well as low friction are possible, and a region of high friction (f ~ 0.15). As
noted in Part I, whether low or moderate-high friction conditions were obtained in the
intermediate region is probably due to differences in the skewness of the surface. Figure 3
shows the scuffing resistance of pins run in under these different friction conditions at a test
and run-in sliding velocity of 1.86 mls. Same trends are observed for other run-in and test
velocities. Values on the horizontal axis represent the ratio between the run-in pressure and
the scuffing pressure observed for virgin specimens at the given velocity (Fig.2). This ratio is
referred to as pressure ratio.
As expected, a lower value of the friction coefficient during run-in is associated with a higher
scuffing resistance. Pins run in under conditions of moderate-high friction scuff at loads
higher than the scuffing load of virgin pins (data point on the vertical axis), but lower than the
scuffing load of pins run in under low friction conditions. On the contrary, the scuffing
resistance of pins, which had high friction during run-in, appears to be lower that that obtained
with virgin pins. The larger scatter in the data seen for the moderate-high and the high friction
conditions correspond to the larger scatter in the value of the friction coefficient during run-in.
5

2. Effect of Run-in Pressure and Velocity
Figure 4 shows data for the scuffing resistance of pins as a function of the run-in pressure
ratio and three test velocities. Data on the vertical axis correspond to the scuffing pressure of
virgin specimens at the given velocity. In all cases, the run-in was under low friction
conditions.
At 3.30 mis, no significant differences were observed between virgin and run-in specimens.
The increase in the scuffing resistance observed for pressure ratios of 0.14 and 0.21 is limited
to a single load step, which could be just scatter.
For velocities of 1.86 mls and 1.44 mis, pressure ratios between 0.14 and 0.21 appear to be the
most effective. A limited difference in the scuffing load was observed between the two
pressure ratios at 1.86 mls. At 1.44 mis, no scuffing was observed for both pressure ratios up
to the limiting load capacity of the tribometer, which corresponds to a pressure of 140 MPa.
The results of the scuffing tests may be explained by the data obtained in Part I. For a
roughness of 0.15 ~m, smoothing is very limited (Part I, Tables 3 and 4). In virgin specimens,
limited differences in surface roughness had no significant effect on scuffing resistance.
Therefore, the higher scuffing load observed after run in must be due to surface film
formation. As seen in Part I, iron seems to playa major role in the strengthening of the surface
layer. Indeed, at 3.30 mls no significant iron transfer was observed; while at 1.44 mls and 1.86
mls the percentage of iron transferred was observed to increase with increasing run-in
pressure.
Figure 5 shows the results of an AES chemical analysis performed on specimens just before
scuffing, prior run-in data given in (a) and without prior run-in given in (b). On run in
specimen, the analysis indicates the formation of a uniform surface layer rich in oxygen and
iron. The layer is of the same type as that observed on specimens run in under step-loading
procedures and described in Part I. The iron transferred from the disk to the pin during run-in
is present in part as an oxide (presumably in the form Fe304), and in part as an intermetallic
compound (either AIFe3 or AhFe). The comparison between the results of the two AES
analyses suggest that no appreciable. surface layer forms during the test to scuffing in
specimens that are not run in.
6
3. Effect of Run-in Time
Figure 6 shows data for the scuffing resistance of pins for different run-in times. For all
velocities, the pressure ratio was set at 0.14, under conditions of low friction. The run-in time
was set at 5, 10 and 20 minutes.
As expected, no significant increase in the scuffing resistance was observed at 3.30 mis,
regardless of run-in duration. At 1.44 mls and 1.86 mis, the scuffing resistance was seen to
increase with run-in time, eventually reaching an asymptote. The 10 minute run-in provides a
significant improvement as compared to the 5 minute, while the increase in scuffing resistance
between the 10 and 20 minute is very limited, when present.
Results confirm the experimental observations on film formation reported in Part I. An AES
chemical analysis indicated that the amount of iron transferred from the pin to the disk
increases significantly between pins run for 5 and 10 minutes; however, no appreciable
difference was observed between pins run for 10 and 20 minutes.
4. Effect of Surface Roughness
Figure 7 shows data for the scuffing resistance as a function of run-in pressure, for the three
roughness values used. As in Figure 3 and 4, values on the horizontal axis represent the ratio
of the run-in pressure to the scuffing pressure observed for virgin pins of same initial surface
roughness (data on vertical axis). Data are for a run-in and test sliding velocity of 1.86 mls.
For all roughness values, data are for low friction conditions during run-in. For any given
roughness, higher pressure ratios than those reported caused high friction conditions during
run-in, therefore resulting in poor scuffing resistance. For all three roughness values, the
optimal pressure ratio falls in between 0.15 and 0.21. This result seems to suggest that, in the
case of constant load run-in procedures, the optimal run-in pressure corresponds to 15-21 % of
the scuffing pressure obtained under the same test conditions for virgin specimens.
Scuffing resistance as a function of run-in time is reported in Figure 8. Data are for a pressure
ratio of 0.15 and, again, a run-in and test sliding velocity of 1.86 mls. For the 0.03 /-lm Ra
pins, scuffing resistance was observed to increase with increasing run-in time. However, for
the 0.15 /-lm Ra, the 20 minute run in showed only a marginal increase in scuffing resistance
as compared to the 10 minute run-in. This result is in agreement with the experimental
7

observations of Part I. For the 0.03 J..lm Ra pins, iron was seen to transfer from the disk to the
pin at a slower rate than for the 0.15 J..lm Ra pins. An AES chemical analysis on the 0.03 J..lm
Ra pins showed a significant difference in the percentage of iron on the surface run in for 10
and 20 minutes.
For the 0.80 J..lm Ra pins, results are more difficult to interpret. At this roughness level, both
topographical modifications and film formation may play a significant role in the run-in
process. As shown in Figure 8, pins run in for 2 minutes already exhibit a significantly higher
scuffing resistance than virgin specimens. Surface traces indicated that surface smoothing
occurs within the first minutes of sliding (see Table 7, Part I) and could, therefore, account for
the increased scuffing resistance. However, Table 7 also shows that very little, if any,
additional changes in surface topography take place with further running. Therefore, surface
smoothing alone can not explain the observed time effect and surface film formation has to be
taken into account. As described in Part I, optical micrographs of run in specimens show the
presence of dark dots on the surface of run in pins. The dots are the tips of asperities that
become black as a consequence of film formation. The number of dots was observed to
increase with increasing run-in time. For the 10 minute run-in, the scuffing resistance is
marginally lower than for the 5 minute run-in. It is believed this difference is just scatter,
indicating that an asymptote has been reached.
Effect of Test Conditions
In this second series of tests, the effect of the sliding velocity and severely starved lubrication
conditions during the test to scuffing are investigated. The idea is to investigate whether
optimal run-in conditions can be identified regardless of subsequent test conditions. The data
are for a run-in time of 10 minutes and a LSR during run-in of 40 mg/min.
1. Effect of Test Sliding Velocity
Figure 9 shows the scuffing resistance of the 0.15 J..lm Ra pins for different run-in conditions
and then run up to scuffing at different test velocities. A constant PV characterizes the run-in
procedures. The run-in PV value is chosen to ensure low friction conditions during run-in.
The most interesting result is that obtained at the higher test velocity. At 3.72 mis, no
beneficial effect seems to be provided by any of the run-in procedures. Not even by run-in
8

procedures that cause a significant increase in the scuffing resistance at lower test velocities.
This result shows that the effectiveness of run-in procedures may vary depending on test
conditions. It also shows that any surface film formed during run-in is probably destroyed at
increasing test sliding velocities, and, since there is limited surface smoothing, no
improvement in scuffing resistance is observed.
Literature works suggest that, at higher sliding velocities, the frequency of load cycles is too
high for the oxide layer to heal and protect the surface before scuffing takes place. Lancaster
[13] investigated the wear rate of 60/40 brass sliding against steel over a range of velocities
and found that the oxide film was only protective at low velocities, where sufficient time was
available between passes. Bjerk [5] showed that the scuffing resistance of steel rollers
lubricated with mineral oil can be strongly influenced by the presence of oxygen. At higher
sliding velocities, however, the scuffing condition is the same whether or not oxygen is
available.
Scuffing tests of run in specimens at a test velocity of 3.72 mls were also conducted for the
0.03 f..1m Ra and the 0.80 f..1m Ra pins. As expected, no increase in the scuffing resistance was
observed for the 0.03 f..1m Ra pins, regardless of run-in conditions. A significant improvement
was observed, on the contrary, for the 0.80 flm Ra pins (Fig. 10). At this roughness level,
smoothing of the surface may playa role in the run-in process. Smoother surfaces seem indeed
to account for higher scuffing resistance (Table 1). The importance of smoother surfaces in
high sliding velocity contacts was also reported by Patching et al [14]. As observed in Table 6
of Part I, smoothing increases for increasing run-in pressure.
2. Effect of Severely Starved Lubrication Conditions
For the 0.15 flm Ra pins, a few tests were conducted to investigate the effect of severely
starved lubrication conditions. Pins were first run in under optimal conditions (pressure ratio
equal to 0.15) at a LSR of 40 mg/min and then tested to scuffing at a lower LSR. The run-in
and test velocity was set at 1.86 mls. Initially, the load step corresponded to a pressure of 7
MPa for all tests, regardless of the LSR.
9

For a test LSR of 30 mg/min, no significant difference in the scuffing pressure was observed
as compared to tests run at 40 mg/min. At 20 mg/min, however, run in pins scuff at pressures
comparable to virgin specimens. In a few cases, scuffing occurred at the onset of the test, i.e.
at pressures lower than virgin specimens (friction transitions shown in Fig. 11).
Because of these early failures, it was decided to reduce the pressure step to scuffing to 3.5
MPa for the first three steps. From the fourth step on, the load step corresponded again to a
pressure of 7 MPa. In the case of virgin specimens, the initial reduction of the pressure step
did not significantly affect the scuffing resistance. On the contrary, under the more gradual
application of the load, run in pins showed a higher scuffing resistance than virgin specimens
(Fig. 11). For the 3.5 MPa pressure step, a uniform layer was formed during the test to
scuffing, while for the 7 MPa step this layer was not formed.
The results suggest that the presence of iron patches (Fig. 4, Part I) on the pin surface due to
run-in is a pre-requisite for strengthening of the surface layer. In the case of the smoother
surfaces, only a uniform layer may protect the surfaces against scuffing failure (Fig. 5, Part I).
For the 0.15 ~m Ra pins, the layer was observed to form during step-loading run-in
procedures or during the test to scuffing, provided that the initial test conditions are not too
severe.
SUMMARY OF RESULTS
In the paper, the effect of running in on scuffing resistance is investigated. The material
combination is 390-T6 aluminum and carburized steel. The contact is lubricated by a base
polyalkylene glycol (PAG) lubricant mist carried by a tetrafluoroethane (R134a) refrigerant
gas under starved lubrication conditions. Run-in procedures are described in Part I of this
paper. In these procedures, pressure, velocity and time are used as variables. The scuffing tests
are run at different velocities and LSR. Three surface roughness values for the aluminum
specimen are considered. The experimental results can be summarized as follows:
1. For the three roughness values tested, run-in procedures could be determined so to
significantly increase the scuffing resistance. The higher scuffing resistance is linked to
10

film formation during run-in. No significant layer formation was observed during the test to
scuffing without prior running in.
2. Pins run in under conditions of low friction exhibited higher scuffing resistance. On the
contrary, pins run in under high friction conditions usually scuff at loads lower than virgin
specimens. In the intermediate region, observed for the 0.15 /-lm Ra pins, moderate-high
friction run-in conditions caused an increase in the scuffing resistance, but still
significantly lower than that obtained under low friction conditions.
3. Higher scuffing loads were observed for pins run in at increasing run-in pressures, provided
that the run-in was conducted under low friction conditions. For the three roughness values
tested, an optimal level of run-in pressure was observed. This level falls in between 15%
and 21 % of the scuffing load for virgin pins.
4. Increasing run-in duration increases the scuffing resistance. Eventually, an asymptote is
reached. For the 0.15 /-lm Ra pins, the asymptote was observed to correspond to the point
where increasing run-in time does not increase the percentage of iron transferred to the pin.
5. For the 0.15 /-lm Ra pins, no significant increase in the scuffing resistance was observed
for pins run in at high run-in velocity and low run-in pressure, where no iron transfer was
detected during run-in.
6. For the 0.80 /-lm Ra pins, run-in does involve surface smoothing, as predicted by the
Kapoor and Johnson map [15]. However, smoothing alone can not explain the observed
increase in scuffing resistance with increasing run-in time. Surface films on top of the
asperities are believed to also playa role.
7. Optimal pressure/velocity run-in procedures were shown to depend on operating
conditions. In particular:
a. Run-in procedures favoring surface layer formation did not improve the scuffing
resistance when the scuffing test was run at high sliding velocities. Under these
conditions, the frequency of load cycles is too high for the oxide layer to heal and
protect the surface before scuffing takes place. Improvement in scuffing resistance can
be obtained at high test velocities when significant smoothing takes place, as in
relatively rough surfaces.
II

b. For the 0.15 f.lm Ra pins, only a uniform surface layer may protect the surface against
scuffing. The layer was observed to form during step-loading run-in procedures or
during the test to scuffing, provided that the initial test conditions are not too severe.
ACKNOWLEDGMENT
The authors are grateful for the financial support by the Air Conditioning and Refrigeration
Center, Mechanical and Industrial Engineering at the University of Illinois at Urbana
Champaign.
12

REFERENCES
[1] H. Christensen, Acta Polytech. Scand.Mech. Eng. Ser. No 25, 1966.
[2] D.A Kelly, C.G. Barnes, R.W. Freeman, G.W. Crithlow, Proc. Instn Mech. Engrs, 206
(1992),425-429.
[3] O. Jinno, M.R Tyagi, Y. Kimura, Tribology International, 29 (1996), 129-136.
[4] S.c. Kang, K.C. Ludema, Wear, 108 (1986), 375-384.
[5] R.O. Bjerk, ASLE Transactions, 16 (1972), 97-106.
[6] RS. Montgomery, Wear, 14 (1969), 99-105.
[7] A Begelinger, AW.J. de Gee, Journal of Lubrication Technology, 103 (1981),203-210.
[8] T. Konishi, E.E. Klaus, J.L. Duda, Tribology Transactions, 39 (1996), 111-118.
[9] R.S. Fein, ASLE Transactions, 10 (1967), 373-385.
[10] M.P. Cavatorta, C. Cusano, Wear ........ ?
[11] T.K. Sheiretov, H.K. Yoon, C. Cusano, STLE Tribology Transactions, 41:4 (1998), 435-
446.
[12] H.K. Yoon, Scuffing under Starved Lubrication Conditions, Ph.D. Thesis, University of
Illinois at Urbana-Champaign, 1999.
[13] IK. Lancaster, Proc. Roy. Soc. London, A 273 (1963),466-483.
[14] M.J. Patching, C.C. Kweh, H.P. Evans, RW. Snidle, ASME Journal of Tribology, 117
(1995),482-489.
[15] A. Kapoor, K.L. Johnson, Int. J. Mech. Sci., 34 (1992), 223-239.
13

Table 1 - Average roughness and skewness values of 0.80 Jim Ra pins before and after run-in, as a function of run-in pressure and velocity.
Run-in time= 600 s, LSR= 40 mg! min
Pressure (MPa) Velocity (m/s) Ra before (11m) Ra after (11m) Skew. before Skew. after
3 3.72 0.75-0.85 0.65-0.70 0.15- (- 0.20) -0.20-(-0.60)
3 1.86 0.75-0.85 0.65-0.70 0.15- (- 0.20) 0.0- (-0.30)
5 1.86 0.75-0.85 0.55-0.70 0.15- (- 0.20) 0.0- (-0.40)
14

1.2
1.0
~ 0.8
~ 0.6
0.4
0.2
0
5 'il 0.4 if
0.3 ~ c; 0.2 ., '13 <;:: 0.1 -8 0
c; 8 101
.J 10°
~ 10-1
N 10-2
= 8 10-3
U 300 " oJ 250
lEI 200 1!
~ ISO
~ 100
50 15 30
Time, l (sec)
Fig. 1 - Typical scuffing test results
15

140 ~ ---- - - --------. - ~ -----.: 120 ,--
---~-------;----·-rc-~--~--~"-~--~--~-~~~--~--~-~--~---
• .&
ro t o
Ra= 0.03 flm Ra= 0.15 flm Ra= 0.80 flm
0.. 100 I ~ '--'
:-
- - --~. ~~ ~-. - - - .. - - - - -
150°C -~--'-'- -- .
- -~ ,~-;-- ---_.&' iii
o l~~~~i-Ll ~~~I~1 ~1-Ll ~-L~~~~~~~~ __ ~ __ ~I~1
0.5 1 1.5 2 2.5 3 3.5 4 Sliding Velocity (m/s)
Fig.2 - Scuffing pressure-velocity map for virgin pins. LSR= 40 mg/min
16

eo (L
~ '-"
Q) l-
::J !/l !/l Q) I-
(L
e> c tE ::J U
CJ)
100 r-
80 f----
60 I--
40 l-
20 I-- -
0
0
i
0.05
f 1 , ........................ + ..................... . f •
o low friction (0.04<f<0.06) moderate-high friction (f -0.1 ) high friction (f>0.15)
0.1 0.15 0.2 Pressure Ratio
0.25 0.3
Fig. 3 - Effect of friction level during run-in on scuffing resistance. Ra= 0.15 )lm, Run-in time= 600 s, LSR= 40 mg/min
17

ro 0...
5 Q) '-:::l (/) (/) Q) '-
0... OJ c ~ :::l U
(f)
140 r--Not scuff t
......•.. i-.c...~-----. t • 1.44 mls
120 f-
~ .... 100
o 1.86m/s o 3.30 mls
80 r , 60 r 40 ...
20
.ij5- ..... :
.rn ..
o t J ! ! I ! I I I
0 0.05 0.1 0.15 0.2 0.25 Pressure Ratio
Fig. 4 - Effect of run-in pressure on scuffing resistance. Ra= 0.15 !-lm Run-in velocity= Test velocity, Run-in time= 600 s, LSR= 40 mg/min
18

60 -
:::R o
§ 40 :=-Fe-:;:::; ~ E Q) u c o () u 'E o ;;(
0
i I I I
0.5 Depth, f.lm
1.5
(a)
80 ,---- -------.---,------------------,-
. .-----------. AI :::R o , '
- - - - - - - - - -
o 0.5 1 1.5 Depth, f.lm
(b)
I I I
2 2.5
• •
2 2.5
Fig. 5 - Representative Auger chemical analysis of specimens before scuffing.
Ra= 0.15 ).lm, LSR= 40 mg/ min. (a) prior run-in, (b) without run-in
19

140 ' ~
~ 120 f ~ 100 ~ ~ r
~ 80 t
Not scuff
'; 60 ~------" -<j!-
~ ::}B ................ ~ ............•..•••....•..•.. ~ o o
I !
200 400
! I ! !
600 800 1000 Run-in Time (s)
~ •
• 1A4 m/s o 1.86 m/s o 3.30 m/s
m
! i
1200 1400
Fig. 6 - Effect of run-in time on scuffing resistance. Ra= 0.15 /lm Pressure ratio= 0.15, Run-in velocity= Test velocity, LSR= 40 mg/min
20

120 1--- ---------------- ---g; --------c- - - - - - - - - - - - - - - - -" , i
100 r0-
~----.- ..... _._. f
o.... 6 (i) ... :J (/) (/) (i) ...
i 60 ~
~
_._ ... - ! T !
----,---------- --------
[jJ --i¥ -- -- ---
0.... O'l c 40 f' --- ----------- -------- ---- _._- -------.-.------~-----..
t§ u
C/) 20 -
o o
! , [ !
0.05
! I ! ! I I I
0.1 0.15 Pressure Ratio
o
• o
Ra= 0.03/--lm Ra= 0.15/--lm Ra= 0.80 /--lm
I •
0.2 0.25
Fig. 7 - Effect of run-in pressure on scuffing resistance for different roughness values. Run-in velocity= Test velocity= 1.86 mis, Run-in time= 600 s, LSR= 40 mg/min
21

---ro
140------
120
r I r t -
~ 100 f ~ 80 ~.
t
--------------------------,---- ------ c------- ---8----
-1-::J CJ) CJ)
OJ .... 0.. OJ c
60 l----------~-- --~-----:---------Q----------:------- _______________ c --------,
! Q • 40 t ~
::J U
CJ) I.
20 !-
o i i~
o 200
~ - - - - - - - - - - - - ~ -- - - - - -
: --"
I i
400 600 800 Run-in Time (5)
0 Ra= 0.03 ~m
• Ra= 0.15 ~m 0 Ra= 0.80 ~m
1000 1200 1400
Fig. 8 - Effect of run-in time on scuffing resistance for different roughness values. Pressure ratio= 0.15, Run-in velocity= test velocity= 1.86 mis, LSR= 40 mg/min
22

140
120 co 0..
100 ~
Q) .... 80 ::J
(/) (/)
~ 60 0.. OJ c
<+= 40 "-::J () (f)
20
0
,-r
t
r r--~ .. F
0.5
1 Notscuff
o ...
1.5 2 2.5 Test Velocity (m/s)
Run-in conditions
+ no run in ... 14 MPa, 0.93 m/s o 7 MPa, 1.86 m/s o 3.5 MPa, 3.72 m/s
3 3.5 4
Fig. 9 - Effect of test velocity on scuffing resistance for different run-in procedures. Ra= 0.15 11m, Run-in time= 600 s, LSR= 40 mg/min
23

50
- 40 co 0... ~ '--'
(J) 30 i -··r-"-:::l r en en (J) "-
0... 20 l __
--T------------ ---t----
--1. - ------e
0> T C ! «= '+-:::l
10 0 I-- - - - - - - - - - - ----,---(f) :
t-e-
O l~ I I I I I I
no run-in proc. A proc. B proc. C Run-in Conditions
Fig. 10- Scuffing data for 0.80 fJ.m Ra run in pins tested at 3.72 m/s. Proc.A= 3 MPa, 3.72 mis, Proc. B= 3 MPa, 1.86 mis,
Proc. C= 5 MPa, 1.86 m/s. Run-in time= 600 s, LSR= 40 mg/min
24

c (])
'(3
~ o ()
c o U ·c u..
• no run-in (3.5 MPa pressure step) o 3.5 MPa pressure step 0.4
0:: t ~~{. I. .-.. -.. D_ .. _ ..... _7_._0_M_p_a_p~r_es_s_u_re_s_te_:_B_ .. _. -_ .......
0.25 : 0 o - - .... B--
o 20 40 60 80 100 120 140 Time (s)
Fig. 11 - Friction data plots during the test to scuffing for pins run in at LSR= 40 mg/min and run up to scuffing at LSR= 20 mg/min.
Pressure ratio= 0.14, Run-in velocity= test velocity= 1.86 mis, Run-in time= 600 s. The values shown in the legend refer to the pressure step used for the test to scuffing
25


SCUFFING BEHAVIOR OF 330 BRASS AND
DHT4 ALUMINUM
Prepared by:
John Whittenhall and Cris Cusano

INTRODUCTION
Scuffing is a phenomenon that occurs in mechanical components that expenence
interfacial sliding. The failure of these components by means of scuffing is often
unpredictable since this mode of failure is not completely understood. There exist
numerous factors that affect scuffing. Previous research done at the University of Illinois
at Urbana-Champaign and elsewhere has attempted to explain many of these factors.
Some of the more recent work at the University of Illinois was done by H.K. Yoon and C.
Cusano and reported in TR-147 entitled "Scuffing Under Starved Lubrication
Conditions." Using the pin-on-disc geometry described in TR-147, the present study
examines the scuffing behavior for DHT4 aluminum and 330 brass using a base
PAG/R134a mixture. These data are then compared to the data for 390-T6 aluminum,
DHT3 aluminum, and Si-Pb brass given in TR-147. The primary objectives of the current
study are to:
• Obtain scuffing data, with the pin-on-disc geometry, for DHT4 aluminum and 330
brass, and compare these data to materials examined in TR-147.
• Examine the surface of both Si-Pb and 330 brasses by XPS, at approximately one
load step before scuffing, to identify possible compounds formed and to better
understand the relative good scuffing resistance of the Si-Pb brass.
2

EXPERIMENTAL SETUP
EQUIPMENT
The data obtained for this research utilized a high pressure tribometer, specially designed
to provide an accurate simulation of the environmental conditions found in refrigerant
compressors. The maximum environmental pressure and temperature in the tribometer is
1.72 MPa and 120°C, respectively. The contact temperature of the pin and disc are set
via an external recirculating unit which has a temperature range from -10°C to 130°C.
A specimen holder secures the lower specimen, which is the pin, and the upper specimen,
or the disc, is attached to a rotating spindle. As indicated earlier, the tests conducted for
this research utilized a pin-on-disc geometry. The pins have a diameter of 6.35 mm.
The pins are inserted in a shoe, which is supported by a socket. This geometry allows for
three degrees of freedom to ensure that the pin remains flat against the rotating disc. The
temperature of the pin was measured with a thermocouple inserted to approximately 2
mm below the sliding surfaces. The resistance is also measured across the contacts. The
tribometer allows for a maximum contact load of 4.45 kN between the specimens. The
spindle has a maximum rotational speed of 2000 RPM.
MATERIALS
DHT4 aluminum and 330 brass pins were tested against 1018 carburized steel in
order to compare them to previously obtained data for 390-T6 aluminum, DHT3
aluminum, and Si-Pb brass. The 330 brass was chosen because its chemical composition
3

is similar to that of the Si-Pb brass, without the silicon, aluminum, or manganese. The
chemical compositions of the various materials tested are given in Table 1.
Table 1 - Chemical Composition of Various Materials Tested·
Material Alloying elements, % by weight
Al Si Fe eu Mn Mg Zn Pb Ti Bi Ni
390-T6 Al Bal. 16.0-18.5 1.0 3.0-4.0 0.5 0.4-1.0 1.0 - 0.25 - -
DHT3 Al Bal. 6.5-12.0 0.2 2.0-5.0 0.15 - 0.15 - - 1.0-5.0 -
DHT4-AI Bal. 11.0-13.5 1.0 2.0-5.0 0.5 - 0.15 - 0.2 3.0-6.0 1.5-2.5
Si-Pb Brass 0.5 0.5-1.5 0.4 61.5-63.0 1.5-3.5 - 30.0-35.0 0.4-0.8 - - -
330 Brass - - 0.07 65.0-68.0 - - 33.5-35.0 0.2-0.8 - - -
Since surface roughness influences scuffing, it was also necessary to maintain a
relatively close surface roughness between materials. The surface roughness of the pins
for each material were measure via a profilometer and the ranges depicted in Table 2. As
can be seen, the surface roughness of each material is approximately the same.
Table 2 - Initial Surface Roughness of Pin Specimens Tested
390-T6 Al DHT3 Al DHT4AI Si-Pb Brass 330 Brass
0.62-0.70 !-lm Ra 0.67-0.75 !-lm Ra 0.53-0.64 !-lm Ra 0.69-0.78 !-lm Ra 0.53-0.60 !-lm Ra
TEST CONDITIONS
The test conditions were identical to those in TR -14 7 since the scuffing data were
to be compared. Thus, the tests were run using a polyalkylene glycol (P AG) lubricant
4

and a tetrafluoroethane (RI34a) refrigerant. The PAG/RI34a mixture was heated and fed
through a nozzle so as to produce a relatively constant lubricant supply rate of 45
mg/min. In order to simulate the environmental conditions of a swashplate compressor as
was done in TR-147, the test chamber was purged to a vacuum of 0.2 torr and the tests
were conducted at an environmental pressure of 0.17 MPa, an environmental temperature
of 115 °e, and an approximate contact temperature of 121°C. A load step of 222.5 N
was utilized with step duration of 15 seconds. The step duration of 15 seconds is
adequate since the steady state temperature is reached in approximately 10 seconds under
starved lubrication conditions. The only factor that was varied in the tests was the
velocity. The tests were run at velocities ranging from 0.47 m/s to 4.65 m/s. Each test
was run until scuffing had occurred. A sharp increase in the coefficient of friction and
temperature, accompanied by a sharp decrease in the contact resistance are good
indicators of when scuffing occurs. When scuffing occurred, the load was released and
the test was stopped.
One specimen of 330 brass and one specimen of Si-Pb brass were loaded until
approximately one load step before scuffing, at which point the test was stopped. The
specimens were then examined using XPS (X-Ray Photoelectron Spectroscopy) to
identify surface compounds that had formed prior to scuffing. The differences in surface
compounds that develop may help to explain the reason why Si-Pb brass is better at
resisting scuffing than many other types of brasses.
5

DISCUSSION
EXPERIMENTAL RESULTS
The composition of a material has a significant influence on scuffing. The data
obtained for 330 brass and DHT4 aluminum, tested against 1018 carburized steel discs,
were plotted along with the data previously obtained for 390-T6 aluminum, DHT3
aluminum, and Si-Pb brass. The PV curves for 390-T6, DHT4, and DHT3 aluminum are
shown in Fig. 1, and the PV curves for 390-T6 aluminum, Si-Pb brass, and 330 brass are
given in Fig. 2. As expected, the scuffing pressure decreases as the sliding velocity
increases for all materials. The high pressure tribometer has a maximum speed of 2000
RPM, which corresponds to a maximum velocity of 4.65 mls for the rubbing radius used.
Thus, data could not be obtained for velocities greater than 4.65 mls. It is quite evident
from the plots that the Si-Pb brass is better with respect to scuffing resistance than all the
other materials tested.
Of the aluminum alloys tested, the 390-T6 has the best scuffing resistance while
DHT3 has the worst resistance to scuffing. The DHT4 alloy is slightly better than the
DHT3 and falls well below the 390-T6 aluminum. It is also essential to note that, with
the exception of the 390-T6 aluminum, all the materials maintain an approximate PV =
constant relationship. The data for the 390-T6 tends to deviate more from this
relationship.
6

.... to oj
~ o o
.... to oj
~ o o
120
100
80
60
40
20
o 0.0
150
125
100
75
50
25
o
1 1 1
~390-T6AI
-"-DHT3AI ___ DHT4AI
----------r---------~----
1 1 1 - - - - - - - - - r - - - - - - - - - , - - - - - - - - - -,- - - - - - - - -
1 1 1 - - ---.- - - - - - - - - - , --- ----- - -,- - - - - - - - -
1
1 1 1 - - - - - - - - - - i - - - - - - - - - -.- - - - - - - --
1
1.0 2.0 3.0 4.0
Sliding Velocity (m/s)
Fig 1. - Scuffing PV for Aluminum Materials Tested
Lubricant/Refrigerant Mixture: PAG/R134a, LSR = 45 mg/min
1 1 1
___ 390-T6 Al
~330Brass ---e- Si-Pb Brass --------,----------r---------,---
1 1 1 - - - r - - - - - - - - - , - - - - - - - - - -,- - - - - - - - -
1 l 1
--- -- ---~ - \ ---- -- -;- 1 1 - -------, ----- ---- -,- - - - - - - - -
-_\ ____ ' ______ --
'~ - 1 " 1 ............. 1 1
- - - - -"":.~ .! - - - - - - - - - _1- _______ _ .:--.. _: o -,,--
5.0
0.0 1.0 2.0 3.0 4.0 5.0
Sliding Velocity (m/s)
Fig 2. - Scuffing PV for 390-T6, 330 Brass, Si-Pb Brass
Lubricant/Refrigerant Mixture: PAG/R134a, LSR = 45 mg/min
7

The Si-Pb brass has a much better scuffing resistance than 330 brass. The 330
brass was tested since it has approximately the same copper, lead, and zinc content as the
Si-Pb brass. The scuffing data for each material, along with the coefficient of friction one
load step before scuffing are tabulated in Table 3.
SURFACE COMPOSITION
The disparity between the scuffing behavior of Si-Pb brass and the 330 brass was
also investigated. Since the main compositions of the two types of brasses are similar, it
was expected that this disparity was due to the silicon and/or manganese in the Si-Pb
brass that may form different surface compounds than the 330 brass. Using XPS (X-Ray
Photoelectron Spectroscopy) analysis of the brass specimens one load step before failure,
it was possible to get an idea of the surface composition of the two brass specimens
before scuffing occurred. The XPS analyses of the specimens were performed first
without sputtering and then after a two-minute sputter. Note that by sputtering, the
surface oxides are removed.
330 Brass
Upon initial examination of the 330 brass with XPS analysis, it was determined
that pure copper and copper oxide, eU20, exist on the surface of the pin prior to scuffing.
8

Table 3 - Scuffing PV and Friction Coefficient Data for Various Materials Tested
Material V (rnls) P (MPa) Friction Coeff., /.l
0.93 112.5 0.09 1.40 63.3 0.09
390-T6 Al 1.86 42.2 0.12 2.79 21.1 0.13 3.72 21.1 0.11 4.65 14.1 0.17 0.47 112.5 0.07 0.70 70.3 0.07 0.93 56.2 0.09
DHT3 Al 1.86 21.1 0.09 2.79 14.1 0.14 3.72 10.5 0.12 4.65 7.0 0.15 0.47 105.5 0.05 0.70 91.4 0.06 0.93 70.3 0.06
DHT4AI 1.86 28.1 0.06 2.79 21.1 0.08 3.72 14.1 0.07 4.65 7.0 0.14 1.86 84.4 0.07
Si-Pb Brass 2.79 42.2 0.07 3.72 35.2 0.06 4.65 28.1 0.07 0.47 105.5 0.04 0.93 70.3 0.06
330 Brass 1.86 28.1 0.07 2.79 21.1 0.06 3.72 14.1 0.08 4.65 7.0 0.10
9

CuZn is a compound with a binding energy very close to that of pure copper and
consequently, may also be present on the surface of the pin. Also present on the surface
were pure zinc and zinc oxide, ZnO. After sputtering the specimen for two minutes, only
pure copper, zinc, and possibly CuZn remained. The XPS surveys before and after
sputtering are given in Fig. 3 and Fig. 4. The vertical axis, N(E)/E, is an arbitrary scale
that has been normalized and has units of number of electrons divided by energy. More
enhanced views of these plots can be found in Appendix A.
Si-Pb Brass
Initially, it was thought that a manganese-silicon compound, probably Mn3Si2 was
formed on the surface of the Si-Pb brass. However, this compound was not found using
XPS analysis. Prior to sputtering, Cu, Cu20, Zn, and ZnO were on the surface of the
specimen. Once again, since the binding energy of CuZn is similar to that of pure copper,
this compound could also be present on the surface of the specimen. Manganese oxide,
Mn02, was also found to exist on the surface. Due to the small amounts of lead,
aluminum, and iron in this brass, the XPS analysis did not detect any of these metals, or
any definite compound containing them. A silicon compound was detected with a
binding energy of 102 e V. This created some difficulty in distinguishing which
compound it was. Silica, Si02, has a binding energy at approximately this level.
However, silicates also have binding energies at about 102 eV. Although it cannot be
determined with certainty if the compound is a silicate or silica, considering the
composition of the material, it is quite possible that it is indeed a silicate such as AhSiOs
or Zn4Si207(OH)2*2H20. Either of these compounds, as well as the manganese oxide,
10
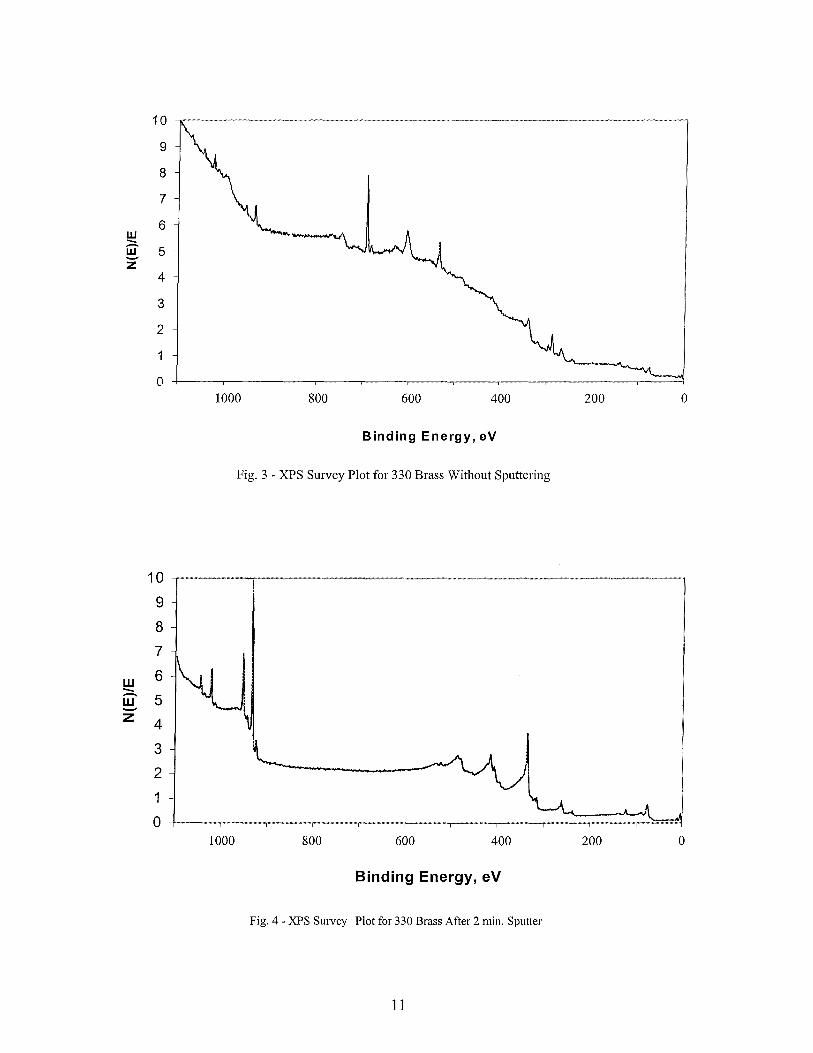
w -
10
9
8
7
6
W 5 -z 4
3
2
o +-----~--~----~----~--~----~----~--~----~----~--~ 1000 800 600 400 200 o
Binding Energy, eV
Fig. 3 - XPS Survey Plot for 330 Brass Without Sputtering
10
9
8
7
w 6 -- 5 w -z 4
3
2
1
0 1000 800 600 400 200 o
Binding Energy, eV
Fig. 4 - XPS Survey Plot for 330 Brass After 2 min. Sputter
11

could be responsible for the significant disparity in the scuffing resistance of the two
types of brasses. After sputtering the specimen for two minutes, copper and possibly
CuZn remained. Manganese and zinc were also determined to exist after sputtering. The
XPS surveys before and after sputtering for the Si-Pb brass are given in Fig. 5 and Fig. 6.
More enhanced views ofthese plots can be found in Appendix B.
12

10
9
8
7
6 w -W 5 ~
z 4
3
2
0
1000 800 600 400 200 o
Binding Energy, eV
Fig. 5 - XPS Survey Plot for Si-Pb Brass Without Sputtering
10
9
8
7
6 w -W 5 Z
4
3
2
1
0
1000 800 600 400 200 o
Binding Energy, eV
Fig. 6 - XPS Survey Plot for Si-Pb Brass After 2 min. Sputter
13

CONCLUSIONS
In the present study, the scuffing resistance ofDHT4 aluminum and 330 brass are
compared to DHT3 aluminum, 390-T6 aluminum, and Si-Pb brass. The scuffing behavior
of the later three materials have already been reported in TR-147. From the results
obtained, the Si-Pb brass has a higher scuffing resistance than the other materials. The
390-T6 aluminum has the next best scuffing resistance of the materials tested. The
scuffing resistance ofDHT4 aluminum is slightly better than that of the DHT3 aluminum
and the scuffing resistance 330 brass falls between DHT3 and DHT4.
An XPS examination of two types of brasses, at approximately one load step
before scuffing, showed that the surface ofthe Si-Pb brass specimen differed from that of
the 330 brass in that it contained manganese oxide and either silica or a silicate. It is
believed that the manganese andlor the silicon content in the Si-Pb brass produce surface
compounds which enhance its scuffing resistance. The Si-Pb brass seems to be a very
good material when scuffing is a major design consideration.
14

APPENDIX A: XPS ANALYSIS OF 330 BRASS
WITHOUT SPUTTERING
10 9 8 7
w 6 -g 5 z 4
3 2
0 1030 1028 1026 1024 1022 1020 1018 1016
Binding Energy, eV
10 9 8 7
w 6 -g 5 z 4
3 2
0
940 938 936 934 932 930 928 926
Binding Energy, eV
10 9 8 7
w 6 -g 5 z 4
3 2 1 0
346 344 342 340 338 336 334 332 330 328
Binding Energy, eV
15

AFTER 2 MINUTE SPUTTER
10 9 8 7
w 6 -g 5 z 4
3 2 1 0 1030 1028 1026 1024 1022 1020 1018 1016
Binding Energy, eV
10 9 8 7
w 6 -W 5 -z 4 3 2
0 940 938 936 934 932 930 928 926
Binding Energy, eV
10 9 8 7
w 6 -g 5 z 4
3 2 1 0
346 344 342 340 338 336 334 332 330 328
Binding Energy, eV
16
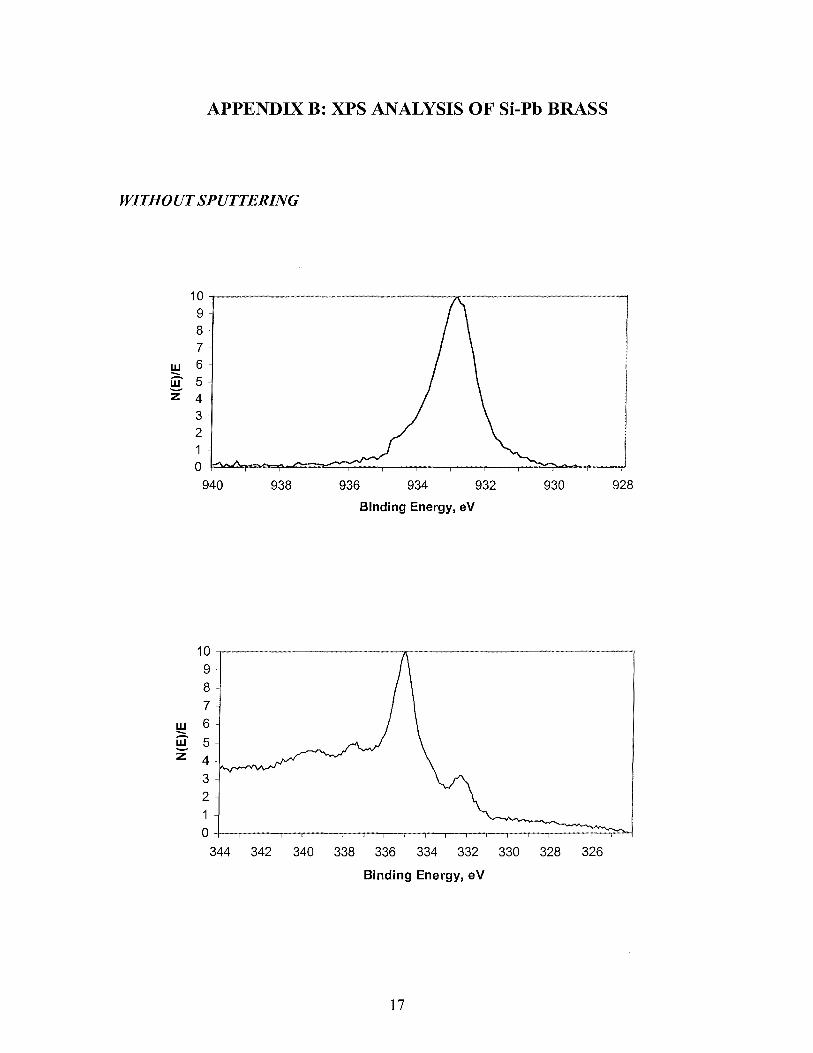
APPENDIXB: XPS ANALYSIS OF Si-Pb BRASS
WITHOUT SPUTTERING
10~~~~~~M~~"" __ ------~""~~~~""--~~~"~.""~ 9 8 7
w 6 g 5 z 4
3 2
940 938 936 934 932 930 928
Binding Energy, eV
10~---~~~~~--~-~--~~_~~--M~~"~~_~-~~-,
9
8 7
w 6 g 5 z 4
3 2 1 O+-~~~~~~~~~--~~~~~~~~~-T~
344 342 340 338 336 334 332 330 328 326
Binding Energy, eV
17

10 9 8
7
w 6 -W 5 -z 4 3 2 1 0
660 655 650 645 640 635
Binding Energy, eV
10 9 8
7
w 6 -g 5 z 4
3 2
1 0
110 108 106 104 102 100 98
Binding Energy, eV
18

AFTER 2 MINUTE SPUTTER
10 9 8 7
UJ 6 -g 5 z 4
3 2 1 0 1030 1028 1026 1024 1022 1020 1018 1016 1014
Binding Energy, eV
10 9 8 7
UJ 6 -g 5 z 4
3 2 1 0
938 937 936 935 934 933 932 931 930 929 928
Binding Energy, eV
10
9
8
7
!!:! 6 iii 5 Z 4
3 2
0 648 646 644 642 640 638 636 634
Binding Energy, eV
19


PRELIMINARY RESULTS FOR THE SCUFFING
BEHAVIOR OF A CO2/P AG MIXTURE
Prepared by:
Nick Stokes and Cris Cusano

INTRODUCTION
Due to environmental concerns, R134a has replaced R12 in small refrigerant
compressors. However, R134a is also known to have a negative effect on the
environment. Consequently, it is considered to be only a temporary solution. Natural
refrigerants are currently being examined as long-term, environmentally acceptable,
replacements. One such natural refrigerant is carbon dioxide. The introduction of a new
refrigerant will affect compressor performance as well as design concerns, since it will
have different thermodynamic and tribological properties. An important consideration is
the scuffing behavior of critical contacts in a C02 environment. In the present study,
scuffing data using C02/P AG and R134a1PAG mixtures are compared. Extensive
research has been conducted at the University of Illinois at Urbana-Champaign which has
examined the phenomenon of scuffing using a R134a1PAG mixture. Recent work was
conducted by H.K. Yoon and C. Cusano and reported in the ACRC TR-147 entitled
"Scuffing Under Starved Lubrication Conditions". The current study is closely modeled
after TR-147, using the shoe-on-disc geometry with 52100 steel shoes and 390-T6
aluminum discs.
EXPERIMENTAL SETUP
EQUIPMENT
As with previous studies, this study utilized a specially designed high pressure
tribometer to provide an accurate simulation of the environmental conditions found in
most refrigerant compressors. The maximum environmental pressure and temperature in
the tribometer is 1.72 MPa and 120°C, respectively. An external circulating unit, with a
2

temperature range from -10 DC to 130 DC, maintains a constant temperature at the
shoe/disc interface. The maximum contact load allowed is 4.45 kN. The maximum
rotational speed of the spindle is 2000 RPM, corresponding to a velocity of 4.65 m/s for
the contact radius used. The applied load, friction coefficient, and electrical resistance
across the shoe/disc interface are measured. A shoe-on-disc geometry was utilized in this
research to simulate the shoe/plate contact in automotive swashplate compressors. The
lower specimen is the shoe, which is supported by a socket in the specimen holder. This
provides the shoe with three degrees of freedom, ensuring that it remains flat against the
rotating disc. The disc is the upper specimen, which is attached to the rotating spindle.
The shoes tested were made of 52100 steel, with a diameter of 9.6 mm. They were
crowned and contained a dimple with an approximate area of 5.5mm2• To simulate the
plate, discs made from 390-T6 aluminum alloy were used. The discs had an initial surface
roughnesses in the range 0.15 to 0.30 /-Lm Ra.
TEST CONDITIONS
In order to facilitate their comparison, the test conditions for the tests conducted
in a tetrafluoroethane (R134a) environment were identical to those conducted in a carbon
dioxide (C02) environment. A predetermined weight of polyalkylene glycol (PAG)
lubricant was initially placed in a pre-cleaned pressure vessel. Placing the vessel in ice,
the CO2 refrigerant was then added to the vessel from a canister. The pressure in the
canister was approximately 900 psi. The vessel was continuously weighed during the
CO2 filling process so that the desired lubricant supply rate could be obtained. For all the
tests conducted, the weight of the CO2/P AG mixture was between 405 and 420 g,
3
approximately 0.05% of which was oil. The mixture is sprayed to the aluminum disc by
means of a nozzle, as done in ACRC TR-147. Before the test is initiated, the vessel was
heated, thereby pressurizing the fluid mixture. This heating produced an initial pressure
of around 1300 psi. Upon initiating spraying and the tests, the pressure in the vessel
dropped to about 1000 psi in about 5 to 10 seconds. After this, the pressure dropped more
slowly, usually reaching an equilibrium between 900 to 950 psi. This equilibrium
pressure was maintained for about two minutes, after which, the pressure slowly
decreased to around 850 psi in about 45 second. Soon afterwards, the pressure drop
accelerated and the spraying quickly ceased. During the tests, a relatively constant
lubricant supply rate was supplied to the disc. The volume of the pressure vessel was 500
cm3. Using the information given above and the thermophysical properties of C02 given
in reference [1], it is estimated that the temperature of the C02/PAG mixture in the vessel
was between 15 and 20 DC during the tests.
Figures 1, obtained from reference [1], gives the miscibility of a PAG lubricant in
CO2. The translation for the German word "Mischungsliicke" is "miscibility gap",
indicating that the cross-hatched area is a region of immiscibility or only partial
miscibility. Considering the small percentage of lubricant used (0.05%), Fig. 1 seems to
indicate that the C02/PAG mixture was miscible for the conditions considered (region
near the y-axis). An experiment was also conducted outside the chamber of the tribometer
by heating the vessel containing the mixture to produce flow through the nozzle. A
different piece of paper was placed on top of the nozzle every few seconds to determine if
the lubricant was flowing until the vessel was empty. This test showed that lubricant was
continuously brought to the paper by the refrigerant gas.
4

ILK Eneden ~
30 --- te..t. -f---f----f
5~-+~~~~~~~~~_+--~--~~
P 0 P-or::--""'" -I.: ~~~~.::atd--+--+---+--+----1 ~
~~~ __ w-~~~~~~~~--~--~~ o 10 3) ~ ..a 50 eo 70 80 80 1(X)
I(Qnartillticln ,M%OI
MlschungsUlcke Gemlsch: CO2 - 01 PAG
Fig. 1. Miscibility Chart for C02IPAG Mixture [1].
5

Before initiating the tests, the test chamber was purged to a vacuum of
approximately 0.2 torr. For all the tests, the environmental pressure was 0.17 MPa, the
environmental temperature was 115°C, and the contact temperature was 121 °c. The
environmental conditions approximately simulate those found at the critical plate/shoe
contact of an automotive swashplate compressor using a RI34a1PAG mixture. Obviously,
for C02 systems, the environmental pressure is much higher. The HPT was not designed
to operate at pressures found in these systems. Since the same lubricant supply rate was
used for the two refrigerants, it is felt that the environmental pressure will not
significantly affect the trends obtained.
An initial load of 222.5 N was applied, with the load being stepped an additional
222.5 N every 15 seconds until scuffing occurred. A step duration of 15 seconds is
adequate because a steady state temperature is reached after approximately 10 seconds
under starved lubrication conditions. Scuffing is indicated by a rapid increase in the
coefficient of friction, along with a corresponding sharp drop in the contact resistance.
When the CO2/P AG mixture was used, tests occasionally had to be stopped before
scuffing commenced. This was mainly due to the depletion of the CO2/P AG mixture in
the pressure vessel. The test velocities used in the study were 1.86 mis, 2.79 mis, 3.72
mis, and 4.65 mls.
6

EXPERIMENTAL RESULTS
All data are presented for a somewhat arbitrarily chosen lubricant supply rate of
40 mg/min. Lubricant supply rates much higher than this would result in no scuffing. For
R134a, two tests were run for each velocity considered. It is believed that two tests were
adequate due to the repeatability of the results and familiarity with the 134a refrigerant.
On the other hand, a higher degree of scatter and not having previous knowledge about
the behavior of C02, required a larger number of tests to be conducted for this refrigerant.
Tests were not conducted using velocities less than 1.86 m/s since the C02/P AG mixture
could not be supplied for a sufficient time to allow a scuffing pressure to be reached at
such velocities. Figure 2 shows the PV data obtained for both the 134a and C02
refrigerants. Note that a curve was not fitted to the C02 data due to the large scatter, as
well as the high number of tests which did not scuff before the CO2/P AG mixture supply
ran out. To understand this scatter requires a study of the chemical composition of the
390-T6 aluminum surface just before scuffing and the thermal properties of C02/PAG
mixture in the pressure vessel. Such a study was not conducted due to the limited time
and resources devoted to this work.
The scuffing data for R134a1P AG mixture maintains an approximate PV =
constant relationship. As the sliding velocity increases, the scuffing pressure decreases.
Despite the scatter, a similar trend can be ascertained from the CO2/PAG data. It is
essential to observe that, for the same velocity, nearly all of the results obtained using
CO2 as a refrigerant failed at pressures higher than the scuffing pressures using R134a.
7

a.. Q) '-::J If) If) Q) '-a..
...... o ro ...... c o ()
Q) 0)
ro '-Q)
> «
60
50
40
30
20
10
o
: : No Scuffing : : ! ~~ ~C~~~gkN ~ t'!!
------- --------- -------- ---------~---------:------ --Up to 3.34 kN- ----:---------;--------
• No Scuffing ..' , : :
-A6-R134a
o CO 2
~ Up To 3.12 kNO: : : : I " I , , I I , ,
, I I I ,
, ",, , " I ,
I " I , I , , , I
- - - - - - - - .,. - - - - - - - - i - - - - - - - - ., - - - - - - - - -t- - - - - - - - - "'j - - - - - - - - - " - - - - - - -
, I I , , I
I I I I , ,
, I I , , ,
: : 0: : : : 0 , , I I I I
, , 1 I I ,
: : : : : : 0 I , , , , I
, I , , I , I , I
. - - - - - - ; - - - - - - - - -:- - - - - - - - - -: - - - - - -f's - ; - - - - - - - - -:. -- - - - - - - -: - - - - - - - - - ; - - - - - - - - -:- - - - - - - - - ~ - - - - - - - -
/':-:,:
o , ,
- - - - - - - -:- - - - - - - - - ~ - - - - - - - - - ~ - - - - - - - - -:- - - - - - - - - ~ - - - -6 - - - ~ - .. - - - - - -:- - -0- ---; - --- --- - -:- -0- - --
o
" , ---- ---; - -- --- -- -:- - ----- -- ~- - ----- --; - --- ---- -:- - - ----- - ~ -- --- --- -; - -- -- --- -:- - -- -- --- ~ - -6- -- --
, , , , I , I , I
, , , , , , I I I
, , , , , I I I I
I , I , , • I , I
I , I , , , , , I
, I , I , , I , I
I I I I , , , , I
I , I , I , , , I
I I , I I I , , I
I I , I I , , , I
, I , " " I
0.0 0.50 1.0 1.5 2.0 2.5 3.0 3.5 4.0 4.5 5.0
Sliding Velocity, V (m/s)
Fig. 2. Scuffing PV Map for 390-T6 Al and 52100 Steel in R134a1PAG or CO2/PAG
mixture. LSR ~ 40 mg/min.
8

Representative plots of the loading history and friction behavior are given in Figs.
3 and 4 for R134a and Figs. 5 through 10 for the CO2 refrigerant. These data are obtained
for a number of different velocities. The scuffing pressure, if any, is also given in the
figures. Those figure marked with a "P >" did not scuff up to the indicated pressure. Note
the difference in the friction behavior when using the C02 refrigerant as opposed to
R134a. For the R134a tests, the friction coefficient remained nearly constant up to
scuffing. Conversely, during the C02 tests, the friction coefficient peaked early in the
tests and decreased, often to extremely low values, until scuffing occurred or the tests
was halted due to the depletion of the CO2/P AG mixture in the pressure vessel. The levels
of friction achieved from the CO2 tests were less than the typical friction levels obtained
from the R134a tests. Note that there is no significant discrepancy between the friction
behavior of the C02 tests that failed at a low pressure and those that did not fail through
the duration of the test. Both Figs. 7 and 8 and Figs. 9 and 10 compare the friction
behavior of two such tests conducted at the same speed, one of which did not scuff and
another which scuffed. Those tests that scuffed also reached relatively low friction levels
prior to scuffing. These results indicate that the C02/PAG and R134a1P AG mixtures form
different compounds on the 390-T6 aluminum discs. These compounds could probably be
identified through surface analyses. In addition, the results indicate that, if significant
surface interaction occurs, C02 refrigerant systems should be more mechanically efficient
than R134a systems when using P AG lubricants.
9

z ~
"0 ro o -l
c o :g
.;:: u. -o .... c (J)
'u I;::: -(J) o ()
z ~
"0 ro o -l
c o U .;:: u. -o .... c (J)
'u ~ (J) o ()
3.2
2.4
1.6
0.8
0
0.3
0.2
0.1
0
3.2
2.4
1.6
0.8
0
0.3
0.2
0.1
0
0
0 30 60 90 120 150 180 210 240 Time, t (sec)
Fig. 3. Load and Friction Plot for Test With R134a.
v = 1.86 mis, Scuffing P = 26.6 MPa
30 60 90 120 150 180 210 240 Time, t (sec)
Fig. 4. Load and Friction Plot for Test With R134a.
v = 3.72 mis, Scuffing P = 13.3 MPa
10

z ~
"0 (II o
....J
c o n .;:: u... -o
C Q)
'0 a= Q) o ()
z ~
"0 (II o
....J
c o U .;:: u... -o C Q)
'0 l;:: -Q) o ()
3.2
2.4
1.6
0.8
0
0.3
0.2
0.1
0
0
3.2
2.4
1.6
0.8
0
0.3
0.2
0.1
0
0
30 60 90 120 150 180 210 240 Time, t (sec)
Fig. 5. Load and Friction Plot for Test With CO2•
v = l.86 mis, Scuffing P > 53.2MPa
30 60 90 120 150 180 210 240
Time, t (sec)
Fig. 6. Load and Friction Plot for Test With CO2,
v = 4.65 mis, Scuffing P = 26.6 MPa
11

z ~
""C <Il o
...J
C Ql ·0 ~ Ql o ()
c: o n ·c LL
z ~
""C <Il o
...J
C Ql ·0 ~ Ql o ()
c: o n ·c LL
3.2
2.4
1.6
0.8
0
0.3
0.2
0.1
0
0
3.2
2.4
1.6
0.8
0
0.3
0.2
0.1
0
0
30 60 90 120 150 180 210 240
Time, t (sec)
Fig. 7. Load and Friction Plot for Test With CO2•
v = 2.79 mis, Scuffing P > 49.9 MPa
30 60 90 120 150 180 210 240
Time, t (sec)
Fig. 8. Load and Friction Plot for Test With CO2,
v = 2.79 mis, Scuffing P = 23.3 MPa
12

Z .x: -0 III o
....J
c OJ
3.2
2.4
1.6
0.8
o
0.3
'0 0.2 ~ OJ o U g 0.1 "u ·c LL
Z .x: -0 III o
....J
.... c OJ
o
3.2
2.4
1.6
0.8
o
0.3
'0 0.2 tE OJ o U g 0.1
U ·c LL
o
o
o
30 60 90 120 150 180 210 240
Time, t (sec)
Fig. 9. Load and Friction Plot for Test With CO2•
v = 3.72 mis, Scuffing P > 49.9 MPa
30 60 90 120 150 180 210 240
Time, t (sec)
Fig. 10. Load and Friction Plot for Test With CO2•
v = 3.72 mis, Scuffing P = 19.9 MPa
13
CONCLUSIONS
Data were obtained which compared the scuffing resistance of R134a1PAG to
CO2/P AG mixtures. Consistent data could not be acquired for tests conducted using CO2,
nor can a satisfactory explanation for the inconsistency be offered. This is due to a lack of
understanding of the performance of C02 in the system used in this study as well as
possible different surface compounds formed at the 390-T6 aluminum discs. In spite of
the scatter within the data, the results indicate that a C02/P AG mixture has better
lubricative properties than a RI34a1PAG mixture. Once again, a quantitative value cannot
be placed on the extent to which the C02/P AG mixture improves scuffing behavior. A
detailed surface analysis should shed some light on the different behavior of the two
refrigerants. The low friction that was achieved during the progression of the tests
utilizing the C02/P AG mixture is also indicative of its better lubricative properties. These
results show that a swashplate compressor using a CO2/P AG mixture could have a better
mechanical efficiency than one using a RI34a1PAG mixture.
REFERENCES
1. Statusbericht des Deutschen Kalte - und Klimatechnischen Vereins, "Kohlendioxid -
Besonderheiten und Einsatzchancen als Kaltemittel", Nr. 20, November 1998, Deutschen
Kalte - und Klimatechnischen Vereins e.V. (DKV) Pfaffenwaldring 10, D-70569
Stuttgart.
14


![RUNNING HEAD: Affirmative Meritocracy Affirmative ... · Affirmative Meritocracy 3 Affirmative Meritocracy “[A]ffirmative action has to be made consistent with our highest ideals](https://static.fdocuments.in/doc/165x107/6014d37ad021f81c1a51c696/running-head-affirmative-meritocracy-affirmative-affirmative-meritocracy-3.jpg)