Running head: ILLUMINATING THE DARK SIDE OF STRESS … · procedures in an attempt to elicit a...
49
Running head: ILLUMINATING THE DARK SIDE OF STRESS 1 Illuminating the Dark Side of Stress: A mortality salience-based psychosocial stressor Leanne Adams and Aimee Minnozzi ACSENT Laboratory Department of Psychology University of Cape Town Supervisor: Kevin Thomas Co-supervisor: Robyn Human Word Count: Abstract: 243 Main Body: 9 988
Transcript of Running head: ILLUMINATING THE DARK SIDE OF STRESS … · procedures in an attempt to elicit a...
Running head: ILLUMINATING THE DARK SIDE OF STRESS 1
Illuminating the Dark Side of Stress:
A mortality salience-based psychosocial stressor
Leanne Adams and Aimee Minnozzi
ACSENT Laboratory
Department of Psychology
University of Cape Town
Supervisor: Kevin Thomas
Co-supervisor: Robyn Human
Word Count:
Abstract: 243
Main Body: 9 988
ILLUMINATING THE DARK SIDE OF STRESS 2
Abstract
Mental health professionals are concerned about the increasing prevalence of stress-related
illnesses. Elevated levels of the hormone cortisol are implicated in these illnesses, and have
consequences for affective, behavioural, and cognitive functioning. To better understand
these consequences, it is imperative that neuroscientists develop laboratory-based protocols
to study fluctuations in cortisol levels and, subsequently, relations between stress, cortisol,
affect, and cognition. However, no existing protocol has induced robust and sustained cortisol
responses in both men and women. We aimed to address this problem by developing a novel
laboratory-based stress-induction protocol – the Mortality Salience Stress Test (MSST).
Because contemplating one’s own death creates an indiscriminate, ever-present potential to
experience anxiety, we combined an existing stress-induction protocol with a mortality
salience manipulation. We then measured salivary cortisol levels, heart rate and subjective
anxiety in a sample of undergraduate students assigned pseudorandomly to one of four
groups: Stress-Male (n = 12), Control-Male (n = 11), Stress-Female (n = 10), and Control-
Female (n = 11). Those in the Stress groups were exposed to the MSST; those in the Control
groups were exposed to an equivalent, non-stressful control condition. In both men and
women, and relative to the control condition, the MSST produced significantly elevated
salivary cortisol, heart rate, and subjective anxiety. However, some sex differences were
observed with regard to magnitude of elevation and sustainability of cortisol responses.
Future research should seek to better attenuate these sex differences and should directly
compare the MSST with other stress-induction protocols.
Keywords: stress; salivary cortisol; HPA-axis; mortality salience; sex differences, heart rate,
subjective anxiety
ILLUMINATING THE DARK SIDE OF STRESS 3
Illuminating the Dark Side of Stress:
A mortality salience-based psychosocial stressor
Medical and mental health professionals are greatly concerned about the increasing
prevalence of stress-related illnesses (Kudielka, Hellhammer, & Wust, 2009). Consequently,
it is imperative to investigate the biological bases of these illnesses (Kemeny, 2003).
Empirical research has shown, consistently, that elevated levels of the stress hormone
cortisol, resulting from overactivity of the hypothalamic-pituitary-adrenal (HPA) axis, are
implicated in these illnesses (Dickerson & Kemeny, 2004; Kudielka & Wüst, 2010).
Therefore, to investigate the effects of stress on human psychobiological, cognitive, and
affective processes, and hence on human health, it is important to design studies featuring
experimental stimulation of the HPA axis. Many existing laboratory-based stress-induction
methods attempt to do this; however, each has limitations. The current study describes an
improved laboratory-based psychosocial stressor.
Background
Physiological Responses to a Stressful Event
A stressor is any perceived threat to one’s physical or psychological wellbeing
(Kemeny, 2003). Prolonged exposure to stressors can result in impaired physical and mental
health. In humans, stress affects three physiological systems: (a) the sympathetic nervous
system, (b) the immune system, and (c) the HPA axis (Dickerson & Kemeny, 2004).
The HPA axis is of central concern in stress research: It is responsible for the release
of cortisol into the urine, blood, and saliva of humans. Cortisol dysregulation is correlated
with the presence of many stress-related diseases and disorders (Kudielka et al., 2009;
Kudielka & Wüst, 2010). Hence, studying the precursors and effects of elevated cortisol,
under controlled laboratory conditions, is an important step in developing measures to
counteract such dysregulation.
Existing Laboratory-Based Stress-Induction Methods
Empirical studies (e.g., Kirschbaum, Pirke, & Hellhammer, 1993; Schwabe, Haddad,
& Schachinger, 2008; Smeets et al., 2012) demonstrate that acute psychological stressors
activate the HPA axis in that they result in elevated cortisol levels. Experimental research
into the effects of stress on cognitive systems has utilised several different laboratory-based
procedures in an attempt to elicit a physiological stress response. These studies have
demonstrated, conclusively, that cortisol mediates the effects of stress on cognition.
ILLUMINATING THE DARK SIDE OF STRESS 4
The Trier Social Stress Test (TSST; Kirschbaum et al., 1993) and the Cold Pressor
Test (CPT; Hines & Brown, 1932) are used frequently to induce stress in the laboratory. The
TSST requires participants to deliver a speech and to perform a mental arithmetic task in
front of a panel of judges; hence, it involves social-evaluative components and is a
psychological means of inducing a stress response. The CPT, in contrast, requires participants
to submerge their dominant hand in ice water for a few minutes; hence, it involves
physiological induction of the stress response.
Although both procedures provoke physiological stress responses reliably, each is
limited in certain ways. The CPT activates the sympathetic nervous system, but does not
stimulate the HPA axis strongly, and is consequently less proficient at eliciting cortisol
responses (McRae et al., 2006). In contrast, the TSST elicits cortisol responses more reliably
than the CPT because it incorporates psychosocial evaluative threat, unpredictability, and
uncontrollability (Dickerson & Kemeny, 2004). The TSST does not, however, produce a
consistent, robust, and sustained cortisol response in all participants (Buchanan & Tranel,
2008; Kudielka et al., 2009). Numerous studies report that cortisol elevations are greater in
men than in women after TSST exposure (Kudielka & Kirschbaum, 2005).
These sex differences are not unique to the TSST: There are clear sex differences in
HPA-axis response patterns, and so, in reaction to psychosocial stressors, men consistently
show a cortisol response almost twice that of women (Kudielka et al., 2009). One explanation
for these differences involves the effect that menstrual cycle phase has on the magnitude of
cortisol elevation in response to psychosocial stress (Kirschbaum, Kudielka, Gaab,
Schommer, & Hellhammer, 1999). Whereas women in the follicular phase of the cycle
demonstrate considerably lower cortisol responses than men following TSST exposure,
women in the luteal phase demonstrate similar responses to men. Furthermore, women using
oral contraceptives show diminished cortisol responses to psychosocial stress (Kirschbaum,
Pirke, & Hellhammer, 1995). Another explanation considers the possibility of sex differences
in the psychological response to stress-induction methods. Stroud, Salovey, and Epel (2002)
found that women demonstrated greater cortisol responses to social rejection challenges (e.g.,
task performance judged negatively by others), whereas men demonstrated greater cortisol
responses to achievement challenges (e.g., the TSST).
To address some of these limitations of the TSST, Smeets et al. (2012) developed the
Maastricht Acute Stress Test (MAST): a combination of the most successful physiological
and psychological components of the CPT and TSST, respectively. Although the authors
reported that the MAST elicited robust cortisol responses in comparison to the CPT and the
ILLUMINATING THE DARK SIDE OF STRESS 5
TSST, the study was limited in that these elevated responses were not sustained over time
(i.e., they diminished sharply after 10 minutes). Another major limitation of Smeets et al.’s
study was that their sample consisted of only male participants; hence, it did not demonstrate
the effectiveness of the protocol in women.
du Plooy, Thomas, Henry, Human, and Jacobs (under review) also devised a stress-
induction protocol, the Fear Factor Stress Test (FFST), that combines the TSST and the CPT.
Participants are asked to imagine undergoing an audition for the reality television show Fear
Factor. As part of the ‘audition,’ they are required to deliver a motivational speech, perform a
verbal arithmetic task, and place one hand into a bucket of ice water. Preliminary data
showed that, although the FFST did not elicit greater subjective anxiety responses,
sympathetic activation or cortisol responses than the TSST, it did produce a sustained cortisol
response over a longer period and in a greater proportion of participants. The FFST also
produced a significant increase over the TSST in the number of women who demonstrated a
sustained cortisol response. Hence, du Plooy et al. asserted that the FFST reduces the
magnitude of (but does not eliminate) sex differences often seen post-TSST.
These findings suggest that the combination of physiological and psychological
components in the MAST and the FFST, and not simply the occurrence of each component in
isolation, produces an increased HPA-axis response, and therefore a more sustained cortisol
response, than that seen following TSST exposure. This conclusion is consistent with
Dickerson and Kemeny’s (2004) assertion that laboratory-based stressors containing
uncontrollable, social-evaluative, and physiological elements are associated with the largest
and most sustained cortisol responses.
A continuing problem with these protocols, however, is that they lack ecological
validity: They require participants to perform tasks that do not necessarily approximate real-
world events or settings. For instance, delivering a job-interview speech is not a frequently
encountered stressful experience, particularly in the undergraduate samples that comprise the
typical TSST study. Similarly, stress associated with delivering a speech regarding one’s
suitability for an appearance a television show is also not commonly encountered by most
individuals. Improving ecological validity in experimental protocols is important for the
application of laboratory-based conclusions to real-world settings (Orne & Holland, 1968).
Mortality Salience
Humans have self-awareness and an ability for symbolic thought that allows for the
comprehension of imminent death (Tritt, Inzlicht, & Harmon-Jones, 2012). Landau,
Solomon, Pyszcynski, and Greenberg (2007) suggest that this knowledge is the largest source
ILLUMINATING THE DARK SIDE OF STRESS 6
of debilitating anxiety in psychological functioning: From an evolutionary perspective, it
conflicts directly with the dominant and primal drive for continued survival.
Mortality salience (MS) laboratory manipulations induce an awareness of
participants’ inevitable death and investigate subsequent effects on worldview defence
(Arndt, Allen, & Greenberg, 2001; Burke, Martens, & Faucher, 2010). Although Arndt et al.
(2001) showed that MS inductions result in physiological signs of subjective anxiety, MS
research generally makes use of a black box approach that does not delineate biological
mechanisms that may underlie social or cognitive changes following the experimental
manipulation. Tritt et al. (2012), however, propose a neuroscientific understanding of MS
effects. They suggest that model the resolution of death-related uncertainty is processed in
brain-based anxiety systems. These systems produce raised levels of cortisol and other stress
hormones in response to the experience of uncertainty.
Previous social psychological research has investigated the effects of MS
manipulations on a range of human behaviour (see, e.g., Burke et al., 2010). However, there
is no study, to our knowledge, that has investigated MS as a part of a stress protocol within a
neuropsychological framework. Applying Tritt et al.’s (2012) notion that cortisol levels
increase following MS manipulations, we investigated whether incorporating an MS
manipulation into the FFST results in a more efficient psychosocial stressor.
Rationale, Specific Aims, and Hypotheses
Existing laboratory-based stress-induction protocols produce, in many participants, a
physiological stress response via stimulation of the HPA axis. Although the combination of
physiological and psychological stressors in the MAST and FFST elicits a more sustained
HPA-axis response than the TSST and the CPT separately, there are a number of limitations
of the FFST. These include (a) a lack of ecological validity, (b) sex differences in cortisol
responses, and (c) a lack of robust and sustained cortisol responses in all exposed
participants.
Because the uniquely human awareness of the inevitability of death is at odds with the
desire for continued life, and creates an indiscriminate, ever-present potential to experience
anxiety (Landau et al., 2007), we sought to investigate whether the addition of an MS
manipulation to the FFST would improve the ecological validity of this stress-induction
protocol. Moreover, to attenuate sex differences, we sought to reduce the achievement
components present in existing protocols such as the TSST and FFST. Finally, because the
concept of death is a highly pertinent and authentic threat to existence, we proposed that the
ILLUMINATING THE DARK SIDE OF STRESS 7
stressor described here would induce larger, and more sustained, cortisol responses in a
greater proportion of participants.
Overall, we addressed the limitations of existing laboratory-based stress-induction
protocols by investigating the efficacy of a novel protocol called the Mortality Salience Stress
Test (MSST). We hypothesised that, compared to participants exposed to a control condition,
those exposed to the MSST would show (1) an elevated and sustained cortisol response
across all measurement points during and post-manipulation, (2) elevated heart rate during
the manipulation, with a decline immediately post-manipulation, and (3) elevated subjective
anxiety during the manipulation, with a decline immediately post-manipulation. We also
hypothesised that (4) there would be no significant sex differences on both physiological and
self-report measures of stress.
Methods
Design and Setting
The study employed a 2 x 2 x 5 (Experimental Condition x Sex x Time) repeated-
measures factorial design. Between-subject variables were Experimental Condition (Stress
versus Control) and Sex (male versus female). The within-subject variable was Time;
measurement points for this variable were once before the manipulation (baseline) and four
times post-manipulation. Outcome variables included salivary cortisol levels, heart rate, and
subjective anxiety.
Study procedures took place between 14h00 and 18h30 to control for cortisol’s
diurnal cycle. Studies utilising acute psychosocial stressors are best run in the late afternoon
(i.e., when cortisol levels are at their lowest and most constant) because this is when changes
in cortisol due to a stressor are most easily identifiable (Maheu, Collicut, Kornik,
Moszkowski, & Lupien, 2005).
We ran the study in two venues in the Department of Psychology at the University of
Cape Town (UCT). In the first venue, a computer laboratory, participants completed all self-
report and physiological measures. In the second venue, a nearby smaller room, participants
were exposed to the experimental manipulation.
Participants
Forty-four healthy university students (23 men, 21 women) met the inclusion criteria
and provided largely complete data sets for analysis. A power analysis suggested that using a
sample of this size leads to an achieved power of .94 when α is set at .05 and the assumed
effect size is set at .25 (i.e., is of medium magnitude; Faul, Erdfelder, Lang, & Buchner,
2007). Cohen (1992) advises a statistical power greater than .80 in order to achieve an
ILLUMINATING THE DARK SIDE OF STRESS 8
acceptable effect size. Therefore, we argue that our design achieved an acceptable level of
statistical power. High levels of statistical power are important as they demonstrate the ability
of laboratory-based findings to find an effect in the data when the effect exists in the real
world (Faul et al., 2007).
We recruited participants from undergraduate psychology classes at UCT using the
Student Research and Participation Programme (SRPP); hence, we employed a self-selected
sampling method. Potential participants were notified of the study’s availability and of the
exclusion criteria via the SRPP website. Male participants signed up for a test session using
the site interface. Sign-up procedures for females are documented below.
Participants who survived the exclusion criteria listed below were pseudorandomly
assigned to one of four groups: Stress-Female, Control-Female, Stress-Male, or Control-
Male.
Exclusion criteria. We investigated participant eligibility using a sociodemographic
questionnaire and the other screening instruments described below. Exclusion criteria
included: (a) smoking, (b) a Beck Depression Inventory – Second Edition (BDI-II; Beck,
Steer, & Brown, 1996) score of ≥ 29 (indicating current experience of severe depression), (c)
the use of any prescription or steroid-based medication, including oral contraceptives, and (d)
a body mass index (BMI) of more than 31 or less than 18. Research investigating the effects
of psychosocial stress on cognitive performance has identified these factors as potentially
confounding variables (Kirschbaum et al., 1999; Wirtz, Ehlert, Emini, & Suter, 2008).
To improve on a previous methodological study conducted by our laboratory (du
Plooy et al., under review), we controlled for females’ menstrual cycle phase and oral
contraceptive use. Both of these have a significant effect on HPA-axis responsiveness to
psychosocial stress (Kirschbaum et al., 1995, 1999). Hence, we required that female
participants be in the luteal phase of their cycle (i.e., the 12 days preceding the start of their
menses; Kirschbaum, Wüst & Hellhammer, 1992) when they experienced the experimental
protocols; this phase is when the female HPA-axis response is most similar to that of men.
Hence, to sign up for the study, we asked female participants to contact us directly, via e-
mail, with their name, student number, and contact number. In the e-mail, they were asked to
verify details regarding the regularity of their menstrual cycle, as well as the estimated
starting date of their next period. Thereafter, we offered and confirmed a date for a test
session on a day within the 12-day period of their luteal phase.
ILLUMINATING THE DARK SIDE OF STRESS 9
Materials and Manipulations
Participant self-report measurements. The following instruments collected
information on participant eligibility, affective traits, and affective state before, during, and
after the experimental manipulation.
Sociodemographic questionnaire. This questionnaire (see Appendix A) gathered
information regarding age, sex, smoking habits, medication intake, and current and past
psychological illness.
Beck Depression Inventory-II (BDI-II). This is a self-report questionnaire containing
21 items. Each item has four possible responses, indicating differing degrees of possible
depressive symptomatology. Respondents are asked to choose the response that best
approximates how they have been feeling for the 2 weeks prior to reporting. Higher scores
indicate greater levels of depression; scores ≥ 29 (the cut-off in this study) indicate severe
depression (Beck et al., 1996).
The BDI-II was developed to comply with the diagnostic criteria for major depression
listed in the fourth edition of the Diagnostic and Statistical Manual of Mental Disorders
(DSM-IV; American Psychiatric Association, 1994). It has high levels of internal consistency
(α = .91; Dozois, Dobson, & Ahnberg, 1998), and good test-retest reliability (α = .93; Beck et
al., 1996).
We used the BDI-II as a screening measure: Participants scoring ≥ 29 or above were
excluded from the study. Those scoring less than 29 but scoring 2 or more on suicidal
ideation items were also excluded because the experimental manipulation required that
participants contemplate their death.
State-Trait Anxiety Inventory (STAI). The STAI (Spielberger, Gorsuch, Lushene,
Vagg, & Jacobs, 1983) contains (1) the STAI-State (Form Y-1), which measures an
individual’s anxiety at a particular time point (state anxiety), and (2) the STAI-Trait (Form
Y-2), which measures an individual’s general level of anxiety (trait anxiety). Both forms
consist of 20 items expressed as statements; each statement is rated using a 4-point Likert-
type scale.
The STAI has been used widely with undergraduate student populations and has
acceptable reliability levels (α = .92). Additionally, it has a reliable factor structure, high
levels of validity, and high levels of internal consistency (Spielberger & Vagg, 1984).
We used the STAI-Trait to measure general levels of anxiety in the participants and to
ensure that, across groups, participants were experiencing comparable levels of anxiety in
ILLUMINATING THE DARK SIDE OF STRESS 10
their daily lives. The STAI-State measured changes in self-reported anxiety at five points
during the study.
Physiological measurements. We used the apparatus described below to collect
information on participant physiological states before, during, and after the experimental
manipulation.
Salivary cortisol. We used SARSTEDT Salivette® Cortisol swabs (Sarstedt,
Nümbrecht, Germany) to collect saliva samples from each participant. The swab is a simple
and non-intrusive means of collecting cortisol samples without causing participants undue
discomfort (Garde & Hansen, 2005). For each collection, we instructed the participant to
chew on a cotton swab for 1 minute. Thereafter, we stored the samples in individual tubes
and froze them until they were transported to the National Health Laboratory Services at
Groote Schuur Hospital, where they underwent analysis.
Heart rate. We fitted participants with a Vrije Universiteit Ambulatory Monitoring
System, version 5fs (VU-AMS; Vrije Universiteit, Amsterdam, Holland) at the beginning of
each session. The VU-AMS is a non-invasive, portable device that allowed participants to
move between the two study venues whilst wearing it. The device measured heart rate
continuously until it was removed at the end of the study.
The experimental manipulation. Each participant experienced either the MSST or a
control condition that mimicked the MSST but was devoid of its purported stress-inducing
components.
Mortality Salience Stress Test (MSST). This is a laboratory-based psychosocial
stressor that consists of three components: (a) a 5-minute free-form speech, (b) a 5-minute
mental arithmetic task, and (c) a 2-minute physical challenge in which the participant is asked
to submerge his/her hand in ice water. This stressor aims to improve on the FFST by
modifying the protocol to include an MS manipulation: Instead of asking participants to write
a speech that will convince the judges of their suitability for the television show, is asks them
to write a speech wherein they speak about their own imminent death. In comparison with the
content of the TSST and FFST speech components, the MSST speech component has no
competitive element and thus seeks to reduce achievement challenges present in the other
protocols.
In accordance with research utilising the FFST protocol (du Plooy et al., under
review; Human et al., 2013), we informed participants that they would be auditioning for a
place on the reality television show Fear Factor. We then gave them a set of standardised
instructions that introduced them to the task. The instructions informed them they would be
ILLUMINATING THE DARK SIDE OF STRESS 11
auditioning for the role in front of a panel of behavioural health experts who would analyse
their verbal and nonverbal behaviour with the aid of a video recording. We told participants
that the audition comprised three tasks: (a) a speech about the circumstances of their death
that would demonstrate their ability to withstand the psychological pressures associated with
an appearance on Fear Factor; (b) a mental arithmetic task that would test their ability to
perform under pressure; and (c) a test of pain tolerance that would test their ability to
withstand the physical demands of the television show.
We then instructed the participant to prepare a 5-minute speech describing the
circumstances of their death in detail, the emotions and the thoughts that death arouses in
them, and what they thought would happen to them as they physically die and after they are
physically dead (Landau et al., 2007). The participant received a blank piece of paper and 10
minutes to prepare the speech. Thereafter, we took him/her to a room where s/he completed
the rest of the stress manipulation. This room was lit only by a bright spotlight, directed at the
participant, and contained a video camera and a panel of two judges (one man and one
woman). We instructed the participant to stand directly in front of the judges, who were
seated behind a desk and who were dressed smartly to convey the appearance of behavioural
experts. Just before the procedure commenced, we removed, without warning, the piece of
paper containing the participant’s prepared speech. The judge of the opposite sex to the
participant then instructed him/her to present the speech. If the participant hesitated or
stopped speaking before the time elapsed, the same judge followed a script specifying how to
respond to the participant (see Appendix B).
Following the speech, the judge of the opposite sex to the participant asked him/her to
perform a serial subtraction task (subtracting 17 from 2043 continuously). If the participant
performed an incorrect subtraction, the same judge instructed him/her to start the task from
the beginning. Finally, the judge of the same sex as the participant asked him/her to submerge
his/her arm in a bucket of ice water (between 0 and 4ºC) for as long as possible, up to a
maximum of 2 minutes.
For the duration of the manipulation, judges maintained eye contact with the
participant, but did not engage with him/her or show any signs of reinforcement or support.
For the duration of the manipulation, the participant remained standing and the researcher
remained in the room. The MSST took 22 minutes to complete.
Control. We instructed participants to write, on a single sheet of paper, a summary of
everything they had done that day. After 10 minutes they were taken to a well-lit room where
we instructed them to stand and read aloud from a general interest magazine for 5 minutes.
ILLUMINATING THE DARK SIDE OF STRESS 12
We left the room for the duration of this task. Thereafter, we re-entered the room and asked
participants to count upwards in multiples of 5, starting from 0, for 5 minutes. Again, we left
the room for the duration of this task. We then re-entered the room and instructed the
participant to submerge his/her arm into warm water (34-38 ºC) for as long as possible, up to
a maximum of 2 minutes.
Procedure
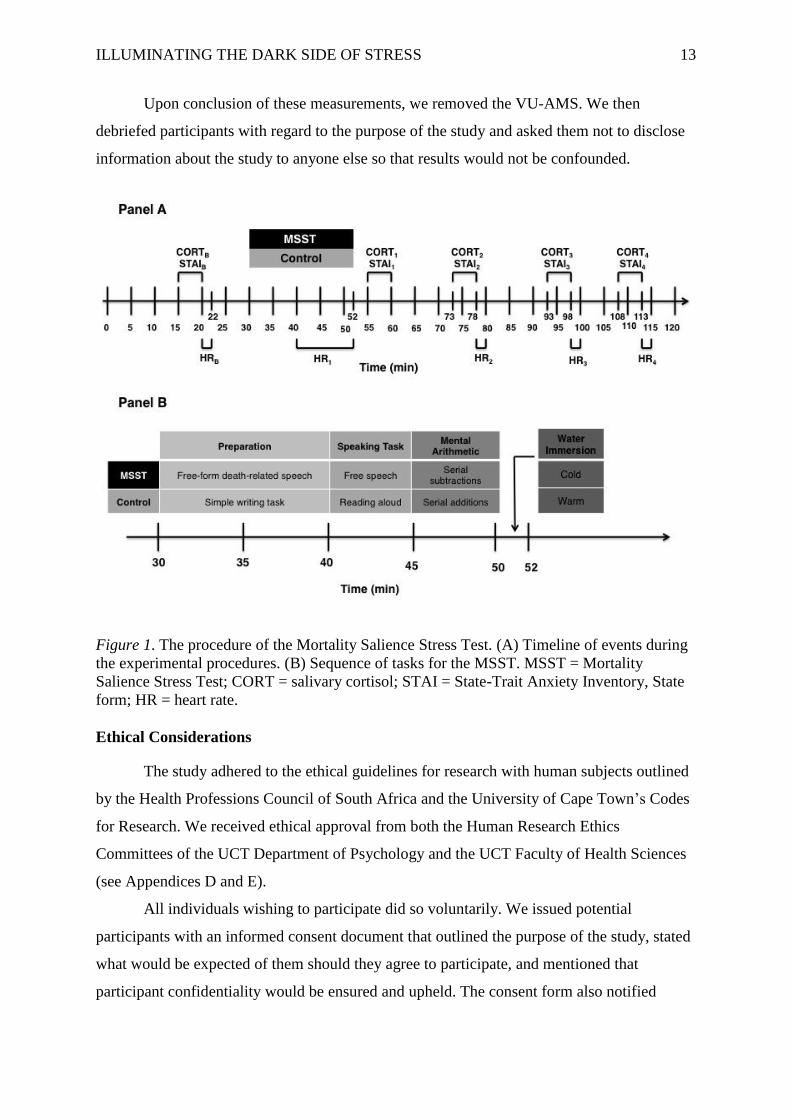
Figure 1 outlines the experimental procedures.
Similar to previous studies conducted in our laboratory (e.g., Human et al., 2013), we
reminded participants via e-mail the day before their session to refrain from eating, drinking
(except water), or doing physical exercise for 2 hours before testing. Upon arrival,
participants read and signed an informed consent document (Appendix C). Thereafter, we
administered the sociodemographic questionnaire, the BDI-II, and the STAI-Trait. Because
participants who met the depression exclusion criterion were not allowed to continue with the
rest of the experiment, we scored the BDI-II while participants completed the STAI-Trait.
Thereafter we measured the participants’ height and weight in order to estimate BMI.
If these screening procedures established the participant’s eligibility to continue, we
fitted him/her with the VU-AMS and allowed a 5-minute rest period for the device to
normalise to his/her heart rate. Then followed a 2-minute baseline heart rate reading (HRB).
We then administered the first STAI-State (STAIB) and thereafter collected the first saliva
sample (CORTB). We then gave participants instructions for the speech-writing component of
the experimental manipulation. After the allotted preparation time had elapsed, we escorted
participants to the room in which the experimental manipulation took place (see Figure 1,
Panel B). Upon completion of the experimental manipulation, participants returned to the
research laboratory for a 5-minute relaxation period.
We then took physiological (HR2-4; CORT1-4) and self-report (STAI1-4)
measurements, identical to baseline measures, at 5 minutes, 20 minutes, 40 minutes, and 55
minutes following the end of the experimental manipulation (see Figure 1, Panel A).
However, as an exception, participants’ average heart rate over the final 10 minutes of the
stressor represented the second heart rate measurement (HR1). Other post-manipulation
measures, not relevant to this study, took place between the abovementioned measurement
points.
ILLUMINATING THE DARK SIDE OF STRESS 13
Upon conclusion of these measurements, we removed the VU-AMS. We then
debriefed participants with regard to the purpose of the study and asked them not to disclose
information about the study to anyone else so that results would not be confounded.
Figure 1. The procedure of the Mortality Salience Stress Test. (A) Timeline of events during
the experimental procedures. (B) Sequence of tasks for the MSST. MSST = Mortality
Salience Stress Test; CORT = salivary cortisol; STAI = State-Trait Anxiety Inventory, State
form; HR = heart rate.
Ethical Considerations
The study adhered to the ethical guidelines for research with human subjects outlined
by the Health Professions Council of South Africa and the University of Cape Town’s Codes
for Research. We received ethical approval from both the Human Research Ethics
Committees of the UCT Department of Psychology and the UCT Faculty of Health Sciences
(see Appendices D and E).
All individuals wishing to participate did so voluntarily. We issued potential
participants with an informed consent document that outlined the purpose of the study, stated
what would be expected of them should they agree to participate, and mentioned that
participant confidentiality would be ensured and upheld. The consent form also notified
ILLUMINATING THE DARK SIDE OF STRESS 14
potential participants of their right to withdraw from the study at any point without penalties
or negative consequences.
We debriefed all participants at the end of their participation. We also informed those
who had been in the MSST condition that their performance in the ‘audition’ was not
videotaped, and that their performance was not evaluated in any way by the judges. We
explained that for the psychosocial stressor to have maximum effect, it was necessary to
deceive them in this way.
The risks involved in participating included experiencing a mildly stressful situation.
However, there were no other discomforts or risks associated with participation. If
participants were excluded from the study based on their BDI-II scores/responses, or if they
showed signs of subjective distress at the end of the study, we provided them with contact
details for the UCT Student Wellness Centre so that they could seek counselling services if so
desired. Although one participant (a 22-year-old female in the Stress condition) took the
option to withdraw from the study following the experimental manipulation, no participants
reported remaining in a subjectively distressed state at the end of the study.
Regarding benefits of participation, all participants received course credit via the
SRPP system.
Data Management and Statistical Analyses
Details about specific analyses are provided before presentation of the results. We
conducted all statistical analyses using IBM
SPSS
Statistics Version 21. We set the
threshold level of statistical significance (α) at .05, and calculated the appropriate effect size
estimate for each analysis.
Before beginning inferential analyses, we ensured that the data met the assumptions
underlying each proposed parametric test. Unless otherwise stated, all of the required
assumptions were upheld for each statistical analysis. In repeated-measures ANOVA
analyses where Mauchley’s test indicated that the assumption of sphericity was violated, we
used Greenhouse-Geisser estimates for corrected degrees of freedom. Furthermore, unless
otherwise stated there were no significant differences in baseline measurements for
physiological and self-report data, and therefore we did not make use of difference scores
under these conditions.
ILLUMINATING THE DARK SIDE OF STRESS 15
Results
Final Sample
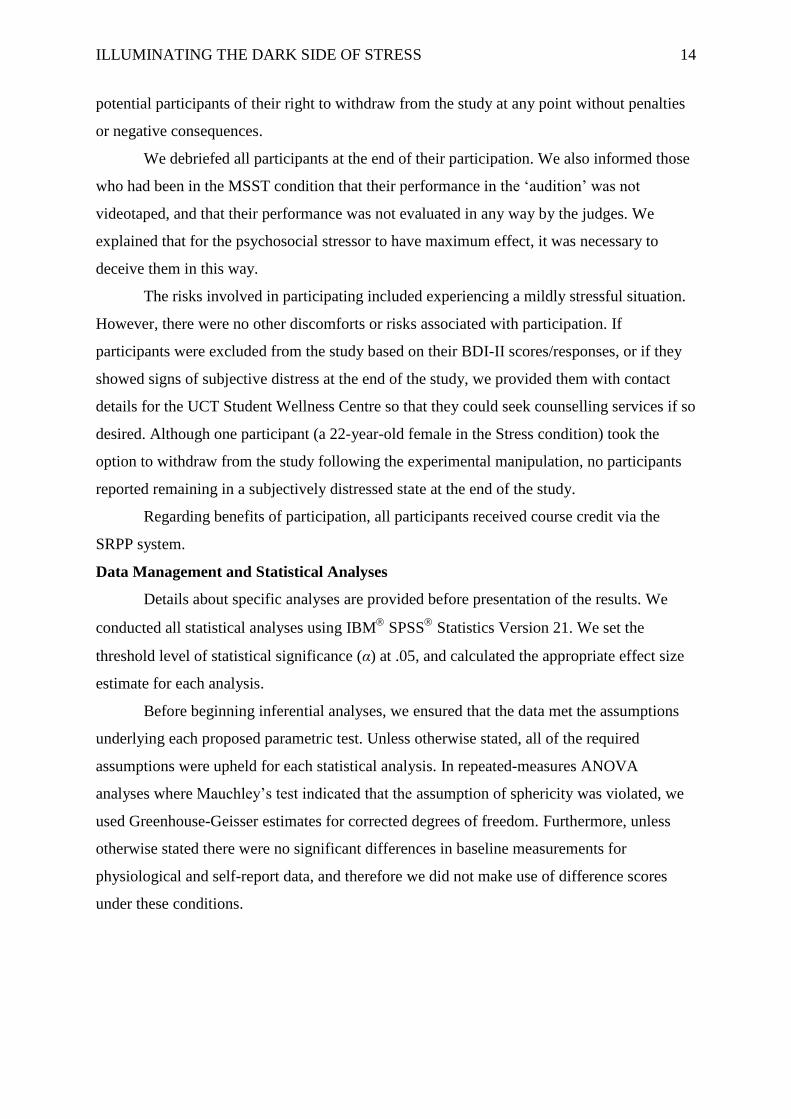
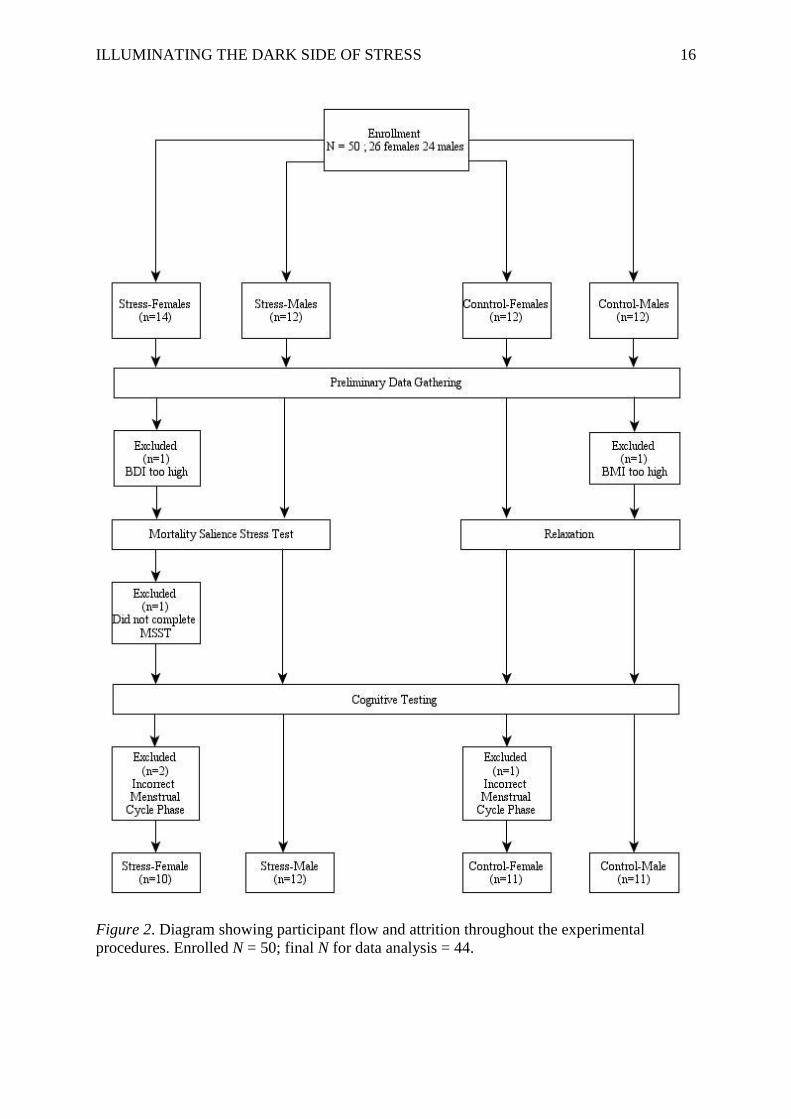
Reasons for participant exclusion. Figure 2 diagrams the sources of attrition during
the data collection process. Three of the 50 participants who enrolled in the study did not
complete it. Two were excluded after completing the screening measures. One, assigned to
the Stress-Female group, did not meet the BDI-II eligibility criterion. The other, assigned to
the Control-Male group, did not meet the BMI eligibility criterion. The third participant,
assigned to the Stress-Female group, opted to withdraw before completing the MSST. Of
note here is that this participant differed significantly, in terms of demographic
characteristics, from participants who did complete the study (see Appendix F).
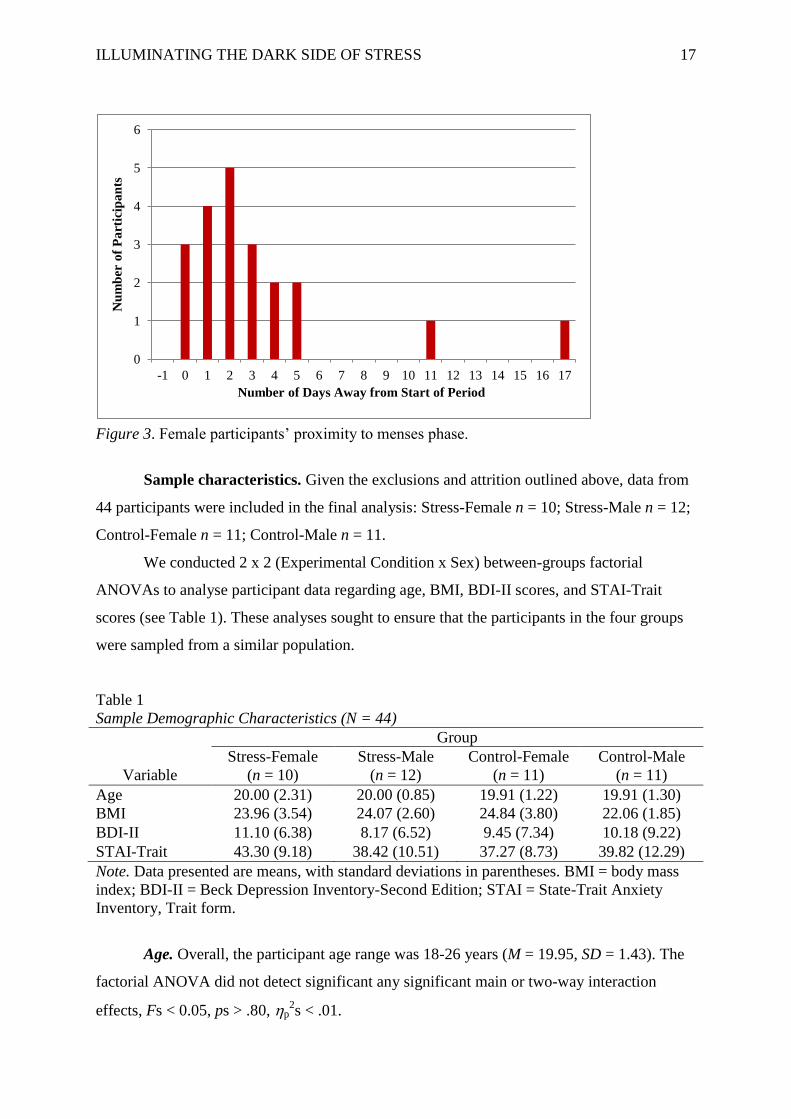
Post-experiment self-report verification revealed that 21 of the 24 female participants
who completed the experimental procedures were tested either in the luteal phase of their
menstrual cycles or 3 days outside of the desired phase (see Figure 3). The other three
female participants were excluded because (a) one, assigned to the Stress-Female group, had
not reported beginning her menses more than 2 months after testing, (b) another, also
assigned to the Stress-Female group, was tested 7 days out of the luteal phase, and (c) the
third, assigned to the Control-Female group, was tested 5 days out of the luteal phase. Hence,
our final analyses excluded the data from these three participants.
ILLUMINATING THE DARK SIDE OF STRESS 16
Figure 2. Diagram showing participant flow and attrition throughout the experimental
procedures. Enrolled N = 50; final N for data analysis = 44.
ILLUMINATING THE DARK SIDE OF STRESS 17
0
1
2
3
4
5
6
-1 0 1 2 3 4 5 6 7 8 9 10 11 12 13 14 15 16 17
Nu
mb
er o
f P
art
icip
an
ts
Number of Days Away from Start of Period
Figure 3. Female participants’ proximity to menses phase.
Sample characteristics. Given the exclusions and attrition outlined above, data from
44 participants were included in the final analysis: Stress-Female n = 10; Stress-Male n = 12;
Control-Female n = 11; Control-Male n = 11.
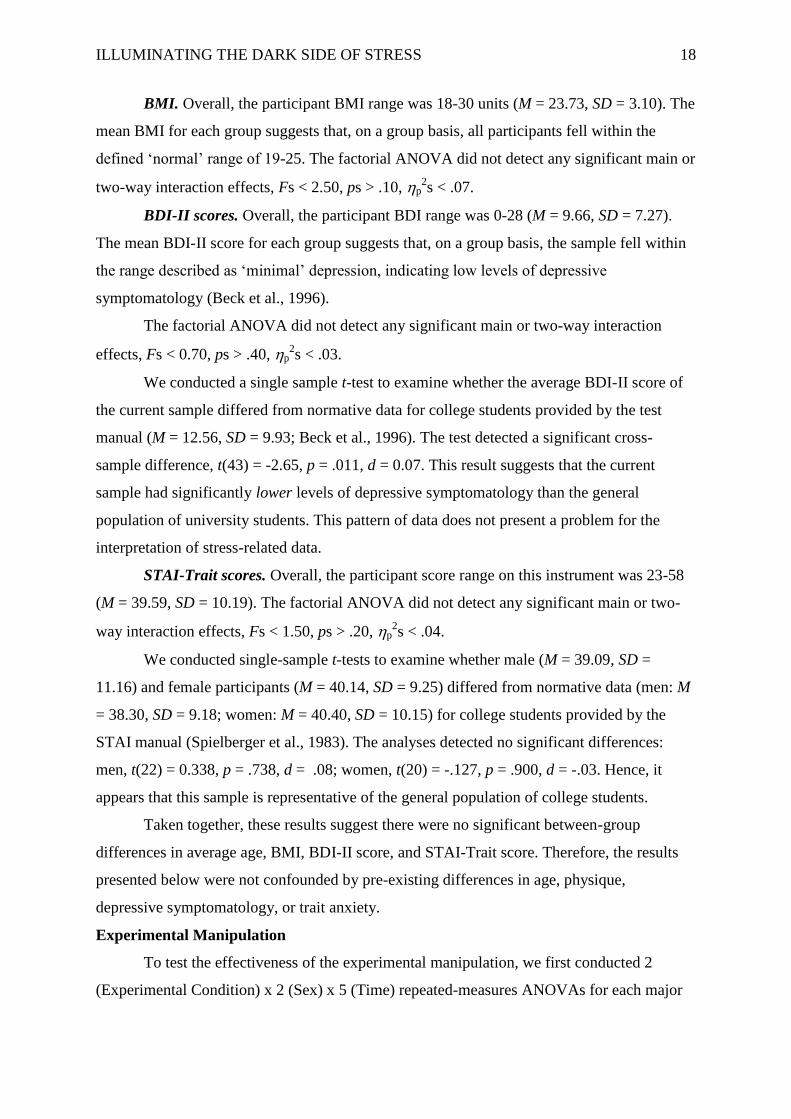
We conducted 2 x 2 (Experimental Condition x Sex) between-groups factorial
ANOVAs to analyse participant data regarding age, BMI, BDI-II scores, and STAI-Trait
scores (see Table 1). These analyses sought to ensure that the participants in the four groups
were sampled from a similar population.
Table 1
Sample Demographic Characteristics (N = 44)
Group
Stress-Female Stress-Male Control-Female Control-Male
Variable (n = 10) (n = 12) (n = 11) (n = 11)
Age 20.00 (2.31) 20.00 (0.85) 19.91 (1.22) 19.91 (1.30)
BMI 23.96 (3.54) 24.07 (2.60) 24.84 (3.80) 22.06 (1.85)
BDI-II 11.10 (6.38) 8.17 (6.52) 9.45 (7.34) 10.18 (9.22)
STAI-Trait 43.30 (9.18) 38.42 (10.51) 37.27 (8.73) 39.82 (12.29)
Note. Data presented are means, with standard deviations in parentheses. BMI = body mass
index; BDI-II = Beck Depression Inventory-Second Edition; STAI = State-Trait Anxiety
Inventory, Trait form.
Age. Overall, the participant age range was 18-26 years (M = 19.95, SD = 1.43). The
factorial ANOVA did not detect significant any significant main or two-way interaction
effects, Fs < 0.05, ps > .80, p2s < .01.
ILLUMINATING THE DARK SIDE OF STRESS 18
BMI. Overall, the participant BMI range was 18-30 units (M = 23.73, SD = 3.10). The
mean BMI for each group suggests that, on a group basis, all participants fell within the
defined ‘normal’ range of 19-25. The factorial ANOVA did not detect any significant main or
two-way interaction effects, Fs < 2.50, ps > .10, p2s < .07.
BDI-II scores. Overall, the participant BDI range was 0-28 (M = 9.66, SD = 7.27).
The mean BDI-II score for each group suggests that, on a group basis, the sample fell within
the range described as ‘minimal’ depression, indicating low levels of depressive
symptomatology (Beck et al., 1996).
The factorial ANOVA did not detect any significant main or two-way interaction
effects, Fs < 0.70, ps > .40, p2s < .03.
We conducted a single sample t-test to examine whether the average BDI-II score of
the current sample differed from normative data for college students provided by the test
manual (M = 12.56, SD = 9.93; Beck et al., 1996). The test detected a significant cross-
sample difference, t(43) = -2.65, p = .011, d = 0.07. This result suggests that the current
sample had significantly lower levels of depressive symptomatology than the general
population of university students. This pattern of data does not present a problem for the
interpretation of stress-related data.
STAI-Trait scores. Overall, the participant score range on this instrument was 23-58
(M = 39.59, SD = 10.19). The factorial ANOVA did not detect any significant main or two-
way interaction effects, Fs < 1.50, ps > .20, p2s < .04.
We conducted single-sample t-tests to examine whether male (M = 39.09, SD =
11.16) and female participants (M = 40.14, SD = 9.25) differed from normative data (men: M
= 38.30, SD = 9.18; women: M = 40.40, SD = 10.15) for college students provided by the
STAI manual (Spielberger et al., 1983). The analyses detected no significant differences:
men, t(22) = 0.338, p = .738, d = .08; women, t(20) = -.127, p = .900, d = -.03. Hence, it
appears that this sample is representative of the general population of college students.
Taken together, these results suggest there were no significant between-group
differences in average age, BMI, BDI-II score, and STAI-Trait score. Therefore, the results
presented below were not confounded by pre-existing differences in age, physique,
depressive symptomatology, or trait anxiety.
Experimental Manipulation
To test the effectiveness of the experimental manipulation, we first conducted 2
(Experimental Condition) x 2 (Sex) x 5 (Time) repeated-measures ANOVAs for each major
ILLUMINATING THE DARK SIDE OF STRESS 19
outcome variable (salivary cortisol; heart rate; STAI-State scores). We followed up each
ANOVA with a set of planned contrasts to test pre-existing hypotheses regarding between-
and within-group differences.
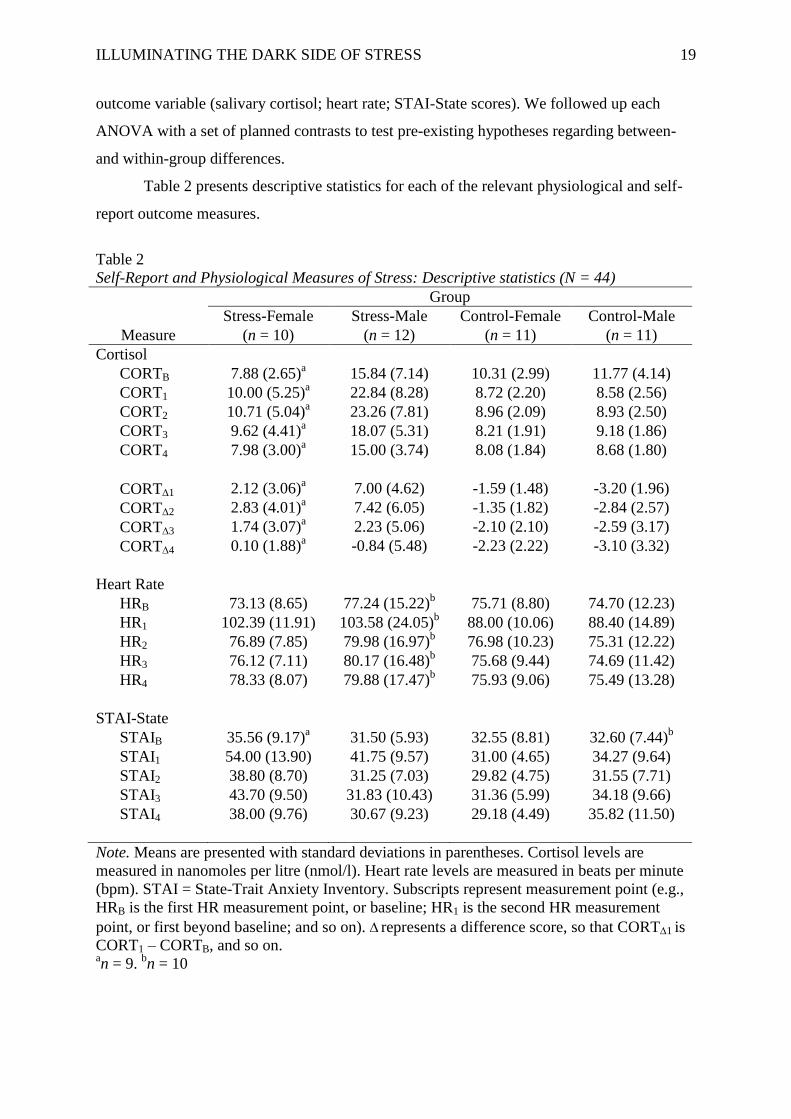
Table 2 presents descriptive statistics for each of the relevant physiological and self-
report outcome measures.
Table 2
Self-Report and Physiological Measures of Stress: Descriptive statistics (N = 44)
Group
Stress-Female Stress-Male Control-Female Control-Male
Measure (n = 10) (n = 12) (n = 11) (n = 11)
Cortisol
CORTB 7.88 (2.65)a 15.84 (7.14) 10.31 (2.99) 11.77 (4.14)
CORT1 10.00 (5.25)a 22.84 (8.28) 8.72 (2.20) 8.58 (2.56)
CORT2 10.71 (5.04)a 23.26 (7.81) 8.96 (2.09) 8.93 (2.50)
CORT3 9.62 (4.41)a 18.07 (5.31) 8.21 (1.91) 9.18 (1.86)
CORT4 7.98 (3.00)a 15.00 (3.74) 8.08 (1.84) 8.68 (1.80)
CORT1 2.12 (3.06)a 7.00 (4.62) -1.59 (1.48) -3.20 (1.96)
CORT2 2.83 (4.01)a 7.42 (6.05) -1.35 (1.82) -2.84 (2.57)
CORT3 1.74 (3.07)a 2.23 (5.06) -2.10 (2.10) -2.59 (3.17)
CORT4 0.10 (1.88)a -0.84 (5.48) -2.23 (2.22) -3.10 (3.32)
Heart Rate
HRB 73.13 (8.65) 77.24 (15.22)b 75.71 (8.80) 74.70 (12.23)
HR1 102.39 (11.91) 103.58 (24.05)b 88.00 (10.06) 88.40 (14.89)
HR2 76.89 (7.85) 79.98 (16.97)b 76.98 (10.23) 75.31 (12.22)
HR3 76.12 (7.11) 80.17 (16.48)b 75.68 (9.44) 74.69 (11.42)
HR4 78.33 (8.07) 79.88 (17.47)b 75.93 (9.06) 75.49 (13.28)
STAI-State
STAIB 35.56 (9.17)a 31.50 (5.93) 32.55 (8.81) 32.60 (7.44)
b
STAI1 54.00 (13.90) 41.75 (9.57) 31.00 (4.65) 34.27 (9.64)
STAI2 38.80 (8.70) 31.25 (7.03) 29.82 (4.75) 31.55 (7.71)
STAI3 43.70 (9.50) 31.83 (10.43) 31.36 (5.99) 34.18 (9.66)
STAI4 38.00 (9.76) 30.67 (9.23) 29.18 (4.49) 35.82 (11.50)
Note. Means are presented with standard deviations in parentheses. Cortisol levels are
measured in nanomoles per litre (nmol/l). Heart rate levels are measured in beats per minute
(bpm). STAI = State-Trait Anxiety Inventory. Subscripts represent measurement point (e.g.,
HRB is the first HR measurement point, or baseline; HR1 is the second HR measurement
point, or first beyond baseline; and so on). represents a difference score, so that CORT1 is
CORT1 – CORTB, and so on. an = 9.
bn = 10
ILLUMINATING THE DARK SIDE OF STRESS 20
Physiological measures of stress. Below, we present analyses of salivary cortisol and
heart rate data separately.
Salivary cortisol. Data for a participant in the Stress-Female group were excluded
from the analysis because her cortisol levels were much higher than the rest of the sample.
Her baseline cortisol level (394.10 nmol/l) was 165 standard deviations above the mean of
the group to which she had been assigned (M = 7.87, SD = 2.38), and was 59 standard
deviations above the mean of all Stress-group participants (M = 12.03, SD = 6.68). Her final
(CORT4) sample (267.10 nmol/l) was 93 standard deviations above the mean of the Stress-
Female group (M = 7.68, SD = 2.86) and was 56 standard deviations above the mean of all
Stress-group participants (M = 11.50, SD = 4.75). Hence, it is possible that there were errors
in data collection and/or cortisol analysis for this participant’s saliva samples.
Informal inspection of group means suggested that men presented with considerably
higher circulating levels of cortisol at baseline than women. Hence, we conducted a 2x2
factorial ANOVA on these baseline data. The analysis confirmed a significant main effect for
Sex, F(1, 39) = 10.46, p = .002, p2 = .21. Therefore, following du Plooy et al. (under
review), we used difference scores as outcome data in our subsequent analyses of cortisol
levels. To obtain these scores we subtracted the baseline measure from those at the second,
third, fourth, and fifth measurement points as follows:
CORT1 = CORT1 – CORTB
CORT2 = CORT2 – CORTB
CORT3 = CORT3 – CORTB
CORT4 = CORT4 – CORTB
The repeated-measures ANOVA run on these difference-score data detected a
significant main effect for Time, F(1.91, 74.60) = 15.88, p < .001, p2 = .29, and a significant
main effect for Experimental Condition, F(1, 39) = 31.27, p < .001, p2 = .45. It did not,
however, detect a significant main effect for Sex, F(1, 39) = 0.38, p = .54, p2 = .01.
Regarding interaction effects, the analysis detected no significant Experimental
Condition x Sex interaction, F(1, 39) = 3.28, p = .08, p2 = .08. It did, however, detect the
following significant interaction effects: Time x Experimental Condition, F(1.91, 74.60) =
11.61, p < .001, p2 = .23, Time x Sex, F(1.91, 74.60) = 3.26, p = .046, p
2 = .08; and Time x
Experimental Condition x Sex, F(1.91, 74.60) = 6.14, p = .004, p2 = .14.
ILLUMINATING THE DARK SIDE OF STRESS 21
-4
-2
0
2
4
6
8
Δ1 Δ2 Δ3 Δ4
Co
rtis
ol
Dif
feren
ce S
core
s in
nm
ol/
l
Time
Stress
Control
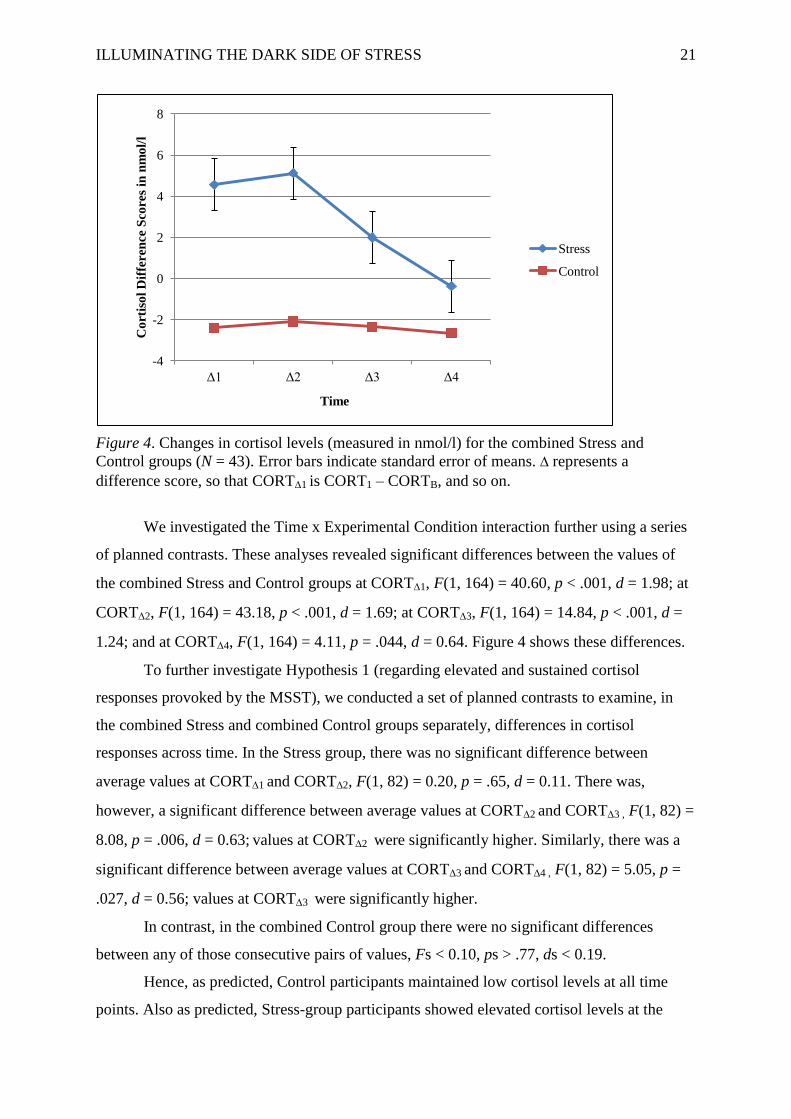
Figure 4. Changes in cortisol levels (measured in nmol/l) for the combined Stress and
Control groups (N = 43). Error bars indicate standard error of means. represents a
difference score, so that CORT1 is CORT1 – CORTB, and so on.
We investigated the Time x Experimental Condition interaction further using a series
of planned contrasts. These analyses revealed significant differences between the values of
the combined Stress and Control groups at CORT1, F(1, 164) = 40.60, p < .001, d = 1.98; at
CORT2, F(1, 164) = 43.18, p < .001, d = 1.69; at CORT3, F(1, 164) = 14.84, p < .001, d =
1.24; and at CORT4, F(1, 164) = 4.11, p = .044, d = 0.64. Figure 4 shows these differences.
To further investigate Hypothesis 1 (regarding elevated and sustained cortisol
responses provoked by the MSST), we conducted a set of planned contrasts to examine, in
the combined Stress and combined Control groups separately, differences in cortisol
responses across time. In the Stress group, there was no significant difference between
average values at CORT1 and CORT2, F(1, 82) = 0.20, p = .65, d = 0.11. There was,
however, a significant difference between average values at CORT2 and CORT3 , F(1, 82) =
8.08, p = .006, d = 0.63; values at CORT2 were significantly higher. Similarly, there was a
significant difference between average values at CORT3 and CORT4 , F(1, 82) = 5.05, p =
.027, d = 0.56; values at CORT3 were significantly higher.
In contrast, in the combined Control group there were no significant differences
between any of those consecutive pairs of values, Fs < 0.10, ps > .77, ds < 0.19.
Hence, as predicted, Control participants maintained low cortisol levels at all time
points. Also as predicted, Stress-group participants showed elevated cortisol levels at the
ILLUMINATING THE DARK SIDE OF STRESS 22
-4
-2
0
2
4
6
8
10
Δ1 Δ2 Δ3 Δ4
Co
rtio
l D
iffe
ren
ce S
core
s in
nm
ol/
l
Time
Stress Male
Stress Female
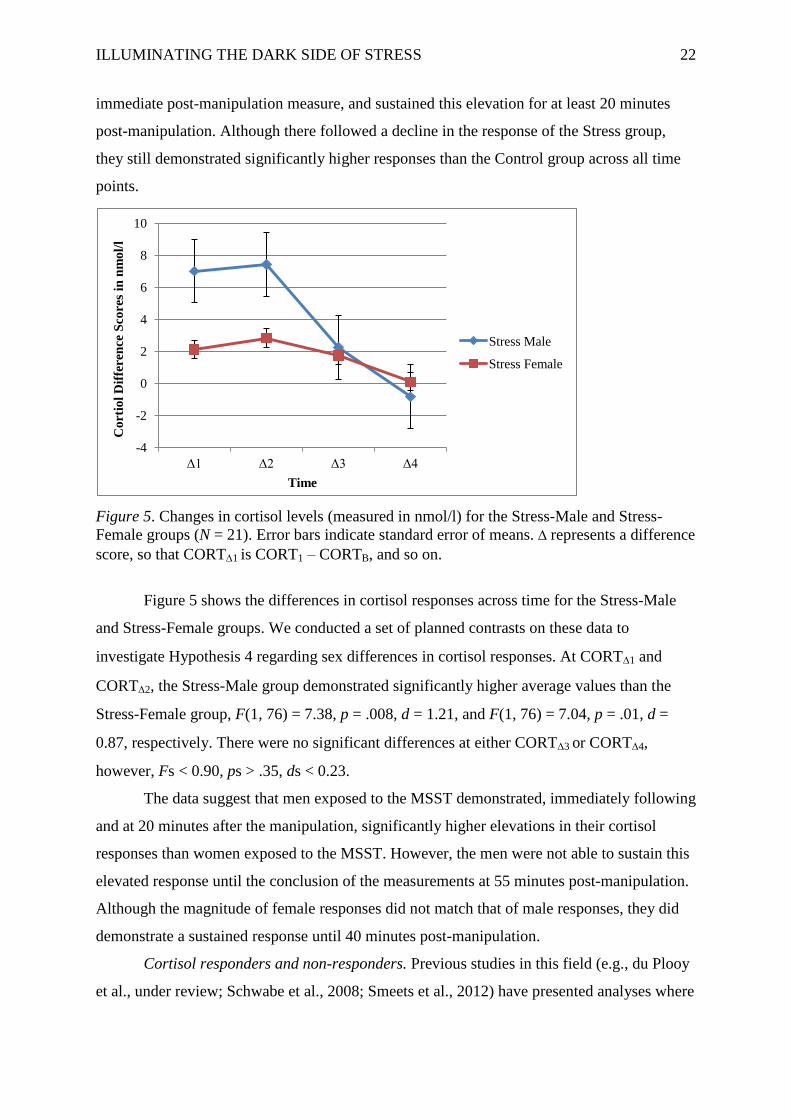
immediate post-manipulation measure, and sustained this elevation for at least 20 minutes
post-manipulation. Although there followed a decline in the response of the Stress group,
they still demonstrated significantly higher responses than the Control group across all time
points.
Figure 5. Changes in cortisol levels (measured in nmol/l) for the Stress-Male and Stress-
Female groups (N = 21). Error bars indicate standard error of means. represents a difference
score, so that CORT1 is CORT1 – CORTB, and so on.
Figure 5 shows the differences in cortisol responses across time for the Stress-Male
and Stress-Female groups. We conducted a set of planned contrasts on these data to
investigate Hypothesis 4 regarding sex differences in cortisol responses. At CORT1 and
CORT2, the Stress-Male group demonstrated significantly higher average values than the
Stress-Female group, F(1, 76) = 7.38, p = .008, d = 1.21, and F(1, 76) = 7.04, p = .01, d =
0.87, respectively. There were no significant differences at either CORT3 or CORT4,
however, Fs < 0.90, ps > .35, ds < 0.23.
The data suggest that men exposed to the MSST demonstrated, immediately following
and at 20 minutes after the manipulation, significantly higher elevations in their cortisol
responses than women exposed to the MSST. However, the men were not able to sustain this
elevated response until the conclusion of the measurements at 55 minutes post-manipulation.
Although the magnitude of female responses did not match that of male responses, they did
demonstrate a sustained response until 40 minutes post-manipulation.
Cortisol responders and non-responders. Previous studies in this field (e.g., du Plooy
et al., under review; Schwabe et al., 2008; Smeets et al., 2012) have presented analyses where
ILLUMINATING THE DARK SIDE OF STRESS 23
participants who have been exposed to an acute psychosocial stressor are classified, post-hoc,
as either cortisol responders or non-responders. Such studies then go on to examine whether,
for instance, effects on cognition are present only in the group of responders (see, e.g.,
Buchanan & Tranel, 2008; van den Bos, Harteveld, & Stoop, 2009).
Unfortunately, there is no standard criterion to classify a participant as a responder or
non-responder. Hence, to compare our responder rates with those of previous studies, we
created three different responder/non-responder sets. The first set followed Kirschbaum et al.
(1993) and Smeets et al. (2012) by classifying cortisol responders as those showing at least a
2.5 nmol/l increase over baseline at any post-manipulation measurement point. The second
set followed Fehm-Wolfsdorf et al. (1993) and du Plooy et al. (under review) by classifying
cortisol responders as those showing at least a 2 nmol/l increase over baseline at any post-
manipulation measurement point. The third set followed Buchanan and Tranel (2008) by
classifying cortisol responders as those showing any increase over baseline at any post-
manipulation measurement point. Table 3 shows the application of these criteria to the data.
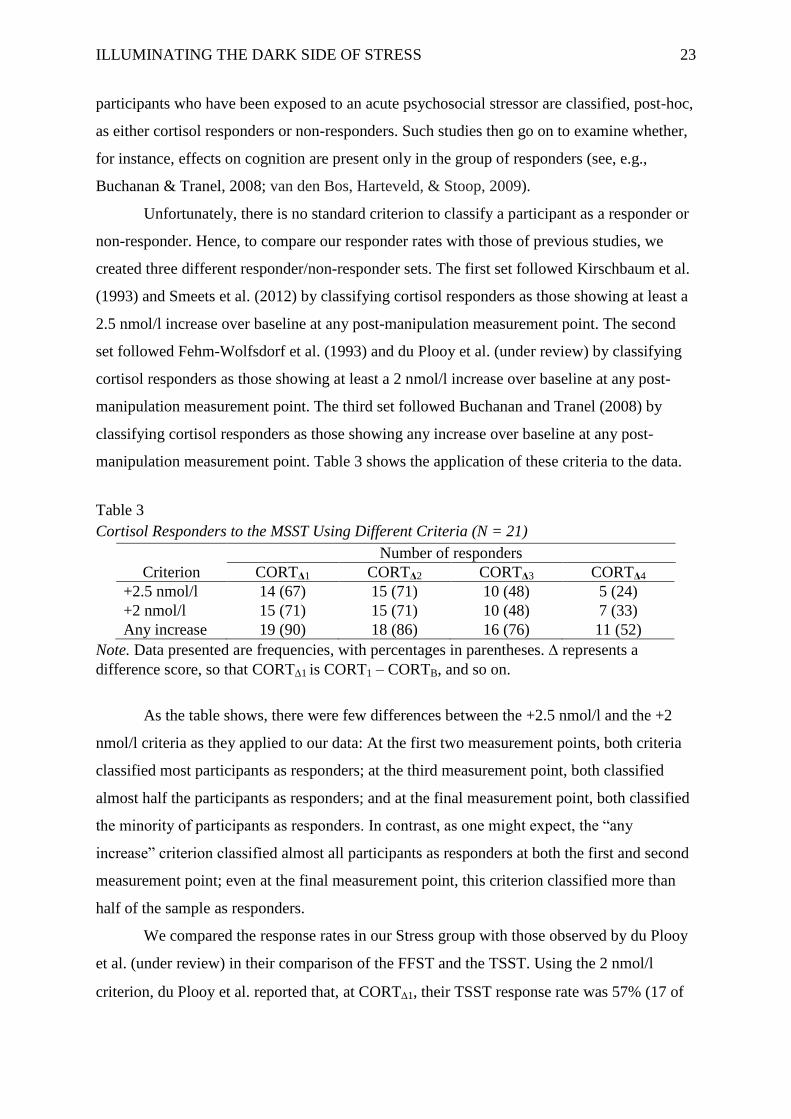
Table 3
Cortisol Responders to the MSST Using Different Criteria (N = 21)
Number of responders
Criterion CORTΔ1 CORTΔ2 CORTΔ3 CORTΔ4
+2.5 nmol/l 14 (67) 15 (71) 10 (48) 5 (24)
+2 nmol/l 15 (71) 15 (71) 10 (48) 7 (33)
Any increase 19 (90) 18 (86) 16 (76) 11 (52)
Note. Data presented are frequencies, with percentages in parentheses. represents a
difference score, so that CORT1 is CORT1 – CORTB, and so on.
As the table shows, there were few differences between the +2.5 nmol/l and the +2
nmol/l criteria as they applied to our data: At the first two measurement points, both criteria
classified most participants as responders; at the third measurement point, both classified
almost half the participants as responders; and at the final measurement point, both classified
the minority of participants as responders. In contrast, as one might expect, the “any
increase” criterion classified almost all participants as responders at both the first and second
measurement point; even at the final measurement point, this criterion classified more than
half of the sample as responders.
We compared the response rates in our Stress group with those observed by du Plooy
et al. (under review) in their comparison of the FFST and the TSST. Using the 2 nmol/l
criterion, du Plooy et al. reported that, at CORT1, their TSST response rate was 57% (17 of
ILLUMINATING THE DARK SIDE OF STRESS 24
30 participants) and their FFST response rate was 48% (14 of 29 participants). In contrast, the
MSST response rate observed here was 71% (15 of 21 participants). At CORT2, the TSST
and the FFST produced response rates of 13% (4 of 30) and 52% (15 of 29), respectively,
whereas the MSST produced a response rate of 48% (10 of 21) at the equivalent time
(CORT3). The FFST’s second measurement point occurred 35 minutes post-manipulation
and the MSST’s third measurement point occurred 40 minutes post-manipulation; this slight
difference could account for the slightly lower response rate seen here.
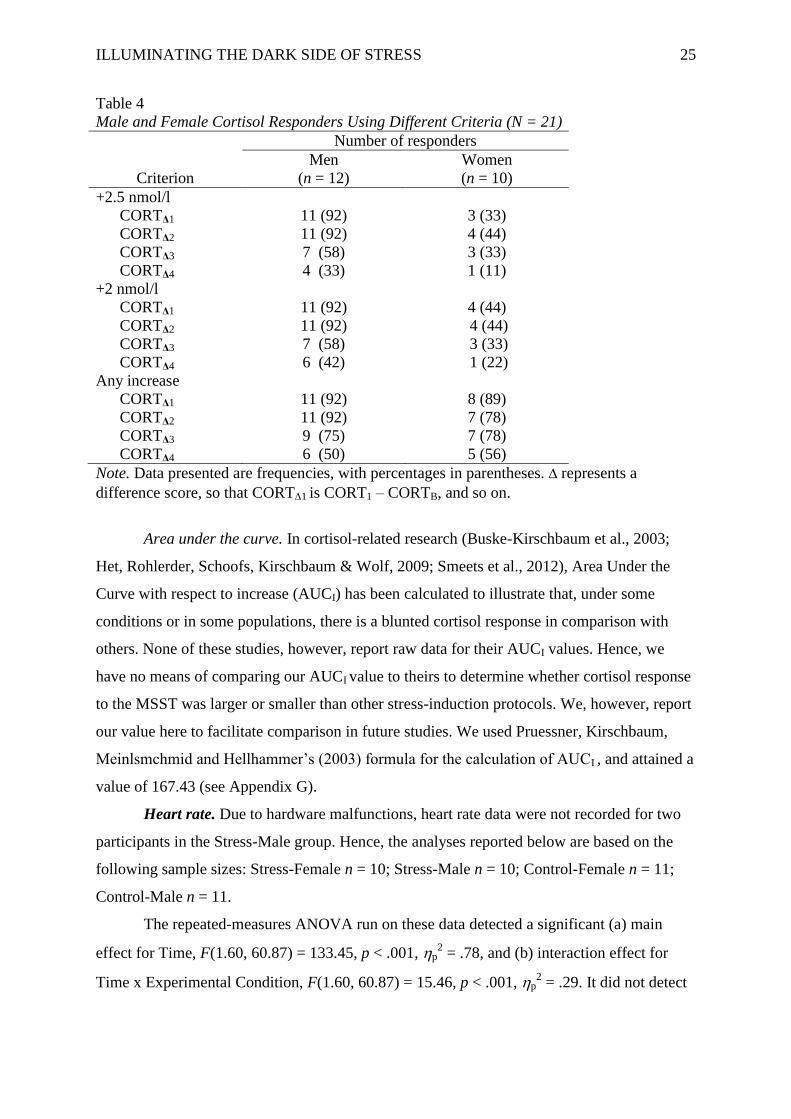
Table 4 shows the application of the same three responder-classification criteria to our
Stress-group data, this time split by sex. Again, the +2.5 nmol/l and +2 nmol/l criteria deliver
almost identical results, with particular differences perhaps only at CORTΔ4. Both of these
criteria classify considerably more men than women as cortisol responders at each
measurement point, however, with particularly stark sex differences at the first and second
points. The most liberal (“Any increase”) criterion delivered a different, and interesting, set
of data. Under this criterion, sex differences are not as extreme; in fact, at CORT4 this
criterion classified more female than male participants, and more than half of the female
sample, as responders.
In their comparison of the CPT, Socially Evaluated CPT (SECPT; Schwabe et al.,
2008), and MAST, Smeets et al. (2012) observed (using an all-male sample and a +2.5 nmol/l
criterion) cortisol response rates of 40%, 65%, and 85%, respectively.1 In the current Stress-
Male group, there was a response rate of 92% using the +2.5 nmol/l criterion.
1Smeets et al. (2012) did not report the time point used to determine these response rates.
Therefore, we assume that these rates refer to the time at which the MAST attained its highest
elevation in cortisol responses, and we applied this standard to the MSST in this comparison.
ILLUMINATING THE DARK SIDE OF STRESS 25
Table 4
Male and Female Cortisol Responders Using Different Criteria (N = 21)
Number of responders
Men Women
Criterion (n = 12) (n = 10)
+2.5 nmol/l
CORTΔ1 11 (92) 3 (33)
CORTΔ2 11 (92) 4 (44)
CORTΔ3 7 (58) 3 (33)
CORTΔ4 4 (33) 1 (11)
+2 nmol/l
CORTΔ1 11 (92) 4 (44)
CORTΔ2 11 (92) 4 (44)
CORTΔ3 7 (58) 3 (33)
CORTΔ4 6 (42) 1 (22)
Any increase
CORTΔ1 11 (92) 8 (89)
CORTΔ2 11 (92) 7 (78)
CORTΔ3 9 (75) 7 (78)
CORTΔ4 6 (50) 5 (56)
Note. Data presented are frequencies, with percentages in parentheses. represents a
difference score, so that CORT1 is CORT1 – CORTB, and so on.
Area under the curve. In cortisol-related research (Buske-Kirschbaum et al., 2003;
Het, Rohlerder, Schoofs, Kirschbaum & Wolf, 2009; Smeets et al., 2012), Area Under the
Curve with respect to increase (AUCI) has been calculated to illustrate that, under some
conditions or in some populations, there is a blunted cortisol response in comparison with
others. None of these studies, however, report raw data for their AUCI values. Hence, we
have no means of comparing our AUCI value to theirs to determine whether cortisol response
to the MSST was larger or smaller than other stress-induction protocols. We, however, report
our value here to facilitate comparison in future studies. We used Pruessner, Kirschbaum,
Meinlsmchmid and Hellhammer’s (2003) formula for the calculation of AUCI , and attained a
value of 167.43 (see Appendix G).
Heart rate. Due to hardware malfunctions, heart rate data were not recorded for two
participants in the Stress-Male group. Hence, the analyses reported below are based on the
following sample sizes: Stress-Female n = 10; Stress-Male n = 10; Control-Female n = 11;
Control-Male n = 11.
The repeated-measures ANOVA run on these data detected a significant (a) main
effect for Time, F(1.60, 60.87) = 133.45, p < .001, p2 = .78, and (b) interaction effect for
Time x Experimental Condition, F(1.60, 60.87) = 15.46, p < .001, p2 = .29. It did not detect
ILLUMINATING THE DARK SIDE OF STRESS 26
0
20
40
60
80
100
120
B 1 2 3 4
Hea
rt R
ate
(b
pm
)
Time
Stress
Control
any other significant main, two-way, or three-way interaction effects, Fs < 1.60, ps > .20,
p2s < .05.
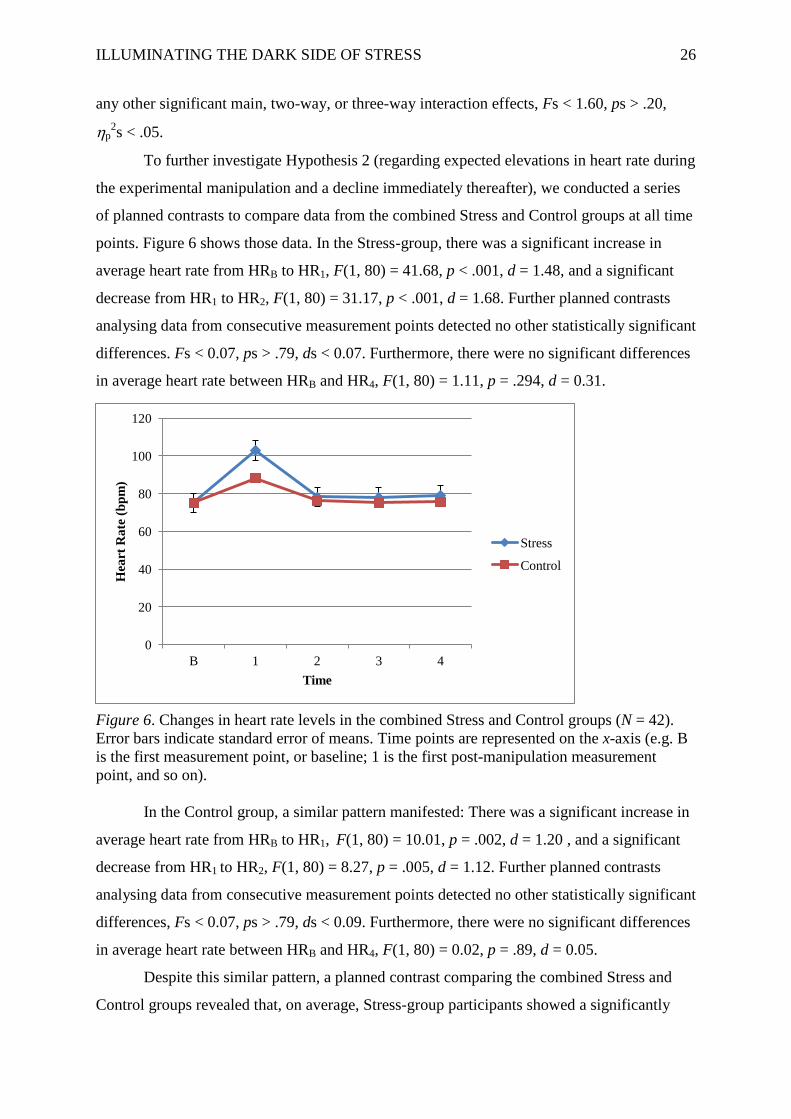
To further investigate Hypothesis 2 (regarding expected elevations in heart rate during
the experimental manipulation and a decline immediately thereafter), we conducted a series
of planned contrasts to compare data from the combined Stress and Control groups at all time
points. Figure 6 shows those data. In the Stress-group, there was a significant increase in
average heart rate from HRB to HR1, F(1, 80) = 41.68, p < .001, d = 1.48, and a significant
decrease from HR1 to HR2, F(1, 80) = 31.17, p < .001, d = 1.68. Further planned contrasts
analysing data from consecutive measurement points detected no other statistically significant
differences. Fs < 0.07, ps > .79, ds < 0.07. Furthermore, there were no significant differences
in average heart rate between HRB and HR4, F(1, 80) = 1.11, p = .294, d = 0.31.
Figure 6. Changes in heart rate levels in the combined Stress and Control groups (N = 42).
Error bars indicate standard error of means. Time points are represented on the x-axis (e.g. B
is the first measurement point, or baseline; 1 is the first post-manipulation measurement
point, and so on).
In the Control group, a similar pattern manifested: There was a significant increase in
average heart rate from HRB to HR1, F(1, 80) = 10.01, p = .002, d = 1.20 , and a significant
decrease from HR1 to HR2, F(1, 80) = 8.27, p = .005, d = 1.12. Further planned contrasts
analysing data from consecutive measurement points detected no other statistically significant
differences, Fs < 0.07, ps > .79, ds < 0.09. Furthermore, there were no significant differences
in average heart rate between HRB and HR4, F(1, 80) = 0.02, p = .89, d = 0.05.
Despite this similar pattern, a planned contrast comparing the combined Stress and
Control groups revealed that, on average, Stress-group participants showed a significantly
ILLUMINATING THE DARK SIDE OF STRESS 27
higher heart rate than Control-group participants during the experimental manipulation (i.e.,
at HR1), F(1, 200) = 11.79, p = .001, d = 0.97. There were no significant differences between
the Stress and Control groups at any other time point, Fs < 0.75, ps > .39, ds < 0.28.
We conducted a series of planned contrasts to investigate Hypothesis 4 (regarding the
attenuation of sex differences between Stress-Female and Stress-Male groups). As expected,
this set of analyses revealed no significant between-group differences in terms of mean heart
rate across all time points, F(1, 90) = 0.03 - 0.41, p = .525 - .854, d = 0.04 - 0.13.
A single sample t-test comparing the current heart rate data to those reported by du
Plooy et al. (under review) indicated that, during the experimental manipulation (i.e., at HR1),
the MSST (M = 102.98 bpm, SD = 18.47) was able to elicit a significantly higher heart rate
peak than the FFST (M = 94.13, SD = 15.06), t(19) = 2.14, p = .02, d = 0.54.
Self-report measurements. Below, we present analyses of STAI-State scores.
STAI-State scores. Data for two participants, one from the Control-Male group and
one from the Stress-Female group, were excluded from this analysis because they did not
respond to all questionnaire items at the Baseline measurement.
The repeated-measures ANOVA detected a significant (a) main effect for Time,
F(3.08, 117.35) = 14.55, p < .001, p2 = .28, (b) main effect for Experimental Condition, F(1,
38) = 10.91, p = .002, p2 = .22, (c) interaction effects for Experimental Condition x Sex
interaction, F(1, 38) = 7.35, p = .01, p2 = .16, and (d) interaction effect for Time x
Experimental Condition interaction, F(3.08, 117.35) = 11.82, p < .001, p2 = .24. It did not
detect any other significant main or interaction effects, Fs < 4.05, ps > .05, p2s < .10.
ILLUMINATING THE DARK SIDE OF STRESS 28
0
10
20
30
40
50
60
B 1 2 3 4
ST
AI-
Sta
te S
core
s
Time
Stress
Control
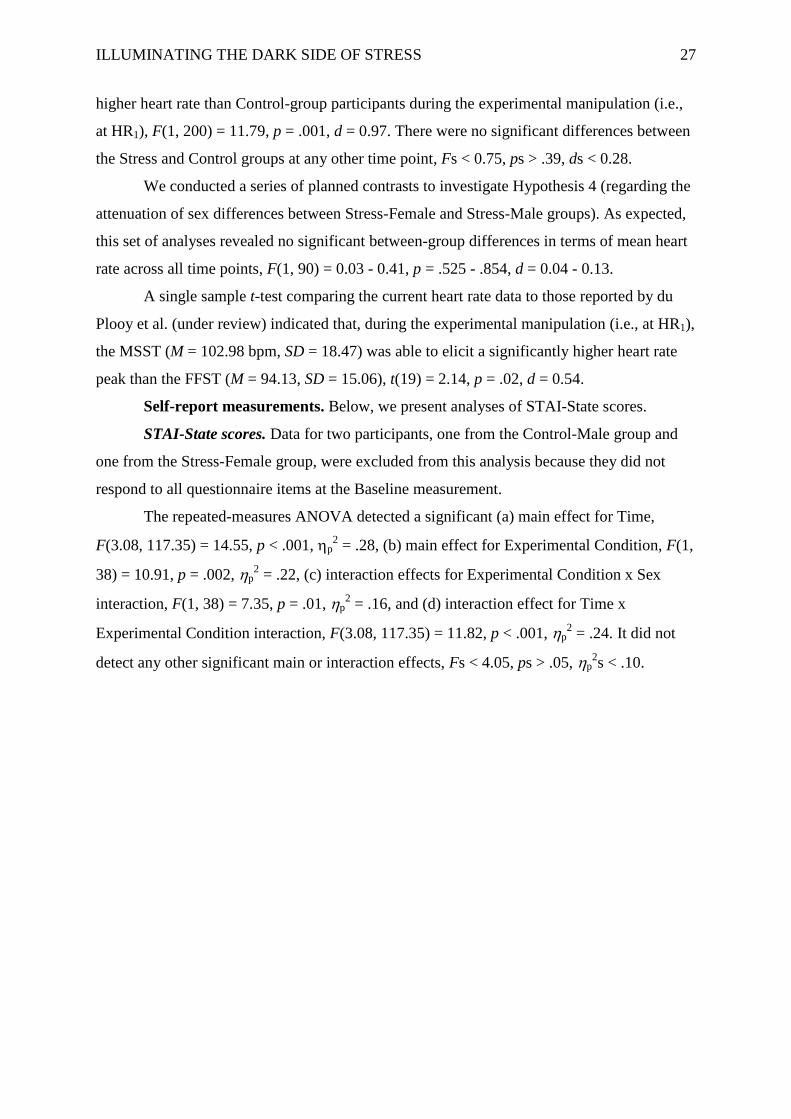
Figure 7. Changes in subjective anxiety levels in the combined Stress and Control groups
(N = 44). Error bars indicate standard error of means. Measurement points are represented on
the x-axis (e.g., B is the first measurement point, or baseline; 1 is the first post-manipulation
measurement point, and so on).
To further investigate Hypothesis 3 (regarding elevations in subjective anxiety during
the experimental manipulation and a decline immediately thereafter), we conducted a series
of planned contrasts comparing data from the combined Stress and Control groups at all time
points. Figure 7 shows changes in subjective anxiety levels. In the Stress group, there was a
significant increase in subjective anxiety from STAIB to STAI1, F(1, 84) = 25.19, p < .001, d
= 1.34, and a significant decrease from STAI1 to STAI2, F(1, 84) = 20.65, p < .001, d = 1.17.
As expected, further planned contrasts analysing data from consecutive measurement points
detected no other statistically significant differences, Fs < 1.21, ps > .28, ds < 0.31.
Furthermore, there were no significant differences in average levels of subjective anxiety
between STAIB and STAI4, F(1, 84) = 0.06, p = .81, d = 0.09.
In the Control group, the series of planned contrasts detected no significant
differences in subjective anxiety between consecutive measurement points, and no significant
differences between STAIB and STAI4, Fs < 0.62, ps > .49, ds < 0.01.
Another planned contrast revealed that, on average, Stress-group participants reported
significantly higher levels of subjective anxiety than the Control-group directly after the
experimental manipulation (i.e., at STAI1), F(1, 210) = 28.48, p < .001, d = 1.43. There were
no other significant between-group differences at any other measurement points, Fs < 2.62,
ps > .11, ds < 0.58.
ILLUMINATING THE DARK SIDE OF STRESS 29
We conducted a series of further planned contrasts comparing data from the Stress-
Male and Stress-Female groups to investigate Hypothesis 4 (regarding the attenuation of sex
differences in subjective anxiety levels). This set of analyses revealed no significant
differences between the Stress-Female and Stress-Male at STAIB, F(1, 100) = 1.47, p = .23, d
= 0.54. However, women reported significantly higher levels of subjective anxiety than men
at STAI1, F(1, 100) = 6.72, p = .011, d = 1.05, at STAI2, F(1, 100) = 4.02, p = .048, d = 0.96,
and at STAI3, F(1, 100) = 8.74, p = .004, d = 1.18 , but not at STAI4, F(1, 100) = 3.92, p =
.05, d = 0.77.
Discussion
We described the Mortality Salience Stress Test (MSST), a stress-induction procedure
that combines the format of an existing psychosocial stressor (the Fear Factor Stress Test)
with a mortality salience manipulation. Several existing laboratory-based procedures utilise
uncontrollability and social evaluative threat to produce consistent physiological stress
responses through activation of the HPA axis; these include the Trier Social Stress Test
(TSST; Kirschbaum et al., 1993), the Maastricht Acute Stress Test (MAST; Smeets et al.,
2012), and the Fear Factor Stress Test (FFST; du Plooy et al., under review). The laboratory
convention, for decades, has been the TSST. However, this method is limited in that it fails to
produce a consistent, robust, and sustained cortisol response in all participants. In particular,
it does not elicit equivalent responses in men and women. Although the FFST and the MAST
both address the limitations of the TSST, they both still fail to (a) provoke a robust and
sustained cortisol response in all participants, (b) attenuate sex differences in cortisol
responses, and (c) tackle issues of ecological validity. Hence, we sought to investigate
whether the addition of a mortality salience (MS) manipulation to the FFST would result in a
more efficient laboratory-based psychosocial stressor. Our results showed, overall, that the
MSST was capable of eliciting HPA-axis, autonomic, and subjective responses to stress
without causing additional psychological harm to participants.
The MSST produced elevated cortisol responses, which indicates that it provoked
HPA-axis activity. Hypothesis 1 predicted elevated and sustained cortisol responses across all
measurement points, during and post-manipulation. Cortisol responses were elevated above
baseline for 40 minutes post-manipulation in both men and women. The elevated response
observed in the Stress group directly after the experimental manipulation was sustained until
at least 20 minutes post-manipulation.
Furthermore, comparisons of our cortisol responder rates to those of other studies
indicated that the MSST was effective in producing more robust and sustained cortisol

ILLUMINATING THE DARK SIDE OF STRESS 30
responses than the FFST, the CPT, SECPT and MAST. Similar to other stress manipulations,
cortisol response rates to the MSST declined significantly at longer intervals post-
manipulation. However, the fact that a third of our participants were still classified as
responders (using a criterion of 2 nmol/l over baseline) at 55 minutes post-manipulation
shows promise for future research. Certainly, in comparison to its direct predecessor, the
FFST, the MSST elicited a greater cortisol response rate.
Additionally, the MSST demonstrated its ability to produce significantly elevated
responses in heart rate and subjective anxiety. Hypothesis 2 predicted elevated heart rate
during the manipulation with a decline immediately post-manipulation. Results indicated that,
although participants in both the Stress and Control groups experienced a peak in heart rate
post-manipulation, as expected, the Stress group showed a significantly elevated heart rate at
this time in comparison to Control participants. After this peak, heart rate declined rapidly
until 20 minutes post-manipulation, and then stabilised for the remaining time points until the
end of the study.
Hypothesis 3 predicted elevated subjective anxiety during the manipulation, with a
decline immediately post-manipulation. Results indicated that Stress-group participants
experienced elevated subjective anxiety post-manipulation and, as expected, showed
significantly higher levels of subjective anxiety at this time in comparison to Control
participants. After this initial increase, subjective anxiety declined until 20 minutes post-
manipulation, and then stabilised for the remaining time points until the end of the study.
Hypothesis 4 predicted no sex differences on both physiological and self-report
measures of stress. Although the MSST was successful in attenuating sex differences in
autonomic responses to stress, it was unable to reduce the sex differences evident in cortisol
responses and in subjective anxiety. Whereas men showed higher cortisol responses, women
showed higher levels of subjective anxiety. Despite this failure, however, our protocol
produced, relative to other stress manipulations, an increased proportion of cortisol
responders among women.
We contend that the MSST achieved elevated hormonal and autonomic responses by,
at least in part, adding an MS manipulation to the FFST protocol. We further contend that the
success of the protocol demonstrates that requesting participants to contemplate emotions and
thoughts surrounding death, as well as the physicality of death, assists in the creation of an
unconscious and indiscriminate anxiety that results in elevated physiological responses to
stress (Landau et al., 2007). This contention is consistent with MS literature asserting that,
although death-related anxiety may be a somewhat unconscious phenomenon, it is
ILLUMINATING THE DARK SIDE OF STRESS 31
measurable through physiological assessment (Tritt et al., 2012). Furthermore, Landau et al.
(2007) suggest that knowledge of one’s death is the largest source of debilitating anxiety in
psychological functioning. Consistent with this suggestion, the MSST provoked significantly
increased elevations on measures of subjective state anxiety, suggesting that the inclusion of
death-related stimuli may lead to increased anxiety. Biologically-based accounts of MS
propose that death-related uncertainty is processed through brain-based anxiety systems, and
that it results in raised levels of cortisol and other stress hormones. Similarly, previous
research suggests that an appraisal of psychosocial stressors results in psychobiological
responses, including the release of cortisol, via activation of the HPA axis (Kemeny, 2003).
Taken together, these accounts suggest that elevated cortisol levels following MSST exposure
can be explained by the combination of death-related subject matter and a psychosocial
stressor that features elements of social evaluation and uncontrollability. Evidently, our
improvements to the FFST, using theories from the MS literature, have resulted in an
improved laboratory-based psychosocial stressor.
Stress researchers recognise there are clear sex differences in HPA-axis responses to
stressors (Kirschbaum et al., 1993; Dickerson & Kemeny, 2004). In existing stress tests (e.g.,
TSST, CPT, and FFST; the developers of the MAST have not yet reported a study wherein
that protocol is administered to women), men tend to display greater HPA reactivity (as
indicated by larger cortisol responses) than women. These sex differences might be related to
oral contraceptive use, hormonal activity as mediated by the female menstrual cycle, and
differential reactions to achievement challenges. Regardless of why these sex differences
arise, however, the fact that they are commonplace has led to many studies including only
men in their samples. Through the addition of an MS manipulation, we sought to reduce the
sex differences prevalent in existing stress-induction procedures. Specifically, we sought to
reduce the achievement components evident in other stress manipulations by altering the
content of the free-form speech.
Our findings were, however, consistent with previous research: The MSST provoked
significantly larger cortisol responses in men than in women. This, despite the fact that we
improved on existing protocols’ controls for both oral contraceptive use and menstrual cycle
phase. Furthermore, contrary to our hypothesis but consistent with most research in this field,
men were not able to sustain this elevated response until the end of the study. In a divergent
pattern, although women did not achieve cortisol elevations of the same magnitude as men,
they were able to sustain their (smaller) responses over the duration of the study.
Accordingly, with regard to the classification of participants as responders, the MSST
ILLUMINATING THE DARK SIDE OF STRESS 32
managed (relative to previously reported FFST data) to achieve higher and more sustained
cortisol responder rates in women.
Previous research has shown that there are differences in brain activity between men
and women in response to stressors (Goldstein, Jerram, Abbs, Whitfield-Gabrieli & Makris,
2010; Kudielka & Kirschbaum, 2005). These differences appear to be hormonally regulated
by subcortical brain mechanisms, which enable women to attenuate their stress responses
better than men. This regulation may explain the sex differences observed in the current
study: Women may have been able to better mediate their responses to the psychosocial
stressor because their brain circuitry supports such mediation. Another explanation for the
observed sex differences considers the possibility of sex differences in psychological
appraisals of stress-induction procedures. Previous research (e.g., Kudielka et al., 2009;
Stroud et al., 2002) suggests that whereas women perceive social rejection challenges to be
more stressful, men perceive achievement challenges as more stressful. Although the MSST
attempted to alleviate these sex differences by reducing achievement components present in
the protocol, our data suggest that this attempt may not have been altogether successful.
Limitations and Considerations for Future Research
Although the sex differences observed here were not a limitation in and of
themselves, the way in which the study set out to attenuate potential sex differences (the
presence of which we assumed, based on previous research in field) was. Reasons for the
observed differences remain uncertain; certainly, they do not relate to oral contraceptive use
and menstrual cycle phase, as we controlled for both of those. Above, we offered possible
explanations for the observed sex differences. One of these considers sex differences in
response to different stressor challenges (Stroud, et al., 2002). Regarding the latter, the MSST
was still, largely, an achievement-based task rather than the type of social rejection challenge
that has been shown to elicit greater cortisol responses in women (see, e.g., Stroud, Tanofsky-
Kraff, Wilfley & Salovey, 2000). Future research may assist in the attenuation of sex
differences by developing new laboratory-based stress induction procedures that feature
social rejection more centrally, or by refining or modifying existing protocols to the same
end. For instance, a task like the MSST might be modified by intensifying tasks in which
performance is judged negatively by others in the female participant’s social group.
A second limitation was that we observed significant sex differences in Baseline
cortisol levels. It is possible that these differences might be related to participants
experiencing anticipatory anxiety upon entering the laboratory: Previous research suggests
that, in men only, the anticipation of an upcoming psychosocial stressor can result in
ILLUMINATING THE DARK SIDE OF STRESS 33
significant cortisol increases (Kudielka & Kirschbaum, 2005). Upon arrival at the laboratory,
we informed all participants that they might have to give a 12-minute presentation; this
instruction may have induced anxiety in male participants, and this anxiety might have been
manifest in elevated cortisol levels at baseline. Although ethical considerations required us to
inform participants they might be exposed to a mildly stressful situation, future research
might either (a) rephrase this information in a less explicit and threatening (but still ethically
sound) manner, or (b) take baseline measures of cortisol before relaying such information.
Finally, a clear direction for future research is to directly compare the MSST with the
FFST, MAST, and TSST concurrently, with participants sampled from the same population.
Although this kind of exhaustive comparison was beyond the scope of the current study, it is
necessary in order to accurately determine the relative efficiency and efficacy of these stress-
induction protocols.
Significance of Research
Despite these limitations, the incorporation of a mortality salience manipulation into
an acute psychosocial stressor demonstrates clear steps towards creating a more ecologically
valid stress-induction protocol: Death is an indiscriminate phenomenon that all humans
experience, and anxiety surrounding one’s death is natural. Ecological validity remains an
important factor in laboratory-based research as it enables application of these findings to
real-world settings (Orne & Holland, 1968). A continuing problem with existing laboratory-
based stress-induction protocols is that they lack ecological validity, as they often require
participants to perform tasks that do not necessarily approximate real-world events or
settings. This, despite the fact that people often encounter acute stressors in everyday life and
are expected to function effectively under these conditions. Currently, one purpose of stress-
induction protocols is to aid in the investigation of the effects of stress on cognitive,
behavioural, and affective functioning. The development of more ecologically valid protocols
adds obvious value to such investigations. In turn, these investigations may assist in better
equipping people to function effectively in stressful situations encountered in daily life.
Summary and Conclusion
We have shown that the MSST is a promising tool that offers improvements on
existing laboratory-based psychosocial stressors: Compared to other stress-induction
methods, it is more ecologically valid and it elicits more robust HPA-axis responses in men
and ensures the maintenance of responses in women, all without increasing participant
discomfort. Although this study demonstrated the value, feasibility, and potential uses of the
MSST, it is clear that continued research into the improvement of laboratory-based stress-
ILLUMINATING THE DARK SIDE OF STRESS 34
induction procedures (e.g., around the issue of attenuating sex differences) is necessary. The
growing prevalence of stress-related illnesses means that laboratory-based stress-induction
procedures have an important role to play in uncovering neurobiological elements of those
illnesses. Therefore, the development of ecologically valid stress-induction protocols may
assist in increasing the efficacy with which these procedures are able to investigate
potentially modifiable biological sources of stress-related illnesses.
ILLUMINATING THE DARK SIDE OF STRESS 35
References
American Psychiatric Association. (1994). Diagnostic and statistical manual of mental
disorders (4th
ed.). Washington, DC: Author.
Arndt, J., Allen, J. J. B., & Greenberg, J. (2001). Traces of terror: Subliminal death primes
and facial electromyographic indices of affect. Motivation and Emotion, 25, 253-277.
Beck, A. T., Steer, R. A., & Brown, G. K. (1996). Beck Depression Inventory manual (2nd
ed.). San Antonio, TX: Psychological Corporation.
Buchanan, T. W., & Tranel, D. (2008). Stress and emotional memory retrieval: Effects of sex
and cortisol response. Neurobiology of Learning and Memory, 89, 134-141.
Burke, B. L., Martens, A., & Faucher, E. H. (2010). Two decades of Terror Management
Theory: A meta-analysis of mortality salience research. Personality and Social
Psychology Review, 14, 155-195.
Buske-Kirschbaum, A., von Auer, K., Krieger, S., Weis, S., Rauh, W., & Hellhammer, D.
(2003). Blunted cortisol responses to psychosocial stress in asthmatic children: a
general feature of atopic disease? Psychosomatic Medicine, 65(5), 806-810.
Cohen, J. (1992). A power primer. Psychological Bulletin, 112, 155-159.
Dickerson, S. S., & Kemeny, M. E. (2004). Acute stressors and cortisol responses: A
theoretical integration and synthesis of laboratory research. Psychological Bulletin,
130, 355-391.
Dozois, D. J. A., Dobson, K. S., & Ahnberg, J. L. (1998). A psychometric evaluation of the
Beck Depression Inventory-II. Psychological Assessment, 10, 83-89.
du Plooy, C. P., Thomas, K. G. F., Henry, M., Human, R., & Jacobs, W. J. (under review).
The Fear-Factor Stress Test: An ethical, non-invasive laboratory method that
produces consistent and sustained cortisol responding in men and women. Metabolic
Brain Disease.
Faul, F., Erdfelder, E., Lang, A.G., & Buchner, A. (2007). G*Power 3: A flexible statistical
power analysis program for the social, behavioral, and biomedical sciences. Behavior
Research Methods, 39, 175-191.
Fehm-Wolfsdorf, G., Soherr, U., Arndt, R., Kern, W., Fehm, H. L., & Nagel, D. (1993).
Auditory reflex thresholds elevated by stress-induced cortisol secretion.
Psychoneuroendocrinology, 18(8), 579-589.
Garde, A. H., & Hansen, Å., M. (2005). Long-term stability of salivary cortisol.
Scandinavian Journal of Clinical & Laboratory Investigation, 65, 433-436.
ILLUMINATING THE DARK SIDE OF STRESS 36
Goldstein, J. M., Jerram, M., Abbs, B., Whitfield-Gabrieli, S., & Makris, N. (2010). Sex
differences in stress response circuitry activation dependent on female hormonal
cycle. The Journal of Neuroscience, 30(2), 431-438.
Het, S., Rohleder, N., Schoofs, D., Kirschbaum, C., & Wolf, O.T. (2009). Neuroendocrine
and psychometric evaluation of a placebo version of the ‘Trier Social Stress Test’.
Psychoneuroendocrinology, 34, 1075-1086.
Hines, E. A., & Brown, G. E. (1932). A standard stimulus for measuring vasomotor reactions:
Its application in the study of hypertension. Proceedings of the Staff Meetings of the
Mayo Clinic, 7, 332-335.
Human, R., Thomas, K. G. F., Dreyer, A., Amod, A. R., Wolf, P. S. A., & Jacobs, W. J.
(2013). Acute psychosocial stress enhances visuospatial memory in healthy males.
South African Journal of Psychology, 43(3), 300-3013.
Kemeny, M. E. (2003). The psychobiology of stress. Current Directions in Psychological
Science, 12, 124-129.
Kirschbaum, C., Kudielka, B. M., Gaab, J., Schommer, N. C., & Hellhammer, D. H. (1999).
Impact of gender, menstrual cycle phase, and oral contraceptives on the activity of the
hypothalamus-pituitary-adrenal axis. Psychosomatic Medicine, 61, 154-162.
Kirschbaum, C., Pirke, K. M., & Hellhammer, D. H. (1993). The 'Trier-Social Stress Test': A
tool for investigating psychobiological stress responses in a laboratory setting.
Neuropsychobiology, 28, 76-81.
Kirschbaum, C., Pirke, K. M., & Hellhammer, D. H. (1995). Preliminary evidence for
reduced cortisol responsivity to psychological stress in women using oral
contraceptive medication. Psychoneuroendocrinology, 20, 509-514.
Kirschbaum, C., Wüst, S., and Hellhammer, D. (1992). Consistent sex differences in cortisol
responses to psychological stress. Psychosomatic Medicine, 54, 648-657.
Kudielka, B. M., Hellhammer, D. H., & Wüst, S. (2009). Why do we respond so differently?
Reviewing determinants of human salivary cortisol responses to a challenge.
Psychoneuroendocrinology, 34, 2-18.
Kudielka, B. M., & Kirschbaum, C. (2005). Sex differences in HPA axis responses to stress:
a review. Biological Psychology, 69(1), 113-132.
Kudielka, B. M., & Wüst, S. (2010). Human models in acute and chronic stress: Assessing
determinants of individual hypothalamus-pituitary-adrenal axis activity and reactivity.
Stress: The International Journal on the Biology of Stress, 13, 1-14.
ILLUMINATING THE DARK SIDE OF STRESS 37
Landau, M., Solomon, S., Pyszczynski, T., & Greenberg, J. (2007). On the compatibility of
terror management theory and perspectives on human evolution. Evolutionary
Psychology, 5, 476-519.
Maheu, F. S., Collicut, P., Kornik, R., Moszkowski, R., & Lupien, S. J. (2005). The perfect
time to be stressed: A differential modulation of human memory by stress applied in
the morning or in the afternoon. Progress in Neuro-Psychopharmacology &
Biological Psychiatry, 29, 1281-1288.
McRae, A. L., Saladin, M. E., Brady, K. T., Upadhyaya, H., Back, S. E., & Timmerman, M.
A. (2006). Stress reactivity: Biological and subjective responses to the cold pressor
and Trier Social stressors. Human Psychopharmacology: Clinical and Experimental,
21, 377-385.
Orne, M. T., & Holland, C. H. (1968). On the ecological validity of laboratory
deceptions. International Journal of Psychiatry, 6, 282-293.
Pruessner, J. C., Kirschbaum, C., Meinlschmid, G., & Hellhammer, D. H. (2003). Two
formulas for computation of the area under the curve represent measures of total
hormone concentration versus time-dependent change. Psychoneuroendocrinology,
28(7), 916-931.
Schwabe, L., Haddad, L., & Schachinger, H. (2008). HPA axis activation by a socially
evaluated cold pressor test. Psychoneuroendocrinology, 33, 890-895.
Smeets, T., Cornelisse, S., Quaedflieg, C. W. E. M., Meyer, T., Jelicic, M., & Merckelback,
H. (2012). Introducing the Maastricht Social Stress Test: A quick and non-invasive
approach to elicit autonomic and glucocorticoid stress responses.
Psychoneuroendocrinology, 37, 1998-2008.
Spielberger, C. D., Gorsuch, R. L., Lushene, R., Vagg, P. R., & Jacobs, G. A. (1983). Manual
for the State-Trait Anxiety Inventory. Palo Alto, CA: Consulting Psychologists Press.
Spielberger, C. D., & Vagg, P. R. (1984). Psychometric properties of the STAI: A reply to
Ramanaiah, Franzen, and Schill. Journal of Personality Assessment, 48, 95-97.
Stroud, L. R., Salovey, P., & Epel, E. S. (2002). Sex differences in stress responses: Social
rejection versus achievement stress. Society of Biological Psychiatry, 52, 318-327.
Stroud, L.R., Tanofsky-Kraff, M., Wilfley, D.E., & Salovey, P. (2000). The Yale
Interpersonal Stressor (YIPS): Affective, physiological, and behavioural responses to
a novel interpersonal rejection paradigm. Annals of Behavioral Medicine, 22, 204-
213.
ILLUMINATING THE DARK SIDE OF STRESS 38
Tritt, S. M., Inzlicht, M., & Harmon-Jones, E. (2012). Toward a biological understanding of
mortality salience (and other threat compensation processes). Social Cognition, 30,
715-733.
Van den Bos, R., Harteveld, M., & Stoop, H. (2009). Stress and decision-making in humans:
Performance is related to cortisol activity, albeit differently in men and women.
Psychoneuroendocrinology, 34, 1449-1458.
Wirtz, P. H., Elhert, U., Emini, L., & Suter, T. (2008). Higher body mass index (BMI) is
associated with reduced glucocorticoid inhibition of inflammatory cytokine
production following acutre psychosocial stress in men. Psychoneuroendocrinology,
33, 1102-1110.
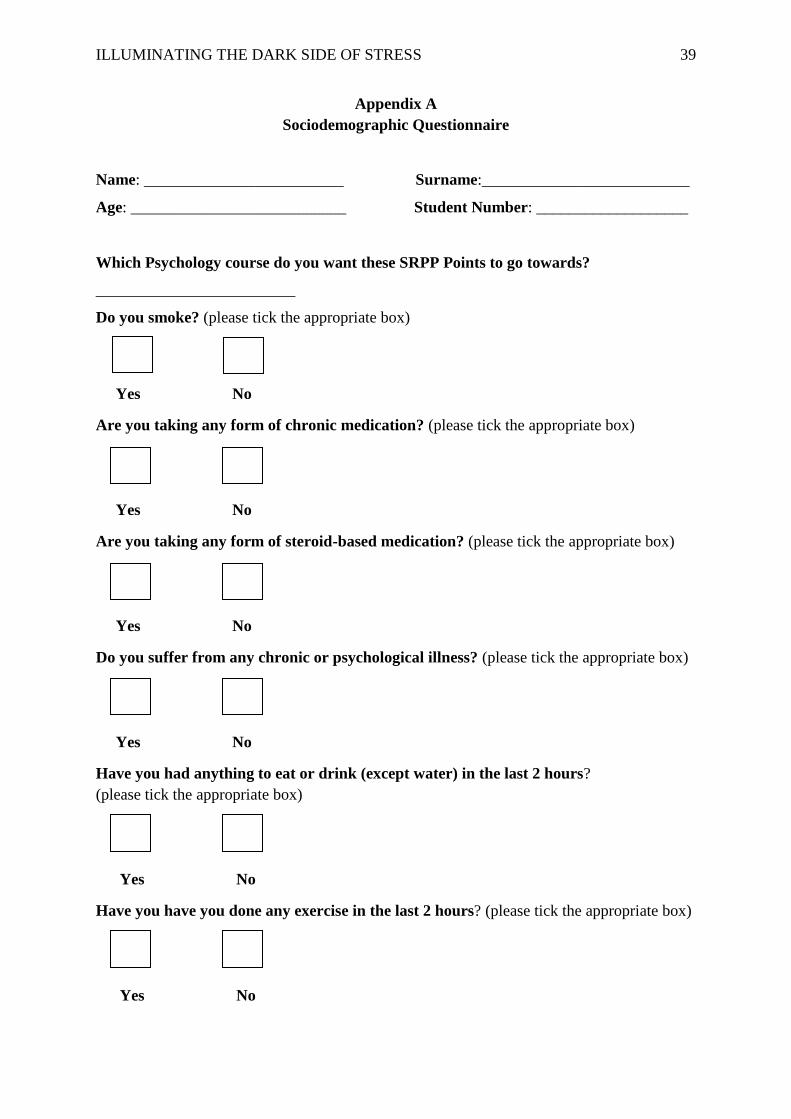
ILLUMINATING THE DARK SIDE OF STRESS 39
Appendix A
Sociodemographic Questionnaire
Name: _________________________ Surname:__________________________
Age: ___________________________ Student Number: ___________________
Which Psychology course do you want these SRPP Points to go towards?
_________________________
Do you smoke? (please tick the appropriate box)
Yes No
Are you taking any form of chronic medication? (please tick the appropriate box)
Yes No
Are you taking any form of steroid-based medication? (please tick the appropriate box)
Yes No
Do you suffer from any chronic or psychological illness? (please tick the appropriate box)
Yes No
Have you had anything to eat or drink (except water) in the last 2 hours?
(please tick the appropriate box)
Yes No
Have you have you done any exercise in the last 2 hours? (please tick the appropriate box)
Yes No
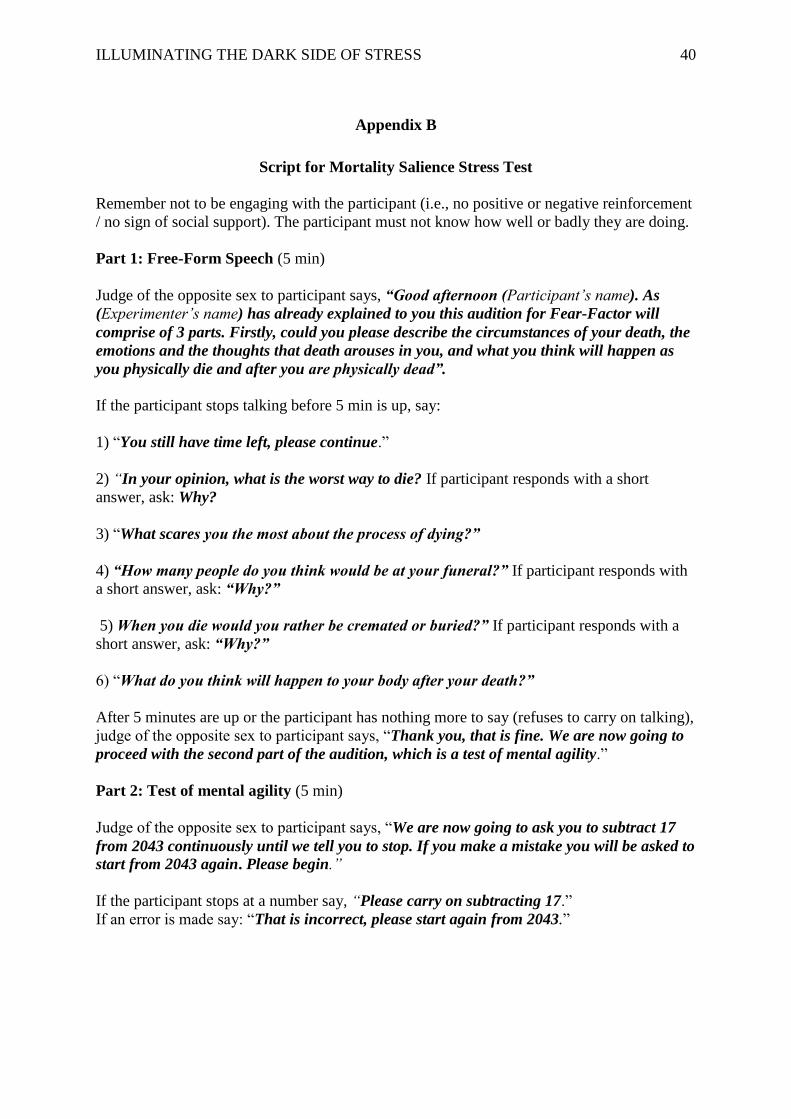
ILLUMINATING THE DARK SIDE OF STRESS 40
Appendix B
Script for Mortality Salience Stress Test
Remember not to be engaging with the participant (i.e., no positive or negative reinforcement
/ no sign of social support). The participant must not know how well or badly they are doing.
Part 1: Free-Form Speech (5 min)
Judge of the opposite sex to participant says, “Good afternoon (Participant’s name). As
(Experimenter’s name) has already explained to you this audition for Fear-Factor will
comprise of 3 parts. Firstly, could you please describe the circumstances of your death, the
emotions and the thoughts that death arouses in you, and what you think will happen as
you physically die and after you are physically dead”.
If the participant stops talking before 5 min is up, say:
1) “You still have time left, please continue.”
2) “In your opinion, what is the worst way to die? If participant responds with a short
answer, ask: Why?
3) “What scares you the most about the process of dying?”
4) “How many people do you think would be at your funeral?” If participant responds with
a short answer, ask: “Why?”
5) When you die would you rather be cremated or buried?” If participant responds with a
short answer, ask: “Why?”
6) “What do you think will happen to your body after your death?”
After 5 minutes are up or the participant has nothing more to say (refuses to carry on talking),
judge of the opposite sex to participant says, “Thank you, that is fine. We are now going to
proceed with the second part of the audition, which is a test of mental agility.”
Part 2: Test of mental agility (5 min)
Judge of the opposite sex to participant says, “We are now going to ask you to subtract 17
from 2043 continuously until we tell you to stop. If you make a mistake you will be asked to
start from 2043 again. Please begin.”
If the participant stops at a number say, “Please carry on subtracting 17.”
If an error is made say: “That is incorrect, please start again from 2043.”
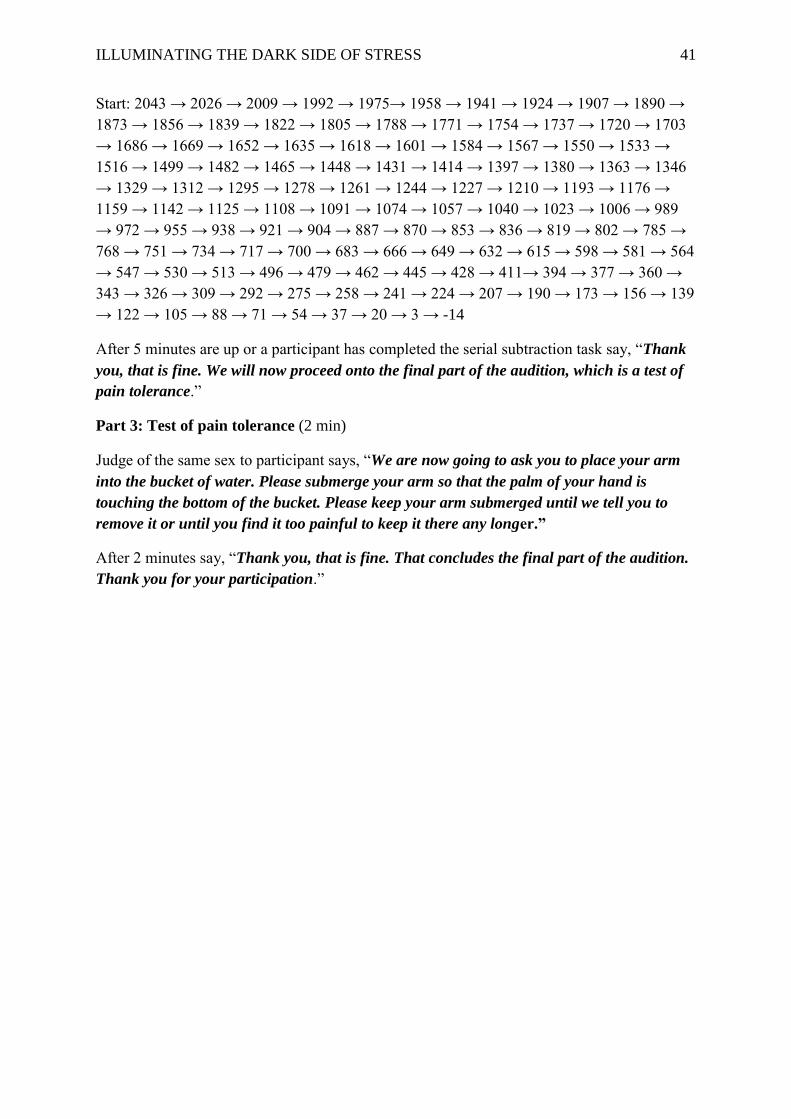
ILLUMINATING THE DARK SIDE OF STRESS 41
Start: 2043 → 2026 → 2009 → 1992 → 1975→ 1958 → 1941 → 1924 → 1907 → 1890 →
1873 → 1856 → 1839 → 1822 → 1805 → 1788 → 1771 → 1754 → 1737 → 1720 → 1703
→ 1686 → 1669 → 1652 → 1635 → 1618 → 1601 → 1584 → 1567 → 1550 → 1533 →
1516 → 1499 → 1482 → 1465 → 1448 → 1431 → 1414 → 1397 → 1380 → 1363 → 1346
→ 1329 → 1312 → 1295 → 1278 → 1261 → 1244 → 1227 → 1210 → 1193 → 1176 →
1159 → 1142 → 1125 → 1108 → 1091 → 1074 → 1057 → 1040 → 1023 → 1006 → 989
→ 972 → 955 → 938 → 921 → 904 → 887 → 870 → 853 → 836 → 819 → 802 → 785 →
768 → 751 → 734 → 717 → 700 → 683 → 666 → 649 → 632 → 615 → 598 → 581 → 564
→ 547 → 530 → 513 → 496 → 479 → 462 → 445 → 428 → 411→ 394 → 377 → 360 →
343 → 326 → 309 → 292 → 275 → 258 → 241 → 224 → 207 → 190 → 173 → 156 → 139
→ 122 → 105 → 88 → 71 → 54 → 37 → 20 → 3 → -14
After 5 minutes are up or a participant has completed the serial subtraction task say, “Thank
you, that is fine. We will now proceed onto the final part of the audition, which is a test of
pain tolerance.”
Part 3: Test of pain tolerance (2 min)
Judge of the same sex to participant says, “We are now going to ask you to place your arm
into the bucket of water. Please submerge your arm so that the palm of your hand is
touching the bottom of the bucket. Please keep your arm submerged until we tell you to
remove it or until you find it too painful to keep it there any longer.”
After 2 minutes say, “Thank you, that is fine. That concludes the final part of the audition.
Thank you for your participation.”
ILLUMINATING THE DARK SIDE OF STRESS 42
Appendix C
Informed Consent Document
Informed Consent to Participate in Research
and Authorization for Collection, Use, and
Disclosure of Protected Health Information
This form provides you with information about the study and seeks your authorisation for the
collection, use and disclosure of your protected health information necessary for the study.
The Principal Investigator (the person in charge of this research) or a representative of the
Principal Investigator will also describe this study to you and answer all of your questions.
Your participation is entirely voluntary. Before you decide whether or not to take part, read
the information below and ask questions about anything you do not understand. By
participating in this study you will not be penalised or lose any benefits to which you would
otherwise be entitled.
1. Name of Participant ("Study Subject")
________________________________________________________________________
2. Title of Research Study
The Mortality Salience Stress Test: A laboratory-based acute psychosocial stressor.
3. Principal Investigators, Ethics Committee, and Telephone Numbers
Kevin G. F. Thomas, Ph.D. Robyn Human, MA Leanne Adams
Department of Psychology PhD Candidate Aimee Minnozzi
University of Cape Town Department of Psychology Honours students
021-650-4608 University of Cape Town
021-788-5536
Faculty of Health Sciences
Research Ethics Committee
Room E52-24, Groote Schuur Hospital, Old Main Building
Observatory 7925
Tel: 021-406-6338
Fax: 021-406-6411
Email: [email protected]
ILLUMINATING THE DARK SIDE OF STRESS 43
4. What is the purpose of this research study?
The purpose of this research study is to better understand how exposure to acute
psychological stress affects cognitive performance.
5. What will be done if you take part in this research study?
During this study, you will be required to complete two personality assessment tasks and may
be required to complete a 20-minute presentation. Your levels of stress will be assessed
through the collection of self-report data, heart rate measurements, skin conductance
measurements and saliva samples with the aid of a cotton swab. These saliva samples will be
used to analyse levels of cortisol, a stress hormone.
6. What are the possible discomforts and risks?
If you are one of the participants selected to complete the 20-minute presentation, you may be
placed in a mildly stressful situation involving public speaking. Furthermore, you may be
asked to place your hand in very cold water. There are no other discomforts and risks
associated with participation in the study.
7. What are the possible benefits of this study?
One major benefit of this study is that scientists and society in general, will have better
understanding of the effects of acute psychological stress on cognitive performance, and what
variables moderate this relationship. This knowledge can then be applied to many different
individuals and situations, including students who are taking exams, business managers who
have to present to their boards, and so on.
8. Can you withdraw from this research study and if you withdraw, can
information about you still be used and/or collected?
You may withdraw your consent and stop participation in this study at any time. Information
already collected may be used.
9. Once personal information is collected, how will it be kept confidential in order
to protect your privacy and what protected health information about you may be
collected, used and shared with others?
Information collected will be stored in locked filing cabinets or in computers with security
passwords. Only certain people - the researchers for this study and certain University of
Cape Town officials - have the legal right to review these research records. Your research
records will not be released without your permission unless required by law or a court order.
ILLUMINATING THE DARK SIDE OF STRESS 44
If you agree to be in this research study, it is possible that some of the information collected
might be copied into a "limited data set" to be used for other research purposes. If so, the
limited data set may only include information that does not directly identify you.
Signatures
As a representative of this study, I have explained to the participant the purpose, the
procedures, the possible benefits, and the risks of this research study; the alternatives to being
in the study; and how the participant’s protected health information will be collected, used,
and shared with others:
______________________________________________ _____________________
Signature of Person Obtaining Consent and Authorization Date
You have been informed about this study’s purpose, procedures, and risks; how your
protected health information will be collected, used and shared with others. You have
received a copy of this form. You have been given the opportunity to ask questions before
you sign, and you have been told that you can ask other questions at any time.
You voluntarily agree to participate in this study. You hereby authorize the collection, use
and sharing of your protected health information. By signing this form, you are not waiving
any of your legal rights.
______________________________________________ _____________________
Signature of Person Consenting and Authorizing Date
Please indicate below if you would like to be notified of future research projects conducted
by our research group:
______________ (initial) Yes, I would like to be added to your research participation pool
and be notified of research projects in which I might participate in the future.
Method of contact:
Phone number: ________________________________
E-mail address: ________________________________
ILLUMINATING THE DARK SIDE OF STRESS 45
Appendix D
Ethical Approval from UCT Department of Psychology
ILLUMINATING THE DARK SIDE OF STRESS 46
Appendix E
Ethical Approval from UCT Faculty of Health Sciences Human Research Ethics
Committee
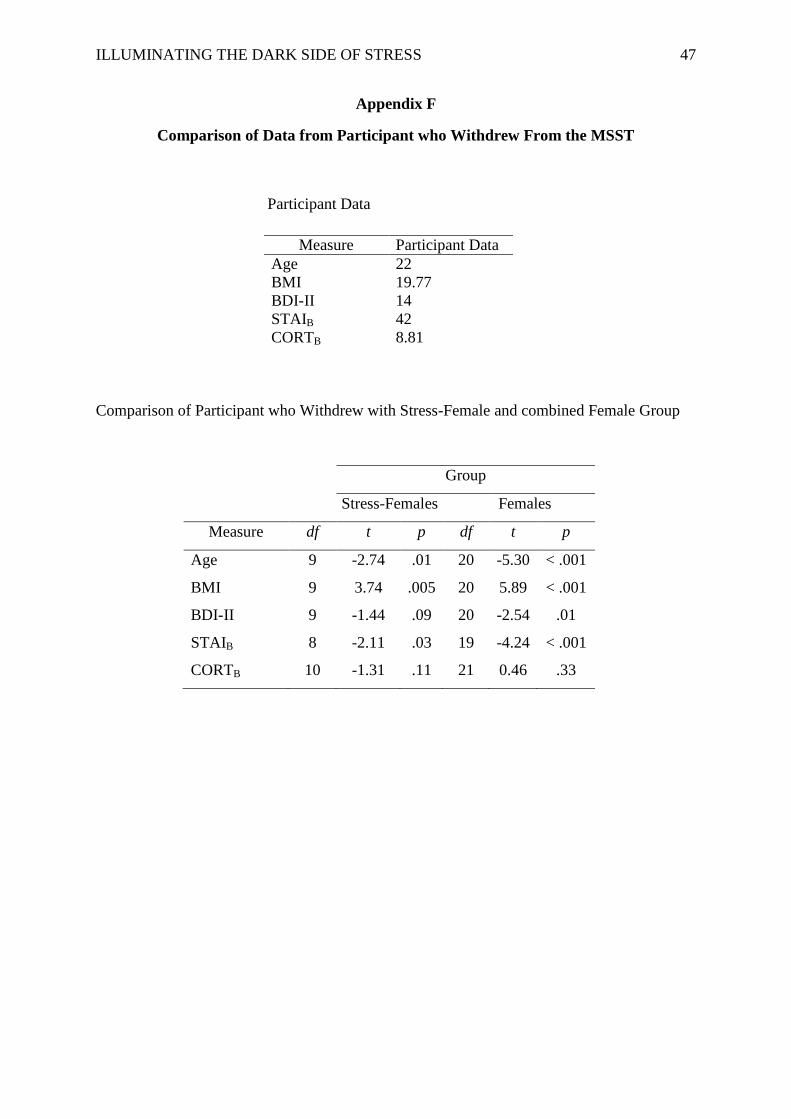
ILLUMINATING THE DARK SIDE OF STRESS 47
Appendix F
Comparison of Data from Participant who Withdrew From the MSST
Participant Data
Comparison of Participant who Withdrew with Stress-Female and combined Female Group
Measure Participant Data
Age 22
BMI 19.77
BDI-II 14
STAIB 42
CORTB 8.81
Group
Stress-Females Females
Measure df t p df t p
Age 9 -2.74 .01 20 -5.30 < .001
BMI 9 3.74 .005 20 5.89 < .001
BDI-II 9 -1.44 .09 20 -2.54 .01
STAIB 8 -2.11 .03 19 -4.24 < .001
CORTB 10 -1.31 .11 21 0.46 .33
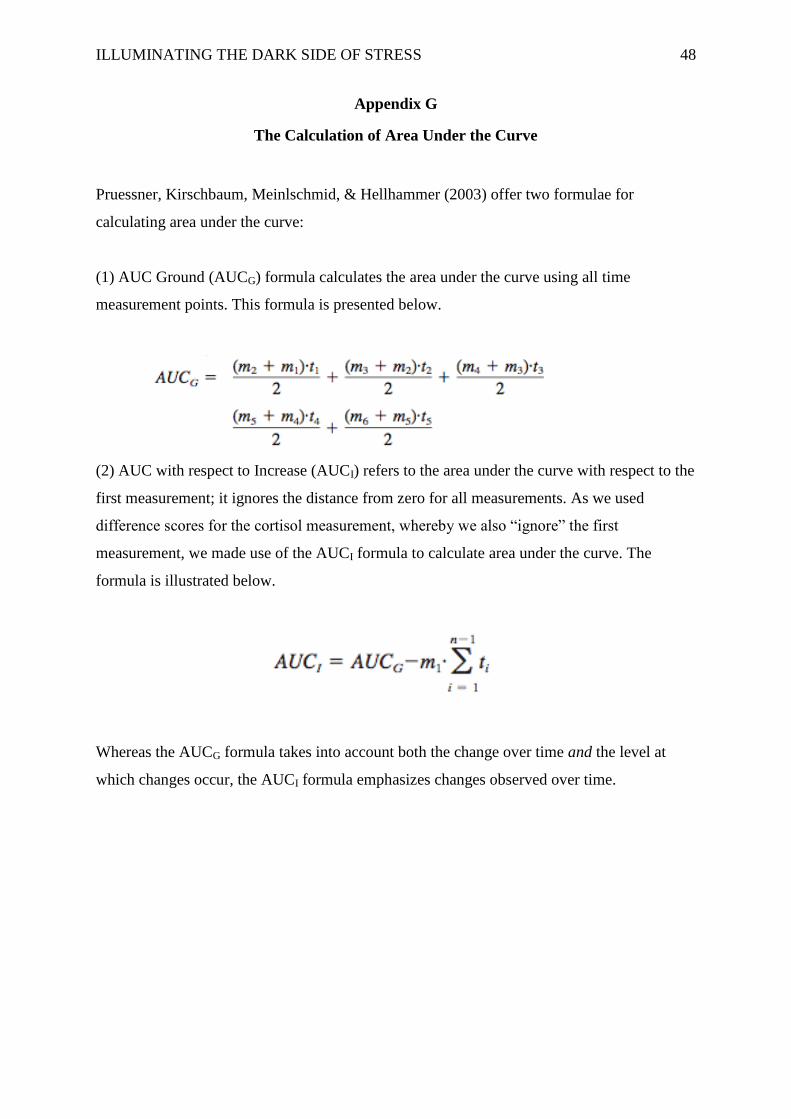
ILLUMINATING THE DARK SIDE OF STRESS 48
Appendix G
The Calculation of Area Under the Curve
Pruessner, Kirschbaum, Meinlschmid, & Hellhammer (2003) offer two formulae for
calculating area under the curve:
(1) AUC Ground (AUCG) formula calculates the area under the curve using all time
measurement points. This formula is presented below.
(2) AUC with respect to Increase (AUCI) refers to the area under the curve with respect to the
first measurement; it ignores the distance from zero for all measurements. As we used
difference scores for the cortisol measurement, whereby we also “ignore” the first
measurement, we made use of the AUCI formula to calculate area under the curve. The
formula is illustrated below.
Whereas the AUCG formula takes into account both the change over time and the level at
which changes occur, the AUCI formula emphasizes changes observed over time.
ILLUMINATING THE DARK SIDE OF STRESS 49
PLAGIARISM DECLARATION
1. We know that plagiarism is wrong. Plagiarism is using another’s work and to pretend
that it is one’s own.
2. We have used the American Psychological Association (APA) as the convention for
citation and referencing. Each significant contribution to, and quotation in, this thesis
from the work, or works, of other people has been attributed, and has cited and
referenced.
3. This thesis is our own work.
4. We have not allowed, and will not allow, anyone to copy our work with the intention
of passing it off as his or her own work.
5. We acknowledge that copying someone else's assignment or essay, or part of it, is
wrong, and declare that this is our own work.
SIGNATURES: _____________________________________________________________
DATE: 24th
October 2013