Seeing Is Believing: Use of Antibodies in Immunocytochemistry and In situ Hybridization

Immunocytochemistry
Run 119/48
Assessment Dates: 2nd — 17th October 2017
Click on sponsor logos below to go straight to the sponsor webpage
Improving Immunocytochemistry for Over 25 Years
Results - Summary Graphs - Pass Rates Best Methods - Selected Images
Immunocytochemistry Modules
General Pathology: TTF-1& p63
2-11
Breast Pathology: PR
12-19
Breast Pathology: HER2 IHC
20-26
Gastric: HER2 IHC
27-33
Lymphoid Pathology: BCL-6 & CD15
34-43
Neuropathology: Ki67 & EMA
44-52
Cytology: Ki67 & CD45
53-62
Alimentary Tract: GIST: CD117 & S100
63-71
g
Al Tract/Lynch Syndrome: MSH2 & MSH6
72-82
NSCLC ALK IHC:
83-89
NSCLC PD-L1 IHC:
In situ Hybridisation Modules
Breast: HER2 ISH Interpretive
91-93
Breast HER2 ISH Technical
94-99
Cover Photo: Taken from the General module Top Left: Optimal p63 staining on the NEQAS sample of prostate Top Right: Sub-optimal p63 demonstration in the NEQAS sample Bottom Left: Optimal TTF-1 demonstration in the NEQAS thyroid sample Bottom Right: Excellent TTF-1 staining on an in-house control slide

General Information
© UK NEQAS ICC & ISH. No part of this document can be copied or used without prior written consent
UK NEQAS ICC & ISH is part of the Cancer Institute at the University College London, Gower Street, London WC1E 6BT
Data shown in this article is collated from UK NEQAS ICC & ISH assessments and is presented and described ‘as collected’, and does not ether endorse nor denounce any particular product or method and is provided as a guide to highlight optimal and sub-optimal staining methodologies. UK NEQAS ICC & ISH does not endorse any of the products featured by the commercial sponsors and are placed at
the discretion of UK NEQAS ICC & ISH. Furthermore, commercial companies featured do not have any input or influence over the content, including results that are shown.
ASSESSORS
UK NEQAS ICC has over 100 Assessors (scientists and pathologists) including the UK, Australia, Canada, Denmark, Germany, Hungary, Ireland, Portugal, Slovenia, South Africa, Sweden and Switzerland.
The list below shows assessors who took part in this assessment.
Deputy Manager Mr Jamie Hughes
Support Scientists
Ms Amy Newman/Mr Neil Bilbe
([email protected]/ [email protected])
Office Manager Mrs Ailin Rhodes
Clerical Assistant Mrs Clara Lynch
Quality Manager Seema Dhanjal
Director Mr Keith Miller
Acting Manager Ms Suzanne Parry
Deputy Director Mr Andrew Dodson
For further information of the UK NEQAS ICC & ISH scheme, general EQA enquiries, slide returns and advertising opportunities please contact:
Suzanne Parry, Acting Scheme Manager UK NEQAS ICC & ISH
Room 127, Finsbury Business Centre
40 Bowling Green Lane
London EC1R 0NE
Tel: +44 (2) 07 415 7065
Fax: +44 (2) 07 415 7048
E-mail: [email protected]
For enquiries concerning training issues, meetings, or courses, please contact:
Mr Keith Miller, Scheme Director Cancer Diagnostic Quality Assurance Services CIC
Poundbury Cancer Institute
Newborough House, 3 Queen Mother Square
Poundbury, Dorchester Dorset DT1 3RZ
United Kingdom
Tel: 07548795116
E-mail: [email protected]
Journal layout and design prepared by UK NEQAS ICC & ISH
United Kingdom
Mr C Abbott, Bath
Mr D Allen, London
Dr BM Araujo, Cambridge
Prof M Arends, Edinburgh
Mr N Bilbe, London
Mr D Blythe, Leeds
Ms A Clayton, Preston
Mr A Dodson, London
Mr I Dowie, Glasgow
Mr R Fincham, Cambridge
Mr D Fish, Reading
Ms S Forrest, Liverpool Dr C Gillett, London
Ms L Govan, Airdrie
Dr D Guppy, London
Mr J Hughes, London
Ms S Jordan, London
Dr J Joseph, Preston
Mr G King, Aberdeen
Ms J McMillan,Glasgow
Mr C Marsh, Newcastle
Mr K Miller, London
Ms A Newman, London
Ms S Parry, London
Dr M Pitt, Cambridge
Ms F Rae, Edinburgh
Ms A Riley, Glasgow
Mr G Rock, Birmingham
Dr J Starczynski, Birmingham
Dr P Taniere, Birmingham
Ms J Terry, Halifax
Ms C Thomas, Preston
Ms G Valentine, London
Dr P Wencyk, Nottingham
Ireland
Dr T O’Grady, Dublin
Mr K McAllister, Dublin
Netherlands
Dr Erik Thunnissen, Amsterdam
Portugal Mr J Matos, Lisbon
Mr R Roque, Lisbon
Ms T Pereira, Lisbon
Ms S Morgado, Lisbon
Slovenia
Ms S Gabric, Golnik
Mr D Vidovic, Maribor

1

Gold Standard Second Antibody
Antigens Assessed: TTF-1 p63
Tissue Sections circulated: Normal thyroid and adenocarcinoma of lung Hyperplastic prostate and normal tonsil
Number of Registered Participants: 312
Number of Participants this Run 296 (95%)
Run 107
Gavin Rock and Jamie Hughes
Introduction Gold Standard: TTF-1
Thyroid transcription factor (TTF1) is a member of the family of homeodomain (protein structural domain that binds DNA or RNA) transcription factors and is a gene regulatory factor expressed in the follicular epithelial and para-follicular c-cells of the thyroid, epithelial cells of the lung, brain and pituitary gland. TTF1 is essential for the normal development of both the thyroid and lung, and increased TTF1 immunohistochemical expression is seen in both pulmonary adenocarcinomas and thyroid neoplasms of follicular origin (follicular adenoma and follicular and papillary carcinoma). Not all pulmonary adenocarcinomas have been shown to be positive for TTF1, with a positivity range of between 65-80 (Compérat et al., 2005), depending on the antibody clone used. TTF1 in small lung carcinomas have been shown in about 96% of cases (Ordóñez, 2000) and in 75% of non-small cell pulmonary carcinomas, but generally it is not thought to be expressed in typical pulmonary carcinoids, although the literature does have some contrasting views. TTF1 can also be used to differentiate between tumours of primary and metastatic origin e.g. primary lung adenocarcinoma (TTF1+ve/CDX2-ve) vs. metastatic gastrointestinal adenocarcinomas (TTF1+ve/CDX2-ve). Furthermore, TTF1 alongside other antibodies such as CK20 can help to further identify tumour types including Merkel cell carcinoma (TTF1-ve/CK20+ve) and metastatic small cell lung carcinoma ( TTF1+ve/CK20-ve).
Features of Optimal Immunostaining: Normal Thyroid: (Fig 3 & 5B) • Strong, nuclear staining of the follicular cells. • Clean background.
Lung Adenocarcinoma: (Fig 1 & 5A) • Strong, crisp, nuclear staining of neoplastic cells. • Strong, nuclear staining of the basal epithelial cells lining the
bronchial ducts. • Weak to moderate nuclear staining of bronchial luminal
epithelial cells. • Clean background.
Features of Suboptimal Immunostaining: (Figs 6 & 2) • Weak staining of the basal epithelial cells lining the bronchial
ducts. • Weak staining of neoplastic cells of the tumour. • Non-specific nuclear staining. • Excessive background staining.
References
1. Comperat E., Zhang, F., Perrotin, C., Molina, T., Magdeleinat, P., Marmey, B., Régnard, J., Audouin, J. and Camilleri-Broët, S. (2005); Variable sensitivity and specificity of TTF1 antibodies in lung metastatic adenocarcinoma of colorectal origin. Modern Pathology. 18(10). pp. 1371-1376. 2. Ordóñez N. (2000). Value of thyroid transcription factor-1 immunostaining in distinguishing small cell lung carcinoma from other Small Cell Carcinomas. The American journal of Surgical Pathology, 24(9),pp.1217-1223.
Second Antigen: p63
p63 is a 63KDa nuclear homologue protein of the tumour suppressor p53 family of transcription factors, which is found in the basal and progenitor cells of many epithelial cells, including those of the breast, prostate, bladder and oesophagus (Signoretti et al., 2000) p63 has been identified as a particularly useful aide in the differentiation between benign and malignant lesions of the prostate (Humphrey, 2007), and has also shown to be a sensitive marker for squamous cell carcinomas of the lung. In breast tissue, p63 is expressed in the myoepithelial cells of normal ducts and is therefore useful within a panel of IHC markers for the assessment of breast lesions due to the differential expression of luminal versus basal and myoepithelial markers (Reis-Filho et al., 2006)
Features of Optimal Immunostaining: Tonsil (Fig 7) • Strong nuclear staining in almost all of the epithelial cells,
with higher intensity in the basal elements. • Minimal background staining. •
Prostate - Benign prostatic hyperplasia: (Fig 9) • Strong nuclear staining in the basal cells lining the gland. • Minimal background staining.
Suboptimal Immunostaining: (Figs 10 8, & 12) • Weak, uneven or no staining. • Diffuse staining. • Non-specific staining of cell types not expected to stain. • Excessive background staining.
References: 1. Humphrey, P. (2007). Diagnosis of adenocarcinoma in prostate needle biopsy tissue. Journal of Clinical Pathology, 60(1), pp.35-42. 2. Reis-Filho, J., Milanezi, F., Steele, D., Savage, K., Simpson, P., Nesland, J., Pereira, E., Lakhani, S. and Schmitt, F. (2006). Metaplastic breast carcinomas are basal-like tumours. Histopathology, 49(1), pp.10-21. 3. Signoretti, S., Waltregny, D., Dilks, J., Isaac, B., Lin, D., Garraway, L., Yang, A., Montironi, R., McKeon, F. and Loda, M. (2000). p63 Is a Prostate Basal Cell Marker and Is Required for Prostate Development. The American Journal of Pathology, 157(6), pp.1769-1775.
© UK NEQAS ICC & ISH. No part of this document can be copied or used without prior written consent
The General Pathology Module Run 119
2

Run 107
Assessment Summary
TTF-1
294 laboratories submitted slides for the TTF-1 assessment, and all but 2 laboratories submitted their in-house control sections for this run. The results show an increase of 4% in acceptable results from Run 107, as shown in the table below:
The most common reason for failure/ loss of marks in run 119 was due to weak/very weak demonstration of the antigen, and less so due to background staining being observed.
The most popular antibody used in this run was Ventana TTF-
1 (SP141) used by 64 participants with a pass rate of 95%. The second most popular antibody was Leica NCL-L-TTF1 (SPT24) used by 62 participants with a pass rate of 98%. Another popular choice was Dako M3575 (8G7G3/1) used by 55 participants with a 82% acceptable pass rate. The acceptable pass rate of the in-house tissue was 96% compared to the NEQAS distributed tissue of 88.44%.
The most common automated platform for TTF-1 was the Ventana Benchmark Ultra used by 103 participants with a pass rate of 90%. The second most common was the Leica Bond III used by 56 participants with a 95% pass rate.
p63
296 laboratories submitted slides for the assessment, and all but 2 laboratories also submitted their in-house material. The results showed an increase of 1% in acceptable results from run 110 to run 119, as shown in the table below:
The most common reasons for failure/ loss of marks in run 119 was due to weak demonstration of antigen and background staining being observed.
The most popular antibody used in this run was Ventana 790-
4509 (454) used by 94 participants with a pass rate of 97%. The second most popular used was Dako M7317 (DAK-p63) used by 47 participants with a pass rate of 91%. Another popular antibody was Leica NCL-L-p63 used by 44 participants with a pass rate of 77%. The acceptable pass rate for the in-house tissue was 94% compared to the NEQAS distributed tissue of 91%.
The most common automated platform for p63 was the Ventana Benchmark Ultra used by 101 participants with a pass rate of 96%. The second most common was the Leica Bond III used by 54 participants with a 85% pass rate.
© UK NEQAS ICC & ISH. No part of this document can be copied or used without prior written consent
The General Pathology Module Run 119
p Pass Rates: NEQAS se ion
Run Run
A epta le % N= % N=
Borderline % N= % N=
Una epta le % N= % N=
TTF- Pass Rates : NEQAS se ion
Run Run
A epta le % N= % N=
Borderline % N= % N=
Una epta le % N= % N=
3

RUN 119 GENERAL PATHOLOGY Module
Selected Images showing Optimal and Sub-optimal immunostaining
Figure 2: Sub-optimal weak and patchy staining of the UK NEQAS lung adenocarcinoma
sample. Dako (8G7G3/1) RTU 20mins 32°C; Dako Omnis; Dako Envision+ HRP mouse.
Figure 1: Optimal demonstration of Thyroid Transcription Factor 1 (TTF-1) on UK NEQAS lung
tumour sample. The example shows strong staining of the basal epithelial cells lining the
bronchial duct, while the staining of the luminal epithelial cells are of moderate intensity.
Ventana (SP141) 12 mins 37°C; Ventana Ultra; CC1 40mins: OptiView Kit.
Figure 3: Optimal demonstration of TTF-1 on UK NEQAS thyroid sample. All of the follicular
epithelial cells show strong nuclear staining, while the background remains clean. Protocol as
per fig. 1.
Figure 4: Sub-optimal demonstration of TTF-1 on UK NEQAS thyroid sample. Weak
demonstration of antigen and slight background staining. Dako (M3575) 1:800 15mins 20°C;
Leica Bond Max; ER2 20 mins; Leica Bond Polymer Refine.
Figure 5: Excellent demonstration of TTF-1 on in-house sample with normal lung (A) and
normal thyroid (B). Both images show strong and distinct staining while the background
remains clear. A) Leica NCL-L-TTF 1:200 32 mins 37°C; Ventana XT; CC1 standard; UltraView
Kit. B) Ventana (SP141) 24mins 36°C; Ventana Ultra; CC1 64mins; Ventana OptiView Kit.
Figure 6: Poor example of TTF-1 staining of in-house lung sample. Weak to no demonstration
of antigen. Dako (8G7G3/1) 1:800 15mins 20°C; Leica Bond Max; ER2 20 mins; Leica Bond
Polymer Refine.
© Copyright UK NEQAS ICC & ISH - Not for publication without written permission
4

RUN 119 GENERAL PATHOLOGY Module
Selected Images showing Optimal and Sub-optimal {@stainingtext}
Figure 8: Sub-optimal staining of p63 on the UK NEQAS distributed tonsil sample. There is
excessive background staining and inadequate demonstration of the antigen. Dako (DAK-p63)
1:25; Dako Autostainer Link 48; Dako PTLink; As per kit.
Figure 7: Optimal staining of p63 on the UK NEQAS distributed tonsil sample, showing strong
nuclear epithelial staining. Ventana (454) 40 mins at RT; Ventana Ultra; CC1 64mins; OptiView
Kit.
Figure 10: Sub-optimal demonstration of the p63 on the UK NEQAS distributed prostate
sample. There is very weak demonstration of the antigen. Leica (NCL-L-p63) 1:25 32mins;
Ventana XT; CC1 64mins; UltraView Kit.
Figure 9: Optimal demonstration of the p63 on the UK NEQAS distributed prostate sample.
There is strong nuclear staining of the basal cells with a clean background. Dako (DAK-p63)
RTU 20mins 32°C; Dako Omnis; EnVision FLEX
Figure 12: Poor example of an in-house control stained with p63. There is excessive
background with little to no counterstain. Protocol as per fig 8.
Figure 11: Excellent example of an in-house skin control stained with p63. The staining is
strong and distinct while the background remains clean. Dako M7317 (DAK-p63) 1:50 32mins
RT; Ventana Ultra; CC1 standard; OptiView Kit.
© Copyright UK NEQAS ICC & ISH - Not for publication without written permission
5

Run 119 GENERAL PATHOLOGY Module
0
20
40
60
80
100
4 5 6 7 8 9 10 11 12 13 14 15 16 17 18 19 20
Scores
no
. o
f re
turn
s
RUN 119A Thyroid Transcription Factor 1 (TTF1) on NEQAS Sections
ALL PARTICIPANTS Individual
Scores
4 = 0 (0%)
5 = 0 (0%)
6 = 0 (0%)
7 = 0 (0%)
8 = 1 (0%)
9 = 3 (1%)
10 = 3 (1%)
11 = 5 (2%)
12 = 22 (7%)
13 = 11 (4%)
14 = 22 (7%)
15 = 18 (6%)
16 = 93 (32%)
17 = 60 (20%)
18 = 43 (15%)
19 = 7 (2%)
20 = 6 (2%)
GRAPHICAL REPRESENTATION OF PASS RATES
RUN 119A Thyroid Transcription Factor 1 (TTF1) on NEQAS Sections
UK PARTICIPANTS
0
10
20
30
40
50
60
4 5 6 7 8 9 10 11 12 13 14 15 16 17 18 19 20
Scores
no
. o
f re
turn
s
Individual
Scores
4 = 0 (0%)
5 = 0 (0%)
6 = 0 (0%)
7 = 0 (0%)
8 = 0 (0%)
9 = 0 (0%)
10 = 1 (1%)
11 = 2 (1%)
12 = 13 (8%)
13 = 7 (4%)
14 = 16 (10%)
15 = 10 (6%)
16 = 56 (34%)
17 = 30 (18%)
18 = 23 (14%)
19 = 3 (2%)
20 = 6 (4%)
Summary
16 - 20 = 209 (71%)
13 - 15 = 51 (17%)
10 - 12 = 30 (10%)
0 - 9 = 4 (1%)
Median = 14.00
Summary
16 - 20 = 118 (71%)
13 - 15 = 33 (20%)
10 - 12 = 16 (10%)
0 - 9 = 0 (0%)
Median = 15.00
0
20
40
60
80
100
120
4 5 6 7 8 9 10 11 12 13 14 15 16 17 18 19 20
Scores
no
. o
f re
turn
s
RUN 119B Thyroid Transcription Factor 1 (TTF1) on in-house
Sections
ALL PARTICIPANTS
Individual
Scores
4 = 0 (0%)
5 = 0 (0%)
6 = 0 (0%)
7 = 0 (0%)
8 = 1 (0%)
9 = 1 (0%)
10 = 2 (1%)
11 = 2 (1%)
12 = 7 (2%)
13 = 5 (2%)
14 = 13 (4%)
15 = 23 (8%)
16 = 120 (41%)
17 = 89 (30%)
18 = 24 (8%)
19 = 5 (2%)
20 = 0 (0%)0
10
20
30
40
50
60
70
4 5 6 7 8 9 10 11 12 13 14 15 16 17 18 19 20
Scores
no
. o
f re
turn
s
RUN 119B Thyroid Transcription Factor 1 (TTF1) on in-house
Sections
UK PARTICIPANTS
Individual
Scores
4 = 0 (0%)
5 = 0 (0%)
6 = 0 (0%)
7 = 0 (0%)
8 = 0 (0%)
9 = 0 (0%)
10 = 1 (1%)
11 = 2 (1%)
12 = 3 (2%)
13 = 2 (1%)
14 = 7 (4%)
15 = 15 (9%)
16 = 62 (37%)
17 = 60 (36%)
18 = 13 (8%)
19 = 2 (1%)
20 = 0 (0%)
Summary
16 - 20 = 238 (82%)
13 - 15 = 41 (14%)
10 - 12 = 11 (4%)
0 - 9 = 2 (1%)
Median = 13.50
Summary
16 - 20 = 137 (82%)
13 - 15 = 24 (14%)
10 - 12 = 6 (4%)
0 - 9 = 0 (0%)
Median = 14.50
© Copyright UK NEQAS ICC & ISH - Not for publication without written permission
6

Run 119 GENERAL PATHOLOGY Module
0
20
40
60
80
100
4 5 6 7 8 9 10 11 12 13 14 15 16 17 18 19 20
Scores
no
. o
f re
turn
s
RUN 119C p63 on NEQAS Sections
ALL PARTICIPANTSIndividual
Scores
4 = 0 (0%)
5 = 0 (0%)
6 = 0 (0%)
7 = 0 (0%)
8 = 3 (1%)
9 = 2 (1%)
10 = 2 (1%)
11 = 5 (2%)
12 = 14 (5%)
13 = 18 (6%)
14 = 17 (6%)
15 = 26 (9%)
16 = 99 (33%)
17 = 64 (22%)
18 = 25 (8%)
19 = 14 (5%)
20 = 7 (2%)
GRAPHICAL REPRESENTATION OF PASS RATES
0
10
20
30
40
50
4 5 6 7 8 9 10 11 12 13 14 15 16 17 18 19 20
Scores
no
. o
f re
turn
s
RUN 119C p63 on NEQAS Sections
UK PARTICIPANTSIndividual
Scores
4 = 0 (0%)
5 = 0 (0%)
6 = 0 (0%)
7 = 0 (0%)
8 = 3 (2%)
9 = 1 (1%)
10 = 2 (1%)
11 = 4 (2%)
12 = 8 (5%)
13 = 13 (8%)
14 = 8 (5%)
15 = 13 (8%)
16 = 50 (30%)
17 = 38 (23%)
18 = 13 (8%)
19 = 10 (6%)
20 = 4 (2%)
Summary
16 - 20 = 209 (71%)
13 - 15 = 61 (21%)
10 - 12 = 21 (7%)
0 - 9 = 5 (2%)
Median = 14.00
Summary
16 - 20 = 115 (69%)
13 - 15 = 34 (20%)
10 - 12 = 14 (8%)
0 - 9 = 4 (2%)
Median = 14.00
0
20
40
60
80
100
120
4 5 6 7 8 9 10 11 12 13 14 15 16 17 18 19 20
Scores
no
. o
f re
turn
s
RUN 119D p63 on in-house Sections
ALL PARTICIPANTSIndividual
Scores
4 = 0 (0%)
5 = 0 (0%)
6 = 0 (0%)
7 = 0 (0%)
8 = 0 (0%)
9 = 1 (0%)
10 = 2 (1%)
11 = 3 (1%)
12 = 11 (4%)
13 = 13 (4%)
14 = 20 (7%)
15 = 35 (12%)
16 = 116 (39%)
17 = 67 (23%)
18 = 18 (6%)
19 = 6 (2%)
20 = 2 (1%)
RUN 119D p63 on in-house Sections
UK PARTICIPANTS
0
10
20
30
40
50
60
4 5 6 7 8 9 10 11 12 13 14 15 16 17 18 19 20
Scores
no
. o
f re
turn
s
Individual
Scores
4 = 0 (0%)
5 = 0 (0%)
6 = 0 (0%)
7 = 0 (0%)
8 = 0 (0%)
9 = 1 (1%)
10 = 2 (1%)
11 = 2 (1%)
12 = 7 (4%)
13 = 7 (4%)
14 = 14 (8%)
15 = 21 (13%)
16 = 60 (36%)
17 = 36 (22%)
18 = 11 (7%)
19 = 4 (2%)
20 = 2 (1%)
Summary
16 - 20 = 209 (71%)
13 - 15 = 68 (23%)
10 - 12 = 16 (5%)
0 - 9 = 1 (0%)
Median = 14.50
Summary
16 - 20 = 113 (68%)
13 - 15 = 42 (25%)
10 - 12 = 11 (7%)
0 - 9 = 1 (1%)
Median = 14.50
© Copyright UK NEQAS ICC & ISH - Not for publication without written permission
7

Run 119 GENERAL PATHOLOGY Module
ANTIBODIES AND OTHER TECHNICAL PARAMETERS EMPLOYED BY PARTICIPANTS IN THE
GENERAL PATHOLOGY MODULE
The following tables record the number of participants (N) using each primary antibody and the percentage (%) of these
participants achieving acceptable staining (scores 12/20) on UK NEQAS sections.
Antibody Details N %
Primary Antibody : Thyroid Transcription Factor 1 (TTF1)
Dako IR056 (8G7G3/1) 12 67Dako IS056 (8G7G3/1) 2 50Dako M3575 (8G7G3/1) 55 82Invitrogen 081221 (8G7G3/1) 1 0Invitrogen 180221 (8G7G3/1) 2 50Neomarkers MS-69-XX (8G7G3/1) 1 0Novocastra NCL-L-TTF-1 (SPT24) 50 98Novocastra NCL-TTF-1 (SPT24) 12 100Novocastra PA0364 (SPT24) 6 100Ventana 760-2829 (8G7G3/1) 9 78Other 14 79Zymed 08-1221 (8G7G3/1) 1 100Biogenex MU397-UC 1 100BOND RTU TTF-1 (SPT24) PA0364 5 100Cell Marque 343M-95/96/97 (8G7G3/1) 5 60Labvision MS-699 1 0Leica Bond TTF1 SPT24 (RTU) PA0364 20 90Leica NCL-L-TTF L136446 21 95THermo-Scientific MS/699P1 1 0Ventana TTF-1 (SP141) 790-4756 51 98Cell Path MOB 285 (8G7G3/1) 2 100Ventana TTF-1 (SP141) 790-4398 13 85
Antibody Details N %
Primary Antibody : p63
Biocare Medical PM163 (4A4) 8 88
Dako M7317 (DAK-p63) 47 91
Dako IR662 RTU FLEX Link (DAK-p63) 27 96
Dako M7247 (4A4) 1 100
Leica/Novocastra PA0103 RTU (7JUL) 25 92
Leica/Novocastra NCL-L-p63 (7JUL) 44 77
Minarini MP-163-CM (4A4) 17 88
Santa Cruz sc8431 (4A4) 2 100
Ventana 790-4509 (454) 94 97
Other 20 85
General Pathology Run: 119 General Pathology Run: 119
p63 Thyroid
Transcription
Factor 1 (TTF1)
N % N %
_Ventana Benk CC1 (Extended) 0 0 1 100_Ventana Benk CC1 (Standard) 0 0 1 100Dako Omnis 15 87 12 75Dako PTLink 24 92 30 90Lab vision PT Module 2 50 1 100Leica ER1 10 mins 2 50 0 0Leica ER1 20 mins 3 67 24 88Leica ER1 30 mins 1 100 12 92Leica ER1 40 mins 0 0 1 0Leica ER2 10 mins 5 100 2 100Leica ER2 20 mins 50 88 34 88Leica ER2 30 mins 15 80 8 100Leica ER2 40 mins 6 83 1 100Microwave 4 75 4 75None 0 0 2 100Other 1 100 1 100Pressure Cooker 3 100 0 0Pressure Cooker in Microwave Oven 1 100 1 100Steamer 2 50 2 100Ventana CC1 16mins 1 100 0 0Ventana CC1 24mins 1 100 3 100Ventana CC1 32mins 15 100 8 100Ventana CC1 36mins 4 100 7 71Ventana CC1 40mins 10 100 10 90Ventana CC1 48mins 7 100 7 100Ventana CC1 52mins 0 0 1 100Ventana CC1 56mins 8 100 9 100Ventana CC1 64mins 54 96 60 87Ventana CC1 72mins 0 0 2 100Ventana CC1 76mins 1 100 2 100Ventana CC1 80mins 1 100 0 0Ventana CC1 88mins 1 100 0 0Ventana CC1 92mins 1 100 0 0Ventana CC1 extended 2 100 3 100Ventana CC1 mild 9 89 5 80Ventana CC1 standard 32 91 27 85Ventana CC2 48mins 1 100 0 0Ventana CC2 64mins 0 0 1 100Water bath 68 OC 1 100 1 0Water bath 95-98 OC 1 0 1 0
Heat Mediated Retrieval
p63 Thyroid
Transcription
Factor 1
N % N %
AS PER KIT 6 67 7 57NOT APPLICABLE 124 90 153 90Other 0 0 1 100Ventana Protease 1 (760-2018) 1 0 1 100
Enzyme Mediated Retrieval
General Pathology Run: 119 General Pathology Run: 119
© Copyright UK NEQAS ICC & ISH - Not for publication without written permission
8

Run 119 GENERAL PATHOLOGY Module
p63 Thyroid
Transcription
Factor 1
N % N %
AS PER KIT 22 73 17 71Dako EnVision FLEX ( K8000/10) 9 78 9 67Dako EnVision FLEX+ ( K8002/12) 21 100 25 96Dako Envision HRP/DAB ( K5007) 4 100 2 50Dako Envision+ HRP mouse K4004/5/6/7 1 0 4 75LabVision UltraVision LP HRP (TL 125 HLJ) 1 0 1 100Leica Bond Polymer Define (DS9713) 2 50 0 0Leica Bond Polymer Refine (DS9800) 72 89 76 91None 2 100 0 0NOT APPLICABLE 0 0 1 100Novocastra Novolink PDS (RE7-140/150/280/290-K) 2 50 2 100Other 7 86 7 57Ventana iView system (760-091) 3 33 3 100Ventana OptiView (760-700) + Amp. (7/860-099) 3 100 4 100Ventana OptiView Kit (760-700) 62 100 63 94Ventana UltraView Kit (760-500) 67 96 66 86
Detection
p63 Thyroid
Transcription
Factor 1 (TTF1)
N % N %
AS PER KIT 40 88 41 90BioGenex liquid DBA (HK-124-7K) 0 0 1 100Dako DAB K3468 1 0 0 0Dako DAB+ Liquid (K3468) 3 67 3 100Dako EnVision Plus kits 3 100 3 67Dako FLEX DAB 32 91 33 85Dako REAL EnVision K5007 DAB 3 67 4 50Leica Bond Polymer Refine kit (DS9800) 71 87 73 90Other 12 100 13 85Sigma DAB (D5637) 1 0 1 100Sigma DAB (D5905) 1 100 0 0Ventana DAB 40 100 38 95Ventana iview 5 60 6 83Ventana Ultraview DAB 72 96 70 86
Chromogen
General Pathology Run: 119 General Pathology Run: 119
p63 Thyroid
Transcription
Factor 1 (TTF1)
N % N %
BioGenex GenoMX 6000i 0 0 1 100Dako Autostainer 1 0 2 100Dako Autostainer Link 48 23 91 24 92Dako Autostainer plus 0 0 1 100Dako Autostainer Plus Link 3 100 4 75Dako Omnis 14 86 12 75LabVision Autostainer 2 50 2 100Leica Bond Max 28 86 32 78Leica Bond-III 54 85 56 95None (Manual) 7 71 4 50Other 1 100 1 100Shandon Sequenza 1 100 1 0Ventana Benchmark GX 5 100 4 100Ventana Benchmark ULTRA 101 96 103 90Ventana Benchmark XT 45 96 38 87Ventana NexES 0 0 1 100
Automation
General Pathology Run: 119
Participant scored 20/20 (UK NEQAS Slide) and 17/20 (In House slide) using this method.
Primary Antibody:
Automation:
Method:
Main Buffer:
HMAR:
Ventana Benchmark ULTRA
Ventana Optiview
EAR:
Chromogen:
Detection:
Ventana TTF-1 (SP141) 790-4398
Thyroid Transcription Factor 1 (TTF1) - Method 1
Ventana reaction buffer (950-300)
Ventana CC1 36mins
Ventana DAB
Ventana OptiView Kit (760-700)
BEST METHODS - Gold Standard Antibody
A selection from just a few of the best methods employed by participants
Participant scored 20/20 (UK NEQAS Slide) and 17/20 (In House slide) using this method.
Primary Antibody:
Automation:
Method:
Main Buffer:
HMAR:
Leica Bond-III
Leica BondMAx Refine KIT
EAR:
Chromogen:
Detection:
Novocastra NCL-L-TTF-1 (SPT24) , 15 Mins, 37 ºC Dilution 1: 1:200
Thyroid Transcription Factor 1 (TTF1) - Method 2
Bond Wash Buffer (AR9590)
Leica ER2 30 mins
Leica Bond Polymer Refine kit (DS9800), Time 1: 10 Mins
Leica Bond Polymer Refine (DS9800) , 8 Mins, RT ºC Prediluted
© Copyright UK NEQAS ICC & ISH - Not for publication without written permission
9

Run 119 GENERAL PATHOLOGY Module
Participant scored 20/20 (UK NEQAS Slide) and 17/20 (In House slide) using this method.
Primary Antibody:
Automation:
Method:
Main Buffer:
HMAR:
Dako Autostainer
Envision
EAR:
Chromogen:
Detection:
Leica NCL-L-TTF L136446 , 60 Mins, 20 ºC Dilution 1: 50
Thyroid Transcription Factor 1 (TTF1) - Method 3
Tris Buffered Saline (TBS)
Microwave, Buffer: Tris/EDTA, PH: 8.5
Dako DAB+ Liquid (K3468), 20 ºC., Time 1: 5 Mins, Time 2: 5 Mins
Other , 30 Mins Prediluted
Participant scored 20/20 (UK NEQAS Slide) and 19/20 (In House slide) using this method.
Primary Antibody:
Automation:
Method:
Main Buffer:
HMAR:
Ventana Benchmark ULTRA
Ventana Optiview
EAR:
Chromogen:
Detection:
Novocastra NCL-L-TTF-1 (SPT24) , 32 Mins, 36 ºC Dilution 1: 1/200
Thyroid Transcription Factor 1 (TTF1) - Method 4
Ventana reaction buffer (950-300)
Ventana CC1 64mins
Ventana DAB
Ventana OptiView Kit (760-700) Prediluted
Participant scored 20/20 (UK NEQAS Slide) and 19/20 (In House slide) using this method.
Primary Antibody:
Automation:
Method:
Main Buffer:
HMAR:
Ventana Benchmark ULTRA
Ventana Optiview
EAR:
Chromogen:
Detection:
Ventana 790-4509 (454) , 40 Mins, RT ºC Prediluted
p63 - Method 1
Ventana reaction buffer (950-300)
Ventana CC1 64mins, PH: 9
NOT APPLICABLE
Ventana DAB, RT ºC., Time 1: 8 Mins
Ventana OptiView Kit (760-700) , 16 Mins, RT ºC Prediluted
BEST METHODS - Secondary Antibody
A selection from just a few of the best methods employed by participants
Participant scored 20/20 (UK NEQAS Slide) and 20/20 (In House slide) using this method.
Primary Antibody:
Automation:
Method:
Main Buffer:
HMAR:
Dako Omnis
Dako FLEX kit
EAR:
Chromogen:
Detection:
Dako IR662 RTU FLEX Link (DAK-p63) , 20 Mins, 32 ºC Prediluted
p63 - Method 2
Dako FLEX wash buffer
Dako Omnis, PH: 9
Dako FLEX DAB, 32 ºC., Time 1: 5 Mins
Dako EnVision FLEX ( K8000/10) , 20 Mins, 32 ºC
© Copyright UK NEQAS ICC & ISH - Not for publication without written permission
10

Run 119 GENERAL PATHOLOGY Module
Participant scored 20/20 (UK NEQAS Slide) and 19/20 (In House slide) using this method.
Primary Antibody:
Automation:
Method:
Main Buffer:
HMAR:
Ventana Benchmark ULTRA
Ventana Optiview
EAR:
Chromogen:
Detection:
Dako M7317 (DAK-p63) , 32 Mins, 36 ºC Dilution 1: 100
p63 - Method 3
Ventana reaction buffer (950-300)
Ventana CC1 32mins, Buffer: Cell Conditioner 1 (CC1), PH: 8
NOT APPLICABLE
AS PER KIT, 36 ºC., Time 1: 8 Mins
Ventana OptiView (760-700) + Amp. (7/860-099) , 8 Mins, 36 ºC Prediluted
Participant scored 20/20 (UK NEQAS Slide) and 18/20 (In House slide) using this method.
Primary Antibody:
Automation:
Method:
Main Buffer:
HMAR:
Ventana Benchmark XT
Ventana Optiview
EAR:
Chromogen:
Detection:
Leica/Novocastra NCL-L-p63 (7JUL) Dilution 1: 50
p63 - Method 4
AS PER KIT
Ventana CC1 standard
NOT APPLICABLE
AS PER KIT
AS PER KIT
© Copyright UK NEQAS ICC & ISH - Not for publication without written permission
11

The Breast Hormone Receptor Module Run 119
Antigen Assessed: Progesterone Receptor (PR)
Tissue Sections circulated: Composite slide consisting of 3 breast carcinomas with different levels of receptor expression and normal tonsil.
Number of Registered Participants: 263
Number of Participants This Run 255 (97%)
Score STAINING PATTERN
0 Slide not returned by participant.
1 or 2 Unacceptable: E.g. False positive / false negative / non-specific or inappropriate staining / lack of staining
Clinically Unacceptable.
3 Borderline Acceptable: Staining weaker than expected / background staining / weak/strong counterstain, Clinically still readable but technical improvements can be made
4 or 5 Acceptable: Demonstration of the expected proportion of nuclei stained in the invasive tumours, with roughly the expected staining intensity.
Marks are also deducted when correct clinical interpretation of staining may be hindered due to factors such as: - Excessive cytoplasmic or diffuse nuclear staining
- Excessively strong or weak haematoxylin counterstain
- Excessive antigen retrieval resulting in morphological damage - Poor quality/inadequate choice of in-house control tissue ( poor/inadequate fixation, damaged cell morphology, over retrieval etc.)
Suzanne Parry and Jamie Hughes
Circulated Tissue
The table below shows the staining characteristics of the tissue sections circulated during Run 119. This composed of three invasive ductal carcinomas (IDCs) with differing levels of receptor expression along with a section of tonsil. The staining of the breast tumours were characterised using the Leica PgR (clone 16) and Dako PgR 1294.
General Guideline Used in The Assessment of slides: In-House Tissue Recommendations:
© UK NEQAS ICC & ISH. No part of this document can be copied or used without prior written consent
Sections %
Positivity
Expected Staining Intensity
Allred / Quick Score
A. IDC >95% High 8
B. IDC 11-33% Mid 4 (the expression level varied depending on the serial
section received)
C. IDC 0% Negative 0
E. Tonsil ≤ 3% Weak to Medium 0 (Negative)
Participants in-house control tissue MUST consist of composite breast tissue placed onto a single slide (cell line controls are an acceptable alternative). Commercial kit/assay controls are not accepted as the participants in-house control, and therefore will not be assessed.
The required composite control should consist of the following samples:
1. >80% tumour positivity with high intensity (Allred/Quick score 7-8)
2. 11-66% tumour positivity with moderate intensity (Allred/Quick score 3-6)
3. Negative tumour, ideally with normal positively stained glands (Allred/Quick score ‘0’)
Participants NOT using a composite control are scored a 'borderline' pass (scores10-12/20).
Introduction
Expression of the hormone receptors, oestrogen receptor-alpha (ER-α) and progesterone receptor (PR, types A and B) in breast epithelial cells is important in the development and function of the normal breast (Anderson, 2002). They also play a key-role in proliferative and neoplastic diseases of the breast.
When examined by immunocytochemical staining, approximately 75% of primary breast cancers express ER-α, and of those approximately 50% co-express PR. Hormone receptor status is a good predictor of response to anti- oestrogen based treatments such as Tamoxifen and
aromatase-inhibitors (Fisher et al., 1989). PR expression is under the control of ER-α, and because of this it has been proposed that PR expression in a tumour indicates the presence of functional ER-α; moreover, it potentially defines a subpopulation of patients with superior response to tamoxifen; conversely, there is evidence that ER-α positive tumours that are PR negative are best treated with aromatase-inhibitors in preference to the ER-antagonists. Finally, PR can be useful in specific clinical situations to predict response to ER-antagonists (Ciocca and Elledge, 2000). Therefore, accurate staining protocols and validated staining protocols are vital to avoid false ER and/or PR staining (Rhodes et al., 2001; Ibrahim et al., 2008), which can have a direct impact on patient treatment.
Please Note: Multiple tissue blocks are compiled from the same cases, however, there may on occasion be variability in staining from the ‘Allred / Quick score’ shown above. This is taken into consideration when scoring participants slides and also noted prior to assessments when staining every 50th sample for quality control purposes.
12

The Breast Hormone Receptor Module Run 119
Choice of Tissue for Assessments
This assessment consisted of three invasive breast tumours of varying PR expression levels (samples A-C). A tonsil (sample D) was also included and used as a further negative control to help gauge the specificity of the test.
NEQAS tissue samples were tested by staining every 50th section from the relevant tissue blocks using the Leica 1A6. clone. This made sure that any heterogeneity in the tissue samples did not result in a participant being penalised.
It should be noted that the tonsil showed staining in up to 3% of cells. This was mainly seen within the germinal centre lymphocytes, but also in the epithelial cells.
Features of Optimal Immunostaining (Figures 1-6 & 9) • Staining of the expected proportion of invasive tumour nuclei with the anticipated staining intensity
• Intense nuclear staining of the appropriate distribution in normal glands
• Cytoplasmic staining not excessive
• No background staining of connective tissues or inappropriately localised staining
Features of Suboptimal Immunostaining (Figures 7, 8 &10) • False positive/negative staining • Relatively weak nuclear staining of the receptor positive tumours
• Excessive cytoplasmic staining
• Excessive background staining of connective tissue elements
• Inappropriate staining of some cells e.g. lymphocytes, fibroblasts
NEQAS Section Assessment Results
255 laboratories submitted their slides for the PR assessment. The pass rates are slightly lower than the previous PR assessment (Run 114), but in keeping with the pass rates seen over previous runs.
Please see table below for breakdown of the PR results on the NEQAS material over the last 3 UK NEQAS ICC assessments:
The borderline and failed marks for this assessment were mostly due to weak staining, particularly in the mid-expressing tumour. A small number of laboratories failed due to inappropriate false-positive staining in the negative tumour. Excessive staining was also seen in the high-expresser and mid-expressing tumour in some of these slides. It was clear when looking at some of the protocols that the antigen retrieval time was excessive, and therefore featuring inappropriate staining.
In-House Tissue Assessment Results
Apart from 2 participants, all laboratories also submitted their in-house controls for assessment. Overall these showed a lower acceptable pass rate of 70% (N=178) compared to the NEQAS sections. The in-house samples showed a higher percentage of borderline passes, 28% (N=71) compared to the NEQAS borderline pass rate. Only 4 laboratories (2%) failed
on their in-house material. Many of the borderline passes were not due to poor staining. Instead participants lost marks due to not providing the required in-house material consisting of a high-expresser, mid-expresser and a negative PR tumour (as outlined in the in-house recommendations section of this article).
Methodologies
The most popular antibody was the Ventana 1E2 clone, used by 39% (N=99) of participants and showed an acceptable pass rate of 80%. The second most popular clone was Leica PgR Clone 16, used by 17% (N=45), and showed an acceptable pass rate of 97%. The third most popular clone was the Dako PgR 636 clone, used by 16% (N=41) and showed an acceptable pass rates of 78%.
The Ventana 1E2 clone is a pre-diluted antibody, and was only seen at the Run 119 assessment to be used on the Ventana automated platforms, for which the antibody was validated. While both the Dako PgR 636 and Leica 16 clones were also originally validated by the vendors for use on their automated platforms, these antibodies are known to also work well on other platforms. Many laboratories continue to use the antibody which was originally introduced for use on the same company automated platform, and it is important that laboratories follow the guidance provided in the datasheet accompanying the antibody for recommended protocol, particularly the antigen retrieval. Regardless of the method used, laboratories must ensure validation/verification is carried out using appropriate controls and clinical samples with known reactivity.
References
1. Anderson E. The role of oestrogen and progesterone receptors in human mammary development and tumorigenesis. Breast Cancer Res. 2002; 4:197-
201. 2. Ciocca DR and Elledge R. Molecular markers for predicting response to
tamoxifen in breast cancer patients. Endocrine. 2000;13: 1-10. 3. Fisher B, Costantino J, Redmond C, Poisson R, Bowman D, Couture J,
Dimitrov NV, Wolmark N, Wickerham DL, Fisher ER, et al. (1989) A randomized clinical trial evaluating tamoxifen in the treatment of patients with node-negative breast cancer who have estrogen receptor-positive tumors. N Engl J Med 1989: 479-484.
4. Ibrahim M, Dodson A, Barnett S, Fish D, Jasani B, Miller K. (2008) Potential for false-positive staining with a rabbit monoclonal antibody to progesterone receptor (SP2): findings of the UK National External Quality Assessment Scheme for Immunocytochemistry and FISH highlight the need for correct validation of antibodies on introduction to the laboratory. Am J Clin Pathol. 129:398-409.
5. Rhodes A, Jasani B, Balaton AJ, Barnes DM, Anderson E, Bobrow LG, Miller KD (2001). Study of inter-laboratory reliability and reproducibility of estrogen and progesterone receptor assays in Europe. Documentation of poor reliability and identification of insufficient microwave antigen retrieval time as a major contributory element of unreliable assays. Am J Clin Pathol. 2001 Jan;115(1):44-58.
Bibliography
1. Davies C, Godwin J, Gray R et al., (2011) Relevance of breast cancer hormone receptors and other factors to the efficacy of adjuvant tamoxifen: patient-level meta-analysis of randomised trials. The Lancet 378: 771-784.
2. Jennet M. Harvey, Gary M. Clark, C. Kent Osborne, and D. Craig Allred (1999) Estrogen Receptor Status by Immunohistochemistry Is Superior to the Ligand-Binding Assay for Predicting Response to Adjuvant Endocrine Therapy in Breast Cancer J Clin Oncol 17:1474-1481.
3. Robin Leake, Diana Barnes, Sarah Pinder, Ian Ellis, Liz Anderson, Tom Anderson, Ruth Adamson, Tony Rhodes, Keith Miller and Rosemary Walker (2000) J. Clin. Pathol. 2000: 634-635.
Acknowledgments
We would like to thank Dako, Roche and Leica for agreeing to stain the UK NEQAS ‘Gold standard’ slides with their respective assays.
PR NEQAS Pass Rates :
Run 112 Run 119 Run 114
Acceptable 88%(N=242) 81%(N=207) 85%(N=221)
Borderline 8%(N=21) 13%(N=34) 10%(N=25)
Unacceptable 4%(N=10) 6%(N=14) 5%(N=14)
© UK NEQAS ICC & ISH. No part of this document can be copied or used without prior written consent
13

RUN 119 BREAST STEROID HORMONE RECEPTOR Module
Selected Images showing Optimal and Sub-optimal immunostaining
Fig 2. Expected level of PR staining in the UK NEQAS high expressing tumour. Similarly to
Figure 1, the staining is seen in over 95% of neoplastic cells with varying intensity; many
showing moderate to strong expression. Stained with the Dako RTU PR 1294 on the Omnis
platform.
Fig 1. Optimal demonstration of PR in the UK NEQAS high expressing tumour. Over 95% of
neoplastic cells are staining, with mostly moderate to strong intensity. Stained using the
Leica/NCL-L-PGR-312 (16) (A) antibody on the Bond III with ER1 retrieval for 30 minutes.
Fig 3. Optimal demonstration of PR in the UK NEQAS higher expressing tumour, showing the
expected level of staining. Stained with the 1E2 (A&B) pre-diluted antibody on the Benchmark
XT, CC1 retrieval for 20 minutes and Ultraview detection.
Fig 4. Unacceptable PR staining of the UK NEQAS high expressing tumour. The staining is
weak with fewer positive tumour cells staining than expected. The same method was used as
the image in Fig 1, except shorter antigen retrieval time (compare to Figs 1-3).
Fig 5. Optimal level of PR staining in the UK NEQAS low expressing tumour. As expected, less
than 10% of tumour cells are staining with moderate to high intensity. (Same protocol as Fig 1).
Fig 6. Expected level of PR staining in the UK NEQAS low expressing tumour. The staining is
strong in less than 10% of neoplastic cells. (Same protocol as Fig 2).
© Copyright UK NEQAS ICC & ISH - Not for publication without written permission
14
RUN 119 BREAST STEROID HORMONE RECEPTOR Module
Selected Images showing Optimal and Sub-optimal {@stainingtext}
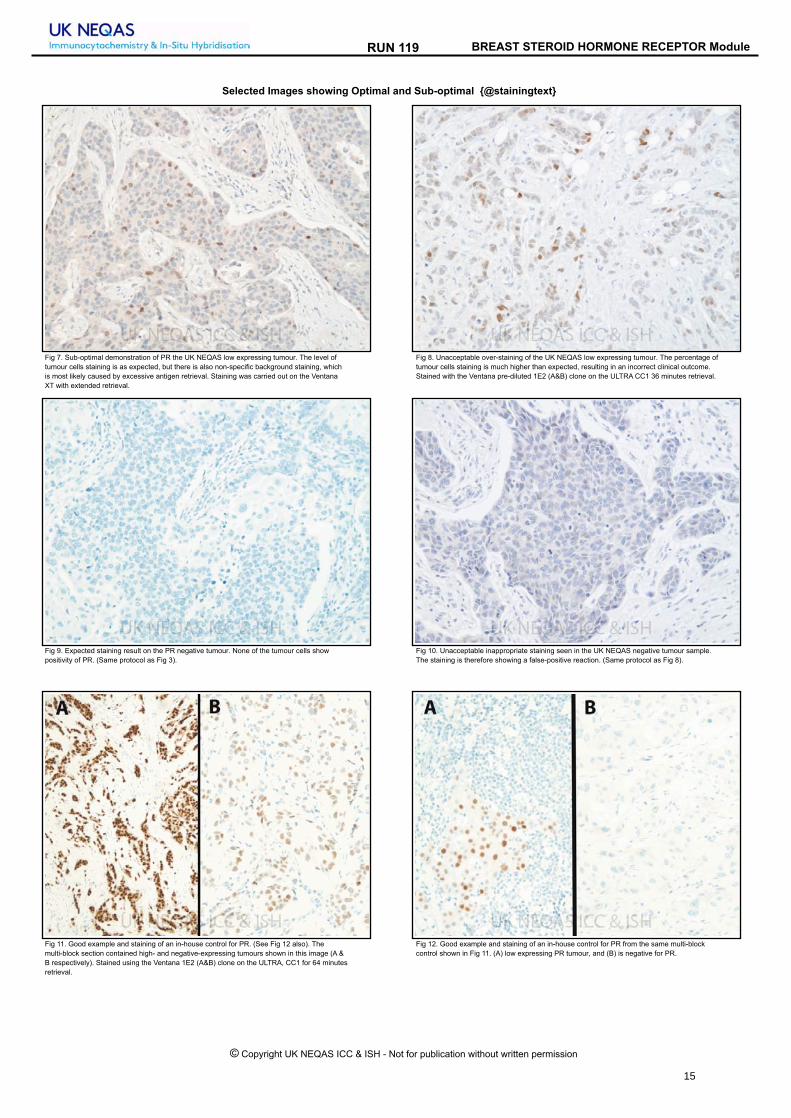
Fig 8. Unacceptable over-staining of the UK NEQAS low expressing tumour. The percentage of
tumour cells staining is much higher than expected, resulting in an incorrect clinical outcome.
Stained with the Ventana pre-diluted 1E2 (A&B) clone on the ULTRA CC1 36 minutes retrieval.
Fig 7. Sub-optimal demonstration of PR the UK NEQAS low expressing tumour. The level of
tumour cells staining is as expected, but there is also non-specific background staining, which
is most likely caused by excessive antigen retrieval. Staining was carried out on the Ventana
XT with extended retrieval.
Fig 10. Unacceptable inappropriate staining seen in the UK NEQAS negative tumour sample.
The staining is therefore showing a false-positive reaction. (Same protocol as Fig 8).
Fig 9. Expected staining result on the PR negative tumour. None of the tumour cells show
positivity of PR. (Same protocol as Fig 3).
Fig 12. Good example and staining of an in-house control for PR from the same multi-block
control shown in Fig 11. (A) low expressing PR tumour, and (B) is negative for PR.
Fig 11. Good example and staining of an in-house control for PR. (See Fig 12 also). The
multi-block section contained high- and negative-expressing tumours shown in this image (A &
B respectively). Stained using the Ventana 1E2 (A&B) clone on the ULTRA, CC1 for 64 minutes
retrieval.
© Copyright UK NEQAS ICC & ISH - Not for publication without written permission
15

Run 119 BREAST STEROID HORMONE RECEPTOR Module
0
20
40
60
80
100
4 5 6 7 8 9 10 11 12 13 14 15 16 17 18 19 20
Scores
no
. o
f re
turn
s
RUN 119E Progesterone on NEQAS Sections
ALL PARTICIPANTS
Individual
Scores
4 = 0 (0%)
5 = 0 (0%)
6 = 0 (0%)
7 = 0 (0%)
8 = 10 (4%)
9 = 4 (2%)
10 = 10 (4%)
11 = 7 (3%)
12 = 17 (7%)
13 = 23 (9%)
14 = 23 (9%)
15 = 12 (5%)
16 = 93 (37%)
17 = 33 (13%)
18 = 15 (6%)
19 = 4 (2%)
20 = 2 (1%)0
10
20
30
40
50
60
4 5 6 7 8 9 10 11 12 13 14 15 16 17 18 19 20
Scores
no
. o
f re
turn
s
RUN 119E Progesterone on NEQAS Sections
UK PARTICIPANTS
Individual
Scores
4 = 0 (0%)
5 = 0 (0%)
6 = 0 (0%)
7 = 0 (0%)
8 = 2 (1%)
9 = 3 (2%)
10 = 2 (1%)
11 = 2 (1%)
12 = 7 (5%)
13 = 14 (10%)
14 = 11 (8%)
15 = 6 (4%)
16 = 53 (38%)
17 = 22 (16%)
18 = 12 (9%)
19 = 2 (1%)
20 = 2 (1%)
GRAPHICAL REPRESENTATION OF PASS RATES
Summary
16 - 20 = 147 (58%)
13 - 15 = 58 (23%)
10 - 12 = 34 (13%)
0 - 9 = 14 (6%)
Median = 14.00
Summary
16 - 20 = 91 (66%)
13 - 15 = 31 (22%)
10 - 12 = 11 (8%)
0 - 9 = 5 (4%)
Median = 14.00
0
20
40
60
80
100
4 5 6 7 8 9 10 11 12 13 14 15 16 17 18 19 20
Scores
no
. o
f re
turn
s
RUN 119F Progesterone on in-house Sections
ALL PARTICIPANTS
Individual
Scores
4 = 0 (0%)
5 = 0 (0%)
6 = 0 (0%)
7 = 0 (0%)
8 = 1 (0%)
9 = 3 (1%)
10 = 1 (0%)
11 = 8 (3%)
12 = 62 (25%)
13 = 13 (5%)
14 = 21 (8%)
15 = 23 (9%)
16 = 88 (35%)
17 = 21 (8%)
18 = 7 (3%)
19 = 2 (1%)
20 = 1 (0%)
0
10
20
30
40
50
4 5 6 7 8 9 10 11 12 13 14 15 16 17 18 19 20
Scores
no
. o
f re
turn
s
RUN 119F Progesterone on in-house Sections
UK PARTICIPANTS
Individual
Scores
4 = 0 (0%)
5 = 0 (0%)
6 = 0 (0%)
7 = 0 (0%)
8 = 0 (0%)
9 = 1 (1%)
10 = 0 (0%)
11 = 1 (1%)
12 = 30 (22%)
13 = 9 (7%)
14 = 14 (10%)
15 = 11 (8%)
16 = 49 (36%)
17 = 16 (12%)
18 = 4 (3%)
19 = 2 (1%)
20 = 1 (1%)
Summary
16 - 20 = 119 (47%)
13 - 15 = 57 (23%)
10 - 12 = 71 (28%)
0 - 9 = 4 (2%)
Median = 14.00
Summary
16 - 20 = 72 (52%)
13 - 15 = 34 (25%)
10 - 12 = 31 (22%)
0 - 9 = 1 (1%)
Median = 15.00
© Copyright UK NEQAS ICC & ISH - Not for publication without written permission
16

Run 119 BREAST STEROID HORMONE RECEPTOR Module
The following tables record the number of participants (N) using each primary antibody and the percentage (%) of these
participants achieving acceptable staining (a score >12/20) on UK NEQAS sections.
ANTIBODIES AND OTHER TECHNICAL PARAMETERS EMPLOYED BY PARTICIPANTS IN THE
BREAST STEROID HORMONE RECEPTOR MODULE
Antibody Details N %
Primary Antibody : Progesterone
28 68Dako M3569 (PgR 636) (A&B)
1 0Dako K1904 (PgR 1294 (b))
2 100Novocastra NCL-PGR (1A6) (A&B)
11 100Novocastra NCL-PGR-312 (16) (A)
33 94Novocastra NCL-L-PGR-312 (16) (A)
1 0Ventana 760 2547 PgR (1A6) (A&B)
34 82Ventana 790-4296 (1E2) (A&B)
7 100Novocastra NCL-L-PGR-AB (16+SAN27) (A&B)
2 100Novocastra RTU-PGR-312 (16) (A)
12 83Novocastra PA0312 (16) (A)
2 50Novocastra NCL-L-PGR/2 (1A6) (A&B)
4 100Novocastra NCL-PGR-AB (16+SAN27)
65 77Ventana 790-2223 (1E2) (A&B)
1 100Dako N1630 RTU (PgR 636) (A&B)
9 78Dako IR068 (PgR 636) (A&B)
3 67Dako IS068 (PgR 636) (A&B)
3 67Ventana 790-4324 (SP2) (A&B)
1 0Cell Marque 323R-16 (A)
19 84Other
2 100Dako M3568 (PgR 1294)
Progesterone
N %Dako Autostainer 2 100Dako Autostainer Link 48 18 89Dako Autostainer Plus Link 4 50Dako Omnis 10 90LabVision Autostainer 3 67Leica Bond Max 17 100Leica Bond-III 48 92None (Manual) 3 67Ventana Benchmark GX 8 63Ventana Benchmark ULTRA 102 78Ventana Benchmark XT 34 68
Automation
Breast Steroid Hormone Receptor Run: 119 Breast Steroid Hormone Receptor Run: 119
Progesterone
N %AS PER KIT 8 88NOT APPLICABLE 166 82Ventana Protease 1 (760-2018) 1 100
Enzyme Mediated RetrievalProgesterone
N %Biocare Decloaking Chamber 1 100Dako Omnis 9 100Dako PTLink 22 77Lab vision PT Module 2 50Leica ER1 20 mins 12 83Leica ER1 30 mins 15 100Leica ER1 40 mins 3 67Leica ER2 10 mins 2 100Leica ER2 20 mins 31 97Leica ER2 30 mins 3 100Microwave 2 100Pressure Cooker 2 100Pressure Cooker in Microwave Oven 1 100Ventana CC1 16mins 2 0Ventana CC1 20mins 1 100Ventana CC1 24mins 1 100Ventana CC1 32mins 6 67Ventana CC1 36mins 18 67Ventana CC1 40mins 3 100Ventana CC1 44mins 1 100Ventana CC1 48mins 3 67Ventana CC1 52mins 8 88Ventana CC1 56mins 1 100Ventana CC1 64mins 49 78Ventana CC1 72mins 1 0Ventana CC1 76mins 3 67Ventana CC1 8mins 1 0Ventana CC1 92mins 1 100Ventana CC1 extended 3 33Ventana CC1 mild 13 69Ventana CC1 standard 27 85Water bath 95-98 OC 1 0
Heat Mediated Retrieval
Breast Steroid Hormone Receptor Run: 119 Breast Steroid Hormone Receptor Run: 119
© Copyright UK NEQAS ICC & ISH - Not for publication without written permission
17

Run 119 BREAST STEROID HORMONE RECEPTOR Module
Progesterone
N %AS PER KIT 18 83BioGenex liquid DBA (HK-124-7K) 1 100Dako DAB K3468 1 0DAKO DAB+ 1 100Dako EnVision Plus kits 3 33Dako FLEX DAB 23 91Dako REAL EnVision K5007 DAB 4 75Dako REAL K5001 DAB 1 100Leica Bond Polymer Refine kit (DS9800) 60 93Other 2 100Ventana DAB 14 71Ventana Enhanced Alk. Phos. Red Detection Kit 1 0Ventana iview 3 67Ventana Ultraview DAB 117 76
ChromogenProgesterone
N %AS PER KIT 12 67BioGenex SS Polymer (QD 430-XAKE) 1 100Dako EnVision FLEX ( K8000/10) 7 100Dako EnVision FLEX+ ( K8002/12) 16 75Dako Envision HRP/DAB ( K5007) 2 100Dako Envision+ HRP mouse K4004/5/6/7 2 100Dako REAL HRP/DAB (K5001 ) 1 100LabVision UltraVision LP HRP (TL 125 HLJ) 1 0Leica Bond Polymer Refine (DS9800) 60 93NOT APPLICABLE 2 100Other 3 100Ventana iView system (760-091) 2 100Ventana OptiView (760-700) + Amp. (7/860-099) 1 100Ventana OptiView Kit (760-700) 17 71Ventana UltraView Kit (760-500) 117 76
Detection
Breast Steroid Hormone Receptor Run: 119 Breast Steroid Hormone Receptor Run: 119
Participant scored 20/20 (UK NEQAS Slide) and 18/20 (In House slide) using this method.
Primary Antibody:
Automation:
Method:
Main Buffer:
HMAR:
Leica Bond-III
Leica BondMAx Refine KIT
EAR:
Chromogen:
Detection:
Novocastra NCL-L-PGR-312 (16) (A) , 15 Mins, ambient ºC Dilution 1: 200
Progesterone - Method 1
Bond Wash Buffer (AR9590)
Leica ER1 30 mins
NOT APPLICABLE
Leica Bond Polymer Refine kit (DS9800)
Leica Bond Polymer Refine (DS9800)
BEST METHODS
A selection from just a few of the best methods employed by participants
Participant scored 18/20 (UK NEQAS Slide) and 19/20 (In House slide) using this method.
Primary Antibody:
Automation:
Method:
Main Buffer:
HMAR:
Ventana Benchmark XT
Ventana UltraView DAB
EAR:
Chromogen:
Detection:
Ventana 790-2223 (1E2) (A&B)
Progesterone - Method 2
Ventana reaction buffer (950-300)
Ventana CC1 20mins
Ventana Ultraview DAB
Ventana UltraView Kit (760-500)
Participant scored 19/20 (UK NEQAS Slide) and 17/20 (In House slide) using this method.
Primary Antibody:
Automation:
Method:
Main Buffer:
HMAR:
Ventana Benchmark XT
Ventana UltraView DAB
EAR:
Chromogen:
Detection:
Novocastra NCL-L-PGR-312 (16) (A) , 32 Mins, 37 ºC Dilution 1: 50
Progesterone - Method 3
Ventana reaction buffer (950-300)
Ventana CC1 standard
NOT APPLICABLE
Ventana Ultraview DAB
Ventana UltraView Kit (760-500)
© Copyright UK NEQAS ICC & ISH - Not for publication without written permission
18

Run 119 BREAST STEROID HORMONE RECEPTOR Module
Participant scored 18/20 (UK NEQAS Slide) and 16/20 (In House slide) using this method.
Primary Antibody:
Automation:
Method:
Main Buffer:
HMAR:
Leica Bond Max
Leica BondMAx Refine KIT
EAR:
Chromogen:
Detection:
Dako M3569 (PgR 636) (A&B) , 30 Mins, room ºC Dilution 1: 200
Progesterone - Method 4
Bond Wash Buffer (AR9590)
Leica ER2 20 mins
Leica Bond Polymer Refine kit (DS9800), room ºC., Time 1: 5 Mins
Leica Bond Polymer Refine (DS9800) , 8 Mins, room ºC
© Copyright UK NEQAS ICC & ISH - Not for publication without written permission
19

The Breast HER2 ICC Module Run 119
Antigen Assessed: HER2
Sections Circulated: 4 breast cancer cell lines of varying levels of HER2 expression.
Number of Registered Participants: 249
Number of Participants this Run 232 (93%)
Cell line Score Acceptable Level/s of Staining During Assessments
Description of Staining Pattern Used By the Assessors
SK-BR-3 3+ 3+ only The 3+ cell line has a wide threshold of complete membrane staining showing strong staining. Only this level of membrane staining is deemed acceptable for this cell line.
MDA-MB-453 2+ 2+ or 1+/2+ or 2+/3+ or 2+/1+ or 3+/2+
i) 1+/2+ or 2+/1+: Staining is slightly weaker than expected with membrane showing more 1+ compared to 2+ (1+/2+) or 2+ membrane staining is present but also showing 1+ staining (2+/1+). ii) 2+/3+ or 3+/2+: Staining is slightly weaker than expected with membrane showing more 2+ compared to 3+ (2+/3+) or 3+ membrane staining is present but also showing 2+ staining (3+/2+).
MDA-MB-175 1+ 1+ or 0/1+ or 1+/0 i) 0/1+: Staining is more towards the weaker end of 1+ staining but still acceptable. ii) 1+/0: Staining is more towards the weaker end of 1+ staining but still acceptable.
MDA-MB-231 Negative 0 or 0/1+ or 1+/0 0/1+ or 1+/0 = Cells are starting to show very weak membrane staining
‘U’/Uninterpretable Scores
Assessors may also give a score of 'U' which indicates that the cell lines were 'uninterpretable’ due to the reasons set out below. Borderline Pass: A score of U/x e.g. U/3+ or U/2+ or U/1+ or U/0 indicates a borderline uninterpretable scores indicating that the staining is just about readable and further improvements are required.
Amy Newman and Keith Miller
Specific Guidelines Used in The Assessment of Slides: The immunohistochemical results were evaluated by UK NEQAS assessors scoring independently using an adapted method initially devised by the Clinical Trials Assay. Due to the nature of cell lines, overall percentage staining criteria can not be accurately applied when scoring cell lines. Communication with Leica Microsystems, with whom UK NEQAS ICC & ISH developed the cell lines, indicate that the expected level of membrane staining for a given cell line may range from 30-90% from the viable cell line population. For this reason when cutting sections, every 50th section is stained as a reference point to gauge the expected level of staining throughout the cell block/s.
© UK NEQAS ICC & ISH. No part of this document can be copied or used without prior written consent
The table below demonstrates the staining patterns looked for in cell lines and in-house tissue sections during assessments.
Cell line position
(slide label end)
Assessment of Cell Line Staining Pattern Assessment of In-House Tissue Sections* *The ASCO/CAP guidelines by Wolff et al., (2013) are not currently
used for scoring in-house controls
A: Negative No staining in the ‘0’ control cell line No staining in the ‘0’ control cell line
B: 1+ Faint barely perceptible incomplete staining Faint barely perceptible incomplete membrane staining in >10% of cells
C: 2+ Weak to moderate complete cell membrane staining
Weak to moderate complete cell membrane staining in >10% of tumour cells
D: 3+ Strong complete membrane staining Strong complete cell membrane staining in >30% of tumour cells
Validation of Distributed UK NEQAS ICC & ISH Cell Lines
IHC Validation using: Leica Oracle, Ventana Pathway 4B5 and Dako HercepTest ISH Validation using: FISH (Abbott Vysis) and DDISH (Roche)
Updated Assessment and Scoring Procedure
UK NEQAS Specific Membrane Scoring Algorithm: UK NEQAS ICC & ISH devised an EQA specific algorithm for scoring the cell lines so as to provide participants with additional technical feedback. As well as taking into account the expected range of cell line membrane staining (30-90% see above), the acceptable staining levels of each of the cell lines are described as follows:
Table below illustrates the expected level of staining for each of the circulated breast carcinoma cell lines along with the UK NEQAS ICC scoring criteria used in assessments ONLY.
20

The Breast HER2 ICC Module Run 119
Introduction
HER2 immunohistochemistry has been routinely used as a predictive marker in breast cancer for more than 10 years. Patients with HER2 positive tumours generally have a poor overall prognosis. However, patients with HER2 positve metastatic disease showed an improved rate of survival when the humanized monoclonal antibody Trastuzumab (Herceptin) was given alone or added with chemotherapy treatment (Slamon et al., 1998). Herceptin, in the metastatic setting was made available in the UK in 2000 by the UK National Institute for Clinical Excellence (NICE). In 2005, Herceptin in the adjuvant setting was also shown to be effective in primary breast cancers by reducing the risk of recurrence and mortality (see articles by Wolff et al., (2006) and Walker et al., (2008), and in 2006 NICE approved primary breast screening for HER2. In the UK alone this has resulted in approximately 40,000 breast cancers per year being tested for HER2. With so many more cases now being tested worldwide, it is imperative that correct protocols and methodologies are followed and adhered to. The UK NEQAS HER2 IHC module assesses the technical quality of staining achieved by laboratories and provides feedback to laboratories to help improve the analytical phase of patient diagnosis. Recommended HER2 testing guidelines are: The ASCO/CAP guidelines by Wolff et al.(2007), the UK guidelines by Walker et al., (2008), the ASCO/CAP guidelines by Wolff et al., 2013. , and the updated UK guidelines by Rakha et al., (2015). These publications provide invaluable guidelines covering interpretation, tissue fixation and antibody validation. The articles by Walker et. al. and Rhaka et al. also provide guidelines on the minimum number of tests per year that labs should be carrying out in order to provide a robust HER2 IHC service. The recommendations are 250 tests for HER2 IHC and 100 tests for HER2 ISH. Participants who continue to have difficulty in producing acceptable staining results should be aware that the members of staff at UK NEQAS ICC are always willing to assist any laboratory struggling to meet the required standard of HER2 immunostaining, and would be happy to receive requests for assistance via e-mail in the first instance (see front of journal or the UK NEQAS ICC & ISH website for contact details).
In-House Control Tissue Recommendations
Correct choice of in-house control tissue and good morphological preservation is paramount to gauge the sensitivity of the HER2 test, which can have an impact on clinical interpretation. UK NEQAS ICC & ISH therefore recommend the following: In-house control tissue (or cell lines) must include 3+, 2+ and 1+/0 invasive breast cancer cases. However, it has become
quite apparent that as patient tumour size and respective biopsies become smaller laboratories may be having difficulty
finding appropriate invasive control material. It is therefore acceptable, if laboratories are having problems in finding appropriate invasive control material, to submit DCIS tissue showing differing levels of membrane staining as an acceptable alternative. Laboratories must indicate on their datasheet which component they have scored otherwise the invasive component (if present) will be assessed.
Assessment Summary: Pass rates for the assessment are summarised in the table below:
The predominant issue observed with this run, was weak staining in the participants 1+ NEQAS cell line compared with the Gold Standard. Assessors agreed that if any membrane staining (>1 membrane) showed HER2 staining, then participants would not be marked down for this and their 1+ core was assessed as a 0/1+. However, if weaker staining was also noted in the 2+ cell line core, participants were marked down accordingly. As with previous runs the most popular antibody was the Ventana 4B5, used by 70% (n=163) of participants and showed an overall acceptable pass rate of 80%. 10 laboratories employed the Dako HercepTest, with 60% of participants achieving an acceptable pass rate. 14 laboratories are using the Leica Oracle assay kit with an acceptable pass rate of 71%. 24 laboratories used laboratory devised tests (LDTs), incorporating a variety of antibodies (most commonly Dako A0485), pre-treatment methods and staining platforms. These laboratories showed an acceptable pass rate of 30%. All data is based on the methodology information submitted by participants, but unfortunately not all methodology was provided by all participants.
© UK NEQAS ICC & ISH. No part of this document can be copied or used without prior written consent
Numerical Scoring Criteria
Once the team of assessors have assessed the membrane interpretation for each of the NEQAS samples, they will award a potential score out of 5 marks; based on the interpretability of the membrane staining and technical staining quality. An overall pass mark is then awarded by combining the four assessors scores to give scores out of 20. See table below:
Score and Interpretation
Interpretation
16-20/20: Excellent
Overall the staining is at the expected level for each of the samples.
13-15/20: Acceptable
Some slight technical issues noted by some of the assessors, but overall the staining is suitable for interpretation
10-12/20: Borderline
Overall the samples are borderline interpretable (still clinically relevant) indicating that technical improvements need to be made. Marks may have been deducted due to: Weaker/stronger staining than expected, cytoplasmic staining, morphological damage etc.
4-9/20: Unacceptable
Overall the samples are of unacceptable quality for clinical interpretation and technical improvements need to be made. Marks may have been deducted due to: False positive/negative membrane staining, excessive cytoplasmic staining, excessive morphological damage, staining of normal glands
Pass Rates Run 119: NEQAS In-House
Acceptable 72% (N=157) 62% (N=133) Borderline 20% (N=43) 31% (N=66) Unacceptable 8% (N=18) 7% (N=16)
21

The Breast HER2 ICC Module Run 119
References
1. Slamon D, Leyland-Jones B, Shak S, et al. Addition of Herceptin (humanised anti-HER2 antibody) to first line chemotherapy for (HER2+/MBC) markedly increases anticancer activity: a randomised, multinational controlled phase III trial. Proc ASCO 1998;17:98a.
2. Piccart-Gebhart MJ, Procter M, Leyland-Jones B, et al. Trastuzumab after adjuvant chemotherapy in HER2-positive breast cancer. N Engl J Med 353:1659-1672, 2005
3. Bartlett JM, Ibrahim M, Jasani B, et al. External quality assurance of HER2 FISH testing: results of a UK NEQAS pilot scheme. J Clin Pathol 2007 60(7):816-819.
4. Walker RA, Bartlett JM, Dowsett M, Ellis IO, Hanby AM, Jasani B, Miller K, Pinder SE. HER2 testing in the UK: further update to recommendations. J Clin Pathol. 2008 61(7):818-824.
5. Wolff AC, Hammond MEH, Schwartz JN, et al. American Society of Clinical Oncology/College of American Pathologists guideline recommendations for human epidermal growth factor receptor 2 testing in breast cancer. J Clin Oncol 2007;25:1–28.
6. Wolff AC, et al. Recommendations for Human Epidermal Growth Factor Receptor 2 Testing in Breast Cancer: American Society of Clinical Oncology/College of American Pathologists Clinical Practice Guideline Update. J Clin Pathol. 2013; 31 (31):3998-4013.
7. Rakha EA, et al. Updated UK rRecommendations for HER2 assessment in breast cancer. J Clin Pathol. 2015;68:93-99.
Acknowledgments
We would like to thank Dako, Ventana and Leica for agreeing to stain the UK NEQAS Breast HER2 ICC ‘Gold standard’ samples with their respective kits/assays.
© UK NEQAS ICC & ISH. No part of this document can be copied or used without prior written consent 22

RUN 119 BREAST HER2 ICC Module
Selected Images showing Optimal and Sub-optimal immunostaining
Figure 2: Weak staining in Core B (1+ cell line) on the NEQAS sample. Scored by assessors as
0 or 0/1+ due to barely present membrane staining as indicated by arrow. Method: Ventana
4B5 Pathway (16 mins, 37C); (Benchmark XT, CC1 32 mins, Ultraview).
Figure 1: Optimal staining in the 1+ NEQAS cell line. There is weak and delicate incomplete
membrane staining in some cells. Note: the stronger brush border (indicated by the arrow) is
NOT included in the scoring assessment. Method: Ventana 4B5 Pathway (16 mins);
(Benchmark ULTRA, CC1 36 mins; UltraView).
Figure 3: (A) Good example of the 2+ NEQAS distributed cell line. The staining is of moderate
intensity with complete membrane staining. Method: Dako HercepTest (PT Link + Autostainer).
(B) staining in the 2+ cell line is less intense but still acceptable. Method: As is Figure 2.
Figure 4: Excellent representation of a 2+ in-house HER2 breast control. There is moderate
intensity staining in >10% of tumour cells. Method: Ventana 4B5 Confirm (Benchmark ULTRA,
CC1 Mild, UltraView).
Figure 5: Good example of a 1+ in-house control showing weak, partial incomplete membrane
staining in tumour cells. Method: Biogenex (EP1045Y) (1:25 for 8 mins @ 37C); (BOND III;
ER1, 40’; Polymer Refine).
Figure 6: Excellent staining demonstrating 3+ in an in-house control. Method: Ventana 4B5
Confirm (12mins); (Benchmark ULTRA; CC1 36 mins; UltraView).
© Copyright UK NEQAS ICC & ISH - Not for publication without written permission
23

Run 119 BREAST HER2 ICC Module
0
5
10
15
20
25
30
35
40
45
4 5 6 7 8 9 10 11 12 13 14 15 16 17 18 19 20
Scores
no
. o
f re
turn
s
RUN 119E1 HER-2 on NEQAS Sections
ALL PARTICIPANTS
Individual
Scores
4 = 0 (0%)
5 = 1 (0%)
6 = 1 (0%)
7 = 1 (0%)
8 = 6 (3%)
9 = 9 (4%)
10 = 3 (1%)
11 = 11 (5%)
12 = 29 (13%)
13 = 27 (12%)
14 = 42 (19%)
15 = 33 (15%)
16 = 38 (17%)
17 = 12 (6%)
18 = 4 (2%)
19 = 1 (0%)
20 = 0 (0%)
GRAPHICAL REPRESENTATION OF PASS RATES
0
4
8
12
16
20
24
28
4 5 6 7 8 9 10 11 12 13 14 15 16 17 18 19 20
Scoresn
o. o
f re
turn
s
RUN 119E1 HER-2 on NEQAS Sections
UK PARTICIPANTS
Individual
Scores
4 = 0 (0%)
5 = 0 (0%)
6 = 0 (0%)
7 = 0 (0%)
8 = 0 (0%)
9 = 1 (1%)
10 = 0 (0%)
11 = 4 (5%)
12 = 5 (7%)
13 = 8 (11%)
14 = 27 (36%)
15 = 12 (16%)
16 = 11 (15%)
17 = 4 (5%)
18 = 1 (1%)
19 = 1 (1%)
20 = 0 (0%)
Summary
16 - 20 = 55 (25%)
13 - 15 = 102 (47%)
10 - 12 = 43 (20%)
0 - 9 = 18 (8%)
Median = 12.00
Summary
16 - 20 = 17 (23%)
13 - 15 = 47 (64%)
10 - 12 = 9 (12%)
0 - 9 = 1 (1%)
Median = 14.50
0
5
10
15
20
25
30
35
40
45
3 4 5 6 7 8 9 10 11 12 13 14 15 16 17 18 19 20
Scores
no
. o
f re
turn
s
RUN 119Fi HER-2 on in-house Sections
ALL PARTICIPANTS
Individual
Scores
3 = 0 (0%)
4 = 0 (0%)
5 = 0 (0%)
6 = 1 (0%)
7 = 1 (0%)
8 = 11 (5%)
9 = 3 (1%)
10 = 12 (6%)
11 = 21 (10%)
12 = 33 (15%)
13 = 17 (8%)
14 = 35 (16%)
15 = 31 (14%)
16 = 41 (19%)
17 = 7 (3%)
18 = 0 (0%)
19 = 1 (0%)
20 = 1 (0%)
Individual
Scores
3 = 0 (0%)
4 = 0 (0%)
5 = 0 (0%)
6 = 0 (0%)
7 = 0 (0%)
8 = 2 (3%)
9 = 2 (3%)
10 = 3 (4%)
11 = 5 (7%)
12 = 6 (8%)
13 = 3 (4%)
14 = 18 (25%)
15 = 17 (23%)
16 = 13 (18%)
17 = 4 (5%)
18 = 0 (0%)
19 = 0 (0%)
20 = 0 (0%)
0
4
8
12
16
20
3 4 5 6 7 8 9 10 11 12 13 14 15 16 17 18 19 20
Scores
no
. o
f re
turn
s
RUN 119Fi HER-2 on in-house Sections
UK PARTICIPANTS
Summary
16 - 20 = 50 (23%)
13 - 15 = 83 (39%)
10 - 12 = 66 (31%)
0 - 9 = 16 (7%)
Median = 12.50
Summary
16 - 20 = 50 (23%)
13 - 15 = 83 (39%)
10 - 12 = 66 (31%)
0 - 9 = 16 (7%)
Median = 12.50
© Copyright UK NEQAS ICC & ISH - Not for publication without written permission
24

Run 119 BREAST HER2 ICC Module
HER-2
N %Dako Autostainer 1 0
Dako Autostainer Link 48 10 60
Dako Autostainer Plus Link 3 67
Dako Omnis 1 100
LabVision Autostainer 1 0
Leica Bond Max 9 22
Leica Bond-III 16 69
None (Manual) 5 0
Ventana Benchmark GX 8 88
Ventana Benchmark ULTRA 105 84
Ventana Benchmark XT 51 69
Automation
ANTIBODIES AND OTHER TECHNICAL PARAMETERS EMPLOYED BY PARTICIPANTS IN THE BREAST HER2 ICC
MODULE
The following tables record the number of participants (N) using each primary antibody and the percentage (%) of these
participants achieving acceptable staining (Score >12/20) on UK NEQAS sections.
Primary Antibody N %
Dako HercepTest K5204 (poly) 2 0
Dako HercepTest K5205 (poly) 1 0
Dako HercepTest K5207 (poly) 1 0
Dako A0485 C-erB-2 (poly) 17 35
Cell Marque CMA 601 (CB11) 1 0
Ventana Pathway 790-100 (4B5) 6 83
Leica Oracle HER2 Bond IHC (CB11) 14 71
Dako Link HercepTest SK001 (poly) 6 100
BioGenex (EP1045Y) rb mono 1 0
Ventana Confirm 790-4493 (4B5) 40 73
Ventana Pathway 790-2991 (4B5) 117 82
Novocastra NCL-L-CB11 (CB11) 3 33
Other 2 0
Breast HER2 ICC Run: 119 Breast HER2 ICC Run: 119
HER-2
N %
Biocare Decloaking Chamber 1 0
Dako Omnis 1 100
Dako PTLink 12 67
Lab vision PT Module 2 0
Leica ER1 10 mins 1 0
Leica ER1 20 mins 7 71
Leica ER1 25 mins 11 64
Leica ER1 30 mins 1 0
Leica ER1 40 mins 1 0
Leica ER2 10 mins 1 0
Leica ER2 30 mins 1 0
Microwave 2 0
None 2 50
Other 2 50
Ventana CC1 16mins 2 100
Ventana CC1 20mins 1 100
Ventana CC1 24mins 2 100
Ventana CC1 32mins 14 71
Ventana CC1 36mins 56 86
Ventana CC1 40mins 1 0
Ventana CC1 48mins 1 0
Ventana CC1 52mins 3 100
Ventana CC1 56mins 4 50
Ventana CC1 64mins 9 89
Ventana CC1 76mins 1 0
Ventana CC1 8mins 1 0
Ventana CC1 mild 57 77
Ventana CC1 standard 10 80
Water bath 95-98 OC 2 0
Heat Mediated Retrieval
Breast HER2 ICC Run: 119 HER-2
N %
AS PER KIT 18 61
BioGenex SS Polymer (QD 420-YIKE) 1 0
Dako HerCep Test (K5204) 1 0
Dako EnVision FLEX ( K8000/10) 2 50
Dako EnVision FLEX+ ( K8002/12) 5 40
Dako Envision HRP/DAB ( K5007) 1 0
Dako HerCep Test Autor (SK001) 5 100
LabVision UltraVision LP HRP (TL 125 HLJ) 1 0
Leica Bond Polymer Refine (DS9800) 13 38
Other 1 0
Ventana iView system (760-091) 5 100
Ventana OptiView Kit (760-700) 11 73
Ventana UltraView Kit (760-500) 141 80
Detection
Breast HER2 ICC Run: 119
HER-2
N %AS PER KIT 11 73
NOT APPLICABLE 122 73
Ventana Protease 1 (760-2018) 1 100
Enzyme Retrieval
Breast HER2 ICC Run: 119HER-2
N %
AS PER KIT 30 70
BioGenex liquid DBA (HK-124-7K) 1 0
DAKO DAB+ 1 100
Dako DAB+ Liquid (K3468) 1 0
Dako FLEX DAB 10 60
Dako REAL EnVision K5007 DAB 4 0
Leica Bond Polymer Refine kit (DS9800) 12 42
Other 4 50
Ventana DAB 7 71
Ventana iview 3 100
Ventana Ultraview DAB 138 80
Chromogen
Breast HER2 ICC Run: 119
© Copyright UK NEQAS ICC & ISH - Not for publication without written permission
25

Run 119 BREAST HER2 ICC Module
Participant scored 17/20 (UK NEQAS Slide) and 16/20 (In House slide) using this method.
Primary Antibody:
Automation:
Method:
Main Buffer:
HMAR:
Ventana Benchmark ULTRA
Ventana UltraView DAB
EAR:
Chromogen:
Ventana Pathway 790-2991 (4B5) , 20 Mins, 36 ºC Prediluted
HER-2 - Method 1
Ventana reaction buffer (950-300)
Ventana CC1 36mins
NOT APPLICABLE
AS PER KIT
Detection: Ventana UltraView Kit (760-500)
BEST METHODS
A selection from just a few of the best methods employed by participants
Participant scored 16/20 (UK NEQAS Slide) and 16/20 (In House slide) using this method.
Primary Antibody:
Automation:
Method:
Main Buffer:
HMAR:
Dako Autostainer Link 48
Dako FLEX kit
EAR:
Chromogen:
Detection:
Dako Link HercepTest SK001 (poly) , 30 Mins, 21 ºC Prediluted
HER-2 - Method 2
Dako FLEX wash buffer
Dako PTLink, Buffer: HERCEPTEST EPITOPE RETRIEVAL
NOT APPLICABLE
Dako FLEX DAB, 21 ºC., Time 1: 5 Mins, Time 2: 5 Mins
Dako HerCep Test Autor (SK001) , 20 Mins, 21 ºC Prediluted
Participant scored 17/20 (UK NEQAS Slide) and 15/20 (In House slide) using this method.
Primary Antibody:
Automation:
Method:
Main Buffer:
HMAR:
Ventana Benchmark ULTRA
Ventana Optiview
EAR:
Chromogen:
Detection:
Ventana Confirm 790-4493 (4B5) , 16 Mins, 36 ºC
HER-2 - Method 3
Ventana reaction buffer (950-300)
Ventana CC1 32mins
NOT APPLICABLE
AS PER KIT
Ventana OptiView Kit (760-700) , 8 Mins, 36 ºC
© Copyright UK NEQAS ICC & ISH - Not for publication without written permission
26

The Gastric HER2 ICC Module Run 119
Antigen Assessed: HER2 for IHC
The NEQAS distributed sections consisted of a composite slide containing 4 surgical /resections of intestinal gastric carcinoma:
The expected expression levels of each tissue sample were: A. 3+
B. 2+, 3+ or 1+ depending on the block or serial section received
C. 0, 1+ or 2+ depending on the block or serial section received D. 0
Number of Registered Participants 66
Number of Participants this Run 60 (91%)
Score
Surgical / resections
As used in NEQAS assessments Biopsies
0
(negative) No staining in < 10% of tumour cells No staining in any of the tumour cells
1+
(negative) Faint barely perceptible incomplete membrane
staining in >10% of cells staining Tumour cells with faint barely perceptible incomplete membrane
staining, irrespective of percentage of tumour cells stained
2+
(equivocal*) Weak/ moderate complete, basolateral or lateral
membrane reactivity in > 10% of tumour cells
Tumour cells with weak/ moderate complete, basolateral or lateral membrane reactivity irrespective of % tumour cells stained
3+
(positive) Strong complete, basolateral or lateral membrane
reactivity in > 10% of tumour cells
Tumour cells with strong, basolateral or lateral membrane reactivity irrespective of percentage of tumour cells stained
* Equivocal cases should be refluxed to ISH testing. Note: in the UK, NICE guidelines recommend that only 3+ cases are put forward for Trastuzumab treatment, see http://guidance.nice.org.uk/TA208
Section Label From slide Label
End
Staining Pattern with IHC
HER2 status by ISH
A 3+ Amplified
B 3+ or 2+ (or 1+)
Amplified
(Non-Amplified)
C
0 or 1+
(or 2+) Non-Amplified
D 0 Non-Amplified
Validation of Distributed Samples
IHC Validation of Distributed Samples
The NEQAS tissue sections are validated prior to sending out: Gold standard slides are stained at every 25th serial level as part of the tissue quality control and to assess the HER2 expression level throughout the blocks. The slides are also stained with the Ventana Pathway 4B5 and Dako HercepTest commercial kits and further assessed for gene expression using the Dako IQ FISH and Ventana/Roche DDISH (see the table below for HER2 ISH status).
Please Note: The variability and heterogeneity of HER2 expression throughout the block is taken into consideration when scoring participants slides.
Suzanne Parry
© UK NEQAS ICC & ISH. No part of this document can be copied or used without prior written consent
Table: 1 Gastric HER2 ICC Membrane Scoring Guidelines: Hoffman et al., (2008) and Rüschoff et al., (2010)
Table 2: HER2 IHC staining and & ISH results
27

The Gastric HER2 ICC Module Run 119
Introduction
The American Society of Clinical Oncology (ASCO), the College of American Pathologists (CAP) and the American Society for Clinical Pathology (ASCP) have issued a new joint guideline on HER2 testing for patients with gastroesophageal cancers (GEA) on 14th of Nov 2016. Please see: www.jco.org. This guideline provides specific recommendations for assessment of HER2 in patients with advanced GEA while addressing pertinent technical issues and clinical implications of the results. Immunohistochemical testing of HER2 status is now routinely used in breast cancer testing and is recognised as a prognostic and predictive marker, generally used alongside breast hormonal receptor markers ER/PR. More recently the Trastuzumab for Gastric
Cancer (ToGA) study, which investigated Trastuzumab in HER2 positive advanced gastric cancer (Bang et al., 2010) showed overall median survival of nearly 3 months. Similar to breast cancer, the ToGA trial showed an increased benefit from Trastuzumab treatment for patients showing 3+ IHC and IHC2+/FISH+ expression. The initial development of the HER2 scoring criteria was developed as a precursor to the ToGA trial (Hoffman et al., 2008) with the study group modifying the breast HER2 IHC scoring algorithm to compensate for the incomplete membrane staining and greater tumour heterogeneity seen in gastric cancers. A different scoring system was also established for resection and core biopsies as illustrated in table 1. A more recent article by Rüschoff et al., (2010) has validated the scoring procedure further with a
Expected membrane staining
Scoring criteria used by UK NEQAS ICC & ISH
3+ i) 3+: as expected
ii) 2+/3+ or 3+/2+: Staining is slightly weaker than expected with membrane showing more 2+ compared to 3+(2+/3+) or 3+ membrane staining is present but also showing 2+ staining (3+/2+).
2+ i) 1+/2+ or 2+/1+: Staining is slightly weaker than expected with membrane showing more 1+ compared to 2+ (1+/2+) or 2+ membrane staining is present but also showing 1+ staining (2+/1+).
ii) ii) 2+/3+ or 3+/2+: Staining is slightly weaker than expected with membrane showing more 2+ compared to 3+ (2+/3+) or 3+ membrane staining is present but also showing 2+ staining (3+/2+).
1+ i) 0/1+: Staining is more towards the weaker end of 1+ staining but still acceptable. ii) 1+/0: Staining is more towards the weaker end of 1+ staining but still acceptable.
Neg. 0/1+ or 1+/0 = Staining starting to show very weak membrane staining
‘U’ = Uninterpretable: Assessors may also give a score of 'U' which indicates that the cell lines / tissue sections were 'uninterpretable’ due to the reasons set out below. U/x = Borderline interpretable. A score of U/x e.g. U/3+ or U/2+ or U/1+ or U/0 indicates that the staining is just about readable and further improvements are required. Any other membrane score other that assigned for each of the expected scores are deemed as unacceptable
Individual Assessor Score
Out of 5 Marks
Combined
Assessor Scores
Out of 20 Marks
Overall Score Interpretation
0 0 Slide not submitted for assessment
1 & 2
4-9 = Unacceptable
Overall the samples are of unacceptable quality for clinical interpretation and technical improvements need to be made. Marks may have been deducted due to:
• False positive / negative membrane staining
• Excessive cytoplasmic staining
• Excessive morphological damage
• Excessive staining of normal glands
3
10-12 = Borderline
Overall the samples are borderline interpretable indicating that technical improvements need to be made. Marks may have been deducted due to:
• Weaker / stronger than expected membrane staining
• Some cytoplasmic staining
• Morphological damage
4 & 5
13-15 = Acceptable
16-20 = Acceptable/Excellent Standard
Overall the samples show acceptable membrane staining and are suitable for interpretation.
Further comments are also provided on individual participant reports. Other factors which may lead to a low score include: excessive/ insufficient haematoxylin staining; poor quality of in-house control tissue; poor/inadequate choice of control tissue; poor/inadequate fixation; excessive antigen retrieval etc.
Assessment Procedure
Assessment is carried out around a multi-header microscope with each slide being assessed by 4 independent assessors and a microscope lead. Each of the NEQAS samples (A-D) (as well as in-house samples where submitted) are individually assessed, with each assessor providing membrane interpretation (see table 3), and an individual score out of 5 (see table 4) based on interpretability of membrane staining and technical feedback. The four assessors scores are then combined to give an overall score out of 20 and it’s interpretation (see table 4).
© UK NEQAS ICC & ISH. No part of this document can be copied or used without prior written consent
Table 3: UK NEQAS Specific Membrane Scoring Criteria: UK NEQAS ICC & ISH uses an EQA specific scoring criteria when scoring the tissue sections, so as to provide participants additional technical feedback.
Table 4: Numeric Scoring Criteria used to Calculate the Overall Pass Mark
28

The Gastric HER2 ICC Module Run 119
detailed approach to ’stepwise’ HER2 IHC scoring in gastric cancers. The article also compared the Ventana 4B5 assay with the HercepTest and indicated “a tendency towards higher sensitivity for 4B5 detecting positive HER2 amplification” but “there was no difference between both test platforms with respect to the ISH-negative cases, with the one equivocal case testing negative at some sites and as positive at others”. Rüschoff and colleagues also used both fluorescent (Dako PharmDX or PathVysion Vysis) and chromogen (Ventana DDISH) ISH techniques to confirm their IHC findings.
Assessment Results
Features Of Acceptable Staining: (Figures 1, 2, 3a, 4, 5 & 6) • Membrane staining of the invasive tumour with the expected
expression level • Cytoplasmic staining not excessive
• No background staining of stromal tissues or inappropriately localised staining
Features Of Suboptimal or Unacceptable Staining: (Figure 3b) • Weaker or stronger staining than the expected expression
level of membrane staining in the invasive tumour • False positive or negative membrane staining • Excessive cytoplasmic staining
• Excessive background staining or inappropriately localised staining
• Morphological damage • Excessive staining of normal glands
Additional Comment: The Ventana 4B5 is known to stain intestinal metaplasia (not illustrated) and participants are not penalised when this staining is observed.
Pass Rates
The pass rates for the NEQAS distributed samples are summarised in the table below:
The pass rate for this module has remained at a pleasingly high level for the past number of Runs. Only 6 laboratories (10%) obtained an unacceptable result due to weak staining in cores B and/or C. In the clinical setting, false negative results may lead to eligible patients not being put forward for Herceptin therapy, and equally concerning is that many patients may be over-treated: For instance, a HER2 IHC result of 3+ will automatically mean that the patient is put forward for Herceptin therapy. Also, as IHC 2+ cases are also reflex tested, incorrect over-staining could mean that more samples than necessary are being put forward for ISH reflex testing. Most labs are using the recommended standardised protocols for their particular automated systems, such as CC1 Mild antigen retrieval on the Ventana XT with the 4B5 pre-diluted antibody clone. However, a few labs are not using the recommended protocols, and this may have the potential to
induce weaker or stronger membrane staining than expected.
All laboratories submitted in-house control material for assessment and the results for these are summarised below:
The overall pass rates on the in-house controls was lower than on the Neqas samples. More laboratories received a borderline pass on the in-house samples. The majority of these borderline passes were given because the laboratories did not submit ideal composite control material, consisting of a 3+, 2+ and 1+/0 expressing gastric/breast control tumour sample. These labs were therefore given a maximum score of 12/20. Other labs were marked down for poor tissue quality or fixation. Another consideration for the 2+ controls sent by some laboratories were not truly 2+. Recommendations for control tissue are described below.
Methodologies
The majority of labs are using the Ventana 4B5 standardised kit for their gastric HER2 testing: In this particular assessment run the Ventana assay was used by 88% of participants with an average acceptable pass rate of 85%. 3 laboratories used the Dako Hercept test with 67% acceptable pass rate.
Control Tissue and Recommendations
UK NEQAS ICC recommends that gastric tissue samples are used as an ideal in–house control for gastric HER2 testing. However, laboratories were given the choice to submit either gastric or breast control material for their in-house control assessment and therefore laboratories were not penalised if they submitted breast carcinomas instead of gastric tissue. Whether gastric or breast tissue is used, laboratories should still submit in-house controls showing 3+, 2+ and 1+/0 levels of membrane expression.
Due to the heterogenic nature of many gastric tumours, it is also acceptable for labs to submit a heterogeneous in-house control with areas of both 3+ and 2+ membrane expression for example, as long as the participant clearly indicates the areas where the assessment should be carried out.
References: 1. Hofmann M, Stoss O, Shi D et al. Assessment of a HER2 scoring system for
gastric cancer: results from a validation study. Histopathology. 2008 52(7):797-805.
2. Rüschoff J, Dietel M, Baretton G etc al. HER2 diagnostics in gastric cancer- guideline validation and development of standardized immunohistochemical testing. Virchows Arch. 2010 457(3):299-307.
3. Bang YJ, Van Cutsem E, Feyereislova A, Chung HC, Shen L, Sawaki A, Lordick F, Ohtsu A, Omuro Y, Satoh T, Aprile G, Kulikov E, Hill J, Lehle M, Rüschoff J, Kang YK. ToGA Trial Investigators. Trastuzumab in combination with chemotherapy versus chemotherapy alone for treatment of HER2-
positive advanced gastric or gastro-oesophageal junction cancer (ToGA): a phase 3, open-label, randomised controlled trial. Lancet. 2010 376(9742):687-97
Acknowledgments
We would like to thank Dako and Ventana for agreeing to stain the UK NEQAS Gastric HER2 ICC ‘Gold standard’ samples with their respective kits/assays and also for providing the ISH.
© UK NEQAS ICC & ISH. No part of this document can be copied or used without prior written consent
In-House Pass Rates Run 119:
Acceptable 69% (N=41)
Borderline 30% (N=18)
Unacceptable 2% (N=1)
NEQAS Pass Rates Run 119: Acceptable 87% (N=52) Borderline 3% (N=2) Unacceptable 10% (N=6)
29

RUN 119 GASTRIC HER2 ICC Module
Selected Images showing Optimal and Sub-optimal immunostaining
Figure 2. Expected level of staining for the 2+ Core B on the NEQAS sample. The expression
level varied depending on which block and serial section was distributed (See Fig. 3). Staining
method as in Figure 1.
Figure 1. Good example of expected level of 3+ HER2 expression for Core A on the NEQAS
distributed sample. Stained using the Ventana 4B5 Pathway on the Ventana Benchmark XT.
CC1 32mins.
Figure 3. Figure 3A demonstrates acceptable 1+ staining in Core B on the NEQAS sample.
Method as described in Figure 1. Figure 3B shows an unacceptable absence of staining in the
1+ Core B. Method: Ventana 4B5 on the Ventana Benchmark Ultra. CC1 36 mins.
Figure 4. The expression in Core C varied from 1+ to 2+ depending on the block and serial
section. Figure 4A shows excellent example of 1+ staining in Core C. Figure 4B demonstrates
stronger staining of 2+. Both A&B stained using the method described in Figure 1.
Figure 5. Excellent example of a participant’s in-house control tissue showing 2+ expression.
Stained using Ventana 4B4 Confirm on the Ventana Benchmark ULTRA. CC1 36 mins.
Figure 6. Very good example of a gastric tumour with 3+ HER2 expression as part of a
participant’s composite control block. Method as described in Figure 5.
© Copyright UK NEQAS ICC & ISH - Not for publication without written permission
30

Run 119 GASTRIC HER2 ICC Module
0
4
8
12
16
20
4 5 6 7 8 9 10 11 12 13 14 15 16 17 18 19 20
Scores
no
. o
f re
turn
s
RUN 119Gn Gastric HER2 IHC on NEQAS Sections
ALL PARTICIPANTS
Individual
Scores
4 = 0 (0%)
5 = 0 (0%)
6 = 0 (0%)
7 = 0 (0%)
8 = 6 (10%)
9 = 0 (0%)
10 = 1 (2%)
11 = 0 (0%)
12 = 1 (2%)
13 = 2 (3%)
14 = 2 (3%)
15 = 2 (3%)
16 = 19 (32%)
17 = 15 (25%)
18 = 6 (10%)
19 = 2 (3%)
20 = 4 (7%)
GRAPHICAL REPRESENTATION OF PASS RATES
0
1
2
3
4
5
6
7
8
4 5 6 7 8 9 10 11 12 13 14 15 16 17 18 19 20
Scoresn
o. o
f re
turn
s
RUN 119Gn Gastric HER2 IHC on NEQAS Sections
UK PARTICIPANTS
Individual
Scores
4 = 0 (0%)
5 = 0 (0%)
6 = 0 (0%)
7 = 0 (0%)
8 = 1 (5%)
9 = 0 (0%)
10 = 0 (0%)
11 = 0 (0%)
12 = 1 (5%)
13 = 1 (5%)
14 = 0 (0%)
15 = 1 (5%)
16 = 8 (38%)
17 = 3 (14%)
18 = 3 (14%)
19 = 1 (5%)
20 = 2 (10%)
Summary
16 - 20 = 46 (77%)
13 - 15 = 6 (10%)
10 - 12 = 2 (3%)
0 - 9 = 6 (10%)
Median = 15.00
Summary
16 - 20 = 17 (81%)
13 - 15 = 2 (10%)
10 - 12 = 1 (5%)
0 - 9 = 1 (5%)
Median = 16.00
0
2
4
6
8
10
12
14
16
3 4 5 6 7 8 9 10 11 12 13 14 15 16 17 18 19 20
Scores
no
. o
f re
turn
s
RUN 119Gh Gastric HER2 IHC on in-house Sections
ALL PARTICIPANTS
Individual
Scores
3 = 0 (0%)
4 = 0 (0%)
5 = 0 (0%)
6 = 0 (0%)
7 = 0 (0%)
8 = 0 (0%)
9 = 1 (2%)
10 = 2 (3%)
11 = 2 (3%)
12 = 14 (23%)
13 = 0 (0%)
14 = 3 (5%)
15 = 4 (7%)
16 = 16 (27%)
17 = 10 (17%)
18 = 5 (8%)
19 = 2 (3%)
20 = 1 (2%)
Individual
Scores
3 = 0 (0%)
4 = 0 (0%)
5 = 0 (0%)
6 = 0 (0%)
7 = 0 (0%)
8 = 0 (0%)
9 = 0 (0%)
10 = 0 (0%)
11 = 0 (0%)
12 = 3 (14%)
13 = 0 (0%)
14 = 0 (0%)
15 = 2 (10%)
16 = 5 (24%)
17 = 6 (29%)
18 = 4 (19%)
19 = 0 (0%)
20 = 1 (5%)
0
1
2
3
4
5
6
3 4 5 6 7 8 9 10 11 12 13 14 15 16 17 18 19 20
Scores
no
. o
f re
turn
s
RUN 119Gh Gastric HER2 IHC on in-house Sections
UK PARTICIPANTS
Summary
16 - 20 = 34 (57%)
13 - 15 = 7 (12%)
10 - 12 = 18 (30%)
0 - 9 = 1 (2%)
Median = 15.00
Summary
16 - 20 = 34 (57%)
13 - 15 = 7 (12%)
10 - 12 = 18 (30%)
0 - 9 = 1 (2%)
Median = 15.00
© Copyright UK NEQAS ICC & ISH - Not for publication without written permission
31

Run 119 GASTRIC HER2 ICC Module
Gastric
HER2 IHC
N %Dako Autostainer Link 48 1 0
Dako Autostainer Plus Link 2 100
Dako Omnis 2 100
Other 1 0
Ventana Benchmark GX 2 100
Ventana Benchmark ULTRA 33 85
Ventana Benchmark XT 18 94
Automation
ANTIBODIES AND OTHER TECHNICAL PARAMETERS EMPLOYED BY PARTICIPANTS IN THE GASTRIC HER2 ICC
MODULE
The following tables record the number of participants (N) using each primary antibody and the percentage (%) of these
participants achieving acceptable staining (Score >12/20) on UK NEQAS sections.
Primary Antibody N %
Dako A0485 C-erB-2 (poly) 2 100
Dako Link HercepTest SK001 (poly) 3 67
Ventana Pathway 790-100 (4B5) 2 100
Ventana Pathway 790-2991 (4B5) 37 92
Other 1 0
Ventana Confirm 790-4493 (4B5) 14 79
Gastric HER2 ICC Run: 119 Gastric HER2 ICC Run: 119
Gastric HER2
IHC
N %
Dako Omnis 2 100
Dako PTLink 3 67
Lab vision PT Module 1 0
Ventana CC1 16mins 2 50
Ventana CC1 24mins 1 100
Ventana CC1 32mins 6 100
Ventana CC1 36mins 15 80
Ventana CC1 52mins 1 100
Ventana CC1 56mins 2 50
Ventana CC1 64mins 6 100
Ventana CC1 mild 15 93
Ventana CC1 standard 5 100
Heat Mediated Retrieval
Gastric HER2 ICC Run: 119 Gastric
HER2 IHC
N %
AS PER KIT 5 60
Dako EnVision FLEX ( K8000/10) 1 100
Dako EnVision FLEX+ ( K8002/12) 1 100
Dako HerCep Test Autor (SK001) 2 100
Power Vision DPVB999 HRP 1 0
Ventana iView system (760-091) 1 100
Ventana OptiView Kit (760-700) 5 60
Ventana UltraView Kit (760-500) 42 93
Detection
Gastric HER2 ICC Run: 119
Gastric
HER2 IHC
N %AS PER KIT 3 100
NOT APPLICABLE 28 93
Ventana Protease 1 (760-2018) 2 100
Enzyme Retrieval
Gastric HER2 ICC Run: 119Gastric
HER2 IHC
N %
AS PER KIT 10 80
Dako DAB+ Liquid (K3468) 1 0
Dako FLEX DAB 4 100
Other 1 100
Ventana DAB 3 67
Ventana iview 1 100
Ventana Ultraview DAB 39 90
Chromogen
Gastric HER2 ICC Run: 119
© Copyright UK NEQAS ICC & ISH - Not for publication without written permission
32

Run 119 GASTRIC HER2 ICC Module
Participant scored 20/20 (UK NEQAS Slide) and 18/20 (In House slide) using this method.
Primary Antibody:
Automation:
Method:
Main Buffer:
HMAR:
Ventana Benchmark XT
Ventana UltraView DAB
EAR:
Chromogen:
Ventana Pathway 790-2991 (4B5) , 16 Mins, 37 ºC Prediluted
Gastric HER2 IHC - Method 1
Ventana reaction buffer (950-300), PH: 7.6
Ventana CC1 16mins, PH: 8.4
Ventana Ultraview DAB, Time 1: 37 Mins, Time 2: 8 Mins
Detection: Ventana UltraView Kit (760-500) , 8 Mins, 37 ºC Prediluted
BEST METHODS
A selection from just a few of the best methods employed by participants
Participant scored 18/20 (UK NEQAS Slide) and 16/20 (In House slide) using this method.
Primary Antibody:
Automation:
Method:
Main Buffer:
HMAR:
Ventana Benchmark XT
Ventana UltraView DAB
EAR:
Chromogen:
Detection:
Ventana Pathway 790-100 (4B5) , 16 Mins
Gastric HER2 IHC - Method 2
Ventana reaction buffer (950-300), PH: 7.54
Ventana CC1 mild
NOT APPLICABLE
Ventana Ultraview DAB, Time 1: 8 Mins
Ventana UltraView Kit (760-500)
© Copyright UK NEQAS ICC & ISH - Not for publication without written permission
33

Gold Standard Second Antibody
Antigens Assessed: BCL-6 CD15
Tissue Sections circulated: Diffuse large B-cell lymphoma (LN) and reactive tonsil
Hodgkin's disease lymph node.
Number of Registered Participants: 210
Number of Participants this Run 201 (96%)
The Lymphoma Module Run 119
David Blythe and Suzanne Parry
Introduction Gold Standard: BCL-6
BCL-6 (B-Cell CLL/Lymphoma 6, zinc finger protein 51) is a 95 kDa zinc-finger transcription factor. It is required for germinal centre formation and is involved in the differentiation of normal germinal centre B-cells. BCL-6 acts as a sequence-
specific repressor of transcription and is a suppressor of p53 expression1. As an immunohistochemical marker, BCL-6 is used alongside a panel of other lymphoma markers to determine lymphomas of B-cell lymphoma, Burkitt’s lymphoma and lymphocyte predominant Hodgkin’s lymphoma2,3,4. BCL-6 expression is absent in acute lymphatic leukaemia and mantle cell lymphoma.
Features of Optimal Immunostaining (Figures 1, 3 & 5): • Moderate to strong nuclear staining of all germinal centre B-
cells in the distributed tonsil and lymph node (follicular lymphoma).
• Clean background with no non-specific staining.
Features of Sub-optimal Immunostaining (Figures 2, 4 & 6): • Weak, uneven or partially missing staining of relevant cell. • Poor/diffuse nuclear localisation. • High background or non-specific staining of cell types not
expected to stain. • Damaged morphology
References: 1. Phan RT and Dall-Favera R. The BCL-6 proto-oncogene suppresses p53 expression in germinal-centre B cells,. Nature 2004; 432: 635-639. 2. Cattirett G et ak, BCL-6 protein in germinal-centre cells. Blood. 1995; 86: 45-
53. 3. Skinnider BF et al. BCL-6 and BCL-2 protein expression in diffuse large B-cell lymphoma and follicular lymphoma: correlation with 3q27 and 18q21 chromosomal abnormalities. Hum Pathol. 1999; 30: 803-808. 4. Wlodarska I et al. Frequent occurrence of BCL-6 rearrangements in nodular lymphocyte predominance Hodgkin lymphoma but not in classical Hodgkin lymphoma. Blood Jan 15; 101 (2): 706-10.
Second Antigen: CD15
CD15 is a complex cluster of differentiation antigen, expressed on glycoproteins, glycolipids and proteoglycans, and is also referred to as Lewis X (LeX) antigen1,. CD15 is expressed in normal mature myeloid cells, but it has been predominantly used as an immunohistochemical marker to identify Reed-Sternberg Cells (RSC) in Classical Hodgkin Lymphoma (CHL), used to distinguish CHL from reactive lymphadenitis, lymphocyte-predominance Hodgkin lymphoma, non-Hodgkin lymphomas and HD-like neoplasms2,3. CD15 is also useful within a panel to aid in the differential diagnosis and classification of other neoplasms, such as the differentiation of mesothelioma from adenocarcinoma, or the differentiation between malignant gliomas and non-neoplastic glial cells. CD15 is also used to indicate a poorer prognosis in certain tumours, such as gastric and colonic carcinoma, and thyroid medullary carcinoma.
Features of Optimal Immunostaining (Figures 7, 8, 9, 11 & 12): • Moderate to strong predominantly membranous staining of
most of the Hodgkin and Reed-Sternberg cells.
• Clean background with no non-specific staining.
Features of Sub-optimal Immunostaining (Figure 10): • Weak, uneven or partially missing staining of relevant cell. • Poor/diffuse localisation. • High background or non-specific staining of cell types not
expected to stain.
References
1.Kerr MA, Stocks SC The role of CD15-(Le(X))-related carbohydrates in neutrophil adhesion. Histochem. J. 1992; 24 (11): 811–26. 2. Dorfman RF, et al. An evaluation of the utility of anti-granulocyte and anti-leucocyte monoclonal antibodies in the diagnosis of Hodgkin’s disease. Am J Pathol 1986. 123:508–19. 3. Vassallo J. et al. Mimicking nodular sclerosis Hodgkin’s lymphoma: report of 10 cases. Am J Surg Pathol 2006. 30:223–9. 4. Barry TS, et al. Peripheral T-cell lymphomas expressing CD30 and CD15. Am J Surg Pathol 2003; 27:1513–22.
Assessment Summary:
BCL-6
200 laboratories submitted slides for the BCL-6 assessment, and all but 1 laboratory submitted their in-house control sections for this run. This was the first run for the assessment year and results were pleasing (Summarised in the table below) with 88% of participants achieving an acceptable result for their NEQAS submission, 11% received a borderline score, and only 3% received unacceptable results. The in-house results where almost identical. The reason for failure was either due to weak/very weak staining in the normal lymphocytes and tumour cells. Comments for the in-house material noted varying levels of background staining. The most popular clones used in this run were Dako (PG-B6p), Ventana (1GI191E/A8) and Leica (LN22) used by 25%, 29% and 33% of participants respectively. The acceptable pass rate for the participants in-house tissue was 92%, therefore, slightly higher than that achieved on the NEQAS material. A further 8% received a borderline pass, and no laboratories failed on their in-house tissue. Many laboratories are only using an appendix as an in-house positive control. While this is an appropriate tissue which stains positively with BCL-6, NEQAS recommends for best practice to use a multi-tissue composite control to help measure the sensitivity of the assay, such as a tonsil and a positive tumour control (i.e. DLBCL). Laboratories were not penalised for only using a single control.
CD15
201 laboratories submitted their stained NEQAS material for the CD15 assessment. Only 1 of these laboratories did not
© UK NEQAS ICC & ISH. No part of this document can be copied or used without prior written consent
NEQAS and In-house Pass Rates Run 119 BCL-6
NEQAS In-house
Acceptable 88% (N=174) 92% (N= 183) Borderline 11% (N=21) 8% (N=16) Unacceptable 3% (N=5) 0% (N=0)
34

The Lymphoma Module Run 119
David Blythe and Suzanne Parry
submit their in-house material. It was the first time that NEQAS has requested CD15 as the marker to be assessed for a while, and the results were generally good. 82% (N=164) achieved an acceptable pass, and a further 9% (N=19) received a borderline pass. However, 18 laboratories (9%) failed the assessment on the NEQAS material.
Pass rates on the in-house material were lower than that on the NEQAS material, with less participants receiving an acceptable pass, and more laboratories receiving borderline passes. 11 laboratories (9%) failed on their in-house material. These pass rates are summarised in the table below:
The reason for failure on both the NEQAS and in-house material was mostly due to no or little staining of the expected Hodgkin and Reed-Sternberg cells. It was noted during the assessment and after reviewing the data, that the Leica Carb-1 antibody was showing particularly poor staining. Even though most laboratories using this clone are carrying out the recommended antigen retrieval with acceptable dilution ranges, the results highlighted this antibody to be underperforming. Of the 16 participants using this clone, no laboratories achieved an acceptable pass, and only 2 laboratories received a borderline. The results with this clone were similar on the NEQAS and in-house material. The MMA clone from Leica was used by 3 participants, and this antibody performed well in the assessment, with all 3 users achieving acceptable pass scores. Other popular antibodies used in the assessment include the Ventana MMA antibody, used by 67 participants, and showed an acceptable pass rate of 94%. The Dako Carb-3 antibody was used by 42 participants, either as a ready-to-use for the autostainers or the Omnis staining machines, or diluted out from the concentrate. Results with this antibody were excellent, and all laboratories achieved acceptable passes. Borderline passes were given mainly for weaker staining, where the expression was present, but the staining could be improved for better technical quality.
© UK NEQAS ICC & ISH. No part of this document can be copied or used without prior written consent
NEQAS and In-house Pass Rates Run 119 CD15
NEQAS In-house
Acceptable 82% (N=164) 66% (N= 130)
Borderline 9% (N=19) 30% (N=59)
Unacceptable 9% (N=18) 6% (N=11)
35

RUN 119 LYMPHOMA Module
Selected Images showing Optimal and Sub-optimal immunostaining
Figure 2: Weak demonstration of BCL-6 on NEQAS reactive tonsil. This was most likely due to
insufficient antigen retrieval. The section was stained using the Cell Marque antibody on the
Leica BondMax with ER1 antigen retrieval for 10 minutes.
Figure 1: Acceptable demonstration of BCL-6 on the UK NEQAS reactive tonsil. The germinal
centre B-cells show moderate nuclear staining while the background remains clean. Stained
with the Dako RTU PG-B6p antibody clone on the Omnis autostainer, antigen retrieval for 30
minutes.
Figure 3. Good demonstration of BCL-6 on the UK NEQAS diffuse large B-cell lymphoma
(DLBCL) sample. Virtually all of the neoplastic cells show moderate to strong, distinct nuclear
staining. Section stained with the Cell Marque GI191E/A8 clone on the Ventana XT with CC1
extended antigen retrieval.
Figure 4. Sub-optimal demonstration of BCL-6 on the UK NEQAS DLBCL sample (compare to
Fig 4). The staining pattern is weak and the antigen is poorly localised. (Same protocol as Fig
2).
Figure 5. Good example of an in house tonsil stained with BCL-6. The germinal centre B cells
show distinct nuclear staining and there is no background staining. (Same protocol as Fig 1).
Figure 6. Sub-optimal staining with BCL-6 on the participants’ in-house tonsil. Although the
B������ ��� ����������� � � ������ �� �������� ��� ������ ��� � ��������� ����� ���������
. � � ��������� �� ��� ���������. ������ ��� � ����� ��� � ��� ����� ��������� � � �
water bath.
© Copyright UK NEQAS ICC & ISH - Not for publication without written permission
36

RUN 119 LYMPHOMA Module
Selected Images showing Optimal and Sub-optimal {@stainingtext}
Figure 8. Optimal demonstration of CD15 on the UK NEQAS distributed Hodgkin’s lymphoma
sample, showing strong well-localised membrane staining of the Hodgkin’s tumour cells.
Stained using the Dako Carb-3 antibody, 1:40, on the Ventana ULTRA with CC1 standard
r��r������
Figure 7. Good demonstration of CD15 on the UK NEQAS Hodgkin’s lymphoma sample,
s� !�"# ��� �$%�&��' ����� ( s���"�"#� )�� �$�*%�� !�s s���"�' +s�"# ��� ,�&� " -�&/�"s "
L01 23 &� "�4 35674 " ��� -�/ 8*"�s �+� s���"�r !��� 9L0: '���&�� " /���
Figure 10. Poor demonstration of CD15 in the UK NEQAS Hodgkin’s lymphoma sample
;& *%�r� � 9�#s<=>?11@5)�� �$�*%�� s� !s � (��s� "�#����� r��&�� "4 !��� "�A s&����r�'
neoplastic cells staining weakly. Stained with the Leica Carb-1 RTU antibody on the Bond III
platform.
9�#+r� >� F ' '�* "s�r��� " ( C-36 " ��� 1D E0GHI '�s�r�J+��' K '#/�"Ms �A*%� *��
0��" �� � ! % !�r ��� K '#/�" &���s s� ! s�r "# *�*Jr�" +s s���"�"# !��� ' �=��/� % s������A�
Stained with the Ventana pre-diluted MMA antibody on the Benchmark ULTRA ,64 minutes
r��r����� �" CC3 buffer.
Figure 12: Excellent demonstration of CD15 on the participant in-house Hodgkin’s lymphoma
control. The example shows strong, well localised membrane staining in the Reed-Sternberg
and Hodgkin’s tumour cells. Stained using the Dako RTU Carb-3 antibody on the Dako Omnis
!��� 9L0: '���&�� "�
Figure 11. Good demonstration of CD15 on the UK NEQAS Hodgkin’s lymphoma sample.
Staining was carried out using the BD Biosciences LEU M1 antibody, 1:50 on the Leica Bond III
autostainer with Refine detection.
© Copyright UK NEQAS ICC & ISH - Not for publication without written permission
37

Run 119 LYMPHOMA Module
0
10
20
30
40
50
60
4 5 6 7 8 9 10 11 12 13 14 15 16 17 18 19 20
Scores
no
. o
f re
turn
s
RUN 119L BCL6 on NEQAS Sections
ALL PARTICIPANTS Individual
Scores
4 = 0 (0%)
5 = 0 (0%)
6 = 0 (0%)
7 = 0 (0%)
8 = 3 (2%)
9 = 2 (1%)
10 = 1 (1%)
11 = 2 (1%)
12 = 18 (9%)
13 = 14 (7%)
14 = 15 (8%)
15 = 24 (12%)
16 = 59 (30%)
17 = 32 (16%)
18 = 21 (11%)
19 = 3 (2%)
20 = 6 (3%)
GRAPHICAL REPRESENTATION OF PASS RATES
RUN 119L BCL6 on NEQAS Sections
UK PARTICIPANTS
0
5
10
15
20
25
30
35
40
4 5 6 7 8 9 10 11 12 13 14 15 16 17 18 19 20
Scores
no
. o
f re
turn
s
Individual
Scores
4 = 0 (0%)
5 = 0 (0%)
6 = 0 (0%)
7 = 0 (0%)
8 = 0 (0%)
9 = 0 (0%)
10 = 0 (0%)
11 = 0 (0%)
12 = 7 (6%)
13 = 8 (7%)
14 = 8 (7%)
15 = 14 (13%)
16 = 39 (36%)
17 = 16 (15%)
18 = 11 (10%)
19 = 2 (2%)
20 = 3 (3%)
Summary
16 - 20 = 121 (61%)
13 - 15 = 53 (27%)
10 - 12 = 21 (11%)
0 - 9 = 5 (3%)
Median = 14.00
Summary
16 - 20 = 71 (66%)
13 - 15 = 30 (28%)
10 - 12 = 7 (6%)
0 - 9 = 0 (0%)
Median = 16.00
0
10
20
30
40
50
60
70
4 5 6 7 8 9 10 11 12 13 14 15 16 17 18 19 20
Scores
no
. o
f re
turn
s
RUN 119M BCL6 on in-house Sections
ALL PARTICIPANTSIndividual
Scores
4 = 0 (0%)
5 = 0 (0%)
6 = 0 (0%)
7 = 0 (0%)
8 = 0 (0%)
9 = 0 (0%)
10 = 2 (1%)
11 = 1 (1%)
12 = 13 (7%)
13 = 15 (8%)
14 = 17 (9%)
15 = 15 (8%)
16 = 68 (34%)
17 = 31 (16%)
18 = 19 (10%)
19 = 10 (5%)
20 = 8 (4%)0
5
10
15
20
25
30
35
40
4 5 6 7 8 9 10 11 12 13 14 15 16 17 18 19 20
Scores
no
. o
f re
turn
s
RUN 119M BCL6 on in-house Sections
UK PARTICIPANTSIndividual
Scores
4 = 0 (0%)
5 = 0 (0%)
6 = 0 (0%)
7 = 0 (0%)
8 = 0 (0%)
9 = 0 (0%)
10 = 0 (0%)
11 = 1 (1%)
12 = 3 (3%)
13 = 12 (11%)
14 = 9 (8%)
15 = 8 (7%)
16 = 36 (33%)
17 = 17 (16%)
18 = 12 (11%)
19 = 6 (6%)
20 = 4 (4%)
Summary
16 - 20 = 136 (68%)
13 - 15 = 47 (24%)
10 - 12 = 16 (8%)
0 - 9 = 0 (0%)
Median = 15.00
Summary
16 - 20 = 75 (69%)
13 - 15 = 29 (27%)
10 - 12 = 4 (4%)
0 - 9 = 0 (0%)
Median = 15.50
© Copyright UK NEQAS ICC & ISH - Not for publication without written permission
38

Run 119 LYMPHOMA Module
0
10
20
30
40
50
60
70
4 5 6 7 8 9 10 11 12 13 14 15 16 17 18 19 20
Scores
no
. o
f re
turn
s
RUN 119N CD15 on NEQAS Sections
ALL PARTICIPANTSIndividual
Scores
4 = 0 (0%)
5 = 0 (0%)
6 = 0 (0%)
7 = 0 (0%)
8 = 10 (5%)
9 = 8 (4%)
10 = 5 (2%)
11 = 8 (4%)
12 = 6 (3%)
13 = 6 (3%)
14 = 9 (4%)
15 = 19 (9%)
16 = 63 (31%)
17 = 34 (17%)
18 = 19 (9%)
19 = 12 (6%)
20 = 2 (1%)
GRAPHICAL REPRESENTATION OF PASS RATES
0
5
10
15
20
25
30
35
4 5 6 7 8 9 10 11 12 13 14 15 16 17 18 19 20
Scores
no
. o
f re
turn
s
RUN 119N CD15 on NEQAS Sections
UK PARTICIPANTSIndividual
Scores
4 = 0 (0%)
5 = 0 (0%)
6 = 0 (0%)
7 = 0 (0%)
8 = 8 (7%)
9 = 5 (5%)
10 = 3 (3%)
11 = 3 (3%)
12 = 4 (4%)
13 = 1 (1%)
14 = 4 (4%)
15 = 9 (8%)
16 = 31 (29%)
17 = 16 (15%)
18 = 12 (11%)
19 = 10 (9%)
20 = 2 (2%)
Summary
16 - 20 = 130 (65%)
13 - 15 = 34 (17%)
10 - 12 = 19 (9%)
0 - 9 = 18 (9%)
Median = 14.00
Summary
16 - 20 = 71 (66%)
13 - 15 = 14 (13%)
10 - 12 = 10 (9%)
0 - 9 = 13 (12%)
Median = 14.00
0
10
20
30
40
50
4 5 6 7 8 9 10 11 12 13 14 15 16 17 18 19 20
Scores
no
. o
f re
turn
s
RUN 119P CD15 on in-house Sections
ALL PARTICIPANTSIndividual
Scores
4 = 0 (0%)
5 = 0 (0%)
6 = 0 (0%)
7 = 1 (1%)
8 = 4 (2%)
9 = 6 (3%)
10 = 12 (6%)
11 = 18 (9%)
12 = 29 (15%)
13 = 18 (9%)
14 = 9 (5%)
15 = 18 (9%)
16 = 50 (25%)
17 = 14 (7%)
18 = 11 (6%)
19 = 6 (3%)
20 = 4 (2%)
RUN 119P CD15 on in-house Sections
UK PARTICIPANTS
0
4
8
12
16
20
24
28
4 5 6 7 8 9 10 11 12 13 14 15 16 17 18 19 20
Scores
no
. o
f re
turn
s
Individual
Scores
4 = 0 (0%)
5 = 0 (0%)
6 = 0 (0%)
7 = 0 (0%)
8 = 4 (4%)
9 = 5 (5%)
10 = 4 (4%)
11 = 11 (10%)
12 = 14 (13%)
13 = 7 (6%)
14 = 6 (6%)
15 = 8 (7%)
16 = 26 (24%)
17 = 8 (7%)
18 = 5 (5%)
19 = 6 (6%)
20 = 4 (4%)
Summary
16 - 20 = 85 (43%)
13 - 15 = 45 (23%)
10 - 12 = 59 (30%)
0 - 9 = 11 (6%)
Median = 13.50
Summary
16 - 20 = 49 (45%)
13 - 15 = 21 (19%)
10 - 12 = 29 (27%)
0 - 9 = 9 (8%)
Median = 14.00
© Copyright UK NEQAS ICC & ISH - Not for publication without written permission
39
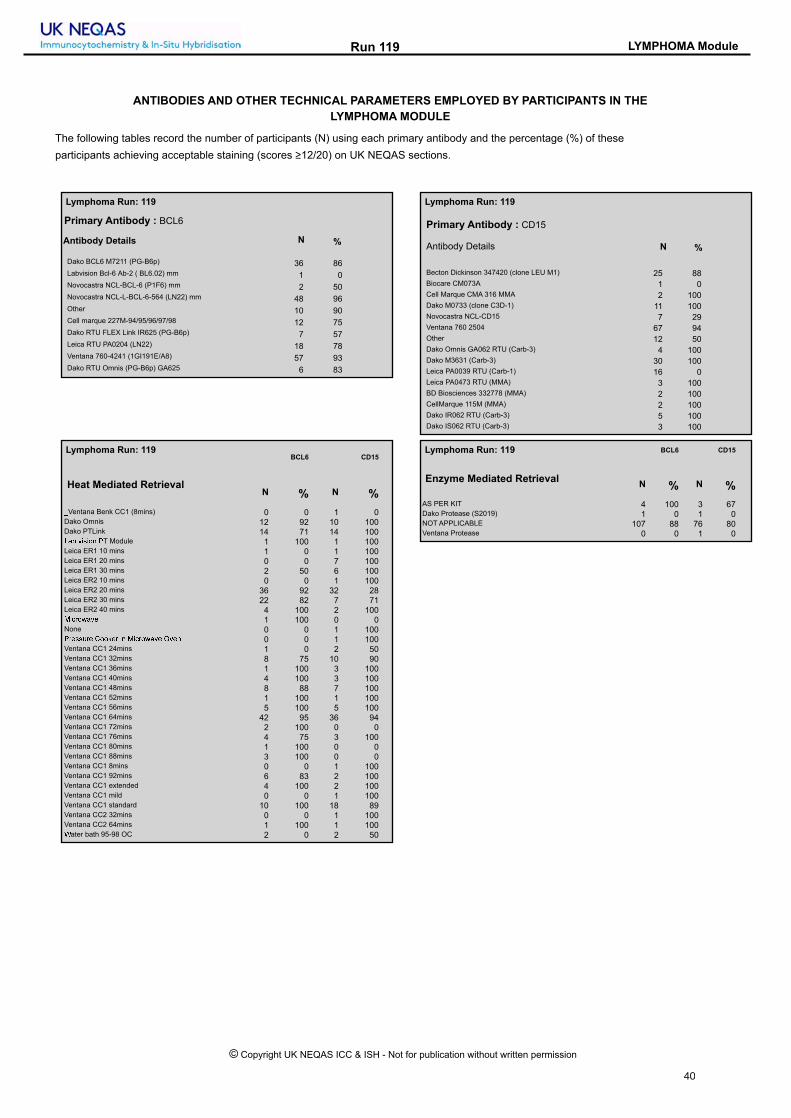
Run 119 LYMPHOMA Module
ANTIBODIES AND OTHER TECHNICAL PARAMETERS EMPLOYED BY PARTICIPANTS IN THE
LYMPHOMA MODULE
The following tables record the number of participants (N) using each primary antibody and the percentage (%) of these
participants achieving acceptable staining (scores ≥12/20) on UK NEQAS sections.
Antibody Details N %
Primary Antibody : BCL6
Dako BCL6 M7211 (PG-B6p) 36 86Labvision Bcl-6 Ab-2 ( BL6.02) mm 1 0Novocastra NCL-BCL-6 (P1F6) mm 2 50Novocastra NCL-L-BCL-6-564 (LN22) mm 48 96Other 10 90Cell marque 227M-94/95/96/97/98 12 75Dako RTU FLEX Link IR625 (PG-B6p) 7 57Leica RTU PA0204 (LN22) 18 78Ventana 760-4241 (1GI191E/A8) 57 93Dako RTU Omnis (PG-B6p) GA625 6 83
Antibody Details N %
Primary Antibody : CD15
Becton Dickinson 347420 (clone LEU M1) 25 88
Biocare CM073A 1 0
Cell Marque CMA 316 MMA 2 100
Dako M0733 (clone C3D-1) 11 100
Novocastra NCL-CD15 7 29
Ventana 760 2504 67 94
Other 12 50
Dako Omnis GA062 RTU (Carb-3) 4 100
Dako M3631 (Carb-3) 30 100
Leica PA0039 RTU (Carb-1) 16 0
Leica PA0473 RTU (MMA) 3 100
BD Biosciences 332778 (MMA) 2 100
CellMarque 115M (MMA) 2 100
Dako IR062 RTU (Carb-3) 5 100
Dako IS062 RTU (Carb-3) 3 100
Lymphoma Run: 119 Lymphoma Run: 119
BCL6 CD15
N % N %
_Ventana Benk CC1 (8mins) 0 0 1 0Dako Omnis 12 92 10 100Dako PTLink 14 71 14 100NOP QRSRTU VT Module 1 100 1 100Leica ER1 10 mins 1 0 1 100Leica ER1 20 mins 0 0 7 100Leica ER1 30 mins 2 50 6 100Leica ER2 10 mins 0 0 1 100Leica ER2 20 mins 36 92 32 28Leica ER2 30 mins 22 82 7 71Leica ER2 40 mins 4 100 2 100WRXYTZOQ[ 1 100 0 0None 0 0 1 100VY[SS\Y[ ]TT^[Y RU WRXYTZOQ[ `Q[U 0 0 1 100Ventana CC1 24mins 1 0 2 50Ventana CC1 32mins 8 75 10 90Ventana CC1 36mins 1 100 3 100Ventana CC1 40mins 4 100 3 100Ventana CC1 48mins 8 88 7 100Ventana CC1 52mins 1 100 1 100Ventana CC1 56mins 5 100 5 100Ventana CC1 64mins 42 95 36 94Ventana CC1 72mins 2 100 0 0Ventana CC1 76mins 4 75 3 100Ventana CC1 80mins 1 100 0 0Ventana CC1 88mins 3 100 0 0Ventana CC1 8mins 0 0 1 100Ventana CC1 92mins 6 83 2 100Ventana CC1 extended 4 100 2 100Ventana CC1 mild 0 0 1 100Ventana CC1 standard 10 100 18 89Ventana CC2 32mins 0 0 1 100Ventana CC2 64mins 1 100 1 100aater bath 95-98 OC 2 0 2 50
Heat Mediated Retrieval
BCL6 CD15
N % N %
AS PER KIT 4 100 3 67Dako Protease (S2019) 1 0 1 0NOT APPLICABLE 107 88 76 80Ventana Protease 0 0 1 0
Enzyme Mediated Retrieval
Lymphoma Run: 119 Lymphoma Run: 119
© Copyright UK NEQAS ICC & ISH - Not for publication without written permission
40

Run 119 LYMPHOMA Module
BCL6 CD15
N % N %
AS PER KIT 13 77 20 70BioGenex HRP (HK 519-06K) 1 100 0 0Dako EnVision FLEX ( K8000/10) 4 75 7 100Dako EnVision FLEX+ ( K8002/12) 15 80 10 100Dako Envision+ HRP mouse K4004/5/6/7 1 100 1 100Dako REAL HRP/DAB (K5001 ) 1 0 1 0Leica Bond Polymer Define (DS9713) 1 0 1 0Leica Bond Polymer Refine (DS9800) 57 86 42 60NOT APPLICABLE 1 100 2 100Other 4 100 3 100Power Vision DPVB999 HRP 1 100 1 100Ventana iView system (760-091) 1 0 1 100Ventana OptiView (760-700) + Amp. (7/860-099) 10 80 3 100Ventana OptiView Kit (760-700) 48 96 40 95Ventana UltraView Kit (760-500) 34 97 43 91
Detection
BCL6 CD15
N % N %
AS PER KIT 26 96 38 79BioGenex liquid DBA (HK-124-7K) 1 100 0 0DAKO DAB+ 1 100 2 100Dako DAB+ Liquid (K3468) 1 100 1 100Dako EnVision Plus kits 1 0 2 100Dako FLEX DAB 23 78 18 100Dako REAL K5001 DAB 1 0 1 0Leica Bond Polymer Refine kit (DS9800) 59 83 45 58Other 10 100 6 100Ventana DAB 33 91 25 96Ventana iview 1 100 2 100Ventana Ultraview DAB 40 90 47 91
Chromogen
Lymphoma Run: 119 Lymphoma Run: 119
BCL6 CD15
N % N %
Dako Autostainer Link 48 14 64 16 100Dako Autostainer plus 0 0 1 100Dako Autostainer Plus Link 2 50 0 0Dako Omnis 12 92 10 100LabVision Autostainer 0 0 1 100Leica Bond Max 25 72 18 50Leica Bond-III 41 93 41 59Menarini - Intellipath FLX 1 0 1 0None (Manual) 1 100 0 0Other 1 100 1 100Ventana Benchmark GX 2 100 1 100Ventana Benchmark ULTRA 75 93 75 93Ventana Benchmark XT 23 91 21 95
Automation
Lymphoma Run: 119
Participant scored 19/20 (UK NEQAS Slide) and 20/20 (In House slide) using this method.
Primary Antibody:
Automation:
Method:
Main Buffer:
HMAR:
Dako Omnis
Dako FLEX kit
EAR:
Chromogen:
Detection:
Dako Omnis GA062 RTU (Carb-3) , 12 Mins, 32 ºC Prediluted
CD15 - Method 1
Dako Wash Buffer (S3006)
Dako Omnis, PH: 9
Dako FLEX DAB, 32 ºC., Time 1: 5 Mins
Dako EnVision FLEX ( K8000/10) , 20 Mins, 32 ºC
BEST METHODS - Gold Standard Antibody
A selection from just a few of the best methods employed by participants
Participant scored 20/20 (UK NEQAS Slide) and 19/20 (In House slide) using this method.
Primary Antibody:
Automation:
Method:
Main Buffer:
HMAR:
Dako Omnis
Dako FLEX+ kit
EAR:
Chromogen:
Detection:
Becton Dickinson 347420 (clone LEU M1) , 20 Mins, 21 ºC Dilution 1: 50
CD15 - Method 2
Dako FLEX wash buffer
Dako Omnis
NOT APPLICABLE
DAKO DAB+, 21 ºC., Time 1: 5 Mins
NOT APPLICABLE
© Copyright UK NEQAS ICC & ISH - Not for publication without written permission
41

Run 119 LYMPHOMA Module
Participant scored 20/20 (UK NEQAS Slide) and 19/20 (In House slide) using this method.
Primary Antibody:
Automation:
Method:
Main Buffer:
HMAR:
Ventana Benchmark ULTRA
Ventana Optiview
EAR:
Chromogen:
Detection:
Ventana 760 2504 , 20 Mins, 36 ºC Prediluted
CD15 - Method 3
Ventana reaction buffer (950-300), PH: 7.6
Ventana CC1 48mins, Buffer: CC1, PH: 7.8
Other, Time 1: 8 Mins
Ventana OptiView Kit (760-700) , 8 Mins, 36 ºC Prediluted
Participant scored 19/20 (UK NEQAS Slide) and 19/20 (In House slide) using this method.
Primary Antibody:
Automation:
Method:
Main Buffer:
HMAR:
Ventana Benchmark ULTRA
Ventana UltraView DAB
EAR:
Chromogen:
Detection:
Ventana 760 2504 , 60 Mins, 36 ºC Prediluted
CD15 - Method 4
Ventana reaction buffer (950-300)
Ventana CC1 standard
NOT APPLICABLE
Ventana Ultraview DAB
Ventana UltraView Kit (760-500) , 8 Mins, 37 ºC Prediluted
Participant scored 20/20 (UK NEQAS Slide) and 20/20 (In House slide) using this method.
Primary Antibody:
Automation:
Method:
Main Buffer:
HMAR:
Ventana Benchmark ULTRA
Ventana Optiview
EAR:
Chromogen:
Detection:
Ventana 760-4241 (1GI191E/A8) , 8 Mins, 36 ºC Prediluted
BCL6 - Method 1
Ventana reaction buffer (950-300)
Ventana CC1 64mins
NOT APPLICABLE
Ventana DAB, 36 ºC., Time 1: 8 Mins
Ventana OptiView Kit (760-700) , 8 Mins, 36 ºC Prediluted
BEST METHODS - Secondary Antibody
A selection from just a few of the best methods employed by participants
Participant scored 20/20 (UK NEQAS Slide) and 20/20 (In House slide) using this method.
Primary Antibody:
Automation:
Method:
Main Buffer:
HMAR:
Dako Omnis
Dako FLEX+ kit
EAR:
Chromogen:
Detection:
Dako RTU Omnis (PG-B6p) GA625 , 12 Mins, 22 ºC Prediluted
BCL6 - Method 2
Dako FLEX wash buffer
Dako Omnis, Buffer: FLEX TRS HIGH
Dako FLEX DAB, 22 ºC., Time 1: 5 Mins
Dako EnVision FLEX+ ( K8002/12) , 10 Mins, 22 ºC Prediluted
© Copyright UK NEQAS ICC & ISH - Not for publication without written permission
42

Run 119 LYMPHOMA Module
Participant scored 20/20 (UK NEQAS Slide) and 20/20 (In House slide) using this method.
Primary Antibody:
Automation:
Method:
Main Buffer:
HMAR:
Ventana Benchmark ULTRA
Ventana Optiview
EAR:
Chromogen:
Detection:
Novocastra NCL-L-BCL-6-564 (LN22) mm , 28 Mins, 36 ºC Dilution 1: 100
BCL6 - Method 3
Ventana reaction buffer (950-300)
Ventana CC1 56mins
NOT APPLICABLE
Ventana DAB, RT ºC., Time 1: 8 Mins
Ventana OptiView Kit (760-700) , 8 Mins, RT ºC Prediluted
Participant scored 20/20 (UK NEQAS Slide) and 20/20 (In House slide) using this method.
Primary Antibody:
Automation:
Method:
Main Buffer:
HMAR:
Dako Omnis
Dako FLEX kit
EAR:
Chromogen:
Detection:
Novocastra NCL-L-BCL-6-564 (LN22) mm , 30 Mins Dilution 1: 800
BCL6 - Method 4
Dako Wash Buffer (S3006)
Dako Omnis
NOT APPLICABLE
Dako FLEX DAB
Dako EnVision FLEX ( K8000/10) , 30 Mins
© Copyright UK NEQAS ICC & ISH - Not for publication without written permission
43

Gold Standard Second Antibody
Antigens Assessed: Ki67 EMA
Tissue Sections circulated: Meningioma and metastatic large cell neuroendocrine tumour
Extra-skeletal myxoid chondrosarcoma and meningioma
Number of Registered Participants: 59
Number of Participants this Run 58 (98%)
The Neuropathology Module Run 119
Neil Bilbe
Introduction
Gold Standard: MIB-1
Antigen Ki-67 is a nuclear protein that is associated with and may be necessary for cellular proliferation. Furthermore it is associated with ribosomal RNA transcription. Inactivation of antigen Ki-67 leads to inhibition of ribosomal RNA synthesis. Ki-67 is an excellent marker to determine the growth fraction of a given cell population. The fraction of Ki-67-positive tumour cells (the Ki-67 labelling index) is often correlated with the clinical course of cancer. The best-studied examples in this context are carcinomas of the prostate, brain, breast and nephroblastoma . For these types of tumours, the prognostic value for survival and tumour recurrence have repeatedly been proven in uni- and multivariate analysis. Ki-67 and MIB-1 monoclonal antibodies are directed against different epitopes of the same proliferation-related antigen. Ki-67 and MIB1 may be used on fixed sections. MIB-1 is used in clinical applications to determine the Ki-67 labelling index. One of its primary advantages over the original Ki-67 antibody (and the reason why it has essentially supplanted the original antibody for clinical use) is that it can be used on formalin-
fixed paraffin-embedded sections, after heat-mediated antigen retrieval.
Features of Optimal Immunostaining: Intense and well-localised nuclear staining of tumour cells
• Clean background
• No non-specific staining
• Adequate counterstain
Features of Suboptimal Immunostaining: • Weak, uneven, or lower than expected level of staining in
the tumour cells
• Diffuse staining
• High background or non-specific staining of cell types not expected to stain
• Excessive or very weak counterstain
References
1. Hsu DW et al, Use of MIB-1 (Ki-67) immunoreactivity in differentiating grade II and grade III gliomas. J Neuropathol Exp Neurol. 1997 Aug;56 (8):857-65. 2. Ralte AM, et al, Clinicopathological features, MIB-1 labeling index and apoptotic index in recurrent astrocytic tumours. Pathol Oncol Res. 2001; 7(4):267-78. 3. S. H Torp. Proliferative activity in human glioblastomas: evaluation of different Ki-67 equivalent antibodies. Mol Pathol 1997;50:198-200.
Second Antigen: EMA
Epithelial membrane antigen (EMA) labels epithelial cells in a wide variety of tissues and is a useful tool for the identification of neoplastic epithelia. EMA belongs to a heterogenous population of human milk fat globule (HMFG), proteins. HMFG is a complex secretory product of mammary epithelium and EMA can be recovered from the aqueous phase of skimmed milk following extraction in chloroform and methanol. Besides in milk, these proteins are present in a variety of epithelia of both normal and neoplastic types. A number of monoclonal and polyclonal antisera have been raised against these molecules and anti-EMA has been extensively studied in a large number of neoplastic conditions, most often in conjunction with other antibodies. EMA is valuable as a marker in the detection of breast carcinoma metastases in histological sections of liver, lymph node, and bone marrow, and is useful for differentiating anaplastic carcinoma from malignant lymphomas, and for the recognition of spindle cell epithelial malignancies.
Features of Optimal Immunostaining: • Specific staining in the tumour cells, and other epithelia
• Clean background with no non-specific staining.
Features of Sub-Optimal Immunostaining: • Weak or uneven staining of the metastatic tumour • Diffuse, poorly-localised staining. • Excessive background or non-specific specific staining.
References: 1. Cordell, J., Richardson, T. C., Pulford, K. A. F., Ghosh, A. K., Gatter, K. C., Heyderman, E. and Mason, D. Y.: Production of monoclonal antibodies against human epithelial membrane antigen for use in diagnostic
immunocytochemistry. Br. J. Cancer 52; 347-354, 1985
2.Heyderman E, Steele K, Ormerod MG (1979) A new antigen on the epithelial membrane: its immunoperoxidase localization in normal and neoplastic tissue. J Clin Pathol 32:35–39
3.Hitchcock E, Morris CS (1987) Cross reactivity of antiepithelial membrane monoclonal for reactive and neoplastic glial cells. J Neurooncol 4:345–352
Assessment Summary: 58 out of 59 participants submitted slides. One lab did not return any slides. A total of 232 slides/sections were assessed: G=58, H=58, J=58 K=58
The overall pass rate was 88% (204 slides), borderline 10% (24), and the failed slides rate was 2% (4). The average score for all slides was 16/20. The NEQAS slides averaged 15/20, In-house slides 16/20.
1) Summary Table - All Slides (MIB-1/Ki67 & EMA)
MIB-1/Ki 67 (G & H) The NEQAS (G) pass rate of 78% was down from the previous Run (83%), primarily because there were two failed slides; previously none. The sample this Run included a neuroendocrine tumour, which may have required a more robust protocol than the GBM that we normally pair with the meningioma. The two failed slides both had very weak staining reactions (see Report Image Fig. 4). Of the 11 slides which were assessed as borderline, all bar one (background staining) were due to weak staining (see Report Image Fig. 2).
Both failed slides used the Dako (M7240) MIB-1, diluted 1:100 and 1:75, with the Leica ER2 20 mins, Leica Bond Polymer Refine, on a Leica Bond III. Other participants using the same primary antibody gained excellent results, usually when combined with the Ventana platform, a less dilute solution; e.g. 1:50, and/or increased antigen retrieval times of at least 40 mins. The three slides which obtained scores of 20/20 employed different primaries: Dako M7240, Leica/Novocastra RTU (K2) PA0230, and Ventana RTU (30-9) 790-4286.
EMA (J & K) The overall results for EMA were slightly better than for the Ki 67, with 83% passing. Only one NEQAS (J) slide was assessed as a fail; using a protocol that appears to be successfully employed by other participants: (see Report Image Fig. 11). The main problem labs had was obtaining sufficient staining in both the chondrosarcoma and meningioma (example Report Image Fig. 10); typically one or other or both were weakly stained, resulting in a borderline score (10-12/20). Only one marker (Leica/Novocastra RTU (GP1.4) PA0035) achieved a 100% pass rate. Although this was used by only three participants, all using a Leica platform: ER1 or 2, Bond Polymer Refine on a Bond Max or Bond III. The single failed in-house slide (K) was due to poor choice of control material, a tonsil section with virtually no staining. The participant scored a low pass (13/20) for their NEQAS slide (J).
© UK NEQAS ICC & ISH. No part of this document can be copied or used without prior written consent 44

RUN 119 NEUROPATHOLOGY Module
Selected Images showing Optimal and Sub-optimal immunostaining
Fig 2. Sub-optimal Ki67 staining on the NEQAS neuroendocrine tissue. Tumours cells are a
lbccld edfgh flidbc fjdkmfcdln jdopqtcufcdjv wfgp xyz{| }x~���h ���||h �z obqt� Ventana CC1
64mins; using the RTU Ventana UltraView Kit (760-500), 12 mins; and the Ventana Benchmark
ULTRA.
Fig 1. Sub-optimal Ki67 demonstration on the NEQAS neuroendocrine portion; staining is
edfgh fqj c�dud bt tpod if�g�upmqj �mdh imc tcbll fttdttdj ft f �fttv �dpxfugdut���duop
Sci (SP6) RM 9106, 1:100, 15 mins; Leica ER2 20 mins; Leica Bond Polymer Refine (DS9800);
on the Leica Bond-III.
Fig 3. Optimal Ki67 demonstration on the NEQAS meningioma sample (A), and neuroendocrine
cmopmu }��v ~c eft ufud cp tdd �ubt� fqj fimqjfqc tcfbqbq� bq c�d odqbq�bpofv �db�f��p�p�ftcuf
RTU (K2) PA0230, 15 mins; Leica ER2 20 mins; RTU Leica Bond Polymer Refine (DS9800), 8
mins; on the Leica Bond-III.
Fig 4. Poor Ki67 demonstration on the NEQAS NE sample. Low power (A), and high power (B).
Staining is far too weak for diagnostic purposes, and the slide failed the assessment. Dako
M7240 (MIB1), 1;100, 30 mins; Leica ER2 20 mins; Leica Bond Polymer Refine (DS9800), 8
mins; on a Leica Bond-III.
Fig 5. Sub-optimal Ki67 staining on the NEQAS neuroendocrine tissue, there are some
non-specific reactions. Slide assessed as a low pass. Biocare CRM325C Ki67 (SP6), 1:30, 24
mins; Ventana CC1 64 mins; RTU Ventana UltraView Kit (760-500), 8 mins; on the Ventana
Benchmark ULTRA.
Fig 6. Sub-optimal Ki67 demonstration in the NEQAS neuroendocrine piece; there is
�upqpmq�dj if�g�upmqj�qpq�t�d�b�b� tcfbqbq� bq tpod fudftv ��fbq c�d tlbjd fttdttdj ft
fjdkmfcd �pu jbf�qptbtv �dqqp�f AP10244C (SP6), 1:200, 72 mins; Ventana CC1 std; on the
Ventana Benchmark XT.
© Copyright UK NEQAS ICC & ISH - Not for publication without written permission
45

RUN 119 NEUROPATHOLOGY Module
Selected Images showing Optimal and Sub-optimal {@stainingtext}
Fig 8. Sub- optimal EMA demonstration on the NEQAS meningioma portion. Staining is weak,
and much of the tumour is negative. Slide assessed as borderline. Dako FLEX RTU (E29)
IR629, 20 mins; Dako PTLink, 30 mins; with RTU Dako OMNIS Flex+, 20 mins; on the Dako
Omnis platform.
Fig 7. Optimal EMA demonstration on the NEQAS meningioma (A), and chondrosarcoma (B)
�������� ���� ������ ���� ��������� ����¡ ����¡�¡¢ �£ ��� ����¤��� Ventana RTU 790-4463, 20
mins; Ventana CC1 48 mins; RTU Ventana OptiView ¥¦§¨©¦¨¨ª « ¬��� ¥¦®§¨©¨¯¯ª °§ ��¡�±
on a Ventana Benchmark ULTRA.
ig 10. Sub-optimal EMA demonstration on the NEQAS chondrosarcoma (A), and meningioma
¥�ª± ����¡�¡¢ ��¤�² ³� ��´� ��������� �¡² �¡��¡��� µ�� ���²� ¢��¡�² � ��� ���� �¡ ���
assessment. Ventana Confirm anti-EMA (E29) 790-4463, RTU, 32 mins; CC1 32 mins; with
Ventana OptiView Kit (760-700); on the Ventana Benchmark ULTRA.
Fig 9. Sub-optimal EMA demonstration on the NEQAS meningioma (B), and chondrosarcoma
(A), samples. Staining is feint and wispy with some background reaction, again scored as
borderline. RTU Dako (E29) M0613, 32 mins; Ventana CC1 36 mins; RTU Ventana UltraView
Kit (760-500), 12 mins; and the Ventana Benchmark ULTRA,
Fig 12. Excellent EMA demonstration on an in-house sample from a meningioma case. The
����¡�¡¢ �� ��������� �¡² ��� ³��¶¢´�¤¡² ����¡� ·�¶� ¥¸¹¯ª º¨§°» °¼»¨¨ °½ ��¡�± ¾���� ¸¿¹
20 mins at pH9; RTU Leica Bond Polymer Refine (DS9800), 8 mins; on the Leica Bond Max
platform.
Fig 11. Poor (failed) EMA demonstration on the NEQAS chondrosarcoma (A), and meningioma
(B). There is no staining in the sarcoma (A), and mainly non-tumour staining in the meningioma
(B). Dako (E29) M0613, 1:75, 16 mins; CC1 20 mins; Ventana UltraView Kit (760-500); and the
Ventana Benchmark XT.
© Copyright UK NEQAS ICC & ISH - Not for publication without written permission
46

Run 119 NEUROPATHOLOGY Module
0
2
4
6
8
10
12
14
16
4 5 6 7 8 9 10 11 12 13 14 15 16 17 18 19 20
Scores
no
. o
f re
turn
s
RUN 119G Ki-67 / MIB1 on NEQAS Sections
ALL PARTICIPANTS Individual
Scores
4 = 0 (0%)
5 = 0 (0%)
6 = 0 (0%)
7 = 0 (0%)
8 = 1 (2%)
9 = 1 (2%)
10 = 2 (3%)
11 = 3 (5%)
12 = 6 (10%)
13 = 3 (5%)
14 = 5 (9%)
15 = 4 (7%)
16 = 16 (28%)
17 = 8 (14%)
18 = 4 (7%)
19 = 2 (3%)
20 = 3 (5%)
GRAPHICAL REPRESENTATION OF PASS RATES
RUN 119G Ki-67 / MIB1 on NEQAS Sections
UK PARTICIPANTS
0
1
2
3
4
5
6
7
8
4 5 6 7 8 9 10 11 12 13 14 15 16 17 18 19 20
Scores
no
. o
f re
turn
s
Individual
Scores
4 = 0 (0%)
5 = 0 (0%)
6 = 0 (0%)
7 = 0 (0%)
8 = 0 (0%)
9 = 1 (4%)
10 = 0 (0%)
11 = 3 (11%)
12 = 3 (11%)
13 = 1 (4%)
14 = 1 (4%)
15 = 2 (7%)
16 = 8 (29%)
17 = 5 (18%)
18 = 1 (4%)
19 = 1 (4%)
20 = 2 (7%)
Summary
16 - 20 = 33 (57%)
13 - 15 = 12 (21%)
10 - 12 = 11 (19%)
0 - 9 = 2 (3%)
Median = 14.00
Summary
16 - 20 = 17 (61%)
13 - 15 = 4 (14%)
10 - 12 = 6 (21%)
0 - 9 = 1 (4%)
Median = 15.00
0
2
4
6
8
10
12
14
16
18
4 5 6 7 8 9 10 11 12 13 14 15 16 17 18 19 20
Scores
no
. o
f re
turn
s
RUN 119H Ki-67 / MIB1 on in-house Sections
ALL PARTICIPANTSIndividual
Scores
4 = 0 (0%)
5 = 0 (0%)
6 = 0 (0%)
7 = 0 (0%)
8 = 0 (0%)
9 = 0 (0%)
10 = 0 (0%)
11 = 0 (0%)
12 = 1 (2%)
13 = 3 (5%)
14 = 4 (7%)
15 = 8 (14%)
16 = 17 (29%)
17 = 13 (22%)
18 = 10 (17%)
19 = 2 (3%)
20 = 0 (0%)0
1
2
3
4
5
6
7
8
4 5 6 7 8 9 10 11 12 13 14 15 16 17 18 19 20
Scores
no
. o
f re
turn
s
RUN 119H Ki-67 / MIB1 on in-house Sections
UK PARTICIPANTSIndividual
Scores
4 = 0 (0%)
5 = 0 (0%)
6 = 0 (0%)
7 = 0 (0%)
8 = 0 (0%)
9 = 0 (0%)
10 = 0 (0%)
11 = 0 (0%)
12 = 1 (4%)
13 = 2 (7%)
14 = 1 (4%)
15 = 3 (11%)
16 = 7 (25%)
17 = 8 (29%)
18 = 5 (18%)
19 = 1 (4%)
20 = 0 (0%)
Summary
16 - 20 = 42 (72%)
13 - 15 = 15 (26%)
10 - 12 = 1 (2%)
0 - 9 = 0 (0%)
Median = 15.50
Summary
16 - 20 = 21 (75%)
13 - 15 = 6 (21%)
10 - 12 = 1 (4%)
0 - 9 = 0 (0%)
Median = 15.50
© Copyright UK NEQAS ICC & ISH - Not for publication without written permission
47

Run 119 NEUROPATHOLOGY Module
0
2
4
6
8
10
12
14
4 5 6 7 8 9 10 11 12 13 14 15 16 17 18 19 20
Scores
no
. o
f re
turn
s
RUN 119J Epithelial Membrane Antigen (EMA) on NEQAS Sections
ALL PARTICIPANTSIndividual
Scores
4 = 0 (0%)
5 = 0 (0%)
6 = 0 (0%)
7 = 0 (0%)
8 = 1 (2%)
9 = 0 (0%)
10 = 1 (2%)
11 = 4 (7%)
12 = 4 (7%)
13 = 5 (9%)
14 = 6 (10%)
15 = 6 (10%)
16 = 14 (24%)
17 = 7 (12%)
18 = 3 (5%)
19 = 7 (12%)
20 = 0 (0%)
GRAPHICAL REPRESENTATION OF PASS RATES
0
1
2
3
4
5
6
7
4 5 6 7 8 9 10 11 12 13 14 15 16 17 18 19 20
Scores
no
. o
f re
turn
s
RUN 119J Epithelial Membrane Antigen (EMA) on NEQAS Sections
UK PARTICIPANTSIndividual
Scores
4 = 0 (0%)
5 = 0 (0%)
6 = 0 (0%)
7 = 0 (0%)
8 = 0 (0%)
9 = 0 (0%)
10 = 1 (4%)
11 = 1 (4%)
12 = 3 (11%)
13 = 2 (7%)
14 = 4 (14%)
15 = 1 (4%)
16 = 7 (25%)
17 = 4 (14%)
18 = 0 (0%)
19 = 5 (18%)
20 = 0 (0%)
Summary
16 - 20 = 31 (53%)
13 - 15 = 17 (29%)
10 - 12 = 9 (16%)
0 - 9 = 1 (2%)
Median = 14.00
Summary
16 - 20 = 16 (57%)
13 - 15 = 7 (25%)
10 - 12 = 5 (18%)
0 - 9 = 0 (0%)
Median = 14.00
0
4
8
12
16
20
4 5 6 7 8 9 10 11 12 13 14 15 16 17 18 19 20
Scores
no
. o
f re
turn
s
RUN 119K Epithelial Membrane Antigen (EMA) on in-house Sections
ALL PARTICIPANTSIndividual
Scores
4 = 0 (0%)
5 = 0 (0%)
6 = 0 (0%)
7 = 0 (0%)
8 = 1 (2%)
9 = 0 (0%)
10 = 0 (0%)
11 = 1 (2%)
12 = 2 (3%)
13 = 0 (0%)
14 = 4 (7%)
15 = 5 (9%)
16 = 19 (33%)
17 = 15 (26%)
18 = 6 (10%)
19 = 4 (7%)
20 = 1 (2%)
RUN 119K Epithelial Membrane Antigen (EMA) on in-house Sections
UK PARTICIPANTS
0
2
4
6
8
10
4 5 6 7 8 9 10 11 12 13 14 15 16 17 18 19 20
Scores
no
. o
f re
turn
s
Individual
Scores
4 = 0 (0%)
5 = 0 (0%)
6 = 0 (0%)
7 = 0 (0%)
8 = 1 (4%)
9 = 0 (0%)
10 = 0 (0%)
11 = 0 (0%)
12 = 0 (0%)
13 = 0 (0%)
14 = 2 (7%)
15 = 3 (11%)
16 = 9 (32%)
17 = 8 (29%)
18 = 3 (11%)
19 = 2 (7%)
20 = 0 (0%)
Summary
16 - 20 = 45 (78%)
13 - 15 = 9 (16%)
10 - 12 = 3 (5%)
0 - 9 = 1 (2%)
Median = 15.50
Summary
16 - 20 = 22 (79%)
13 - 15 = 5 (18%)
10 - 12 = 0 (0%)
0 - 9 = 1 (4%)
Median = 16.00
© Copyright UK NEQAS ICC & ISH - Not for publication without written permission
48

Run 119 NEUROPATHOLOGY Module
ANTIBODIES AND OTHER TECHNICAL PARAMETERS EMPLOYED BY PARTICIPANTS IN THE
NEUROPATHOLOGY MODULE
The following tables record the number of participants (N) using each primary antibody and the percentage (%) of these
participants achieving acceptable staining (scores 12/20) on UK NEQAS sections.
Antibody Details N %
Primary Antibody : Ki-67 / MIB1
Dako M7240 (MIB1) 30 63NeoMarkers/Thermo Sci (SP6) RM 9106 1 100Leica/Novocastra (MM1) NCL-Ki67-CE 1 100Other 2 100Leica/Novocastra RTU (MM1) PA0118 2 50Leica/Novocastra RTU (K2) PA0230 3 100Ventana RTU (30-9) 790-4286 9 100Dako FLEX RTU (MIB1) IR626 2 100DAKO FLEX RTU Omnis (MIB1) GA626 6 83Gennova AP10244C (SP6) 1 100
Antibody Details N %
Primary Antibody : Epithelial Membrane Antigen (EMA)
Dako (E29) M0613 29 83
Leica/Novocastra (GP1.4) NCL-EMA 7 71
Other 7 86
Ventana (E29) 760-4259 4 75
Leica/Novocastra RTU (GP1.4) PA0035 3 100
Dako FLEX RTU (E29) IR629 7 86
Neuropathology Run: 119 Neuropathology Run: 119
Epithelial
Membrane
Antigen (EMA)
Ki-67 / MIB1
N % N %
Dako Omnis 6 100 8 88Dako PTLink 4 50 3 100Lab vision PT Module 1 100 1 100Leica ER1 20 mins 8 100 0 0Leica ER2 20 mins 6 100 11 64Leica ER2 30 mins 0 0 3 67Leica ER2 40 mins 0 0 1 100None 2 50 0 0Other 1 100 2 100Ventana CC1 16mins 1 0 0 0Ventana CC1 20mins 1 0 0 0Ventana CC1 24mins 0 0 1 100Ventana CC1 32mins 4 100 5 60Ventana CC1 36mins 4 25 2 50Ventana CC1 40mins 1 100 0 0Ventana CC1 48mins 2 100 2 100Ventana CC1 56mins 0 0 1 100Ventana CC1 64mins 8 88 9 78Ventana CC1 72mins 1 100 0 0Ventana CC1 mild 3 67 3 33Ventana CC1 standard 2 100 2 100Ventana CC2 64mins 0 0 2 100Water bath 95-98 OC 1 100 1 100
Heat Mediated Retrieval
Epithelial
Membrane
Antigen (EMA)
Ki-67 / MIB1
N % N %
NOT APPLICABLE 29 90 36 75ÀÁÂ ÁÃÄÅ ÆÄÇÈÉÊ Ë 1 100 0 0
Enzyme Mediated Retrieval
Neuropathology Run: 119 Neuropathology Run: 119
© Copyright UK NEQAS ICC & ISH - Not for publication without written permission
49

Run 119 NEUROPATHOLOGY Module
Epithelial
Membrane
Antigen (EMA)
Ki-67 / MIB1
N % N %
AS PER KIT 5 100 8 75Dako EnVision FLEX ( K8000/10) 3 100 4 100Dako EnVision FLEX+ ( K8002/12) 4 75 4 100Dako Envision HRP/DAB ( K5007) 1 100 1 100Leica Bond Polymer Refine (DS9800) 14 93 14 64Other 1 0 1 100Power Vision DPVB999 HRP 1 100 1 100Ventana OptiView (760-700) + Amp. (7/860-099) 2 100 0 0Ventana OptiView Kit (760-700) 9 89 10 80Ventana UltraView Kit (760-500) 16 63 14 71
Detection
Epithelial
Membrane
Antigen (EMA)
Ki-67 / MIB1
N % N %
AS PER KIT 9 100 10 90Dako DAB+ Liquid (K3468) 1 100 1 100Dako DAB+ REAL Detection (K5001) 1 100 1 100Dako EnVision Plus kits 2 50 1 0Dako FLEX DAB 7 86 8 100Leica Bond Polymer Refine kit (DS9800) 14 93 15 67Other 2 100 2 50Ventana DAB 5 80 4 100Ventana Ultraview DAB 16 63 15 67
Chromogen
Neuropathology Run: 119 Neuropathology Run: 119
Epithelial
Membrane
Antigen (EMA)
Ki-67 / MIB1
N % N %
Dako Autostainer Link 48 3 67 3 100Dako Autostainer Plus Link 1 100 0 0Dako Omnis 7 86 8 88Leica Bond Max 7 100 4 75Leica Bond X 1 100 0 0Leica Bond-III 8 88 11 73None (Manual) 1 100 2 50Other 1 100 1 100Ventana Benchmark GX 1 100 0 0Ventana Benchmark ULTRA 21 76 22 86Ventana Benchmark XT 6 67 6 33
Automation
Neuropathology Run: 119
Participant scored 18/20 (UK NEQAS Slide) and 17/20 (In House slide) using this method.
Primary Antibody:
Automation:
Method:
Main Buffer:
HMAR:
Leica Bond-III
Leica BondMAx Refine KIT
EAR:
Chromogen:
Detection:
Dako M7240 (MIB1)
Ki-67 / MIB1 - Method 1
Bond Wash Buffer (AR9590)
Leica ER2 40 mins
Leica Bond Polymer Refine kit (DS9800)
Leica Bond Polymer Refine (DS9800)
BEST METHODS - Gold Standard Antibody
A selection from just a few of the best methods employed by participants
Participant scored 20/20 (UK NEQAS Slide) and 16/20 (In House slide) using this method.
Primary Antibody:
Automation:
Method:
Main Buffer:
HMAR:
Leica Bond-III
Leica BondMAx Refine KIT
EAR:
Chromogen:
Detection:
Leica/Novocastra RTU (K2) PA0230 , 15 Mins, rt ºC Prediluted
Ki-67 / MIB1 - Method 2
Bond Wash Buffer (AR9590)
Leica ER2 20 mins
NOT APPLICABLE
Leica Bond Polymer Refine kit (DS9800), Time 1: 5 Mins
Leica Bond Polymer Refine (DS9800) , 8 Mins, rt ºC Prediluted
© Copyright UK NEQAS ICC & ISH - Not for publication without written permission
50

Run 119 NEUROPATHOLOGY Module
Participant scored 20/20 (UK NEQAS Slide) and 17/20 (In House slide) using this method.
Primary Antibody:
Automation:
Method:
Main Buffer:
HMAR:
Ventana Benchmark ULTRA
Ventana UltraView DAB
EAR:
Chromogen:
Detection:
Dako M7240 (MIB1) , 48 Mins, RT ºC Dilution 1: 50
Ki-67 / MIB1 - Method 3
Ventana reaction buffer (950-300)
Ventana CC1 64mins
NOT APPLICABLE
Ventana Ultraview DAB
Ventana UltraView Kit (760-500)
Participant scored 20/20 (UK NEQAS Slide) and 18/20 (In House slide) using this method.
Primary Antibody:
Automation:
Method:
Main Buffer:
HMAR:
Leica Bond Max
Leica BondMAx Refine KIT
EAR:
Chromogen:
Detection:
Ventana RTU (30-9) 790-4286 , 15 Mins Prediluted
Ki-67 / MIB1 - Method 4
Bond Wash Buffer (AR9590)
Leica ER2 20 mins
Leica Bond Polymer Refine kit (DS9800), Time 1: 10 Mins
Leica Bond Polymer Refine (DS9800) , 8 Mins Prediluted
Participant scored 17/20 (UK NEQAS Slide) and 19/20 (In House slide) using this method.
Primary Antibody:
Automation:
Method:
Main Buffer:
HMAR:
Leica Bond-III
Leica BondMAx Refine KIT
EAR:
Chromogen:
Detection:
Leica/Novocastra RTU (GP1.4) PA0035 , 15 Mins, rt ºC Prediluted
Epithelial Membrane Antigen (EMA) - Method 1
Bond Wash Buffer (AR9590)
Leica ER2 20 mins
NOT APPLICABLE
Leica Bond Polymer Refine kit (DS9800), rt ºC., Time 1: 5 Mins
Leica Bond Polymer Refine (DS9800)
BEST METHODS - Secondary Antibody
A selection from just a few of the best methods employed by participants
Participant scored 19/20 (UK NEQAS Slide) and 17/20 (In House slide) using this method.
Primary Antibody:
Automation:
Method:
Main Buffer:
HMAR:
Ventana Benchmark GX
Ventana UltraView DAB
EAR:
Chromogen:
Detection:
Dako (E29) M0613 , 32 Mins, 37 ºC Dilution 1: 25
Epithelial Membrane Antigen (EMA) - Method 2
Ventana reaction buffer (950-300)
Ventana CC1 mild
NOT APPLICABLE
Ventana Ultraview DAB
Ventana UltraView Kit (760-500)
© Copyright UK NEQAS ICC & ISH - Not for publication without written permission
51

Run 119 NEUROPATHOLOGY Module
Participant scored 19/20 (UK NEQAS Slide) and 19/20 (In House slide) using this method.
Primary Antibody:
Automation:
Method:
Main Buffer:
HMAR:
Leica Bond-III
Leica BondMAx Refine KIT
EAR:
Chromogen:
Detection:
Dako (E29) M0613 , 15 Mins, RT ºC Dilution 1: 1/200
Epithelial Membrane Antigen (EMA) - Method 3
Bond Wash Buffer (AR9590)
Leica ER2 20 mins
NOT APPLICABLE
Leica Bond Polymer Refine kit (DS9800), Time 1: 10 Mins, Time 2: 5 Mins
Leica Bond Polymer Refine (DS9800) , 8 Mins, RT ºC Prediluted
Participant scored 19/20 (UK NEQAS Slide) and 16/20 (In House slide) using this method.
Primary Antibody:
Automation:
Method:
Main Buffer:
HMAR:
Dako Omnis
Dako FLEX kit
EAR:
Chromogen:
Detection:
Dako FLEX RTU (E29) IR629 , 20 Mins, 32 ºC Prediluted
Epithelial Membrane Antigen (EMA) - Method 4
Dako FLEX wash buffer
Dako Omnis, Buffer: EnV FLEX TRS high PH
Dako FLEX DAB, 32 ºC., Time 1: 5 Mins
Dako EnVision FLEX ( K8000/10) , 20 Mins Prediluted
© Copyright UK NEQAS ICC & ISH - Not for publication without written permission
52

Gold Standard Second Antibody
Antigens Assessed: Ki 67 CD45
Sample circulated; cytospins and cell block sections:
Hypopharyngeal carcinoma cell line Cell suspension from non-Hodgkin's lymphoma
Number of Registered Participants: 87-67 Cell block (77%), 20 Cytospins (23%).
Number of Participants this Run 87 (100%)
The Cytology Module Run 119
Neil Bilbe and Irena Srebotnik Kirbis
Introduction
Gold Antigen: Ki 67
Antigen Ki-67 is a nuclear protein that is associated with and may be necessary for cellular proliferation. Furthermore it is associated with ribosomal RNA transcription. Inactivation of antigen Ki-67 leads to inhibition of ribosomal RNA synthesis. Ki-67 is an excellent marker to determine the growth fraction of a given cell population. The fraction of Ki-67-positive tumour cells (the Ki-67 labelling index) is often correlated with the clinical course of cancer. The best-studied examples in this context are carcinomas of the prostate, brain and the breast and nephroblastoma . For these types of tumours, the prognostic value for survival and tumour recurrence have repeatedly been proven in uni- and multivariate analysis. Ki-67 and MIB-1 monoclonal antibodies are directed against different epitopes of the same proliferation related antigen. MIB-1 is used in clinical applications to determine the Ki-67 labelling index. Both Ki-67 and MIB-1 may be used on fixed sections.
References
1. P A Hall, et al. The prognostic value of Ki67 immunostaining in non-
Hodgkin’s lymphoma. J Pathol 1988; 154:223-35
2. D C Brown, et al. Proliferation in non-Hodgkin's lymphoma: a comparison of Ki67 staining on fine needle aspiration and cryostat sections. J Clin Pathol 1990;43:325-328
Features of Optimal Immunostaining: • Intense and well-localised nuclear staining of tumour cells
• Clean background
• No non-specific staining
• Adequate counter-stain
Features of Suboptimal Immunostaining: • Weak, uneven, or lower than expected level of staining in the
tumour cells
• Diffuse staining
• High background or non-specific staining of cell types not expected to stain
• Excessive or very weak counterstain
Second Antigen: CD45
Protein tyrosine phosphatase, receptor type, C also known as PTPRC is an enzyme that, in humans, is encoded by the PTPRC gene. PTPRC is also known as CD45 antigen, originally called leukocyte common antigen (LCA). It is a type I transmembrane protein that is in various forms present on all differentiated hematopoietic cells except erythrocytes and plasma cells that assists in the activation of those cells (a form of co-stimulation). It is expressed in lymphomas, B-cell chronic lymphocytic leukaemia, hairy cell leukaemia, and acute non-lymphocytic leukaemia. A monoclonal antibody to CD45 is used in routine immunohistochemistry to differentiate between lymphomas and carcinomas.
Features of Optimal Immunostaining: • Strong, cell membrane staining of lymphocytes and NHL cells
• Clean background
• No non-specific staining of other cell types not expected to stain
• Adequate nuclear counterstain
Features of Sub-Optimal Immunostaining: • Weak, diffuse or partial membrane staining of lymphocytes
• Uneven staining
• Excessive background staining
• Non-specific staining of cell types or components not expected to stain
• Inadequate nuclear counterstain
References
1. Leong A, et al. Manual of Diagnostic Cytology (2nd ed.) Greenwich Medical Media Ltd. pp. 121-124. 2.Prasad RR, et al. Fine-needle aspiration cytology in the diagnosis of superficial lymphadenopathy: an analysis of 2,418 cases. Diagn Cytopathol. 1996; 15:382-386. 3.Hehn ST, et al. Utility of fine-needle aspiration as a diagnostic technique in lymphoma. J Clin Oncol. 2004; 22: 3046-3052. 4.Gong JZ, et al. Diagnostic impact of core-needle biopsy on fine-needle aspiration of non-Hodgkin lymphoma. Diagn Cytopathol. 2004; 31: 23-30. 5. Levien PH, et al. Role of fine-needle aspiration cytology in breast lymphoma. Diagn Cytopathol. 2004; 30: 332-340.
References (cell blocks in cytology) 1. Xin Jing, et al,. Morphologic and Immunocytochemical Performances of
Effusion Cell Blocks Prepared Using 3 Different Methods. (2013) American Journal of Clinical Pathology, 139, 177-182
2. Nithyananda A. Nathan, et al, Cell Block Cytology. Improved Preparation and Its Efficacy in Diagnostic Cytology. (2000) American Journal of Clinical Pathology, 114, 599-606.
3. Hirofumi Sakamoto, et al, Use of Liquid-Based Cytology (LBC) and Cell Blocks from Cell Remnants for Cytologic, Immunohistochemical, and Immunocytochemical Diagnosis of Malignancy. Open Journal of Pathology, Vol. 2 No. 3 (2012), Article ID: 21116, 8 pages
Assessment Summary: All participants (87) submitted at least two slides. One lab did not submit any in-house control slides (S & U). This resulted in 346 slides for the assessors to score: R = 87, S = 86, T = 87, U = 86.
Assessment Outcomes: The overall pass rate was 93.1% (322 slides), 6.6% borderline (23), and a 0.3% failure rate (1). The average score for all slides was 16/20.
Examples of the immunocytochemical reactions on NEQAS slides prepared in a reference/supplier laboratory
Fig.1 Ki-67 NEQAS Cytospin Fig.2 Ki-67 NEQAS Cell Block
Fig.3 CD45 NEQAS Cytospin Fig.4 CD45 NEQAS Cell Block
© UK NEQAS ICC & ISH. No part of this document can be copied or used without prior written consent 53

The Cytology Module Run 119
(1) Summary Table - All Slides:
Ki 67 (R & S) The assessment outcome of a 91% pass rate for the NEQAS Ki 67 slides (R), was very similar to that for Run 118 (92% pass rate). For this Run there was a single failed slide, which was on a NEQAS cytospin sample. The participant employed the Dako 7240 (MIB-1) at 1:50, without retrieval on the Ventana Benchmark XT platform. The staining was very weak, but additionally appears to show morphological damage (see Image Report Fig 5). Other cytospin users with similar protocols achieved excellent results, and overall the antibody (Dako M7240) had a 95% pass rate for all labs (39/41 users). There were four slides which scored 20/20, two were cytospins (See Images Report Fig 2) and two were cell block samples. The protocols employed on these slides are shown in the table below (2) and show very similar methodologies for each of the two sample types (CS and CB). For the in-house controls (S), 16 participants (19%) submitted a sample, other than a FFPE section, which is close to the level of labs requesting cytospin preparations of 23%. (2) Best Performing Methods Ki67: NEQAS Samples (R)
CD45 (T & U)
The participants performed marginally better overall with the NEQAS CD45 (T) than with the Ki 67 NEQAS samples (R), with 82/87 labs passing the assessment (94%), compared to 92% for the Ki 67 slides 79/87 .
What was more encouraging, was the improvement in pass rate from the last CD45 request in Run 116, where only 86% of participants passed the assessment. Additionally, there were three failed slides on the NEQAS samples in Run 116, whereas none failed for the Run 119 assessments.
The most significant finding when analysing the CD45 NEQAS slides (T) was that the best performing slides for this marker, were all on cell block sections (e.g. see Images Report Fig 11). No cytospin slide scored greater than 17/20.
Unlike the Ki 67 methods, there was a spread of differing protocols. See the table below (3):
(3) Best Performing Methods CD45: NEQAS Samples (T):
The number of labs who submitted an in-house sample (U) other than tissue sections was of a similar magnitude to the Ki 67 slides (S), with 17% doing so (15/86) for CD45.
Cell Block v Cytospins
(4) Summary Table - Average Scores NEQAS Samples:
The outcomes for the cell block (CB) and cytospin (CS) samples does not vary significantly from run to run, with average scores usually varying between 14 and 17. The one constant is that the average scores for cell blocks are usually higher than those for the cytospin submissions. An example is the current run, where the cell blocks averaged 16/20 and the cytospins 15/20 for both antigens (see table 4 above).
It is worth stating, that on more than one occasion, the very best performing slides have been cytospins, it is only the average scores for all participants, where the cell blocks outperform cytospins.
There could be several reasons for this:
• Protocols, reagents and platforms designed and validated primarily for FFPE sections….
• ...particularly where antigen retrieval is important - many cytospin users routinely avoid or omit any HMAR steps
• The percentage of users from one or more regions and their preferred choice of sample in conjunction with their platforms, may also play a part
(5) Average Scores NEQAS Cytospin Samples w/wo Retrieval:
The first thing to emphasise is, as mentioned in previous write ups on the Cytopathology module, the accuracy as to whether a participant has used an antigen retrieval step on the NEQAS samples or not, requires them to use the Radio Buttons below the Antigen Retrieval section (YES or NO)*. If the data is correct, then the table (5) shows that the retrieved NEQAS samples (R & T) performed better than the non-retrieved, but significantly more so for the Ki 67 slides (R) *For example this Cytospin user has indicated that they have not used any retrieval method on the NEQAS cytospin sample (R) for the Ki 67 antigen, but they have entered a retrieval method from the HMAR drop down menu: Ventana CC1 8 mins.
Their in-house sample (S) is given as a cytospin. If all this data is taken literally, this means that antigen retrieval has been carried out the in-house sample, but not on the NEQAS sample! The participant scored 16 for their NEQAS (R) cytospin (no retrieval), but only 11 on their in-house (S) cytospin (retrieved). N.B. Laboratory scored 16 for both their CD45 slides (T & U), where retrieval was ? only used on an in-house (U) cytospin.
54

RUN 119 CYTOLOGY Module
Selected Images showing Optimal and Sub-optimal Immunostaining
Fig 2. Optimal Ki67 demonstration on a NEQAS cytospin. Staining of the tumour nuclei is very
precise, and prominent nucleoli are also seen. Dako 7240 (MIB-1), 1:100, 32 mins; Ventana
CC1 64 mins, with the RTU Ventana UltraView Kit (760-500) 12 mins, on the Ventana
Benchmark ULTRA.
Fig 1. Optimal Ki67 demonstration on a NEQAS cell block. Nuclear staining of the tumour cells
ÌÍ ÎÏÐÑÒÓ ÎÔÌÍÕ ÑÒÖ ÕÔÐÎÌÍÐ× ØÙÚÐ ÒÐÛÑÜÌÝÐÍ ÑÔÐ ÑÏÍÙ ÕÔÐÍÐÒÜ× ÞÑßÙ àáâã äåæçèéêÓ éëéããì íÌÜî
Ventana CC1 32 mins at pH9; using the RTU Ventana OptiView Kit (760-700) for 16 mins on
the Ventana Benchmark ULTRA.
ïÌÛ ð× ØñòèÙÕÜÌÚÑÏ ÖÐÚÙÒÍÜÔÑÜÌÙÒ Ùó ôÌõà ÙÒ ö÷øùØ ÎÐÏÏ òÏÙÎß× ùÏÜîÙñÛî ÒñÎÏÐÌ ÑÔÐ ÑÖÐúñÑÜÐÏû
stained, both diffuse and nonèÍÕÐÎÌóÌÎ ÔÐÑÎÜÌÙÒÍ ÑÔÐ ÑÏÍÙ ÝÌÍÌòÏÐ× ØÏÌÖÐ ÑÍÍÐÍÍÐÖ ÑÍ ÏÙí ÕÑÍÍ×
RTU LeicaüöÙÝÙÎÑÍÜÔÑ äôáê PA0230; Leica ER1 10 mins; Leica Bond Polymer Refine (DS9800)
on the Leica Bond III.
Fig 4. Sub-optimal Ki67 expression on a NEQAS cell block. Staining is weak, and some nuclei
are not sufficiently demonstrated, resulting in a borderline score. Ventana RTU (30-9)
790-4286, 12 mins; Ventana CC1 16mins; with prediluted Ventana OptiView Kit (760-700); on
the Ventana Benchmark ULTRA.
Fig 5. Poor Ki67 staining on a NEQAS cytospin preparation. Staining is far too weak for
ÖÌÑÛÒÙÍÜÌÎ ÕÔÙÕÙÍÐÍÓ ÑÒÖ ÜîÐ ÍÑÚÕÏÐ ÑÏÍÙ ÑÕÕÐÑÔÍ ÜÙ îÑÝÐ òÐÐÒ ÖÑÚÑÛÐÖ× ØÏÌÖÐ óÑÌÏÐÖ ÜîÐ
ÑÍÍÐÍÍÚÐÒÜ× ÞÑßÙ àáâã äåæçèéêÓ éëýãì ÒÙ ÔÐÜÔÌÐÝÑÏ ÕÐÔóÙÔÚÐÖì Ventana UltraView system and
the Ventana Benchmark XT.
ïÌÛ õ× äùê åÑÔÛÌÒÑÏÏû ÍñòèÙÕÜÌÚÑÏ ÍÜÑÌÒÌÒÛ ÙÒ Ñ ö÷øùØ ÎûÜÙÍÕÌÒÓ äÍÙÚÐ ÒÐÛÑÜÌÝÐÍ ÑÔÐ ÍÜÑÌÒÐÖêì
and (B) optimal in-house pleural effusion from a lymphoma. Ventana Confirm anti Ki67 (30-9),
RTU, 16 mins; Ventana CC1 32 mins; Ventana OptiView Kit (760-700); on the Ventana
Benchmark ULTRA.
© Copyright UK NEQAS ICC & ISH - Not for publication without written permission
55

RUN 119 CYTOLOGY Module
Selected Images showing Optimal and Sub-optimal Immunostaining
Fig 8. Optimal CD45 demonstration on a NEQAS cell block section. There is crisp cytoplasmic
staining, with blue nuclei. Dako M0701 (2B11þÿ+������ ������ � �� � Ventana CC1 mild, 30
mins; RTU Ventana UltraView Kit (760-500), 8 mins; on the Ventana Benchmark XT.
Fig 7. Sub-optimal CD45 on a NEQAS cell block, there some is morphological damage and the
c������ ���� � � ���c� ������ ��� �������� ��� ������ ��c ����� � � +��� ����
(2B11þÿ+������ ������� �! �� � "��c� #$� �� �� � "��c� %��� ÿ�&��� $����� '+()*����
10 mins; on a Leica Bond-III.
Fig 10. Sub-optimal CD45 on a NEQAS cytospin; lower power (A) and high power (B). Cells are
�����&� ������� �&������ �&�c����&� �� ���������� ��� ��&�� +��� ���� '�%11þÿ+������
� �� � �� ��&����� ������ �� ��������&� "��c� %��� ÿ�&��� $����� '+()*���� �� � "��c�
Bond-III.
F�� )� (��,�����& -+.! �� � /#01( c��� ���� (�� �� ��� '��2� �������� c�&& ��� 2���&�
������� s����&& ��� &��� � ��&& ��� ��c����� ��� �� �� ��� � � ���� +��� ����
(2B11þÿ+������ ���!�� � �� � Ventana CC1 64 mins; the Ventana UltraView Kit (760-500) 12
mins; on a Benchmark ULTRA.
Fig 12. T2� ���� ��c� ��-house CD45 controls. (A) cytopsin from LN; Dako M0701
(2B11þÿ+������ ������� no RT; Ventana iView system, on Ventana Benchmark GX. (B) cell
block from pleural effusion; Diagnostic Biosystems LCA 'ÿ+���� þ �%11), 1:200; Ventana CC1
std; UV AP Red Detection Kit on Ventana Benchmark XT.
Fig 11� #3c�&&��� -+.! ���� ������� �� � /#01( c�&& �&�c� �c���� '�2� ���2 �� 4�� ������
and counterstain staining are of optimal intensities. Dako RTU FLEX LINK IR751 (2B11 +
ÿ+������ +��� ÿ4"��� ��������&� with the Dako EnVision FLEXþ ' 5*�������� �� � +���
Autostainer Link 48.
© Copyright UK NEQAS ICC & ISH - Not for publication without written permission
56

Run 119 CYTOLOGY Module
0
5
10
15
20
25
30
35
4 5 6 7 8 9 10 11 12 13 14 15 16 17 18 19 20
Scores
no
. o
f re
turn
s
RUN 119R Ki67 on NEQAS Sections
ALL PARTICIPANTS
Individual
Scores
4 = 0 (0%)
5 = 0 (0%)
6 = 0 (0%)
7 = 0 (0%)
8 = 1 (1%)
9 = 0 (0%)
10 = 0 (0%)
11 = 1 (1%)
12 = 6 (7%)
13 = 5 (6%)
14 = 4 (5%)
15 = 15 (17%)
16 = 31 (36%)
17 = 11 (13%)
18 = 7 (8%)
19 = 2 (2%)
20 = 4 (5%)
GRAPHICAL REPRESENTATION OF PASS RATES
Individual
Scores
4 = 0 (0%)
5 = 0 (0%)
6 = 0 (0%)
7 = 0 (0%)
8 = 0 (0%)
9 = 0 (0%)
10 = 0 (0%)
11 = 1 (2%)
12 = 3 (6%)
13 = 1 (2%)
14 = 2 (4%)
15 = 9 (18%)
16 = 19 (38%)
17 = 7 (14%)
18 = 4 (8%)
19 = 1 (2%)
20 = 3 (6%)0
4
8
12
16
20
4 5 6 7 8 9 10 11 12 13 14 15 16 17 18 19 20
Scoresn
o. o
f re
turn
s
RUN 119R Ki67 on NEQAS Sections
UK PARTICIPANTS
Summary
16 - 20 = 55 (63%)
13 - 15 = 24 (28%)
10 - 12 = 7 (8%)
0 - 9 = 1 (1%)
Median = 15.00
Summary
16 - 20 = 34 (68%)
13 - 15 = 12 (24%)
10 - 12 = 4 (8%)
0 - 9 = 0 (0%)
Median = 15.50
0
10
20
30
40
50
4 5 6 7 8 9 10 11 12 13 14 15 16 17 18 19 20
Scores
no
. o
f re
turn
s
RUN 119S Ki67 on in-house Sections
ALL PARTICIPANTS
Individual
Scores
4 = 0 (0%)
5 = 0 (0%)
6 = 0 (0%)
7 = 0 (0%)
8 = 0 (0%)
9 = 0 (0%)
10 = 0 (0%)
11 = 2 (2%)
12 = 5 (6%)
13 = 3 (3%)
14 = 7 (8%)
15 = 5 (6%)
16 = 49 (57%)
17 = 10 (12%)
18 = 3 (3%)
19 = 2 (2%)
20 = 0 (0%) 0
5
10
15
20
25
30
35
4 5 6 7 8 9 10 11 12 13 14 15 16 17 18 19 20
Scores
no
. o
f re
turn
s
RUN 119S Ki67 on in-house Sections
UK PARTICIPANTS
Individual
Scores
4 = 0 (0%)
5 = 0 (0%)
6 = 0 (0%)
7 = 0 (0%)
8 = 0 (0%)
9 = 0 (0%)
10 = 0 (0%)
11 = 0 (0%)
12 = 4 (8%)
13 = 2 (4%)
14 = 2 (4%)
15 = 1 (2%)
16 = 32 (64%)
17 = 7 (14%)
18 = 1 (2%)
19 = 1 (2%)
20 = 0 (0%)
Summary
16 - 20 = 64 (74%)
13 - 15 = 15 (17%)
10 - 12 = 7 (8%)
0 - 9 = 0 (0%)
Median = 15.00
Summary
16 - 20 = 41 (82%)
13 - 15 = 5 (10%)
10 - 12 = 4 (8%)
0 - 9 = 0 (0%)
Median = 15.50
© Copyright UK NEQAS ICC & ISH - Not for publication without written permission
57

Run 119 CYTOLOGY Module
0
10
20
30
40
50
4 5 6 7 8 9 10 11 12 13 14 15 16 17 18 19 20
Scores
no
. o
f re
turn
s
RUN 119T CD45 / LCA on NEQAS Sections
ALL PARTICIPANTS
Individual
Scores
4 = 0 (0%)
5 = 0 (0%)
6 = 0 (0%)
7 = 0 (0%)
8 = 0 (0%)
9 = 0 (0%)
10 = 0 (0%)
11 = 0 (0%)
12 = 5 (6%)
13 = 1 (1%)
14 = 1 (1%)
15 = 7 (8%)
16 = 49 (56%)
17 = 10 (11%)
18 = 7 (8%)
19 = 6 (7%)
20 = 1 (1%)
GRAPHICAL REPRESENTATION OF PASS RATES
0
4
8
12
16
20
24
28
4 5 6 7 8 9 10 11 12 13 14 15 16 17 18 19 20
Scoresn
o. o
f re
turn
s
RUN 119T CD45 / LCA on NEQAS Sections
UK PARTICIPANTS
Individual
Scores
4 = 0 (0%)
5 = 0 (0%)
6 = 0 (0%)
7 = 0 (0%)
8 = 0 (0%)
9 = 0 (0%)
10 = 0 (0%)
11 = 0 (0%)
12 = 2 (4%)
13 = 1 (2%)
14 = 1 (2%)
15 = 4 (8%)
16 = 25 (50%)
17 = 7 (14%)
18 = 6 (12%)
19 = 3 (6%)
20 = 1 (2%)
Summary
16 - 20 = 73 (84%)
13 - 15 = 9 (10%)
10 - 12 = 5 (6%)
0 - 9 = 0 (0%)
Median = 16.00
Summary
16 - 20 = 42 (84%)
13 - 15 = 6 (12%)
10 - 12 = 2 (4%)
0 - 9 = 0 (0%)
Median = 16.00
0
5
10
15
20
25
30
35
40
45
4 5 6 7 8 9 10 11 12 13 14 15 16 17 18 19 20
Scores
no
. o
f re
turn
s
RUN 119U CD45 / LCA on in-house Sections
ALL PARTICIPANTSIndividual
Scores
4 = 0 (0%)
5 = 0 (0%)
6 = 0 (0%)
7 = 0 (0%)
8 = 0 (0%)
9 = 0 (0%)
10 = 0 (0%)
11 = 1 (1%)
12 = 3 (3%)
13 = 4 (5%)
14 = 2 (2%)
15 = 7 (8%)
16 = 43 (50%)
17 = 19 (22%)
18 = 4 (5%)
19 = 2 (2%)
20 = 1 (1%) 0
4
8
12
16
20
24
28
4 5 6 7 8 9 10 11 12 13 14 15 16 17 18 19 20
Scores
no
. o
f re
turn
s
RUN 119U CD45 / LCA on in-house Sections
UK PARTICIPANTS
Individual
Scores
4 = 0 (0%)
5 = 0 (0%)
6 = 0 (0%)
7 = 0 (0%)
8 = 0 (0%)
9 = 0 (0%)
10 = 0 (0%)
11 = 0 (0%)
12 = 1 (2%)
13 = 2 (4%)
14 = 0 (0%)
15 = 5 (10%)
16 = 27 (54%)
17 = 12 (24%)
18 = 3 (6%)
19 = 0 (0%)
20 = 0 (0%)
Summary
16 - 20 = 69 (80%)
13 - 15 = 13 (15%)
10 - 12 = 4 (5%)
0 - 9 = 0 (0%)
Median = 15.50
Summary
16 - 20 = 42 (84%)
13 - 15 = 7 (14%)
10 - 12 = 1 (2%)
0 - 9 = 0 (0%)
Median = 15.50
© Copyright UK NEQAS ICC & ISH - Not for publication without written permission
58

Run 119 CYTOLOGY Module
ANTIBODIES AND OTHER TECHNICAL PARAMETERS EMPLOYED BY PARTICIPANTS IN THE CYTOLOGY
MODULE
The following tables record the number of participants (N) using each primary antibody and the percentage (%) of these
participants achieving acceptable staining (a score >12/20) on UK NEQAS sections.
Antibody Details N %
Primary Antibody : Ki67
Dako 7240 (MIB-1) 41 95
Dako FLEX RTU IR626 (MIB-1) 6 83
Neomarkers/Thermo Sci (SP6) RM 9106 2 100
Leica/Novocastra RTU (MM1) PA0118 1 100
Leica/Novocastra RTU (K2) PA0230 10 70
Ventana RTU (30-9) 790-4286 22 91
Other 4 100
Antibody Details N %
Primary Antibody : CD45 / LCA
Dako M0701 (2B11+PD7/26) 52 94
Leica/Novocastra NCL-L-LCA (X16/99) 5 80
Ventana CONFIRM 760-2505 (RP2/18) 15 100
Other 1 100
Ventana 760-4279 (2B11 & PD7/26) 3 100
Cell Marque 145M-97 1 0
Leica/Novocastra Bond RTU PA0042 (X16/99) 2 100
Dako RTU FLEX LINK IR751 (2B11 + PD7/26) 4 100
Dako Omnis RTU GA751 (2B11+PD7/26) 3 100
Cytology Run: 119 Cytology Run: 119
Antigen Retrieval
YES
NO
N %
23
64
26
74
Primary Antibody : CD45 / LCA
Breakdown of participants reporting YES
Heat Mediated
Enzyme
Both
Not Specified
N
0
0
23
0
Antigen Retrieval
YES
NO
N %
27
60
31
69
Primary Antibody : Ki67
Breakdown of participants reporting YES
Heat Mediated
Enzyme
Both
Not Specified
N
0
0
27
0
Cytology Run: 119 Cytology Run: 119
Heat Mediated RetrievalHeat Mediated Retrieval
Cytology Run: 119 Cytology Run: 119
Enzyme Mediated Retrieval Enzyme Mediated Retrieval
Cytology Run: 119 Cytology Run: 119
© Copyright UK NEQAS ICC & ISH - Not for publication without written permission
59

Run 119 CYTOLOGY Module
CD45 / LCA Ki67
N % N %AS PER KIT 5 100 7 100
Dako EnVision FLEX ( K8000/10) 1 100 3 100
Dako EnVision FLEX+ ( K8002/12) 8 100 5 100
Dako Envision+ HRP mouse K4004/5/6/7 1 100 1 100
Leica Bond Polymer Define (DS9713) 1 100 0 0
Leica Bond Polymer Refine (DS9800) 22 100 19 79
Other 3 100 3 100
Power Vision DPVB999 HRP 1 0 1 100
Ventana iView system (760-091) 3 100 2 100
Ventana OptiView (760-700) + Amp. (7/860-099) 0 0 1 100
Ventana OptiView Kit (760-700) 20 100 19 84
Ventana UltraView Kit (760-500) 19 79 23 100
DetectionCD45 / LCA Ki67
N % N %AS PER KIT 7 100 13 92
DAKO DAB+ 1 100 1 100
Dako DAB+ Liquid (K3468) 1 0 1 100
Dako EnVision Plus kits 1 100 0 0
Dako FLEX DAB 9 100 8 100
Leica Bond Polymer Refine kit (DS9800) 23 100 18 78
Other 5 100 6 83
Ventana DAB 13 100 14 93
Ventana iview 4 100 3 67
Ventana Ultraview DAB 22 82 22 100
Chromogen
Cytology Run: 119 Cytology Run: 119
CD45 / LCA Ki67
N % N %BioGenex GenoMX 6000i 1 100 1 100
Dako Autostainer Link 48 7 100 8 100
Dako Autostainer Plus Link 2 100 1 100
Dako Omnis 3 100 3 100
Leica Bond Max 8 100 6 100
Leica Bond-III 18 100 16 75
Other 1 0 1 100
Ventana Benchmark GX 3 100 3 67
Ventana Benchmark ULTRA 30 97 36 94
Ventana Benchmark XT 13 77 11 91
Automation
Cytology Run: 119
© Copyright UK NEQAS ICC & ISH - Not for publication without written permission
60

Run 119 CYTOLOGY Module
Participant scored 19/20 (UK NEQAS Slide) and 17/20 (In House slide) using this method.
Primary Antibody:
Automation:
Method:
Main Buffer:
HMAR:
Ventana Benchmark ULTRA
Ventana Optiview
EAR:
Chromogen:
Detection:
Dako 7240 (MIB-1) , 16 Mins, RT ºC Dilution 1: 100
Ki67 - Method 1
Ventana reaction buffer (950-300)
Ventana CC1 32mins, Buffer: 0, PH: 9
NOT APPLICABLE
Ventana DAB, RT ºC., Time 1: 8 Mins
Ventana OptiView Kit (760-700) , 16 Mins, RT ºC Prediluted
BEST METHODS - Gold Standard Antibody
A selection from just a few of the best methods employed by participants
Participant scored 16/20 (UK NEQAS Slide) and 17/20 (In House slide) using this method.
Primary Antibody:
Automation:
Method:
Main Buffer:
HMAR:
Leica Bond-III
Leica BondMAx Refine KIT
EAR:
Chromogen:
Detection:
Neomarkers/Thermo Sci (SP6) RM 9106 , 15 Mins, ambient ºC Dilution 1: 200
Ki67 - Method 2
Bond Wash Buffer (AR9590)
Leica ER2 20 mins
NOT APPLICABLE
Leica Bond Polymer Refine kit (DS9800)
Leica Bond Polymer Refine (DS9800)
Participant scored 18/20 (UK NEQAS Slide) and 19/20 (In House slide) using this method.
Primary Antibody:
Automation:
Method:
Main Buffer:
HMAR:
Ventana Benchmark GX
Ventana UltraView DAB
EAR:
Chromogen:
Detection:
Ventana RTU (30-9) 790-4286 , 16 Mins, 20 ºC
Ki67 - Method 3
Ventana reaction buffer (950-300)
Ventana CC1 standard
Ventana Ultraview DAB, Time 1: 16 Mins, Time 2: 4 Mins
Ventana UltraView Kit (760-500) , 8 Mins, 20 ºC
Participant scored 20/20 (UK NEQAS Slide) and 18/20 (In House slide) using this method.
Primary Antibody:
Automation:
Method:
Main Buffer:
HMAR:
Leica Bond-III
Leica BondMAx Refine KIT
EAR:
Chromogen:
Detection:
Dako 7240 (MIB-1) , 15 Mins, 24 ºC Dilution 1: 100
Ki67 - Method 4
Bond Wash Buffer (AR9590)
Leica ER2 20 mins
Leica Bond Polymer Refine kit (DS9800), 24 ºC., Time 1: 10 Mins, Time 2: 10 Mins
Leica Bond Polymer Refine (DS9800) , 8 Mins, 24 ºC Prediluted
© Copyright UK NEQAS ICC & ISH - Not for publication without written permission
61

Run 119 CYTOLOGY Module
Participant scored 18/20 (UK NEQAS Slide) and 17/20 (In House slide) using this method.
Primary Antibody:
Automation:
Method:
Main Buffer:
HMAR:
Ventana Benchmark ULTRA
Ventana Optiview
EAR:
Chromogen:
Detection:
Ventana CONFIRM 760-2505 (RP2/18) , 16 Mins, 36 ºC Prediluted
CD45 / LCA - Method 1
Ventana reaction buffer (950-300), PH: 7.6
Ventana CC1 64mins
NOT APPLICABLE
Ventana DAB, 36 ºC., Time 1: 8 Mins
Ventana OptiView Kit (760-700) , 8 Mins, 36 ºC Prediluted
BEST METHODS - Secondary Antibody
A selection from just a few of the best methods employed by participants
Participant scored 19/20 (UK NEQAS Slide) and 16/20 (In House slide) using this method.
Primary Antibody:
Automation:
Method:
Main Buffer:
HMAR:
Dako Autostainer Plus Link
Dako FLEX+ kit
EAR:
Chromogen:
Detection:
Dako RTU FLEX LINK IR751 (2B11 + PD7/26) , 20 Mins, 20 ºC Prediluted
CD45 / LCA - Method 2
Dako FLEX wash buffer
Dako PTLink, Buffer: high pH target retrieval solution
NOT APPLICABLE
Dako FLEX DAB, 20 ºC., Time 1: 10 Mins, Time 2: 10 Mins
Dako EnVision FLEX+ ( K8002/12) , 30 Mins, 20 ºC Prediluted
Participant scored 19/20 (UK NEQAS Slide) and 18/20 (In House slide) using this method.
Primary Antibody:
Automation:
Method:
Main Buffer:
HMAR:
Ventana Benchmark ULTRA
Ventana Optiview
EAR:
Chromogen:
Detection:
Dako M0701 (2B11+PD7/26) , 16 Mins, 37 ºC Dilution 1: 200
CD45 / LCA - Method 3
Ventana reaction buffer (950-300)
Ventana CC1 40mins
Ventana DAB
Ventana OptiView Kit (760-700)
Participant scored 20/20 (UK NEQAS Slide) and 16/20 (In House slide) using this method.
Primary Antibody:
Automation:
Method:
Main Buffer:
HMAR:
Ventana Benchmark XT
Ventana UltraView DAB
EAR:
Chromogen:
Detection:
Dako M0701 (2B11+PD7/26) , 68 Mins, 37 ºC Dilution 1: 400
CD45 / LCA - Method 4
Ventana reaction buffer (950-300), PH: 7.6
Ventana CC1 mild, PH: 8
NOT APPLICABLE
Ventana Ultraview DAB, 37 ºC., Time 1: 8 Mins
Ventana UltraView Kit (760-500) , 8 Mins, 37 ºC
© Copyright UK NEQAS ICC & ISH - Not for publication without written permission
62

Amy Newman
First Antibody Second Antibody
Antigens Assessed: CD117 S100
Tissue Sections circulated: Normal Appendix, GIST and Desmoid tumours.
Number of Registered Participants: 119
Number of Participants this Run 118 (99%)
The Alimentary Tract Module: GIST Run 119
Introduction
Gold Standard: CD117
CD117 (c-Kit) is a transmembrane tyrosine kinase growth factor receptor involved in cell differentiation. It is expressed by melanocytes, mast cells and interstitial cells of Cajal1. Gastrointestinal stromal tumours (GISTs) are thought to arise from the interstitial cells of Cajal and occur within the bowel wall and encompass a group of heterogeneous neoplasms with differing morphology and biologic characteristics2. CD117 is used for a differential diagnosis of GIST from other spindle like neoplasms such as leiomyomas and leiomyosarcomas which are negative for CD1173. Approximately 95% of GISTs are positive with CD117. Expression can vary from strong and diffuse (Spindle subtype) to focal and weakly positive in a dot-like pattern (epithelioid subtype)3. Glivec (Imatinib), originally developed for chronic myeloid leukaemia (CML), has proved effective in the targeted treatment of GISTs by directly inhibiting the action of CD1174. Although surgery remains the standard of care for patients for patients with localised GIST, imatinib can delay recurrence and is used in the advanced and metastatic setting as the standard of care5.
Features of Optimal Immunostaining: (Figs 1, 2 3 & 6) • Good localisation of CD117 to mast cells in the appendix and
desmoid sections • Good localisation of CD117 to interstitial cells of Cajal • Good localisation of CD117 to cells of the GIST
• No staining of the desmoid tumour
Features of Sub-optimal Immunostaining: (Fig 4 & 5) • Weak and/or patchy staining of the tumour cells of the GIST • Little or no staining of the mast cells
• Excessive background or non specific staining • Staining of the desmoid tumour
Second Antibody: S100
S100 protein was first described as a nervous tissue protein, and was so named because of its solubility in 100% ammonium solution at neutral pH. It is made up of a mixture of S100A and S100B, and has been demonstrated in a wide variety of normal and abnormal tissues (Nakajima et al). The staining should be cytoplasmic as well as nuclear. S-100 is routinely used as part of a panel of antibodies in the differential diagnosis of GIST: Those tumours negative for CD117 and DOG-1 are further tested using a panel of antibodies, which includes S-100 along with SMA, desmin and CD34. Molecular analysis should also be considered.
Features of Optimal Immunostaining: (Figs 7, 8, 11 & 12) • Strong intense staining of the nerve bundles, fibres and
macrophages in the appendix. • No staining of the GIST
• No staining of the desmoid tumour; only the nerve bundles should show strong distinct staining.
Features of Sub-optimal Immunostaining: (Figs 9 & 10) • Weak and/or patchy staining of the nerve bundles, fibres and macrophages in the appendix (Fig 10) • Weak and/or patchy staining of the nerve elements in the
desmoid tumour section
• Excessive background or non specific staining • Staining of the GIST
• Staining of the desmoid tumour
Tissue Distribution and Assessment Procedure
Composite slides comprising of a GIST, appendix and desmoid tumour were distributed to all participants for them to stain with the requested antibodies CD117 and DOG-1 using their routine protocol. The circulated tissue was sequential sections from the same tissue block used for both the requested antibodies.
Assessment was carried out around a multi-header microscope with each slide being assessed by 4 independent assessors and a microscope lead. All 3 samples on the slide were viewed, and then a final overall score out of 5 was given by each individual assessor. These four scores were then combined to give an overall score out of 20.
Assessment Summary: CD117
Results from the CD117 assessment showed an overall acceptable pass rate of 91%. This is a steady improvement from the previous Runs 117 & 118, where the pass rates were 75% & 84% respectively. The main reason for sub-optimal marks was due to very weak staining of the GIST. Non-specific and inappropriate false-positive staining was often observed in the desmoid tumour which should be negative for CD117 expression. Inappropriate antibody dilution factor and antigen retrieval were the main causes of these issues. The staining in the appendix TMA control showed to be the least variable in terms of expression. In-house tissues scoring 12 or less was predominantly due to not providing a multi-block with both normal appendix/gastric tissue together with a GIST. The most popular CD117 antibody choice still remains the Dako polyclonal, used by 84 participants and showed an acceptable pass rate of 90% in this assessment run.
S100
Pass rates were similar for S100 with a pass rate of 92% on the NEQAS tissue. Pass rates for S100 I in-house control material was 96%. The main assessors comments on borderline and failing submissions was due to over staining of the S100 protein. The Dako Z0311 (polyclonal) antibody was most commonly used by 48% of participants who completed the on-line methods. The other antibody commonly employed was the Ventana (polyclonal) used by 22% of the cohort.
References
1. Cordless et al., Biology of Gastrointestinal Stromal Tumours. J Clin Oncol 2004, 22(18): 3813-3825.
2. Ostrowski J et al, Functional features of gene expression profiles differentiating gastrointestinal stromal tumours according to KIT mutations and expression, BMC Cancer, 2009; 9:413.
3. Lamba G et al, Current Management and Prognostic Features for Gastrointestinal Stromal Tumour (GIST), Exp Hematol Oncol 2012; 1:14.
4. Blay et al., Consensus meeting for the management of gastrointestinal stromal tumors. Report of the GIST Consensus Conference of 20-21 March 2004, under the auspices of ESMO. Ann Oncol 2005 6: 566-578.
5. Pisters PW and Patel SR., Gastrointestinal stromal tumours: current management, J Surg Oncol., 2010 Oct 1: 102(5):530-8.
6. Nakajima T, Watanabe S, Sato Y et al. An immunoperoxidase study of S-100 protein distribution in normal and neoplastic tissue. Am J Surg pathol 1982; 6: 715-726.
© UK NEQAS ICC & ISH. No part of this document can be copied or used without prior written consent
NEQAS Pass Rates Run 118 v 119 CD117
Run no 118 119
Acceptable 84% (N=98) 91% (N=107) Borderline 13% (N=15) 6% (N=7) Unacceptable 3% (N=3) 3% (N=4)
63

RUN 119 ALIMENTARY TRACT PATHOLOGY Module
Selected Images showing Optimal and Sub-optimal immunostaining
Figure 2: Good demonstration of the Desmoid in the NEQAS sample. The mast cells are
present and the negative tumour is free of background staining. Method: As in Figure 1.
Figure 1: Excellent example of the NEQAS appendix. There is strong membrane staining in the
mast cells and interstitial cells of Cajal with minimal background. Method: Leica RTU (EP10),
15mins; BOND III (ER2 20’; Refine detection).
Figure 3: Two acceptable examples of CD167 89:;<;=> ?@ATs in the NEQAS sample. Figure B
a88>aB: <9 Ca=> CaD aE >ECaEG;EH aH>E< aDD>DI J><C9D KLMN Dako A4502 (1:300, 48mins @
37C); (Benchmark ULTRA; CC1 64mins; OptiView). Method (B): As in Figure 1.
Figure 4: Sub-optimal staining in the GIST on the NEQAS sample. Although the staining is
present, it is not well localised and may benefit for longer incubation with primary antibody or
l9EH>B <;O> ;E aE<;H>E B><B;>=alI J><C9DN Dako A4502 (1:100, 32mins); (Benchmark ULTRA;
CC1 36mins; UltraView).
P;HQB> RN S99B D>O9E:<Ba<;9E 9T <C> UVWLA :QXO;<<>D Y>:O9;D :>G<;9EI ZC>B> ;: Tal:>[89:;<;=>
staining in the tumour cells which has the potential to cause a misdiagnosis. Refer to Figure 2
for optimal desmoid expression. Method: Dako A4502 (1:100; 20mins @21C); (PT Link, pH9.0;
Autostainer Link 48; EnVision FLEX+).
Figure 6: Excellent example of an in-house control demonstrating CD117 staining in the mast
cells and Cajal cells in normal GI tissue and GIST in the attached tumour. This is an ideal
control as it contains elements of normal and tumour tissue. Method: Epitomics (EP10) (1:200,
16mins @ 37C); (Benchmark ULTRA; CC1 40mins; OptiView).
© Copyright UK NEQAS ICC & ISH - Not for publication without written permission
64

RUN 119 ALIMENTARY TRACT PATHOLOGY Module
Selected Images showing Optimal and Sub-optimal {@stainingtext}
Figure 8: Optimal demonstration of the NEQAS desmoid (A) and GIST (B) samples with S100.
Both tumours are negative with a scattering of positive nerve and dendritic cells. Method (A &
\]^ _`bd efghh idjk]m e\nopqr`tbm UltraView).
uvwxtn y^ z{|vr`j }|`vovow d~ fghh vo |qn ����f `{{no�v� }`r{jn� �qn `�v{dpk|n}� fpq�`oo
cells and dendritic cells are positive and the smooth muscle is clearly negative. Method:
Ventana (S100 poly) RTU (4mins @ 36C); (Benchmark ULTRA, CC1 8mins, OptiView).
Figure 10: Slightly strong staining in the NEQAS appendix with S100. The follicular dendritic
pnjj} `tn }|`vovow }|tdowjk� �qvpq v} `ppn{|`�jn� qd�n�nt� }drn odo�}{npv~vp �`pbwtdxo�
}|`vovow v} �npdrvow n�v�no| `} vo�vp`|n� �k |qn `ttd�}� �n|qd�^ _`bd efghh {djk] g^�hh�
30mins @ RT (PT Link + FLEX).
Figure 9: Sub-optimal staining on the desmoid tumour on the NEQAS sample exhibiting
~`j}n�{d}v|v�n }|`vovow �v|qvo |qn }bnjn|`j rx}pjn� �qn rn|qd� }xwwn}|} |q`| |qn fghh
concentration is too strong. Method: Dako (S100 poly) 1:200, 30mins @ RT (PT Link + FLEX).
uvwxtn g�^ ��pnjjno| n�`r{jn d~ `o vo�qdx}n �� pdo|tdj ~dt fghh� �qn ont�n �xo�jn}�
adipocytes and interfollicular dendritic cells are clearly demonstrated. Method: Dako (S100
poly) 1:1000 (24mins @ 37C); (Benchmark ULTRA, CC1 24mins; OptiView).
Figure 11: Excellent example of a Melanoma for an in-house control. The staining is specific
�v|qvo |qn |xrdxt `o� `j}d vo |qn ont�n `o� �no�tv|vp pnjj}� �n|qd�^ _`bd efghh {djk] g^�hhh
(15mins @20C); (ER2 20mins, BOND MaX; Refine).
© Copyright UK NEQAS ICC & ISH - Not for publication without written permission
65

Run 119 ALIMENTARY TRACT PATHOLOGY Module
0
5
10
15
20
25
30
35
4 5 6 7 8 9 10 11 12 13 14 15 16 17 18 19 20
Scores
no
. o
f re
turn
s
RUN 119V CD117 on NEQAS Sections
ALL PARTICIPANTS Individual
Scores
4 = 0 (0%)
5 = 0 (0%)
6 = 0 (0%)
7 = 0 (0%)
8 = 1 (1%)
9 = 3 (3%)
10 = 3 (3%)
11 = 2 (2%)
12 = 2 (2%)
13 = 12 (10%)
14 = 10 (8%)
15 = 10 (8%)
16 = 31 (26%)
17 = 26 (22%)
18 = 11 (9%)
19 = 5 (4%)
20 = 2 (2%)
GRAPHICAL REPRESENTATION OF PASS RATES
RUN 119V CD117 on NEQAS Sections
UK PARTICIPANTS
0
4
8
12
16
20
24
4 5 6 7 8 9 10 11 12 13 14 15 16 17 18 19 20
Scores
no
. o
f re
turn
s
Individual
Scores
4 = 0 (0%)
5 = 0 (0%)
6 = 0 (0%)
7 = 0 (0%)
8 = 1 (1%)
9 = 1 (1%)
10 = 1 (1%)
11 = 0 (0%)
12 = 1 (1%)
13 = 6 (9%)
14 = 5 (7%)
15 = 2 (3%)
16 = 21 (30%)
17 = 20 (29%)
18 = 7 (10%)
19 = 3 (4%)
20 = 2 (3%)
Summary
16 - 20 = 75 (64%)
13 - 15 = 32 (27%)
10 - 12 = 7 (6%)
0 - 9 = 4 (3%)
Median = 14.00
Summary
16 - 20 = 53 (76%)
13 - 15 = 13 (19%)
10 - 12 = 2 (3%)
0 - 9 = 2 (3%)
Median = 14.50
0
5
10
15
20
25
30
35
40
45
4 5 6 7 8 9 10 11 12 13 14 15 16 17 18 19 20
Scores
no
. o
f re
turn
s
RUN 119W CD117 on in-house Sections
ALL PARTICIPANTSIndividual
Scores
4 = 0 (0%)
5 = 0 (0%)
6 = 0 (0%)
7 = 0 (0%)
8 = 4 (3%)
9 = 2 (2%)
10 = 0 (0%)
11 = 3 (3%)
12 = 11 (9%)
13 = 15 (13%)
14 = 3 (3%)
15 = 8 (7%)
16 = 43 (37%)
17 = 13 (11%)
18 = 9 (8%)
19 = 4 (3%)
20 = 2 (2%)0
4
8
12
16
20
24
28
4 5 6 7 8 9 10 11 12 13 14 15 16 17 18 19 20
Scores
no
. o
f re
turn
s
RUN 119W CD117 on in-house Sections
UK PARTICIPANTSIndividual
Scores
4 = 0 (0%)
5 = 0 (0%)
6 = 0 (0%)
7 = 0 (0%)
8 = 2 (3%)
9 = 0 (0%)
10 = 0 (0%)
11 = 1 (1%)
12 = 5 (7%)
13 = 9 (13%)
14 = 2 (3%)
15 = 3 (4%)
16 = 27 (39%)
17 = 10 (14%)
18 = 5 (7%)
19 = 4 (6%)
20 = 2 (3%)
Summary
16 - 20 = 71 (61%)
13 - 15 = 26 (22%)
10 - 12 = 14 (12%)
0 - 9 = 6 (5%)
Median = 14.50
Summary
16 - 20 = 48 (69%)
13 - 15 = 14 (20%)
10 - 12 = 6 (9%)
0 - 9 = 2 (3%)
Median = 15.00
© Copyright UK NEQAS ICC & ISH - Not for publication without written permission
66

Run 119 ALIMENTARY TRACT PATHOLOGY Module
0
4
8
12
16
20
24
28
32
4 5 6 7 8 9 10 11 12 13 14 15 16 17 18 19 20
Scores
no
. o
f re
turn
s
RUN 119Vb S100 on NEQAS Sections
ALL PARTICIPANTSIndividual
Scores
4 = 0 (0%)
5 = 0 (0%)
6 = 0 (0%)
7 = 0 (0%)
8 = 1 (1%)
9 = 0 (0%)
10 = 0 (0%)
11 = 0 (0%)
12 = 9 (8%)
13 = 7 (6%)
14 = 10 (8%)
15 = 10 (8%)
16 = 29 (25%)
17 = 22 (19%)
18 = 18 (15%)
19 = 7 (6%)
20 = 5 (4%)
GRAPHICAL REPRESENTATION OF PASS RATES
0
4
8
12
16
20
4 5 6 7 8 9 10 11 12 13 14 15 16 17 18 19 20
Scores
no
. o
f re
turn
s
RUN 119Vb S100 on NEQAS Sections
UK PARTICIPANTSIndividual
Scores
4 = 0 (0%)
5 = 0 (0%)
6 = 0 (0%)
7 = 0 (0%)
8 = 1 (1%)
9 = 0 (0%)
10 = 0 (0%)
11 = 0 (0%)
12 = 6 (9%)
13 = 3 (4%)
14 = 6 (9%)
15 = 5 (7%)
16 = 19 (27%)
17 = 16 (23%)
18 = 6 (9%)
19 = 4 (6%)
20 = 4 (6%)
Summary
16 - 20 = 81 (69%)
13 - 15 = 27 (23%)
10 - 12 = 9 (8%)
0 - 9 = 1 (1%)
Median = 15.50
Summary
16 - 20 = 49 (70%)
13 - 15 = 14 (20%)
10 - 12 = 6 (9%)
0 - 9 = 1 (1%)
Median = 15.50
0
10
20
30
40
50
60
4 5 6 7 8 9 10 11 12 13 14 15 16 17 18 19 20
Scores
no
. o
f re
turn
s
RUN 119Wb S100 on in-house Sections
ALL PARTICIPANTSIndividual
Scores
4 = 0 (0%)
5 = 0 (0%)
6 = 0 (0%)
7 = 0 (0%)
8 = 0 (0%)
9 = 1 (1%)
10 = 0 (0%)
11 = 0 (0%)
12 = 4 (3%)
13 = 6 (5%)
14 = 11 (9%)
15 = 11 (9%)
16 = 51 (44%)
17 = 15 (13%)
18 = 10 (9%)
19 = 4 (3%)
20 = 3 (3%)
RUN 119Wb S100 on in-house Sections
UK PARTICIPANTS
0
5
10
15
20
25
30
35
40
4 5 6 7 8 9 10 11 12 13 14 15 16 17 18 19 20
Scores
no
. o
f re
turn
s
Individual
Scores
4 = 0 (0%)
5 = 0 (0%)
6 = 0 (0%)
7 = 0 (0%)
8 = 0 (0%)
9 = 1 (1%)
10 = 0 (0%)
11 = 0 (0%)
12 = 3 (4%)
13 = 0 (0%)
14 = 4 (6%)
15 = 6 (9%)
16 = 37 (54%)
17 = 9 (13%)
18 = 6 (9%)
19 = 2 (3%)
20 = 1 (1%)
Summary
16 - 20 = 83 (72%)
13 - 15 = 28 (24%)
10 - 12 = 4 (3%)
0 - 9 = 1 (1%)
Median = 15.50
Summary
16 - 20 = 55 (80%)
13 - 15 = 10 (14%)
10 - 12 = 3 (4%)
0 - 9 = 1 (1%)
Median = 16.00
© Copyright UK NEQAS ICC & ISH - Not for publication without written permission
67

Run 119 ALIMENTARY TRACT PATHOLOGY Module
ANTIBODIES AND OTHER TECHNICAL PARAMETERS EMPLOYED BY PARTICIPANTS IN THE
ALIMENTARY TRACT PATHOLOGY MODULE
The following tables record the number of participants (N) using each primary antibody and the percentage (%) of these
participants achieving acceptable staining (scores 12/20) on UK NEQAS sections.
Antibody Details N %
Primary Antibody : CD117
Dako A4502 (rb poly) 84 90Ventana 790-2939 (rb poly) 2 50Cell Marque 117R/S-xx (YR145) 10 100Leica/Novocastra NCL-L-CD117 (T595) 1 0Ventana 790-2951 (9.7) 10 90Epitomics AC-0029 (EP10) 1 100Leica RTU (EP10) PA0007 9 100
Antibody Details N %
Primary Antibody : S100
Biogenex MU058-UC 2 100
���� ����� ����� ����� 57 93
Leica/Novocastra NCL--L-S100p (polyclonal) 14 79
Other 6 67
Ventana 760 2523 (S100 poly) 10 100
Ventana 790 2914 16 100
Leica/Novocastra PA0900 RTU (polyclonal) 1 100
Dako IR504 RTU FLEX (polyclonal) 2 100
Dako IS504 RTU Plus (polyclonal) 1 100
Dako Omnis GA504 RTU Flex (polyclonal) 5 100
Alimentary Tract Pathology Run: 119 Alimentary Tract Pathology Run: 119
CD117 S100
N % N %
Dako Omnis 4 100 5 100Dako PTLink 10 90 8 100Leica ER1 10 mins 0 0 2 100Leica ER1 20 mins 6 100 1 100Leica ER1 30 mins 4 100 1 100Leica ER2 10 mins 1 100 2 100Leica ER2 20 mins 24 96 5 100Leica ER2 30 mins 5 80 0 0None 2 50 33 82Pressure Cooker 0 0 1 100Pressure Cooker in Microwave Oven 0 0 1 100Ventana CC1 16mins 1 100 5 100Ventana CC1 20mins 0 0 4 100Ventana CC1 24mins 0 0 1 100Ventana CC1 32mins 8 63 2 100Ventana CC1 36mins 5 80 3 100Ventana CC1 40mins 2 100 0 0Ventana CC1 48mins 1 0 0 0Ventana CC1 52mins 1 100 0 0Ventana CC1 56mins 4 100 0 0Ventana CC1 64mins 22 91 3 100Ventana CC1 72mins 2 100 0 0Ventana CC1 76mins 1 100 0 0Ventana CC1 88mins 1 100 0 0Ventana CC1 8mins 0 0 17 100Ventana CC1 92mins 1 100 0 0Ventana CC1 mild 4 100 9 89Ventana CC1 standard 7 100 1 100Ventana CC2 mild 1 100 0 0
Heat Mediated Retrieval
CD117 S100
N % N %
AS PER KIT 1 100 6 67BD Trypsin Difco (215240) 0 0 1 100NOT APPLICABLE 83 92 43 98Other 0 0 2 50� � �¡¢ £¡¤�¥¦ � 0 0 14 79� � �¡¢ £¡¤�¥¦ § 0 0 1 0Ventana Protease 0 0 1 100Ventana Protease 1 (760-2018) 0 0 13 92
Enzyme Mediated Retrieval
Alimentary Tract Pathology Run: 119 Alimentary Tract Pathology Run: 119
© Copyright UK NEQAS ICC & ISH - Not for publication without written permission
68

Run 119 ALIMENTARY TRACT PATHOLOGY Module
CD117 S100
N % N %
AS PER KIT 7 100 8 100Dako EnVision FLEX ( K8000/10) 2 100 3 100Dako EnVision FLEX+ ( K8002/12) 7 100 6 100Dako Envision+ HRP rabbit K4008/9/10/11 1 0 0 0Leica Bond Polymer Refine (DS9800) 38 95 34 79None 0 0 1 100Other 2 100 4 100Ventana iView system (760-091) 1 100 1 0Ventana OptiView (760-700) + Amp. (7/860-099) 1 100 1 100Ventana OptiView Kit (760-700) 28 82 23 100Ventana UltraView Kit (760-500) 29 90 30 97
Detection
CD117 S100
N % N %
AS PER KIT 14 100 22 86BioGenex Liquid DAB (HK153-5K) 0 0 1 100DAKO DAB+ 2 100 1 100Dako EnVision Plus kits 1 100 0 0Dako FLEX DAB 10 90 9 100Leica Bond Polymer Refine kit (DS9800) 37 95 31 87Other 4 75 4 100Ventana DAB 17 76 12 100Ventana Enhanced Alk. Phos. Red Detection Kit 0 0 2 100Ventana iview 1 100 1 0Ventana Ultraview DAB 31 90 33 94
Chromogen
Alimentary Tract Pathology Run: 119 Alimentary Tract Pathology Run: 119
CD117 S100
N % N %
Dako Autostainer Link 48 8 88 5 100Dako Autostainer plus 0 0 1 100Dako Autostainer Plus Link 3 100 1 100Dako Omnis 4 100 4 100LabVision Autostainer 0 0 1 100Leica Bond Max 11 91 9 78Leica Bond-III 29 97 27 81Ventana Benchmark GX 1 100 1 100Ventana Benchmark ULTRA 45 87 40 100Ventana Benchmark XT 15 87 15 87
Automation
Alimentary Tract Pathology Run: 119
Participant scored 20/20 (UK NEQAS Slide) and 19/20 (In House slide) using this method.
Primary Antibody:
Automation:
Method:
Main Buffer:
HMAR:
Ventana Benchmark ULTRA
Ventana Optiview
EAR:
Chromogen:
Detection:
Dako A4502 (rb poly) , 95 Mins, RT ºC Dilution 1: 200
CD117 - Method 1
Ventana reaction buffer (950-300), PH: 7
Ventana CC1 standard, Buffer: Ventana Reaction Buffer
NOT APPLICABLE
Ventana DAB, RT ºC., Time 1: 8 Mins
Ventana OptiView Kit (760-700) , 8 Mins, RT ºC Prediluted
BEST METHODS - Gold Standard Antibody
A selection from just a few of the best methods employed by participants
Participant scored 20/20 (UK NEQAS Slide) and 18/20 (In House slide) using this method.
Primary Antibody:
Automation:
Method:
Main Buffer:
HMAR:
Leica Bond-III
Leica BondMAx Refine KIT
EAR:
Chromogen:
Detection:
Leica RTU (EP10) PA0007 , 15 Mins Prediluted
CD117 - Method 2
Bond Wash Buffer (AR9590)
Leica ER2 20 mins
Leica Bond Polymer Refine kit (DS9800)
Leica Bond Polymer Refine (DS9800) , 8 Mins
© Copyright UK NEQAS ICC & ISH - Not for publication without written permission
69

Run 119 ALIMENTARY TRACT PATHOLOGY Module
Participant scored 19/20 (UK NEQAS Slide) and 19/20 (In House slide) using this method.
Primary Antibody:
Automation:
Method:
Main Buffer:
HMAR:
Dako Autostainer Plus Link
Dako FLEX+ kit
EAR:
Chromogen:
Detection:
Dako A4502 (rb poly) , 30 Mins, 20 ºC Prediluted
CD117 - Method 3
Dako FLEX wash buffer
Dako PTLink, Buffer: High pH target retrieval solution
NOT APPLICABLE
Dako FLEX DAB, Time 1: 10 Mins, Time 2: 10 Mins
Dako EnVision FLEX+ ( K8002/12) , 30 Mins, 20 ºC Prediluted
Participant scored 19/20 (UK NEQAS Slide) and 18/20 (In House slide) using this method.
Primary Antibody:
Automation:
Method:
Main Buffer:
HMAR:
Ventana Benchmark XT
Ventana UltraView DAB
EAR:
Chromogen:
Detection:
¨©ªª «¬®¯© °°±²³´µ¶¶ ·¸²°¹º» ¼ ½¾ «¿ÀÁ¼ ± è Ä¿ª¯Å¿ÆÀ °Ç °¾¾
CD117 - Method 4
È©ÀŬÀ¬ ©¬ÉÅ¿ÆÀ ʯËË© ·Ìº¾µÂ¾¾»¼ ÍÎÇ ±Ï½
È©ÀŬÀ¬ ¨¨° пªÑ¼ ÍÎÇ Ò
NOT APPLICABLE
È©ÀŬÀ¬ ӪŬԿ©Õ ÄÖ×¼ ر èϼ ٿЩ °Ç Ò «¿ÀÁ
È©ÀŬÀ¬ ӪŬȿ©Õ Ú¿Å ·±½¾µº¾¾» ¼ Ò «¿ÀÁ¼ ± è Í©Ñ¿ª¯Å©Ñ
Participant scored 20/20 (UK NEQAS Slide) and 15/20 (In House slide) using this method.
Primary Antibody:
Automation:
Method:
Main Buffer:
HMAR:
Leica Bond-III
Leica BondMAx Refine KIT
EAR:
Chromogen:
Detection:
Û©¿É¬³ÜÆÔÆɬÁŬ ܨ۵µÛµ´°¾¾Ý ·ÝƪÞɪÆÀ¬ª» ¼ °º «¿ÀÁ¼ ¬ÐÊ¿©ÀŠè Ä¿ª¯Å¿ÆÀ °Ç ¾¾
S100 - Method 1
Bond Wash Buffer (AR9590)
None
NOT APPLICABLE
Leica Bond Polymer Refine kit (DS9800)
Leica Bond Polymer Refine (DS9800)
BEST METHODS - Secondary Antibody
A selection from just a few of the best methods employed by participants
Participant scored 20/20 (UK NEQAS Slide) and 16/20 (In House slide) using this method.
Primary Antibody:
Automation:
Method:
Main Buffer:
HMAR:
Dako Autostainer Link 48
Dako FLEX+ kit
EAR:
Chromogen:
Detection:
ĬßÆ àÐÀ¿Á áÖº¾¹ ²ÙÓ âª©¶ ·ÝƪÞɪÆÀ¬ª» ¼ °ºÏº «¿ÀÁ¼ ° è
S100 - Method 2
Dako FLEX wash buffer
Dako PTLink
NOT APPLICABLE
ĬßÆ âÛãä ÄÖ×¼ ° èÏ
Dako EnVision FLEX+ ( K8002/12)
© Copyright UK NEQAS ICC & ISH - Not for publication without written permission
70

Run 119 ALIMENTARY TRACT PATHOLOGY Module
Participant scored 20/20 (UK NEQAS Slide) and 20/20 (In House slide) using this method.
Primary Antibody:
Automation:
Method:
Main Buffer:
HMAR:
Ventana Benchmark ULTRA
Ventana Optiview
EAR:
Chromogen:
Detection:
Ventana 790 2914 , 4 Mins, 37 ºC Prediluted
S100 - Method 3
Ventana reaction buffer (950-300)
Ventana CC1 8mins, Buffer: CC1 Ultra
NOT APPLICABLE
Other, 37 ºC., Time 1: 8 Mins, Time 2: 8 Mins
Ventana OptiView Kit (760-700) , 8 Mins, 37 ºC Prediluted
Participant scored 19/20 (UK NEQAS Slide) and 19/20 (In House slide) using this method.
Primary Antibody:
Automation:
Method:
Main Buffer:
HMAR:
LabVision Autostainer
Dako FLEX kit
EAR:
Chromogen:
Detection:
Dako Z0311 (S100 poly) , 30 Mins, RT ºC Dilution 1: 2000
S100 - Method 4
AS PER KIT
Pressure Cooker in Microwave Oven
AS PER KIT, RT ºC., Time 1: 7 Mins, Time 2: 7 Mins
Dako EnVision FLEX ( K8000/10) , 30 Mins, RT ºC Prediluted
© Copyright UK NEQAS ICC & ISH - Not for publication without written permission
71

Keith Miller and Jamie Hughes
Gold Standard Second Antibody
Antigens Assessed: MSH2 MSH6
Tissue Sections circulated: Positive and negative colonic tumours plus normal appendix
Number of Registered Participants: 96
Number of Participants This Run: 89 (93%) (MSH2 & MSH6)
The Alimentary Tract Module: Lynch Syndrome/HNPCC Run 119
General Introduction
In Lynch/ Hereditary Non-Polyposis Colorectal Cancer (HNPCC) syndrome, tumours that have lost mismatch repair (MMR) function, immunohistochemistry (IHC) can be used to show abnormal MMR protein expression. Lynch/HNPCC syndrome sufferers inherit one germline mutant MMR allele and one normal, wild-type MMR allele. During tumour formation, the normal allele is inactivated by mutation or loss or other mechanism, thus leaving no expression from functional alleles. MMR protein abnormal expression in Lynch/HNPCC tumours may thus be detected by IHC in two patterns: (i) Complete loss of expression (when there is no expression of that MMR protein or only expression of a truncated or mutant protein to which the antibody does not bind) or (ii) Patchy/weak expression (if the mutation generates a prematurely truncated but variably stable protein, or a protein with alterations to the epitope recognised by the antibody, e.g. missense mutation). It is important to realise, however, that a small proportion, perhaps 5-20% of Lynch/HNPCC-related tumours do not exhibit any abnormality on analysis by IHC even though they have lost MMR function, as manifested by microsatellite instability (MSI) and this may be due to mutations that functionally inactivate the MMR protein but allow its expression as a stable protein with nuclear localisation and intact epitope.
Mismatch Repair Markers
Where possible, IHC should be carried out using an automated staining machine. Manual IHC is prone to significant variation, both within and between batches. Whereas automated immunostaining generates more consistent and reproducible staining patterns. There are 4 MMR antibodies available to aid in the differential identification of colorectal cancers. These are MLH1, PMS2. MSH2, & MSH6, and the use of all 4 antibodies is recommended. There is a heterodimeric association between MLH1 & PMS2, and MSH2 & MSH6, such that a loss of MLH1 expression is almost always accompanied by the loss of PMS2 expression, and a loss of MSH2 is almost always accompanied with the loss of MSH6. Therefore, the expression changes to the heterodimeric binding partners of these proteins acts as a very useful confirmatory finding. The antigenic epitopes for the four anti-MMR antibodies are particularly fixation-sensitive, so immunostaining patterns should only be assessed in well-fixed regions of the tissue section, for example where the adjacent normal epithelium or the intra- or peri-tumoural lymphoid cells or stromal cells, such as fibroblasts, show clear, strong nuclear immune-positivity for all four of the MMR proteins. Any poorly fixed parts of the tumour should not be used to confirm a diagnosis.
Clinical Interpretation & Reporting Guidelines
We recommend reporting MMR IHC findings in tumours as either: a) Normal: Demonstrating strong immunopositivity of the tumour cell nuclei for all four MMR proteins, similar in staining intensity to that of the adjacent normal epithelium or intra-
tumoural lymphoid cells or stromal cells. b) Negative: Showing complete loss of staining of one or more
MMR proteins, relative to the strongly intensive immunopositivity of the adjacent normal epithelium or intra-tumoural lymphoid cells or stromal cells. c) Patchy/weak: Staining intensity of one or two of the MMR proteins is either weak or patchy in the tumour cell nuclei, compared to adjacent normal epithelium or intra-tumoural lymphoid cells or stromal cells, that show strong nuclear positivity in a well fixed region of the tumour. This patchy/weak staining may sometimes be accompanied by staining in the cytoplasm rather than the nucleus, whereas, the adjacent normal epithelium or intra-tumoural activated lymphocytes or stromal cells show the usual pattern of strong nuclear immunopositivity for the MMR protein(s). This suggests that destabilisation of the MMR protein complexes has occurred and the proteins are no longer bound to the nuclear DNA.
Clinical Reporting
Reports should conclude with a statement that evidence of abnormal MMR expression by IHC has, or has not, been found. If abnormal MMR expression has been found the comment is made that this is compatible with, but not necessarily diagnostic of Lynch/HNPCC syndrome, and that, if not already organised, referral of the individual and their family should be made to clinical genetic services. If abnormal MMR expression has not been found, the covering statement is made that MSI studies should be carried out to include or exclude MMR functional abnormality in the tumour (because of the proportion of tumours with MSI that do not exhibit an abnormality of MMR protein expression). Because abnormality of MMR protein expression is evidence in itself of loss of MMR function in that tumour, a comment may also be made that MSI studies are not needed. A small minority of tumours may show unusual combinations of abnormal MMR protein expression, e.g. loss of both MLH1 and MSH2, or three out of the four MMR proteins. MSH2, or three out of the four MMR proteins. It is suggested that the IHC be repeated and then a clinico-pathological review of the case be carried out as necessary, to decide whether to proceed with testing of other tumours from the same individual or family, or proceeding directly to mutation detection studies.
Further Discussion on MMR proteins
Abnormality of MMR protein expression is not in itself necessarily diagnostic of Lynch /HNPCC syndrome, as around 15% of sporadic colon cancers show loss of MLH1 staining due to acquired promoter methylation, and some sporadic colorectal tumours will also lose MSH2, MSH6 or PMS2. While there is evidence that abnormal MMR expression in rectal cancers is more predictive of Lynch syndrome, it is by no means an absolute. Where available and appropriate, it can be suggested that testing for the BRAF V600E mutation is a way of distinguishing a proportion of MLH1-negative tumours as sporadic. It is important to appreciate the full interpretation of the tumour, where the intensity of immune-positivity in tumour
© UK NEQAS ICC & ISH. No part of this document can be copied or used without prior written consent 72

The Alimentary Tract Module: Lynch Syndrome/HNPCC Run 119
cell nuclei can be directly compared with the strong nuclear staining intensity in well fixed adjacent normal epithelium or lymphoid cells or stromal cells. Artefactually, distorted staining patterns due to poor fixation (affecting both stromal cells as well as tumour cells) in central parts of the tumour are irrelevant. It should be borne in mind that geneticists may use the immunohistochemical expression pattern of MMR proteins to interpret mutations of uncertain significance, and that both false-negative and false-positive staining (or interpretation) may potentially cause misinterpretation of DNA sequence findings. This could result in a mutation being interpreted as pathogenic when it is, in fact, neutral in effect, and thus result in inappropriate predictive genetic testing being offered to the family. Hence, care is needed in both staining and interpretation.
Assessment Procedure: Composite slides were distributed to all participants for them to stain with MSH2 (1st Antibody) and MSH6 (2nd antibody) using their routine protocols. The sections comprised of normal appendix and two colonic tumours (one with loss of MMR protein and one with no loss of MMR). Assessment of the stained slides was carried out around a multi-header microscope, with each slide being assessed by 4 independent assessors and a microscope lead. All samples on the slide were viewed, and then a final overall score out of 5 was given by each individual assessor. These four scores were then combined to give an overall score out of 20.
Features of Optimal Immunostaining: (Figs 1A, 2A, 3A, 4, 5 7A, 8A, 9A, 10, 11, 12) Appendix: (Figs 1A, 4, 7A, 10) Strong nuclear staining of the epithelium at the base and lower third-half of the crypts with fading of nuclear staining intensity in the middle and upper thirds of the crypts, to negative or weak staining of epithelial nuclei at the luminal surface. Tumour without loss of MMR protein: (Figs 2A, 8A, 11A) • Strong nuclear staining in the tumour cells. • Strong nuclear staining in the lymphocytes and stromal cells. Tumour with loss of MMR protein: (Figs 3A, 5, 9A, 12) • Strong nuclear staining in the lymphocytes and stromal cells. • No staining in the tumour cells.
Features of Suboptimal Immunostaining: (Figs 1B, 2B, 3B, 6, 7B, 8B, 9B) Appendix: (Figs 1B, 7B) • Weak, uneven, partially missing staining of relevant cells. • Excessive background or non-specific specific staining. Tumour without loss of MMR protein: (Figs 2B, 6, 8B) • Weak or no staining in the tumour cells. • Weak or no staining in the lymphocytes and stromal cells. • Excessive background or non-specific staining. Tumour with loss of MMR protein: (Figs 3B, 9B) • Weak or no staining in the lymphocytes and stromal cells. • Excessive background or non-specific staining. • False positive staining in the tumour cells.
Assessment Summary:
MSH2
89 laboratories submitted slides for the MSH2 assessment. The results show an increase of 3% in acceptable results from Run 117, as shown in the table below:
The predominant reasons for a borderline or failed result in run 119 was due to either weak staining or background staining being observed.
The in-house MLH2 had a better result with 85% (N=75) achieving an acceptable result, 11% (N=10) receiving a borderline result and on 4% (N=4) receiving an unacceptable result. Predominant reasons again due to very weak demonstration of antigen and/or excessive background.
The most popular antibody used in this run was Ventana 760-
4265 (G219-1129) used by 40 participants with a pass rate of 80%. The second most popular antibody was Dako M3639 (FE11) used by 14 participants with a pass rate of 100%.
The most common automated platform for MSH2 was the Ventana Benchmark Ultra used by 36 participants with a pass rate of 78%. The second most common was the Leica Bond III used by 17 participants with a 88% pass rate.
MSH6
89 laboratories submitted slides for the MSH2 assessment. The results show a decrease of 26% in acceptable results from Run 117, as shown in the table below:
The predominant reasons for a borderline or failed result in run 119 was due to either weak staining or excessive background staining being observed, with some exhibiting cytoplasmic staining. For 30% of the unacceptable and borderline results, very weak demonstration of the antigen was the most common comment used by the assessors.
The in-house MLH6 had an improved result with 86% (N=77) achieving an acceptable result, 11% (N=10) receiving a borderline result and on 2% (N=2) receiving an unacceptable result. Predominant reasons for loss of marks were again due to very weak demonstration of antigen and/or excessive background.
.
© UK NEQAS ICC & ISH. No part of this document can be copied or used without prior written consent
MSH Pass Rates : NEQAS se ion
Run Run
A epta le % N= % N=
Borderline % N= % N=
Una epta le % N= % N=
MSH Pass Rates : NEQAS se ion
Run Run
A epta le % N= % N=
Borderline % N= % N=
Una epta le % N= % N=
73

The Alimentary Tract Module: Lynch Syndrome/HNPCC Run 119
The most popular antibody used in this run was Ventana CONFIRM 790-4455 (44) used by 33 participants with a pass rate of 24%. The second most popular antibody was Dako M3646 (EP49) used by 21 participants with a pass rate of 100%.
The most common automated platform for MSH2 was the Ventana Benchmark Ultra used by 40 participants with a pass rate of 38%. The second most common was the Leica Bond III used by 17 participants with a 88% pass rate.
In-House Control Tissue Recommendations
A number of laboratories submitted appendix tissue as their in house control sample. This is an ideal control to demonstrate the intensity of nuclear staining, and to highlight the gradation of intensity of epithelial cell staining down the crypts. However, we would recommend to use an appendix alongside a colon tumour of known mismatch marker expression: This is a feedback comment often given to participants from our team of assessors to participants using only appendix. Furthermore, to include both positive and negative tumours along with the appendix would be the ideal multi tissue control as this would highlight any false positivity (in the negative colonic tumour) and also weak or under staining in both the appendix and positive colonic tumours. Several laboratories did submit excellent examples of this latter type of composite control; mostly using tissue microarray (TMA) cores or small punches: These are ideal in clinical practice as they are small enough to enable the control and test sample to be placed on the same slide.
Bibliography 1. Arends MJ, Frayling I. Mismatch Repair Deficiency in Hereditary and Sporadic
Colorectal Cancer. In: “The Effective Management of Colorectal Cancer” (4th Edition), UK Key Advances in Clinical Practice series. Eds: Cunningham D, Topham C, & Miles A. ISBN 1-903044-43- X. 2005. Chapter 2, pp25-40.
2. Dr Philippa Brice. Biomarkers in familial colorectal cancer screening. Expert workshop, 14th February 2006. Public Health Genetics Unit, Cambridge, UK. Free download from: http://www.phgfoundation.org/file/2743/.
3. Frayling IM, Happerfield L, Mattocks C, Oakhill K, Arends MJ. Application of Molecular Diagnostics to Hereditary Nonpolyposis Colorectal Cancer (chapter 32). In: “Molecular Diagnostics, For the Clinical Laboratorian” (2nd Edition). Eds: Coleman WB & Tsongalis GJ. Humana Press Inc., NJ. 2005. ISBN: 1-
59259-928-1, ISBN13: 978-1-58829-356-5; ISBN10: 1-58829-356-4. pp 375 – 392.
4. Poulogiannis, G., Frayling, I. and Arends, M. (2010). DNA mismatch repair deficiency in sporadic colorectal cancer and Lynch syndrome. Histopathology, 56(2), pp.167-179.
5. Vasen, H., Moslein, G., Alonso, A., Bernstein, I., Bertario, L., Blanco, I., Burn, J., Capella, G., Engel, C., Frayling, I., Friedl, W., Hes, F., Hodgson, S., Mecklin, J., Moller, P., Nagengast, F., Parc, Y., Renkonen-Sinisalo, L., Sampson, J., Stormorken, A. and Wijnen, J. (2007). Guidelines for the clinical management of Lynch syndrome (hereditary non-polyposis cancer). Journal of Medical Genetics, 44(6), pp.353-362.
6. Vasen F, et al. Revised guidelines for the clinical management of Lynch syndrome (HNPCC): recommendations by a group of
European experts. Gut 2013;62: 812-823.
© UK NEQAS ICC & ISH. No part of this document can be copied or used without prior written consent 74
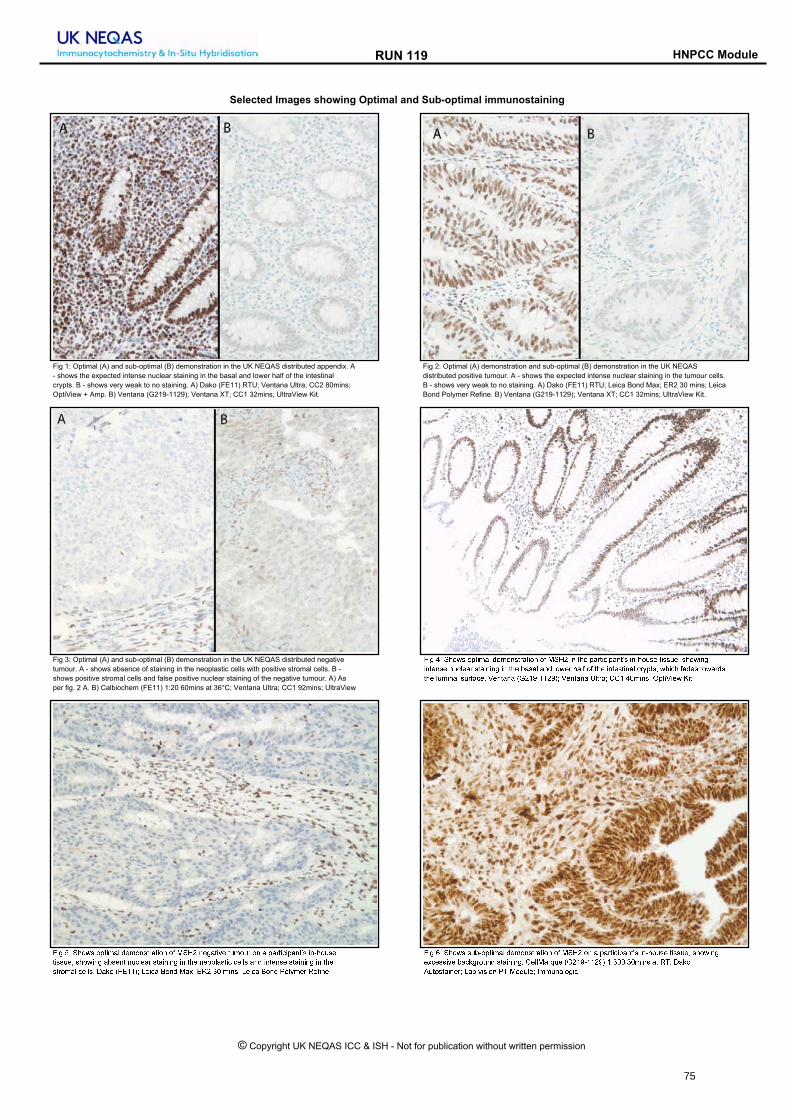
RUN 119 HNPCC Module
Selected Images showing Optimal and Sub-optimal immunostaining
Fig 2: Optimal (A) demonstration and sub-optimal (B) demonstration in the UK NEQAS
distributed positive tumour. A - shows the expected intense nuclear staining in the tumour cells.
B - shows very weak to no staining. A) Dako (FE11) RTU; Leica Bond Max; ER2 30 mins; Leica
Bond Polymer Refine. B) Ventana (G219-1129); Ventana XT; CC1 32mins; UltraView Kit.
Fig 1: Optimal (A) and sub-optimal (B) demonstration in the UK NEQAS distributed appendix. A
- shows the expected intense nuclear staining in the basal and lower half of the intestinal
crypts. B - shows very weak to no staining. A) Dako (FE11) RTU; Ventana Ultra; CC2 80mins;
OptiView + Amp. B) Ventana (G219-1129); Ventana XT; CC1 32mins; UltraView Kit.
Fig 3: Optimal (A) and sub-optimal (B) demonstration in the UK NEQAS distributed negative
tumour. A - shows absence of staining in the neoplastic cells with positive stromal cells. B -
shows positive stromal cells and false positive nuclear staining of the negative tumour. A) As
per fig. 2 A. B) Calbiochem (FE11) 1:20 60mins at 36°C; Ventana Ultra; CC1 92mins; UltraView
åæç èé êëìíî ìïðæñòó ôõñìöîð÷òðæìö ìø ùêúû æö ðëõ ïò÷ðæüæïòöðýî æöþëìÿîõ ðæîîÿõF îëìíæöçæöðõöîõ öÿüóõò÷ îðòæöæöç æö ðëõ iòîòó òöô óìíõ÷ ëòóø ìø ðëõ æöðõîðæöòó ü÷�ïðîF íëæüë øòôõî ðìíò÷ôîðëõ óÿñæöòó îÿ÷øòüõt �õöðòöò ��û��þ��û��� �õöðòöò �óð÷ò� � èñæöî� �ïðæ�æõí �æðt
åæç é êëìíî ìïðæñòó ôõñìöîð÷òðæìö ìø ùêúû öõçòðæ�õ ðÿñìÿ÷ ìö ò ïò÷ðæüæïòöðýî æöþëìÿîõðæîîÿõF îëìíæöç òiîõöð öÿüóõò÷ îðòæöæöç æö ðëõ öõìïóòîðæü üõóóî òöô æöðõöîõ îðòæöæöç æö ðëõîð÷ìñòó üõóóît sò�ì �å����� �õæüò �ìöô ùò�� ��û � ñæöî� �õæüò �ìöô �ìó�ñõ÷ �õøæöõt
åæç �é êëìíî îÿiþìïðæñòó ôõñìöîð÷òðæìö ìø ùêúû ìö ò ïò÷ðæüæïòöðýî æöþëìÿîõ ðæîîÿõF îëìíæöçõ�üõîîæ�õ iòü�ç÷ìÿöô îðòæöæöçt õóóùò÷eÿõ ��û��þ��û�� �é� �ñæöî òð ��� sò�ìAÿðìîðòæöõ÷� �òi �æîæìö �� ùìôÿóõ� �ññÿöìóìçæüt
© Copyright UK NEQAS ICC & ISH - Not for publication without written permission
75

RUN 119 HNPCC Module
Selected Images showing Optimal and Sub-optimal {@stainingtext}
Fig 8: Optimal (A) and sub-optimal (B) demonstration in the UK NEQAS tissue. A - shows
intense nuclear staining in the tumour cells. B - shows very weak to no nuclear staining and
cytoplasmic staining. A) Abcam (EPR3945) 1:550 32mins 37°C; Ventana Ultra; CC1 64mins;
OptiView Kit. B) BD BioSci (44) 1:100 15 mins 20°C; Leica Bond Max; ER2 30 mins; Refine kit.
Fig 7: Optimal (A) and sub-optimal (B) demonstration in the UK NEQAS distributed appendix. A
- shows intense nuclear staining in the basal and lower half of the intestinal crypts, which fades
towards the luminal surface.B - shows weak and patchy staining. A) Ventana CONFIRM (44)
44mins 37°C; Ventana Ultra; CC1 92mins; As per kit. B) As per A (but incubated at 36°C)
��� ��� !"#$ "%&�'() *+'",$&-(&�", ". / 01 �, &!+ %(-&�2�%(,&3$ �,4!"5$+ &�$$5+6 $!"#�,��,&+,$+ ,52)+(- $&(�,�,� �, &!+ 7($() (,* )"#+- !(). ". &!+ �,&+$&�,() 2-8%&$6 #!�2! .(*+$ &"#(-*$the luminal surface. Protocol as per fig. 8 A.
��� 9� :%&�'() ;<= (,* $57"&�'() ;>= *+'",$&-(&�", �, &!+ ?@ BCD< *�$&-�75&+* ,+�(&�E+tumour. A - shows the expected absence of staining in the neoplastic cells with positive stromal
cells as the internal control. B - shows positive stromal cells and cytoplasmic staining of the
negative tumour. A) Protocol as per fig. 8 A. B) Protocol as per fig. 8 B.
��� �G� !"#$ "%&�'() *+'",$&-(&�", ". / 01 ", ( %(-&�2�%(,&3$ �,4!"5$+ &�$$5+6 $!"#�,�absent nuclear staining in the neoplastic cells and intense staining in the stromal cells. Protocol
as per fig. 8 A.
��� ��� !"#$ "%&�'() *+'",$&-(&�", ". / 01 ", ( %(-&�2�%(,&3$ �,4!"5$+3$ &�$$5+6 $!"#�,�intense nuclear staining in the neoplastic cells and positive stromal cells. Protocol as per fig. 8
A.
© Copyright UK NEQAS ICC & ISH - Not for publication without written permission
76

Run 119 HNPCC Module
0
5
10
15
20
25
30
35
4 5 6 7 8 9 10 11 12 13 14 15 16 17 18 19 20
Scores
no
. o
f re
turn
s
RUN 119Y MSH2 on NEQAS Sections
ALL PARTICIPANTS Individual
Scores
4 = 3 (3%)
5 = 1 (1%)
6 = 0 (0%)
7 = 2 (2%)
8 = 5 (6%)
9 = 1 (1%)
10 = 2 (2%)
11 = 2 (2%)
12 = 2 (2%)
13 = 6 (7%)
14 = 8 (9%)
15 = 6 (7%)
16 = 34 (38%)
17 = 11 (12%)
18 = 1 (1%)
19 = 3 (3%)
20 = 2 (2%)
GRAPHICAL REPRESENTATION OF PASS RATES
RUN 119Y MSH2 on NEQAS Sections
UK PARTICIPANTS
0
4
8
12
16
20
4 5 6 7 8 9 10 11 12 13 14 15 16 17 18 19 20
Scores
no
. o
f re
turn
s
Individual
Scores
4 = 1 (2%)
5 = 0 (0%)
6 = 0 (0%)
7 = 0 (0%)
8 = 1 (2%)
9 = 1 (2%)
10 = 0 (0%)
11 = 2 (4%)
12 = 1 (2%)
13 = 3 (7%)
14 = 5 (11%)
15 = 3 (7%)
16 = 19 (42%)
17 = 4 (9%)
18 = 1 (2%)
19 = 2 (4%)
20 = 2 (4%)
Summary
16 - 20 = 51 (57%)
13 - 15 = 20 (22%)
10 - 12 = 6 (7%)
0 - 9 = 12 (13%)
Median = 12.50
Summary
16 - 20 = 28 (62%)
13 - 15 = 11 (24%)
10 - 12 = 3 (7%)
0 - 9 = 3 (7%)
Median = 14.00
0
5
10
15
20
25
30
35
4 5 6 7 8 9 10 11 12 13 14 15 16 17 18 19 20
Scores
no
. o
f re
turn
s
RUN 119Z MSH2 on in-house Sections
ALL PARTICIPANTSIndividual
Scores
4 = 0 (0%)
5 = 0 (0%)
6 = 0 (0%)
7 = 0 (0%)
8 = 2 (2%)
9 = 2 (2%)
10 = 0 (0%)
11 = 1 (1%)
12 = 9 (10%)
13 = 5 (6%)
14 = 5 (6%)
15 = 11 (12%)
16 = 33 (37%)
17 = 12 (13%)
18 = 8 (9%)
19 = 1 (1%)
20 = 0 (0%)0
2
4
6
8
10
12
14
4 5 6 7 8 9 10 11 12 13 14 15 16 17 18 19 20
Scores
no
. o
f re
turn
s
RUN 119Z MSH2 on in-house Sections
UK PARTICIPANTSIndividual
Scores
4 = 0 (0%)
5 = 0 (0%)
6 = 0 (0%)
7 = 0 (0%)
8 = 0 (0%)
9 = 1 (2%)
10 = 0 (0%)
11 = 1 (2%)
12 = 5 (11%)
13 = 3 (7%)
14 = 1 (2%)
15 = 6 (13%)
16 = 14 (31%)
17 = 9 (20%)
18 = 5 (11%)
19 = 0 (0%)
20 = 0 (0%)
Summary
16 - 20 = 54 (61%)
13 - 15 = 21 (24%)
10 - 12 = 10 (11%)
0 - 9 = 4 (4%)
Median = 14.00
Summary
16 - 20 = 28 (62%)
13 - 15 = 10 (22%)
10 - 12 = 6 (13%)
0 - 9 = 1 (2%)
Median = 14.00
© Copyright UK NEQAS ICC & ISH - Not for publication without written permission
77

Run 119 HNPCC Module
0
4
8
12
16
20
24
4 5 6 7 8 9 10 11 12 13 14 15 16 17 18 19 20
Scores
no
. o
f re
turn
s
RUN 119Yb MSH6 on NEQAS Sections
ALL PARTICIPANTSIndividual
Scores
4 = 1 (1%)
5 = 3 (3%)
6 = 0 (0%)
7 = 4 (4%)
8 = 7 (8%)
9 = 4 (4%)
10 = 5 (6%)
11 = 1 (1%)
12 = 12 (13%)
13 = 4 (4%)
14 = 1 (1%)
15 = 6 (7%)
16 = 21 (24%)
17 = 9 (10%)
18 = 3 (3%)
19 = 7 (8%)
20 = 1 (1%)
GRAPHICAL REPRESENTATION OF PASS RATES
0
2
4
6
8
10
12
14
16
4 5 6 7 8 9 10 11 12 13 14 15 16 17 18 19 20
Scores
no
. o
f re
turn
s
RUN 119Yb MSH6 on NEQAS Sections
UK PARTICIPANTSIndividual
Scores
4 = 1 (2%)
5 = 1 (2%)
6 = 0 (0%)
7 = 0 (0%)
8 = 3 (7%)
9 = 0 (0%)
10 = 0 (0%)
11 = 1 (2%)
12 = 8 (18%)
13 = 1 (2%)
14 = 1 (2%)
15 = 3 (7%)
16 = 16 (36%)
17 = 6 (13%)
18 = 2 (4%)
19 = 2 (4%)
20 = 0 (0%)
Summary
16 - 20 = 41 (46%)
13 - 15 = 11 (12%)
10 - 12 = 18 (20%)
0 - 9 = 19 (21%)
Median = 12.50
Summary
16 - 20 = 26 (58%)
13 - 15 = 5 (11%)
10 - 12 = 9 (20%)
0 - 9 = 5 (11%)
Median = 13.50
0
5
10
15
20
25
30
35
40
4 5 6 7 8 9 10 11 12 13 14 15 16 17 18 19 20
Scores
no
. o
f re
turn
s
RUN 119Zb MSH6 on in-house Sections
ALL PARTICIPANTSIndividual
Scores
4 = 0 (0%)
5 = 1 (1%)
6 = 0 (0%)
7 = 0 (0%)
8 = 1 (1%)
9 = 0 (0%)
10 = 0 (0%)
11 = 3 (3%)
12 = 7 (8%)
13 = 2 (2%)
14 = 7 (8%)
15 = 8 (9%)
16 = 39 (44%)
17 = 10 (11%)
18 = 3 (3%)
19 = 7 (8%)
20 = 1 (1%)
RUN 119Zb MSH6 on in-house Sections
UK PARTICIPANTS
0
4
8
12
16
20
24
4 5 6 7 8 9 10 11 12 13 14 15 16 17 18 19 20
Scores
no
. o
f re
turn
s
Individual
Scores
4 = 0 (0%)
5 = 0 (0%)
6 = 0 (0%)
7 = 0 (0%)
8 = 0 (0%)
9 = 0 (0%)
10 = 0 (0%)
11 = 1 (2%)
12 = 2 (4%)
13 = 1 (2%)
14 = 4 (9%)
15 = 1 (2%)
16 = 24 (53%)
17 = 6 (13%)
18 = 2 (4%)
19 = 3 (7%)
20 = 1 (2%)
Summary
16 - 20 = 60 (67%)
13 - 15 = 17 (19%)
10 - 12 = 10 (11%)
0 - 9 = 2 (2%)
Median = 14.50
Summary
16 - 20 = 36 (80%)
13 - 15 = 6 (13%)
10 - 12 = 3 (7%)
0 - 9 = 0 (0%)
Median = 15.50
© Copyright UK NEQAS ICC & ISH - Not for publication without written permission
78

Run 119 HNPCC Module
ANTIBODIES AND OTHER TECHNICAL PARAMETERS EMPLOYED BY PARTICIPANTS IN THE
HNPCC MODULE
The following tables record the number of participants (N) using each primary antibody and the percentage (%) of these
participants achieving acceptable staining (scores 12/20) on UK NEQAS sections.
Antibody Details N %
Primary Antibody : MSH2
Other 3 0BD Bio/Pharmingen 556349 (G219-1129) 3 100Leica/Novocastra NCL-MSH2 (25D12) 7 71BD Bio/Pharmingen 610360 (27) 1 0Invitrogen 33-7900 (FE11) 1 100Ventana 760-4265 (G219-1129) 40 80Cell Marque CMAx/Cx (G219-1129) 5 60Calbiochem NA27/T (FE11) 1 0Dako FLEX RTU IR085 (FE11) 12 92Dako M3639 (FE11) 14 100Epitomics AC-0211 RED2 1 100
Antibody Details N %
Primary Antibody : MSH6
Other 2 50
Abcam AB92471 (EPR3945) 3 100
Leica/Novocastra NCL-L-MSH6 (PU29) 3 0
Ventana CONFIRM 790-4455 (44) 33 24
BD T. Labs/BioSci/Pharmingen 610919 (44/MSH6) 1 0
BD T. Labs/BioSci/Pharmingen 610918 (44) 4 0
Cell Marque 287R-24/25/26 (SP93) 4 50
Cell Marque 287R-27/28 RTU (SP93) 1 100
Epitomics AC-0047 (EP49) 2 100
Dako FLEX RTU IR086 (EP49) 14 93
Dako M3646 (EP49) 21 100
HNPCC Run: 119
MSH2 MSH6
N % N %
Biocare Decloaking Chamber 1 100 1 100Dako Omnis 3 100 3 100Dako PTLink 8 100 8 88Lab vision PT Module 1 0 1 0Leica ER1 30 mins 1 100 2 100Leica ER2 20 mins 8 88 4 100Leica ER2 30 mins 9 67 13 69Leica ER2 40 mins 6 83 4 100Ventana CC1 24mins 2 0 0 0Ventana CC1 32mins 12 67 5 20Ventana CC1 36mins 0 0 1 0Ventana CC1 40mins 5 80 3 33Ventana CC1 44mins 0 0 1 100Ventana CC1 48mins 2 100 3 67Ventana CC1 56mins 3 100 5 60Ventana CC1 64mins 17 88 12 50Ventana CC1 72mins 0 0 2 50Ventana CC1 80mins 1 100 3 67Ventana CC1 88mins 1 100 3 33Ventana CC1 92mins 3 33 8 13Ventana CC1 extended 0 0 1 100Ventana CC1 standard 3 100 3 33Ventana CC2 48mins 1 0 1 0Ventana CC2 80mins 1 100 0 0Ventana CC2 92mins 0 0 1 0
Heat Mediated Retrieval
MSH2 MSH6
N % N %
AS PER KIT 2 100 3 67NOT APPLICABLE 53 79 55 62Ventana Protease 1 (760-2018) 0 0 1 0
Enzyme Mediated Retrieval
HNPCC Run: 119 HNPCC Run: 119
© Copyright UK NEQAS ICC & ISH - Not for publication without written permission
79

Run 119 HNPCC Module
MSH2 MSH6
N % N %
AS PER KIT 4 50 4 75Dako EnVision FLEX ( K8000/10) 1 100 3 100Dako EnVision FLEX+ ( K8002/12) 8 100 7 86Leica Bond Polymer Refine (DS9800) 22 86 22 86NOT APPLICABLE 0 0 1 0Other 3 33 2 0Ventana OptiView (760-700) + Amp. (7/860-099) 14 86 16 44Ventana OptiView Kit (760-700) 30 77 26 42Ventana UltraView Kit (760-500) 4 50 5 20
Detection
MSH2 MSH6
N % N %
AS PER KIT 17 65 18 50Dako EnVision Plus kits 1 100 1 0Dako FLEX DAB 9 100 9 100Dako REAL EnVision K5007 DAB 1 100 1 100Leica Bond Polymer Refine kit (DS9800) 23 83 22 86Other 5 60 5 40Ventana DAB 27 89 25 40Ventana Ultraview DAB 5 40 7 14
Chromogen
HNPCC Run: 119 HNPCC Run: 119
MSH2 MSH6
N % N %
Dako Autostainer 1 0 1 0Dako Autostainer Link 48 6 100 6 83Dako Autostainer plus 1 100 1 100Dako Autostainer Plus Link 1 100 1 100Dako Omnis 4 100 3 100LabVision Autostainer 1 100 0 0Leica Bond Max 7 57 6 67Leica Bond-III 17 88 17 88None (Manual) 1 100 1 100Ventana Benchmark GX 1 100 1 0Ventana Benchmark ULTRA 36 78 40 38Ventana Benchmark XT 13 69 11 55
Automation
HNPCC Run: 119
Participant scored 20/20 (UK NEQAS Slide) and 18/20 (In House slide) using this method.
Primary Antibody:
Automation:
Method:
Main Buffer:
HMAR:
Ventana Benchmark ULTRA
Ventana Optiview
EAR:
Chromogen:
Detection:
Ventana 760-4265 (G219-1129) , 8 Mins, 37 ºC Prediluted
MSH2 - Method 1
Ventana reaction buffer (950-300)
Ventana CC1 64mins
NOT APPLICABLE
AS PER KIT
Ventana OptiView (760-700) + Amp. (7/860-099)
BEST METHODS - Gold Standard Antibody
A selection from just a few of the best methods employed by participants
Participant scored 20/20 (UK NEQAS Slide) and 16/20 (In House slide) using this method.
Primary Antibody:
Automation:
Method:
Main Buffer:
HMAR:
Dako Autostainer Link 48
Dako FLEX+ kit
EAR:
Chromogen:
Detection:
Dako FLEX RTU IR085 (FE11)
MSH2 - Method 2
Dako FLEX wash buffer
Dako PTLink
NOT APPLICABLE
Dako FLEX DAB
Dako EnVision FLEX+ ( K8002/12)
© Copyright UK NEQAS ICC & ISH - Not for publication without written permission
80

Run 119 HNPCC Module
Participant scored 19/20 (UK NEQAS Slide) and 18/20 (In House slide) using this method.
Primary Antibody:
Automation:
Method:
Main Buffer:
HMAR:
Leica Bond Max
Leica BondMAx Refine KIT
EAR:
Chromogen:
Detection:
Dako FLEX RTU IR085 (FE11) , 15 Mins, RT ºC Prediluted
MSH2 - Method 3
Bond Wash Buffer (AR9590)
Leica ER2 30 mins
NOT APPLICABLE
Leica Bond Polymer Refine kit (DS9800)
Leica Bond Polymer Refine (DS9800)
Participant scored 17/20 (UK NEQAS Slide) and 18/20 (In House slide) using this method.
Primary Antibody:
Automation:
Method:
Main Buffer:
HMAR:
Dako Omnis
Dako FLEX+ kit
EAR:
Chromogen:
Detection:
Dako FLEX RTU IR085 (FE11) , 30 Mins
MSH2 - Method 4
Dako Wash Buffer (S3006)
Dako Omnis
NOT APPLICABLE
Dako FLEX DAB
Dako EnVision FLEX+ ( K8002/12) , 30 Mins
Participant scored 19/20 (UK NEQAS Slide) and 20/20 (In House slide) using this method.
Primary Antibody:
Automation:
Method:
Main Buffer:
HMAR:
Ventana Benchmark ULTRA
Ventana Optiview
EAR:
Chromogen:
Detection:
Abcam AB92471 (EPR3945) , 32 Mins, 37 ºC Dilution 1: 1:550
MSH6 - Method 1
Ventana reaction buffer (950-300)
Ventana CC1 64mins
NOT APPLICABLE
Ventana DAB, 37 ºC., Time 1: 12 Mins, Time 2: 12 Mins
Ventana OptiView Kit (760-700) , 12 Mins, 37 ºC Prediluted
BEST METHODS - Secondary Antibody
A selection from just a few of the best methods employed by participants
Participant scored 20/20 (UK NEQAS Slide) and 17/20 (In House slide) using this method.
Primary Antibody:
Automation:
Method:
Main Buffer:
HMAR:
Leica Bond-III
Leica BondMAx Refine KIT
EAR:
Chromogen:
Detection:
Abcam AB92471 (EPR3945) Dilution 1: 150
MSH6 - Method 2
Bond Wash Buffer (AR9590)
Leica ER2 30 mins
NOT APPLICABLE
Leica Bond Polymer Refine kit (DS9800)
Leica Bond Polymer Refine (DS9800)
© Copyright UK NEQAS ICC & ISH - Not for publication without written permission
81

Run 119 HNPCC Module
Participant scored 19/20 (UK NEQAS Slide) and 19/20 (In House slide) using this method.
Primary Antibody:
Automation:
Method:
Main Buffer:
HMAR:
Dako Autostainer Link 48
Dako FLEX+ kit
EAR:
Chromogen:
Detection:
Dako FLEX RTU IR086 (EP49) , 20 Mins, 20 ºC Prediluted
MSH6 - Method 3
Dako FLEX wash buffer, PH: 7.6
Dako PTLink, Buffer: High pH TRS, PH: 9
NOT APPLICABLE
Dako FLEX DAB, 20 ºC., Time 1: 10 Mins, Time 2: 10 Mins
Dako EnVision FLEX+ ( K8002/12)
Participant scored 19/20 (UK NEQAS Slide) and 19/20 (In House slide) using this method.
Primary Antibody:
Automation:
Method:
Main Buffer:
HMAR:
Ventana Benchmark ULTRA
Ventana Optiview
EAR:
Chromogen:
Detection:
Epitomics AC-0047 (EP49) , 32 Mins, 36 ºC Dilution 1: 50
MSH6 - Method 4
Ventana reaction buffer (950-300)
Ventana CC1 64mins
NOT APPLICABLE
Ventana DAB, 36 ºC., Time 1: 8 Mins, Time 2: 8 Mins
Ventana OptiView Kit (760-700) , 8 Mins, 36 ºC Prediluted
© Copyright UK NEQAS ICC & ISH - Not for publication without written permission
82

Introduction
Non-small cell lung cancer (NSCLC) accounts for approximately 80%1 of lung cancers, with a 5 year survival rate of 17%1,2. Existing therapies have limited benefit due to their non-specific targeted approach. However, with the possibility of identifying underlying molecular or mutational changes, certain sub-groups of patients may be eligible candidates for more precise targeted therapies, and thus, have a greater chance of survival. A therapeutic drug currently showing good clinical response is Crizotinib3,4, intended for patients showing anaplastic lymphoma kinase (ALK) rearrangements.
One of the fusion partners of ALK has shown to be echinoderm microtubule associated protein-like 4 (EML4)5 found in 3-6.7%6-10 of patients. The EML4-ALK rearrangement was initially assessed using fluorescence in situ hybridisation (FISH). The FISH technique involves the identification of genetic abnormalities using break-apart FISH probes, to identify whether there are genomic rearrangements or deletions between the EML4-ALK fusion pair3,4. Brightfield immunohistochemistry (IHC) has also enhanced the possibility of detecting ALK rearrangements11. However, IHC for ALK rearrangements can also be challenging due to the relatively low ALK protein concentrations, and therefore requiring more sensitive and/or enhanced detection systems. The publication by Savic and colleagues12 indicates that certain IHC antibodies perform equally well but still recommend a combined use with FISH testing. More recent publications have indicated ALK IHC to be a better predictor of ALK inhibition outcome13. There is also evidence that ALK IHC along with intensity (and H-score) could be used as an affective screening tool14,15, but this is still a debatable subject requiring further clinical evidence and is quite possibly related to the ‘detection system’ employed16.
Assessment Criteria
NEQAS & In-house controls
The NEQAS ICC & ISH quality control samples were placed and orientated as shown in Figure 1 and Table 1. The distributed slide consisted of an area for participants to also cut and place their in-house control material alongside the NEQAS sample. This set-up ensured: • Both the NEQAS & in-house controls had the same
methodology applied
• Allowed easier comparison of both NEQAS & in-house controls during assessments
• Provides a more cost-effective EQA, as less reagent is used by the participant
Interpretation criteria incorporating staining intensity
The assessment consisted of assessors providing their feedback on whether each of the distributed samples were either ALK IHC positive or negative (+ve’/‘-ve’). Alongside this the assessors also provided feedback on the observed intensity of staining including 3+ (high), 2+ (medium) and 1+ (low) intensity. Assessors were therefore asked to score each of the ALK IHC positive samples as: +ve (3+) OR +ve (2+) OR +ve (1+). This allowed for more informative feedback on the intensity of staining on the ALK positive samples and also reflected the different scoring systems employed by participants.
Assessment scoring guidelines
• A team of four assessors independently but simultaneously scored all of the returned slides, and provided interpretation and feedback on technical issues.
• Each of the 4 assessors also provided a possible score out of 5, with marks summed together to give a final score out of 20.
Table 2: Assessment interpretation
Features of Optimal Staining (Figures 1, 3, 5, 7A & 8) • Moderate to strong granular cytoplasmic staining of the
ganglion and nerve cells in the appendix • Strong granular cytoplasmic staining of the positive cell line
sample • No staining of the ALK negative cell line sample
• Moderate to strong granular cytoplasmic staining of the
© UK NEQAS ICC & ISH. No part of this document can be copied or used without prior written consent
Antibody Assessed: ALK
Samples Circulated: Cell lines and NSCLC tissue samples with varying ALK IHC expression & normal appendix (see table below)
Number Registered Participants: 63
Number of Participants This Run: 61 (97%)
Figure 1 & Table 1 below illustrate the positioning of the distributed samples along with their pre-tested IHC status.
Score Interpretation
16-20/20:
Excellent: Samples of very good staining quality and show the expected level of staining
13-15/20:
Acceptable: Some slight technical issues noted by some of the assessors, but overall the staining is suitable for interpretation
10-12/20:
Borderline: Overall the staining is clinically relevant but technical improvements can be made
4-9/20:
Unacceptable: Overall the samples are of unacceptable quality for clinical interpretation and technical improvements need to be made. Marks may have been deducted due to:
- False positive/negative ALK IHC staining
- Lower level of staining than expected - Excessive background staining
- Non-specific or inappropriate staining Marks may also be deducted for reasons which will be shown on individual participant reports such as: morphology damage or poor quality/choice of in-
house control tissue
The ALK for NSCLC Module Run 119
Suzanne Parry
Sample
code
Sample IHC status
(Roche D5F3) A Cell line: Adenocarcinoma -ve
B Cell line: Adenocarcinoma +ve
C NSCLC: Adenocarcinoma +ve
D NSCLC: Adenocarcinoma +ve
E NSCLC: Adenocarcinoma -ve
F Appendix +ve in ganglion and
nerve cells
83
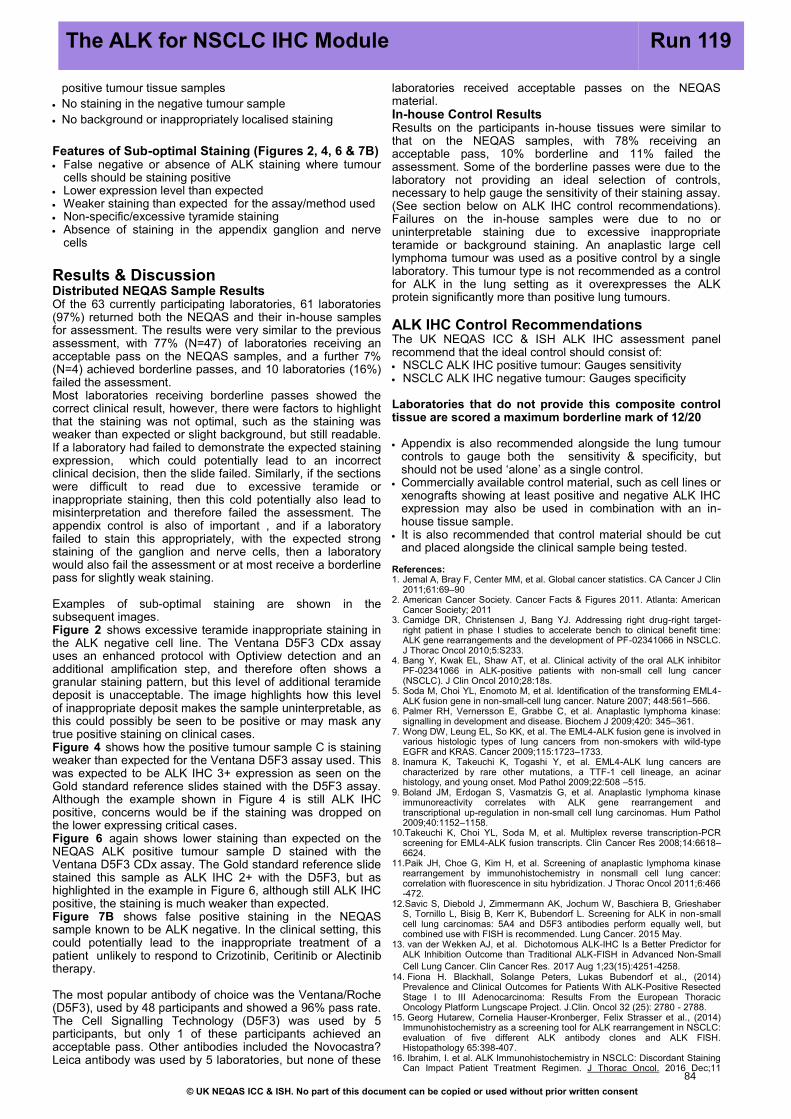
positive tumour tissue samples
• No staining in the negative tumour sample • No background or inappropriately localised staining
Features of Sub-optimal Staining (Figures 2, 4, 6 & 7B) • False negative or absence of ALK staining where tumour
cells should be staining positive • Lower expression level than expected
• Weaker staining than expected for the assay/method used
• Non-specific/excessive tyramide staining
• Absence of staining in the appendix ganglion and nerve cells
Results & Discussion
Distributed NEQAS Sample Results
Of the 63 currently participating laboratories, 61 laboratories (97%) returned both the NEQAS and their in-house samples for assessment. The results were very similar to the previous assessment, with 77% (N=47) of laboratories receiving an acceptable pass on the NEQAS samples, and a further 7% (N=4) achieved borderline passes, and 10 laboratories (16%) failed the assessment. Most laboratories receiving borderline passes showed the correct clinical result, however, there were factors to highlight that the staining was not optimal, such as the staining was weaker than expected or slight background, but still readable. If a laboratory had failed to demonstrate the expected staining expression, which could potentially lead to an incorrect clinical decision, then the slide failed. Similarly, if the sections were difficult to read due to excessive teramide or inappropriate staining, then this cold potentially also lead to misinterpretation and therefore failed the assessment. The appendix control is also of important , and if a laboratory failed to stain this appropriately, with the expected strong staining of the ganglion and nerve cells, then a laboratory would also fail the assessment or at most receive a borderline pass for slightly weak staining.
Examples of sub-optimal staining are shown in the subsequent images. Figure 2 shows excessive teramide inappropriate staining in the ALK negative cell line. The Ventana D5F3 CDx assay uses an enhanced protocol with Optiview detection and an additional amplification step, and therefore often shows a granular staining pattern, but this level of additional teramide deposit is unacceptable. The image highlights how this level of inappropriate deposit makes the sample uninterpretable, as this could possibly be seen to be positive or may mask any true positive staining on clinical cases. Figure 4 shows how the positive tumour sample C is staining weaker than expected for the Ventana D5F3 assay used. This was expected to be ALK IHC 3+ expression as seen on the Gold standard reference slides stained with the D5F3 assay. Although the example shown in Figure 4 is still ALK IHC positive, concerns would be if the staining was dropped on the lower expressing critical cases. Figure 6 again shows lower staining than expected on the NEQAS ALK positive tumour sample D stained with the Ventana D5F3 CDx assay. The Gold standard reference slide stained this sample as ALK IHC 2+ with the D5F3, but as highlighted in the example in Figure 6, although still ALK IHC positive, the staining is much weaker than expected. Figure 7B shows false positive staining in the NEQAS sample known to be ALK negative. In the clinical setting, this could potentially lead to the inappropriate treatment of a patient unlikely to respond to Crizotinib, Ceritinib or Alectinib therapy.
The most popular antibody of choice was the Ventana/Roche (D5F3), used by 48 participants and showed a 96% pass rate. The Cell Signalling Technology (D5F3) was used by 5 participants, but only 1 of these participants achieved an acceptable pass. Other antibodies included the Novocastra?Leica antibody was used by 5 laboratories, but none of these
laboratories received acceptable passes on the NEQAS material. In-house Control Results
Results on the participants in-house tissues were similar to that on the NEQAS samples, with 78% receiving an acceptable pass, 10% borderline and 11% failed the assessment. Some of the borderline passes were due to the laboratory not providing an ideal selection of controls, necessary to help gauge the sensitivity of their staining assay. (See section below on ALK IHC control recommendations). Failures on the in-house samples were due to no or uninterpretable staining due to excessive inappropriate teramide or background staining. An anaplastic large cell lymphoma tumour was used as a positive control by a single laboratory. This tumour type is not recommended as a control for ALK in the lung setting as it overexpresses the ALK protein significantly more than positive lung tumours.
ALK IHC Control Recommendations
The UK NEQAS ICC & ISH ALK IHC assessment panel recommend that the ideal control should consist of: • NSCLC ALK IHC positive tumour: Gauges sensitivity
• NSCLC ALK IHC negative tumour: Gauges specificity
Laboratories that do not provide this composite control tissue are scored a maximum borderline mark of 12/20
• Appendix is also recommended alongside the lung tumour controls to gauge both the sensitivity & specificity, but should not be used ‘alone’ as a single control.
• Commercially available control material, such as cell lines or xenografts showing at least positive and negative ALK IHC expression may also be used in combination with an in-
house tissue sample. • It is also recommended that control material should be cut
and placed alongside the clinical sample being tested.
References: 1. Jemal A, Bray F, Center MM, et al. Global cancer statistics. CA Cancer J Clin
2011;61:69–90
2. American Cancer Society. Cancer Facts & Figures 2011. Atlanta: American Cancer Society; 2011
3. Camidge DR, Christensen J, Bang YJ. Addressing right drug-right target-right patient in phase I studies to accelerate bench to clinical benefit time: ALK gene rearrangements and the development of PF-02341066 in NSCLC. J Thorac Oncol 2010;5:S233.
4. Bang Y, Kwak EL, Shaw AT, et al. Clinical activity of the oral ALK inhibitor PF-02341066 in ALK-positive patients with non-small cell lung cancer (NSCLC). J Clin Oncol 2010;28:18s.
5. Soda M, Choi YL, Enomoto M, et al. Identification of the transforming EML4-
ALK fusion gene in non-small-cell lung cancer. Nature 2007; 448:561–566. 6. Palmer RH, Vernersson E, Grabbe C, et al. Anaplastic lymphoma kinase:
signalling in development and disease. Biochem J 2009;420: 345–361. 7. Wong DW, Leung EL, So KK, et al. The EML4-ALK fusion gene is involved in
various histologic types of lung cancers from non-smokers with wild-type EGFR and KRAS. Cancer 2009;115:1723–1733.
8. Inamura K, Takeuchi K, Togashi Y, et al. EML4-ALK lung cancers are characterized by rare other mutations, a TTF-1 cell lineage, an acinar histology, and young onset. Mod Pathol 2009;22:508 –515.
9. Boland JM, Erdogan S, Vasmatzis G, et al. Anaplastic lymphoma kinase immunoreactivity correlates with ALK gene rearrangement and transcriptional up-regulation in non-small cell lung carcinomas. Hum Pathol 2009;40:1152–1158.
10.Takeuchi K, Choi YL, Soda M, et al. Multiplex reverse transcription-PCR screening for EML4-ALK fusion transcripts. Clin Cancer Res 2008;14:6618–6624.
11.Paik JH, Choe G, Kim H, et al. Screening of anaplastic lymphoma kinase rearrangement by immunohistochemistry in nonsmall cell lung cancer: correlation with fluorescence in situ hybridization. J Thorac Oncol 2011;6:466-472.
12.Savic S, Diebold J, Zimmermann AK, Jochum W, Baschiera B, Grieshaber S, Tornillo L, Bisig B, Kerr K, Bubendorf L. Screening for ALK in non-small cell lung carcinomas: 5A4 and D5F3 antibodies perform equally well, but combined use with FISH is recommended. Lung Cancer. 2015 May.
13. van der Wekken AJ, et al. Dichotomous ALK-IHC Is a Better Predictor for ALK Inhibition Outcome than Traditional ALK-FISH in Advanced Non-Small Cell Lung Cancer. Clin Cancer Res. 2017 Aug 1;23(15):4251-4258.
14. Fiona H. Blackhall, Solange Peters, Lukas Bubendorf et al., (2014) Prevalence and Clinical Outcomes for Patients With ALK-Positive Resected Stage I to III Adenocarcinoma: Results From the European Thoracic Oncology Platform Lungscape Project. J.Clin. Oncol 32 (25): 2780 - 2788.
15. Georg Hutarew, Cornelia Hauser-Kronberger, Felix Strasser et al., (2014)Immunohistochemistry as a screening tool for ALK rearrangement in NSCLC: evaluation of five different ALK antibody clones and ALK FISH. Histopathology 65:398-407.
16. Ibrahim, I. et al. ALK Immunohistochemistry in NSCLC: Discordant Staining Can Impact Patient Treatment Regimen. J Thorac Oncol. 2016 Dec;11
© UK NEQAS ICC & ISH. No part of this document can be copied or used without prior written consent
The ALK for NSCLC IHC Module Run 119
84

RUN 119 ALK NSCLC Module
Selected Images showing Optimal and Sub-optimal immunostaining
Fig 2. Sub-optimal ALK demonstration in the UK NEQAS distributed negative cell line (sample
A) (compare to Fig 1B). The example shows excessive non-specific teramide deposit.
Fig 1. Good example showing the expected ALK expression in the UK NEQAS distributed cell
lines. The positive cell line (sample B) shows strong, membranous and cytoplasmic staining,
while there is no staining in the negative cell line (sample A). This sample remains clean and
without background. Both stained with the Ventana Roche D5F3 ALK assay.
Fig 3. Expected level of staining in the UK NEQAS distributed positive tumour sample C. The
example shows moderate to strong membranous and cytoplasmic staining of neoplastic cells.
Stained using the Ventana D5F3 assay on the Benchmark with OptiView detection and
amplification.
Fig 4. Sub-optimal staining of the UK NEQAS positive tumour sample C. Although the tumour is
staining positive as expected, the reaction is much weaker than expected for the assay used.
Stained with the Ventana D5F3 assay.
Fig 5. Expected level of staining in the UK NEQAS distributed positive tumour sample D. The
section shows mostly high intensity, with some areas of moderate expression. Stained using
the Ventana Roche D5F3 assay.
Fig 6. Example showing sub-optimal demonstration of ALK staining in the UK NEQAS positive
tumour sample D. While the tumour is mostly staining, the expression is weak, with some areas
barely staining at all. Stained with the Ventana D5F3 assay.
© Copyright UK NEQAS ICC & ISH - Not for publication without written permission
85

RUN 119 ALK NSCLC Module
Selected Images showing Optimal and Sub-optimal {@stainingtext}
Fig 8. Example showing optimal ALK staining in the UK NEQAS appendix (sample F). The
section shows strong positive staining of ganglion cells and axons. Appendix acts as a very
good normal control to help gauge the sensitivity of the assay. Stained with the Ventana Roche
D5F3 assay.
Fig 7. Two examples showing ALK IHC demonstration in the UK NEQAS negative tissue
sample. As expected, sample A shows no staining. However, example B shows inappropriate
staining of the tumour, and therefore appears to be weakly positive, therefore, clinically
indicating a false-positive result.
© Copyright UK NEQAS ICC & ISH - Not for publication without written permission
86

Run 119 ALK NSCLC Module
0
2
4
6
8
10
12
4 5 6 7 8 9 10 11 12 13 14 15 16 17 18 19 20
Scores
no
. o
f re
turn
s
RUN 119An ALK on NEQAS Sections
ALL PARTICIPANTS
Individual
Scores
4 = 1 (2%)
5 = 1 (2%)
6 = 0 (0%)
7 = 1 (2%)
8 = 6 (10%)
9 = 1 (2%)
10 = 0 (0%)
11 = 2 (3%)
12 = 2 (3%)
13 = 5 (8%)
14 = 4 (7%)
15 = 5 (8%)
16 = 9 (15%)
17 = 12 (20%)
18 = 9 (15%)
19 = 2 (3%)
20 = 1 (2%)
GRAPHICAL REPRESENTATION OF PASS RATES
0
1
2
3
4
5
6
4 5 6 7 8 9 10 11 12 13 14 15 16 17 18 19 20
Scores
no
. o
f re
turn
s
RUN 119An ALK on NEQAS Sections
UK PARTICIPANTS
Individual
Scores
4 = 0 (0%)
5 = 1 (4%)
6 = 0 (0%)
7 = 0 (0%)
8 = 1 (4%)
9 = 0 (0%)
10 = 0 (0%)
11 = 0 (0%)
12 = 1 (4%)
13 = 2 (9%)
14 = 2 (9%)
15 = 2 (9%)
16 = 2 (9%)
17 = 5 (22%)
18 = 6 (26%)
19 = 1 (4%)
20 = 0 (0%)
Summary
16 - 20 = 33 (54%)
13 - 15 = 14 (23%)
10 - 12 = 4 (7%)
0 - 9 = 10 (16%)
Median = 13.00
Summary
16 - 20 = 14 (61%)
13 - 15 = 6 (26%)
10 - 12 = 1 (4%)
0 - 9 = 2 (9%)
Median = 14.50
0
2
4
6
8
10
12
3 4 5 6 7 8 9 10 11 12 13 14 15 16 17 18 19 20
Scores
no
. o
f re
turn
s
RUN 119Ah ALK on in-house Sections
ALL PARTICIPANTS
Individual
Scores
3 = 0 (0%)
4 = 1 (2%)
5 = 1 (2%)
6 = 0 (0%)
7 = 0 (0%)
8 = 5 (8%)
9 = 0 (0%)
10 = 0 (0%)
11 = 0 (0%)
12 = 6 (10%)
13 = 5 (8%)
14 = 4 (7%)
15 = 4 (7%)
16 = 12 (20%)
17 = 10 (16%)
18 = 4 (7%)
19 = 4 (7%)
20 = 5 (8%)
RUN 119Ah ALK on in-house Sections
UK PARTICIPANTS
0.0
0.5
1.0
1.5
2.0
2.5
3.0
3.5
4.0
3 4 5 6 7 8 9 10 11 12 13 14 15 16 17 18 19 20
Scores
no
. o
f re
turn
s
Individual
Scores
3 = 0 (0%)
4 = 0 (0%)
5 = 0 (0%)
6 = 0 (0%)
7 = 0 (0%)
8 = 0 (0%)
9 = 0 (0%)
10 = 0 (0%)
11 = 0 (0%)
12 = 3 (13%)
13 = 2 (9%)
14 = 2 (9%)
15 = 2 (9%)
16 = 4 (17%)
17 = 4 (17%)
18 = 1 (4%)
19 = 1 (4%)
20 = 4 (17%)
Summary
16 - 20 = 35 (57%)
13 - 15 = 13 (21%)
10 - 12 = 6 (10%)
0 - 9 = 7 (11%)
Median = 14.50
Summary
16 - 20 = 14 (61%)
13 - 15 = 6 (26%)
10 - 12 = 3 (13%)
0 - 9 = 0 (0%)
Median = 16.00
© Copyright UK NEQAS ICC & ISH - Not for publication without written permission
87

Run 119 ALK NSCLC Module
ALK
N %Dako Autostainer Link 48 1 0
Dako Omnis 1 0
Leica Bond Max 1 0
Leica Bond-III 3 0
Ventana Benchmark GX 2 100
Ventana Benchmark ULTRA 30 83
Ventana Benchmark XT 21 95
Automation
ANTIBODIES AND OTHER TECHNICAL PARAMETERS EMPLOYED BY PARTICIPANTS IN THE ALK NSCLC MODULE
The following tables record the number of participants (N) using each primary antibody and the percentage (%) of these
participants achieving acceptable staining (Score >12/20) on UK NEQAS sections.
Primary Antibody N %
Cell Sign. Tech. (D5F3) 5 20
Novocastra NCL-ALK (5A4) 4 0
Novocastra PA0306 (5A4) 1 0
Other 1 0
Ventana/Roche (D5F3) 48 96
ALK NSCLC Run: 119 ALK NSCLC Run: 119
ALK
N %
Dako Omnis 1 0
Dako PTLink 1 0
Leica ER2 20 mins 3 0
None 1 100
Other 3 67
Ventana CC1 36mins 1 100
Ventana CC1 64mins 1 100
Ventana CC1 88mins 2 100
Ventana CC1 92mins 38 97
Ventana CC1 extended 5 40
Ventana CC1 standard 3 33
Heat Mediated Retrieval
ALK NSCLC Run: 119 ALK
N %
AS PER KIT 1 0
Dako EnVision FLEX ( K8000/10) 1 0
Dako EnVision FLEX+ ( K8002/12) 1 0
Leica Bond Polymer Refine (DS9800) 3 0
Ventana OptiView (760-700) + Amp. (7/860-099) 36 92
Ventana OptiView Kit (760-700) 16 88
Ventana UltraView Kit (760-500) 1 0
Detection
ALK NSCLC Run: 119
ALK
N %AS PER KIT 3 67
NOT APPLICABLE 31 77
Enzyme Retrieval
ALK NSCLC Run: 119ALK
N %
AS PER KIT 18 78
DAKO DAB+ 1 0
Dako EnVision Plus kits 1 0
Leica Bond Polymer Refine kit (DS9800) 4 0
Ventana DAB 31 94
Ventana Ultraview DAB 4 100
Chromogen
ALK NSCLC Run: 119
© Copyright UK NEQAS ICC & ISH - Not for publication without written permission
88

Run 119 ALK NSCLC Module
Participant scored 19/20 (UK NEQAS Slide) and 16/20 (In House slide) using this method.
Primary Antibody:
Automation:
Method:
Main Buffer:
HMAR:
Ventana Benchmark ULTRA
EAR:
Chromogen:
Ventana/Roche (D5F3)
ALK - Method 1
Ventana CC1 92mins
NOT APPLICABLE
AS PER KIT
Detection: Ventana OptiView (760-700) + Amp. (7/860-099)
BEST METHODS
A selection from just a few of the best methods employed by participants
Participant scored 20/20 (UK NEQAS Slide) and 16/20 (In House slide) using this method.
Primary Antibody:
Automation:
Method:
Main Buffer:
HMAR:
Ventana Benchmark XT
EAR:
Chromogen:
Detection:
Ventana/Roche (D5F3) Prediluted
ALK - Method 2
Ventana CC1 92mins
NOT APPLICABLE
Ventana DAB
Ventana OptiView Kit (760-700)
© Copyright UK NEQAS ICC & ISH - Not for publication without written permission
89

90

Gene Assessed: HER2
Sections Circulated: Composite slide consisting of 4 breast carcinoma sections (see table below)
Number of Registered Participants: 153
Number of Participants Taking Part this Run 129 (84%)
The HER2 ISH Module - Interpretive Run 48
Sample HER2 status by IHC
HER2 status by FISH
A 2+ Amplified
B 2+ Borderline/Non-amplified
C 2+ Non-amplified
D 2+ Non-amplified
Introduction
Breast cancer HER2 status should be determined in all newly diagnosed and recurrent and metastatic breast cancers. In-situ hybridization (ISH), using either fluorescent (FISH) or brightfield chromogenic methods (CISH) are now recognised techniques to determine the amplification status of breast cancers in either 2+ IHC equivocal cases or as an upfront method. Although single HER2 probe methods are available, such as Ventana Silver ISH (SISH), the dual probe (ratio) based techniques are the method of choice, with chromogenic assays now used as abundantly as FISH
For UK laboratories who are accredited to carry out diagnostic HER2 ISH testing, participation in an external quality assessment (such as the UK NEQAS ICC & ISH) is a requirement, and therefore poor performance is monitored on a regular basis to enhance confidence in HER2 ISH testing. It should also be emphasised that the scheme remains very much open to non-UK laboratories as an aid to monitoring and improving performance.
Recommendations
There are several recommendations regarding HER2 ISH testing including those by ASCO/CAP (USA) and the UK Recommendations and Guidelines. It is advisable that these guidelines are followed and the processes of introducing and maintaining a clinically validated HER2 ISH assay or laboratory developed test (LDT) are properly validated prior to their introduction into the laboratory as a diagnostic test.
Assessment Procedure The assessment of slides utilises a statistical method in order to provide more concise information with regards to inter-observer variability in enumerating HER2 copy, chromosome 17 and overall ratios (See table: Statistical Approach to the Scoring System).
Assessment Results
All laboratories employed a dual probe and a ratio scoring algorithm. 64% of participants achieved excellent or acceptable results. 26% received a borderline pass and 13 laboratories (10%) had an unacceptable interpretation result. Two of the unacceptable results were from UK laboratories. The most common brightfield method was the Ventana DDISH with 46 (36%) laboratories using this technique, and for the FISH method, the most popular assay was the Pathvysion Vysis Kit, used by 38 (29%) of laboratories. Acceptable pass rates with the Pathvysion Vysis Kit was slightly better than with the Ventana DDISH assay for this particular assessment run: 66% and 59% respectively. The most notable difference when comparing the interpretative results of run 48 to the previous run 47 is the drop in acceptable results, which has fallen from 74% in the previous run (47) to 64% in the current run (48).
HER2 ISH Method and Probe Enumeration
The subsequent table and graphs show the various ISH methods employed along with percentages of pass rates. Frequency histograms of the assessment results are also provided showing the distribution of HER2 copy and Cen17 counts and ratio calculations. Participants are encouraged to use the provided frequency histograms to gauge their own performance and variability in counts for each of the distributed samples.
Bibliography 1. Rakha, E., Pinder, S., Bartlett, J., Ibrahim, M., Starczynski, J., Carder, P.,
Provenzano, E., Hanby, A., Hales, S., Lee, A. and Ellis, I. (2014). Updated UK Recommendations for HER2 assessment in breast cancer. Journal of Clinical Pathology, 68(2), pp.93-99.
2. Bartlett, J., Starczynski, J., Atkey, N., Kay, E., O'Grady, A., Gandy, M., Ibrahim, M., Jasani, B., Ellis, I., Pinder, S. and Walker, R. (2011). HER2 testing in the UK: recommendations for breast and gastric in-situ hybridisation methods. Journal of Clinical Pathology, 64(8), pp.649-653.
3. Moore, D., McCabe, G. and Craig, B. (2011). Introduction to the practice of statistics. 7th ed. New York, NY: Freeman.
Suzanne Parry
Tissue Expression levels: The summary box below gives details of the HER2 phenotype and genotype of the tissues circulated for this assessment, which comprised of formalin fixed and paraffin processed sections from a composite block of four human breast carcinomas.
© UK NEQAS ICC & ISH. No part of this document can be copied or used without prior written consent
Tissue Section Positioning: Tissue sections were positioned on microscope slides as illustrated in the image below
91

Run 48 ISH Module
GRAPHICAL REPRESENTATION OF PASS RATES (ratio methods only)
RUN 48 HER-2 ISH: Ratio Method: All Participants
0
4
8
12
16
20
24
12 13 14 15 16 17 18 19 20 21 22 23 24 25 26 27 28 29 30 31 32 33 34 35 36
Scores
no
. o
f re
turn
s
0
2
4
6
8
10
12 13 14 15 16 17 18 19 20 21 22 23 24 25 26 27 28 29 30 31 32 33 34 35 36
Scoresn
o. o
f re
turn
s
RUN 48 HER-2 ISH: Ratio Method: UK labs only
Excellent: 36-36/36 = 3 (7%)
Acceptable: 30-35/36 = 29 (71%)
Borderline: 24-29/36 = 8 (20%)
Unacceptable: <24/36 = 1 (2%)
Excellent: 36-36/36 = 8 (6%)
Acceptable: 30-35/36 = 77 (59%)
Borderline: 24-29/36 = 33 (25%)
Unacceptable: <24/36 = 12 (9%)
METHODS USED and PASS RATES
The following tables record the number of participants (N) using each method, antibody and the percentage (%) of these participants
achieving acceptable interpretation. For those using a dual probe (ratio) method the pass rate is >30/36 and for those using a single
HER2 copy method the pass rate is >10/12
Ratio Method N
% Pass
(score > 30/36)
Ratio: Dako IQFISH pharmDX 58% 12
Ratio: Dako Pharm Dx 0% 1
Ratio: In house FISH 67% 3
Ratio: Kreatech Probes 100% 3
Ratio: Leica HER2 FISH TA9217 88% 8
Ratio: Other - CISH 100% 1
Ratio: Other - FISH 75% 4
Ratio: Pathvysion Vysis Kit 68% 38
Ratio: Ventana BDISH 800-098/505 50% 4
Ratio: Ventana DDISH (780/800-4422) 60% 47
Ratio: Ventana Inform Silver ISH 100% 2
Ratio: Zytovision ZytoDot 2C 0% 1
Ratio: Zytovision ZytoLight 80% 5
Copy Method (Shown Only When Applicable) N
% Pass
(score > 10/12)
© Copyright UK NEQAS ICC & ISH - Not for publication without written permission
92

Run 48 ISH Module
Green = mean +/- 1 Stdev Amber = mean +/- 2 Stdev Red = mean > +/- 3 stdev
FREQUENCY HISTOGRAMS
The below histograms show distribution of HER2 copy, Chr17 and Ratio results for this assessment
0
10
20
30
40
50
< 2.1 2.1- 3 3- 3.9 3.9-4.79
4.79-5.69
5.69-6.59
6.59-7.49
7.49-8.39
8.39-9.28
>10.18
Sample A: Av. HER2 copy
No
Pa
rtic
ipa
nts
0
10
20
30
40
50
60
< 0.45 0.45-0.92
0.92-1.39
1.39-1.85
1.85-2.32
2.32-2.79
2.79-3.26
3.26-3.72
3.72-4.19
> 4.66
Sample A: Av. Chr17
0
5
10
15
20
25
30
35
40
45
< 0.16 0.16-0.73
0.73-1.29
1.29-1.85
1.85-2.41
2.41-2.97
2.97-3.54
3.54-4.1
4.1-4.66
> 5.22
Sample A: Ratio
No
Pa
rtic
ipa
nts
0
10
20
30
40
50
< 0.44 0.44-1.05
1.05-1.67
1.67-2.29
2.29-2.91
2.91-3.53
3.53-4.15
4.15-4.77
4.77-5.39
> 6.01
Sample B: Av. HER2 copy
0
5
10
15
20
25
30
35
40
< 0.41 0.41-0.91
0.91-1.42
1.42-1.92
1.92-2.42
2.42-2.93
2.93-3.43
3.43-3.93
3.93-4.43
> 4.94
Sample B: Av. Chr17
0
10
20
30
40
50
60
< 0.64 0.64-0.78
0.78-0.92
0.92-1.06
1.06-1.2
1.2-1.33
1.33-1.47
1.47-1.61
1.61-1.75
> 1.89
Sample B: Ratio
0
5
10
15
20
25
30
35
40
45
< 1.73 1.73-2.19
2.19-2.66
2.66-3.13
3.13-3.59
3.59-4.06
4.06-4.53
4.53-4.99
4.99-5.46
> 5.93
Sample C: Av. HER2 copy
No
Pa
rtic
ipa
nts
0
10
20
30
40
50
< 1.01 1.01-1.29
1.29-1.57
1.57-1.85
1.85-2.13
2.13-2.4
2.4-2.68
2.68-2.96
2.96-3.24
> 3.52
Sample C: Av. Chr17
0
10
20
30
40
50
60
< 0.71 0.71-0.96
0.96-1.21
1.21-1.45
1.45-1.7
1.7-1.95
1.95-2.19
2.19-2.44
2.44-2.69
> 2.93
Sample C: Ratio
0
5
10
15
20
25
30
35
40
< 3.11 3.11-4.02
4.02-4.93
4.93-5.85
5.85-6.76
6.76-7.67
7.67-8.58
8.58-9.49
9.49-10.41
>11.32
Sample D: Av. HER2 copy
No
Pa
rtic
ipa
nts
0
10
20
30
40
50
60
70
80
-0.19-0.95
0.95-2.09
2.09-3.23
3.23-4.38
4.38-5.52
5.52-6.66
6.66-7.8
7.8-8.95
> 10.09
Sample D: Av. Chr17
0
10
20
30
40
50
60
< 0.51 0.51-0.76
0.76- 1 1- 1.24 1.24-1.49
1.49-1.73
1.73-1.98
1.98-2.22
2.22-2.47
> 2.71
Sample D: Ratio
© Copyright UK NEQAS ICC & ISH - Not for publication without written permission
93

Gene Assessed: HER2
Sections circulated: Composite slide consisting of 4 breast carcinoma sections (see table below)
Number of Registered Participants: 153
Number of Participants Taking Part this Run 126 (82%) (71 Fluorescent and 55 Chromogenic)
The HER2 ISH Module - Technical Run 48
Assessment Procedure
Brightfield ISH (CISH / SISH / BDISH / DDISH) was assessed around a multi-header microscope. Each slide was reviewed by 4 independent assessors, each providing scores from 1-5 for the slide as a whole (not the individual tissue sections). The scores were added together to give an overall score out of 20 along with any assessor feedback comments.
Fluorescent ISH (FISH) was assessed by a team of assessors who viewed the slides together on a large HD screen which was linked to the fluorescent microscope. Each assessor provided their opinion and feedback, and then an overall score was given out of 20.
A summary of the assessment scoring criteria and it’s interpretation is shown in the table on the next page
Each of the UK NEQAS tissue sections (A-D) (as well as in-
house samples where submitted) are individually assessed for the quality of ISH staining. Assessors do not count the HER2/Cen17 signals. The accuracy of signal enumeration is assessed in the 'Interpretive' section of the HER2 ISH module.
Important: If two separate slides are submitted with separate for example, when using the Ventana/Roche SISH technique, which requires the Cen17 and HER2 probes to stained separately, the assessors will regard this as a single result, and as such, combined comments are placed in a single results column. If cores from a combination of the 2 distributed slides have been used to carry out the counts for the interpretive assessment, then it is important that participants indicate on the slide and the online methodology form as to which cores were used, as these will be the cores reviewed in the technical part of the assessment.
In-house ‘example/s’ are also requested for this module and participants will be required to place them on the distributed NEQAS slides whenever possible. However, due to there sometimes being the requirement to alter the digestion times for
the differences in pre-analytics, separate in-house samples are accepted. A single tissue only is required for the in-house sample.
Results Summary
CISH Results
Selected images Figures 1-6 show examples of the acceptable and unacceptable levels of staining for the different methods.
The overall results showed slightly lower pass rates compared to the previous run (Run 47). 31 (56%) of laboratories achieved an acceptable pass rate on this Run (48) compared to 59% on previous run on the UK NEQAS distributed material. Again, the failures were predominantly due to weak or no Cen17 signals, as seen in previous assessment runs. The borderline passes were given for weak, but diagnostically readable signals; again, this was mostly due to weak Cen17 signals. Some slides showed dust-like silver chromogen signals, but unless obscuring the specific HER2 signals and the slide was deemed still readable, the section did not fail, but was given a borderline pass. More recently the assessment is also seeing more red precipitate, sometimes obscuring the signals, and lack of staining in the normal cells. These observational results refer to the Ventana DDISH, Inform or BDISH methods. Another assay used in the assessment was the ZytoDot 2C, ZytoVision, which was used by one participant, but unfortunately this slide did not pass the assessment. Th Dako DuoCISH method was also used by 1 laboratory, and unfortunately also failed the assessment.
Important: Whichever Brightfield ISH methodology is being used, any laboratory experiencing staining problems should contact the relevant company for further support.
FISH Results
71 laboratories submitted slides for the FISH assessment. The results show an increase of 3% in acceptable results from run
Suzanne Parry and Jamie Hughes
The Summary Box below gives details of the HER2 phenotype and genotype of the tissue sections circulated for this assessment, which comprised of formalin fixed and paraffin processed sections from a composite block of four human breast carcinomas
© UK NEQAS ICC & ISH. No part of this document can be copied or used without prior written consent
Sample HER2 status by IHC
HER2 status by FISH
A 2+ Amplified
B 2+ Borderline/Non-amplified
C 2+ Non-amplified
D 2+ Non-amplified
Tissue Section Positioning: Tissue sections were positioned on microscope slides as illustrated in the image on the left (same sample as the interpretive ISH)
94

The HER2 ISH Module - Technical Run 48
47, as shown in the table below:
There was an improvement in the current run 48 compared to the previous run (47) where there was a high level of FISH submissions with weak or no HER2 and/or Cen17 signals. This may have been attributed to technical handling (e.g. cleaning of slides with alcohol before sealing), storage or transport errors (e.g. temperature fluctuations), as it did not appear to be assay specific.r
The failure rate dropped from 17% (run 47) to 14% (run 48). This is reflected in the overall pass rate with an increase of acceptable pass rates from 71% (run 47) to 79% (run 47). Images of acceptable and unacceptable levels of staining are illustrated in Figures 7-8.
The Pathvysion Vysis kit was the most commonly used FISH method, used by 51% (N=38) of FISH participants. The acceptable pass rate using the Vysis kit for this run was 67%, and a further 8% achieved a borderline pass. The second most common assay was the Dako IQFISH used by 15% of FISH participants, and showed an acceptable pass rate of 91%. Zytovision (ZytoLight) was used by 7% of FISH participants and showed an acceptable pass rate of 100%. Other FISH assays/probes used include; Dako Pharm Dx, Leica HER2 FISH system and Kreatech Probes, all of which performed well overall, although the numbers of laboratories adopting these methods are low.
Validating ISH
It is crucial to emphasise the importance of undertaking a robust validation and verification protocol when introducing ISH into a diagnostic laboratory for the first time or a new assay/method is being introduced. For example, changing from a FISH assay to a brightfield ISH asssay, the new technique must be fully validated and staff must undergo extra training to gain expertise with the new method employed. The UK NEQAS data indicates that there is a definite move towards the use of the Ventana DDISH method and laboratories introducing either this method or another ISH method should make sure that: • Staff perform a minimum of 100 ISH evaluations in parallel
with an experienced member of staff to ensure scoring consistency before working independently. • A minimum concordance of 95% is recommended for both
diagnostic results (amplified and non-amplified status) and • numerical results (for both HER2 and Cen17). • Clinical and UK NEQAS samples should be assessed for
quality of hybridisation prior to interpretation. You should make sure that the probe signals are easily discernible, normal cells show the expected HER2 and/or Cen17 signal, and there is minimal background and leaching of the signal.
• Further validation guidelines can be found in: Bartlett et al., (2011) HER2 testing in the UK: Recommendations for Breast and Gastric In-situ Hybridisation Methods. J Clin Pathol.64(8):649-653.
Table below shows a summary of the assessment scoring criteria and interpretation.
Scoring Interpretation
Acceptable
Individual Assessor 4-5/5 or
Overall score >13/20
The NEQAS distributed samples and/or in-house tissue show a good/very good standard of staining and are suitable for interpretive analyses.
Borderline
Individual Assessor 3/5
or Overall Score = 10-12/20
The NEQAS distributed samples and/or in-house tissue is borderline interpretable with 2 out of the 4 assessors indicating that improvements can be made with respect for example:
Excessive / Weak Nuclear staining
Level of probe hybridisation
Excessive background staining
Also see assessor comments on your report
Unacceptable
Individual Assessor 1-2/5 or
Overall score <9/20 =
The NEQAS distributed samples and/or in-house tissue is unacceptable for interpretation with at least 3 out of the 4 assessors indicating that there are hybridisation issues, which could be due:
Excessive / Weak Nuclear staining
Poor probe hybridisation
Missing HER2 copy no. / CEN 17
Excessive background staining
Also see assessor comments on your report
Score = 0 Slide Not submitted for assessment
© UK NEQAS ICC & ISH. No part of this document can be copied or used without prior written consent
HER FISH Pass Rates : NEQAS se ion
Run Run
A epta le % N= % N=
Borderline % N= % N=
Una epta le % N= % N=
95

The HER2 ISH Module - Technical Run 48
How to Use this Report to Compare NEQAS Cell Line ‘Technical’ & ‘Interpretive’ Results:
Once you have your results for both the ‘Interpretive’ and ‘Technical’ HER2 ISH modules, use both results to troubleshoot whether there are interpretive and/or technical issues with your ISH methodology. The table below shows a brief troubleshooting guide, which we hope will assistant you further. UK NEQAS ICC & ISH recommends that laboratories should continually monitor their performance to make sure that both technical and interpretive results are frequently audited.
Interpretive & Technical Troubleshooting Guide
Interpretive
Result Technical
Result (pre-pilot module)
Overall Feedback
Appropriate or Acceptable
Acceptable Acceptable The NEQAS samples show a good standard of staining and have been interpreted correctly
Unacceptable
Acceptable
Unacceptable The NEQAS samples show a good standard of staining BUT there appears to be issues with interpretation i.e. HER2 copy number and/or Cen17 overestimated/underestimated. Recommend that scoring/counting criteria is reviewed
Appropriate or Acceptable
Borderline
Borderline Acceptable
The NEQAS samples are of borderline acceptability for staining quality. Recommend that technical method (kit/assay) is further optimised.
Unacceptable
Borderline
Unacceptable The technical staining can be improved as this may be effecting interpretation. Recommend that technical method (kit/assay) is optimised (or where relevant a standardised kit is used as per instructions) as interpretation may be affected by the borderline quality of staining.
Appropriate or Acceptable
Unacceptable
Unacceptable
The NEQAS samples are unacceptable for interpretation and caution should be taken when interpreting from these slides. Recommend that technical method (kit/assay) is optimised (or where relevant a standardised kit is used as per instructions) as interpretation, although appears correct, may lead to incorrect interpretation of clinical cases.
Unacceptable
Unacceptable
Unacceptable
The NEQAS samples are unacceptable for technical staining and interpretation. Reporting from such cases is very likely to lead to incorrect interpretation of clinical cases. If there is persistent underperformance:
• seek assistance from kit/assay manufacturer • seek assistance from UK NEQAS or colleagues
• re-validate protocol (retrospectively and prospectively) • review scoring criteria
• send clinical cases to a reference centre to confirm your results
© UK NEQAS ICC & ISH. No part of this document can be copied or used without prior written consent
Recommendations for Returning FISH Slides for NEQAS Assessments
a. Sections should be mounted using a fluorescence antifade mounting media, which prevents loss/quenching of fluorescence e.g. Vectashield (Vector labs), Dako Fluorescence Mounting Medium (Dako), Fluoromount (SIGMA/Aldrich, VWR). Note: The Abbott Vysis kit already contains DAPI in phenylenediamine dihydrochloride, which is an anti fading reagent, but we have found that
some laboratories also sued the above mentioned mounting media.
b. Seal the coverslip edges onto the slide using clear varnish or another sealing agent, which will stop the slide from drying out.
c. Send back FISH slides as soon as you have finished your own interpretation.
d. There is no need to send back slides packed in ice/dry ice. Please return in the slide mailer that is provided.
96

RUN 48 BREAST HER2 ISH Module
Selected Images showing Optimal and Sub-optimal staining
Figure 2. Acceptable Ventana DDISH in the UK NEQAS non-amplified and amplified distributed
samples C and D. Both samples show strong HER2 signals (black) and Chr17 signals (red)
with the expected average copy numbers per cell.
Figure 1. Acceptable Ventana DDISH in the UK NEQAS distributed amplified and non-amplified
samples A and B. Both examples show distinct HER2 signals (black) and Chr17 signals (red) at
the expected signal level.
Figure 3. Single probe silver Ventana ISH assay on the UK NEQAS distributed sample A.
Section A shows the Chr17 probe, while section B is the HER2 copy number. The section is
non-amplified.
Figure 4. Single probe silver Ventana ISH assay on the UK NEQAS distributed sample B. Both
the Chr17 (A) and the HER2 (B) probes show the good strong black signals at the expected
level.
Figure 5. Two examples showing unacceptable Ventana DDISH staining in the UK NEQAS
non-amplified samples (A and B): There are no Chr17 signals and therefore the samples are
uninterpretable.
Figure 6. Unacceptable Ventana DDISH staining in the UK NEQAS non-amplified samples (C
and D): Example A shows leaching of the Chr17 probe, and in example B there is excessive
precipitate and background.
© Copyright UK NEQAS ICC & ISH - Not for publication without written permission
97

RUN 48 BREAST HER2 ISH Module
Selected Images showing Optimal and Sub-optimal {@stainingtext}
Figure 2: Excellent demonstration of HER2 gene and CEP17 on core B of the UK NEQAS
distributed sample. Fibroblasts are clearly visible and appropriate number of signals are
present. Pathvysion Vysis Kit; Dako pre-treatment buffer; Pepsin 37°C for 5 mins
Figure 1: Excellent demonstration of HER2 gene and CEP17 on core A of the UK NEQAS
distributed sample. Pathvysion Vysis Kit; Dako pre-treatment buffer; Pepsin 37°C for 5 mins
Figure 4: Excellent demonstration of HER2 gene and CEP17 on core D of the UK NEQAS
distributed sample. Image shows clear amplified tumour with multiple single signals and cluster.
Kreatech Probes; Other; Pepsin 37°C for 20 mins
Figure 3: Excellent demonstration of HER2 gene and CEP17 on core C of the UK NEQAS
distributed sample. Kreatech Probes; Other; Pepsin 37°C for 20 mins
Figure 6: Poor example of HER2 gene and CEP17 demonstration on in-house control tissue.
No signals observed. Likely due to fading before assessment date as participant scored
acceptable in the interpretive module. Pathvysion Vysis Kit; Vysis kit I; Protease 37°C for 26
mins.
Figure 5: Poor example of HER2 gene and CEP17 demonstration on in-house control tissue.
Excessive CEP17 signal inside and outside of the nucleus. Pathvysion Vysis Kit; Vysis
(VP2000); Protease I 37°C for 60 mins
© Copyright UK NEQAS ICC & ISH - Not for publication without written permission
98

Run 48 Breast HER2 ISH Technical Module
CISH NEQAS Slide (n=55)
0
10
20
30
40
50
60
70
80
90
100
Acceptable (n=31)
Borderline (n=15)
Unacceptable (n=9)
56%
27%
16%
Overall Pass Rates
Technical ISH: Pass Rates and Methods
FISH NEQAS slide (n=71)
0
10
20
30
40
50
60
70
80
90
100
Acceptable (n=56)
Borderline (n=5)
Unacceptable (n=10)
79%
7%
14%
0%
10%
20%
30%
40%
50%
60%
70%
80%
90%
100%
Dako IQFISHpharmDX
(n=11)
Dako PharmDx (n=1)
In houseFISH (n=2)
KreatechProbes (n=3)
Leica HER2FISH
TA9217(n=8)
Not Stated(n=1)
Other - FISH(n=4)
PathvysionVysis Kit(n=36)
ZytovisionZytoLight
(n=5)
91100 100 100
88
100
7567
100
9
25
8
13
25
Unacceptable
Borderline
Acceptable
NEQAS Slides: FISH Methods Used and Percentage Pass Rates
0%
10%
20%
30%
40%
50%
60%
70%
80%
90%
100%
Not Stated (n=1) Other - CISH (n=1) Ventana BDISH800-098/505 (n=4)
Ventana DDISH(780/800-4422)
(n=46)
Ventana InformSilver ISH (n=2)
Zytovision ZytoDot2C (n=1)
100 100
75
52
100
25
30
17
100Unacceptable
Borderline
Acceptable
NEQAS Slides: CISH Methods Used and Percentage Pass Rates
© Copyright UK NEQAS ICC & ISH - Not for publication without written permission
99

© UK NEQAS ICC & ISH. No part of this document can be copied or used without prior written consent
For advertising opportunities contact: Neil Bilbe: [email protected]
UK NEQAS ICC & ISH
Improving Immunocytochemistry for over 25 Years
100


![PLATINUM SPONSOR - Closte · LEVEL OF SPONSORSHIP [CHECK ONE]: q PLATINUM SPONSOR [$10000] q GOLD SPONSOR [$5000] q Breakfast Sponsor q Lunch Sponsor q Gift Sponsor q Auction Sponsor](https://static.fdocuments.in/doc/165x107/60014c66d50c102c412072c5/platinum-sponsor-closte-level-of-sponsorship-check-one-q-platinum-sponsor-10000.jpg)