Rudolf Andorka - Zsuzsa Ferge - István György Tóth: Is ... · 1 Rudolf Andorka - Zsuzsa Ferge -...
25
1 Rudolf Andorka - Zsuzsa Ferge - István György Tóth: Is Hungary really the least unequal? A discussion of data on income inequalities and poverty in Central and Eastern European countries Research note on the data preseented in the World Development Report TÁRKI-ELTE Budapest October 1996
Transcript of Rudolf Andorka - Zsuzsa Ferge - István György Tóth: Is ... · 1 Rudolf Andorka - Zsuzsa Ferge -...

1
Rudolf Andorka - Zsuzsa Ferge - István György Tóth:
Is Hungary really the least unequal?
A discussion of data on income inequalities and poverty in Central and Eastern European countries
Research note on the data preseented in the World Development Report
TÁRKI-ELTE Budapest
October 1996

2
1. Introduction1
It is hard to doubt that income inequalities had to increase in Central and Eastern
European countries after the transition. It has been obvious right at the outset that with the
introduction of market economies disparities will grow in all walks of life from ownership and
income to life chances and life styles. However, though the orientation of the changes is
straightforward, their magnitude within the countries and their similarity or difference between the
countries is uncertain and controversial.
The reasons of inconclusive results are manifold:
• There is a lack of reliable and sufficiently comparable data. (Over and above the usual
difficulties of income measurement, the spread of black and grey economies render very
difficult to obtain reliable results on household income.)
• Methodological differences in certain cases hinder comparability.
• There may be serious conceptual inter-country differences in sampling, research questions,
presentation of data etc. among surveys on the economic position of the respondents.
This research note intends to have a closer look on the available income data using
various sources and relying on our earlier research on income inequalities and poverty in Central
and Eastern Europe. The present exercise was prompted by the publication of the recent World
Development Report (referred to hereafter as WDR), a volume published for the World Bank by
the Oxford University Press. This book is one of the most comprehensive accounts of the
problems of the transition countries during their shift "From Plan to Market". Rich in relevant data,
well focused interpretations and clearly formulated conclusions characterise the book. Our
research note will relate to one area only, the one which is the closest to our interest: a chapter
called "People and the Transition" dealing with the social dimensions of the economic transition.
We find it reassuring that the World Bank devotes an important part of the book to this issue. This
fact, as well as the volume edited by Nicholas Barr on "Labour Markets and Social Policy in
Central and Eastern Europe" (Barr, 1994), or a most recent publication on "Public Spending and
the Poor” (van de Walle - Nead, 1995) indicate convincingly that the World Bank puts a strong
emphasis on the social impact of the economic transition.
While many of the results contained in WDR correspond to our previous knowledge and
complete it, some of the findings are at variance with information coming from other sources. We
have found particularly debatable some data on income inequalities and some on the magnitude
of poverty. This research note is about these two issues.
1 The authors wish to thank Zoltán Fábián for his assistance in some of the computations.

3
We are obviously aware of the fact that the measurement of income inequalities and of
poverty constitutes a difficult and controversial methodological task. Indeed, while doing our
analysis we arrived to the conclusion that most of the differences are due to methodological
differences. However, results obtained by different methods may lead to different political
conclusions. It seems to us therefore that the results obtained by various methods have to be
examined taking into account conditions which may throw light on the respective validity of the
findings.
2. A comparison of income inequalities
2.1. Data presented in the World Development Report
Data presented in the WDR suggest that:
• Inequalities increased significantly in the transition economies.
• There has been a dramatic increase in some of the countries, while others produced much
smaller increase in income inequalities.
• The data about Hungary suggest that this country is an outlier: income inequalities there
increased to an unusually small extent, so that Hungary is one of the countries having the
lowest level of inequalities.
This latter finding made headlines in Hungary. The press emphasised strongly that
inequalities are by far the smallest in Hungary as compared to other post socialist countries
making a sort of political issue of this scientific finding. We do not intend to deal with the political
implications. However, we question the published results on methodological grounds, adding also
some substantive considerations to the debated issues.
One possible summary statistical measure for the concentration of incomes is the Gini
coefficient. This coefficient ranges from a value of zero (perfect equality, when each members
receive the same amount) to one (perfect inequality, when all the incomes are concentrated in the
hands of the single wealthiest person in the population). An easy interpretation of the Gini
coefficients can be given by the graphical representation of Lorenz curves. If cumulative
population shares and their cumulative income shares are presented as Lorenz curves, the Ginis
are defined as the areas between these curves and the line of perfect equality (45%), expressed
as a percentage of the whole area of the triangle. Ginis above 0.4-0.5 signify relatively high
inequalities, while Ginis around 20 percent are considered to portray a relatively equalised income
distribution.
The WDR presents in its text Gini coefficients that suggest that Bulgaria is by far the most
unequal country among the quoted six, followed by Poland, Slovenia, the Czech Republic,
4
Slovakia and, quite far behind them, Hungary (Table 1, first column). As neither the text, nor the
table footnotes contain information on how the Ginis were computed (no indication is available on
whether individual or household incomes, per capita or adjusted incomes were used), we can just
assume that the figures are based on 1993 household budget surveys of the countries covered
and the Ginis were computed on a per capita basis.
It is not clear either how the authors obtained household incomes. In principle there are
two ways for doing that. The economic situation of the population can be directly described by
income data, or it can be represented by means of variables on consumption. In case of income
surveys and many multipurpose surveys the income situation of the household is based on
income measures. In case of household budget surveys, the economic situation may be
described in two ways: by using either the declared income data, or the money equivalent of the
total expenditure on the consumption of the household. We could not infer from the text which
concept was used.
Moreover, the data presented in WDR are not unambiguous. For example, there are
some unexplained sometimes significant - differences between the tables in the text and those in
the annex tables. In the case of Hungary, for example, the difference is over 17 percent, but it
exceeds 10 percent also in the case of Bulgaria. The only explanation is attached as a note to
table 4.1. with the WDR suggesting that „any difference in Gini coefficients between this table and
Table 5 in the World Development Indicators are due to differences in samples, time periods,
definitions, or other technical assumptions” (ibid., p. 69.). No substantive remark is added, though.
A comparison of the series presented in the text and in the Tables shows that there are no
differences in the case of the Czech and the Slovenian data. However, for Bulgaria and Poland the
figure in the text is significantly higher than the coefficient in the annex, while for Hungary the
reverse is true. The reason may be the difference in reference years in the case of Bulgaria, but
we could not find an explanation either for the Polish or for the Hungarian difference.
5
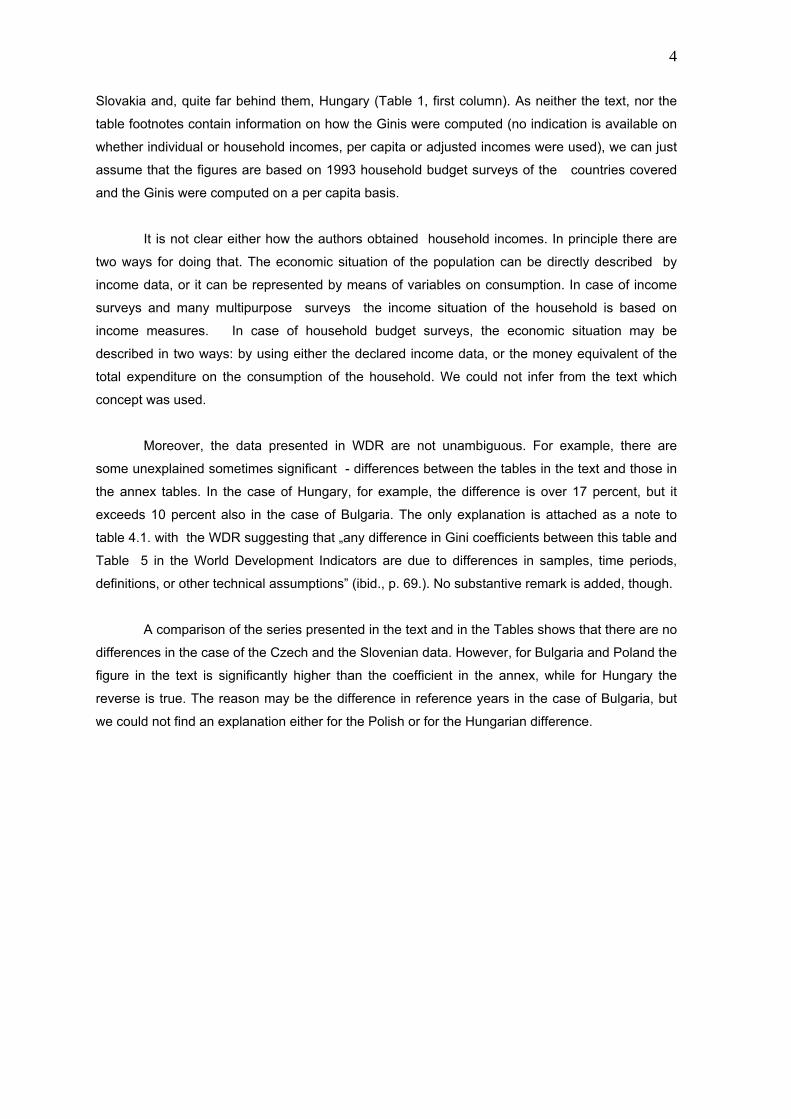
Table 1. Gini coefficients in some CEE countries in 1993, as presented in the World Development Report 1996 textd annex Bulgaria 0,34 0,308ac
Czech Republic
0,27 0,266a
Hungary 0,23 0,270b
Poland 0,30 0,272bc
Slovakia N/A. 0,195ac
Slovenia 0,28 0,282a
Notes: a: income shares by fractiles of persons, ranked by income per capita b: expenditure shares by fractiles of persons, ranked by expenditure per capita c: data for 1992 d: as for the figures in the text, we could not find indication of the method of adjustment for family size Source: World Development Report 1996. Oxford University Press, New York 1996, p.69 and p. 196-197.
We have several problems with these data. First, the level of inequalities seem to be
rather low (we expected at least the Slovak and the Hungarian figure to be higher, and we
certainly did not expect Hungary to be the least unequal country. Secondly, the rank order of the
countries do not conform to the research results produced by ourselves, by other scholars. Thirdly,
they are not in line with what we know about the social conditions and the economic politics of the
respective countries. The rank order of countries derived from the annex (Bulgaria first, followed
by Poland, Hungary and the Czech Republic) seems more convincing, but the levels are still
suspicious. The next section is therefore devoted to alternative results, and then we will try to find
some explanation for the divergences.
2.2. Other sources, other results
2.2.1. Other sources
To confront these figures with others we started "shopping around" for other data-sets. We
shall present results derived from three important international data sources.
The first is the Luxembourg Income Study (LIS), an ongoing project to produce
comparable income distribution data for the developed countries. The original micro surveys
produced in the home countries may not have been designed to be used for international
comparison. However, the LIS staff has made serious efforts to produce a variable structure for
each of the deposited microdata files to improve their comparability. This data-set contains files
also for some of the Central and Eastern European countries and some preliminary computations
have already been completed. (For the use of LIS data on OECD countries see Atkinson,
Rainwater and Smeeding, 1995).
The second available set is derived from one constituent part (Part A) of the data base
derived from the project on the Social Consequences of Transition (the so-called SOCO project)

6
initiated and sponsored by the Institute für die Wissenschaften vom Menschen located in Vienna.
Part A of the data base consists of a collection of already available data on social and economic
trends in five countries (Czech Republic, former East Germany, Hungary, Poland and Slovakia). It
contains a set of comparative tables including statistical and sociological data on labour market,
household income and expenditure, and poverty in CEE countries. This data base was produced
by national experts from the above countries, under the auspices of the SOCO project, This part
of the SOCO project was directed by Jiry Vecernik from the Institute of Sociology of the Czech
Academy of Sciences. In what follows we refer to it as the SOCO Database.
The third source is a cross- country survey executed also (as Part B) within the framework
of the SOCO project. The survey was planned to be an international comparative exercise.
Perfect comparability is of course almost unachievable, but the national teams designed the
survey with this objective in mind. The survey - referred to hereafter as the SOCO survey - was
conducted in early 1995. The questionnaire was administered to 1000 randomly selected
households by country. (The countries were identical with those in Part A.). The project was
directed by Zsuzsa Ferge from the Department of Social Policy of Eotvos Lorand University,
Budapest. A draft international report with the title Social Costs of Transition was produced by
Zsuzsa Ferge, Endre Sik, Peter Robert and Fruzsina Albert in (Ferge et al, 1995) and some
papers have been published in Hungarian or English journals. Since the SOCO Survey was not
designed to be an income survey, it has many limitations in this respect to which we shall return.
We will use two other data-sets for cross-checking the Hungarian data. The first is the
Hungarian Household Panel Study (HHPS) which started at the initiative of Rudolf Andorka, rector
of the Budapest University of Economics and Tamás Kolosi, now president of the Social
Research Informatics Centre (TÁRKI). The project, headed by István György Tóth, director of
TÁRKI, started with a 2600 households nationally representative sample, with detailed questions
on labour market positions, incomes, housing situation and attitudes of the respondent
households. This longitudinal survey ( a joint exercise of the Budapest University of Economics,
department of Sociology and TÁRKI), follows the original sample using year by year the same
methodology, similarly to other panel studies in Europe (GSOEP, BHPS, PSELL and others), and
in the US (for instance the PSID). The results derived from the HHPS are first published in
working paper series (Sik-Tóth, 1993a,1993b, 1996, Tóth, 1994) and later they are used in a great
number of Hungarian and English publications. Some further information on HHPS can be found
in Tóth, 1995.
The second survey that we use for cross-checking was carried out by TÁRKI within the
framework of the research called "The effects of public sector reform on the income distribution of
households" (later we call it "REFORM" research), sponsored by the Ministry of Finances. This
survey covered a sample of 10000 households, and was carried out in June, 1995. It was not
7
designed either to serve as an income survey. However, the size of the sample and the
methodology for acquiring income data makes it a good data source for control..
2.2.2. Other results
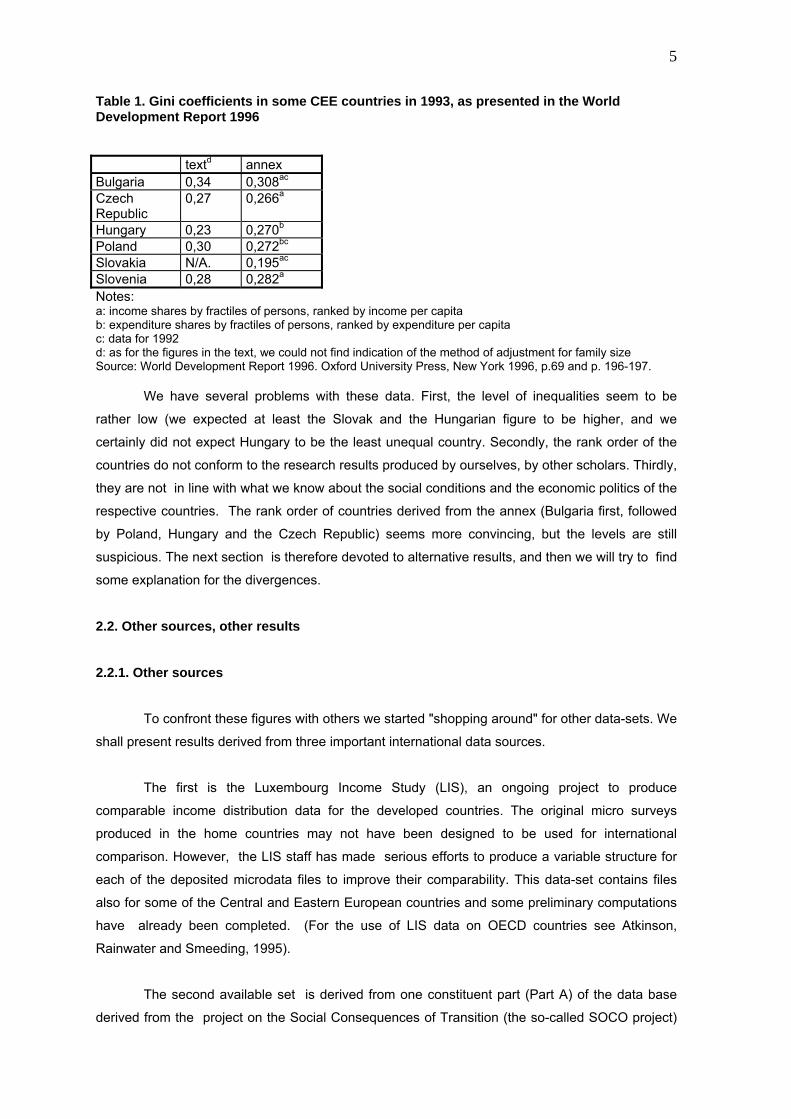
Table 2 shows some inequality measures in CEE countries for earnings distribution. Data
on earnings distribution are presented portraying the pre-transfer level of inequalities in 1988 and
1992. In addition to the Gini, two other measures are presented. The first is the so called Robin
Hood index first presented under this name by Atkinson and Micklewright 1992. This is a very
simple measure designed to show the overall level of inequalities. The starting point is total
equality. If this situation prevails, each income decile receives exactly ten percent of the total
income of the population. The Robin Hood index shows the deviation from this total equality: it is
the sum of the percentages of the excess amount received by those deciles receiving a share
above ten percent. To put it even more simply: should there be a Robin Hood acting with the aim
of taking away from the rich and giving it to the poor, the index would show the maximum share he
would be able to redistribute.
The other inequality measure shown is the percentile ratio 90/10. This is the ratio of the
lowest income in the highest decile compared to the highest income of the lowest decile. This
measure is better than the decile ratio (the ratio of the averages of the two extreme deciles)
inasmuch as it leaves out the possible impact of some outliers.
8
Table 2. Inequality measures in CEE countries: Robin Hood index, Gini and percentile values as percent of median for earnings distribution,
1988 Robin Hood Gini p10 p90 p90/p10 Czech Republic
13,2 0,19 60,0 143,8 2,40
Hungary 20,5 0,29 58,3 183,3 3,14 Poland 12,7 0,18 62,7 163,3 2,60 Slovakia 13,2 0,18 61,7 168,0 2,42
1992 Robin Hood Gini p10 p90 p90/p10 Czech Republic
16,4 0,23 56,1 153,5 2,74
Hungary 22,5 0,32 56,0 203,7 3,64 Poland 17,0 0,25 61,6 179,8 2,92 Slovakia 13,3 0,18 68,1 170,5 2,50 Source: Vecernik, forthcoming., pp. 61-63, various places Original sources: GINI and Robin Hood: SOCO database Percentiles: Czech R. and Slovak R.: microcensus 1988 and 1992, Poland: Rutkowski, 1994 ,Hungary: HCSO communication We would like to emphasise four conclusions based on the examination of the figures presented in
Table 2.
• As Table 2 shows, based mostly on the SOCO Database, earning inequalities increased
significantly in each of the observed countries between 1988 and 1992.
• The biggest increase was experienced in Poland, while it was the smallest in Slovakia.
• A deterioration in the relative position of the group with the lowest earnings can be observed
in each of the countries , with the exception of Slovakia.
• There has also been an improvement of the relative position of those on the upper end of the
earning ladder. This was particularly true in the case of Poland.
• When comparing these data we find a rank order of countries which differs considerably from
the WDR series, with Hungary as the most unequal country, followed by Poland, the Czech
Republic and Slovakia.
But earnings are only one part of the total income of the households. Redistributed
income provided by the state as well as other income sources of other household members all
contribute to the economic situation of individuals. Therefore the comparison of the economic
situation of the households should be based on the total household income. However, the
household income in itself is not a good predictor of the living standard of the household. On the
one hand, economies of scale may arise stemming from the fact that individuals living together
can share most of the living costs. The per capita income variable may solve this problem. On the
other hand, though, the needs of different members of the household may vary. For instance it is
usually assumed that the costs covering the needs of young children are lower than those of
adults. The adjustment of household income means, then, that different weights are assigned to

9
the individual household members to account for their different needs, and that the gain derived
from the economy of scale is taken into account. Recent income studies usually employ some sort
of the so-called adjusted or equivalent income.
An often used way of taking into account economies of scale and varying needs is to
adjust household incomes by means of so-called equivalence scales. Buhmann et al (1988)
showed that any equivalence scale can be expressed by a single parameter, its elasticity. The
equivalence elasticity e is the power by which the economic needs N of a household increases as
its size S increases: N = Se. Therefore, when we speak about adjusted household income in the
following, we mean the average income of the household members computed by means of the
equivalence scale. (For instance if the per capita income is identical in a household of two and of
four persons, the adjusted income will be higher in the second case.).
In the following, when we present new calculations, we always try to create data as close
to the quoted reference data (the WDR data) as possible, both in case of the choice of the
appropriate unit of observation and of the choice of the applied equivalence scale. This exercise
is rendered difficult, though. because of the deficiencies of the methodological information in
WDR already referred to.
Table 3 shows inequality measures for adjusted household incomes in Central and
Eastern Europe 1988 and 1992, on the basis of the SOCO Database. As it is shown here, both
Gini coefficients and Robin Hood indices show increasing inequalities in two countries, and near-
stagnation or decrease in two others. These findings are not necessarily in line with what one
may assume on the basis of known sociological facts both for Poland and Slovakia. However, we
cannot offer any adequate explanation.
Table 3. Distribution of household income in CEE countries: Gini and Robin Hood for adjusted household incomes Robin Hood Gini 1988 1992 1988 1992 Czech R 13,9 15,4 0,20 0,22 Hungary 15,6 18,2 0,22 0,26 Poland 18,1 17,8 0,26 0,25 Slovakia 12,4 12,2 0,18 0,18 Note: the so called OECD scale (e=0.73) was used for adjustment Source: Vecernik, forthcoming., SOCO Database
Also, the data presented in Table 3 are slightly confusing, since (contrary to our original
hypothesis) Ginis based on adjusted household income are not always smaller than Ginis for
earnings. Of course the original hypothesis is debatable: the combined effects of extra earnings
and state redistribution may not necessarily have an equalising effect on individual earnings. Still,
the Gini coefficients are in majority lower for the total adjusted income (Table 3) than for earnings

10
(Table 2) which may be the consequence of redistributive policies. However, the rank order
between the observed countries is again different from that one published in the WDR and close to
the rank order based on earnings: Hungary and Poland are the most unequal, followed by the
Czech Republic and Slovakia.
Table 4 is taken from a paper by Ferge (1996), comparing pre-and post-transition
inequality data. Despite all the well-known shortcomings of the income data of the SOCO survey,
the direction and the magnitude of the changes seem to support the results presented in Tables 2
and 3. (In the SOCO survey adjusted incomes were calculated by giving a weight of 1 to the first
adult, 0,7 to any other adults and 0,5 to children. This, roughly, corresponds to an equivalence
scale of 0,73 [Atkinson et al, 1995, pp. 18-21]) However in Table 4 per capita incomes are used to
render the data comparable to those used by Atkinson and Micklewright for 1988.
Table 4. Inequality measures relating to individual distribution of net per capita income. (Income at different percentiles in % of median)
4.a. Pre-transition data*
Czech R. 1988
Poland, 1989
Hungary, 1987
Germany (East) (no data)
Slovakia, 1988
P5 59.7 44.9 52.2 . 58.8 P10 66.9 54.5 61.3 . 66.0 P25 81.2 72.6 76.9 . 81.5 P75 128.8 135.9 13.3 . 125.9 P90 162.5 180.2 172.6 157.6 P95 185.7 217.0 208.8 . 179.9 P90/P10 2.43 3.31 2.81 . 2.39 var coef 0.379 0.548 0.504 . 0.376
4.b. SOCO data for 1994. P5 44.7 22.4 45.5 44.4 50.5 P10 55.6 32.2 53.9 55.5 57.9 P25 75.0 61.3 75.8 76.2 73.7 P75 133.3 150.5 134.7 133.3 131.1 P90 177.8 215.0 176.8 166.7 168.5 P95 222.2 274.1 217.2 190.5 210.6 P90/P10 3.20 6.67 3.28 3.00 2.91
Var coef 0.499 1.074 0.750 0.525 0.647 *Source: Atkinson, A.B. and John Mickleright (1992). The Robin Hood indices and the Ginis were not computed at the time, but later checks
confirm the conclusions of the above data. (The outlier character of Polish data is tentatively
explained in the original report). Unlike the WDR, these data show greater inequality, and greater
widening of inequality, in Hungary than the Czech Republic. In our view this is not surprising given
developments in the two countries over these years. The rapid increase in unemployment in
Hungary combined with very low unemployment benefits, as well as the rapid deregulation of

11
wages and the method of privatisation of former state property, had to increase inequalities more
than in the Czech Republic which has had low unemployment rates and a new law on statutory
social assistance, has maintained for long central wage regulation, and has chosen a method of
privatisation which, at least theoretically and initially, made everybody profit to the same extent.
Table 5 summarises the most important results derived from the LIS data and from the
SOCO survey. In both parts of the table person equivalent incomes (e=0.5) are presented. These
data for the SOCO survey differ from those in Table 4 because the LIS method was applied to the
SOCO data. (This is a clear indication of the importance of the methods and measurements
chosen.)
Table 5. Comparing income inequalities across CEE countries: percentile values in% of the person equivalent (e=.5) median incomes and Gini coefficients P10 P90 P90/P10 GINI
LIS data, 1992 Czech republic 65 155 2,36 0,207 East Germany - - - - Hungary, 1991 52 180 3,46 0,289 Poland 51 192 3,76 0,290 Slovakia 66 149 2,25 0,189
SOCO Survey, 1994 - method different from Table 4. Czech Republic 60 185 3,10 0,249 East Germany 58 150 2,60 0,221 Hungary 57 175 3,05 0,279 Poland 39 189 4,90 0,352 Slovakia 61 167 2,73 0,230 Source: own computations, from the SOCO survey and Sprout, 1995, Table 1, Figure 1, Note: figures presented here differ from those presented in Ferge et al, p. 86, because of the different equivalence scale chosen. The main conclusions based on Table 5 are the following:
• For 1992, the rank order of the countries can be described as follows: Poland, Hungary,
Czech Republic, Slovakia.
• As the SOCO data-set shows, the rank order of these countries did not change between 1992
and 1994.
• Comparing the two data-sets shows an increase between 1992 and 1994 in the case of each
country with the exception of Hungary. This may be basically due to the different data
sources. In any case, we again lack a good sociological understanding of these trends.
In Table 6 the per capita income data are used as a basis for the calculation of the Gini
coefficients. The following conclusions emerge.
• When comparing the coefficients in Table 5 to the figures in Table 6, we find that the Gini
coefficients are slightly sensitive to the equivalence scales used. However, neither the

12
magnitude, nor the rank order between the countries is affected by the change of the
methodology.
• If we accept HHPS as a benchmark for Hungary, it seems that SOCO underestimates the
level of inequalities. This is confirmed by the results of the REFORM survey which produces
results between the two other sets. However, the rank order of the countries is identical
whatever data source we use for Hungary.
Table 6. Gini coefficients for per capita incomes in 1994 observation
unit: households observation
unit: persons SOCO survey November 1994
Czech Republic 0,2463 0,2584 Poland 0,4652 0,3753 Hungary 0,2877 0,2874 East Germany 0,2335 0,2484 Slovakia 0,2544 0,2497
Hungary, TÁRKI REFORM June 1995
0,2721 N/A.
Hungary, HHP, 1994/1995
0,3115 0,3142
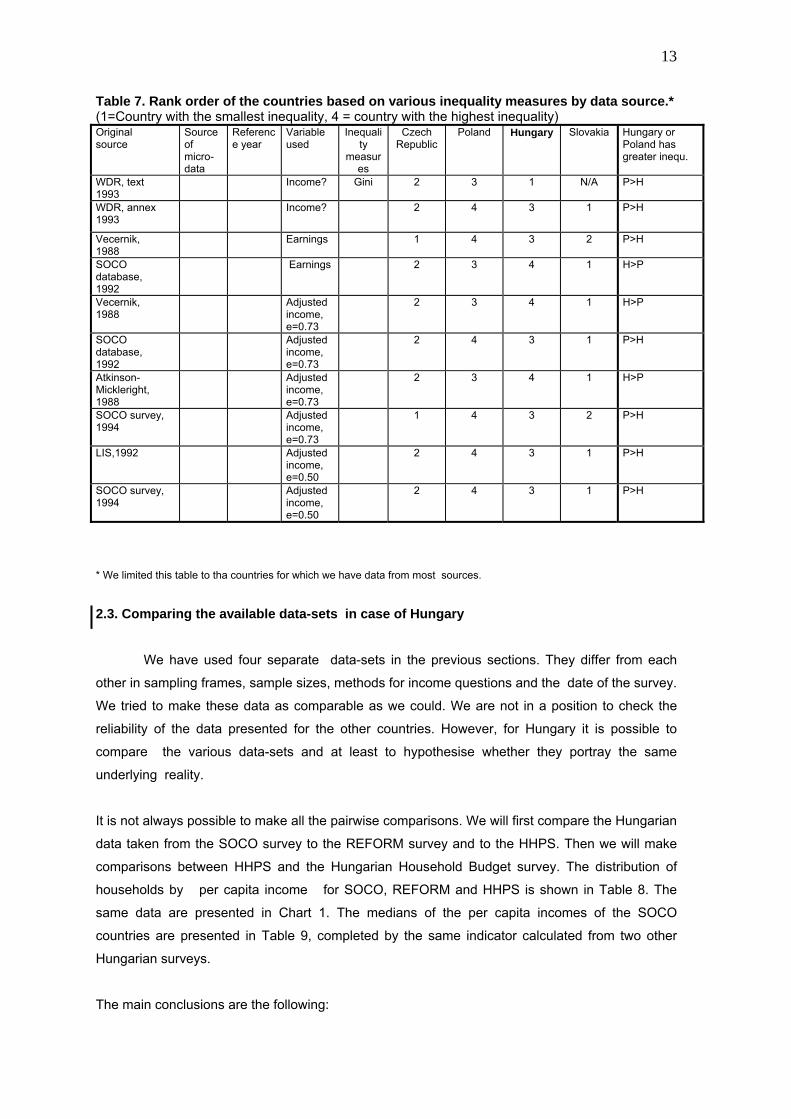
To sum up, we shall present in Table 7 the rank order of the countries according to
their level of income inequality obtained by the different methods and data sets. Data allow the
inclusion of four countries in this analysis. Out of ten measurements, only one in one case (the first
row) does Hungary rank other than third or fourth. Where it is not shown as having the greatest
inequality, it appears as second always to Poland with again the exception in the first row. The last
column emphasises some inconsistencies in the relationship between Poland and Hungary: these
results are hectic. Out of the two comparisons, only the Czech-Hungarian rank order could be
sociologically argued. The inconsistencies in the Polish-Hungarian relationship may be due to
methodological differences, to differences in the year examined, or to - as yet - unknown
sociological or other explanations .
13
Table 7. Rank order of the countries based on various inequality measures by data source.* (1=Country with the smallest inequality, 4 = country with the highest inequality) Original source
Source of micro-data
Reference year
Variable used
Inequality
measures
Czech Republic
Poland Hungary Slovakia Hungary or Poland has greater inequ.
WDR, text 1993
Income? Gini 2 3 1 N/A P>H
WDR, annex 1993
Income? 2 4 3 1 P>H
Vecernik, 1988
Earnings 1 4 3 2 P>H
SOCO database, 1992
Earnings 2 3 4 1 H>P
Vecernik, 1988
Adjusted income, e=0.73
2 3 4 1 H>P
SOCO database, 1992
Adjusted income, e=0.73
2 4 3 1 P>H
Atkinson- Mickleright, 1988
Adjusted income, e=0.73
2 3 4 1 H>P
SOCO survey, 1994
Adjusted income, e=0.73
1 4 3 2 P>H
LIS,1992 Adjusted income, e=0.50
2 4 3 1 P>H
SOCO survey, 1994
Adjusted income, e=0.50
2 4 3 1 P>H
* We limited this table to tha countries for which we have data from most sources.
2.3. Comparing the available data-sets in case of Hungary
We have used four separate data-sets in the previous sections. They differ from each
other in sampling frames, sample sizes, methods for income questions and the date of the survey.
We tried to make these data as comparable as we could. We are not in a position to check the
reliability of the data presented for the other countries. However, for Hungary it is possible to
compare the various data-sets and at least to hypothesise whether they portray the same
underlying reality.
It is not always possible to make all the pairwise comparisons. We will first compare the Hungarian
data taken from the SOCO survey to the REFORM survey and to the HHPS. Then we will make
comparisons between HHPS and the Hungarian Household Budget survey. The distribution of
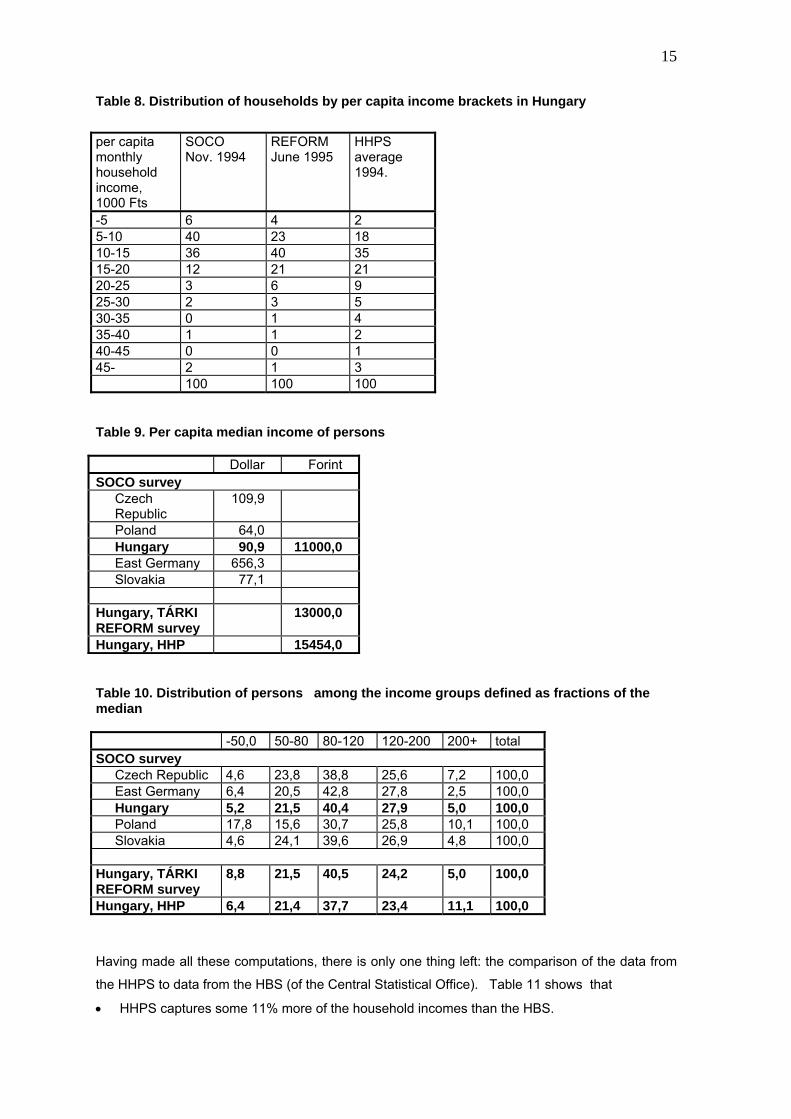
households by per capita income for SOCO, REFORM and HHPS is shown in Table 8. The
same data are presented in Chart 1. The medians of the per capita incomes of the SOCO
countries are presented in Table 9, completed by the same indicator calculated from two other
Hungarian surveys.
The main conclusions are the following:
14
• The Hungarian Household Panel (HHPS) captures a wider range of incomes than the other
two surveys. We think that this is primarily due to the different formulation of the questions. In
HHPS there is a very detailed questionnaire asking for incomes of each and every adult
household member. Also, incomes that cannot be directly allocated to any individual
household member are also registered separately in the household questionnaire. The other
two surveys seem to be able to capture less income. The SOCO survey had just one
extremely general question about the sum of total income of the household in one month
(November 1994). As for the different income sources of the individual household members,
only the incidence of income types was registered. The incidence data as presented in the
original report seem to be rather convincing, while the absolute figure is more an indicative
variable than an exact figure. Also, because the question related just to one month, seasonal
incomes and direct household incomes are more likely to be missing from the SOCO and the
REFORM surveys than from the HHPS. Compared to SOCO, the median income in HHPS is
some 40 percent higher, compared to REFORM, the median is 19 percent higher.
• This is partly the reason why SOCO households cluster more in the lower income brackets
than the HHPS or REFORM households. 40 percent of the SOCO households belong to the 5-
10 Ft per capita income bracket while only 23 percent of the REFORM households and 18
percent of the HHPS households belong to this category.
• Having known that even the HHPS is unable to capture some 25 percent of the national
incomes known from macro-statistical data (which may not be perfect either), we think that
the HHPS data are still underestimating the "true" level of inequalities. Income surveys tend to
miss the poorest persons (among others the homeless) and to underreport the income of the
wealthiest people. Therefore the "true" Ginis for Hungary are probably higher rather than
lower than the ones we present in this paper. From this it follows that we consider the data
presented in WDR as a serious underestimation of the "true" values. As we endeavoured to
show, inconsistencies and uncertainties abound in case of all the countries and, more
generally, in case of income surveys in general. That is why we think it important to combine
statistical findings with other known sociological facts, institutional conditions, and so forth.
This seems to be particularly important in case of Hungary.
• The distribution of persons based on per capita income among the income groups defined as
fractions of the median (Table 10) suggests that more of the highest incomes are missing
from the SOCO and the REFORM surveys than from HHPS. SOCO seems to underestimate
also the lower extremes of the income distribution, while the REFORM survey seems to
capture this aspect better than the HHPS.
15
Table 8. Distribution of households by per capita income brackets in Hungary per capita monthly household income, 1000 Fts
SOCO Nov. 1994
REFORM June 1995
HHPS average 1994.
-5 6 4 2 5-10 40 23 18 10-15 36 40 35 15-20 12 21 21 20-25 3 6 9 25-30 2 3 5 30-35 0 1 4 35-40 1 1 2 40-45 0 0 1 45- 2 1 3 100 100 100 Table 9. Per capita median income of persons Dollar Forint SOCO survey
Czech Republic
109,9
Poland 64,0 Hungary 90,9 11000,0 East Germany 656,3 Slovakia 77,1
Hungary, TÁRKI REFORM survey
13000,0
Hungary, HHP 15454,0 Table 10. Distribution of persons among the income groups defined as fractions of the median -50,0 50-80 80-120 120-200 200+ total SOCO survey
Czech Republic 4,6 23,8 38,8 25,6 7,2 100,0 East Germany 6,4 20,5 42,8 27,8 2,5 100,0 Hungary 5,2 21,5 40,4 27,9 5,0 100,0 Poland 17,8 15,6 30,7 25,8 10,1 100,0 Slovakia 4,6 24,1 39,6 26,9 4,8 100,0
Hungary, TÁRKI REFORM survey
8,8 21,5 40,5 24,2 5,0 100,0
Hungary, HHP 6,4 21,4 37,7 23,4 11,1 100,0
Having made all these computations, there is only one thing left: the comparison of the data from
the HHPS to data from the HBS (of the Central Statistical Office). Table 11 shows that
• HHPS captures some 11% more of the household incomes than the HBS.

16
• HBS fails to capture the two ends of the income distribution. The tenth percentile point is some
seven percent higher than it is in the case of the HHPS, while at the other extreme, the
ninetieth percentile is almost 30 lower than the same percentile point in the HHBS.
• It seems that even the TARKI REFORM survey provides a better representation of the income
distribution than the HBS.
• A comparison between the percentiles (expressed as a percent of the median in the lower part
of Table 11) shows that expenditures in the HBS are more unequal than incomes. (For further
analysis and explanation to the difference between income and expenditure distribution see
Szivós and Kéki, 1995). However, even the expenditure distribution data portray a more equal
world than is shown by the HHPS. We think on the whole that the inferences drawn from the
HHPS are closer to the real world than those based on any of the other data-sets.
Table 11. Income and expenditure percentiles as percent of the median in Hungary, 1993 HBS 1993
yearly income, Ft
HBS 1993 yearly
expenditure, Ft
HHP 1993 yearly income,
Ft
HHP income /HBS income
p10 108448 92520 101070 0,93 p20 126786 112569 123003 0,97 p30 140984 129869 140398 1,00 p40 154918 144516 163455 1,06 p50 167503 160754 179675 1,07 p60 182850 177912 200908 1,10 p70 201571 200667 232571 1,15 p80 227211 230477 270864 1,19 p90 272101 285190 350178 1,29 HBS incomes,
percentiles in % of median
HBS expen-ditures, per-
centiles in % of median
HHP incomes, percentiles in % of median
(SOCO, 1994. Nov,)
p10 0,65 0,58 0,56 0.53 p20 0,76 0,70 0,68 0.70 p30 0,84 0,81 0,78 0.80 p40 0,92 0,90 0,91 0.90 p50 1,00 1,00 1,00 1.00 p60 1,09 1,11 1,12 1.13 p70 1,20 1,25 1,29 1.25 p80 1,36 1,43 1,51 1.43 p90 1,62 1,77 1,95 1.75 p90/p10 2,49 3,05 3,48 (3.28) Source: own computations based on Szivós P. and Kéki Zs. (1995):13 Source of data: CSO HBS, 1993 * Note: percentiles and median values are computed for person equivalents

17
2.4. The increase of inequalities in two countries: the Czech Republic and Hungary
Finally, let us present a not merely methodological interpretation for at least part of the
debated issue. This interpretation tries to include the historical perspective in the analysis.
Table 12 and Table 13 present two time series representing income inequality
estimates for the Czech Republic and Hungary. Before the transition income inequalities were
much lower in the Czech Republic than in Hungary. Moreover, while in Hungary ( as well as in
Poland or Britain also included in the analysis of Atkinson and Micklewright as an example of a
capitalist economy), the tendency was toward a decrease of income inequalities in the first
decades after the war and a significant increase from the seventies or eighties on,
Czechoslovakia (both parts of it) remained an exception. In this country income inequalities were
continuously decreasing from the fifties on.
From the two tables presented some inferences may be drawn. In Hungary the
inequalities have always been larger than in the Czech Republic. The continuation of this trend
points to a sort of 'path-dependency'. The transition brought about dramatic changes in both
countries, albeit these changes seem to have been more spectacular in Hungary around the
transition, due probably the early - even pre-transition - overture to market forces. These forces
appear to start to have a strong impact in the Czech Republic from 1993 onwards. Thus the
historical legacy which seems now to be lasting may fade away on the longer run if the present
tendency of convergence continues to prevail. In fact, even though the differences are not too
significant from year to year, in Hungary there has been only a marginal yearly increase in the
values of Gini coefficients after 1992, while the increase is more clear-cut in the Czech Republic.
(The stagnation or slight fluctuation of the inequality of the Hungarian income distribution in the
last years is confirmed by HBS data. See Szivós-Kéki, 1995.) However, the differences are so
slight and the uncertainties so great that the tendency of convergence cannot be considered as
fixed. After all, there have always been significant differences in the degree of income inequality
among the developed market economies owing mainly for institutional reasons (such as wage
bargaining, redistributive policies, and such like). We do not know as yet whether the process of
globalisation will dampen these differences or whether they will prevail. The same uncertainty
applies also to the transition countries.
Table 12. Distribution of household incomes in the Czech Republic: Gini and Robin Hood indices for adjusted household incomes, 1988-1996 year year November November January 1988 1992 1993 1994 1996 Robin Hood
13,9 15,4 18,5 18,5 18,8
Gini 0,20 0,22 0,25 0,25 0,26 Source: Vecernik, forthcoming. Original sources: Microcensus 1988 and 1989, EEA surveys for other years

18
Table 13. Distribution of household incomes in the Hungary: P90/P10 and Gini indices indices for adjusted household incomes, 1988-1996 1988* 1992 1993 1994 1995 1996 p90/P10 2.81 3,55 3,41 3,89 3,86 3,68 Gini for non-zero person equivalent income, (e=0,5)
0.24 0,29 0,29 0,30 0,31 0,30
* Atkinson-Mickleright, Annex., based on per capita income
3. Poverty estimates In case of the measurement of income poverty dilemmas abound. Results - both within a given
country and in a cross-national perspective - vary a great deal depending on the use of so-called
absolute or so-called relative methods. A so-called absolute measure usually means a basket of
goods based on scientifically defined nutrition standards and other assumptions about minimal
needs. The sum of the price of these goods is, at least in theory, a sort of subsistence level. The
"relative" measure may mean those living under 50, 67, 75 or x per cent of the mean or median
income, those belonging to the lowest income decile or quintiles, and so forth - and the income in
question may be the household income, the per capita income, or the adjusted income based on
various equivalence scales. Poverty may also be defined by mapping the subjective feelings of
the citizens about their own situation. However, it is a common place in sociology that the
demarcation line between objective and subjective, absolute and relative measures are fragile
and relative. Each measure is strongly influenced by subjective elements, value judgments, and
relativities due to time and space change. The objectivity and unambiguity of the so-called
'objective absolute' measure is highly illusory: each item in the basket might be debated at length
and depends on the views of the experts or bureaucrats involved. Moreover, and most importantly,
even if we neglect subjectivity, the most absolute measure has to vary in time and space. If water
comes from a self-made well in the yard or from the nearby river, and is therefore free, it will not
figure in the basket, while it has to be included as an important item if individual water-meters are
introduced. The value of household energy assuming the same need for warmth will vary both
with the climate of the country and the availability of free combustible materials. The authors of the
WDR are well aware of some, but not all of these difficulties as shown by Box 4.1 of the WDR on
page 67.
Each and every method has its advantages and disadvantages, its protagonists and
antagonists. But whichever method is used, one has to evaluate the results in the light of the reality to
which the method is applied.
Researchers at the World Bank have used different methods in analyzing poverty. One of these
has been presented in influential works written by B. Milanovic (1994, 1995, 1996) and is apparently
used in the WDR. This method applies a single threshold - USD 120 per year per capita - to all the
transition countries from Kyrgyzstan through the Baltics to Slovenia, defining as poor those who live
under this threshold. In his most recent work Milanovic arrives to the conclusion that the number of

19
the poor has increased between l987-88 and 1993-94 by 37 per cent, i.e. 124 million persons in the
18 countries covered. The result is staggering and seems to be convincing at first sight. However,
when countries are inspected separately, the outcome is rather surprising and at odds with other
information. In fact, according to this study, the rate of poverty headcount has increased in Central
Asia from 15 to 52 per cent, on the Balkans and in Poland from 5% to 27%, in the Baltic states from 1%
to 38%. In Central Europe, though, the situation is presented as rather reassuring: in those countries,
namely in the Czech and Slovak Republics, in Hungary and in Slovenia taken together, the rate of
poverty changed from 0 to 1%. Out of them, Hungary is presented as being in the worst position with
her 3% poverty rate (Milanovic, 1995). In the WDR, almost the same figures are used. On page 69 of
the WDR data on poverty headcount are given for Hungary. The poverty rate calculated by the method
devised by Milanovic is 1 per cent in 1987-88, 2 per cent in 1993 based on income data and 6 per cent
in 1993 based on expenditure data.
By contrast, the World Bank study on "Poverty and social transfers: Hungary" (World
Bank, 1996a), used three different poverty measures:
1. The minimum pension, which is neither a truly absolute nor a clearly relative measure. It is not
a subsistence level calculus, albeit maybe it should be. It is relative only inasmuch as it may be
influenced by the changes of the wage and price levels, but it is not 'absolute' since its statutory
level changes periodically. In other terms, its real value may change as well its value relative to
the mean income level..
2. The 50 per cent and 67 per cent level of the mean per capita expenditure level. The first might
be thought of as the threshold of deep poverty and the second as the threshold of shallow
poverty.
Using the expenditure data from the household budget surveys the authors of "Poverty
and social transfers" state that the proportion of households with income below the minimum
pension in Hungary increased from 1.6 per cent in 1989 to 8.6 per cent in 1993 (as measured by
the real value of the minimum pension of 1989 in 1993). The proportion of households with income
below half of the mean per capita income increased from 4.3 per cent in 1989 to 34.6 per cent in
1993 (holding the 1989 value of the poverty line constant in 1993). In the detailed tables and
analyses the headcount of poverty is 4.5 per cent in case of the "below minimum pension" line and
25.3 per cent in case of the below 2/3 of the mean expenditure line.
The same World Bank study also presents figures based on the so-called subsistence
level. From 1982 to 1994 the Hungarian Central Statistical Office calculated the level of minimum
existence or subsistence level. Using the results of the household income surveys of the Central
Statistical Office it was estimated that the rate of poverty among individuals increased from about
10 per cent in the 1980's to about 25 per cent in 1993 and continued to increase to about 30-35
per cent in 1995. The World Bank study included the estimates for 1993.

20
Poverty rates based on adjusted income Poverty line 1989 1993 on 1989 prices Below the statutory pension minimum
1.6
8.6
Below 50 % of the mean
4.3 34.6
Below the subsistence level
13.9 45.2
Poverty rates based on income and expenditure in 1993 Poverty line Expenditure Income
on 1993 prices Below the statutory pension minimum
4.5 2.5
Below 50 % of the mean
9.3 5.0
Below the subsistence level
58.3 55.3
Source: The World Bank (1996) Report on Poverty and Social Transfers in Hungary (Household Budget Data of the CSO)
The Hungarian Household Panel Surveys yielded two other estimates on the poverty rates.
(Andorka, Spéder, 1996):
1. In 1992 5.2 per cent, in 1993 5.4 per cent and in 1994 6.7 per cent of the population lived on an
income which was lower than the minimum pension (of the given year),
2. In 1992 10.4 per cent of the population lived on an income which was lower than 50 per cent of
the mean per capita income, and this percentage increased slowly to 12.4 per cent in 1995.
The above estimates were based on income rather than on expenditure data, and not only
because the adequate data on expenditure are missing from the HHPS. We also believe that
income data are theoretically more adequate to measure poverty because they reflect better the
capacities of households and individuals to fend for themselves and to participate in the
mainstream of society than the data on their actual consumption, which might be different from the
income data in consequence of saving, dissaving and borrowing.
The rate of persons living under 50 per cent of the average per capita income and under some other poverty lines
Year Percentage under 50 per cent of the mean
1992 10.1 1993 10.3 1994 11.6 1995 12.4
Under 60% of the mean 1995 22.7
Source: HHPS

21
According to the SOCO survey which admittedly underestimates poverty, in four out of five
countries the percentage of those living under 50% of the median was around 5% in 1994, and of those
under 67% of the median around 15%. The exception is Poland, with much higher poverty rates, 16 and
24 per cent respectively.
The rate of the population living under 50 or 67% of the median of the adjusted income.
Czech R. Poland Hungary Germany Slovakia Region,
total Percentage of the po- pulation under 67% of median
14% 24% 16% 16% 16% 15%
Percentage of the po- pulation under 50% of median
3% 16% 4% 5% 4% 6%
Source: SOCO survey
Thus all the sources quoted including the study on Hungary prepared by the World Bank
itself give (for Hungary) much higher estimates about poverty than are presented in the WDR. It
would have been perhaps useful to mention this former publication and the inconsistencies arising
therefrom in the WDR.
No doubt some of the former estimates may be hotly debated. For instance the
estimates based on the subsistence level were strongly criticised on different grounds. In the
eighties the level calculated by the CSO was criticised mostly because it was considered by the
general public as being too low while at present many experts find it too high. Both opinions may
have some truth in them: the subsistence level, a seemingly absolute level, rapidly changes with
changing conditions, pointing again to the relativity of so-called absolute measures. Also, it is not
the purpose of this paper to discuss which poverty measures are "best". All throw light on one or
another facet of the phenomenon. However, most experts and the general public agree that the
estimates presented in the WDR - no poverty in Hungary before the transition, hardly any
nowadays - are unrealistic, not to say absurd. The reason lies in the method applied in the WDR.
This method - the application of the same yardstick to different countries - certainly makes
us aware that Central Europe is better situated than its Eastern part or Central Asia. It is
misleading, though, as to the "real" scope of poverty. If we apply the same method to countries a
bit further west - and the scientific basis of comparing Hungary to Austria is certainly not weaker
than to compare Kazahstan with the Czech Republic - it can be easily demonstrated that poverty
has been eradicated all over Western Europe and the USA. This does not seem to be in line with
known facts which, for instance, underpin home research and social policy practice in individual
countries. In the USA the poverty line - and the threshold of social assistance - is six times
higher than the average per capita income in India, while (according to all information) those living
under the poverty line in the USA are often in deep poverty (Atkinson, 1993).
It is claimed in the WDR that the method of an identical yardstick is sound: since it is based on
the PPP (purchasing power parity) estimates, it allows the purchase of an identical bundle of goods. We

22
have serious doubts about the validity of this claim. One of these is related to the assertion that this
poverty line in calculated at international prices. We cannot quite see what this means. In 1993 the
market purchasing power parities in the CEE and NIS were not as yet realistic and sometimes fluctuated
rather wildly. It is also uncertain whether the PPPs for the lowest income groups are the same as those
for the whole population. On the other hand in absence of other information the 1990 PPP lines were
indexed to the national price level, but it is not sure that the price index valid for the poor is the same as
the average price index. More importantly our former considerations about water and fuel (to which we
could add the cost of transport, of food or clothing which is available at different levels of processing on
different levels of economic development, and so forth) are altogether missing from this method.
These problems do not go entirely unacknowledged by the WDR. In fact, while the volume applies a
(rather arbitrary) common poverty line from Central Asia to Central Europe, it uses in the same table a
different poverty line, 18 USD, for China and Vietnam. Using this poverty line for the CEE and NIS,
almost no poor person would be found. We fail to see the underlying logic, Alternatively, if we impute to
this procedure an underlying logic, we find it biased.
We wish to re-emphasise that we do not suggest that the poverty definition and thresholds
used by other authors than the WDR are unquestionable. But there are too many unclear points in
the WDR. It would be desirable to organise serious scientific debates about the methodological
and substantive problems of inequality and poverty in the first, the former second and the third
world. Even then there would be no consensus just because the issue is highly value-loaded.
However if we are at least partially right that some of the data and methods used by the WDR are
subject to serious doubts, then some corrections should be made public in order to avoid either
the denigration of an important work, or the misinformation of the general public and the media by
a prestigious publication of an influential supra-national agency. In view of the importance of the
World Bank and the attention given to it by leading politicians, it is therefore all the more important
to carefully check the validity of the data or to spell out the doubts. This research note would like
to prompt these corrections - if the authors of WDR see some validity in our comments.

23
Figure 1. Distribution of households between various per capita income brackets in Hungary
0
5
10
15
20
25
30
35
40
-5 5-10 10-15 15-20 20-25 25-30 30-35 35-40 40-45 45-
SOCOReformPanel
Figure 2. Comparing HHPS and SOCO data-sets: average per capita incomes in the deciles of SOCO and in HHPS
0
5000
10000
15000
20000
25000
30000
35000
40000
45000
50000
1 2 3 4 5 6 7 8 9 10
120
125
130
135
140
145
150
155
PanelSOCOdiff
24
REFERENCES Andorka, Rudolf - Zsolt Spéder - István György Tóth. 1995. Developments in Poverty and
inequalities in Hungary, 1992-1994. Budapest: TÁRKI Andorka, Rudolf - Zsolt Spéder. 1996. A szegénység Magyarországon 1992-1995. (Poverty in
Hungary, 1992-1995). Esély. 1996. no. 4. 25-52. p. Atkinson, A.B. and John Mickleright. 1992. Economic transformation in Eastern Europe and the
distribution of income. Cambridge: Cambridge U.P Atkinson, Antony - Lee Rainwater - Timothy M. Smeeding. 1995. Income distribution in the OECD
countries. Paris: OECD Barr, Nicholas. 1995. Labour Markets and Social Policy in Central and Eastern Europe: The
transition and beyond. New York and Oxford: Oxford University Press. Buchman, B. - L. Rainwater - G. Schmaus - T. Smeeding - /1988/: Equivalence scales, well-being,
inequality and poverty: Sensitivity estimates across ten countries using the LIS Database, Review of Income and Wealth 34, June 1988, pp. 115-142
Ferge, Zuzsa. 1996. Major Problems and Crisis Phenomena of the Hungarian Society and the Central European Region. Paper prepared for the Conference on the New Dialogue between Central Europe and Japan, Budapest, 1996. 16-18 September.
Ferge, Zsuzsa - Péter Róbert - Endre Sik - Fruzsina Albert. 1995. Social Costs of Transition. International Report. Vienna: Institute for Human Sciences, mimeo.
Milanovic, Branko (1996) Income, Inequality, and Poverty During the Transition. Manuscript of a forthcoming book, draft version of August 1996.
Milanovic, B. (1994) A Cost of Transition: 50 Million New Poor and Growing Inequality. Transition, (Transition Economics Division, Policy Research Department, The World Bank) Volume 5, no. 8. October 1994.
Milanovic, Branko (1995) Poverty, Inequality and Social Policy in Transition Economies. World Bank, Transition Economics Division, Research Paper Series Paper Number 9, February 1995.
Rutkowski, J. 1994. Labor market transition and changes in wage structure: the case of Poland. Center for International Studies, Princeton University.
Sik, Endre - Tóth István György Ed. 1993a. Jelentés a Magyar Háztartás Panel I. hullámának eredményeirôl /Report on the results of the II. wave of the Hungarian Household Panel Study / Magyar Háztartás Panel Mühelytanulmányok 1. sz. /Hungarian Household Panel Working Papers No 1./ Budapest: BKE - TÁRKI, 114 p
Sik, Endre - Tóth István György Ed. 1993b. Egy év után ... Jelentés a Magyar Háztartás Panel II. hullámának eredményeirôl /A year after ... Report on the results of the II. wave of the Hungarian Household Panel Study / Magyar Háztartás Panel Mühelytanulmányok 3. sz. /Hungarian Household Panel Working Papers No 3./ Budapest: BKE - TÁRKI, Budapest, 156 p
Sik, Endre - Tóth István György. Ed. 1996: Társadalmi Páternoszter 1992-1995 Jelentés a Magyar Háztartás Panel 4. hullámának eredményeirôl /Social escalators 1992-1995 Report on the results of the 4. wave of the Hungarian Household Panel Study / Magyar Háztartás Panel Mühelytanulmányok 7. sz. /Hungarian Household Panel Working Papers No 7./ Budapest: BKE - KSH- TÁRKI. 191 p.
Sprout, Ron. 1995. Poverty and Getting By in Russia. LIS/AID/US Census Buro Conference on Economic Hardship and Social Protection in Central and Eastern Europe. Luxembourg, July 1995. Mimeo.
Szivós, Péter - Kéki, Zsuzsanna. 1995. A jövedelem és a fogyasztás egyenlőtlensége. Kutatási beszámoló a Pénzügyminisztérium számára. (The inequalitiy of income and consumption. Research report for the Ministry of Finance). Budapest: TÁRKI
Tóth István György. 1995. The Hungarian Household Panel: aims and methods in: Innovation, Vol 8. No 1. March, 1995, pp 106-122.
Tóth István György. Ed. 1994. Társadalmi átalakulás 1992-94 Jelentés a Magyar Háztartás Panel III. hullámának eredményeiröl (Social restructuring 1992-1994 Report on the resutls of the III. wave of the Hungarian Household Panel) Budapest: BKE-KSH-TÁRKI
Vecernik, Jiri. forthcoming. Markets and People. The Czech Reform experience in a comparative perspective. Avebury.
van de Walle, Dominique - Kimberly Nead. 1995. (Ed.) Public Spending and the Poor. Theory and evidence. Published for the World Bank. Baltimore: The Johns Hopkins University Press. 619 p.
World Bank.1996. From plan to market. World Development Report 1996. Published for the World Bank. Oxford: Oxford University Press. 241 p.
25
World Bank. 1996a. Hungary: Poverty and Social Transfers. A World Bank Country Study. Washington DC. 85 p.


![Tomory Zsuzsa - Hungarian Culturehungarians.weebly.com/uploads/2/0/0/3/20035969/tomory_zsuzsa... · Tomory Zsuzsa UNEXPLORED CHAPTERS OF HUNGARIAN HISTORY[1] I would like to bring](https://static.fdocuments.in/doc/165x107/5ac4f6157f8b9ae06c8d83bb/tomory-zsuzsa-hungarian-zsuzsa-unexplored-chapters-of-hungarian-history1-i-would.jpg)