RTL POSIX Trace 1.0 (a POSIX Trace System in RT-Linux) · The trace system has been baptized “RTL...
24
RTL POSIX Trace 1.0 (a POSIX Trace System in RT-Linux) by Andr´ es Terrasa, Ana Garc´ ıa-Fornes and Agust´ ın Espinosa aterrasa,agarcia,aespinos @dsic.upv.es September 10, 2002 Contents Foreword 3 1 Introduction 4 2 The Three Tracing Roles in RTL-PT 5 2.1 Trace Controller Process ................................ 6 2.2 The Traced Process ................................... 8 2.3 The Trace Analyzer Process .............................. 9 3 New System Event Types Defined in RTL-PT 12 4 The Kernel Trace Facility 14 5 Some Other Minor Changes 15 5.1 Header Files ....................................... 15 5.2 Full Event Sets ..................................... 16 A An Example 17 A.1 The rtl tasks.c Module .............................. 17 A.2 The linux target.c Program ........................... 20 A.3 The linux analyzer.c Program .......................... 21 1
Transcript of RTL POSIX Trace 1.0 (a POSIX Trace System in RT-Linux) · The trace system has been baptized “RTL...

RTL POSIX Trace 1.0
(a POSIX Trace System in RT-Linux)
byAndres Terrasa, Ana Garcıa-Fornes and Agustın Espinosa�
aterrasa,agarcia,aespinos � @dsic.upv.es
September 10, 2002
Contents
Foreword 3
1 Introduction 4
2 The Three Tracing Roles in RTL-PT 52.1 Trace Controller Process . . . . . . . . . . . . . . . . . . . . . . . . . . . . . . . . 62.2 The Traced Process . . . . . . . . . . . . . . . . . . . . . . . . . . . . . . . . . . . 82.3 The Trace Analyzer Process . . . . . . . . . . . . . . . . . . . . . . . . . . . . . . 9
3 New System Event Types Defined in RTL-PT 12
4 The Kernel Trace Facility 14
5 Some Other Minor Changes 155.1 Header Files . . . . . . . . . . . . . . . . . . . . . . . . . . . . . . . . . . . . . . . 155.2 Full Event Sets . . . . . . . . . . . . . . . . . . . . . . . . . . . . . . . . . . . . . 16
A An Example 17A.1 The rtl tasks.cModule . . . . . . . . . . . . . . . . . . . . . . . . . . . . . . 17A.2 The linux target.c Program . . . . . . . . . . . . . . . . . . . . . . . . . . . 20A.3 The linux analyzer.c Program . . . . . . . . . . . . . . . . . . . . . . . . . . 21
1
RTL POSIX Trace 1.0 (a POSIX Trace System in RT-Linux)Copyright c
�2002 by Andres Terrasa, Ana Garcıa-Fornes and Agustın Espinosa�
aterrasa,agarcia,aespinos � @dsic.upv.esDepartamento de Sistemas Informaticos y Computacion
Technical University of Valencia
Cno. de Vera s/n, 46022 Valencia (SPAIN)
This document can be freely distributed under the following terms:
� Any change or translations of this document should be previously notified to the author(s).� Any reproduction, either complete or partial, of this document must show this copyright text.� The authors don’t take any responsability for any damage incurred from the use of the documentation contained
herein.
Notes:
I hope the information contained in this document will be useful for those people interested in usingthe POSIX Trace support in RT-Linux.
RT-Linux (Real-Time Linux) is a trademark of Finite State Machine Labs, Inc. (www.fsmlabs.com).Open RT-Linux can be used free of royalties under the terms of the Open RTLinux Patent LicenseVersion 2.0 (see file PATENT in the Open RT-Linux distribution for details).
”POSIX” and ”1003.1” are registered trademarks of the Institute of Electrical and Electronic Engi-neers, Inc.
The software described in this document, that is, the POSIX Trace system integrated into Open RT-Linux (RTL POSIX Trace 1.0), is distributed under the terms of the GNU’s General Public Licenseversion 2 (www.gnu.org).
Please report any suggestion, comment or error to my e-mail address above.
A. Terrasa

Foreword 3
Foreword
This document assumes that you already know about the POSIX Trace standard. If not, we adviseyou to take a look at the document entitled “A Summary of the POSIX Trace Standard” first.
Although you are most probably familiar with RT-Linux and how real-time applications are im-plemented on it, the following is a (very) brief description of the RT-Linux programming philosophy.We hope this will help you understand some of the design decisions adopted in the implementationof the POSIX Trace support. If you already know how to implement RT-Linux applications, you mayperfectly skip it.
RT-Linux is a real-time kernel mainly focussed on implementing small hard real-time applicationswhich need tightly bounded interrupt latencies and a fully predictable system behavior. In addition,the programmer can have full advantage of having a general-purpose, full-featured operating systemas Linux available (but only running when RT-Linux allows it to do so)
From the programmer point of view, RT-Linux has been progressively taking the external form ofthe POSIX Minimal Realtime System Profile (MRSP) over the years. The MRSP is the most restrictedprofile defined in POSIX for real-time operating systems. This profile describes the facilities requiredto support small, embedded, hard real-time applications. The hardware requirements of this profileinclude only one processor, no explicit memory protection, no mass storage and, in general, simplehardware devices operated synchronously. The software requirements include only the execution ofone process (with complete POSIX thread support), but without the need of a file system or userinteraction.
Since RT-Linux has adopted the MRSP model (although the support is still incomplete), it onlysupports one “process” to be running at a time1, on which many POSIX threads (real-time tasks)can be created. From the RT-Linux viewpoint, Linux and all its user processes are globally seen asan additional real-time task running in the background (at lowest priority). This means that Linuxprocesses can still execute, but only when no real-time task wants to do so. In addition, real-timetasks can interact with Linux processes by using communication mechanisms such as shared memoryand real-time “fifos”.
Overall, this model permits (and encourages) the programmer to split the real-time applicationinto two parts: the code which actually needs hard real-time capabilities and the non-real-time code.Then, the real-time part (usually small and simple) is implemented as a set of real-time tasks at the RT-Linux level, while the non-real-time part (which can be as big and complex as needed) is implementedas one or more Linux processes.
1Actually, since RT-Linux supports multiprocessor (SMP) systems, the RT-Linux model assumes one running processper physical processor. However, this feature is not further considered, since our tracing system does not have multiproces-sor support yet.
c�
2002 A. Terrasa, A. Garcıa-Fornes, A. Espinosa

4 RTL POSIX Trace 1.0
1 Introduction
The purpose of this document is to point out the characteristics and peculiarities of our POSIX Tracestandard implementation in RT-Linux. This implementation has effectively integrated a POSIX Tracesubsystem into the RT-Linux kernel. In particular, it has been carried out on the Open RT-Linuxversion 3.1. The trace system has been baptized “RTL POSIX Trace 1.0” (RTL-PT 1.0).
The trace system RTL-PT 1.0 entirely supports the Trace and the Trace Event Filter options de-fined in the standard, subject to some minor changes and limitations. Overall, this allows the pro-grammer of a real-time application in RT-Linux to perform filtered on-line tracing of events at runtime.
Conversely, RTL-PT 1.0 does not (so far) support neither the Trace Inheritance nor the Trace Logoptions. The reason for not supporting inheritance is straightforward, since the “target” process forRT-Linux (that is, the running real-time application) cannot fork. We may support trace into logs insome future version, but this is not trivial since the RT-Linux kernel does not have direct access toa standard file system in a permanent storage media (such as the computer’s hard drive file systemsavailable at the Linux level). This lack of file system access could be circumvented in a couple ofways2, with either of them covering only partially the standard’s requirements for the Trace Logoption.
Following the RT-Linux philosophy (explained in the Foreword section), the trace system consid-ers only one target process at a time (i.e., the running RT-Linux application), but potentially formedby both a set of RT-Linux tasks and any number of Linux processes. The implementation thus sup-ports the tracing (generation) and retrieval of trace events from both the RT-Linux tasks and Linuxprocesses concurrently. Furthermore, this target can be traced in up to TRACE SYS MAX number ofstreams simultaneously (this constant has currently its minimum value according to the standard,which is eight). All this is further explained in Section 2.
In a general-purpose system, one of the main benefits of having a trace system available is to test(and debug) applications from a functional point of view. That is, to check if a given application doeswhat it is supposed to do. In a real-time system, however, it also becomes vital to know when theapplication is doing things, and how much these actions take to execute. This kind of temporal infor-mation should include the system overhead as well, in order to be accurate and useful. In this sense,RTL-PT 1.0 has introduced some system event types that automatically collect this type of informa-tion and make it available to analysis. A description of the system event types and its associated datacan be found in Section 3. In addition, the application can optionally use a facility called “RTL kerneltrace” which automatically collects and processes these new system events and generates some fileswith the recorded information. With one of this files, for example, a graphical trace of the applicationexecution can be depicted by using a visor tool called Quivi3. The kernel trace facility is described in
2The first possibility is to send the trace events to a Linux process (by a RT-FIFO, for instance) and make this processstore them into the file log. Or else, we could send the events through some port (e.g., serial, parallel, network, etc.) toanother computer.
3Quivi is a trace displayer entirely implemented in Tcl-Tk by Agustın Espinosa. It is free software, under the terms of
c�
2002 A. Terrasa, A. Garcıa-Fornes, A. Espinosa

2 The Three Tracing Roles in RTL-PT 5
Section 4.
During the implementation of the RTL-PT system, there have also been some other minor changes,adaptations and, in general, slight differences from the standard definition. All these are reported inSection 5.
Finally, Appendix A includes a full example of use, on which both a real-time task and a Linuxprocess trace events into a stream, while another Linux process retrieves them. This example can alsobe found (and executed) in the directory examples/posixtrace/rtl-and-linux.
2 The Three Tracing Roles in RTL-PT
As described in the standard, there are three roles which are executed in any complete tracing activity:the trace controller process, the target or traced process and the trace analyzer process.
In a typical RT-Linux application, the programmer usually splits the application code in a set ofreal-time tasks (executed by the RT-Linux kernel) plus one or more Linux user processes (executedby the Linux kernel). These two parts will be hereafter referred to as the applications’s “RT-Linuxside” and “Linux side”. If some trace support has to be given to the two sides, the RTL-PT system hasto be present at both. Therefore, we have implemented RTL-PT as two cooperating trace subsystems,one at each level:
a) RT-Linux trace subsystem. The RTL-PT support at the RT-Linux level has been integratedinto the RT-Linux scheduler (module rtl scheduler.o). The trace support is then alwaysavailable to the RT-Linux application, whether or not the application wants to use it. Neverthe-less, its overhead in the case of not using it is practically null.
All the data structures necessary to keep the entire tracing status are created and managed insidethis module. These data structure include, among other control information, the set of eventtypes registered for the target and all the active streams with its currently stored events.
b) Linux trace subsystem. Maybe the most natural way to suport POSIX Trace at the Linux levelcould have been to modify the Linux kernel by adding the required facilities as new Linux sys-tem calls. However, we chose not to do this for two reasons: firstly, because then the supportwould have been completely coupled to a particular version of the Linux kernel, and secondlybecause the actual functionality to be supported (see below) did not actually require such am-bitious implementation . As a result, the decision was to implement this subsystem as a libraryto be linked with any Linux process that required trace support (called libposix trace.a).This library is made available in Linux when RT-Linux (with the RTL-PT system) is compiled.Internally, this library communicates with the RT-Linux scheduler (where the RT-Linux tracesubsystem is) in order to make both systems work in a synchronized manner. This communi-cation is done by several dedicated RT-FIFOs.
the the GPL, and can be found on www.dsic.upv.es/˜aespinos/quivi.html.
c�
2002 A. Terrasa, A. Garcıa-Fornes, A. Espinosa

6 RTL POSIX Trace 1.0
Time Module
RT−FIFO Module
Other ModulesScheduler + Trace Subsystem Module
RT−App Module
RT−Linux
Task N Linux Kernel
Linux
Task 2Task 1
Initialization
RT−FIFOs
Target Process Analyzer Process
Trace Subsystem
Trace Stream
Other P
rocessesTrace Subsystem
events
H1 H2TTC A
AT
User Code User Code
HARDWARE
Figure 1: The RTL POSIX Trace 1.0 system.
Figure 1 depicts a complete vision of the RTL-PT system, showing both trace subsystems andtheir relationships with the different components of a real-time application. The figure shows all thepossibilities of the RTL-PT system at once, including real-time tasks and Linux processes playingthe target and trace analyzer roles. In this figure, the application RT-Linux side is labelled RT-App
Module, while the application Linux side is formed by the Linux processes labelled Target Process
and Analyzer Process. The figure is further described in the following subsections, where the threetrace roles are discussed. The review of the roles is done in terms of who can play each of them inRT-Linux according to the RTL-PT system (as explained above, “who” means the real-time tasks, ora Linux process, or both).
2.1 Trace Controller Process
The process playing the trace controller process (TCP) role has the ability to create one or more tracestreams in order to trace certain target process. After creating a stream, the TCP has complete control
c�
2002 A. Terrasa, A. Garcıa-Fornes, A. Espinosa

2.1 Trace Controller Process 7
on its behavior (among other actions, it can start and stop the stream, set the filter of event types, clearthe stream, shut it down, etc.).
In RTL-PT, the set up of the stream(s) on which the real-time application will be traced corre-sponds naturally to the RT-Linux side of the application. In particular, the actions related with theTCP will normally be executed at the initialization stage of the RT-Linux side (in the init module
function). An exception of this is the case of the stream shutting down, which will usually be done atthe application’s exit (inside the cleanup module function). Any of the TCP functions can also becalled by a running real-time task, although this should not the case for many of them4.
Thus, if any RT-Linux application wants to trace events using the RTL-PT support, the initializa-tion function of the module containig the application has to perform, at least, these actions:
1. A call posix trace attr init in order to initialize a stream attribute object. If any attributehas a default value which is not appropriate for the application, then the corresponding functionshould be invoked to correct it.
2. A call posix trace create in order to create a stream with the stream attribute object ar-ranged above. This call must provide a 0 as the function’s first argument, indicating that we aregoing to trace the current process. If successful, a stream identifier is returned.
If the application needs to be traced in more than one stream, then this step has to be repeatedas many times as necessary. The upper limit of this is currently 7, since one stream is reservedto the kernel trace facility (see Section 4).
3. If any of the created streams requires filtering, then the application needs to create an empty (orfull) event type set, add (or remove) individual event types as required, and then apply the setto the appropriate stream by calling posix trace set filter.
4. A call posix trace start in order to make the stream to start recording events. Do this withany stream created.
The following is the full list of the functions corresponding to the TCP which are supported inRTL-PT 1.0. (this particular subset of the trace functions is represented as TC in Figure 1):
int posix_trace_attr_destroy(trace_attr_t *);
int posix_trace_attr_getclockres(const trace_attr_t *,
struct timespec *);
int posix_trace_attr_getcreatetime(const trace_attr_t *,
struct timespec *);
int posix_trace_attr_getgenversion(const trace_attr_t *, char *);
int posix_trace_attr_getmaxdatasize(const trace_attr_t *restrict,
size_t *restrict);
int posix_trace_attr_getmaxsystemeventsize(const trace_attr_t *restrict,
4Some of the trace functions, for example the one that creates an stream, produces significant overhead. This overheadis not a problem when the application is being initialized, but it can be inacceptably high at run time.
c�
2002 A. Terrasa, A. Garcıa-Fornes, A. Espinosa

8 RTL POSIX Trace 1.0
size_t *restrict);
int posix_trace_attr_getmaxusereventsize(const trace_attr_t *restrict,
size_t, size_t *restrict);
int posix_trace_attr_getname(const trace_attr_t *, char *);
int posix_trace_attr_getstreamfullpolicy(const trace_attr_t *restrict,
int *restrict);
int posix_trace_attr_getstreamsize(const trace_attr_t *restrict,
size_t *restrict);
int posix_trace_attr_init(trace_attr_t *);
int posix_trace_attr_setmaxdatasize(trace_attr_t *, size_t);
int posix_trace_attr_setname(trace_attr_t *, const char *);
int posix_trace_attr_setstreamsize(trace_attr_t *, size_t);
int posix_trace_attr_setstreamfullpolicy(trace_attr_t *, int);
int posix_trace_clear(trace_id_t);
int posix_trace_create(pid_t, const trace_attr_t *restrict,
trace_id_t *restrict);
int posix_trace_eventid_equal(trace_id_t, trace_event_id_t,
trace_event_id_t);
int posix_trace_eventid_get_name(trace_id_t, trace_event_id_t, char *);
int posix_trace_eventset_add(trace_event_id_t, trace_event_set_t *);
int posix_trace_eventset_del(trace_event_id_t, trace_event_set_t *);
int posix_trace_eventset_empty(trace_event_set_t *);
int posix_trace_eventset_fill(trace_event_set_t *, int);
int posix_trace_eventset_ismember(trace_event_id_t,
const trace_event_set_t *restrict, int *restrict);
int posix_trace_eventtypelist_getnext_id(trace_id_t,
trace_event_id_t *restrict, int *restrict);
int posix_trace_eventtypelist_rewind(trace_id_t);
int posix_trace_get_attr(trace_id_t, trace_attr_t *);
int posix_trace_get_filter(trace_id_t, trace_event_set_t *);
int posix_trace_get_status(trace_id_t,
struct posix_trace_status_info *);
int posix_trace_set_filter(trace_id_t, const trace_event_set_t *, int);
int posix_trace_shutdown(trace_id_t);
int posix_trace_start(trace_id_t);
int posix_trace_stop(trace_id_t);
int posix_trace_trid_eventid_open(trace_id_t, const char *restrict,
trace_event_id_t *restrict);
2.2 The Traced Process
In RTL-PT 1.0, the target or traced process (TP) is always composed by a set of real-time tasksexecuted by the RT-Linux scheduler and, optionally, some Linux user processes. The RTL-PT systemprovides both levels with the two functions which the standard defines to this role. These functionsare:
int posix_trace_eventid_open(const char *restrict,
trace_event_id_t *restrict);
void posix_trace_event(trace_event_id_t,
const void *restrict, size_t);
c�
2002 A. Terrasa, A. Garcıa-Fornes, A. Espinosa

2.3 The Trace Analyzer Process 9
The support for the TP at the RT-Linux level is provided by the RT-Linux scheduler module(represented as T at the upper part of the Scheduler + Trace subsystem Module box in Figure 1).
At the Linux level, the TP functions are provided by the libposix trace.a library, which hasto be linked with any target Linux process. The TP support provided by the library is represented asthe T symbol inside the Linux Target Process in Figure 1. Inside the library, these two TP functionsuse a private RT-FIFO in order to communicate with the RT-Linux trace subsystem, which is the onethat actually stores the information. Each time a message is written to the FIFO at the Linux side,a handler in the RT-Linux scheduler wakes up (this handler is depicted as H1 in the figure). Whentriggered, the handler checks the message in order to retrieve which function was called from Linux(and its arguments) and then invokes the equivalent function of the RT-Linux trace subsystem. ManyLinux processes can use these functions simultaneously, effectively using the same FIFO. Obviously,this mechanism does not work if the RT-Linux scheduler module is not loaded when the Linux TPcalls these functions. If the RT-Linux side has not already created the stream(s), or if it has shut themdown, then calling to these two functions from Linux has no effect.
If the TP role is being executed by different entities (namely, the set of real-time tasks and someLinux processes), it is possible for any of them to register a new event type by calling the functionposix trace eventid open. The identifier returned by the call can be subsequently used by thisentity to trace events of this type. But, as the registration is actually performed in a single place (theRT-Linux trace subsystem) for all the entities, this registration becomes global for all these entitiesforming the TP. This means that one entity can actually trace events of a type which was originallyregistered by another entity. For example, if the application real-time side has registered a new eventtype named “evtype1” and then a Linux process does the same, the Linux process will be returnedthe same internal identifier for the event type that the real-time side received. Then, both entities canactually trace events of the same type.
2.3 The Trace Analyzer Process
Since RTL-PT does not support the Trace Log option, the only way of retrieving events is to do sowhile the stream(s) on which the application is being traced are active. This is the role of the traceanalyzer process (TAP).
In RTL-PT, the TAP support is provided by the two trace subsystems, which allows any real-timetask or any Linux process to retrieve events from a given stream. At the RT-Linux level, the TAPfunctions are provided by the module containing the RT-Linux scheduler (symbolized as A abovethis module in Figure 1). In Linux, the TAP functions are provided by the libposix trace.a
library. In the figure, this is represented as the A symbol inside the Linux Analyzer process.
In this sense, it is worth noting that although it is technically possible to have many entities playingthe TAP role simultaneously (e.g., many real-time tasks and/or Linux processes), this not probablya good idea unless each of them is retrieving events from a different stream. If, for example, tworeal-time tasks (or a real-time task and a Linux process) are retrieving events from the same stream,then each event in the stream will randomly be retrieved by one entity or the other (depending on
c�
2002 A. Terrasa, A. Garcıa-Fornes, A. Espinosa

10 RTL POSIX Trace 1.0
which one asks for its retrieval first). In the end, the events retrieved by each entity will probablyhave to be merged, and all of them are re-ordered, in order to extract any useful information. For thisreason, having only one TAP entity per trace stream is normally a better practice.
The full list of functions available for the TAP at either of the application levels is now shown.Please note that all of them, except the last three ones, are also on the list in Section 2.1; this isbecause these functions correspond to capabilities that both TCP and TAP roles share:
int posix_trace_attr_getclockres(const trace_attr_t *,
struct timespec *);
int posix_trace_attr_getcreatetime(const trace_attr_t *,
struct timespec *);
int posix_trace_attr_getgenversion(const trace_attr_t *, char *);
int posix_trace_attr_getmaxdatasize(const trace_attr_t *restrict,
size_t *restrict);
int posix_trace_attr_getmaxsystemeventsize(const trace_attr_t *restrict,
size_t *restrict);
int posix_trace_attr_getmaxusereventsize(const trace_attr_t *restrict,
size_t, size_t *restrict);
int posix_trace_attr_getname(const trace_attr_t *, char *);
int posix_trace_attr_getstreamfullpolicy(const trace_attr_t *restrict,
int *restrict);
int posix_trace_attr_getstreamsize(const trace_attr_t *restrict,
size_t *restrict);
int posix_trace_eventid_equal(trace_id_t, trace_event_id_t,
trace_event_id_t);
int posix_trace_eventid_get_name(trace_id_t, trace_event_id_t, char *);
int posix_trace_eventtypelist_getnext_id(trace_id_t,
trace_event_id_t *restrict, int *restrict);
int posix_trace_eventtypelist_rewind(trace_id_t);
int posix_trace_get_attr(trace_id_t, trace_attr_t *);
int posix_trace_get_status(trace_id_t,
struct posix_trace_status_info *);
int posix_trace_getnext_event(trace_id_t,
struct posix_trace_event_info *restrict , void *restrict,
size_t, size_t *restrict, int *restrict);
int posix_trace_timedgetnext_event(trace_id_t,
struct posix_trace_event_info *restrict, void *restrict,
size_t, size_t *restrict, int *restrict,
const struct timespec *restrict);
int posix_trace_trygetnext_event(trace_id_t,
struct posix_trace_event_info *restrict, void *restrict, size_t,
size_t *restrict, int *restrict);
At the RT-Linux level, it is straightforward for a real-time task to retrieve an event from any givenstream, just by using any of the three retrieval functions at the bottom of the list. This is because thestream identifier (which is a parameter of the three functions) is a known variable within the modulecontaining the application RT-Linux side. According to the standard, this is the expected behaviorin on-line tracing, where the TCP and the TAP are actually the same process. Therefore, the usual
c�
2002 A. Terrasa, A. Garcıa-Fornes, A. Espinosa

2.3 The Trace Analyzer Process 11
practice will be to create a TAP real-time task per active trace stream, so that each task is responsibleof retrieving the events of that stream (or else, the same real-time task can sequentially retrieve eventsfrom different streams).
However, if we want a Linux process to retrieve events from a given trace stream, then there isa serious problem, because the internal identifier of that particular stream is not known outside theapplication RT-Linux module. Imagine, for example, that we want three Linux processes to retrieveand analyze events from three different streams. The programmer needs a way, at implementationtime, to distinguish from these streams, although their actual stream identifiers will not be knownuntil run time (and only at the RT-Linux level). We had to slightly change the behavior establishedby the standard in order to solve this. Indeed, only the expected behavior was changed; the interfaceremains intact. All this is now explained.
The way both sides of the application can agree, at implementation time, to use a particular streamis done by name. We take advantage that stream have names (it is one of the attributes in the streamattribute object) in the following way:
1. The application RT-Linux side has to give certain name to the stream when the stream is created.The header file trace.h provides public names for the eight possible streams that may becreated.
Inside the creation function (posix trace create), the RTL trace subsystem creates a pri-vate RT-FIFO which is associated exclusively with that stream name. All these FIFOs createdfor supporting TAP in Linux share a common RT-Linux handler (the H2 in Figure 1), whichexecuted whenever a Linux process writes some data to one of the FIFOs.
2. A Linux process that wants to retrieve events from that stream has first to get a stream identifierthat points to that particular stream. This is done by “creating” the stream again inside theLinux process with the same public name it was used in the first step.
The posix trace create function is also used here, but with different semantics: the streamname is used to extract the FIFO name that is associated with the stream; then the functionchecks whether or not the FIFO has already been created by the RT-Linux side. If so, this FIFObecomes the private link between the Linux process and that particular stream. Otherwise, thefunction fails.
3. The internal stream identifier returned by the creation function in the previous step can then beused by the Linux process in the three alternative retrieval function. All three functions workexactly as described in the standard.
4. Since the streams are shutdown at the RT-Linux level, a mechanism is needed to inform ananalyzer Linux process when this happens. This has been carried out by following the standarddefinition of the retrieval functions: the [EINVAL] error has to be returned by any of the threefunctions if “the trace stream identifier was invalid”. In Linux, this happens when the streamhas been shutdown from the RT-Linux side.
c�
2002 A. Terrasa, A. Garcıa-Fornes, A. Espinosa

12 RTL POSIX Trace 1.0
3 New System Event Types Defined in RTL-PT
The POSIX Trace standard defines, for the combination of the Trace and Trace Event Filter options,the predefined system events in the following table:
Event Type Name Event Type Constant Additional Data Description
posix trace error POSIX TRACE ERROR int error This event reports that an error relatedto the trace system occurred.
posix trace start POSIX TRACE START trace event set tevent filter
This event is reported each time thestream starts tracing events, returningalso the filter currently active for thestream.
posix trace stop POSIX TRACE STOP int auto This event is reported each time thestream stops tracing events, returningalso whether the stop was automatic orapplication-initiated.
posix trace filter POSIX TRACE FILTER trace event set told event filter,new event filter
This event is reported each time the ap-plication changes the filter of the stream,returning both the old and the new filters.
posix trace overflow POSIX TRACE OVERFLOW (none) This event is reported at the beginningof an overflow situation (some events areoverwritten in the stream, and thus theyare lost).
posix trace resume POSIX TRACE RESUME (none) This event is reported right before thefirst “valid” event after an overflow situa-tion (that is, when the overflow situationhas ended).
posix trace unnameduserevent
POSIX TRACE UNNAMEDUSEREVENT
(none) This event is reported when theuser tries to register a new eventtype and the per-process maxi-mum amount of user event types(TRACE USER EVENT MAX) has beenreached.
Table 1: System event types predefined by the POSIX Trace standard.
In addition to these, RTL-PT 1.0 has added the following ones, mainly with the purpose of retriev-ing system information that can be useful for the real-time programmer. Please note that future ver-sions of RTL-PT may modify the event types (syntactically or semantically); check file <trace.h>for any change. All these events are automatically recorded to any active stream which has not ex-plicitly filtered them out:
POSIX TRACE CONTEXT SWITCH :
Event type name: posix trace context switch.
When it is reported: Every time a context switch is produced between real-time tasks.
Associated data:
typedef struct {
void *task; // The new running task
c�
2002 A. Terrasa, A. Garcıa-Fornes, A. Espinosa

3 New System Event Types Defined in RTL-PT 13
int priority; // Its priority
task_state_t state;
bool is_linux; // Whether this task is Linux or not
} posix_trace_task_state_event_data;
POSIX TRACE TASK STATE :
Event type name: posix trace task state.
When it is reported: Every time a real-time task changes its state (released, ended, ready,suspended).
Associated data:typedef struct {
void *task; // The task the state is being reported
int priority; // Its priority
task_state_t state; // The task’s new state
bool is_linux; // Whether this task is Linux or not
} posix_trace_task_state_event_data;
POSIX TRACE KERNEL OVERHEAD :
Event type name: posix trace kernel overhead.
When it is reported: Every time the RT-Linux scheduler starts or stops running. In particular,each time the schedule function is invoked.
Associated data:typedef struct {
kernel_overhead_t type; // OVERHEAD_START or OVERHEAD_END
void *task; // The task that was running
bool is_linux; // Whether this task is Linux or not.
} posix_trace_overhead_event_data;
POSIX TRACE SYSTEM CALL :
Event type name: posix trace system call.
When it is reported: Every time some system calls are invoked from a real-time tasks. Onlysome “interesting” system calls are actually instrumented (such as pthread create, clock nanosleep,pthread kill, pthread mutex lock, etc.).
Associated data:typedef struct {
syscall_types_t syscall; // The invoked syscall’s identifier
void *task; // The invoking task
bool is_linux; // Whether this task is linux or not
} posix_trace_syscall_event_data;
POSIX TRACE MUTEX LOCK / POSIX TRACE MUTEX UNLOCK :
Event type name: posix trace mutex lock, posix trace mutex unlock.
When it is reported: Every time the related functions are called, including the mutex identifierand, in the case of the lock function, the result of the invocation: lock granted, lock denied (andhence blocking the task), or lock tried (if the “try” function has been invoked and the lock is notgranted.)
Associated data:
c�
2002 A. Terrasa, A. Garcıa-Fornes, A. Espinosa
14 RTL POSIX Trace 1.0
typedef struct {
mutex_op_t op; // The operation
void *mutex; // The mutex id
void *task; // The invoking task id
} posix_trace_mutex_event_data;
POSIX TRACE COND WAIT / POSIX TRACE COND BROADCAST :
Event type name: posix trace cond wait, posix trace cond broadcast.
When it is reported: Every time the related functions are called, including the identifiers of themutex and condition variable involved, and the invoking task.
Associated data:
cond_op_t op; // Operation: wait, signal, broadcast
void *task; // The invoking task id
void *cond; // The condition variable id
void *mutex; // The mutex id
} posix_trace_cond_event_data;
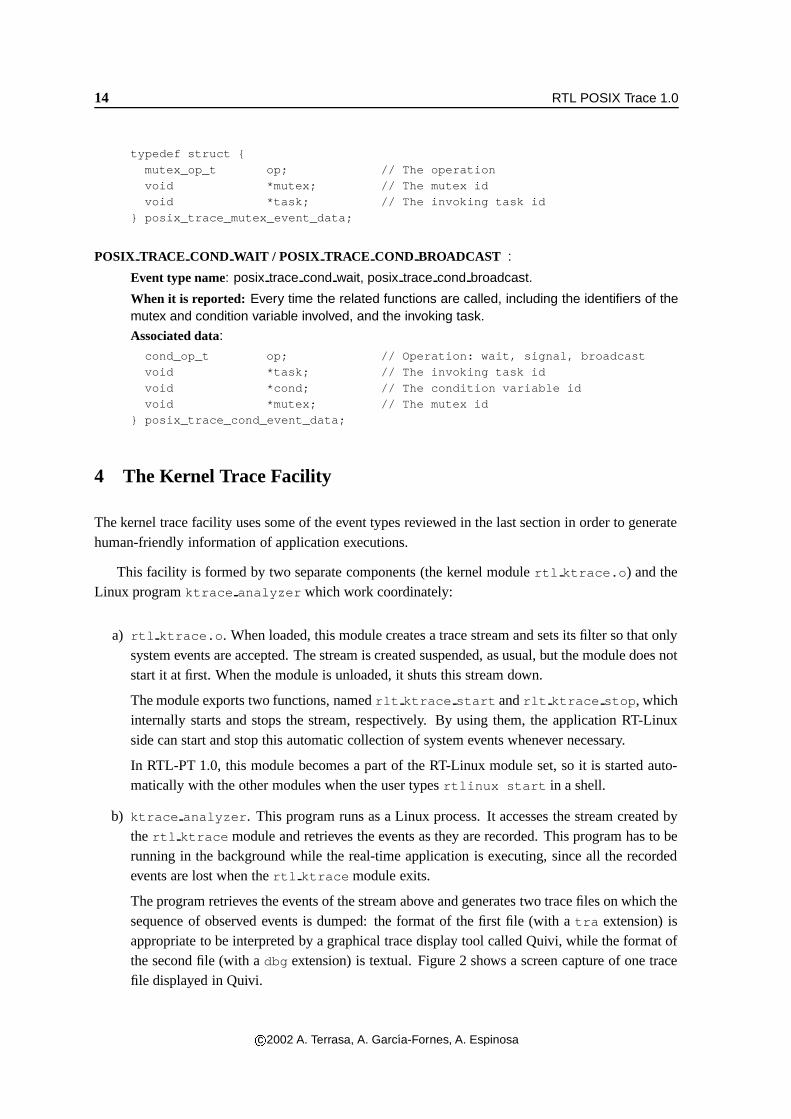
4 The Kernel Trace Facility
The kernel trace facility uses some of the event types reviewed in the last section in order to generatehuman-friendly information of application executions.
This facility is formed by two separate components (the kernel module rtl ktrace.o) and theLinux program ktrace analyzer which work coordinately:
a) rtl ktrace.o. When loaded, this module creates a trace stream and sets its filter so that onlysystem events are accepted. The stream is created suspended, as usual, but the module does notstart it at first. When the module is unloaded, it shuts this stream down.
The module exports two functions, named rlt ktrace start and rlt ktrace stop, whichinternally starts and stops the stream, respectively. By using them, the application RT-Linuxside can start and stop this automatic collection of system events whenever necessary.
In RTL-PT 1.0, this module becomes a part of the RT-Linux module set, so it is started auto-matically with the other modules when the user types rtlinux start in a shell.
b) ktrace analyzer. This program runs as a Linux process. It accesses the stream created bythe rtl ktrace module and retrieves the events as they are recorded. This program has to berunning in the background while the real-time application is executing, since all the recordedevents are lost when the rtl ktrace module exits.
The program retrieves the events of the stream above and generates two trace files on which thesequence of observed events is dumped: the format of the first file (with a tra extension) isappropriate to be interpreted by a graphical trace display tool called Quivi, while the format ofthe second file (with a dbg extension) is textual. Figure 2 shows a screen capture of one tracefile displayed in Quivi.
c�
2002 A. Terrasa, A. Garcıa-Fornes, A. Espinosa

5 Some Other Minor Changes 15
Figure 2: A snapshot of the Quivi tool displaying a trace generated by the Kernel Trace facility.
Given that the RTL-PT system automatically traces all system events and stores them in all theactive trace streams on which they are not explicitly filtered out, the extra overhead of the kernel tracefacility is very low. Nevertheless, if the application does not want to use this facility, it may either notloading the rlt ktrace module or simply not invoking the rlt ktrace start function from theapplication RT-Linux side module.
5 Some Other Minor Changes
This section lists the differences between the standard definition and the implementation of the RTL-PT which have not been reported in other sections of this document.
5.1 Header Files
Some constants and basic types are defined in header files which are not the ones established bythe standard. In particular: all the limit constants (such as TRACE SYS MAX or TRACE NAME MAX)should be placed in header file limits.h and all the private (opaque) data types (as trace id t ortrace event id t ) should be placed in sys/types.h.
In both cases, all these types and constants have been defined in trace.h. The reason for this isthat in RT-Linux many header files are duplicated (one version for RT-Linux and another for Linux) insuch a way that some header files are identical in both sides and some other are different. This makesthe entire header system so complex that we thought that, for the sake of clarity, this shortcomingcould be reasonable. As a result, any RT-Linux application or Linux program that wants to use thetrace support of RTL-PT has to include this global header file only.
c�
2002 A. Terrasa, A. Garcıa-Fornes, A. Espinosa
16 RTL POSIX Trace 1.0
5.2 Full Event Sets
When the application wants to have a set full of event types, it uses posix trace eventset full,indicating one of these options: POSIX TRACE WOPID EVENTS, POSIX TRACE SYSTEM EVENTS orPOSIX TRACE ALL EVENTS. The first one is defined as the set of “all the process-independent, imple-mentation-defined system trace event types”, the second is the set formed by “all the implementation-defined system trace event types” and the last one is the set formed by “all the trace event types”.
RTL-PT 1.0 considers that all system events are directly or indirectly related to the target process(and probably also to some of its tasks) and therefore the POSIX TRACE WOPID EVENTS event set isconsidered void.
c�
2002 A. Terrasa, A. Garcıa-Fornes, A. Espinosa
A An Example 17
A An Example
The example this section is describing is one of the sample applications that RTL-PT 1.0 providesin the examples/posixtrace directory. Any of these examples can be executed by typing “maketest” in a shell located in the example’s directory.
In particular, this example features a “complex” application formed by several real-time tasks anda Linux process (called target process). Both the real-time tasks and the target Linux processdefine new user event types and then trace events to a single stream, which is set to filter out allsystem events. The events are retrieved by an additional Linux process called linux analyzer.This process just retrieves the events and write them to the standard output. The real-time module andboth Linux processes are now explained in detail, showing excerpts of the actual C files.
A.1 The rtl tasks.c Module
The application RT-Linux side is placed in this module called rtl tasks.c. Inside this module,the initialization stage contains the creation of a stream attribute object, its modification, the creationof a stream and its filtering set up, and finally, the creation of four periodic real-time tasks. Amongthese four, only one actually traces events, while the other just consume CPU and uses some systemresources (a mutex). This is how this function looks like:
int init_module(void) {
trace_attr_t attr;
pthread_attr_t thattr;
trace_event_set_t set;
int error;
// Start the automatic tracing of kernel events:
rtl_ktrace_start();
// Create and set the trace attribute:
posix_trace_attr_init(&attr);
posix_trace_attr_setstreamfullpolicy (&attr, POSIX_TRACE_UNTIL_FULL);
posix_trace_attr_setname(&attr, TRACE_STREAM1_NAME);
// Create the stream:
error = posix_trace_create(0, &attr, &trid);
if (error) {
return -1;
}
// Set the stream filter to only record user events:
posix_trace_eventset_fill(&set, POSIX_TRACE_SYSTEM_EVENTS);
posix_trace_set_filter(trid, (const trace_event_set_t *) &set,
POSIX_TRACE_SET_EVENTSET);
c�
2002 A. Terrasa, A. Garcıa-Fornes, A. Espinosa
18 RTL POSIX Trace 1.0
// Start tracing:
posix_trace_start(trid);
// Create the task which traces user events (awakes each 100 msec):
pthread_attr_init (&thattr);
pthread_create (&thr1, &thattr, writer, 0);
pthread_make_periodic_np(thr1, 0, (hrtime_t) 100000000);
// And other tasks which just consume cpu
// This one awakes each 20 msec:
pthread_create (&thr2, &thattr, just_execute, (void *) 100000);
pthread_make_periodic_np(thr2, 0, (hrtime_t) 20000000);
// This one awakes each 25 msec:
pthread_create (&thr3, &thattr, just_execute, (void *) 300000);
pthread_make_periodic_np(thr3, 0, (hrtime_t) 25000000);
// This one awakes each 50 msec:
pthread_create (&thr4, &thattr, just_execute, (void *) 200000);
pthread_make_periodic_np(thr4, 0, (hrtime_t) 50000000);
return 0;
}
The real-time task executing the writer function first registers three new event types (which arecalled “user event string”, “user event char” and “user event int”) and then enters into a loop, whichexecutes one iteration each time the task is periodically released. In each loop, the task traces anevent of each of these user event types. Two of the three events are traced each time with differentassociated data, while the third always traces the same data. The writer function is now shown:
void *writer(void *dummy) {
int i;
int j;
char s[32];
char c;
int k;
void *data;
// Create some new event types:
posix_trace_eventid_open ("user event string", &ev_string);
posix_trace_eventid_open ("user event char", &ev_char);
posix_trace_eventid_open ("user event int", &ev_int);
// Initialize data to be recorded along with the events
c = ’A’;
k = 0;
//s = "RT-Linux says: Hello world!";
strcpy(s, "RT-Linux says: Hello world!");
c�
2002 A. Terrasa, A. Garcıa-Fornes, A. Espinosa
A.1 The rtl tasks.c Module 19
for (i=0; i<50; i++) {
pthread_mutex_lock(&mutex);
// Trace the "user event char" event and consume some CPU:
data = (void *) & c;
posix_trace_event(ev_char, data, sizeof(char));
c += 1;
for (j=0; j<40000; j++) ;
// Trace the "user event int" event and consume some CPU:
data = (void *) & k;
posix_trace_event(ev_int, data, sizeof(int));
k += 1;
for (j=0; j<40000; j++) ;
// Trace the "user event string" event and consume some CPU:
posix_trace_event(ev_string, s, sizeof(s));
for (j=0; j<40000; j++) ;
pthread_mutex_unlock(&mutex);
// Go to sleep until next period:
pthread_wait_np();
}
return (void *) 0;
}
Finally, the module’s cleanup function shuts the stream down, destroy the tasks and exits:
void cleanup_module(void) {
rtl_printf("rtl_tasks: CLEANUP!!!\n");
// Stop and shutdown the stream:
posix_trace_stop(trid);
posix_trace_shutdown(trid);
// Delete the tasks:
pthread_delete_np(thr1);
pthread_delete_np(thr2);
pthread_delete_np(thr3);
pthread_delete_np(thr4);
// Stop the automatic tracing of kernel events:
rtl_ktrace_stop();
}
c�
2002 A. Terrasa, A. Garcıa-Fornes, A. Espinosa
20 RTL POSIX Trace 1.0
A.2 The linux target.c Program
This program is supposed to form part of the application, and thus also traces event into the stream(s)which the RT-Linux might have created. In particular, this program register two event types called“user event linux” and “user event string”. The former is unknown to the trace system and then it isregistered as a new event type. However, the latter has already been created by the RT-Linux side soin this case, the register function in Linux returns the already mapped identifier for that event. Thisshows how RT-Linux and Linux can effectively trace events which belong to the same event type.
After registering the two event types, the program just enters in a loop in which traces the twoevents and then sleeps for a while.
#include <stdio.h>
#include <unistd.h>
#include <signal.h>
#include <trace.h>
#define NTIMES 30
void timer_handler(int dummy) {
return;
}
int main(void) {
int ntimes;
trace_event_id_t ev_linux;
trace_event_id_t ev_string;
void *data;
char s[32];
struct itimerval timeout;
struct sigaction action;
// Create a new type of event:
posix_trace_eventid_open ("user event linux", &ev_linux);
// Register an event type which has been created in RT-Linux
posix_trace_eventid_open ("user event string", &ev_string);
strcpy(s, "Linux says: Hello world!");
// Initialize the timeout value (oneshot, 500 ms):
timeout.it_interval.tv_sec = 0;
timeout.it_interval.tv_usec = 0;
timeout.it_value.tv_sec = 0;
timeout.it_value.tv_usec = 500000;
sigfillset(&(action.sa_mask));
sigdelset(&(action.sa_mask), SIGALRM);
action.sa_handler = timer_handler;
sigaction(SIGALRM,&action,NULL);
c�
2002 A. Terrasa, A. Garcıa-Fornes, A. Espinosa
A.3 The linux analyzer.c Program 21
// Enter the main loop: trace this event and sleep for a timeout:
for (ntimes = 0; ntimes < NTIMES; ntimes ++) {
data = (void *) & ntimes;
posix_trace_event(ev_linux, data, sizeof(int));
posix_trace_event(ev_string, s, sizeof(s));
setitimer(ITIMER_REAL,&timeout,NULL);
pause();
}
return 0;
}
A.3 The linux analyzer.c Program
This program is the trace analyzer process for the application. It basically extracts all the possibleinformation out of the stream created at the RT-Linux side. As explained above (Section 2.3) the waya Linux analyzer process can be attached to a particular stream is by “re-creating” it using the publicname of the stream (defined in “trace.h).
The program “creates” the stream, extracts and displays the stream attributes, the set of registeredevent types and the stream status, and then enters a loop in which waits for an event to be availablein the stream. When available, it displays all its information, including its associated traced data, andthen waits again for the next event.
#include <stdio.h>
#include <string.h>
#include <trace.h>
#define MAX_DATA_SIZE 256
int main(void) {
char data[MAX_DATA_SIZE];
char str[TRACE_NAME_MAX];
char s[64];
size_t data_len;
size_t size;
int unavailable;
int pol;
int error;
trace_event_id_t ev;
trace_attr_t trace_attr;
trace_id_t trace_id;
struct posix_trace_event_info event;
struct posix_trace_status_info status;
struct timespec time;
int *i;
char *c;
c�
2002 A. Terrasa, A. Garcıa-Fornes, A. Espinosa

22 RTL POSIX Trace 1.0
// Create (open) **the same** trace stream already created in
// rtl_tasks.c
posix_trace_attr_init(&trace_attr);
posix_trace_attr_setname(&trace_attr, TRACE_STREAM1_NAME);
error = posix_trace_create(0,&trace_attr,&trace_id);
if(error) {
fprintf(stderr,"ERROR %d while creating stream %s\n", error,
TRACE_STREAM1_NAME);
exit(1);
}
// Retrieve the attributes of this stream and print all the info:
error = posix_trace_get_attr(trace_id, &trace_attr);
fprintf(stderr, "get attr (%d)\n", error);
error = posix_trace_attr_getgenversion(&trace_attr, str);
fprintf(stderr, "get genversion (%d): %s\n", error, str);
error = posix_trace_attr_getname(&trace_attr, str);
fprintf(stderr, "get name (%d): %s\n", error, str);
error = posix_trace_attr_getcreatetime(&trace_attr, &time);
fprintf(stderr, "get create time (%d): %ld.%ld\n", error,
time.tv_sec, time.tv_nsec);
error = posix_trace_attr_getclockres(&trace_attr, &time);
fprintf(stderr, "get clock res (%d): %ld.%ld\n", error,
time.tv_sec, time.tv_nsec);
error = posix_trace_attr_getstreamfullpolicy(&trace_attr, &pol);
fprintf(stderr, "get full policy (%d): %d\n", error, pol);
error = posix_trace_attr_getmaxusereventsize(&trace_attr, 0, &size);
fprintf(stderr, "get max user event size (%d): %d\n", error, size);
error = posix_trace_attr_getmaxsystemeventsize(&trace_attr, &size);
fprintf(stderr, "get max system event size (%d): %d\n", error, size);
error = posix_trace_attr_getmaxdatasize(&trace_attr, &size);
fprintf(stderr, "get max data size (%d): %d\n", error, size);
error = posix_trace_attr_getstreamsize(&trace_attr, &size);
fprintf(stderr, "get stream size (%d): %d\n", error, size);
// Print the full list of event types available in the stream:
error = posix_trace_eventtypelist_rewind(trace_id);
fprintf(stderr, "event list rewind (%d)\n", error);
error = posix_trace_eventtypelist_getnext_id (trace_id, &ev, &unavailable);
while( ! unavailable && ! error) {
c�
2002 A. Terrasa, A. Garcıa-Fornes, A. Espinosa

A.3 The linux analyzer.c Program 23
error = posix_trace_eventid_get_name (trace_id, ev, str);
if (! error) {
fprintf(stderr, "event getname (%d): %s\n", error, str);
}
// Get the next one:
error = posix_trace_eventtypelist_getnext_id (trace_id, &ev,
&unavailable);
}
// Print the current status of the stream :
error = posix_trace_get_status(trace_id, &status);
fprintf(stderr, "event get status (%d): %d %d %d \n", error,
status.posix_stream_status, status.posix_stream_full_status,
status.posix_stream_overrun_status);
// Start retrieving events while the stream is open:
fprintf(stderr, "\n\nNow retrieving events: \n");
while(1) {
error = posix_trace_getnext_event(trace_id, &event, &data, sizeof(data),
&data_len, &unavailable);
if(error) {
fprintf(stderr,"No more events (%d). Exiting\n", error);
exit(0);
} else if (unavailable) {
fprintf(stderr, " Event unavailable\n");
} else {
fprintf(stderr, " ** New event ----------------------------------\n");
fprintf(stderr, " Event identifier = %d\n", event.posix_event_id);
fprintf(stderr, " Process ID = %d\n", event.posix_pid);
fprintf(stderr, " Address = %x\n", (int) event.posix_prog_address);
fprintf(stderr, " Truncation status= %d\n", event.posix_truncation_status);
fprintf(stderr, " Timestamp = %ld.%9ld\n", event.posix_timestamp.tv_sec,
event.posix_timestamp.tv_nsec);
fprintf(stderr, " Thread ID = %d\n", (int) event.posix_thread_id);
posix_trace_eventid_get_name (trace_id, event.posix_event_id, str);
fprintf(stderr, " Event Name = %s\n", str);
// Now switch depending on the event type (name):
if (!strcmp(str,"user event char")) {
c = (char *) data;
fprintf(stderr, " Data (char) = %c\n", *c);
}
else if (!strcmp(str,"user event int")) {
i = (int *) data;
c�
2002 A. Terrasa, A. Garcıa-Fornes, A. Espinosa

24 RTL POSIX Trace 1.0
fprintf(stderr, " Data (int) = %d\n", *i);
}
else if (!strcmp(str,"user event string")) {
strcpy(s, data);
fprintf(stderr, " Data (string) = %s\n", s);
}
else if (!strcmp(str,"user event linux")) {
i = (int *) data;
fprintf(stderr, " Data (int) = %d\n", *i);
}
else {
fprintf(stderr, " Data unknown\n" );
}
fprintf(stderr, " Data length = %d\n", data_len);
fprintf(stderr, " -----------------------------------------------\n\n");
}
}
return 0;
}
c�
2002 A. Terrasa, A. Garcıa-Fornes, A. Espinosa