
RTI in Middle Schools: Going from Concept to Reality Matthew Burns, Ph.D.
52
RTI in Middle Schools: Going from Concept to Reality Matthew Burns, Ph.D.
-
Upload
julian-paul -
Category
Documents
-
view
219 -
download
3
Transcript of RTI in Middle Schools: Going from Concept to Reality Matthew Burns, Ph.D.

RTI in Middle Schools: Going from Concept to Reality
Matthew Burns, Ph.D.

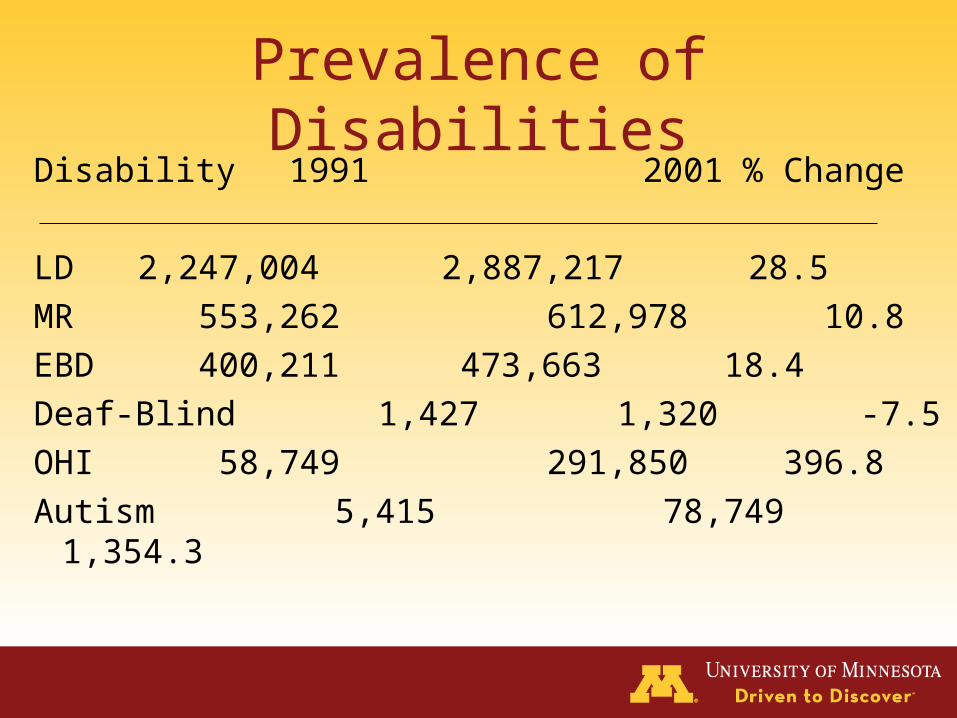
Prevalence of DisabilitiesDisability 1991 2001 % Change
LD 2,247,004 2,887,217 28.5
MR 553,262 612,978 10.8
EBD 400,211 473,663 18.4
Deaf-Blind 1,427 1,320 -7.5
OHI 58,749 291,850 396.8
Autism 5,415 78,749 1,354.3
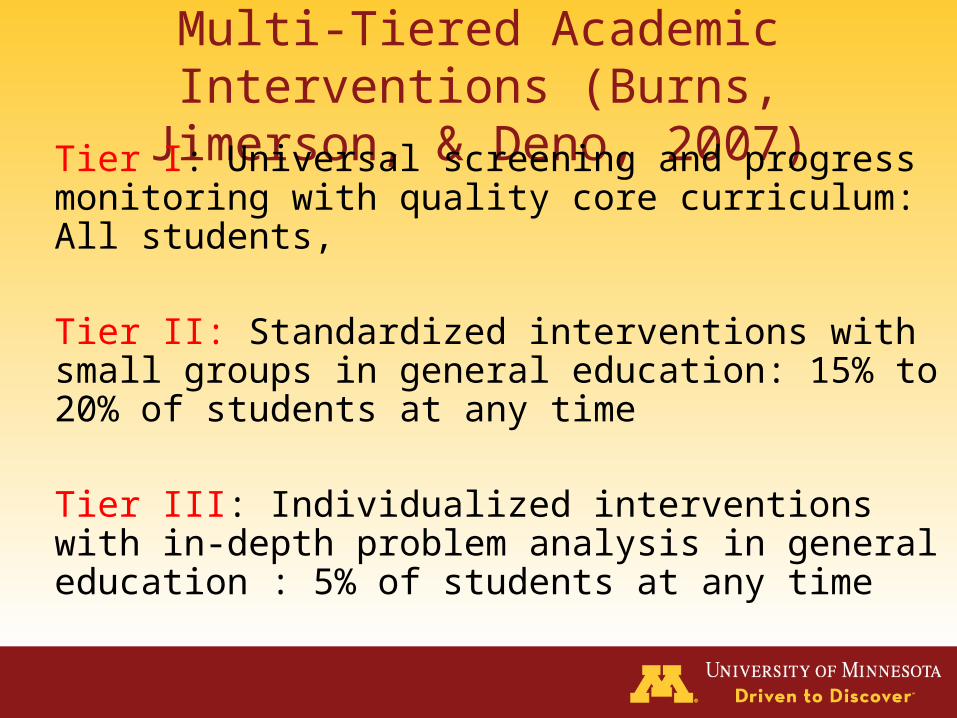
Multi-Tiered Academic Interventions (Burns, Jimerson, & Deno, 2007)
Tier I: Universal screening and progress monitoring with quality core curriculum: All students,
Tier II: Standardized interventions with small groups in general education: 15% to 20% of students at any time
Tier III: Individualized interventions with in-depth problem analysis in general education : 5% of students at any time
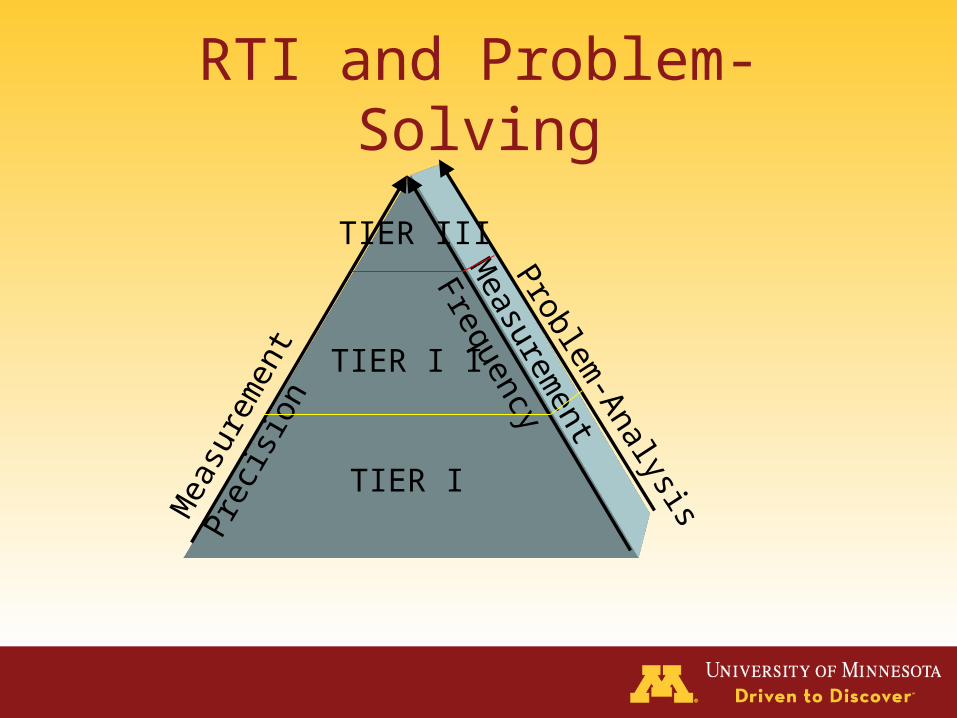
RTI and Problem-SolvingM
easu
rem
ent P
reci
sion M
easurement Frequency
Problem-Analysis
TIER I
TIER I I
TIER III

Problem Solving• Tier I – Identify discrepancy between
expectation and performance for class or individual
• Tier II – Identify discrepancy for individual. Identify category of problem. Assign small group solution.
• Tier III – Identify discrepancy for individual. Identify causal variable. Implement individual intervention.
TIER I
Classwide problem?
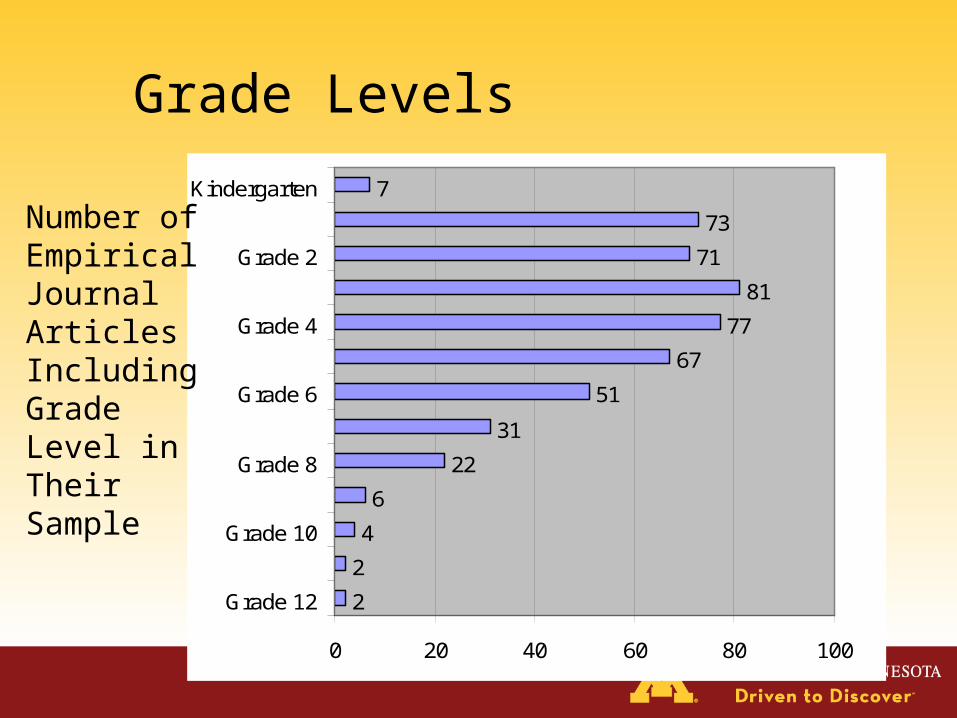
Grade Levels
2
2
4
6
22
31
51
67
77
81
71
73
7
0 20 40 60 80 100
Grade 12
Grade 10
Grade 8
Grade 6
Grade 4
Grade 2
Kindergarten
Number of Empirical Journal Articles Including Grade Level in Their Sample
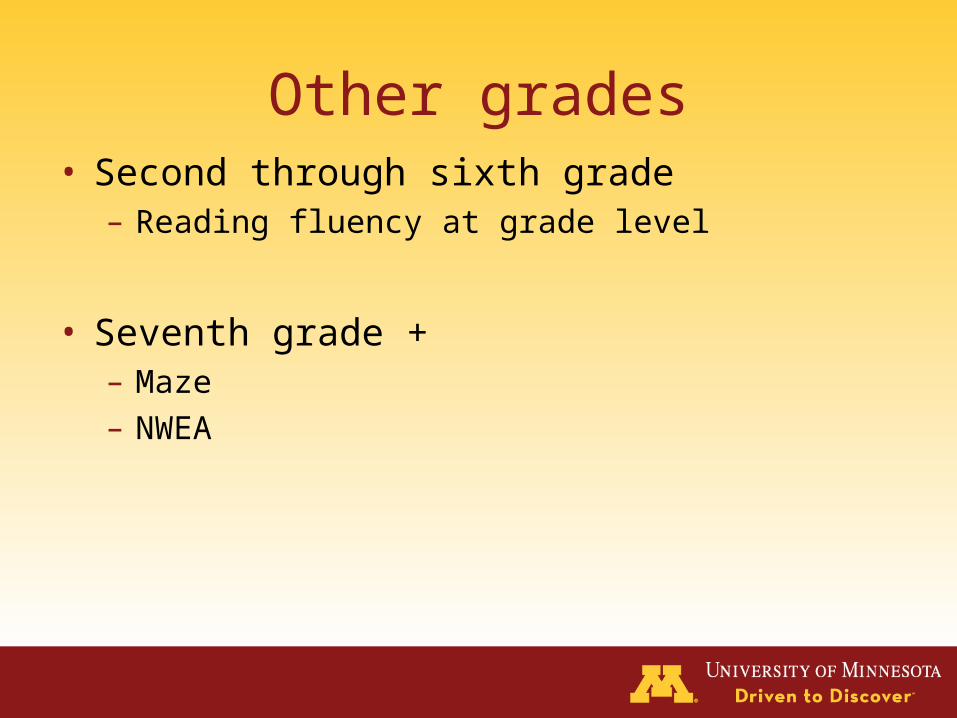
Other grades• Second through sixth grade
– Reading fluency at grade level
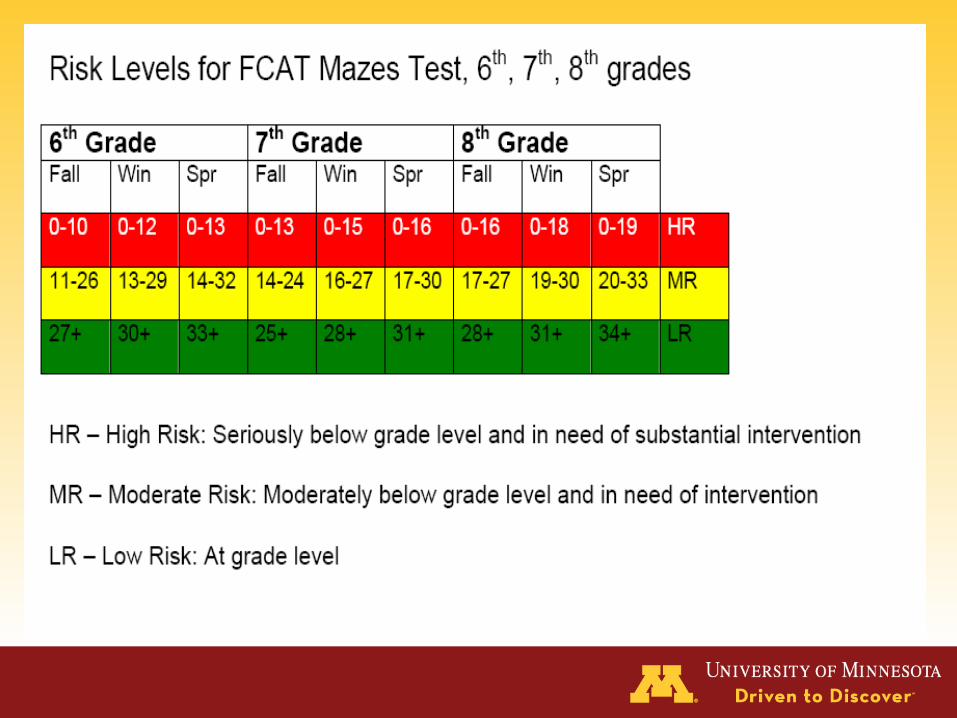
• Seventh grade +– Maze– NWEA

You’ve Got the Data – Now What?• Data Management Team
– Usually school psychologist and one other– Know data!
• PLC or Discipline Teams
• Get data to teachers within 2 to 3 days
• Lead data meeting
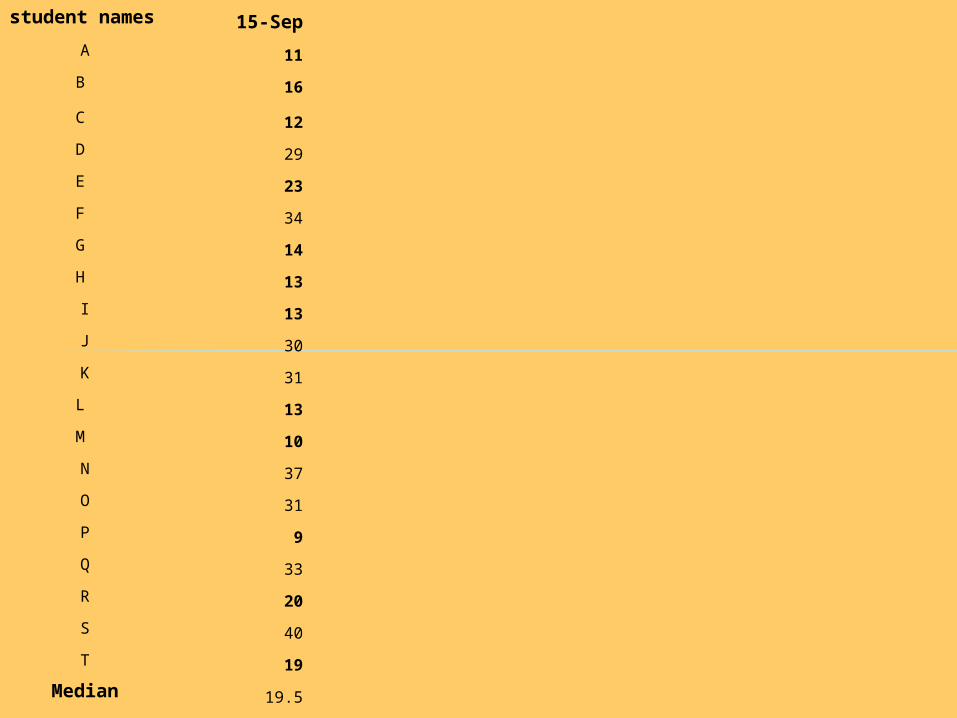
student names 15-Sep
A 11
B 16
C 12
D 29
E 23
F 34
G 14
H 13
I 13
J 30
K 31
L 13
M 10
N 37
O 31
P 9
Q 33
R 20
S 40
T 19
Median 19.5

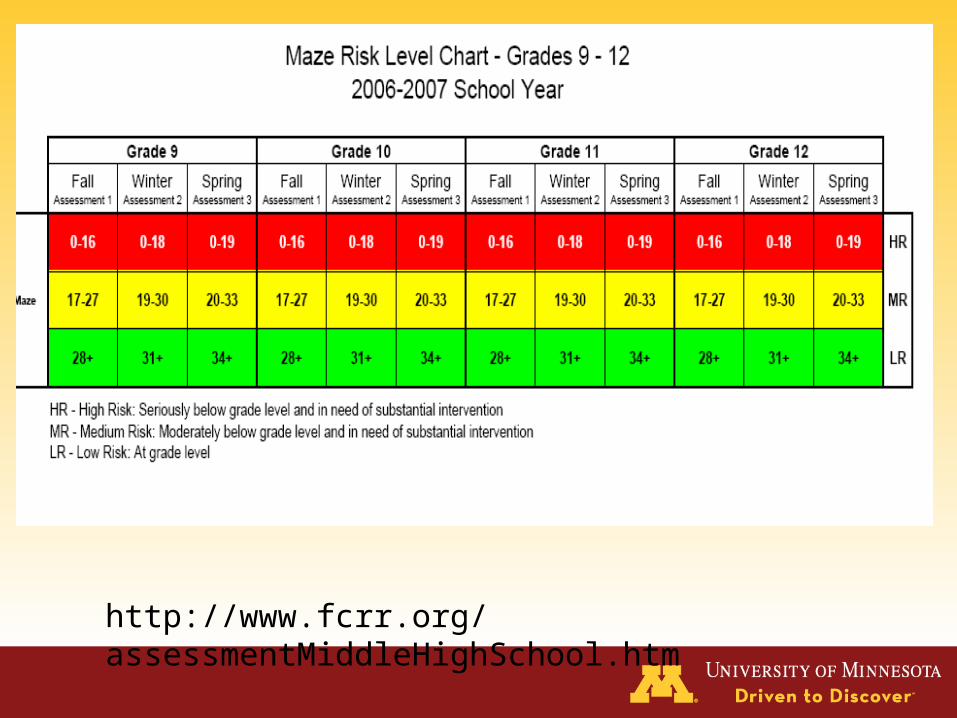
http://www.fcrr.org/assessmentMiddleHighSchool.htm

student names 15-Sep
A 11
B 16
C 12
D 29
E 23
F 34
G 14
H 13
I 13
J 30
K 31
L 13
M 10
N 37
O 31
P 9
Q 33
R 20
S 40
T 19
Median 19.5
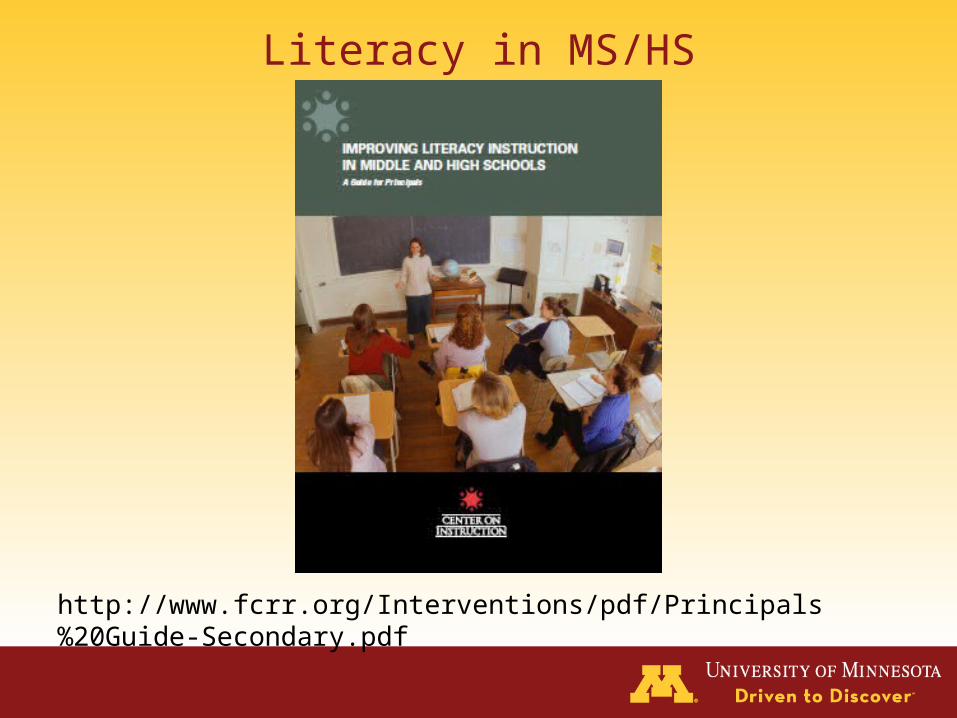
Literacy in MS/HS
http://www.fcrr.org/Interventions/pdf/Principals%20Guide-Secondary.pdf
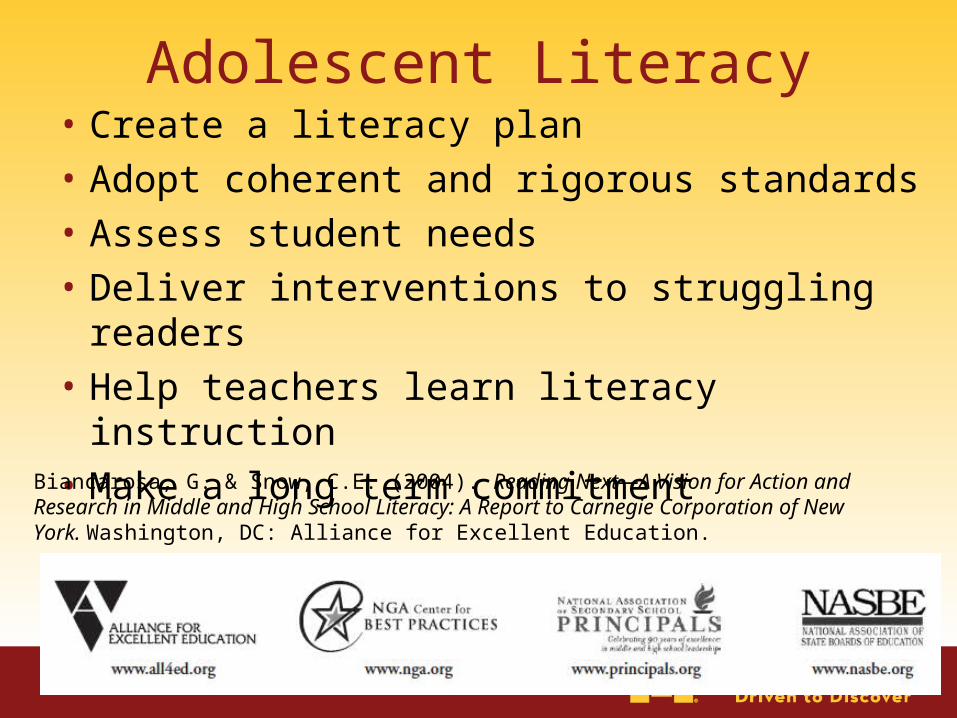
Adolescent Literacy• Create a literacy plan
• Adopt coherent and rigorous standards
• Assess student needs
• Deliver interventions to struggling readers
• Help teachers learn literacy instruction
• Make a long term commitment Biancarosa, G. & Snow, C.E. (2004). Reading Next—A Vision for Action and Research in Middle and High School Literacy: A Report to Carnegie Corporation of New York. Washington, DC: Alliance for Excellent Education.
Classwide Intervention
http://kc.vanderbilt.edu/pals/
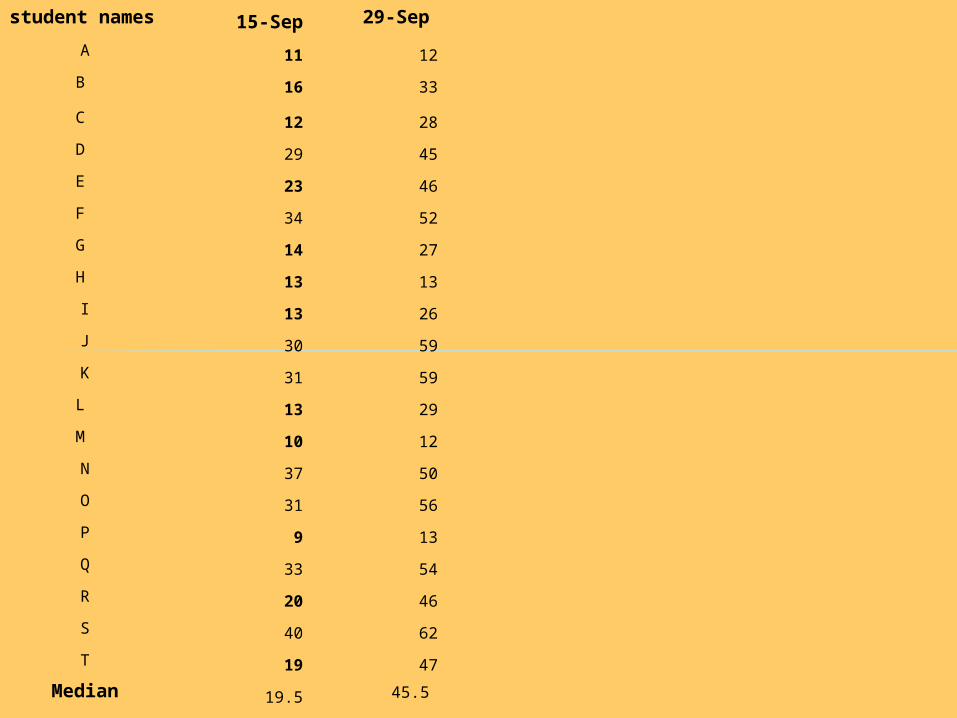
student names 15-Sep 29-Sep
A 11 12
B 16 33
C 12 28
D 29 45
E 23 46
F 34 52
G 14 27
H 13 13
I 13 26
J 30 59
K 31 59
L 13 29
M 10 12
N 37 50
O 31 56
P 9 13
Q 33 54
R 20 46
S 40 62
T 19 47
Median 19.5 45.5
TIER II INTERVENTIONS
Category of the Deficit

Assess 4 NRP Areas• Phonemic Awareness
– NA at secondary setting
• Phonics– Word attack - WJ
• Fluency– Oral reading fluency or Test of Silent Contextual Reading
Fluency
• Vocabulary/Comprehension– MAP
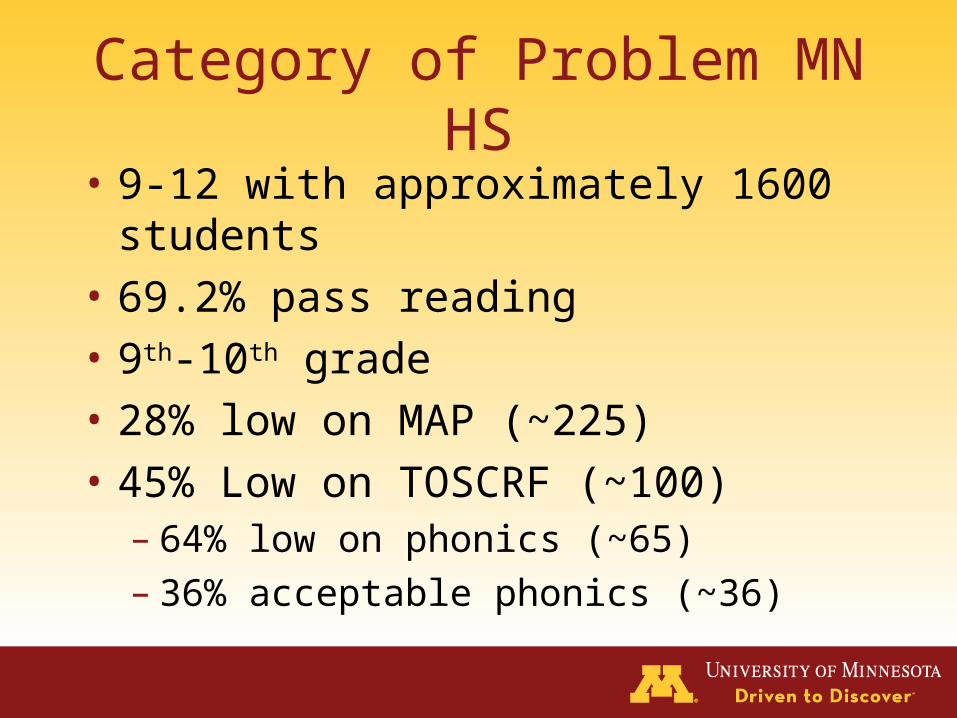
Category of Problem MN HS• 9-12 with approximately 1600 students
• 69.2% pass reading
• 9th-10th grade
• 28% low on MAP (~225)
• 45% Low on TOSCRF (~100)– 64% low on phonics (~65)– 36% acceptable phonics (~36)

Florida Center for Reading Research
www.fcrr.org
• Click – For Teachers• Click – Interventions for Struggling Readers• Click – Supplemental and Intervention
Programs
http://www.fcrr.org/FCRRReports/CReportsCS.aspx?rep=supp
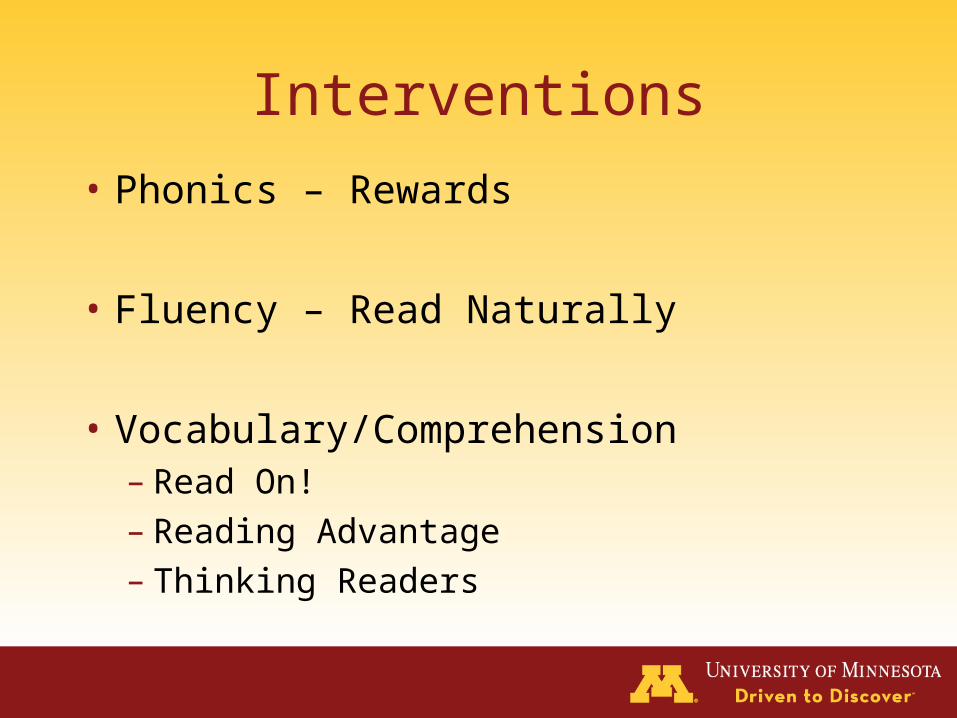
Interventions
• Phonics – Rewards
• Fluency – Read Naturally
• Vocabulary/Comprehension– Read On!– Reading Advantage– Thinking Readers

RAND Reading Research Group (2002)
• Described a critical state of reading comprehension skills among middle- and high-school students.
• Described six effective strategies– Monitoring comprehension was #1– Others were using graphic organizers,
generating and answering questions, examining story structure and summarizing
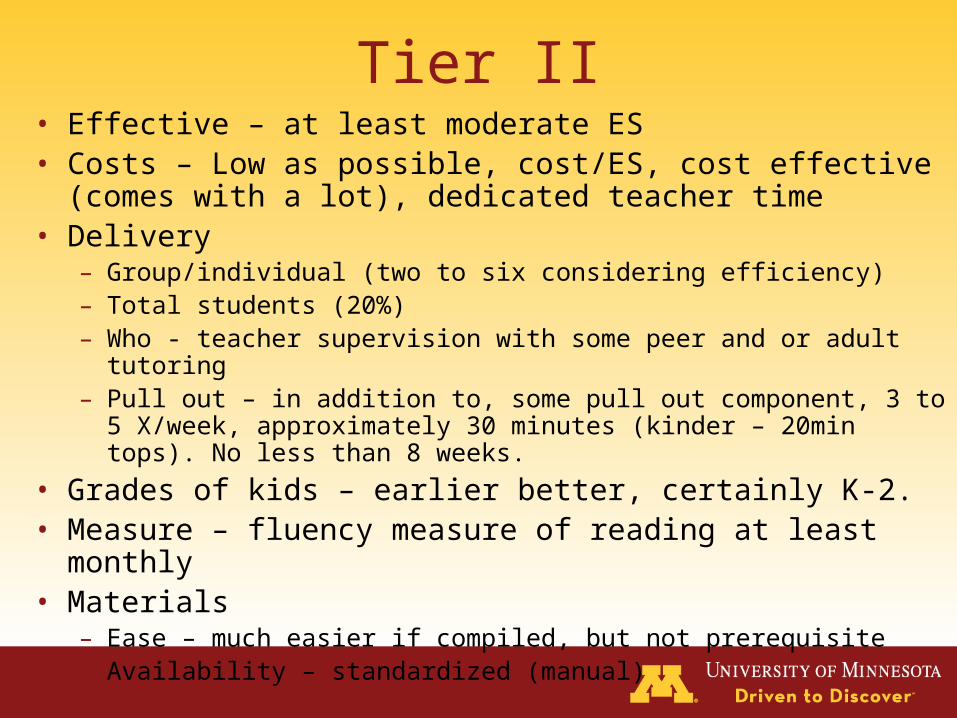
Tier II• Effective – at least moderate ES• Costs – Low as possible, cost/ES, cost effective (comes with
a lot), dedicated teacher time • Delivery
– Group/individual (two to six considering efficiency) – Total students (20%)– Who - teacher supervision with some peer and or adult tutoring– Pull out – in addition to, some pull out component, 3 to 5 X/week,
approximately 30 minutes (kinder – 20min tops). No less than 8 weeks.
• Grades of kids – earlier better, certainly K-2.• Measure – fluency measure of reading at least monthly• Materials
– Ease – much easier if compiled, but not prerequisite– Availability – standardized (manual)

Secondary Setting
• 50 minute courses– Smaller courses (up to 12 or so)– Content area (e.g., Social Studies)
• 90 minute blocks– Within course– 30 minutes of strategies

Tier II in HSSocial Studies RTI Class Social Studies Class
Social Studies Teacher
Social Studies Teacher
Interventionist
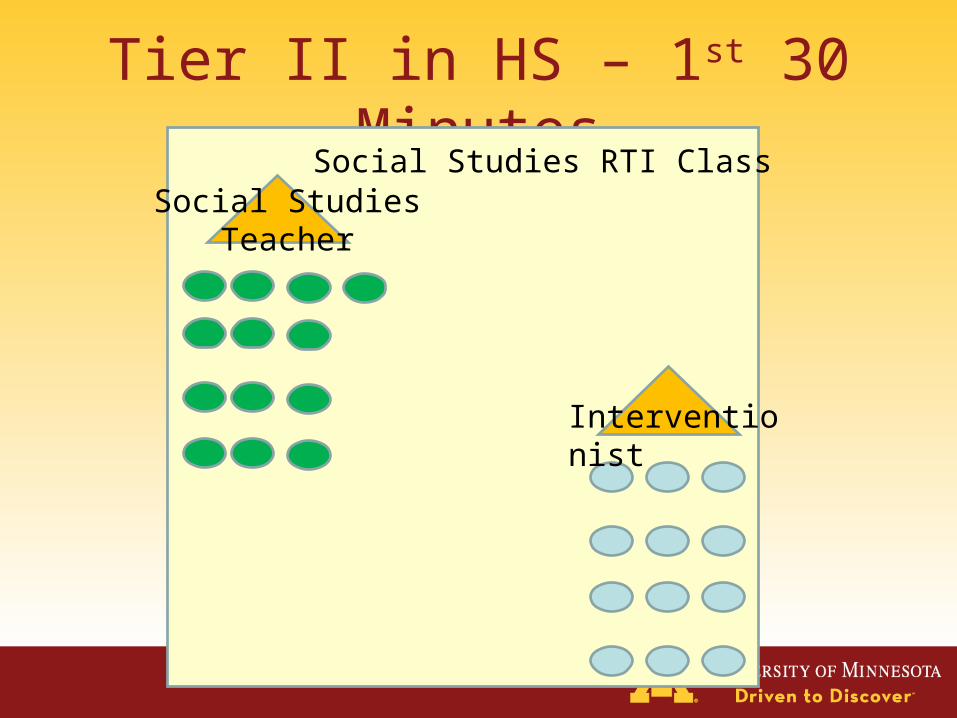
Tier II in HS – 1st 30 MinutesSocial Studies RTI Class
Social Studies Teacher
Interventionist
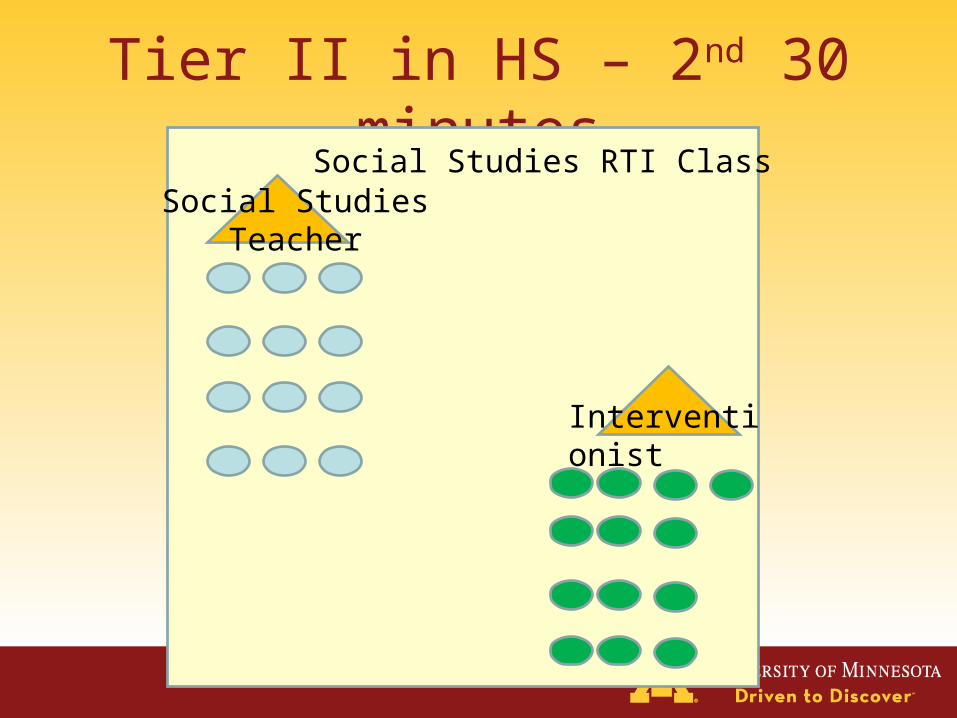
Tier II in HS – 2nd 30 minutesSocial Studies RTI Class
Social Studies Teacher
Interventionist

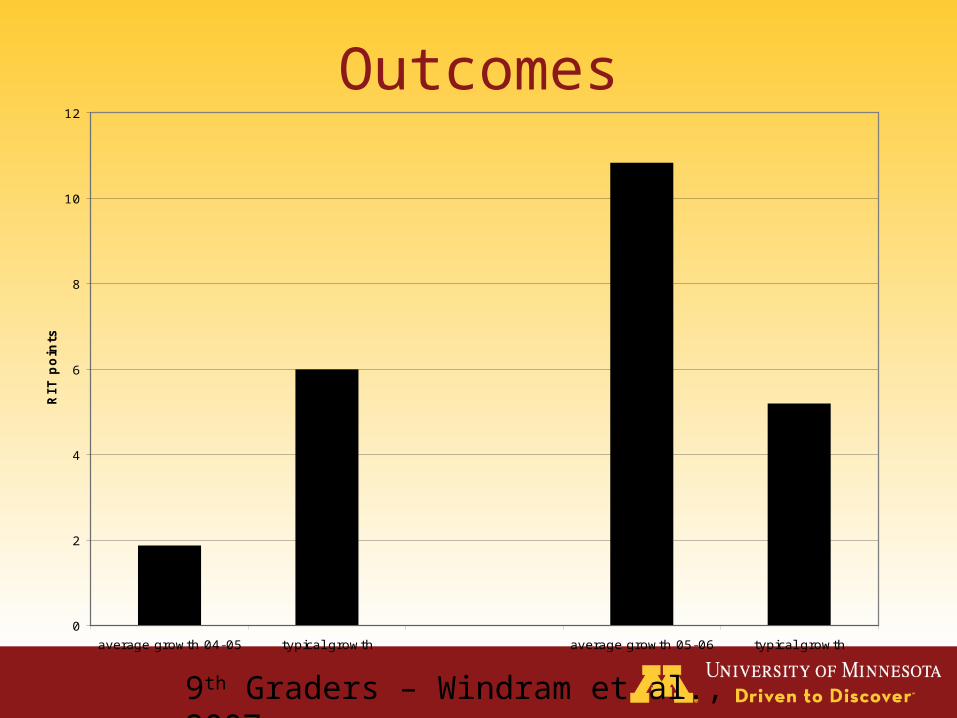
Outcomes
Outcomes
0
2
4
6
8
10
12
average growth 04-05 typical growth average growth 05-06 typical growth
RIT
poin
ts
9th Graders – Windram et al., 2007

Service Delivery• Courses
– Content course– Remedial course– 30 minute homeroom– Study hall
• Comprehension strategies and fluency
• Co-taught – Content specialist and interventionist
• AM and AR
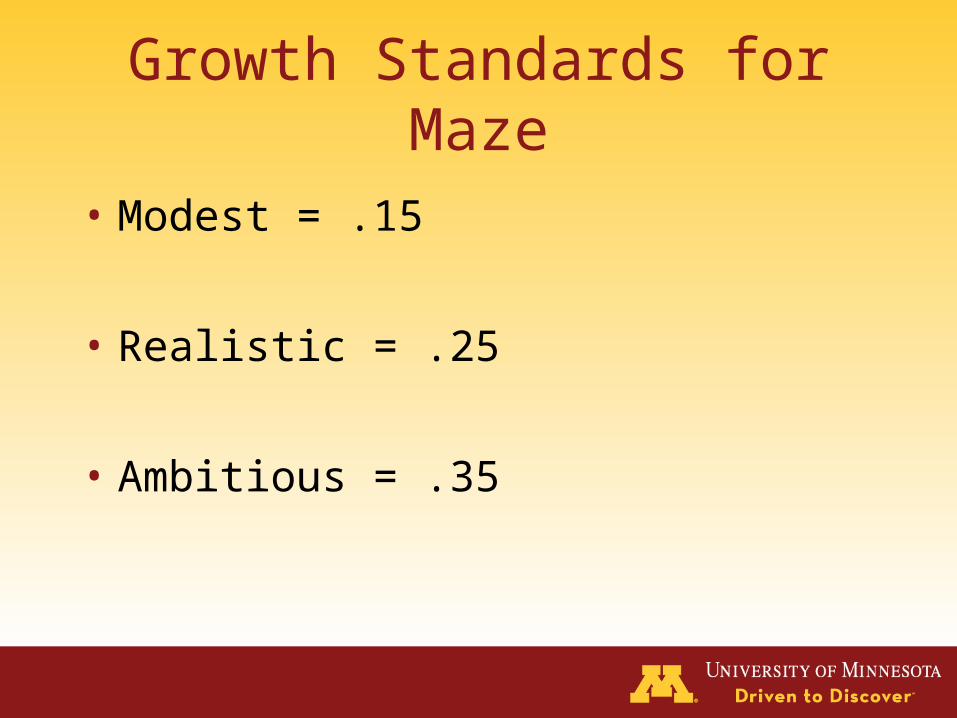
Growth Standards for Maze
• Modest = .15
• Realistic = .25
• Ambitious = .35

Tier III

Reading Comprehension
• Occurs when the reader develops mental representations of the text and uses them to interpret the text (Pressley & Afflerbach, 1995).
• Critically low among middle- and high-school students (RAND Reading Research Group, 2002).
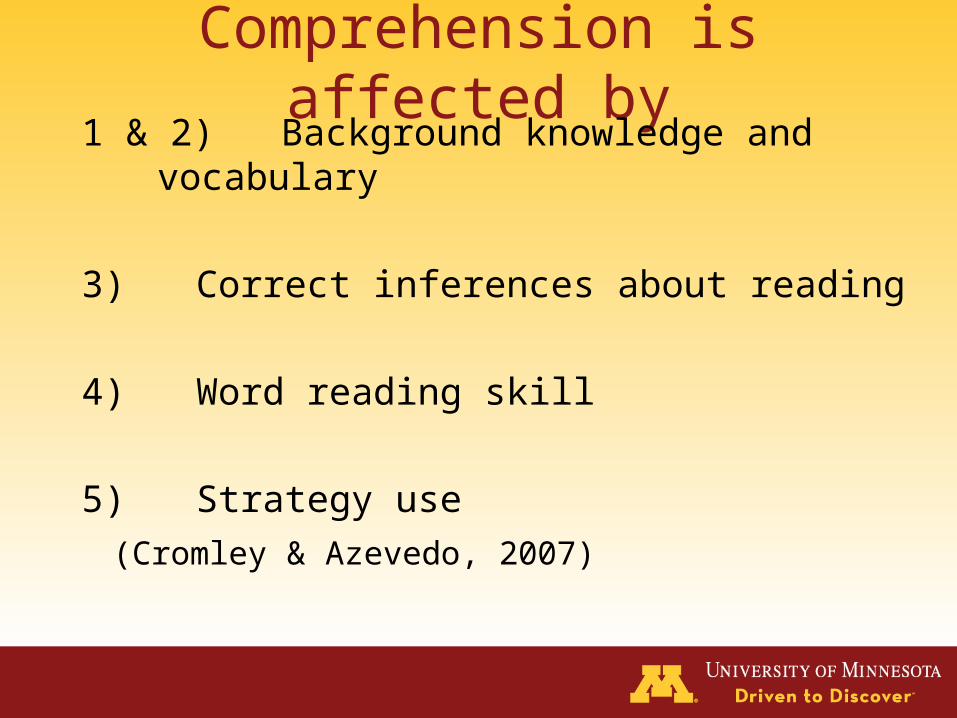
Comprehension is affected by1 & 2) Background knowledge and
vocabulary
3) Correct inferences about reading
4) Word reading skill
5) Strategy use
(Cromley & Azevedo, 2007)

Previewing (Graves et al., 1983)1. Provide each student the text
2. Provide a synopsis
3. Ask questions about the topic
4. Describe major story elements: setting, characters, point of view (narration), and description of the plot.
5. Present the names and descriptions of main characters
About 15 minutes
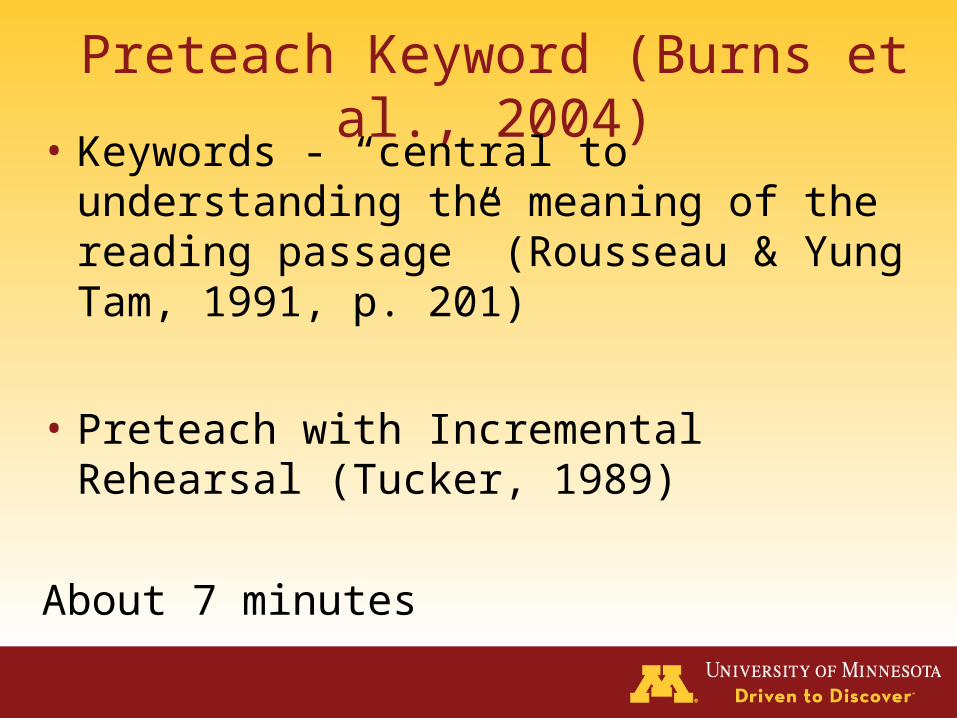
Preteach Keyword (Burns et al., 2004)• Keywords - “central to understanding the
meaning of the reading passage” (Rousseau & Yung Tam, 1991, p. 201)
• Preteach with Incremental Rehearsal (Tucker, 1989)
About 7 minutes
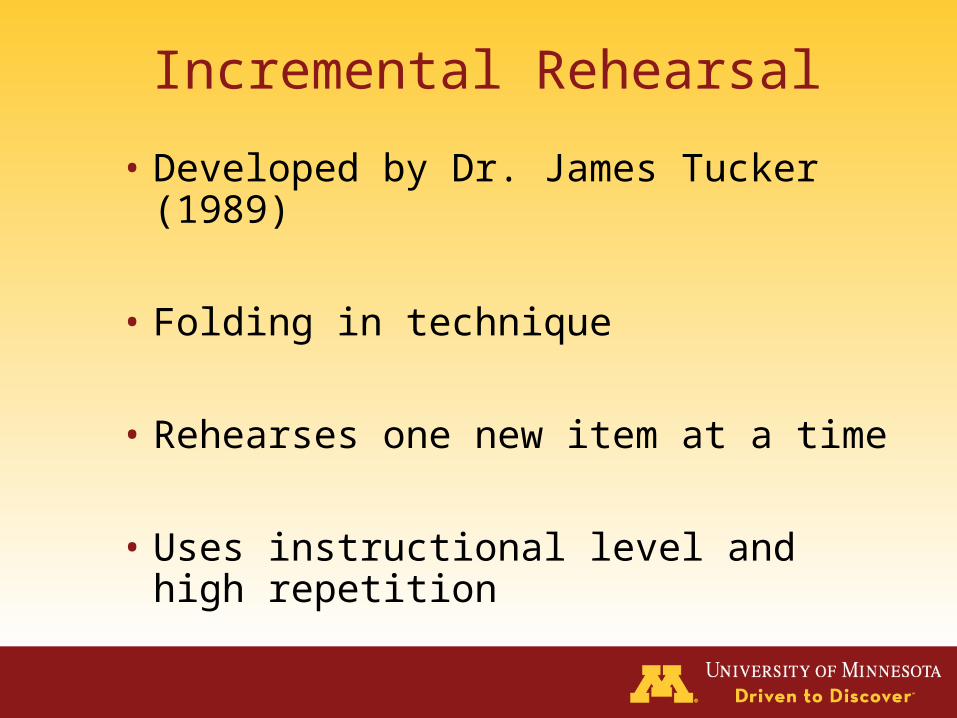
Incremental Rehearsal
• Developed by Dr. James Tucker (1989)
• Folding in technique
• Rehearses one new item at a time
• Uses instructional level and high repetition

Mean Number of Word Retained

Correlation between retentionand receptive vocabulary
1 day 2 days 3 days 7 days 30 days
TA .32 .27 .32 .23 .08
DS .22 .25 .17 .16 .20
IR -.16 -.13 .06 .04 -.07
These results are “astounding” (Daly & McCurdy, 2002; p. 457).
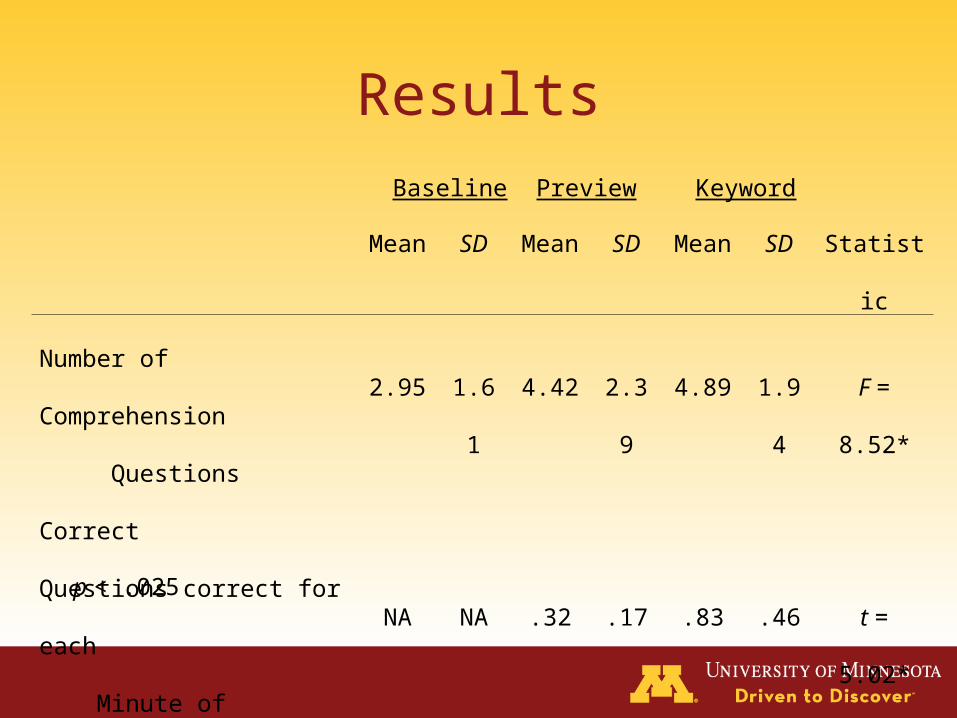
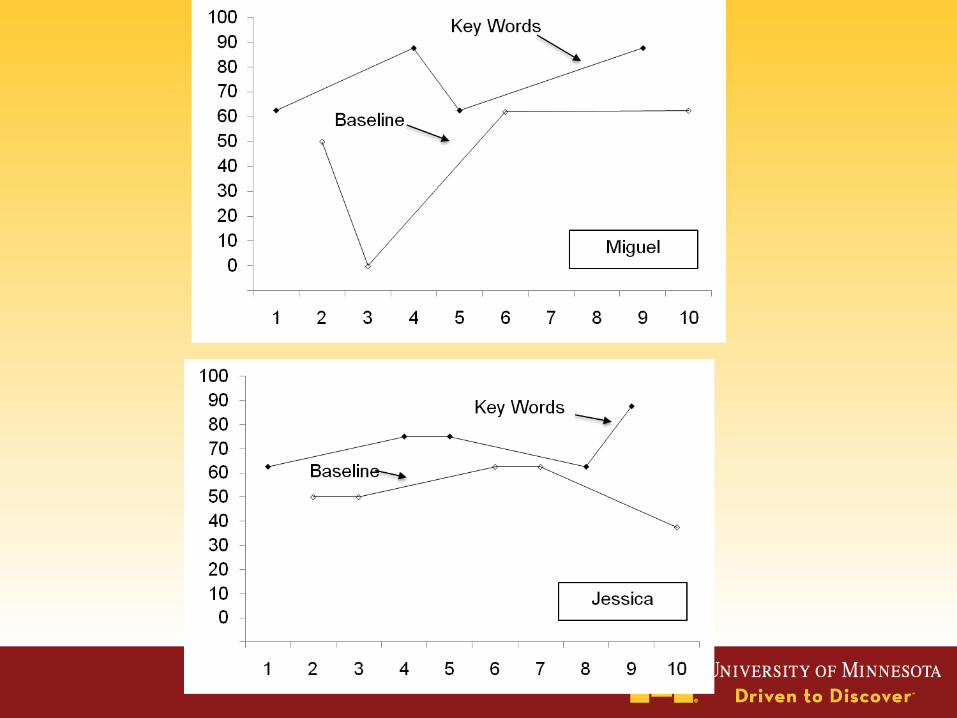
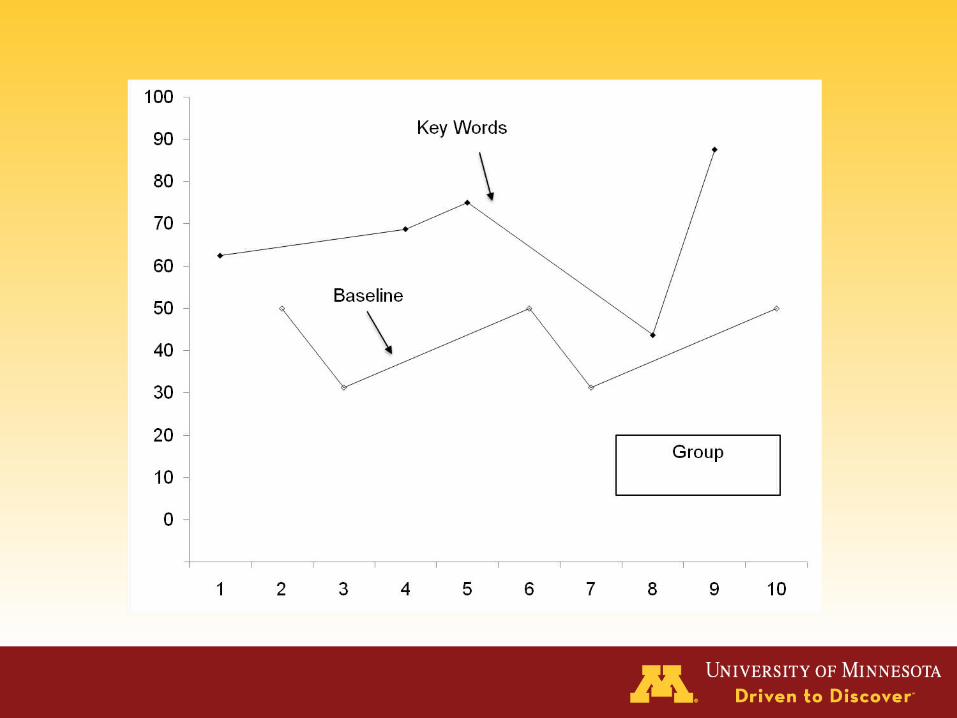
Results
Mean SD Mean SD Mean SD Statistic
Number of Comprehension
Questions Correct2.95 1.61 4.42 2.39 4.89 1.94 F = 8.52*
Questions correct for each
Minute of Instructional TimeNA NA .32 .17 .83 .46 t = 5.02*
Baseline Preview Keyword
p < .025
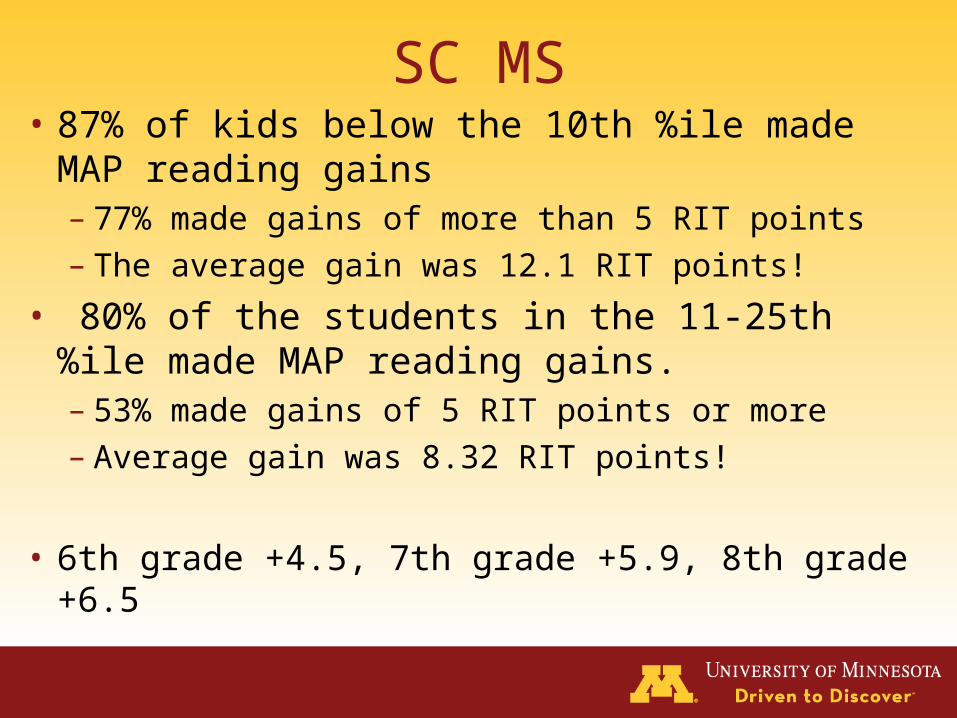
SC MS• 87% of kids below the 10th %ile made MAP
reading gains– 77% made gains of more than 5 RIT points– The average gain was 12.1 RIT points!
• 80% of the students in the 11-25th %ile made MAP reading gains. – 53% made gains of 5 RIT points or more – Average gain was 8.32 RIT points!
• 6th grade +4.5, 7th grade +5.9, 8th grade +6.5