RTG Degradation Primer and Application to...
17
NETS 2015 1 Presenting Author: Tom Hammel, Teledyne Energy Systems Co-Authors: Russell Bennett, Teledyne Energy Systems Robert Sievers, Teledyne Energy Systems Bill Otting, Aerojet Rocketdyne RTG Degradation Primer and Application to MMRTG Nuclear and Emerging Technology for Space (NETS) 2015 February 23-26, 2015 Abstract 5107
Transcript of RTG Degradation Primer and Application to...

NETS 2015
1
Presenting Author: Tom Hammel, Teledyne Energy Systems
Co-Authors: Russell Bennett, Teledyne Energy Systems
Robert Sievers, Teledyne Energy Systems
Bill Otting, Aerojet Rocketdyne
RTG Degradation Primer and Application to MMRTG
Nuclear and Emerging Technology for Space (NETS) 2015
February 23-26, 2015
Abstract 5107
NETS 2015
2
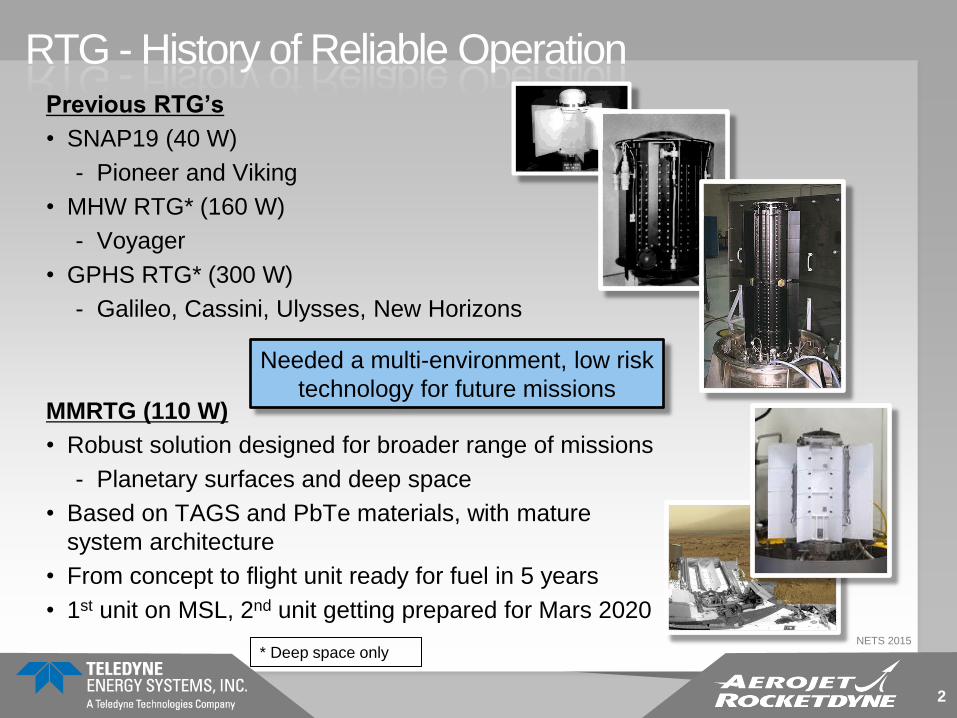
RTG - History of Reliable Operation Previous RTG’s
• SNAP19 (40 W)
- Pioneer and Viking
• MHW RTG* (160 W)
- Voyager
• GPHS RTG* (300 W)
- Galileo, Cassini, Ulysses, New Horizons
MMRTG (110 W)
• Robust solution designed for broader range of missions
- Planetary surfaces and deep space
• Based on TAGS and PbTe materials, with mature
system architecture
• From concept to flight unit ready for fuel in 5 years
• 1st unit on MSL, 2nd unit getting prepared for Mars 2020
* Deep space only
Needed a multi-environment, low risk
technology for future missions
NETS 2015
3
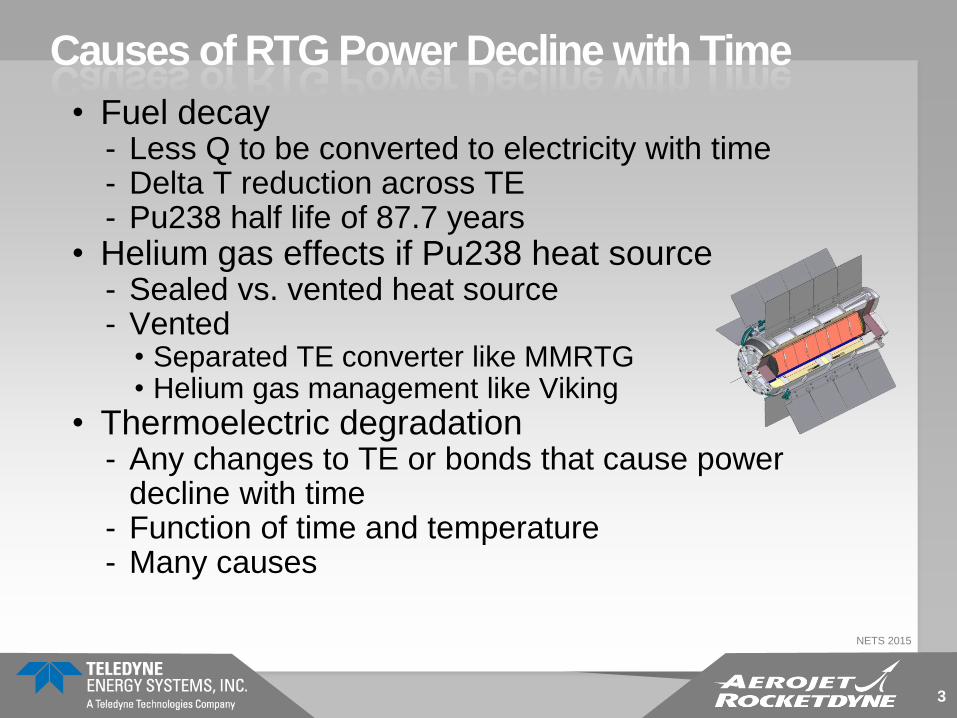
Causes of RTG Power Decline with Time
• Fuel decay - Less Q to be converted to electricity with time - Delta T reduction across TE - Pu238 half life of 87.7 years
• Helium gas effects if Pu238 heat source - Sealed vs. vented heat source - Vented
• Separated TE converter like MMRTG • Helium gas management like Viking
• Thermoelectric degradation - Any changes to TE or bonds that cause power
decline with time - Function of time and temperature - Many causes
NETS 2015
4
TE Degradation Causes
• Sublimation - Geometry changes - Porosity effects on TE properties - Preferential sublimates causing TE property
changes - Effect of deposited sublimates on other
materials and/or insulation thermal conductivity - Suppression techniques
• Argon gas fill • Tightly packed insulation • Poured aerogel insulation • Ceramic paints • Segmenting to reduce hot side temperature of
sublimation sensitive segments
NETS 2015
5
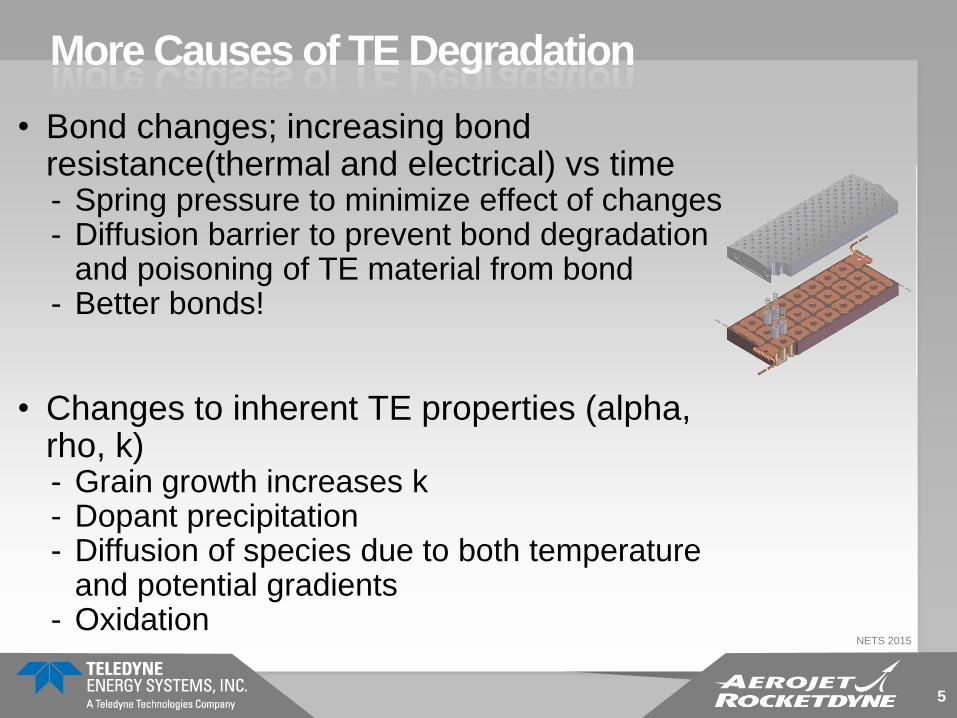
More Causes of TE Degradation
• Bond changes; increasing bond resistance(thermal and electrical) vs time - Spring pressure to minimize effect of changes - Diffusion barrier to prevent bond degradation
and poisoning of TE material from bond - Better bonds!
• Changes to inherent TE properties (alpha, rho, k) - Grain growth increases k - Dopant precipitation - Diffusion of species due to both temperature
and potential gradients - Oxidation
NETS 2015
6
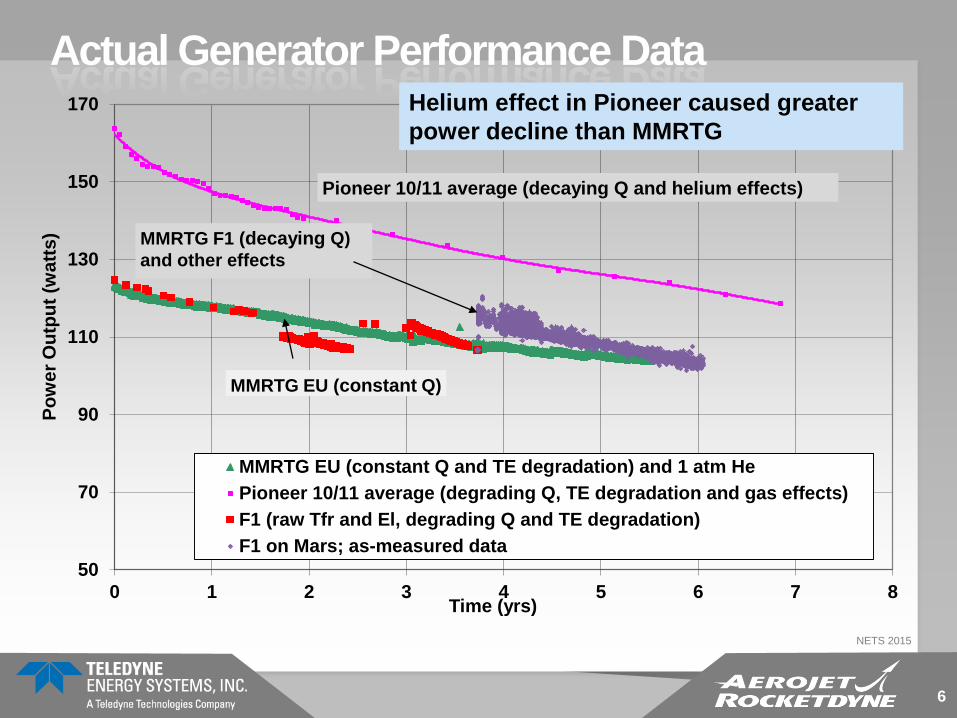
Actual Generator Performance Data
50
70
90
110
130
150
170
0 1 2 3 4 5 6 7 8
Po
we
r O
utp
ut
(wa
tts
)
Time (yrs)
MMRTG EU (constant Q and TE degradation) and 1 atm He
Pioneer 10/11 average (degrading Q, TE degradation and gas effects)
F1 (raw Tfr and El, degrading Q and TE degradation)
F1 on Mars; as-measured data
MMRTG F1 (decaying Q)
and other effects
MMRTG EU (constant Q)
Pioneer 10/11 average (decaying Q and helium effects)
Helium effect in Pioneer caused greater
power decline than MMRTG
NETS 2015
7
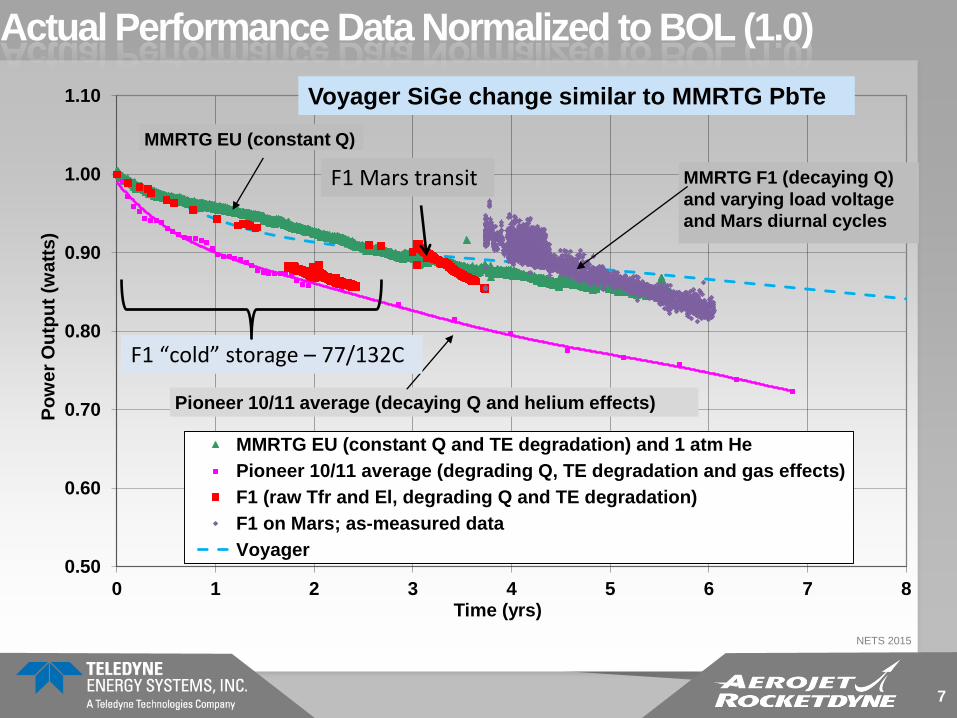
Actual Performance Data Normalized to BOL (1.0)
0.50
0.60
0.70
0.80
0.90
1.00
1.10
0 1 2 3 4 5 6 7 8
Po
we
r O
utp
ut
(wa
tts
)
Time (yrs)
MMRTG EU (constant Q and TE degradation) and 1 atm He
Pioneer 10/11 average (degrading Q, TE degradation and gas effects)
F1 (raw Tfr and El, degrading Q and TE degradation)
F1 on Mars; as-measured data
Voyager
MMRTG F1 (decaying Q)
and varying load voltage
and Mars diurnal cycles
MMRTG EU (constant Q)
Pioneer 10/11 average (decaying Q and helium effects)
F1 “cold” storage – 77/132C
F1 Mars transit
Voyager SiGe change similar to MMRTG PbTe

NETS 2015
8
Actual Performance Data Normalized to BOL (1.0)
0.50
0.60
0.70
0.80
0.90
1.00
1.10
0 1 2 3 4 5 6 7 8 9 10
Po
we
r O
utp
ut
(wa
tts
)
Time (yrs)
MMRTG F1 (decaying Q) MMRTG EU (constant Q)
Pioneer 10/11 average (decaying Q and helium effects)
Rate of Fuel Decay
for Pu238
MMRTG power output with
JUST fuel decay
MMRTG power prediction with fuel
decay and TE degradation at
constant conditions (TFR and EL)

NETS 2015
9
Actual Performance Data Normalized to BOL (1.0)
0.50
0.60
0.70
0.80
0.90
1.00
1.10
0 1 2 3 4 5 6 7 8 9 10
Po
we
r O
utp
ut
(wa
tts
)
Time (yrs)
MMRTG F1 (decaying Q) MMRTG EU (constant Q)
Pioneer 10/11 average (decaying Q and helium effects)
Rate of Fuel Decay
for Pu238
MMRTG power output with
JUST fuel decay
MMRTG power prediction with fuel
decay and TE degradation at
constant conditions (TFR and EL)
eMMRTG Goal (2.5%/yr)

NETS 2015
10
Power Change Effects Averaged Over 10 Years
• Fuel decays 0.8%/year
• Power drops 1.1%/year due to fuel decay alone
• MMRTG power reduces 2.9%/year due to fuel decay
and TE degradation
- TE degradation adds 1.8%/year to fuel decay effect
• eMMRTG goal is 2.5%/yr (on an each-year basis)
- Over 10 years this averages to 2.24%/year
- TE degradation would be about equal to fuel decay
effect

NETS 2015
11
Basis of MMRTG System Performance Model
• System performance model performs Beginning of Life (BOL) analysis - Heat balance of heat losses and thermoelectric heat flow to determine TE hot
junction temperature - From this and TE data/model, power output is determined
• TE Life model is additional analysis which solely
adds TE changes with time - This model includes two components
• Magnitude and change with time from EU test data - Uses Eoc and Ri vs time, extrapolated - EU test data taken at one set of temperature conditions
• Uses “heritage” model from Pioneer and Viking data to adjust the EU results for hot side temperature changes determined from system model - Will be updated when module life data is available

NETS 2015
12
• Both EOC and RI for EU are
normalized and plotted vs time
• Currently, data are broken into
four time periods:
- 0 to 2800 hours
- 2800 to 5600 hours
- 5600 to 14000 hours
- Greater than 14000 hours
• Linear data fits enable
reasonable and well-behaved
extrapolation
• Approach easily modified to
more groups and other type of
fits as warranted
EU Test Data for Performance
Model

NETS 2015
13
Testing to Characterize TE Degradation • Test Challenges
- Constant vs Degrading Q
- Hot and Cold junction temperatures; constant vs
vary with Q
- Load current (load)
- Environment considerations
• Tests - Couple tests
- Module tests
- ETG tests
- Long term Module life tests
Testing Goal: Simulate actual use
conditions in an RTG as closely as
possible!

NETS 2015
14
Putting Some Test Results Together…..
• Showing some various test results from - MMRTG life test boxes
- MMRTG EU, and
- MMRTG F1
• % change/1000 hours shown as a function of TE hot
junction temperature and time

NETS 2015
15
Thermoelectric Power Change Rate
0.01
0.10
1.00
10.00
600 650 700 750 800 850 900 950 1000 1050 1100
Po
we
r lo
ss
, (d
P/d
t)(1
/P0
), %
/10
00
hrs
Temperature (°F)
Revised set using avg THJ
EU test data
F1 test data
Pioneer data
Life Tester B1M34
Life Tester B2M34
Pioneer/Viking,
fixed Q
MMRTG initial estimate
MMRTG EU
2 Khrs
17.5 Khrs
MMRTG F1
5 Khrs
1 Khrs
10 Khrs
20 Khrs 60 Khrs
Pioneer vs time
45 Khrs
0 Khrs
5 Khrs
10 Khrs
20 Khrs
B1M34; 40-50Khrs
B2M34; 40-50Khrs
Estimated Thj
based on Tfr 40-50 Khrs

NETS 2015
16
TE Degradation Trends
• Conclusions:
- MMRTG degradation rate is likely flatter vs.
temperature than prior Pioneer and Viking
generators
- Difficult to use F1 data due to varying conditions
- Reduced TE hot junction temperature gives less
degradation reduction than with heritage
(Pioneer/Viking units)
• Makes sense as TAGS segment is much shorter
than prior units
NETS 2015
17
Conclusions
• Characterizing TE degradation is important: it is roughly ½ to 2/3
of the power loss in an RTG with time
• Long term testing needs to planned well in advance
• Understanding basic physical effects in TE couples and modules
is important
• Consider testing MMRTG QU with Mars diurnal cycling
• Next generation eMMRTG using Skutterudite couples should see
reduced degradation: stable materials, no segmentation and
testing is underway
The authors would like to acknowledge the
support of DOE, JPL and NASA.