Gas phase molecular relaxation probed by synchrotron radiation
Upload
truongtramCategory
view
225download
2
ISSN 1463-9076
Physical Chemistry Chemical Physics
www.rsc.org/pccp Volume 15 | Number 12 | 28 March 2013 | Pages 4075–4460
1463-9076(2013)15:12;1-T
PERSPECTIVERinge et al.Single nanoparticle plasmonics
4110 Phys. Chem. Chem. Phys., 2013, 15, 4110--4129 This journal is c the Owner Societies 2013
Cite this: Phys. Chem.Chem.Phys.,2013,15, 4110
Single nanoparticle plasmonics
Emilie Ringe,w*a Bhavya Sharma,a Anne-Isabelle Henry,a Laurence D. Marksb andRichard P. Van Duynea
Interest in nanotechnology is driven by the unique and novel properties of nanoscale materials such as the
strong interaction of metal particles with light, caused by localized surface plasmon resonances (LSPRs). In this
perspective article we review and discuss prominent advantages and advances in single particle studies of
plasmonic nanostructures. Common techniques and recent improvements in spatial and spectral resolution
will first be outlined, covering both far-field and near-field phenomena. Then, new insight and information
uniquely obtained from single particle approaches will be overviewed, including several fundamental studies
of plasmonic behaviour, as well as applications using single particle tracking and chemical reaction
monitoring. Finally, highly interdisciplinary future directions and experiments are discussed.
1. Introduction
The optical properties of nanoparticles have been observedsince the antiquity, for example, as part of the 4th century AD
Lycurgus cup and medieval stained glass. Scientific interests inthe colour of small particles debuted later, when Faradaysynthesized the famous ‘‘Ruby Fluid’’ by reacting gold chloridewith phosphorous in ether.1 Faraday recognized that the colourwas due to the reduction of gold to small particles, and laterMie provided the theoretical foundations explaining the colourof the particles and its dependence on metal composition aswell as surrounding environment.2
Such bright colours arise in materials with a negative realand a small positive imaginary dielectric constant in a given
a Department of Chemistry, Northwestern University, Evanston, IL 60208, USA.
E-mail: [email protected] Department of Materials Science and Engineering, Northwestern University,
Evanston, IL 60208, USA
Emilie Ringe
Emilie Ringe is a Gott JuniorResearch Fellow at Trinity Hall,Cambridge University, as well as aNewton International ResearchFellow (the Royal Society, UK).She studied at McGill Universityat the undergraduate level beforeobtaining a MS from North-western University in inorganiccrystallography with J. A. Ibers.She then completed a PhD inoptical spectroscopy andanalytical modelling of nano-particle shape in the groups of
Richard Van Duyne and Laurence Marks at NorthwesternUniversity in 2012. She currently works in the high resolutionelectron microscopy group at Cambridge University; her researchinterests include atomic resolution elemental mapping of alloynanoparticles relevant for catalysis applications, as well as near-field plasmon mapping using electron energy loss spectroscopy.
Bhavya Sharma
Bhavya Sharma received her BSin Exercise Science at SUNYBuffalo. She completed her PhDin 2011 in Chemistry from theUniversity of Pittsburgh underthe guidance of Prof. SanfordAsher. She used UV resonanceRaman spectroscopy andexcitation profiles to examineelectronic transitions in peptidesand proteins. Bhavya is currentlya postdoctoral fellow with Prof.Richard P. Van Duyne atNorthwestern University. Her
research interests include biological applications of SERS andRaman spectroscopy and Raman imaging.
† Current address: Department of Materials Science and Metallurgy, University ofCambridge, Cambridge CB2 3QZ, UK.
Received 18th December 2012,Accepted 4th February 2013
DOI: 10.1039/c3cp44574g
www.rsc.org/pccp
PCCP
PERSPECTIVE
Publ
ishe
d on
04
Febr
uary
201
3. D
ownl
oade
d by
Nor
thw
este
rn U
nive
rsity
on
17/0
7/20
14 2
1:51
:56.
View Article OnlineView Journal | View Issue
This journal is c the Owner Societies 2013 Phys. Chem. Chem. Phys., 2013, 15, 4110--4129 4111
wavelength range, such as quasi-free electron metals, Ag, Au, Cu,and Al, because they can support surface plasmon resonances(SPRs) when submitted to electromagnetic radiation. The SPR canbe of two types: propagating or localized. Propagating surfaceplasmons, also called surface plasmon polaritons (SPP), are oscilla-tions of electric charges travelling at a metal–dielectric interface. Insmall metallic particles such as Faraday’s ‘‘Ruby Fluid’’, the electronoscillation becomes localized, and is thus called localized surfaceplasmon resonance or LSPR. This particle-confined oscillationoccurs in the entire particle, however the strongest electric fieldsare found at the metal–dielectric interface (hence the name‘‘surface’’). Three wavelength-dependent phenomena arise fromLSPR: enhancement of the electric field on the surface of theparticle, photon absorption, and photon scattering. The latter twoare directly responsible for colour, while the former gives rise to theelectromagnetic contribution in surface-enhanced spectroscopies.
Several factors affect the LSPR behaviour of nanoparticles,including shape, size, composition, dielectric environment, pro-viding exquisite tuneability as well as characterization challenges.Given the complex and acute dependence of plasmonic propertieson structural factors, even optimized synthesis products containshape inhomogeneities which prevent obtaining quantitativeinformation from bulk measurements. Just as biological processescan be better understood from single biomolecule studies,3 andnanoparticle dynamics such as vibration are best unravelled oneparticle at a time,4 knowledge on plasmonic behaviour can beuniquely enhanced by single particle approaches. Technical andinstrumental advances have greatly increased their robustness,reliability, and popularity, producing an increasingly vast body ofliterature on plasmonics studied at the single particle level.
In this perspective, we will highlight the most prominenttools and unique features of single particle spectroscopy,focusing on the characterization of plasmonic phenomena incolloidal nanoparticles. In Section 2, the most common toolsas well as recent advances in characterization of single nano-particles will be reviewed. Then, in Section 3, examples ofrecent findings will be discussed with a focus on what canuniquely be learnt from single particle approaches. Finally,Section 4 concludes with open challenges and future directions.Note that since all the particles discussed herein are nanosized,we decided to omit the ‘nano’ prefix for simplicity, i.e., ananosized rod will be referred to as a rod rather than ananorod; for analogous reasons we will refer to quasi-sphericalparticles as sphere, although true spheres are very rare becauseof faceting and twinning tendencies.
2. Methods and advances in single particlecharacterization
A surface plasmon is by definition a polariton, i.e. a photoncoupled to an electron,5,6 such that either photons or electrons
Laurence D. Marks
Laurence D. Marks received his BAin chemistry and a PhD in physicsfrom Cambridge University.Marks did postdoctoral trainingin Cambridge with Drs D. J.Smith and A. Howie as well aswith Prof. J. M. Cowley atArizona State University. Since1985 he has been a facultymember at NorthwesternUniversity. He has researchinterests in a range of areas,from nanoparticles tonanotribology and surface science.
Richard P. Van Duyne
Richard P. Van Duyne is CharlesE. and Emma H. MorrisonProfessor of Chemistry and ofBiomedical Engineering atNorthwestern University. Hereceived a BS (1967) at theRensselaer Polytechnic Instituteand PhD (1971) at theUniversity of North Carolina,Chapel Hill, both in chemistry.He is a member of the NationalAcademy of Sciences and theAmerican Academy of Arts andSciences. He is known for the
discovery of surface-enhanced Raman spectroscopy (SERS), theinvention of nanosphere lithography (NSL), and development ofultrasensitive nanosensors based on localized surface plasmonresonance (LSPR) spectroscopy.
Anne-Isabelle Henry
Anne-Isabelle Henry received aBS in physical chemistry fromUniversity Paris Sud (2003) inOrsay, France after completingan internship in the Departmentof Physical Chemistry at the FritzHaber institute in Berlin,Germany. She received a PhD(2008) in chemistry fromUniversity Pierre and MarieCurie in Paris, France on thethermal stability and control ofsuperstructure in Ag nanocrystalsassemblies. She is currently a
senior research associate at Northwestern University. Herresearch interests include the fabrication, assembly, and study ofplasmonic nanoparticles, SERS-active nanoparticle aggregates andsubstrates with a focus on structure–property relationships.
Perspective PCCP
Publ
ishe
d on
04
Febr
uary
201
3. D
ownl
oade
d by
Nor
thw
este
rn U
nive
rsity
on
17/0
7/20
14 2
1:51
:56.
View Article Online

4112 Phys. Chem. Chem. Phys., 2013, 15, 4110--4129 This journal is c the Owner Societies 2013
can be used to excite this fascinating electron oscillation. Alarge number of experimental approaches are thus available toexcite and probe the plasmonic behaviour of single particles,offering a rich variety of information and resolution. In thissection, we describe the most commonly used single particlecharacterization methods, as well as recent and excitingadvances, and explain what unique information they are capableof providing. For quick reference, the main characteristics ofeach technique are presented in Table 1.
2.1 Far-field approaches to single particle characterization
While nanoparticles cannot be directly observed with the nakedeye, the effects of their plasmonic behaviour can readily bevisualized in, for example, the bright colours in medievalstained glass. Methods probing the optical properties of nano-particles from a distance much larger than the wavelength oflight, i.e. far-field approaches, are simple and robust tools tostudy some of the prominent features of plasmonic particles.
Despite being intrinsically diffraction-limited, far-field approachesare useful to analyse absorption and scattering properties, whilethe plasmon-induced electric field can indirectly be characterizedthrough enhancement factors in various types of spectroscopies.Additionally, far-field detection simplicity allows for its incorpora-tion in more complex experimental schemes such as dynamictracking and correlation with structural parameters, enabling thestudy of complex, heterogeneous systems.
2.1.1 Scattering by plasmonic nanoparticles. Light scatteringis a common phenomenon that occurs whenever a refractiveindex contrast exists between a particle and its surroundings.In plasmonic particles, elastic photon scattering is stronglywavelength dependent and is most enhanced at the resonancefrequency. Single particle light scattering was first observed abouta century ago by Zsigmondy, whose ultramicroscope and studiesof colloids were rewarded by the 1925 Nobel Prize in Chemistry.19
Dark-field optical microscopy (herein referred to as simply dark-field microscopy) is now a prominent nanotechnology tool.20–30
Table 1 Overview of single particle detection techniques
Technique Probed phenomenon Spatial resolution Advantages Disadvantages
Far field Dark-fieldmicroscopy
Scattering Diffractionlimited
Simple platform easily coupled toother techniquesDynamic nanoparticle trackingSingle molecule detection7
Background scattering fromother objectsTypically limited to largeparticles (>40 nm)8,9
Photothermalimaging (PHI)
Absorption Diffractionlimited
Low background interferenceSingle molecule detection10
Detection of very small particles(1.4 nm)11
No direct cross-sectioninformationNeeds relatively intense pumpsources
Spatial modulationspectroscopy (SMS)
Extinction Diffractionlimited
Provides absolute extinctioncross-sectionNo intense pump sourcesrequired
Less sensitive than PHIRequires larger particles(>5 nm)12
Surface-enhancedspectroscopy
Electromagnetic fieldenhancement
Diffractionlimited
Direct probing of performancefor spectroscopic applications
Indirect characterization of thenear-fieldEnhancement factor provides anaveraged field intensity
Near field Scanning near fieldoptical microscopy(SNOM)
Near-field opticaltransmission orscattering
o10 nm (aper-tureless probe)13
Wide spectral range and goodenergy resolutionFlexible measurement cap-abilities and geometriesSuitable for non-vacuum andliquid environment
Possible near-field perturbationfrom the probe
Photoelectronemission micro-scopy (PEEM)
Photon-induced,field-enhancedelectron emission
20–25 nm14
2 nm (aberration-corrected)15
Can be coupled to other techni-ques (2-photon photoemission,interferometric pump–probetechniques)Good spatial resolution
Requires sophisticatedelectron opticsPossible distortions due tocharging
Scanning photo-ionization micro-scopy (SPIM)
Photon-induced,field-enhancedelectron emission
Diffractionlimited
High temporal resolutionRelative simplicityPolarization studies possible
Indirect near field informationLimited energy resolution
Cathodo-luminescence
Electron-induced,field-enhancedphoton emission
10–50 nm16,17 Can be performed in TEM orSEMRelatively simpleinstrumentation
Sample must be stable underelectron beamSpatial resolution intrinsicallylimited by electron–holerecombination distance
Electron energy lossspectroscopy
Energy loss intransmitted electronbeam due to plasmonexcitation
Sub-Å18 Best spatial resolution achievableFitting of STEM-EELS data canyield deconvoluted modesSimultaneous elemental analysispossible
Sophisticated, expensiveequipment requiredPossible difficulty in analysis todue to plasmon modes overlapRequires stable and electrontransparent sample
PCCP Perspective
Publ
ishe
d on
04
Febr
uary
201
3. D
ownl
oade
d by
Nor
thw
este
rn U
nive
rsity
on
17/0
7/20
14 2
1:51
:56.
View Article Online

This journal is c the Owner Societies 2013 Phys. Chem. Chem. Phys., 2013, 15, 4110--4129 4113
In summary, a high numerical aperture dark-field condenser,where the central portion of the cone of light is blocked, is used toilluminate the sample with a hollow cone of light as depicted inFig. 1. The smaller numerical aperture collection objective acceptsonly light scattered by particles in the field of view, giving rise to adark background (hence ‘‘dark-field’’) with particles of variousshapes and sizes appearing as bright spots of different coloursand intensities against a black background (Fig. 1).
The variation of scattering intensity can be in part attributedto size effects, as explained by Mie theory,2,31 a simple and well-known way to model the extinction (scattering + absorption) of aplasmonic particle.29 While this solution to Maxwell’s equationsdescribes the peak position (colour) dependence on volume forspheres,32 other approaches (numerical or experimental) areneeded for non-spherical particles. Scattering studies can, ingeneral, probe single particles as small as 35 nm,22,23 dependingon their composition. To lower this size limit, variousapproaches have been combined with dark-field microscopy,such as polarization effects,26,27,33,34 supercontinuum white lightsources,21 and spatial modulation spectroscopy.35,36 These newdevelopments have allowed for particles as small as 5 nm in sizeto be imaged.21
2.1.2 Absorption by plasmonic nanoparticles. Despite theadvances in detection limits mentioned above, the observationof nanoparticles via scattering methods becomes increasinglydifficult as their size decreases. Indeed, as described in Mietheory2 (and more generally in Rayleigh’s theory37) the scatteringcross-section of a nanoparticle much smaller than the wavelengthof light scales as the sixth power of its radius, while the absorptioncross-section scales as its third power. It becomes immediatelyevident that absorption-based methods are better suited thanscattering-based ones for the detection of nanoparticles with radiismaller than 50 nm.29,38 Furthermore, detection of low intensityscattering can be impeded by a variety of background signals fromnon-plasmonic impurities in the sample, complicating dataacquisition and processing.
While several methods have been reported for measuringthe absorption of photons by single metal nanoparticles,8,31,38–41
the two most commonly used are photothermal imaging andspatial modulation spectroscopy. The former was pioneered by
Boyer et al.8 and later refined by Berciaud et al.11,39 as photo-thermal heterodyne imaging (PHI); an alternative and moreexplicit name, LISNA (Laser induced scattering around a nano-absorber), is also present in the literature.40 This method takesadvantage of the slight refractive index change resulting fromheat release around an excited object; any absorbers, includingplasmonic nanoparticles, can be detected at room temperaturewithout background interference. PHI has been used to measurethe absorption of supported Au particles as small as 5 nm indiameter42 and B1.4 nm (67 atom clusters),11 as well as 5 nm Agnanoparticles.39 Beyond fundamental studies of single nano-particles immobilized on a substrate, PHI is also a powerful,low background approach to detect freely diffusing nano-particles in complex media, as will be discussed in Section 3.43
The signal-to-noise ratio of photothermal microscopy44 cantypically be improved by increasing the power of the laser beamprobe, increasing the magnitude of the temperature-dependentrefractive index change of the surrounding medium (organicsolvents, thermotropic liquid crystals45), and thermally isolatingthe absorber from the glass substrate.
Spatial modulation spectroscopy (SMS) is another techniqueto characterize very small particles by monitoring the extinctionof a light beam (laser, white light, or supercontinuum) causedby the passage of a single nanoparticle, providing a singleparticle extinction spectrum (i.e. absorption and scatteringcombined). Fig. 2 provides a graphical description of thisprinciple, and further experimental details can be found in arecent review.12 Beyond measuring the absolute extinctioncross-section of single nanoparticles,12 SMS can characterizechanges in refractive index around particles via extinctionchanges.46
These two absorption-based techniques, PHI and SMS, canbe correlated with other types of spectroscopy or imaging,providing a powerful platform for the investigation of plasmonicproperties. The simultaneous acquisition of absorption (via PHI)and fluorescence data47 shows promise for applications inmultidimensional tracking and sensing, while correlation withelectron microscopy allows the study of fundamental size andshape effects.29 Such recent developments and growth of novelfar-field optical techniques provide new ways to study singleparticle absorption, hereby expanding the set of measurablesavailable to researchers for fundamental plasmonic investigationas well as applications in biological and other complex media.
2.1.3 Surface-enhanced effects. Plasmon resonances insmall metal particles induce strong electric fields at the particle/dielectric interface, typically orders of magnitude more intensethan the incoming radiation. This enhancement can be utilized toincrease the signal of optical spectroscopies such as Raman andfluorescence. Surface-enhanced Raman spectroscopy (SERS) is apowerful vibrational technique that allows for highly sensitive andselective detection of low concentration analytes through thisplasmonic amplification of electromagnetic fields. The electro-magnetic enhancement mechanism is generally believed to bethe primary contributor to the SERS effect, while the chemicalmechanism, which primarily results from charge transfer betweenthe metal and molecule, provides a minor enhancement effect.
Fig. 1 Dark-field microscopy. Left: schematic of the experimental geometryshowing the hollow cone of white light illuminating the sample. Right: real-colour image of the scattering from colloidal nanoparticles on glass. Left andright panels reproduced with permission from ref. 149 and 23, respectively.
Perspective PCCP
Publ
ishe
d on
04
Febr
uary
201
3. D
ownl
oade
d by
Nor
thw
este
rn U
nive
rsity
on
17/0
7/20
14 2
1:51
:56.
View Article Online

4114 Phys. Chem. Chem. Phys., 2013, 15, 4110--4129 This journal is c the Owner Societies 2013
In the electromagnetic enhancement mechanism, the regions ofhigh electromagnetic fields, known from near-field measurementand calculations to be located in gaps, crevices, and at sharpfeatures of nanoparticles, generate sites of high signal enhance-ment, commonly referred to as ‘‘hot spots’’ (Fig. 3). The hot spotphenomenon is a complex subject reviewed elsewhere.48,49 Typi-cally, the enhancement due to both mechanisms is reported as anenhancement factor (EF), which is calculated as a ratio between theSERS intensity and the normal Raman intensity of an analyte:49,50
EF = (ISERS/NSERS)/(INRS/NNRS)
where ISERS and INRS are the SERS and normal Raman scatteringintensities, respectively, and NSERS and NNRS are the number ofmolecules contributing to the scattering intensity, typicallycalculated as surface coverage in SERS and as a scatteringvolume in the solution for the normal Raman. In general, the
electromagnetic enhancement mechanism contributes EFs upto B108–109, while the chemical mechanism contributes EFs B102–103.50–54 Resonance Raman effects can further produce anenhancement on the order of 103–104.55,56 When multiplied(EFtotal = EFSERS � EFResRaman), these enhancements can yieldthe theoretically possible total EFs of 1014–1016.49,54,56–58 Thiscombination of SERS with the resonance Raman effect gave riseto the EFs B 1014–1015 reported in the first single moleculeSERS papers.57,59,60 Careful examination of experimental SERSEFs can generate information about the ‘‘average’’ electric fieldenhancement around a particle or cluster of particle, leading tobetter understanding of plasmonic phenomena. In addition tothis plasmonic characterization application, its small probingvolume and high signal enhancement make SERS powerful invery low concentration sensing.
Second harmonic generation (SHG) spectroscopy is anotherfar-field, surface-enhanced spectroscopy that can be used toprobe the plasmon-induced electric field enhancement. SHGis a non-linear optical process where photons interact with anon-linear material through which two photons are combinedto produce one photon with double the frequency (halfthe wavelength). An attractive surface and interface probingtechnique, SHG has unique advantages such as detection ofsub-monolayer coverage and sub-ps time resolution.61 Further-more, high-resolution imaging depths of hundreds of micronsare achievable by using wavelengths in the near-IR range.62
SHG has been most successfully used with imaging microscopy,which allows for high resolution and rapid data acquisition,especially when combined with laser scanning technology;direct visualization of sample structure, with no need forexogenous dyes or contrast agents, can be achieved. Also,because signals arise from induced polarization instead of, as
Fig. 2 Spatial modulation spectroscopy. (a) Experimental geometry showing incoming light focused close to the diffraction limit on the sample plane. (b) Spatiallyresolved transmission intensity change for a Au nanoparticle at l = 530 nm, with lock-in amplifier set at the position modulation frequency (f) and its first harmonic(2f). (c) Cross-section of the transmission change. Reproduced with permission from ref. 12.
Fig. 3 Finite element method calculation results for a L-shaped trimer SERSnanoantenna. The antenna-averaged electromagnetic enhancement (|Eexc|4) isplotted as a heat map demonstrating two hot spots located at the junctionbetween two spheres. Reproduced with permission from ref. 156.
PCCP Perspective
Publ
ishe
d on
04
Febr
uary
201
3. D
ownl
oade
d by
Nor
thw
este
rn U
nive
rsity
on
17/0
7/20
14 2
1:51
:56.
View Article Online

This journal is c the Owner Societies 2013 Phys. Chem. Chem. Phys., 2013, 15, 4110--4129 4115
in the case of fluorescence, from absorption, photobleachingand phototoxicity are reduced. Beyond imaging, intrinsic non-linear optical properties of nanoparticles such as hyperpolariz-ability and polarization-dependent behaviour can be measuredvia SHG.63,64
2.1.4 Dynamic particle tracking. Tracking the plasmonicresponse of a particle over a long period of time providesinformation about real-time diffusion coefficients,22 adsorbate-induced changes in the plasmon resonance maximum (LSPRlmax),
23 and effects of varying nanoparticle dimensions.25 Far-fieldimaging techniques, in particular scattering, are ideally suited todynamic tracking of nanoparticles because no direct contact withthe sample is required, and the addition of nanoparticles isbelieved to minimally interfere with biological processes.65 Noblemetal nanoparticles are easily trackable probes for differentsystems because of their large scattering cross sections at LSPRlmax, rendering them extremely bright. While the spatialresolution for discerning two identical nanoparticles is generallydiffraction limited (B250 nm),66 several strategies have beendeveloped to improve the spatial resolution of far-field techniques,which can now reach 1–10 nm. Such approaches include bindingof nanoparticles with fluorescence markers (generally referred toas fluorescence nanoscopy67), combination of high speed videomicroscopy with fluorescence,68 photothermal imaging,40 use ofimproved instrumentation such as liquid crystal22 or acousto-optic tuneable filters in conjunction with electron-multiplyingCCD cameras,69 combining dark-field microscopy with polariza-tion,70 and employing more intense white light (femtosecondwhite light continuum) sources.71 Under optimal conditions,some of these advanced techniques even allow the detection ofparticles a few nanometres in size, although for biologicalsystems, particles larger than 30 nm are more clearly visibleamongst the complex environment.65
2.1.5 Correlation with structural characterization. The finerelationships linking plasmonic response to the size, shape,and composition of metal nanoparticles allows for exquisitecontrol over their optical properties. Quantifying this depen-dence and unravelling its details is thus critical to both funda-mental understanding and application development. Inevitablestructural inhomogeneities in colloidal synthesis products,however, are major obstacles to the use of bulk solutions asonly general trends can be extracted from such ensemble-averaged measurements, rather than the quantitative relation-ships gained from single particle studies. Single particlefar-field approaches are well suited to optically characterize alarge number of individual particles as the data acquisition istypically fast and correlation with high resolution structuralmeasurements can provide the high quality information andlarge data sets necessary to extract quantitative relationships.
While simultaneous far-field optical response and structurecan be obtained, for example with total internal reflectionspectroscopy coupled with atomic force microscopy,72 the useof ex situ structural characterization dominates because of thesuperior structural resolution achieved by electron microscopy.Scanning and transmission electron microscopes (SEM andTEM) offer different advantages and limitations and are typically
chosen according to the sample studied. Structural characteriza-tion with SEM is completely substrate-general, although the bestimaging resolution can be achieved on a conductive supportfilm. Because of its transparency (allowing transmission geo-metries for optical characterization) and its conductivity, indiumtin oxide (ITO) is ideally suited for correlative work and isbroadly used despite some minor background (both in scatteringand imaging) due to surface roughness. When using a TEM,likely chosen because of its unmatched structural resolution oranalytical capabilities, electron transparent substrates arerequired. A variety of film composition can be purchased orfabricated, including formvar (polyvinylformal), amorphous carbon,graphene, SiOx, Si3N4, and Si; optical transparency is of course notan issue, but small grid spacing or deep etch pits can causeproblems by scattering strongly or blocking low angle incominglight. Substrate effects, due to the inhomogeneous environmentaround the particle73–76 can be eliminated, if desired, by immersingthe sample in a solvent with a matching refractive index.77
Particle retrieval techniques for correlated measurementsare essentially the same regardless of substrate. In most cases, agroup of particles of interest or region of interest is typicallyassociated with an easily retrievable marker, either random orfabricated. In the random case, large aggregates and particlelocation patterns78 provide guidance, sometimes in conjunc-tion with grid bars or asymmetric patterns built in the sub-strates.73,74,79–81 Examples of deliberate markers used includeITO etch pits milled with an ion-beam,24 lithographicallyfabricated metal patches,63 and alignment marks created byevaporation.30 Such markers allow easy retrieval of the particlesfor structural characterization after the optical experiments areperformed. Because of the low damage inflicted upon imaging atlow magnification in a SEM, rough structural characterizationcan be performed first (identifying aggregation state for example),without major effects on the optical properties.82 Damage,evidenced by plasmon frequency shifts and broadening, ishowever observed for most Ag nanoparticles as well as forprolonged imaging, such that control experiments are necessaryfor each new system. Note that due to damage and potentialcontamination yielding large redshifts of the LSPR resonance,83 itis impossible to image with a TEM before optical characterization.
Far-field optical methods such as scattering and absorptioncan thus provide information with high energy resolution,capable, when coupled to electron microscopy, of unravellingfine details of the size and shape-dependence of plasmonenergy, polarization, refractive index sensitivity, and plasmondecay. Additionally, SERS and other surface-enhanced spectro-scopies allow the quantification of the field enhancementaround the nanoparticle(s).
2.2 Near-field approaches to single particle characterization
While the far-field techniques discussed above provide accessto much-needed quantitative understanding of structuraleffects, their intrinsic diffraction-limited resolution impedesaccess to detailed information about the underlying electronoscillation phenomenon. A detailed knowledge of the position-dependent oscillation amplitude (which does not necessarily
Perspective PCCP
Publ
ishe
d on
04
Febr
uary
201
3. D
ownl
oade
d by
Nor
thw
este
rn U
nive
rsity
on
17/0
7/20
14 2
1:51
:56.
View Article Online

4116 Phys. Chem. Chem. Phys., 2013, 15, 4110--4129 This journal is c the Owner Societies 2013
peak at the same energy as the far-field observations asexplained in ref. 84) within and around the particle can unravelregions of high field enhancement critical to sensing perfor-mance optimization. This understanding can be gained usingvarious forms of electric field mapping which allow the directvisualization of the plasmon eigenmodes. Additionally, dipoleforbidden modes, which cannot be excited by far-fieldapproaches, are accessible via local excitation.85,86 Many techniquesexist, combining or relying solely on photons and/or electrons.Some of these have been reviewed recently,5,13,17,87 such that thissection will only briefly overview the standard techniques and mostexciting developments.
2.2.1 Near-field optical microscopy. Near-field opticaltechniques aim at improving the spatial resolution limits offar-field optical techniques while preserving their excellentenergy resolution by introducing a physical, optical probe inclose proximity to the particle,5,13,87–93 a concept first outlinedby Synge in 1928.94 Akin to topographical mapping, the spatialresolution of near-field optical techniques is largely determinedby the nature and sharpness of the probe.
In scanning near-field optical microscopy (SNOM), a tip isscanned a few nanometres above the sample deposited on anoptically transparent substrate, creating localized illumination,and the transmitted or emitted light is collected by either ahigh numerical aperture objective (positioned above or belowthe sample) or the tip itself.13 Reflective geometries have beendeveloped such that a variety of substrates can also be accom-modated.90 An important drawback of this technique is thepossible (and difficult to assess) distortion of near-fields causedby the presence of the probe, such that care must be taken tobalance spatial resolution (closer probes give better resolution)and near-field disruption (minimized by distant probes).
Traditional SNOM probes fabricated by chemical etchingand metal coating of a fibre followed by aperture fabricationyield emission aperture dimensions of the order of tens ofnanometres. This most common experimental geometry isreferred to as aperture-type SNOM, and its resolution is typicallyof the order of several tens of nanometres (50–100 nm).95 Recentadvances in tip fabrication and design have improved the spatialresolution of SNOM: a prominent development being that ofapertureless, or scattering-type SNOM13,87,96 which can reachless than 10 nm spatial resolution by using needle-like probes; asin scanning tunnelling microscopy resolution is determined bythe radius of curvature of the probe. Improvement in resolutionhave been predicted and observed using patterned tips acting aswaveguides.97–99
The flexibility of the light input and experimental geometryin SNOM allows for a large number of optical experiments, many ofwhich have been proposed or realized. Non-linear phenomenonproviding information on plasmon dynamics, such as two-photonluminescence,91,100,101 have been successfully coupled to SNOM.Ultrafast experiments are also possible.87 Overall, while the perturba-tion potential and limited spatial resolution of SNOM place it as adisadvantage compared to other near-field techniques, its widespectral range, excellent energy resolution and flexible measurementcapabilities ensure its lasting presence in the plasmonics field.
2.2.2 Photoemission. The interaction of photons withmetallic materials leads to electron emission when an energybeyond the workfunction can be reached, a phenomenonutilized in ultraviolet and X-ray photoelectron spectroscopy(UPS and XPS).102 When plasmonic metals are probed, how-ever, a significant increase in electron emission can occur dueto the local electric field enhancement produced by plasmonresonances, such that information on the near-field patternscan be obtained from the position-dependence of electronemission intensity. This capability is harnessed in a commonand commercially available approach called photoelectronemission microscopy (PEEM), which has been used to map,with a resolution down to 20 nm, the photoemission enhance-ment in a number of patterned surfaces,103–105 slits,106 and asmall number of single particles including crescents.107
Recent advances have coupled PEEM with 2-photon photo-emission as well as sophisticated interferometric pump–probeapproaches yielding improved contrast;104,108 coupling withfemtosecond excitation has also been achieved to probe ultra-fast processes,105,106,109–111 while aberration correctionimproved the lateral resolution down to a few nanometres.15,112
PEEM, however, can be a complex tool requiring sophisticatedelectron optics and special care to avoid distortions due tocharging. A diffraction-limited variant of the technique, scanningphotoionization microscopy (SPIM), has been developed and usedto study the behaviour of plasmonic particles such as rods andcubes;80,113–115 its high temporal resolution and relative simplicityare prominent advantages.
2.2.3 Cathodoluminescence. Electrons can be used as abroadband point dipole source to excite plasmon resonances,such that one can detect and locally map plasmonic behaviourby monitoring the events accompanying electron excitation.Photons are emitted by the probed material as a result of thisexcitation, a process called cathodoluminescence (CL). In CLspectroscopy, high spatial resolution is obtained by controllingat the nanometre level the position of the excitation beam; thedetection consists of measuring the number and the energy ofphotons emitted, usually through a large area detector orparabolic mirror.16,116 CL can be performed in both TEM andSEM, the latter being more common because of lower costs,easier implementation, and the ability to use thick or lowbackground substrates such as Si wafers.16 Spectrally resolvedCL yields either a spectra at each beam position or an image fora selected energy, while panchromatic CL (panCL) providesintensity-only information by collecting all the light emittedregardless of energy. The lateral resolution of the obtainedimages is typically quite large, however, as it is not only limited bythe size of the electron beam, but also by the potential emissionnear (not only at) the electron beam position, a fundamentalproperty of the CL process.16 Current best lateral and spectralresolutions are of the order of a few (5–10 nm) and a few tens(20–50) of nanometres, respectively.16,17 Scanning tunnellingluminescence, a modification of scanning tunnelling microscopy,shows promise toward improving the spatial resolution. However,the required short tip–sample distance can be a problem forobserving particles of plasmonically relevant sizes and shapes.117
PCCP Perspective
Publ
ishe
d on
04
Febr
uary
201
3. D
ownl
oade
d by
Nor
thw
este
rn U
nive
rsity
on
17/0
7/20
14 2
1:51
:56.
View Article Online

This journal is c the Owner Societies 2013 Phys. Chem. Chem. Phys., 2013, 15, 4110--4129 4117
2.2.4 Electron energy loss microscopy. Electrons can transferenergy to a nearby metallic particle to excite a plasmonicresonance, such that detecting the change in energy, i.e. energyloss, of transmitted electrons provides a high spatial resolutionapproach to obtain a scattering probability map in and arounda single metallic nanoparticle. As in CL spectroscopy, twotechniques can be utilized to unravel information about theelectron oscillation behaviour of a nanoparticle: scanningtransmission electron microscopy electron energy loss spectro-scopy (STEM-EELS)85,118,119 or energy-filtered transmissionelectron microscopy (EF-TEM).120 In the former, a small electronbeam (B1 nm in diameter) is scanned across the sample, anda full energy-loss spectrum is acquired at each point. Fielddistributions for each peak can then be reconstructed from peakfitting. In the latter, a full image is acquired at a small specificelectron energy window, and a spectrum can be obtained byextracting the intensity of a pixel or sets of pixels from eachimage across the entire energy range studied. EF-TEM imagesprovide superior spatial resolution but can be difficult to analysebecause of mode overlap over the energy window selected(typically 0.2 eV or higher). Not surprisingly, such electronmicroscopy-based techniques have gained tremendous popularityin the last decade;85,118,119,121,122 their resolution improvementsclosely followed that of electron microscopes, in particular theimplementation of aberration correction (both spherical andchromatic) and monochromation, such that this approach nowhas the highest routine spatial resolution of all near-fieldtechniques.
Recent advances allowed the coupling of this powerful fieldmapping approach with tomography, aiming to reconstruct a3-dimensional map by obtaining images at various tilt angles.Such experiments are expected to provide rich information onthe fine details of plasmonic resonances in single and coupledparticles.123,124 Time-resolved experiments using pulsed electronbeams may also become a reality in the near future.
As seen above, several techniques are available to probe theplasmonic behaviour of single metal nanoparticles, each with adifferent combination of spatial resolution, spectral resolution,expansion capabilities and ease of use and implementation.Such complementarity allows for the acquisition of a fullspectrum of information on single particle optical behaviour.Upcoming developments are expected to improve the experimentalthroughput and render results more accurate and detail-rich.
3. New knowledge from single particlemeasurements
The tremendous advances in instrumentation described above,coupled with major synthetic breakthroughs, made many novelexperiments possible in the last ten years. As a result, funda-mental properties of plasmon resonances, such as their decay,dependence on structural factors, and near field distribution arenow better understood. Applications such as particle tracking andnanosensing have also flourished, allowing the study of complexsystems such as catalytic reactions and biological processes.
In the following section, we will highlight several recent examplesof fundamental studies and applications using single particleapproaches to give the reader an exciting and up-to-date overviewof the field.
3.1 Far-field spectroscopy studies of plasmonic behaviour
Tuning of the optical properties of metal nanoparticles can beefficiently achieved by controlling their shape and size. Forexample, the longitudinal LSPR resonance of Au rods of differentaspect ratio can span the visible and near-IR spectrum,32,77,125–127
while changing the size of Ag cubes from 50 to 200 nm (side length)shifts their dipolar resonance from approximately 450 to800 nm.128–130 Such tuning is essential for many applications wherethere exists an optimal plasmon resonance frequency, such as insurface-enhanced spectroscopies58–60,131–135 and sensors based onmolecular resonance coupling.136,137
The details of the size and shape dependence of theplasmon resonance energy and width are inherently blurredin bulk measurements because of the unavoidable inhomogeneityof colloidal reaction products. Single particle optical experiments,when coupled with structural information as described earlier inSection 2.1.5, provide a powerful approach to unravel the details ofthe structure–function relationships in plasmonic nanoparticles.Since the initial experiments of Mock et al.138 showing largespectral differences between silver spheres decahedra, andtriangles, single particle dark-field microscopy coupled withelectron microscopy has been used on a large number of shapessuch as triangles,28,79,139,140 decahedra,24,79 cubes,73,74,80
cages,141 spheres,29,142 shells,143 and rods.25,77 In the studiesmentioned above, single particle approaches uniquely characterizedand quantified the effects of size and shape on the plasmonicbehaviour of nanoparticles, and allowed the study of propertiesinaccessible with bulk measurements, such as plasmon decay andpolarization effects. Recent examples highlighting these uniquecapabilities are presented below; additional discussion and reviewof earlier work can be found elsewhere.83,139
3.1.1 Quantitative effects of size and shape on plasmonenergy and intensity. Shape and size are well known toinfluence LSPR behaviour, however only recently quantitativeinformation suitable to provide valuable guidance for applicationdevelopment has appeared. Tcherniak et al.29 have measured,using a combination of dark-field microscopy, PHI and SEM, theexact scattering/absorption ratio for the dipolar resonance of Auspheres. Their results are in perfect agreement with predictionsfrom Mie theory and directly impact fields where Au nanoparticlesact as photothermal devices. Quantitative plasmon energy andlinewidth size-dependence characterization has been performedfor sharp Au cubes, decahedra, icosahedra, triangles, andoctahedra, such that the influence of shape on size effectswas extracted.79 The change in dipolar plasmon energy for agiven size increase was found to be constant for all shapeswhen the dipolar resonance pathlength was used as the sizeparameter (the distance between poles of opposite charge);the simplicity of this dipolar behaviour provides tremendouspredictive power for the size-dependence of arbitrary shapes.Going beyond dipolar resonances, single particle spectroscopy
Perspective PCCP
Publ
ishe
d on
04
Febr
uary
201
3. D
ownl
oade
d by
Nor
thw
este
rn U
nive
rsity
on
17/0
7/20
14 2
1:51
:56.
View Article Online

4118 Phys. Chem. Chem. Phys., 2013, 15, 4110--4129 This journal is c the Owner Societies 2013
uniquely allows accurate characterization of higher ordermodes often ill-separated in bulk spectra. The quadrupolarresonance of Ag cubes was characterized73–75 and its size-dependence was found to be significantly smaller than that ofthe dipolar resonance,73 as predicted by numerical simula-tions.144 Recently, Wei et al. characterized size effects on theplasmon resonances in nanorice, a quasi-one-dimensionalstructure capable of supporting modes up to l = 4.145–147 Asseen in Fig. 4, plasmon energy size-dependence is very linearand less pronounced for higher order modes. In this study, thewidth of the particles was fixed at 60 nm, such that a singlestructural parameter, the length, could be isolated and variedover the range 200–600 nm; excellent agreement with boundaryelement method (BEM) results was obtained. Single particlestudies can also quantitatively probe the effect of simultaneousstructure and size effects as was performed for Ag–AgO shells148
and Ag bipyramids.149 In such cases multiparameter fits mustbe used, requiring large data sets. With the development andimprovement of high throughput single particle approaches(wide field, ultramicroscopy, etc.), more such studies are likelyto appear.
3.1.2 Size and shape effects on plasmon polarization.Far-field plasmon polarization, which reveals mode symmetryas well as particle anisotropy and orientation, can efficiently beprobed by single particle approaches as they overcome the
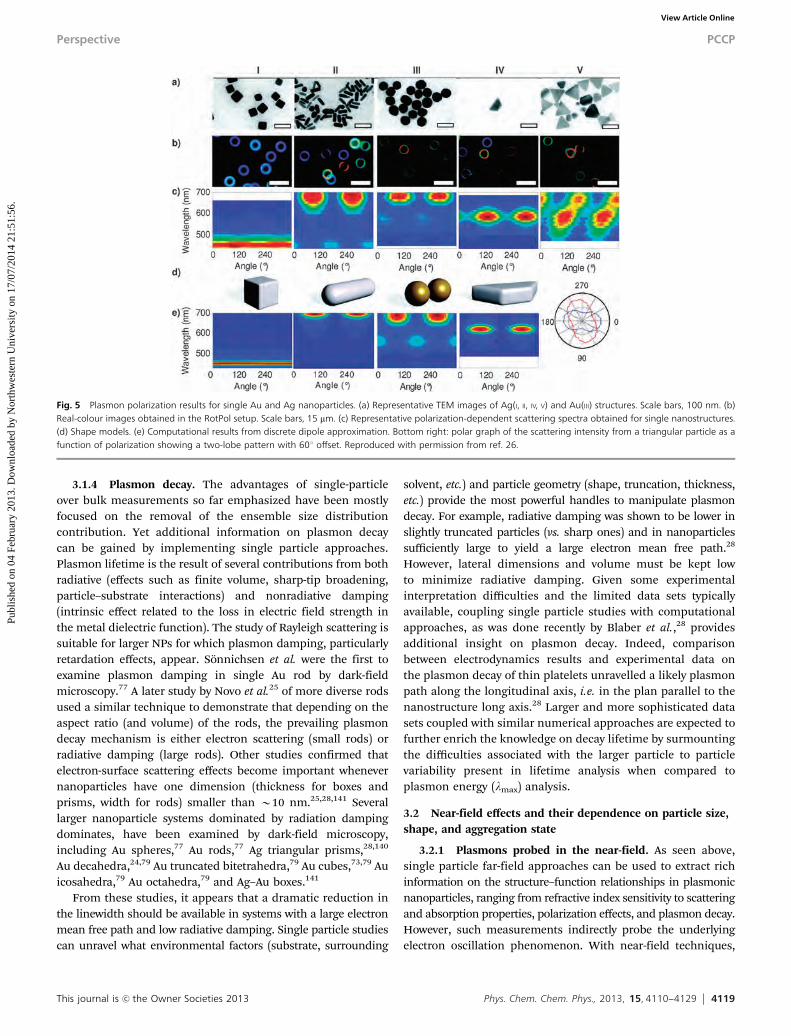
random orientation of bulk samples. Polarization-dependentspectra from an ensemble of templated or oriented particlescan be obtained;150 however, single particle spectroscopy canuniquely provide quantitative information on the magnitude ofthe intrinsic polarization-induced scattering intensity variationand mode selectivity. By combining dark-field microscopywith a variable wavelength interference filter and a rotatingpolarizer, a technique referred to as RotPol, Schubert et al.26
probed the scattering of single Ag and Au nanoparticles andparticle pairs as illustrated in Fig. 5. The polarization aniso-tropy for Au rods was found to vary as a function of rodresonance wavelength, a result in agreement with numericalcalculations; these rods could be monitored during overgrowthto rounder particles, a process leading to a gradual decrease inresonance wavelength and polarization anisotropy. The authorsalso reported strong plasmon polarization for Ag triangles andAu sphere dimers, and observed no polarization for Ag cubes.Recent results confirm the latter in dark-field optical micro-scopy; however, when probed by scanning photoionizationmicroscopy (where the cube absorbs 4 photons and emits anelectron), a strong polarization dependence was observed.80
Correlated structural measurements confirmed that the photo-emission was enhanced when the laser polarization wasaligned with the cube corners, strongly supporting coherentmultiphoton photoelectron emission as the mechanismresponsible for electron emission from Ag nanoparticles andruling out thermionic and incoherent pathways.80
Polarization effects can also be observed by incorporating apolarizer in the beam path of a dark-field setup, either before82
or after the sample.30 Using the latter, Nehl et al. studied therather complex behaviour of Au stars and correlated the orien-tation of most intense scattering with the position of largeprotrusions.30 Using the former, the scattering intensity for thelowest energy mode (longitudinal) of rods and linear sphereassemblies was found to peak when the polarization is alignedalong the long axis.77,82
3.1.3 Refractive index sensitivity of single nanoparticles. Aprominent feature of small metal particles is their nanosensingcapabilities enabled by the sensitivity of their plasmon reso-nance energy to the surrounding medium. Small changes insize and shape strongly influence the refractive index sensitivity(RIS), such that single particle studies can uniquely provideinsight and quantitative relationships between structuralfactors and sensing performance. Early studies by Mock et al.on random colloids138,151 demonstrated a large (factor of 1.5)variation in RIS from particle to particle. While no directstructural correlation was performed, it was inferred fromprevious scattering data that the RIS increased from spheresto triangles to rods. Work by Sherry et al.75,152 furthershowed that RIS can vary nearly as much for particles withnominally similar shapes and plasmon resonance frequencies,highlighting the importance of minute changes in size andcorner rounding. Such acute dependence could be character-ized quantitatively via correlated single particle RIS measure-ments and structural characterization, a difficult yet achievableexperiment.
Fig. 4 Size dependent far-field response of Au nanorice. Top: peak positionrelationship to particle length, where the black dots are experimental scatteringdata from correlated dark-field microscopy and scanning electron microscopy,and the coloured background is boundary element method results for theextinction cross-section of 60 nm diameter particles. Bottom: extinction coeffi-cient calculated for a nanorice with length of 400 nm (white line in top panel).Reproduced with permission from ref. 147.
PCCP Perspective
Publ
ishe
d on
04
Febr
uary
201
3. D
ownl
oade
d by
Nor
thw
este
rn U
nive
rsity
on
17/0
7/20
14 2
1:51
:56.
View Article Online
This journal is c the Owner Societies 2013 Phys. Chem. Chem. Phys., 2013, 15, 4110--4129 4119
3.1.4 Plasmon decay. The advantages of single-particleover bulk measurements so far emphasized have been mostlyfocused on the removal of the ensemble size distributioncontribution. Yet additional information on plasmon decaycan be gained by implementing single particle approaches.Plasmon lifetime is the result of several contributions from bothradiative (effects such as finite volume, sharp-tip broadening,particle–substrate interactions) and nonradiative damping(intrinsic effect related to the loss in electric field strength inthe metal dielectric function). The study of Rayleigh scattering issuitable for larger NPs for which plasmon damping, particularlyretardation effects, appear. Sonnichsen et al. were the first toexamine plasmon damping in single Au rod by dark-fieldmicroscopy.77 A later study by Novo et al.25 of more diverse rodsused a similar technique to demonstrate that depending on theaspect ratio (and volume) of the rods, the prevailing plasmondecay mechanism is either electron scattering (small rods) orradiative damping (large rods). Other studies confirmed thatelectron-surface scattering effects become important whenevernanoparticles have one dimension (thickness for boxes andprisms, width for rods) smaller than B10 nm.25,28,141 Severallarger nanoparticle systems dominated by radiation dampingdominates, have been examined by dark-field microscopy,including Au spheres,77 Au rods,77 Ag triangular prisms,28,140
Au decahedra,24,79 Au truncated bitetrahedra,79 Au cubes,73,79 Auicosahedra,79 Au octahedra,79 and Ag–Au boxes.141
From these studies, it appears that a dramatic reduction inthe linewidth should be available in systems with a large electronmean free path and low radiative damping. Single particle studiescan unravel what environmental factors (substrate, surrounding
solvent, etc.) and particle geometry (shape, truncation, thickness,etc.) provide the most powerful handles to manipulate plasmondecay. For example, radiative damping was shown to be lower inslightly truncated particles (vs. sharp ones) and in nanoparticlessufficiently large to yield a large electron mean free path.28
However, lateral dimensions and volume must be kept lowto minimize radiative damping. Given some experimentalinterpretation difficulties and the limited data sets typicallyavailable, coupling single particle studies with computationalapproaches, as was done recently by Blaber et al.,28 providesadditional insight on plasmon decay. Indeed, comparisonbetween electrodynamics results and experimental data onthe plasmon decay of thin platelets unravelled a likely plasmonpath along the longitudinal axis, i.e. in the plan parallel to thenanostructure long axis.28 Larger and more sophisticated datasets coupled with similar numerical approaches are expected tofurther enrich the knowledge on decay lifetime by surmountingthe difficulties associated with the larger particle to particlevariability present in lifetime analysis when compared toplasmon energy (lmax) analysis.
3.2 Near-field effects and their dependence on particle size,shape, and aggregation state
3.2.1 Plasmons probed in the near-field. As seen above,single particle far-field approaches can be used to extract richinformation on the structure–function relationships in plasmonicnanoparticles, ranging from refractive index sensitivity to scatteringand absorption properties, polarization effects, and plasmon decay.However, such measurements indirectly probe the underlyingelectron oscillation phenomenon. With near-field techniques,
Fig. 5 Plasmon polarization results for single Au and Ag nanoparticles. (a) Representative TEM images of Ag(I, II, IV, V) and Au(III) structures. Scale bars, 100 nm. (b)Real-colour images obtained in the RotPol setup. Scale bars, 15 mm. (c) Representative polarization-dependent scattering spectra obtained for single nanostructures.(d) Shape models. (e) Computational results from discrete dipole approximation. Bottom right: polar graph of the scattering intensity from a triangular particle as afunction of polarization showing a two-lobe pattern with 601 offset. Reproduced with permission from ref. 26.
Perspective PCCP
Publ
ishe
d on
04
Febr
uary
201
3. D
ownl
oade
d by
Nor
thw
este
rn U
nive
rsity
on
17/0
7/20
14 2
1:51
:56.
View Article Online

4120 Phys. Chem. Chem. Phys., 2013, 15, 4110--4129 This journal is c the Owner Societies 2013
electric field potential maps providing the details of the electronresonance pattern can be obtained. Shape effects can thus bevisualized directly as different geometric distribution of theelectric field potential in and around the particle. This isof particular interest for fundamental studies on plasmonicbehaviour as well as in the optimization of substrates for surface-enhanced spectroscopies. Indeed, as will be discussed later, theregions of high field intensity are believed to provide most of thesignal enhancement in, for example, SERS,48,51,153–156 such thatquantifying the intensity and size of such ‘‘hot spots’’ is of criticalimportance. Any of the techniques described in Section 2.2 can beused to produce such electric field maps, with various levels ofresolution (Table 1). Note that there exists a growing discussionabout the exact nature of the observed signal in near-fieldapproaches.157,158 However this section will focus on twoprominent types of information uniquely obtained by near-field techniques; the reader is referred to recent reviews forfurther and more specialized discussion.92,139,159
Amongst the unique aspects of plasmonic behaviour thatcan be probed in the near-field are ultralocal variations of theelectric field due to differences in corner sharpness withinthe same particle. Indeed, large changes in field intensity atthe tips of Ag triangles and cubes have both been observed.EELS studies of the former showed that a higher corner angle(larger radius of curvature) leads to lower field concentration:the 76.51 corner had the weakest interaction with the electronbeam, followed by the shaper 59.51 and 441 corners.119 Similareffect were observed and calculated for cubes, in which theabsorption resonance at different corners was found to bemostly independent of each other and rather be dictated bythe local shape and environment.121
Another unique capability of near-field approaches isthe possibility to gain profound understanding of high order
(high energy) modes, for which the field distribution is not asobvious and symmetric as for dipolar modes. Such plasmonresonances can be visualized by observing the electric fieldsaround a particle at a specific, narrow energy range such thatthe overlap from other modes is minimized. Exquisite detailcan be obtained using energy-filtered TEM imaging; a recentexample in Fig. 6 shows the field distribution for the m = 1 tom = 6 modes in a Ag rod.120 Similar results have beenobtained, albeit with much more limited spatial resolution,using cathodoluminescence160 and two-photon-induced lumi-nescence.101,161 Near-field mapping also provides access to‘‘dark modes’’, i.e. modes which cannot be excited in the farfield because of their lack of net dipole moment. Koh et al., forexample, recently used STEM-EELS to probe the plasmonmodes in fabricated nanoantennas made of one to threetriangular structures, revealing both dark and bright modeswithin their rich coupling patterns.85
3.2.2 Field enhancements studies from far-field spectro-scopy. Studies correlating near-field and/or far-field micro-scopies (including TEM, SEM, AFM, and LSPR imaging) withSERS and other enhanced spectroscopies have allowed forinterrogation of the effect of nanoparticle shape and aggrega-tion on field intensity. ‘‘Single’’ particle SERS is somewhat of amisnomer, as it is generally agreed that most monomer nano-particles do not provide sufficient EFs (>104).162 Generally,‘‘single’’ particle SERS involves dimers, trimers, and higherorder aggregates, either bare or coated with silica, to providethe hot spots necessary for generating significantly enhancedelectromagnetic fields.156,163,164 From studies of dimers andtrimers of 150 nm spheres, it was found that EFs do notcorrelate with aggregation state. Instead, only a single hot spotseems necessary for significant enhancement.156,164 It was alsofound, as shown in Fig. 7, that there is no direct correlation
Fig. 6 Energy-filtered transmission electron micrographs of a single Ag rod obtained in a monochromated Zeiss SESAM FEG-TEM operated at 200 keV with an energyselecting slit of 0.23 eV. Modes from the fundamental (m = 1) to the m = 6 mode are clearly visible. The intensity of the energy-loss maps is shown as a temperaturecolour scale. Reproduced with permission from ref. 120.
PCCP Perspective
Publ
ishe
d on
04
Febr
uary
201
3. D
ownl
oade
d by
Nor
thw
este
rn U
nive
rsity
on
17/0
7/20
14 2
1:51
:56.
View Article Online

This journal is c the Owner Societies 2013 Phys. Chem. Chem. Phys., 2013, 15, 4110--4129 4121
between the LSPR lmax (a far-field effect) and the SERS max-imum EF (a near-field phenomenon) when the system is hotspot dominated.
Recent advances in nanoparticle synthesis has resulted inincreasingly successful attempts to create hot spots in singlenanoparticles by synthesizing shapes with extremely sharp features,including stars,165 spiked gold beads,166 cubes,167,168 and octopodstructures.168 Fig. 8a shows a Raman signal map overlaid on thecorresponding SEM image, confirming the single particle origin ofthe signal. Fig. 8b shows an example of the Raman spectra used togenerate the map, clearly showing that the highest signal intensity isobtained with the etched octahedral particles.168 The authors alsotested the wavelength dependence of the enhancement produced bytheir particles, and found that compared with excitation at 514 nm,the mildly etched particles had a higher SERS signal intensity at633 nm, while the octopod particles demonstrated a higher intensityat 785 nm, with EFs B5 � 105, i.e. an order of magnitude betterthan most monomers. To date, the best effort for achieving highlyenhancing single particle SERS utilized LSPR spectroscopy, highresolution STEM, EELS, SEM and SERS, to demonstrate thatattaching single Au stars to surface-bound 1,5-naphtalenedithiolmolecules formed intense hot spots between the nanostar tips andthe optically thick Au substrate. The low concentration of moleculeson the surface insured that only one or two molecules would reachthe hot spot, such that the EFs calculated for the stars were on theorder of 1010, three orders of magnitude higher than for dimers ofspheres (EFs B 107).165 An important issue to note is that nano-particles such as stars, cubes and triangles, all with sharp corners, aswell as rods, are more highly sensitive to polarization orientation
than more truncated structures.167,168 Thus, when performing singleparticle SERS measurements with non-spherical structures, it iscritical to take laser polarization into account.164,167,169 Such studiesindicate the possibility of achieving highly enhancing structuresfor true single particle SERS, given the appropriate nanoparticlegeometry and laser polarization.
Another approach to probing the electric field on nano-particles, second harmonic generation (SHG) imaging, has beenused to characterize type I collagen fibres in extracellularmatrices, connective tissue, and internal organs.62 Generally inSHG, spherical nanoparticles are more easily observed as trimersthan dimers because of symmetry, although if the particles arenot spherical dimers and trimers have comparable activity.63 Jinet al.63 showed that SHG is symmetry forbidden for bulk samplessuch as silver due to the inversion symmetry in bulk silver. It is,however, possible for SHG at the single silver particle level, dueto both the surface contribution, and the enhancement from theplasmon resonance. Indeed, excitation along the longitudinalaxis of the rods created the SHG response through nonlinearityin the polarization.63 Because SHG can be used to interrogate thenonlinear properties of nanoparticle systems and is sensitive topolarization effects at the single particle level, it is expected toevolve as an important tool in nanotechnology.
3.3 Monitoring chemical and biological processes with theplasmonic response of single nanoparticles
As previously illustrated in this paper, monitoring the shift inlmax of a nanoparticle is a relatively easy way to measurechanges of the nanoparticle itself (size and shape) or its
Fig. 7 (a) SERS enhancement factors (EFs) for 30 single Au sphere aggregates as a function of number of cores. (b) Average EF for each number of cores showconstant behavior regardless of the number of hot spots present. (c) Lack of correlation between EF and dipole plasmon resonance energy. (d) Calculated h|Eexc|4i for adimer structure as a function of the interparticle separation; at lex = 633 nm, the average EM enhancement increases by B2 orders of magnitude with decreasing gapsize. Reproduced with permission from ref. 156.
Perspective PCCP
Publ
ishe
d on
04
Febr
uary
201
3. D
ownl
oade
d by
Nor
thw
este
rn U
nive
rsity
on
17/0
7/20
14 2
1:51
:56.
View Article Online

4122 Phys. Chem. Chem. Phys., 2013, 15, 4110--4129 This journal is c the Owner Societies 2013
surrounding environment, even allowing the tracking ofchemical events at the surface of single particles via dark-fieldmicroscopy or photothermal imaging. The potential for monitoringsurface binding events is of great interest for fields such ascatalysis, materials science, biology, and biochemistry, such thatmany exciting new developments have emerged recently; we high-light some of the most important ones below.
Nanoparticle oxidation can be tracked optically using theirplasmonic signature. Oxidation of Cu has been observedon triangular nanoparticle arrays fabricated by nanospherelithography170 and more recently continuously monitored inreal time at the single nanoparticle level by dark-field micro-scopy.171 Cheng et al. were able to identify heterogeneousreaction pathways and intermediate states of the oxidationkinetics of cetyltrimethylammonium bromide (CTAB)-coatedAu rods by H2O2 in the presence of Br172 by studying singleparticle scattering with dark-field microscopy. They found thatmild oxidation happens likely at the tips of the rods (where theCTAB capping layer is less dense) resulting in a shortening oftheir length well matching the observed blue-shift of the long-itudinal LSPR peak. By monitoring heterogeneous reactionrates as well as reaction pathways, a self-catalysis mechanismpreviously hindered by ensemble-averaged measurements wasrevealed. Alternatively, it is possible to externally control theplasmonic signature by applying an electrochemical potential;the colour change is visible in dark-field microscopy.173 Theamplitude of the spectral shifts was observed to vary with theparticle morphology, being most influenced by the presence oftips or any other electromagnetic field hot spots that areexpected to have higher rates of electron transfer. Colourchanges in Au rods were of such magnitude to be observable
by eye when the potential was stepped from �1.0 V to �1.6 V(Fig. 9).
Direct observation of chemical reactions on single Auparticles by dark-field microscopy was first reported by theMulvaney group.174 By correlating the shift in LSPR lmax andthe change in the nanoparticle electron density, they achieved aquantitative description of Au-catalysed oxidation of ascorbicacid by dissolved oxygen at the nanoparticle surface. Morespecifically, the resonance shift observed for one nanoparticlein one redox cycle can be related to the number of O2 moleculesinvolved in the reaction per second, given knowledge of thenumber of atoms in the structure (volume derived fromTEM images) and the reaction stoichiometry. Ultimately, thisstudy demonstrated another great application of dark-field
Fig. 8 Surface-enhanced Raman scattering of benzenethiol on single Ag nanoparticles. (a) SEM image of particles overlaid with SERS intensity map of the 1584 cm�1
mode of benzenethiol. (b) SERS spectra for each shape particle obtained with 633 nm excitation. (c) Average single particle SERS intensity as a function of shape andexcitation wavelength. Reproduced with permission from ref. 168.
Fig. 9 Real colour image from dark field microscopy showing the electricpotential induced shift in scattering lmax for single Au nanoparticles (red = rods,green = spheres or triangular prisms). Reproduced with permission from ref. 173.
PCCP Perspective
Publ
ishe
d on
04
Febr
uary
201
3. D
ownl
oade
d by
Nor
thw
este
rn U
nive
rsity
on
17/0
7/20
14 2
1:51
:56.
View Article Online

This journal is c the Owner Societies 2013 Phys. Chem. Chem. Phys., 2013, 15, 4110--4129 4123
microscopy, namely its capability to directly quantify redoxreactions in plasmonic nanoparticles.
Other chemical reactions have since been monitored, suchas the generation of hydrogen by photodecomposition of lacticacid at the surface of cubic particles made of platinizedcadmium sulfide with gold cores (Au@Pt/CdS) by dark-fieldmicroscopy.175 Hydrogen detection was also central to a studyby Liu et al.,176 which monitored indirectly the change inducedby the adsorption of hydrogen molecules on Pd posts located10 to 50 nm apart from a single Au triangle or rod. While Pdgreatly absorbs hydrogen, it is a weak plasmonic material suchthat a broad and damped scattering spectrum is observed bothin the presence and absence of hydrogen. In the close presenceof Au, however, a nanofocusing effect (optical nanoantennaeffect) increases the lmax shift of the Pd nanoparticle, asillustrated in Fig. 10. Such robust plasmonic detection of alow-mass gas demonstrates that nanoantennas based on thecontrolled assembly of nanoparticles are promising for mole-cular sensing and single-molecule detection.
Single molecule detection, the ultimate sensitivity limit, hasrecently been demonstrated for plasmonic systems via theadsorption of large single proteins (with molecular weightabove 53 kDa) at the surface of single Au rods. This experimentwas rendered possible by clever, tip-specific functionalizationof the particles with receptors. In this study by Zijlstra et al.,10
the shift of the longitudinal surface plasmon resonance at asingle frequency was monitored by photothermal imaging. Thesingle-molecule nature of the binding events is illustrated in
Fig. 11, where the normalized photothermal signal and relativeplasmon resonance frequency shift is reported over a 800 speriod during which the protein (streptavidin–R-phycoerythrinconjugate) is put in the vicinity of the nanoparticle. Interestingly,the approach of molecules that leave the probing volume withintens of seconds can be observed. Method generality wasestablished by probing three different biotin-binding proteins(streptavidin, antibiotin, and a streptavidin–R-phycoerythrinconjugate) as well as different single rods. The Sonnichsengroup also reported single-molecule adsorption events on asingle plasmonic sensor. Using a dark-field optical microscopeequipped with a white light laser source and intensified CCDcamera detector, they monitored the LSPR lmax shift in thescattering spectrum of single Au rods induced by the binding offibronectin.7 Single Au rod scattering spectra could be obtainedwithin a few milliseconds with an impressive spectral resolution of0.03 nm (after fitting the spectral resonance). The simple structureof both sensors (single nanoparticle) makes such approach attrac-tive as it avoids any fabrication/assembly difficulties while reachingunprecedented detection capabilities.
3.4 Nanoparticle tracking
Dark-field microscopy is, as discussed in many parts of thisarticle, a robust and flexible tool easily integrated in multi-component/multi-instrument studies. Because of its fast speedand high sensitivity to plasmonic scattering, it provides aunique and highly effective method for the investigation ofthe dynamic motion of nanoparticles under various, potentiallycomplex conditions such as biological media. Combining LSPRimaging with a wavelength selector (liquid crystal tuneable filter),Bingham et al.22 characterized the plasmonic response and motionof diffusing nanoparticles, and recorded the scattering of multipleB35 nm Ag nanoparticles and B100 nm Ag prisms in parallel.Such high-throughput method is extremely attractive for singleparticle studies as it provides LSPR information and diffusioncoefficients simultaneously and in real-time.22
Using high speed video microscopy (video rate of 25 ms) andfluorescence, Fujiwara et al.68 tracked a 40 nm Au nanoparticlefunctionalized with a lipid (1,2-dioleoyl-sn-glycero-3-
Fig. 10 Antenna-enhanced hydrogen sensing using a Au triangular platelet anda Pd nanoparticle separated by a 10 nm gap. The left diagram shows thescattering spectrum of the nanoantennas for the different hydrogen pressurevalues; the hydrogen partial pressure is raised first from 0 Torr to higher pressures(cycle 1) and then driven back to 0 Torr (cycle 2). The right diagram shows thebehaviour of the resonance peak on hydrogen cycles 1 and 2. An SEM image ofthe nanostructure is shown in the lower right. Scale bar, 50 nm. Reproduced withpermission from ref. 176.
Fig. 11 Time trace of normalized photothermal signal and relative LSPR shift forbiotin-functionalized single Au rods in the presence of different concentrations ofa streptavidin–R-phycoerythrin conjugate. Because of the single wavelengthmeasurement performed, the right-hand axis corresponds to an estimate ofthe LSPR redshift deduced from the linewidth of the individual rods. Reproducedwith permission from ref. 10.
Perspective PCCP
Publ
ishe
d on
04
Febr
uary
201
3. D
ownl
oade
d by
Nor
thw
este
rn U
nive
rsity
on
17/0
7/20
14 2
1:51
:56.
View Article Online

4124 Phys. Chem. Chem. Phys., 2013, 15, 4110--4129 This journal is c the Owner Societies 2013
phosphoethanolamine (DOPE)) in the cell membrane. Theyobserved that the cell membrane is compartmentalized withrespect to lateral diffusion of phospholipids. This compartmen-talization confines the nanoparticle–DOPE complex within acompartment, limiting long-range diffusion. Actin-basedmembrane skeleton, regulating membrane compartmentboundaries, was thus involved in the process, a finding sup-ported by the simple Brownian diffusion of the nanoparticle–DOPE complex in areas of the membrane where the skeleton wasfound to be depleted. Other studies involving membranesinclude that of the rotary molecular motors comprising F0F1
ATP synthase with Au rods.70 Unlike single molecular Forsterresonance energy transfer or attaching actin filaments or nano-particles to the rotor, i.e. techniques which are hampered bylimited time and angular resolution as well as having longacquisition times, dark-field microscopy combined with polar-ization effects allows for shorter data acquisition times,improved time resolution (5 ms), and a superior signal-to-noiseratio. This time resolution and signal intensity resulted in theelucidation of the F0 Brownian ratchet mechanism, as well as theobservation of transient dwells from interaction between the F0
rotor and the F0F1 complex.Rods are prominent in tracking studies because polarized
light can give information about their orientation. Sonnichsen
et al.33 utilized this feature to track the 2D orientation of Aurods confined at a glass–water interface. The fastest rotationaldiffusion times recorded were B60 ns, with the local viscositydominated by particle–surface interactions. They also foundthat some particles were ‘‘sticky’’ (attaching to the surface) andhence had longer diffusion times.
The tracking of nanoparticles quickly became of interest toin vivo studies because of the widespread possible applicationsin live cells such as biosensing, drug delivery, diagnostics, andtherapeutics.65,177 Indeed, nanoparticle tracking combines theadvantages of single particle and single molecule tracking,namely the unlimited observation time due to lack of photo-bleaching and the absence of disruption to the surroundingenvironment due to the small size of the marker. Absorption-based imaging (LISNA) allowed for 2D tracking of 5 nmAu spheres in the planar membrane of live cells,40 yieldinginformation about the protein lateral diffusion at greater signalintensities than with fluorescence. Utilizing a fs white lightcontinuum with dark-field microscopy, Louit et al.71 monitoredthe interaction of 80 nm Au spheres with living mouse fibro-blast cells, observing diffusion of B5 mm over an hour timeperiod. Changes in the particle scattering maximum positionand intensity of interferences correlated with exo- and endocytoticprocesses: changes in nanoparticle height of 1–2 mm within the cell
Fig. 12 Orientational mapping using dark field microscopy. Far left: measured dark-field images from four Au rods. Left: best-fit simulated dark-field images. Right:3D intensity distribution plots including contour plots and blue dots representing measured values and showing good agreement with simulated data. Far right: 3Dorientation models of the corresponding rods. Reproduced with permission from ref. 179.
PCCP Perspective
Publ
ishe
d on
04
Febr
uary
201
3. D
ownl
oade
d by
Nor
thw
este
rn U
nive
rsity
on
17/0
7/20
14 2
1:51
:56.
View Article Online

This journal is c the Owner Societies 2013 Phys. Chem. Chem. Phys., 2013, 15, 4110--4129 4125
along with increased cell background signal and interferences wereindicators of the nanoparticle undergoing endocytosis, providing atool to track such interactions.
Beyond membrane diffusion and cytosis, nanoparticlestracking can unravel details about intracellular transport.Incorporating a quadrant photodiode and a feedback-looped piezostage (to maintain position) to dark-field microscopy, Nan et al.178
resolved individual steps of the molecular motors kinesin anddynein using 100–150 nm Au nanoparticles functionalized withhuman fibroblast growth factor in lung cancer cells. The timeresolution of B25 ms was limited by particle size (smaller particleswould result in decreased time resolution), and the spatial resolu-tion was B1.5 nm, an unprecedented result which allowed for thedetection of individual motion steps at full range in vivo velocities(0–8 mm s�1).
Finally, moving towards 3D particle tracking, Xiao et al.179
used a defocused approach, where they introduced an aberra-tion into the dark-field imaging of Au rods. By interpreting theelectric field distribution pattern, the orientation angle of theoscillating dipoles of the individual rods was resolved, resultingin spatial information about the Au rods (Fig. 12).65,179
4. Challenges, open questions, and futuredirections
Single particle approaches have shown to be a powerful tool infundamental studies and are gaining momentum as part ofdevices and sensing technology owing to their multiplexingcapabilities and small sensing volume. Several areas benefitedfrom the recent instrumental advances in single particlestudies described in Section 2, yet many open questionsand challenges remain, in particular in novel nanoparticlearchitectures, single molecule sensing, and in vivo studies.
Single particle studies of the dynamics of (bio)chemical andcatalytic reactions offer a unique way to unobtrusively probe anextremely small volume. However, to obtain strong signals,understanding, control, and optimization of particle geometryis paramount. Many exciting synthetic advances have beenreported; now the challenge lies in the successfully transitionfrom making to using such novel particles. Complex, multi-functional architectures such as bimetallic particles representone such class of materials ripe for single particle studies andapplication implementation. A recent example is the Au@Pd–Au octopodal structure, which could provide exquisite trackingand perhaps even optical control of Pd-catalysed chemicalreactions at the single particle level.180,181 Such bimetallicstructures also widen the spectrum of available attachmentchemistry beyond the traditional Au–thiol architecture.Advances in control of nanoparticle assembly should alsoprovide novel single particle (rather single assembly) sensingplatforms. For example, strong interactions between quadru-polar modes in a 3-D plasmon ruler182 consisting of a Au rodsandwiched between two pairs of parallel Au rods in a ‘‘H’’shape produces sharp spectral features allowing for a largeincrease in the sensing figure of merit (via its 1/FWHM
dependence). These unique spectral features are directly corre-lated with the 3D configuration of the Au rods, such that thesmallest change in their relative position produces a clear signalwhich could be used to quantify molecular structure changesgiven appropriate calibration, with potential applications in thestudy of macromolecules dynamics and other biological pro-cesses.182 Mode hybridization shows promises as a powerfulsensing platform that is not confined to the hybridization ofsimilar modes, as demonstrated by the coupling of singleparticle and microcavity modes by Schmidt et al.183
The interest in single molecule spectroscopy has fostered alarge body of research in the last ten years, mostly at the proof-of-concept level, yet the field is still far from generalized,reproducible, and robust single molecule sensing. A limitednumber of reports, discussed above, claim single moleculedetection from LSPR spectroscopy, while single molecule SERShas become a well-established field.59,60,184–187 For the latter,more robust single molecule SERS substrates are expected toemerge from the powerful design rules gained from a betterunderstanding of the hot spot phenomenon.48,49,51,153–155 Theadvancement and practical implementation of the former relieson a combination of improved particle design and instrumentaladvances, moving forward refractive index sensitivity as well asenergy resolution.
Single particle plasmonic sensors have been demonstratedto be efficient at not only label-free single-molecule detectionbut at monitoring real-time adsorption and desorption eventshappening at their surface. The specificity of such events can betailored via surface functionalization, a concept critical tobiocompatibility and many sensing approaches.188–190 Plasmo-nic sensors indeed have a very promising future as intracellularprobes for monitoring dynamic biochemical processes withincells and thermodynamics of small systems. The versatility ofthe single plasmonic sensors, e.g. relative ease to fabricatenanoparticles such as rods in a controlled manner, enablesin vivo studies aiming not only at monitoring intracellularchemical reactions, but how those ‘nanobeacons’ affect theirliving host, i.e. the associated nanotoxicology. Nanoparticlescan also act as mechanical probes for investigating the environ-ment they are embedded in. By monitoring their scatteringspectrum over time it is possible to calculate their associateddiffusion coefficient, as was recently done in transmembraneglycolipid, for example.69
It is no doubt that the wide diversity of far-field and near-fieldtechniques offered for the study of the fundamental to appliedplasmonic behaviour of metal nanoparticles represents a tre-mendous opportunity for fundamental plasmonic studies as wellas sensing and device application. Furthermore, the implemen-tation of multi-technique correlated studies on single plasmonicnanoparticles has allowed for understanding the structure–func-tion and inter functions relationships in those systems.
Acknowledgements
This work was supported by the National Science Foundation(NSF CHE-0911145, CHE-1152547, DMR-1121262) and by
Perspective PCCP
Publ
ishe
d on
04
Febr
uary
201
3. D
ownl
oade
d by
Nor
thw
este
rn U
nive
rsity
on
17/0
7/20
14 2
1:51
:56.
View Article Online

4126 Phys. Chem. Chem. Phys., 2013, 15, 4110--4129 This journal is c the Owner Societies 2013
DARPA under SSC Pacific grant N660001-11-1-4179. Any opi-nions, findings, and conclusions or recommendationsexpressed in this publication are those of the author(s) anddo not necessarily reflect the views of DARPA. E.R. acknowl-edges support from Northwestern University in the form of apresidential fellowship.
References
1 M. Faraday, Philos. Trans. R. Soc. London, 1857, 147,145–181.
2 G. Mie, Ann. Phys., 1908, 25, 377–445.3 S. Weiss, Science, 1999, 283, 1676–1683.4 G. V. Hartland, Annu. Rev. Phys. Chem., 2006, 7, 403–430.5 R. Vogelgesang and A. Dmitriev, Analyst, 2010, 135,
1175–1181.6 S. A. Maier, Plasmonics: Fundamentals and Applications,
Springer, New York, 2007.7 I. Ament, J. Prasad, A. Henkel, S. Schmachtel and
C. Sonnichsen, Nano Lett., 2012, 12, 1092–1095.8 D. Boyer, P. Tamarat, A. Maali, B. Lounis and M. Orrit,
Science, 2002, 297, 1160–1163.9 C. L. Wong, G. C. K. Chen, B. K. Ng, S. Agarwal, N. Fanani,
Z. Lin, S. Vasudevan and P. Chen, Opt. Eng., 2011, 50,073201–073201.
10 P. Zijlstra, P. M. R. Paulo and M. Orrit, Nat. Nanotechnol.,2012, 7, 379–382.
11 S. Berciaud, L. Cognet, G. A. Blab and B. Lounis, Phys. Rev.Lett., 2004, 93, 257402.
12 P. Billaud, S. Marhaba, N. Grillet, E. Cottancin, C. Bonnet,J. Lerme, J.-L. Vialle, M. Broyer and M. Pellarin, Rev. Sci.Instrum., 2010, 81, 043101.
13 K. Imura and H. Okamoto, in Progress in Nanophotonics 1,Nano-Optics and Nanophotonics, ed. M. Ohtsu, Springer-Verlag, Berlin, Heidelberg, 2011.
14 J. Lin, N. Weber, A. Wirth, S. H. Chew, M. Escher,M. Merkel, M. F. Kling, M. I. Stockman, F. Krausz andU. Kleineberg, J. Phys.: Condens. Matter, 2009, 21, 314005.
15 R. M. Tromp, J. B. Hannon, A. W. Ellis, W. Wan,A. Berghaus and O. Schaff, Ultramicroscopy, 2010, 110,852–861.
16 P. Chaturvedi, K. H. Hsu, A. Kumar, K. H. Fung,J. C. Mabon and N. X. Fang, ACS Nano, 2009, 3, 1965–2974.
17 F. J. Garcıa de Abajo, Rev. Mod. Phys., 2010, 82, 209–275.18 R. F. Egerton, Electron energy-loss spectroscopy in the
electron microscope, Springer, 2011.19 R. Zsigmondy, Nobel Lectures, Chemistry, Elseiver Publishing
Company, Amsterdam, 1966.20 W.-S. Chang, L. S. Slaughter, B. P. Khanal, P. Manna,
E. R. Zubarev and S. Link, Nano Lett., 2009, 9, 1152–1157.21 K. Lindfors, T. Kalkbrenner, P. Stoller and V. Sandoghdar,
Phys. Rev. Lett., 2004, 93, 037401.22 J. M. Bingham, K. A. Willets, N. C. Shah, D. Q. Andrews and
D. R. P. Van, J. Phys. Chem. C, 2009, 113, 16839–16842.23 A. D. McFarland and R. P. Van Duyne, Nano Lett., 2003, 3,
1057–1062.
24 J. Rodrıguez-Fernandez, C. Novo, V. Myroshnychenko,A. M. Funston, A. Sanchez-Iglesias, I. Pastoriza-Santos,J. Perez-Juste, F. J. Garcıa de Abajo, L. M. Liz-Marzan andP. Mulvaney, J. Phys. Chem. C, 2009, 113, 18623–18631.
25 C. Novo, D. Gomez, J. Perez-Juste, Z. Zhang, H. Petrova,M. Reismann, P. Mulvaney and G. V. Hartland, Phys. Chem.Chem. Phys., 2006, 8, 3540–3546.
26 O. Schubert, J. Becker, L. Carbone, Y. Khalavka,T. Provalska, I. Zins and C. Sonnichsen, Nano Lett., 2008,8, 2345–2350.
27 P. Zijlstra, J. W. M. Chon and M. Gu, Phys. Chem. Chem.Phys., 2009, 11, 5915–5921.
28 M. G. Blaber, A.-I. Henry, J. M. Bingham, G. C. Schatz andR. P. Van Duyne, J. Phys. Chem. C, 2012, 116, 393–403.
29 A. Tcherniak, J. W. Ha, S. Dominguez-Medina,L. S. Slaughter and S. Link, Nano Lett., 2010, 10, 1398–1404.
30 C. L. Nehl, H. Liao and J. H. Hafner, Nano Lett., 2006, 6,683–688.
31 M. A. van Dijk, M. Lippitz and M. Orrit, Acc. Chem. Res.,2005, 38, 594–601.
32 V. Myroshnychenko, J. Rodrıguez-Fernandez, I. Pastoriza-Santos, A. M. Funston, C. Novo, P. Mulvaney, L. M.Liz-Marzan and F. J. Garcıa de Abajo, Chem. Soc. Rev.,2008, 37, 1792–1805.
33 C. Sonnichsen and A. P. Alivisatos, Nano Lett., 2005, 5,301–304.
34 K. A. Koen, M. L. Weber, K. M. Mayer, E. Fernandez andK. A. Willets, J. Phys. Chem. C, 2012, 116, 16198–16206.
35 J. Lerme, G. Bachelier, P. Billaud, C. Bonnet, M. Broyer,E. Cottancin, S. Marhaba and M. Pellarin, J. Opt. Soc. Am. A,2008, 25, 493–514.
36 H. Baida, P. Billaud, S. Marhaba, D. Christofilos,E. Cottancin, A. Crut, J. Lerme, P. Maioli, M. Pellarin,M. Broyer, F. N. Del, F. Vallee, A. Sanchez-Iglesias,I. Pastoriza-Santos and L. M. Liz-Marzan, Nano Lett.,2009, 9, 3463–3469.
37 C. F. Bohren and D. R. Huffman, Absorption and Scatteringof Light by Small Particles, Wiley, New York, Chichester,1983.
38 M. A. van Dijk, A. L. Tchebotareva, M. Orrit, M. Lippitz,S. Berciaud, D. Lasne, L. Cognet and B. Lounis, Phys. Chem.Chem. Phys., 2006, 8, 3486–3495.
39 S. Berciaud, D. Lasne, G. A. Blab, L. Cognet and B. Lounis,Phys. Rev. B: Condens. Matter Mater. Phys., 2006, 73, 045424.
40 D. Lasne, G. A. Blab, S. Berciaud, M. Heine, L. Groc,D. Choquet, L. Cognet and B. Lounis, Biophys. J., 2006,91, 4598–4604.
41 A. Arbouet, D. Christofilos, N. Del Fatti, F. Vallee,J. R. Huntzinger, L. Arnaud, P. Billaud and M. Broyer, Phys.Rev. Lett., 2004, 93, 127401.
42 S. Berciaud, L. Cognet, P. Tamarat and B. Lounis, NanoLett., 2005, 5, 515–518.
43 C. Leduc, J.-M. Jung, R. R. Carney, F. Stellacci andB. Lounis, ACS Nano, 2011, 5, 2587–2592.
44 A. Gaiduk, P. V. Ruijgrok, M. Yorulmaz and M. Orrit, Chem.Sci., 2010, 1, 343–350.
PCCP Perspective
Publ
ishe
d on
04
Febr
uary
201
3. D
ownl
oade
d by
Nor
thw
este
rn U
nive
rsity
on
17/0
7/20
14 2
1:51
:56.
View Article Online

This journal is c the Owner Societies 2013 Phys. Chem. Chem. Phys., 2013, 15, 4110--4129 4127
45 W.-S. Chang and S. Link, J. Phys. Chem. Lett., 2012, 3,1393–1399.
46 O. L. Muskens, P. Billaud, M. Broyer, N. Del Fatti andF. Vallee, Phys. Rev. B: Condens. Matter Mater. Phys., 2008,78, 205410.
47 A. Gaiduk, P. V. Ruijgrok, M. Yorulmaz and M. Orrit, Phys.Chem. Chem. Phys., 2011, 13, 149–153.
48 R. C. Maher, in Raman Spectroscopy for NanomaterialsCharacterization, ed. C. S. S. R. Kumar, Springer, Berlin,Heidelberg, 2012.
49 S. L. Kleinman, R. R. Frontiera, A.-I. Henry, J. A. Dieringerand D. R. P. Van, Phys. Chem. Chem. Phys., 2013, 15, 21–36.
50 E. C. Le Ru, E. Blackie, M. Meyer and P. G. Etchegoin,J. Phys. Chem. C, 2007, 111, 13794–13803.
51 J. P. Camden, J. A. Dieringer, Y. Wang, D. J. Masiello,L. D. Marks, G. C. Schatz and R. P. Van Duyne, J. Am. Chem.Soc., 2008, 130, 12616–12617.
52 S. M. Morton and L. Jensen, J. Am. Chem. Soc., 2009, 131,4090–4098.
53 L. Jensen, C. M. Aikens and G. C. Schatz, Chem. Soc. Rev.,2008, 37, 1061–1073.
54 B. Sharma, R. R. Frontiera, A.-I. Henry, E. Ringe andR. P. Van Duyne, Mater. Today, 2012, 15, 16–25.
55 S. Shim, C. M. Stuart and R. A. Mathies, ChemPhysChem,2008, 9, 697–699.
56 J. A. Dieringer, K. L. Wustholz, D. J. Masiello, J. P. Camden,S. L. Kleinman, G. C. Schatz and R. P. Van Duyne, J. Am.Chem. Soc., 2008, 131, 849–854.
57 M. Moskovits, Phys. Chem. Chem. Phys., 2013, DOI:10.1039/C2CP44030J.
58 J. Zhao, J. A. Dieringer, X. Zhang, G. C. Schatz and R. P. VanDuyne, J. Phys. Chem. C, 2008, 112, 19302–19310.
59 S. Nie and S. R. Emory, Science, 1997, 275, 1102–1106.60 K. Kneipp, Y. Wang, H. Kneipp, L. T. Perelman, I. Itzkan,
R. R. Dasari and M. S. Feld, Phys. Rev. Lett., 1997, 78,1667–1670.
61 Y. R. Shen, Nature, 1989, 337, 519–525.62 P. Campagnola, Anal. Chem., 2011, 83, 3224–3231.63 R. Jin, J. E. Jureller and N. F. Scherera, Appl. Phys. Lett.,
2006, 88, 263111.64 J. Butet, J. Duboisset, G. Bachelier, I. Russier-Antoine,
E. Benichou, C. Jonin and P.-F. Brevet, Nano Lett., 2010,10, 1717–1721.
65 G. Wang and N. Fang, Methods Enzymol., 2012, 504,83–108.
66 G. Rong, H. Wang, L. R. Skewis and B. R. M. Reinhard,Nano Lett., 2008, 8, 3386–3393.
67 S. W. Hell, Single molecule spectroscopy in chemistry,physics and biology, in Far-field optical nanoscopy, ed.A. Graslund, R. Rigler and J. Widengren, Springer, Berlin,Heidelberg, 2010, vol. 96.
68 T. Fujiwara, K. Ritchie, H. Murakoshi, K. Jacobson andA. Kusumi, J. Cell Biol., 2002, 157, 1071–1082.
69 L. B. Sagle, L. K. Ruvuna, J. M. Bingham, C. Liu,P. S. Cremer and R. P. Van Duyne, J. Am. Chem. Soc.,2012, 134, 15832–15839.
70 T. Hornung, J. Martin, D. Spetzler, R. Ishmukhametov andW. D. Frasch, Methods Mol. Biol., 2011, 778, 273–289.
71 G. Louit, T. Asahi, G. Tanaka, T. Uwada and H. Masuhara,J. Phys. Chem. C, 2009, 113, 11766–11772.
72 R. L. Stiles, K. A. Willets, L. J. Sherry, J. M. Roden andR. P. Van Duyne, J. Phys. Chem. C, 2008, 112, 11696–11701.
73 E. Ringe, J. M. McMahon, K. Sohn, C. M. Cobley, Y. Xia,J. Huang, G. C. Schatz, L. D. Marks and R. P. Van Duyne,J. Phys. Chem. C, 2010, 114, 12511–12516.
74 J. M. McMahon, Y. Wang, L. J. Sherry, R. P. Van Duyne,L. D. Marks, S. K. Gray and G. C. Schatz, J. Phys. Chem. C,2009, 113, 2731–2735.
75 L. J. Sherry, S.-H. Chang, G. C. Schatz, R. P. Van Duyne,B. J. Wiley and Y. Xia, Nano Lett., 2005, 5, 2034–2038.
76 S. Zhang, K. Bao, N. J. Halas, H. Xu and P. Nordlander,Nano Lett., 2011, 11, 1657–1663.
77 C. Sonnichsen, T. Franzl, T. Wilk, G. von Plessen,J. Feldmann, O. Wilson and P. Mulvaney, Phys. Rev. Lett.,2002, 7, 077402.
78 H. Tamaru, H. Kuwata, H. T. Miyazaki and K. Miyano, Appl.Phys. Lett., 2002, 80, 1826–1828.
79 E. Ringe, M. R. Langille, K. Sohn, J. Zhang, J. Huang,C. A. Mirkin, R. P. Van Duyne and L. D. Marks, J. Phys.Chem. Lett., 2012, 3, 1479–1483.
80 A. Grubisic, E. Ringe, C. Cobley, Y. Xia, L. D. Marks,R. P. Van Duyne and D. J. Nesbitt, Nano Lett., 2012, 12,4823–4829.
81 Y. Wang, S. K. Eswaramoorthy, L. J. Sherry, J. A. Dieringer,J. P. Cadmen, G. C. Schatz, R. P. Van Duyne andL. D. Marks, Ultramicroscopy, 2009, 109, 1110–1113.
82 S. J. Barrow, A. M. Funston, D. E. Gomez, T. J. Davis andP. Mulvaney, Nano Lett., 2011, 11, 4180–4187.
83 A.-I. Henry, J. M. Bingham, E. Ringe, L. D. Marks,G. C. Schatz and R. P. Van Duyne, J. Phys. Chem. C, 2011,115, 9291–9305.
84 J. Zuloaga and P. Nordlander, Nano Lett., 2011, 11,1280–1283.
85 A. L. Koh, A. I. Fernandez-Domınguez, D. W. McComb,S. A. Maier and J. K. W. Yang, Nano Lett., 2011, 11,1323–1330.
86 M.-W. Chu, V. Myroshnychenko, C. H. Chen, J.-P. Deng,C.-Y. Mou and F. J. G. D. Abajo, Nano Lett., 2009, 9,399–404.
87 H. Okamoto and K. Imura, Prog. Surf. Sci., 2009, 84,199–229.
88 M. De Serio, R. Zenobi and V. Deckert, Trends Anal. Chem.,2003, 22, 70–77.
89 A. Lewis, M. Isaacson, A. Harootunian and A. Muray,Ultramicroscopy, 1984, 13, 227–231.
90 U. C. Fischer and D. W. Pohl, Phys. Rev. Lett., 1989, 62,458–462.
91 K. Imura, H. Okamoto, M. K. Hossain and M. Kitajima,Nano Lett., 2006, 6, 2173–2176.
92 G. P. Wiederrecht, Eur. Phys. J.: Appl. Phys., 2004, 28, 3–18.93 E. Betzig, J. K. Trautman, T. D. Harris, J. S. Weiner and
R. L. Kostelak, Science, 1991, 251, 1468–1470.
Perspective PCCP
Publ
ishe
d on
04
Febr
uary
201
3. D
ownl
oade
d by
Nor
thw
este
rn U
nive
rsity
on
17/0
7/20
14 2
1:51
:56.
View Article Online

4128 Phys. Chem. Chem. Phys., 2013, 15, 4110--4129 This journal is c the Owner Societies 2013
94 E. H. Synge, Philos. Mag., 1928, 6, 356–362.95 R. M. Bakker, A. Boltasseva, Z. Liu, R. H. Pedersen,
S. Gresillon, A. V. Kildishev, V. P. Drachev andV. M. Shalaev, Opt. Express, 2007, 21, 13682–13688.
96 M. Rang, A. C. Jones, F. Zhou, Z.-Y. Li, B. J. Wiley, Y. Xiaand M. B. Raschke, Nano Lett., 2008, 8, 3357–3363.
97 H. J. Lezec, A. Degiron, E. Devaux, R. A. Linke, L. Martin-Moreno, F. J. Garcia-Vidal and T. W. Ebbesen, Science,2002, 297, 820–822.
98 F. I. Baida and A. Belkhir, Plasmonics, 2009, 4, 51–59.99 S. Berweger, J. M. Atkin, R. L. Olmon and M. B. Raschke,
J. Phys. Chem. Lett., 2010, 1, 3427–3432.100 D. ten Bloemendal, P. Ghenuche, R. Quidant,
I. G. Cormack, P. Loza-Alvarez and G. Badenes, Plasmonics,2006, 1, 41–44.
101 P. Ghenuche, S. Cherukulappurath and R. Quidant, New J.Phys., 2008, 10, 105013.
102 J. H. D. Eland, Photoelectron Spectroscopy: An Introduction toUltraviolet Photoelectron Spectroscopy in the Gas Phase,Butterworths, London, 2nd edn, 1984.
103 L. Douillard, F. Charra, C. Fiorini, P. M. Adam, R. Bachelot,S. Kostcheev, G. Lerondel, M. Lamy de la Chapelle andP. Royer, J. Appl. Phys., 2007, 101, 083518.
104 A. Kubo, K. Onda, H. Petek, Z. Sun, Y. S. Jung andH. K. Kim, Nano Lett., 2005, 5, 1123–1127.
105 G. H. Fecher, O. Schmidt, Y. Hwu and G. Schonhense,J. Electron Spectrosc. Relat. Phenom., 2002, 126, 77–87.
106 L. Zhang, A. Kubo, L. Wang, H. Petek and T. Seideman,Phys. Rev. B: Condens. Matter Mater. Phys., 2011, 84, 245442.
107 M. Cinchetti, A. Gloskovskii, S. A. Nepjiko, G. Schonhense,H. Rochholz and M. Kreiter, Phys. Rev. Lett., 2005,95, 047601.
108 S. J. Peppernick, A. G. Joly, K. M. Beck and W. P. Hess,J. Chem. Phys., 2011, 134, 034507.
109 T. Munakata, T. Masuda, N. Ueno, S. Sakaya, T. Sugiyama,N. Takehiro and Y. Sonoda, Surf. Sci., 2003, 532–535,1140–1144.
110 M. Rohmer, M. Bauer, T. Leissner, C. Schneider, A. Fischer,G. Niedner-Schatteburg, B. von Issendorff and M. Aeschlimann,Phys. Status Solidi B, 2010, 247, 1132–1138.
111 M. Aeschlimann, M. Bauer, D. Bayer, T. Brixner,S. Cunovic, F. Dimler, A. Fischer, W. Pfeiffer, M. Rohmer,C. Schneider, F. Steeb, C. Struber and D. V. Voronine, Proc.Natl. Acad. Sci. U. S. A., 2010, 107, 5329–5333.
112 W. Wan, J. Feng, H. A. Padmore and D. S. Robin, Nucl.Instrum. Methods Phys. Res., Sect. A, 2004, 519, 222–229.
113 V. Schweikhard, A. Grubisic, T. A. Baker, I. Thomann andD. J. Nesbitt, ACS Nano, 2011, 5, 3724–3735.
114 V. Schweikhard, A. Grubisic, T. A. Baker and D. J. Nesbitt,J. Phys. Chem. C, 2011, 115, 83–91.
115 O. L. A. Monti, T. A. Baker and D. J. Nesbitt, J. Chem. Phys.,2006, 125, 154709.
116 T. Coenen, E. J. R. Vesseur, A. Polman andA. F. Koenderink, Nano Lett., 2011, 11, 3779–3784.
117 L. Douillard and F. Charra, J. Phys. D: Appl. Phys., 2011,44, 464002.
118 H. Duan, A. I. Fernandez-Domınguez, M. Bosman, S. A. Maierand J. K. W. Yang, Nano Lett., 2012, 12, 1683–1689.
119 J. Nelayah, M. Kociak, O. Stephan, F. J. Garcıa de Abajo,M. Tence, L. Henrard, D. Taverna, I. Pastoriza-Santos,L. M. Liz-Marzan and C. Colliex, Nat. Phys., 2007, 3, 348–353.
120 O. Nicoletti, M. Wubs, N. A. Mortensen, W. Sigle, P. A. vanAken and P. A. Midgley, Opt. Express, 2011, 19, 15371–15379.
121 S. Mazzucco, N. Geuquet, J. Ye, O. Stephan, W. Van Roy,P. Van Dorpe, L. Henrard and M. Kociak, Nano Lett., 2012,12, 1288–1294.
122 B. S. Guiton, V. Iberi, S. Li, D. N. Leonard, C. M. Parish,P. G. Kotula, M. Varela, G. C. Schatz, S. J. Pennycook andJ. P. Camden, Nano Lett., 2011, 11, 3482–3488.
123 W. Van den Broek, J. Verbeeck, S. De Backer, P. Scheundersand D. Schryvers, Ultramicroscopy, 2006, 106, 269–276.
124 K. Jarausch, P. Thomas, D. N. Leonard, R. Twesten andC. R. Booth, Ultramicroscopy, 2009, 109, 326–337.
125 S. W. Prescott and P. Mulvaney, J. Appl. Phys., 2006,99, 123504.
126 C. J. Murphy, T. K. Sau, A. M. Gole, C. J. Orendorff, J. Gao,L. Gou, S. E. Hunyadi and T. Li, J. Phys. Chem. B, 2005, 109,13857–13870.
127 K.-S. Lee and M. A. El-Sayed, J. Phys. Chem. B, 2006, 110,19220–19225.
128 Y. Xia, Y. Xiong, B. Lim and S. E. Skrabalak, Angew. Chem.,Int. Ed., 2009, 48, 60–103.
129 C. M. Cobley, S. E. Skrabalak, D. J. Campbell and Y. Xia,Plasmonics, 2009, 4, 171–179.
130 S. E. Skrabalak, L. Au, X. Li and Y. Xia, Nat. Protocols, 2007,2, 2182.
131 R. P. Van Duyne and J. P. Haushalter, J. Phys. Chem., 1984,88, 2446–2451.
132 D. L. Jeanmaire and R. P. Van Duyne, J. Electroanal. Chem.,1977, 84, 1–20.
133 A. D. McFarland, M. A. Young, J. A. Dieringer and R. P. VanDuyne, J. Phys. Chem. B, 2005, 109, 11279–11285.
134 M. Kahl, E. Voges, S. Kostrewa, C. Viets and W. Hill, Sens.Actuators, B, 1998, 51, 285–291.
135 J. R. Lakowicz, C. D. Geddes, I. Gryczynski, J. Malicka,Z. Gryczynski, K. Alsan, J. Lukomska, E. Matveeva, J. Zhang,R. Badugu and J. Huang, J. Fluoresc., 2004, 14, 425–441.
136 A. J. Haes, S. Zou, J. Zhao, G. C. Schatz and R. P. VanDuyne, J. Am. Chem. Soc., 2006, 128, 10905–10914.
137 J. Zhao, A. Das, X. Zhang, G. C. Schatz, S. G. Sligar andR. P. Van Duyne, J. Am. Chem. Soc., 2006, 128,11004–11005.
138 J. J. Mock, M. Barbic, D. R. Smith, D. A. Schultz andS. Schultz, J. Chem. Phys., 2002, 116, 6755–6759.
139 I. Pastoriza-Santos and L. M. Liz-Marzan, J. Mater. Chem.,2008, 18, 1724–1737.
140 K. Munechika, J. M. Smith, Y. Chen and D. S. Ginger,J. Phys. Chem. C, 2007, 111, 18906–18911.
141 M. Hu, J. Chen, M. Marquez, Y. Xia and G. V. Hartland,J. Phys. Chem. C, 2007, 111, 12558–12565.
142 T. Itoh, T. Uwada, T. Asahi, Y. Ozaki and H. Masuhara,Can. J. Anal. Sci. Spectrosc., 2007, 52, 130–141.
PCCP Perspective
Publ
ishe
d on
04
Febr
uary
201
3. D
ownl
oade
d by
Nor
thw
este
rn U
nive
rsity
on
17/0
7/20
14 2
1:51
:56.
View Article Online

This journal is c the Owner Societies 2013 Phys. Chem. Chem. Phys., 2013, 15, 4110--4129 4129
143 C. L. Nehl, N. K. Grady, G. P. Goodrich, F. Tam, N. J. Halasand J. H. Hafner, Nano Lett., 2004, 4, 2355–2359.
144 F. Zhou, Z.-Y. Li, Y. Liu and Y. Xia, J. Phys. Chem. C, 2008,112, 20233–20240.
145 B. J. Wiley, Y. Chen, J. M. McLellan, Y. Xiong, Z.-H. Li,D. Ginger and Y. Xia, Nano Lett., 2007, 7, 1032–1036.
146 H. Wang, D. W. Brandl, F. Le, P. Nordlander andN. J. Halas, Nano Lett., 2006, 6, 827–832.
147 H. Wei, A. Reyes-Coronado, P. Nordlander, J. Aizpurua andH. Xu, ACS Nano, 2010, 4, 2649–2654.
148 J. M. J. Santillan, L. B. Scaffardi and D. C. Schinca, J. Phys.D: Appl. Phys., 2011, 44, 105104.
149 E. Ringe, J. Zhang, M. R. Langille, C. A. Mirkin, L. D. Marksand R. P. V. Duyne, Nanotechnology, 2012, 23, 444005.
150 L. M. Liz-Marzan, Langmuir, 2006, 22, 32–41.151 J. J. Mock, D. R. Smith and S. Schultz, Nano Lett., 2003, 3,
485–491.152 L. J. Sherry, R. Jin, C. A. Mirkin, G. C. Schatz and R. P. Van
Duyne, Nano Lett., 2006, 6, 2060–2065.153 P. H. C. Camargo, M. Rycenga, L. Au and Y. Xia, Angew.
Chem., Int. Ed., 2009, 48, 2180–2184.154 E. D. Dielbold, P. Peng and E. Mazur, J. Am. Chem. Soc.,
2009, 131, 16356–16357.155 M. Rycenga, X. Xia, C. H. Moran, F. Zhou, D. Qin, Z.-Y. Li
and Y. Xia, Angew. Chem., Int. Ed., 2011, 50, 5473–5477.156 K. L. Wustholz, A.-I. Henry, J. M. McMahon, R. G. Freeman,
N. Valley, M. E. Piotti, M. J. Natan, G. C. Schatz and R. P. VanDuyne, J. Am. Chem. Soc., 2010, 132, 10903–10910.
157 F. J. Garcıa de Abajo and M. Kociak, Phys. Rev. Lett., 2008,100, 106804.
158 U. Hohenester, H. Ditlbacher and J. R. Krenn, Phys. Rev.Lett., 2009, 103, 106801.
159 A.25 Bouhelier, G. Colas des Francs and J. Grandidier, inPlasmonics, Springer Series in Optical Sciences 167, ed. S. Enochand N. Bonod, Springer-Verlag, Berlin, Heidelberg, 2012.
160 E. J. R. Vesseur, R. de Waele, M. Kuttge and A. Polman,Nano Lett., 2007, 7, 2843–2846.
161 A. Bouhelier, R. Bachelot, G. Lerondel, S. Kostcheev,P. Royer and G. P. Wiederrecht, Phys. Rev. Lett., 2005,95, 267405.
162 L. Tong, T. Zhu and Z. Liu, Chem. Soc. Rev., 2011, 40,1296–1304.
163 C. E. Talley, J. B. Jackson, C. Oubre, N. K. Grady,C. W. Hollars, S. M. Lane, T. R. Huser, P. Nordlanderand N. J. Halas, Nano Lett., 2005, 5, 1569–1574.
164 L.-L. Tay, J. Hulse, D. Kennedy and J. P. Pezacki, J. Phys.Chem. C, 2010, 114, 7356–7363.
165 L. Rodrıguez-Lorenzo, R. N. A. Alvarez-Puebla, I. Pastoriza-Santos, S. Mazzucco, O. Stephan, M. Kociak, L. M. Liz-Marzanand F. J. Garcıa de Abajo, J. Am. Chem. Soc., 2009, 131,4616–4618.
166 P. Aldeanueva-Potel, E. Carbo-Argibay, N. Pazos-Perez,S. Barbosa, I. Pastoriza-Santos, R. A. Alvarez-Puebla andL. M. Liz-Marzan, ChemPhysChem, 2012, 13, 2561–2565.
167 J. M. McLellan, Z.-Y. Li, A. R. Siekkinen and Y. Xia, NanoLett., 2007, 7, 1013–1017.
168 M. J. Mulvihill, X. Y. Ling, J. Henzie and P. Yang, J. Am.Chem. Soc., 2010, 132, 268–274.
169 M. Rycenga, P. H. C. Camargo, W. Li, C. H. Moran andY. Xia, J. Phys. Chem. Lett., 2010, 1, 696–703.
170 G. H. Chan, J. Zhao, E. M. Hicks, G. C. Schatz and R. P. VanDuyne, Nano Lett., 2007, 7, 1947–1952.
171 L.-X. Qin, C. Jing, Y. Li, D.-W. Li and Y.-T. Long, Chem.Commun., 2012, 48, 1511–1513.
172 J. Cheng, Y. Liu, X. Cheng, Y. He and E. S. Yeung, Anal.Chem., 2010, 82, 8744–8749.
173 C. Novo, A. M. Funston, A. K. Gooding and P. Mulvaney,J. Am. Chem. Soc., 2009, 131, 14664–14666.
174 C. Novo, A. M. Funston and P. Mulvaney, Nat. Nanotechnol.,2008, 3, 598–602.
175 D. Seo, G. Park and H. Song, J. Am. Chem. Soc., 2011, 134,1221–1227.
176 N. Liu, M. L. Tang, M. Hentschel, H. Giessen andA. P. Alivisatos, Nat. Mater., 2011, 10, 631–636.
177 Y. Li, C. Jing, L. Zhang and Y.-T. Long, Chem. Soc. Rev.,2012, 41, 632–642.
178 X. Nan, P. A. Sims and X. S. Xie, ChemPhysChem, 2008, 9,707–712.
179 L. Xiao, Y. Qiao, Y. He and E. S. Yeung, Anal. Chem., 2010,82, 5268–5274.
180 C. J. DeSantis and S. E. Skrabalak, Langmuir, 2012, 28,9055–9062.
181 C. J. DeSantis, A. C. Sue, M. M. Bower and S. E. Skrabalak,ACS Nano, 2012, 6, 2617–2628.
182 N. Liu, M. Hentschel, T. Weiss, A. P. Alivisatos andH. Giessen, Science, 2011, 332, 1407–1410.
183 M. A. Schmidt, D. Y. Lei, L. Wondraczek, V. Nazabal andS. A. Maier, Nat. Commun., 2012, 3, 1108.
184 E. C. Le Ru and P. G. Etchegoin, Annu. Rev. Phys. Chem.,2012, 63, 65–87.
185 S. K. Kleinman, E. Ringe, N. Valley, K. L. Wustholz,E. Phillios, K. A. Scheidt, G. C. Schatz and R. P. Van Duyne,J. Am. Chem. Soc., 2011, 133, 4115–4122.
186 J. A. Dieringer, R. B. Lettan, K. A. Scheidt and R. P. VanDuyne, J. Am. Chem. Soc., 2007, 129, 16249–16256.
187 A. Otto, J. Raman Spectrosc., 2002, 33, 593–598.188 A. J. Haes and R. P. Van Duyne, Anal. Bioanal. Chem., 2004,
379, 920–930.189 N. G. Khlebtsov and L. A. Dykman, J. Quant. Spectrosc.
Radiat. Transfer, 2010, 111, 1–35.190 K. Kneipp, H. Kneipp and J. Kneipp, Acc. Chem. Res., 2006,
39, 443–450.
Perspective PCCP
Publ
ishe
d on
04
Febr
uary
201
3. D
ownl
oade
d by
Nor
thw
este
rn U
nive
rsity
on
17/0
7/20
14 2
1:51
:56.
View Article Online