Rs lect 1day_2
29
Dr.-Ing. Görres Grenzdörffer Remote Sensing Satellite Remote Sensing 1 Universität Rostock, Professur für Geodäsie und Geoinformatik X 2006 Dr.-Ing. Görres Grenzdörffer Basics and Applications of Remote Sensing Universität Rostock, Professur für Geodäsie und Geoinformatik Schedule Lectures • Remote Sensing Basics (1st Day) • Examples of modern airborne and spaceborne remote sensing • The EM-spectrum • Reflectance properties of different objects • Spaceborne sensors • Satellite Remote Sensing (1st Day) • Landsat, SPOT and ASTER • Highest resolution satellites • SRTM • Change Detection • Airborne Remote Sensing (2nd Day) • (digital) airborne sensors • Digital orthophotos • Digital oblique imagery • Digital image Processing (2nd Day) • Pixels and mixels • Spectral bands / low level image operations
-
Upload
bangalore-techie -
Category
Technology
-
view
139 -
download
0
Transcript of Rs lect 1day_2

Dr.-Ing. Görres Grenzdörffer Remote Sensing
Satellite Remote Sensing 1
Universität Rostock, Professur für Geodäsie und Geoinformatik X 2006
Dr.-Ing. Görres Grenzdörffer
Basics and Applications ofRemote SensingBasics and Applications ofRemote Sensing
Universität Rostock, Professur für Geodäsie und Geoinformatik
Schedule Lectures
• Remote Sensing Basics (1st Day)• Examples of modern airborne and spaceborne remote sensing• The EM-spectrum• Reflectance properties of different objects• Spaceborne sensors
• Satellite Remote Sensing (1st Day)• Landsat, SPOT and ASTER• Highest resolution satellites• SRTM• Change Detection
• Airborne Remote Sensing (2nd Day)• (digital) airborne sensors• Digital orthophotos• Digital oblique imagery
• Digital image Processing (2nd Day)• Pixels and mixels• Spectral bands / low level image operations

Dr.-Ing. Görres Grenzdörffer Remote Sensing
Satellite Remote Sensing 2
Universität Rostock, Professur für Geodäsie und Geoinformatik
Landsat 4/5
StartOrbit heightRepetition rateSensorGround resolutionScene sizeSpectral bands
1982705 km16 DaysTM30*30 m185 * 185 km1 0.45-0.52 µm2 0.52-0.60 µm3 0.63-0.69 µm4 0.76-0.90 µm5 1.55-1.73 µm6 10.4-12.5* µm7 2.08-2.35 µm
StartOrbit heightRepetition rateSensorGround resolutionScene sizeSpectral bands
1982, 1984705 km16 DaysTM30*30 m185 * 185 km1 0.45-0.52 µm2 0.52-0.60 µm3 0.63-0.69 µm4 0.76-0.90 µm5 1.55-1.73 µm6 10.4-12.5* µm7 2.08-2.35 µm
Inclination: Sun-synchronous, 98.2 degreesEquatorial crossing: Descending node; 10:00am +/- 15 min.Landsat 5 is still operational !
Universität Rostock, Professur für Geodäsie und Geoinformatik
Landsat Coverage History
http://landsat.gsfc.nasa.gov/project/Comparison.html

Dr.-Ing. Görres Grenzdörffer Remote Sensing
Satellite Remote Sensing 3
Universität Rostock, Professur für Geodäsie und Geoinformatik
Landsat 7 - ETM+
StartOrbit heightRepetition rateSensorGround resolutionScene sizeSpectral bands
StartOrbit heightRepetition rateSensorGround resolutionScene sizeSpectral bands
1999705 km16 Days
185 * 185 km1 0.45-0.52 µm2 0.52-0.60 µm3 0.63-0.69 µm4 0.76-0.90 µm5 1.55-1.73 µm6 10.4-12.5* µm7 2.08-2.35 µm
705 km16 DaysETM15*15 – 30*30 m185 * 185 km1 0.45-0.52 µm2 0.52-0.60 µm3 0.63-0.69 µm4 0.76-0.90 µm5 1.55-1.73 µm6 10.4-12.5* µm7 2.08-2.35 µm
Landsat 1 – 7 deliver continuous data for more than 30 years now !!Since Mai 2003 Scan line corrector failure
Universität Rostock, Professur für Geodäsie und Geoinformatik
16012,00013,200158
103,0003,300606
4060006,600301-5, 7
MB per Band
Data Lines(rows)
Samples(columns)
Resolution(meters)
BandNumber
Image Dimensions for a Landsat 7 Product
Landsat 7 – ETM Data Specifications

Dr.-Ing. Görres Grenzdörffer Remote Sensing
Satellite Remote Sensing 4
Universität Rostock, Professur für Geodäsie und Geoinformatik
Satellite receiving stations for Landsat TM 4, 5, 7
Mission control of EOSAT Sioux Falls, South Dakota, USAData for Vietnam (Bangkok)
Universität Rostock, Professur für Geodäsie und Geoinformatik
WRS- 2 Path/Row (Landsat 4,5 and 7, and UTM- Zones
http://ltpwww.gsfc.nasa.gov/IAS/handbook/handbook_htmls/chapter5/htmls/wrs_graphic.html
World coverage: 57,784 scenes
127/045

Dr.-Ing. Görres Grenzdörffer Remote Sensing
Satellite Remote Sensing 5
Universität Rostock, Professur für Geodäsie und Geoinformatik
Landsat TM 5 and ETM 7 – Path127/ Row 045
Landsat 5 12/27/1993 Landsat 7 11/04/2000
Hanoi Hanoi
Universität Rostock, Professur für Geodäsie und Geoinformatik
TM and ETM+ Sensor Band Designations
Band Use 1 Blue-green Bathymetric mapping; distinguishes soil from vegetation;
deciduous from coniferous vegetation 2 Green Emphasizes peak vegetation, which is useful for assessing plant vigor 3 Red Emphasizes vegetation slopes 4
Reflected IR Emphasizes biomass content and shorelines
5 Reflected IR Discriminates moisture content of soil and vegetation; penetrates thin clouds
6 Thermal IR Useful for thermal mapping and estimated soil moisture 7 Reflected IR Useful for mapping hydrothermally altered rocks associated with
mineral deposits 8 Panchromatic Landsat 7 carries a panchromatic band (visible through near
infrared) with15 m resolution for “sharpening” of multispectral images
http://landsat.usgs.gov/project_facts/files/landsat_fact_sheet_20023-03.pdf

Dr.-Ing. Görres Grenzdörffer Remote Sensing
Satellite Remote Sensing 6
Universität Rostock, Professur für Geodäsie und Geoinformatik
RGB Band Composite
Universität Rostock, Professur für Geodäsie und Geoinformatik
Pixel color and brightness is determined by the pixel value

Dr.-Ing. Görres Grenzdörffer Remote Sensing
Satellite Remote Sensing 7
Universität Rostock, Professur für Geodäsie und Geoinformatik
Certain bands or band combinations are better than others for identifying specific land cover features
Landsat TM Red= band 3, Green = band 2, Blue = band 1 (True color)
Landsat TM Red= band 4, Green = band 5, Blue = band 3
Universität Rostock, Professur für Geodäsie und Geoinformatik
• Penetrates water better than the other bands so it is often the band of choice for aquatic ecosystems
• Used to monitor sediment in water, mapping coral reefs, and water depth
• The “noisiest” of the Landsatbands since short wavelength blue light is scattered more than the other bands
• Rarely used for "pretty picture" type images
Landsat ETM+ band 1 (0.45- 0.52 µm, blue- green)

Dr.-Ing. Görres Grenzdörffer Remote Sensing
Satellite Remote Sensing 8
Universität Rostock, Professur für Geodäsie und Geoinformatik
• Similar qualities to band 1 but not as noisy.
• Matches the wavelength for the color green.
Landsat ETM+ band 2 (0.52- 0.60 µm, green)
Universität Rostock, Professur für Geodäsie und Geoinformatik
• Since vegetation absorbs nearly all red light (it is sometimes called the chlorophyll absorption band)
• Band 3 can be useful for distinguishing between vegetation and soil and in monitoring vegetation health
Landsat ETM+ band 3 (0.63- 0.69 µm, red)

Dr.-Ing. Görres Grenzdörffer Remote Sensing
Satellite Remote Sensing 9
Universität Rostock, Professur für Geodäsie und Geoinformatik
• Since water absorbs nearly all light at this wavelength water bodies appear very dark. This contrasts with bright reflectance for soil and vegetation so it is a good band for defining the water/land interface
• Sensitive to vegetation cover• Less affected by atmospheric
contamination
Landsat ETM+ band 4 (0.76- 0.90 µm, near infrared)
Universität Rostock, Professur für Geodäsie und Geoinformatik
• Very sensitive to moisture and is therefore used to monitor vegetation water stress and soil moisture.
• Useful to differentiate between clouds and snow
Landsat ETM+ band 5 (1.55- 1.75 µm, mid- infrared)

Dr.-Ing. Görres Grenzdörffer Remote Sensing
Satellite Remote Sensing 10
Universität Rostock, Professur für Geodäsie und Geoinformatik
• Measures surface temperature.
• Geological applications • Differentiate clouds from
bright soils since clouds tend to be very cold
• The resolution is twice as course as the other bands (60 m instead of 30 m)
Landsat ETM+ band 6 (10.40- 12.50 µm, thermal infrared)
Universität Rostock, Professur für Geodäsie und Geoinformatik
• Can detect high surface temperatures
• Also used for vegetation moisture although generally band 5 is generally preferred for that application
• Commonly used in geology
Landsat ETM+ band 7 (2.08- 2.35 µm mid- infrared)

Dr.-Ing. Görres Grenzdörffer Remote Sensing
Satellite Remote Sensing 11
Universität Rostock, Professur für Geodäsie und Geoinformatik
Landsat ETM+ bands 3,2,1 –Penetrates shallow water and shows submerged shelf, water turbidity
Landsat ETM+ bands 4,3,2 –Peak chlorophyll, land/water boundary, urban areas
Universität Rostock, Professur für Geodäsie und Geoinformatik
Landsat ETM+ bands 4,5,3 –Land/water boundary, Vegetation type and condition, soil moisture
Landsat ETM+ bands 7,4,2 –Moisture content in vegetation and soils, geological mapping, vegetation mapping
Dr.-Ing. Görres Grenzdörffer Remote Sensing
Satellite Remote Sensing 12
Universität Rostock, Professur für Geodäsie und Geoinformatik
SPOT 5
•Start May 2002•Weight ca. 3.000 kg•Geometric resolution
• G,R, NIR (10 m), MIR (20m), Pan 5 m (2.5 m)•Sensors (HRV / HRVIR) und swath width
• 1 Sensor: 60 km, 2 Sensors: 117 km• Mirror ± 27° off-nadir-viewing, therefore
variable swath width up to 80 km at 950 km elevation
•Végétation-Instrument: 2250 km•Temporal Resolution
• HRV / HRVIR: 26 days due to off-nadir view of the mirror up 11-times coverage within 26 days possible, for ϕ = 45°)
• Végétation-Instrument: ca. 1 day•Stereo
• Along track (600 * 120 km)• Base to height ration 0.8
SP
OT
Imag
eS
PO
T Im
age
Universität Rostock, Professur für Geodäsie und Geoinformatik
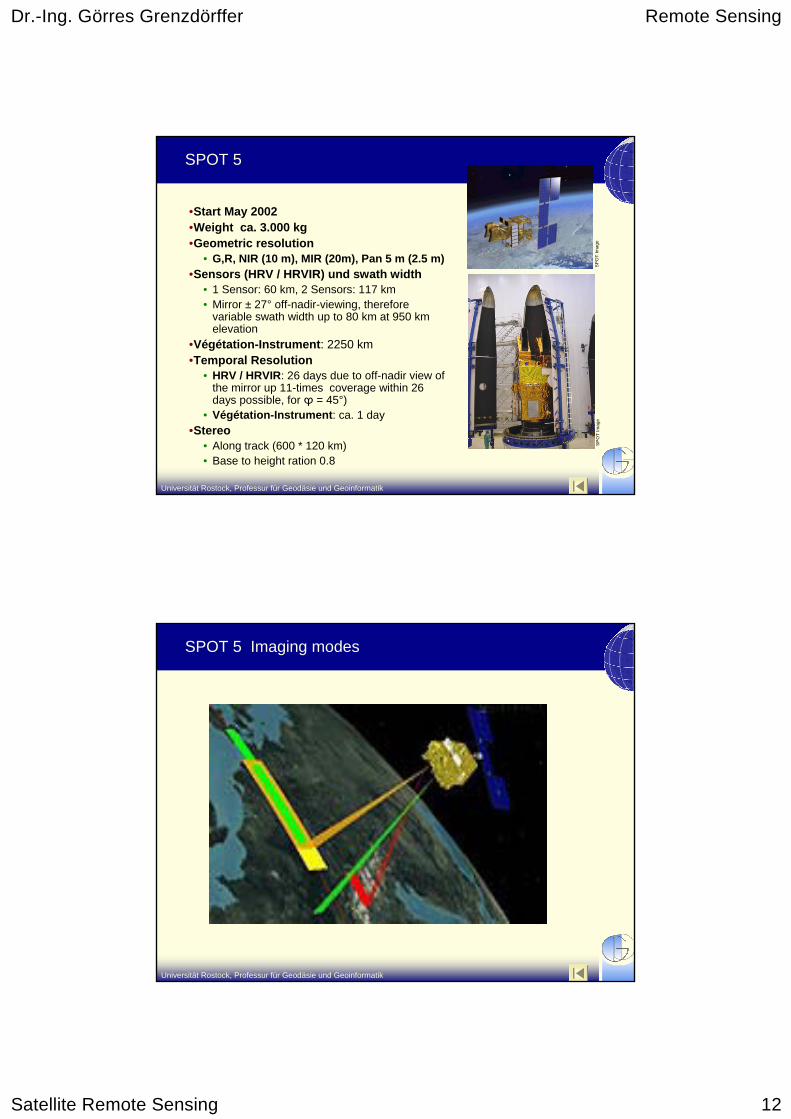
SPOT 5 Imaging modes
SPOT Image

Dr.-Ing. Görres Grenzdörffer Remote Sensing
Satellite Remote Sensing 13
Universität Rostock, Professur für Geodäsie und Geoinformatik
ASTERAdvanced Spaceborne Thermal Emission and Reflection
Radiometer
Flies on Terra platform
Built for METI in Japan
Data processing in Japan and U.S.
Instrument command and control by Japan and U.S.
Joint Science Team
TerraTerra
Universität Rostock, Professur für Geodäsie und Geoinformatik
Terra Launch from VAFB, December 1999

Dr.-Ing. Görres Grenzdörffer Remote Sensing
Satellite Remote Sensing 14
Universität Rostock, Professur für Geodäsie und Geoinformatik
Terra is the flagship of NASA's ESE (Earth Science Enterprise). Terra is the flagship of NASA's ESE (Earth Science Enterprise).
Terra SatelliteTerra Satellite
MODISMODIS
ASTERASTER (TIR)(TIR)ASTERASTER (SWIR)(SWIR)ASTERASTER (VNIR)(VNIR)
MISRMISR
MOPITTMOPITT
CERESCERES
ASTER is the zoom lens of Terra!ASTER is the zoom lens of Terra!
Universität Rostock, Professur für Geodäsie und Geoinformatik
ASTER Instrument Characteristics
60 km swath; <16 day repeat cycle; along track stereo

Dr.-Ing. Görres Grenzdörffer Remote Sensing
Satellite Remote Sensing 15
Universität Rostock, Professur für Geodäsie und Geoinformatik
Visible-NIR Visible-NIR
Short Wave IR Thermal IR
Universität Rostock, Professur für Geodäsie und Geoinformatik
ASTER Response to Indian Ocean TsunamiASTER Response to Indian Ocean Tsunami
Banda Aceh before tsunami (left) and 5 days after tsunami (right)

Dr.-Ing. Görres Grenzdörffer Remote Sensing
Satellite Remote Sensing 16
Universität Rostock, Professur für Geodäsie und Geoinformatik
Eruption of Mt. Etna, Italy
Visible Thermal
Universität Rostock, Professur für Geodäsie und Geoinformatik
• 80 million cubic meter rock/ice avalanche and subsequent debris/mud flows on September 20, 2002
• Overran Karmadon village 18 km down valley
• Over 120 killed• Mudflow continued 15km
further down valley• Rapid ASTER imaging
response over several days following emergency.
• ASTER data used by emergency response teams
Kolka glacier disaster, Sept. 2002

Dr.-Ing. Görres Grenzdörffer Remote Sensing
Satellite Remote Sensing 17
Universität Rostock, Professur für Geodäsie und Geoinformatik
ASTER Application Examples
SO2 plume north of Baghdad from sulfur plant fire. SO2detected by ASTER’s TIR bands
Universität Rostock, Professur für Geodäsie und Geoinformatik www.spotimage.fr

Dr.-Ing. Görres Grenzdörffer Remote Sensing
Satellite Remote Sensing 18
Universität Rostock, Professur für Geodäsie und Geoinformatik
Highest resolution (1m) - Satellites
* Minimum order 64 km²** plus programming fee***Minimum order 100 km², different processing levels
Company/SystemStartOrbit heightRepetition rate (n)Repetition rate (s)ModeGround res. [m]Swath width [km]Stereo capabilitesDelivery - Satellite
ConsumerPrize [$ per km²]
Earth Watch"Quick Bird"15.11.2001470 km4-5 Days< 2 Days
PAN MS0.61 2.416.5 86In Track
15 min. - 48 h.
Orbital Sciences"Orb-View 3"
2002
470 km16 Days< 3 Days
PAN MS1 m 8 m
8kmIn Track
15 min. - 24 h.
Space Imaging“IKONOS"21.9.2000680 km14 Days1 - 3 Days
PAN MS1 m 4 m
11 kmIn Track
24 - 48 h.18 - 150***
Image Sat“EROS-A"05.12.2000480 km4-5 Days< 2 Days
PAN1.8 m12.5
In/cross Track
1.500/Scene**25 - 30*
Universität Rostock, Professur für Geodäsie und Geoinformatik
(GSD 1m - pan)
http://www.spaceimage.com/
Ikonos 1 – 1st picture Washington D.C.

Dr.-Ing. Görres Grenzdörffer Remote Sensing
Satellite Remote Sensing 19
Universität Rostock, Professur für Geodäsie und Geoinformatik IKONOS, Rabat, PAN
Universität Rostock, Professur für Geodäsie und Geoinformatik IKONOS, Singapore, Color

Dr.-Ing. Görres Grenzdörffer Remote Sensing
Satellite Remote Sensing 20
Universität Rostock, Professur für Geodäsie und GeoinformatikQuickbird, Prague before 2003 flood, Color
Universität Rostock, Professur für Geodäsie und Geoinformatik Quickbird, Prague at 2003 flood, Color

Dr.-Ing. Görres Grenzdörffer Remote Sensing
Satellite Remote Sensing 21
Universität Rostock, Professur für Geodäsie und GeoinformatikQuickbird, Vietnam, North of Hanoi,11.03.2007
Universität Rostock, Professur für Geodäsie und Geoinformatik
Highest- Resolution Earth Observation Satellites 2006 - 2012
http://www.asprs.org/news/satellites/asprs_database_090706.pdf

Dr.-Ing. Görres Grenzdörffer Remote Sensing
Satellite Remote Sensing 22
Universität Rostock, Professur für Geodäsie und Geoinformatik
High- Resolution Earth Observation Satellites 2006 - 2012
http://www.asprs.org/news/satellites/asprs_database_090706.pdf
Universität Rostock, Professur für Geodäsie und Geoinformatik
SRTM - DEM generation and analysis
Dr.-Ing. Görres GrenzdörfferChair of Geodesy and Geoinformatics, Rostock University
SRTM SRTM -- DEM DEM generationgeneration and and analysisanalysis

Dr.-Ing. Görres Grenzdörffer Remote Sensing
Satellite Remote Sensing 23
Universität Rostock, Professur für Geodäsie und Geoinformatik
Shuttle Radar Topography Mission (SRTM)
LAUNCH.............: February 11, 2000DURATION.........: 11 daysSPACE SHUTTLE: EndeavourCOMPLETION DATA ANALYSIS: 2004
• X-SAR/SRTM was an innovativeway of collecting highly accurate topographic information using spaceborne radar instruments.
• The collected radar images are converted to digital elevationmodels (DEMs) spanning the globebetween 60° North and 58° South.
Universität Rostock, Professur für Geodäsie und Geoinformatik
Interferometry (1)

Dr.-Ing. Görres Grenzdörffer Remote Sensing
Satellite Remote Sensing 24
Universität Rostock, Professur für Geodäsie und Geoinformatik
Interferometry (2)
Universität Rostock, Professur für Geodäsie und Geoinformatik
Interferometry (3)

Dr.-Ing. Görres Grenzdörffer Remote Sensing
Satellite Remote Sensing 25
Universität Rostock, Professur für Geodäsie und Geoinformatik
http://www.dlr.de/srtm/hintergrund/hintergrund_en.htm
3D with interferometry- Step by step
Universität Rostock, Professur für Geodäsie und Geoinformatik
Accuracy and availability of SRTM- data
Source: http://www.dlr.de/srtm/produkte/produkte.htm
SRTM X-SAR Resolution: 30m / Pixel (DLR)
SRTM C-SAR Freely accessible via Internet : 90m / Pixel (NASA)
±6m 90% vertical errorvertical accuracy (relative)±16m 90% vertical errorvertical accuracy (absolute)±15m 90% circular errorhorizontal accuracy (relative)±20m 90% circular errorhorizontal accuracy (absolute)16-bit Signed IntegerData formatWGS84 or MSL (optionally)Datum (vertical)WGS84Datum (horizontal)1mHeight levels1"x1" Lon& LatRaster size

Dr.-Ing. Görres Grenzdörffer Remote Sensing
Satellite Remote Sensing 26
Universität Rostock, Professur für Geodäsie und Geoinformatik
SRTM- DEM World Coverage
http://www2.jpl.nasa.gov/srtm/world.htm#PIA03394
Universität Rostock, Professur für Geodäsie und Geoinformatik
SRTM- Data example – Shaded relief
20 km
Hanoi

Dr.-Ing. Görres Grenzdörffer Remote Sensing
Satellite Remote Sensing 27
Universität Rostock, Professur für Geodäsie und Geoinformatik
Image drape over SRTM- DEM of Landsat Scene 045/127
Universität Rostock, Professur für Geodäsie und Geoinformatik
Price of satellite data – general
• Dependent upon:
• Urgency- emergency services - the faster you need it, the more you pay
• Age of the data- the more recent the data, the higher its value
• Spatial resolution- the higher the spatial resolution, the higher the cost

Dr.-Ing. Görres Grenzdörffer Remote Sensing
Satellite Remote Sensing 28
Universität Rostock, Professur für Geodäsie und Geoinformatik
Price of satellite data - examples
Price structures of satellite data are generally complicatedSeveral constraints apply for data distribution
Data from several internet sources with subject to change
Satellite GSD / Pixel Price / Scene [€] Price per km² [€]Meteosat II 2.5 km Free* – 500 NOAA - AVHRR 1.1 km Free* – 100Landsat (E)TM 30 m Free* – 1.000 0 - 0.03ASTER 15 – 90 m Free* – 80 0 - 0.02SPOT 4 / 5 2.5 – 20 m 1.000* – 6.000 ** 0.27* – 10 ***
IRS 2.5 – 23 m 1.700* – 4.500 0.35* – 0.90***
IKONOS 1 – 4 m 850* – 24.200 7* – 200 ***
Quickbird 0.6 – 4 m 4.300* –12.200 16* – 45**, ***
* Archived data** Additional fees for programming of the satellite apply*** Minimum order sizes apply
Universität Rostock, Professur für Geodäsie und Geoinformatik
Where do I get satellite data ?
• Through the internet – search and retrieval (via snail mail)
• Google earth ?!?
• Every satellite operating company has an online search and
ordering services
• Satellite distributors (receiving stations) offer satellite data from
many different satellites
• National aerospace agencies offer satellite data from national
(scientific) missions

Dr.-Ing. Görres Grenzdörffer Remote Sensing
Satellite Remote Sensing 29
Universität Rostock, Professur für Geodäsie und Geoinformatik
Wrap Up
• What have we learned?• Where satellite images come from and how they are made • Information content of satellite data• There is an enormous amount of satellite data in different
spectral and spatial resolution around
• After this class• We learn where we will get RS-Data through the internet• Practical exercises with Landsat TM data• Play with the data you have received in the class, using some
of the techniques we discussed