R&S GTSL Debug Driver Server Software User Manual · R&S GTSL instrument driver wrapper DLLs are...
21
R&S ® GTSL Debug Driver Server Software User Manual User Manual Version 01 1179136402 (;Ý=Î2)
Transcript of R&S GTSL Debug Driver Server Software User Manual · R&S GTSL instrument driver wrapper DLLs are...

R&S®GTSLDebug Driver Server SoftwareUser Manual
User
Man
ual
Versi
on 01
1179136402(;Ý=Î2)

This document is valid for the following software versions.
● R&S®GTSL version 3.40 and higher
© 2020 Rohde & Schwarz GmbH & Co. KGMühldorfstr. 15, 81671 München, GermanyPhone: +49 89 41 29 - 0Fax: +49 89 41 29 12 164Email: [email protected]: www.rohde-schwarz.comSubject to change – Data without tolerance limits is not binding.R&S® is a registered trademark of Rohde & Schwarz GmbH & Co. KG.Trade names are trademarks of the owners.
1179.1364.02 | Version 01 | R&S®GTSL
Throughout this manual, products from Rohde & Schwarz are indicated without the ® symbol , e.g. R&S®GTSL is indicated asR&S GTSL.

ContentsR&S®GTSL
3User Manual 1179.1364.02 ─ 01
Contents1 Documentation Overview......................................................................5
2 Software Installation..............................................................................6
3 System Overview................................................................................... 7
4 Quick-Start..............................................................................................9
5 R&S GTSL Instrument Driver Wrapper.............................................. 10
6 R&S GTSL Debug Driver Server......................................................... 11
7 R&S GTSL Debug Panels.................................................................... 12
8 R&S GTSL Server Service Control..................................................... 19
Glossary: R&S GTSL........................................................................... 21

ContentsR&S®GTSL
4User Manual 1179.1364.02 ─ 01
Documentation OverviewR&S®GTSL
5User Manual 1179.1364.02 ─ 01
1 Documentation OverviewThe Debug Driver Server Software is part of the Generic Test Software LibraryR&S GTSL. For this reason, the following documents are useful in addition to this man-ual:
● R&S GTSL Generic Test Software Library User Manual● R&S EGTSL Enhanced Generic Test Software Library User Manual● R&S IC-Check Generic Test Software Library User Manual

Software InstallationR&S®GTSL
6User Manual 1179.1364.02 ─ 01
2 Software InstallationYou can install the Debug Driver Server Package using the installation routine for theGeneric Test Software Library R&S GTSL.
For a detailed description of the installation procedure for the Generic Test SoftwareLibrary R&S GTSL refer to the following document:● R&S GTSL Generic Test Software Library user manual, chapter "Software Installa-
tion".

System OverviewR&S®GTSL
7User Manual 1179.1364.02 ─ 01
3 System Overview
3.1 Block Diagram
Figure 3-1 illustrates how the overall R&S GTSL Software is working with an activeDebug Driver Server Software.
Figure 3-1: System overview
3.2 Information
The Debug Driver Server Software is considered to give application engineers and cir-cuit test engineers another tool for debugging and implementing actual tests.
Do not use the software in productive systems. Since the commands were redirectedover a local server, the runtimes of the messages and the server are added to theactual runtime. The completeness of the messages cannot be ensured, since softwarefrom other platforms is involved.
The R&S GTSL Debug Driver Server Software facilitates the information gathering ofan ongoing measurement. Since the driver contains no interface like this, an addition
Information

System OverviewR&S®GTSL
8User Manual 1179.1364.02 ─ 01
was necessary. The provided application shows additional information even during theactual measurement.
As seen in the block diagram (see Chapter 3.1, "Block Diagram", on page 7), the sys-tem ‘hijacks’ the connection to the driver and sends the information to the R&S GTSLDebug Driver Server. Within the server, information from the incoming commands isextracted, executed on the hardware and information is provided to the R&S DebugPanels.
3.3 Available Instrument Drivers
Currently nine instruments are supported. All other instruments are still working, butthe system is not able to monitor those.
● R&S TS-PIO2● R&S TS-PMB● R&S TS-PSAM● R&S TS-PSM1● R&S TS-PSM2● R&S TS-PSM3● R&S TS-PSM4● R&S TS-PSM5● R&S TS-PSU
Available Instrument Drivers

Quick-StartR&S®GTSL
9User Manual 1179.1364.02 ─ 01
4 Quick-StartThe complete R&S GTSL Debug Driver Server Software was developed to be handyand intuitive. Nevertheless, the following chapter consolidates a short guide for setupand running for a simple use case.
1. Activate the R&S GTSL Debug Driver Software.After the installation of the packages, the system is almost ready for usage. Youjust have to start and enable the server. This is done the easiest way in theR&S GTSL Debug Panels:"File" > "Enable Debugging".You should make sure that no application has loaded a driver meanwhile, or areboot is necessary.
2. Establish a connection.After enabling the system, the instrument driver DLLs within the installation folderof the R&S GTSL software are replaced by the instrument driver wrapper DLLs.Therefore, any application, which uses the binaries in the R&S GTSL installationfolder, will automatically use the debug system. Any "init" method (Prefix_init andPrefix_InitWithOptions) of the instrument driver wrapper DLLs will automaticallyestablish a connection to the server.
3. Execute the test application.Execute your measurement application as usual. The performance of the system isalmost the same. A small overhead is added to every call to the instrument driverwrapper methods.
4. Check information in the R&S GTSL debug panels.The information in the application can be refreshed at any time by the controls onthe bottom. Nevertheless, it is better to refresh the data during a breakpoint or aftera measurement is done. This is because the actual state is mostly unknown, duringa measurement.
5. Disable the R&S GTSL Debug Driver Server Software.After a successful debugging, when the measurement works as expected, youshould disable the system. As already mentioned, there is a small increase in theruntime, which can interfere with the results in the productive system. Therefore,the server should only be active during debugging.

R&S GTSL Instrument Driver WrapperR&S®GTSL
10User Manual 1179.1364.02 ─ 01
5 R&S GTSL Instrument Driver WrapperInstead of executing the commands directly on the hardware, the wrapper redirectsany input and output data to the R&S GTSL Debug Driver Server. The server executesthe command on the hardware and updates its internal state of the hardware. For aconvenient usage, the wrapper DLLs replace the actual instrument drivers in the GTSLfolder. Therefore, any application which uses the genuine delivered DLLs, worksdirectly with this addition.
After the installation of the R&S GTSL software, the wrapper DLLs are located inC:\ProgramData\Rohde-Schwarz\GTSL\BinWrapper. In addition, a secondfolder C:\ProgramData\Rohde-Schwarz\GTSL\BinDriver holds the originalinstrument driver DLLs for restore purposes. During enabling of the system theR&S GTSL instrument driver wrapper DLLs are copied to the installation folder of theGTSL software and overwrite the actual instrument driver. To reverse this action andrestore the actual behavior again, the backed-up instrument driver DLLs are copiedinto the GTSL bin folder.
If a user-defined application does not use the installation folder as source or the pathvariable for the drivers, the debug panels will not work properly.
Do not update firmware while the debug system is active. The wrapper does not sup-port the commands to upload and download the firmware and data stored in the FPGA.Therefore any attempt to update the firmware will not work.

R&S GTSL Debug Driver ServerR&S®GTSL
11User Manual 1179.1364.02 ─ 01
6 R&S GTSL Debug Driver ServerGeneral
The purpose of the server is to accept incoming connections from the wrapper andexecute commands with the actual drivers on the hardware. As mentioned already,most of the drivers do not support the extraction of the current state from the hardware.To overcome this issue, the server now achieves the single access to the hardwareand is able to manage multiple client connections.
Generally, the communication is based on simple TCP sockets opened by the server.The TCP port (default: 35102) can be configured in the settings, to avoid conflict withother services on the machine.
Note that the software will store information and settings into the registry. This is due tothe share status and different information with all involved software modules, i.e. thewrapper binaries. The used registry folder is already established by the GTSL installa-tion:
32Bit: HKLM\SOFTWARE\Rohde&Schwarz\GTSL\64Bit: HKLM\SOFTWARE\WOW6432Node\Rohde&Schwarz\GTSL\
Service implementation
For a more convenient usage, the server is implemented as a Microsoft Windows ser-vice. Effort was put in, to create the tool R&S GTSL Server Service Control (see Chap-ter 8, "R&S GTSL Server Service Control", on page 19). Although the tool has asmall GUI, the complete functionality is also available via the R&S GTSL Debug Pan-els.
User interactions with the server are reduced to a minimum. After installing and startingthe server initially, no further action must be performed until the debug mechanismshould be disabled again. The system is activated even after a system reboot, becausethe service is installed automatically as an automatic start service. Since the server isthe central point of the system, it is necessary to run it before any of the actions to betracked are executed.
The server produces a log file with errors and rudimentary information underC:\ProgramData\Rohde-Schwarz\GTSL\Logs\service_out.txt. If the con-nections from the panel fail to establish, a first hint can be taken from this file. Old logfiles are overwritten, as soon as the server starts.

R&S GTSL Debug PanelsR&S®GTSL
12User Manual 1179.1364.02 ─ 01
7 R&S GTSL Debug Panels
7.1 General
During the startup checks, the global state of the debug system is gathered. If the sys-tem is disabled or the service is not running, the panel shows a warning, stating thatthe system should be enabled first.
Common for the current cards is the display of connections to the analog bus to findestablished connections between single cards. Additionally, the driver version and firm-ware versions are shown at the very end of the list. Other information is chosen individ-ually for every card.
The R&S GTSL Debug Panels application has a simplified layout and control design toreduce user interaction, since the main purpose for the application is to display infor-mation. In fact, the only way to interact with the panel is via two controls on the bottom.The "Refresh" button allows refreshing the information on the active panel once,whereby the "Auto Refresh" switch activates a timer with a tick-rate of one second,which refreshes the panel automatically.
7.2 Main Screen
Main Screen

R&S GTSL Debug PanelsR&S®GTSL
13User Manual 1179.1364.02 ─ 01
1 = Device list2 = Main area (several tabs)3 = Log
The application is divided into three areas, which focus on different functionalities.
● The device list shows all currently initialized instrument drivers on the server.● The main area contains the actual panels.● The log shows the protocol after it was requested.
For convenience, drag-able spacers divide those three areas to change the size of theareas. On the bottom, there is also a status bar, which shows various useful informa-tion of ongoing processes.
7.2.1 Device List
The list on the left holds current initialized devices of the server. Since the system doesnot support all devices (see Chapter 3.3, "Available Instrument Drivers", on page 8),the list only shows the implemented devices. The blue text underneath the TS modulename, shows the actual resource string that you can use to distinguish between differ-ent modules of the same type.
Double-clicking on one of those entries to select the corresponding panel. The panel isthen shown in the current window. If the selected panel is already opened, the tab willbe selected and therefore highlighted in the application.
Main Screen
R&S GTSL Debug PanelsR&S®GTSL
14User Manual 1179.1364.02 ─ 01
The "Refresh" button requests the connection list from the server. Already openeddevice tabs do not close, even if the device is closed on the server already. In addition,you can also use this button, if the connection to the server is closed unexpectedly.
The "Clear" button removes all devices from the device list, but does not close openedtabs.
7.2.2 Panel
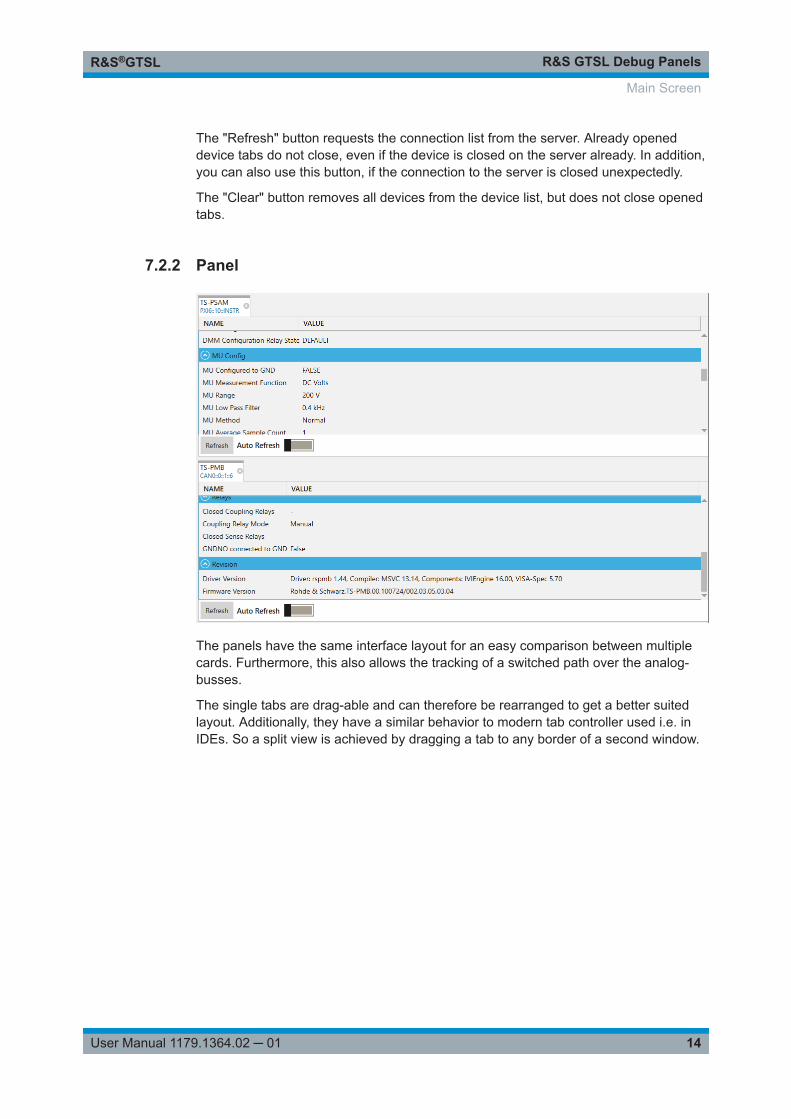
The panels have the same interface layout for an easy comparison between multiplecards. Furthermore, this also allows the tracking of a switched path over the analog-busses.
The single tabs are drag-able and can therefore be rearranged to get a better suitedlayout. Additionally, they have a similar behavior to modern tab controller used i.e. inIDEs. So a split view is achieved by dragging a tab to any border of a second window.
Main Screen

R&S GTSL Debug PanelsR&S®GTSL
15User Manual 1179.1364.02 ─ 01
7.2.3 Log
This control shows a log of all traceable actions done by the R&S GTSL Debug DriverServer. During debugging of a test program or other application, the actual sequenceof actions provide additional information. Such an entry consists of the timestamp, theactual driver with resource number, as well as a comment, where most of informationabout the parameter is given. In cohesion with the actual content in the panel, this cov-ers a large percentage of the achievable status.
By design, the actual log resides on the server. Therefore, the displayed protocol isactually a copy. This allows gathering the complete log, even if the R&S Debug Panelswere started delayed.
Best practice is to display the log after a sequence of interest, since during the requestall actions on the server are delayed.
Besides the possibility to sorting the list by any column, invoked by clicking onto one ofthe headers, there are two filters. One filter is able to filter the list by devices, whichoccur at least once in the log. The other filter enables old entries to sort out. All entrieswith an older timestamp than the given one, are hidden from the user interface.
7.3 Menu Structure
7.3.1 File
Enable Debugging
With the already established system including standalone drivers and several custom-developed applications, introducing the R&S GTSL Debug Driver Server Software is
Menu Structure

R&S GTSL Debug PanelsR&S®GTSL
16User Manual 1179.1364.02 ─ 01
invasive. This is due to the only interface to the hardware is given on file level by thedrivers. To get this work, files have to be replaced in known directories.
Enabling the debugger elevates the user access level and therefore asks for adminis-trator privileges.
To activate the debugging, the R&S GTSL Server Service Control tool overwrites theactual instrument driver with stored wrapper DLLs. If an active program currently hasloaded any of the drivers, Windows is not able to overwrite the files and will throw anerror. This error is caught by the tool and asks the user if it shall install an auto startelement to overwrite the binaries after a restart.
For efficiency, the tool also monitors a status flag in the registry. If the flag is missing(no prior action) or states that the system is disabled, the copy process is executedand the flag is updated accordingly. Since writing into the Program Files directory isonly allowed with administrator privileges, the elevation is done implicitly and askstherefore for according to privileges.
Additionally the tool installs the R&S GTSL Debug Driver Server service as system ser-vice and starts it afterwards. If everything worked well, the panel connects to the serverand refreshes the list of devices.
Disable Debugging
Like the "Enable Debugging" control, the "Disable Debugging" internally controls multi-ple tasks. First, it shuts down the server service and thereby removes any connectionto wrappers and active hardware modules. After that, the tool removes service from thelist of available services.
Disabling the debugger elevates the user access level and asks therefore for adminis-trator privileges.
Finally, the tool overwrites the Wrapper DLLs again with previously stored InstrumentDriver binaries. As last step, the state is updated in the registry, to signal according tomodules. Similar to the enabling process, the disabling could also run into problemswith loaded binaries during copying.
Settings
The "Application" settings hold options to configure the target endpoint of the monitorconnection. Per default, the target address is pointed to localhost to connect to thelocal server. Nevertheless, the application can establish a connection to a remote com-puter. This works only if all firewalls and / or anti-virus allow the connection.
Menu Structure
R&S GTSL Debug PanelsR&S®GTSL
17User Manual 1179.1364.02 ─ 01
To use a different target address, select the upper checkbox. This allows you to editthe two textboxes. The application will not store the settings, after it was closed the val-ues are set to the default again. In addition, as soon as the checkbox is disabled again,the panel connects to the local server again.
The "System" settings mainly focuse on options for the local system. The server port isadjustable, if an already established software on the computer uses the default TCPPort 35102. This setting is read by every module, which participates in the connection.Every wrapper has read access on this variable and establish a connection accordinglyto this option.
Reconfigure the TCP Port, if the port is occupied otherwise. All software modules willuse the new set port.
Additionally, the log level for the server is configurable. This has an effect on the levelof information given in the event log of the server saved in the logfile (see Chap-ter 7.2.3, "Log", on page 15). However, this does not affect the entries created bymethods of the single driver, are stored independent of the level.
The last three points in the system settings determine directories where the softwarecomponents are stored. 'GTSL Bin Folder' state the binary folder within the installationfolder of the GTSL/EGTSL software. This is the target folder for any copy action duringenabling and disabling of the system. The other two folders annotate the folder, wherecopies of the actual drivers and the wrappers are stored respectively.
Changes in the system settings are only applied into the system, after the "Apply" but-ton was clicked. This prevents false configurations, if settings are done accidentally. Ifthe settings window is closed without selecting the "Apply" button, the changes are dis-carded.
Exit
Closes any open connection to the server and shuts down the panel application. Theshutdown does not affect the running server operations.
7.3.2 Log
Request server-log
"Request Server-Log" requests the current log from the server. This log holds allactions initialized by the monitored drivers on the hardware. Resulting in a completehistory of executed commands, even those events before the panel application started.The gathering of the log stalls the server for a few moments, depending on how manyentries the log consists of. During this time, no action from any instrument driver wrap-per can be performed. Be aware of this and request the log preferably after a criticalsituation.
The complete log is shown in the log view on the bottom side of the R&S GTSL DebugPanels after the request was successful. Since this is a server sided log, the entriescannot be reset by restarting the application. A request will gather the complete serverlog again.
Menu Structure

R&S GTSL Debug PanelsR&S®GTSL
18User Manual 1179.1364.02 ─ 01
Save server-log
After requesting and gathering the server log, those entries can also be saved in a CSVfile. After selecting the "Save Server-Log" entry in the menu, a new dialog will open tochoose the actual file name for saving. This can be interesting for different analysisafter a debugging session or to compare it with other runs of the same sequence. Thewhole log is stored to a file.
7.3.3 Help
The "Help" button will open a window, which shows some information about the versionand copyright details.
Menu Structure

R&S GTSL Server Service ControlR&S®GTSL
19User Manual 1179.1364.02 ─ 01
8 R&S GTSL Server Service Control
8.1 General
This tool has the purpose to control the service and enable/disable the debugging sys-tem on the computer. In order to provide those functionalities, there are some addi-tional internal features.
The tool automatically elevates to administrator rights, if they are not already assigned.Administrator rights are needed for both of the core mechanisms. Additionally, the toolhas an interface to control the windows services. This provides functionality to querythe current state of the services and to start/stop them.
Each time the tool is put in focus, it updates the states of the switches.
For a convenient usage, the tool has a simple GUI which enables the user to easilycontrol the different modules. Additionally, there is a start parameter to use the tool viawindows command shell or other applications, like the debug panels.
8.2 GUI
The controls act as a display for the actual state and as control to change the descri-bed functionality. Use a single click to control the switches. As soon as the switch haschanged its state, the actual process is finished in the background.
Debug Function
The first switch enables/disables the debugging system. When active, it displays theactual state by reading the status from the registry. If the switch is turned off, the origi-nal drivers are activated and no debugging can be done. After switching the control,the tool first tries to copy all available wrappers and overwrites the driver. If not allbinaries could be copied, since one driver is still in use, a dialog pops up to ask if anautostart object should be created. This also works in the reverse way during disabling
GUI
R&S GTSL Server Service ControlR&S®GTSL
20User Manual 1179.1364.02 ─ 01
of the system. Finally, the registry is updated to reflect the current state of the debug-ging system.
Install Service
The second switch is in charge to install/uninstall the service. Also here the first stateafter starting is shown, if the service is currently installed "On" or not installed "Off". Byswitching the control, the service will either be installed or uninstalled, respectively.Since for this action, the actual server binary must be accessible, the tool should belocated within the same folder as the server binary.
Start Service
As last method, the service can also be started or stopped with the tool. Since the ser-vice is installed in auto start mode, this option may be seldom used.
8.3 Command-Line Parameter
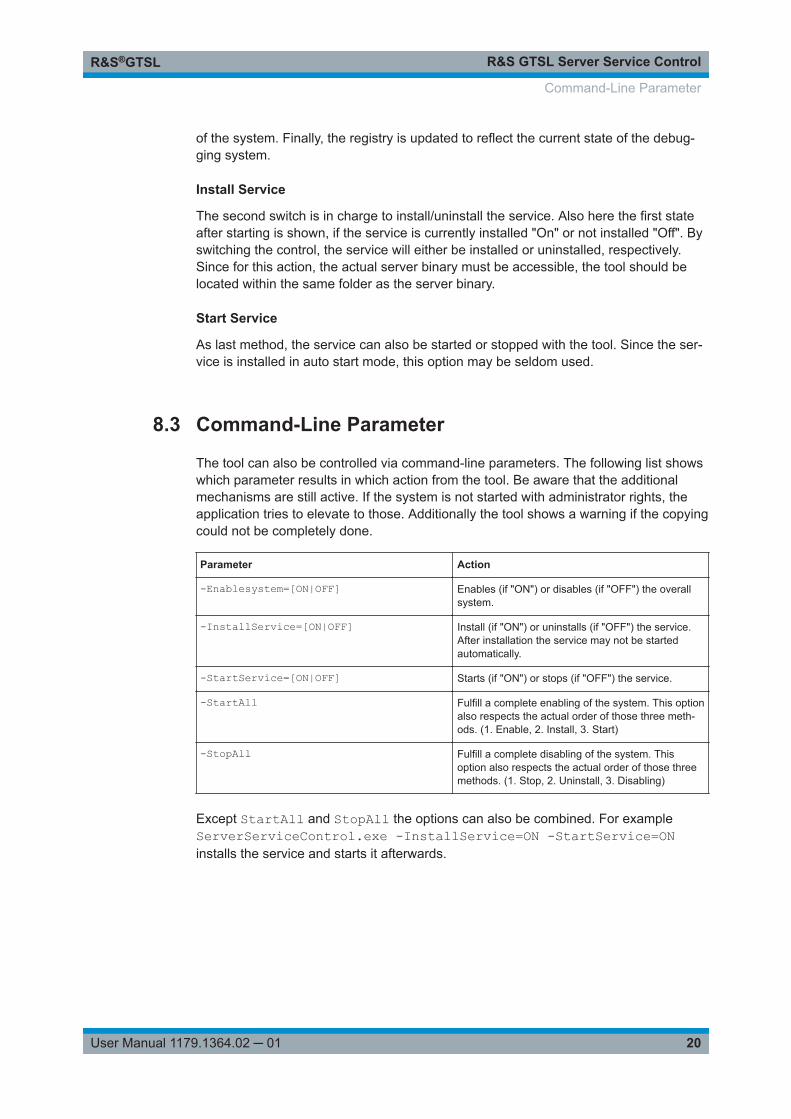
The tool can also be controlled via command-line parameters. The following list showswhich parameter results in which action from the tool. Be aware that the additionalmechanisms are still active. If the system is not started with administrator rights, theapplication tries to elevate to those. Additionally the tool shows a warning if the copyingcould not be completely done.
Parameter Action
-Enablesystem=[ON|OFF] Enables (if "ON") or disables (if "OFF") the overallsystem.
-InstallService=[ON|OFF] Install (if "ON") or uninstalls (if "OFF") the service.After installation the service may not be startedautomatically.
-StartService=[ON|OFF] Starts (if "ON") or stops (if "OFF") the service.
-StartAll Fulfill a complete enabling of the system. This optionalso respects the actual order of those three meth-ods. (1. Enable, 2. Install, 3. Start)
-StopAll Fulfill a complete disabling of the system. Thisoption also respects the actual order of those threemethods. (1. Stop, 2. Uninstall, 3. Disabling)
Except StartAll and StopAll the options can also be combined. For exampleServerServiceControl.exe -InstallService=ON -StartService=ONinstalls the service and starts it afterwards.
Command-Line Parameter

Glossary: R&S GTSLR&S®GTSL
21User Manual 1179.1364.02 ─ 01
Glossary: R&S GTSLD
Debug Driver Server: Central running service which accepts connections from theWrapper and handles also the connection to the R&S Debug Panels.
Debug Driver System: The name for the collection of the Instrument Driver Wrapper,the Debug Driver Server, the R&S Debug Panels and the Server Service Control tool.
Debug Panels: Application to display the gathered information and control the DebugDriver System.
IInstrument Driver: Delivered driver DLLs for the TS- Modules.
Instrument Driver Wrapper: Replacements for the Instrument Driver, which connectto the Debug Driver Server and redirect all of the necessary info. These files replacethe original DLL's if the system is enabled.
SServer Service Control: A small tool which is capable of install/start the service andenable/disable the whole Debug Driver System.