
RReeppoorrtt oonn EEccoonnoommiicc aanndd FFiinnaanncciiaall
115
R R e e p p o o r r t t o o n n E E c c o o n n o o m m i i c c a a n n d d F F i i n n a a n n c c i i a a l l D D e e v v e e l l o o p p m m e e n n t t s s Second Quarter 2013
Transcript of RReeppoorrtt oonn EEccoonnoommiicc aanndd FFiinnaanncciiaall

RReeppoorrtt oonn
EEccoonnoommiicc aanndd
FFiinnaanncciiaall
DDeevveellooppmmeennttss
SSeeccoonndd QQuuaarrtteerr 22001133

Report on Economic and Financial Developments
EXECUTIVE SUMMARY 1
A. REAL SECTOR
AGGREGATE SUPPLY AND DEMAND 12
LABOR AND EMPLOYMENT 14
B. FISCAL SECTOR
NATIONAL GOVERNMENT CASH OPERATIONS 16
C. MONETARY SECTOR
PRICES 18
DOMESTIC LIQUIDITY 22
DOMESTIC INTEREST RATES 23
MONETARY POLICY DEVELOPMENTS 26
D. FINANCIAL SECTOR
BANKING SYSTEM 27
BANKING POLICIES 34
CAPITAL MARKET REFORMS 34
STOCK MARKET 34
BOND MARKET 38
CREDIT RISK ASSESSMENT 39
PAYMENTS AND SETTLEMENTS SYSTEM 45
E. EXTERNAL SECTOR
BALANCE OF PAYMENTS 47
INTERNATIONAL RESERVES 60
EXCHANGE RATE 61
EXTERNAL DEBT 63
FOREIGN INTEREST RATES 66
GLOBAL ECONOMIC DEVELOPMENTS 69
F. FINANCIAL CONDITION OF THE BSP
BALANCE SHEET 72
INCOME STATEMENT 73
G. CHALLENGES AND FUTURE POLICY DIRECTIONS 74 ANNEXES 79
STATISTICAL TABLES

Bangko Sentral ng Pilipinas | 1
Report on Economic and Financial Developments Second Quarter 2013
EXECUTIVE SUMMARY
A. Key Economic Developments
The Philippine economy accelerated by 7.5
percent in Q2 2013 supported mainly by the
industry and services sectors. On the
expenditure side, growth was propelled by
strong capital formation and government as
well as private consumption expenditures.
This brought the country’s real GDP growth to
7.6 percent in the first semester of 2013.
The robust economic expansion was
accompanied by low inflation, with headline
inflation remaining near the low end of the
target range of 4±1 percent for 2013.
Headline inflation eased during the period
due mainly to lower non-food inflation, owing
to lower electricity rates and domestic
petroleum prices.
Meanwhile, the growth in domestic liquidity
or M3 supported the rise of economic
activity. The increase in M3 reflected the
robust expansion in net domestic assets
(NDA) arising from the sustained growth in
bank lending to the private sector.
Meanwhile, the BSP maintained its key policy
rates during the quarter as inflation
environment remained benign over the policy
horizon. The BSP, however, reduced the
interest rates on the special deposit account
(SDA) facility to 2.0 percent regardless of
tenor effective end-April 2013. The
adjustment was in line with the BSP’s
continuing efforts to fine-tune its monetary
policy instruments and thereby gain greater
flexibility in conducting monetary operations,
and also to ensure adequate liquidity for
economic activity.
The cash operations of the National
Government (NG) yielded a surplus as a result
of improved collections by the Bureau of
Internal Revenue (BIR). The surplus was a
reversal from the deficit recorded in the same
period in 2012.
In the financial sector, investors’ sentiment
was boosted by the country's sound
macroeconomic fundamentals as well as the
recent upgrade of the country’s credit rating
to investment grade which offset the impact
of negative developments from overseas. As a
result, the PSEi peaked at 7,392.2 index points
on 15 May before closing lower at 6,465.3
index points on June due to concerns on the
US Federal Reserve's impending tapering of
its bond purchases. Meanwhile, the persistent

Bangko Sentral ng Pilipinas | 2
Report on Economic and Financial Developments Second Quarter 2013
downside risks in the global outlook caused
the country’s sovereign bond spreads to
widen.
The Philippine banking system remained
strong amid the challenging global economic
environment. Asset quality continued to
improve, while capital adequacy ratios (CARs)
remained above international standards. As
of end-December 2012, the U/KB banking
industry’s average CARs stood at 17.3 percent
and 18.4 percent on solo and consolidated
bases, which were both higher than last
year’s 16.7 percent and 17.7 percent,
respectively.
The economy also continued to gain support
from the external sector’s favorable position.
The balance of payments (BOP) surplus in
Q2 2013 increased to US$1.0 billion from
US$75 million in the comparable period a
year ago.
Meanwhile, the country’s gross international
reserves (GIR) continued to grow to a level
sufficient to cover 11.8 months worth of
imports of goods and payments of services
and income. However, the peso weakened
due mainly to repricing of risk fuelled by
uncertainty about the exit from monetary
policy stimulus in the US. Nonetheless, the
continued strong foreign exchange inflows
from OF remittances tempered the further
depreciation of the peso.
The Philippine economy sustains robust
growth. Real Gross Domestic Product (GDP)
accelerated by 7.5 percent in Q2 2013, faster
than the 6.3 percent growth posted a year
ago. On the supply side, industry and services
sectors supported the economic growth. On
the demand side, strong capital formation
and government as well as private
consumption expenditures propelled growth.
This brought the country’s real GDP growth to
7.6 percent in the first semester of 2013.
Labor market conditions remain soft. Based
on the results of the April 2013 Labor Force
Survey (LFS) of the National Statistics Office
(NSO), the unemployment rate was higher at
7.5 percent in the second quarter of 2013
relative to the 6.9 percent recorded in the
same quarter of 2012. There was an observed
improvement in the quality of employment
even as the overall level of employment
decreased slightly by 0.1 percent year-on-
year. Employment in the agriculture sector
contracted (-5.0 percent). However, the
impact of the decline in the employment in
the agriculture sector was cushioned by
increased employment in the services (1.9

Bangko Sentral ng Pilipinas | 3
Report on Economic and Financial Developments Second Quarter 2013
percent) and industry (3.8 percent) sectors,
which generated 224,000 and 380,000
additional jobs, respectively. The growth in
employment in the industry sector came
primarily from construction, manufacturing
and mining and quarrying. Meanwhile, the
additional jobs generated in the services
sector were mainly in the tourism-related
industries, such as accommodation and food
service activities, transportation and storage,
as well as arts, entertainment and recreation.
Of the 37.8 million total employed persons,
52.6 percent were employed by the services
sector, while the agriculture and industry
sectors employed 31.3 percent and 16.1
percent, respectively. The ratio of the
underemployed to total employed persons
declined marginally to 19.2 percent during
the review period from 19.3 percent in the
comparable period in 2012.
NG cash operations yield a surplus. The cash
operations of the National Government (NG)
yielded a surplus of P15.2 billion in Q2 2013.
This level was a reversal from the P0.5 billion
deficit recorded in the same period in 2012
and the programmed deficit of P10.8 billion
during the review period. Total revenues
reached P475.1 billion for the review period,
higher than the year-ago level of P399.9
billion due mainly to improved collections by
the Bureau of Internal Revenue (BIR).
Meanwhile, total expenditures reached
P460.0 billion in Q2 2013, 14.9 percent higher
than the P400.4 billion expenditures incurred
a year ago, although this amount was 6.7
percent lower than the P493.0 billion
programmed expenditures for the quarter.
The bulk of expenditures was channeled to
infrastructure spending and capital outlays.
Inflation eases. Headline inflation decreased
to 2.6 percent year-on-year (y-o-y) in Q2 2013
from the quarter-ago and year-ago rates of
3.2 percent and 2.9 percent, respectively.
The slowdown in headline inflation was
traced mainly to lower non-food inflation,
owing to lower electricity rates and domestic
petroleum prices. Likewise, lower inflation on
most food items, particularly rice, corn, fish,
milk, oils, and sugar, was recorded during the
quarter. Core inflation, which excludes some
food and energy items to measure
generalized price pressures, also fell to 3.0
percent in Q2 2013 from 3.8 percent in the
previous quarter and 3.7 percent a year ago.
Domestic liquidity expands further. Money
supply or M3 grew by 20.0 percent y-o-y as
of end-June 2013 to reach P5.7 trillion. This
growth was faster than the 13.4 percent
expansion as of end-March 2013. The

Bangko Sentral ng Pilipinas | 4
Report on Economic and Financial Developments Second Quarter 2013
increase in M3 was driven by the 11.1
percent y-o-y expansion in domestic claims in
June 2013. Credits extended to the private
sector grew by 15.9 percent, consistent with
the sustained expansion in bank lending to
bolster economic activity. Similarly, net
claims on the central government rose by 1.8
percent in June, largely as a result of the
increase in investments in National
Government securities. Similarly, net foreign
assets (NFA) also grew by 6.0 percent y-o-y in
June 2013. The BSP’s international reserves
rose further due mainly to robust foreign
exchange inflows from overseas remittances
and BPO receipts. However, the NFA of banks
contracted further as banks’ foreign liabilities
continued to increase given higher
placements and deposits made by foreign
banks with their local branches and other
banks, while their foreign assets decreased
due to the decline in loan receivables from
and deposits with foreign banks.
The BSP maintains key policy rates but cuts
SDA rates. During its monetary policy
meetings on 25 April and 13 June 2013, the
BSP decided to maintain its key policy interest
rates at 3.50 percent for the overnight
borrowing or reverse repurchase (RRP) facility
and 5.50 percent for the overnight lending or
repurchase (RP) facility. The interest rate on
term RRPs and RPs were also maintained. The
reserve requirement ratios were kept steady
as well. The Monetary Board’s (MB) policy
rate decisions were based on its assessment
that the inflation environment remained
benign over the policy horizon. Latest
baseline forecasts indicated that inflation will
remain within target for 2013 until 2015,
supported by well-anchored inflation
expectations. With the current stronger pace
of domestic liquidity growth, inflation is still
expected to remain manageable over the
policy horizon given improvements in the
economy’s absorptive capacity. Keeping
policy settings steady also allows time to
assess the impact of recent fine-tuning in
monetary operations. Recent global financial
market developments also support an
unchanged policy stance. Meanwhile, the BSP
reduced the interest rates on the SDA facility
by 50 bps during its policy meeting on 25 April
2013. By end-April 2013, the SDA rate was set
to 2.0 percent regardless of tenor. The MB
noted that the benign inflation environment
and robust domestic growth prospects
provided scope for further enhancing the
efficiency of monetary operations in
absorbing liquidity through the SDA facility.
The adjustment was also in line with the BSP’s
continuing efforts to fine-tune its monetary
policy instruments and thereby gain greater

Bangko Sentral ng Pilipinas | 5
Report on Economic and Financial Developments Second Quarter 2013
flexibility in conducting monetary operations,
and also to ensure adequate liquidity for
economic activity.
Domestic market interest rates rise. Yields on
government securities in both primary and
secondary markets increased during the
quarter driven mainly by cautious selling
activities due to expectations of a US scale
down of its quantitative easing program (QE3)
amid signs of some recovery in the US
economy.
The Philippine banking system remains
sound and stable. The Philippine banking
system remained resilient amid the subdued
global economic environment. Banks’ core
balance sheets were marked by steady
growth in assets, deposit base, and capital
accounts. Asset quality also continued to
improve, while capital adequacy ratios
remained above international standards.
The total resources of the banking system
rose by 6.0 percent and 16.3 percent to P8.9
trillion as of end-June 2013 from quarter- and
year- ago levels of P8.4 trillion and P7.7
trillion, respectively due to the growth in
loans, securities, and other equities indicative
of the public’s continued trust in the banking
system. Outstanding loans of commercial
banks, net of banks' RRP placements with the
BSP as of end-June 2013, grew by 12.3
percent y-o-y and 3.9 percent q-o-q.
Meanwhile, the U/KBs gross non-performing
loans (GNPL) ratio sustained its downward
path, easing to 2.75 percent as of end-May
2013 from 3.17 percent in the comparable
period in 2012 while the net non-performing
loans (NNPL) ratio was at 0.44 percent.
Banks’ initiatives to improve asset quality
along with prudent lending regulations
helped bring the NPL ratios to below its pre-
Asian crisis level of around 3.5 percent.
As of end-December 2012, the U/KB banking
industry average CARs stood at 17.3 percent
and 18.4 percent on solo and consolidated
bases, which were both higher than last
year’s 16.7 percent and 17.7 percent,
respectively, as banks either increased their
retained earnings or issued capital
instruments to match the rise in their risk-
weighted assets in line with increased lending
activity.
The equities market rallies to a new high. In
Q2 2013, strong domestic macroeconomic
fundamentals offset the impact of negative
developments from overseas to lift the
Philippine Stock Exchange index (PSEi). The
PSEi averaged 6,836.0 index points, higher by

Bangko Sentral ng Pilipinas | 6
Report on Economic and Financial Developments Second Quarter 2013
6.2 percent and 34.2 percent relative to first
quarter’s and the previous year’s levels,
respectively. Trading was lifted by optimism
over the strong Philippine economic outlook,
ample market liquidity, following the third
BSP SDA rate cut in April and the credit rating
upgrades of the Philippines to investment
grade by S&P in early May and by Fitch Rating
in late March. However, the local index
dipped to mirror the retreat in markets’
overseas after the US Federal Reserve
signaled that it could start unwinding its QE
measures later this year.
Debt spreads widen anew. The upgrade in
the country’s credit rating did not translate
into a significant narrowing of debt spread.
Credit spreads closed the second quarter
wider relative to the previous quarter’s level
and on a year-on-year basis, reflecting
heightened risk aversion towards the
country’s debt papers. The Emerging Market
Bond Index (EMBI)+ Philippine spreads
averaged 147.4 bps, up from the first
quarter’s 136.2 bps while credit default swaps
(CDS) spreads inched up to average 102.7 bps
from 101.8 bps. Against those of neighboring
economies, the Philippine CDS traded lower
than Indonesia’s average of 164.5 bps and
closer to Thailand’s 95.3 bps and Malaysia’s
90.3 bps.
BOP surplus surges as current and financial
accounts improve appreciably. The country’s
balance of payments position yielded a higher
surplus of US$1 billion in Q2 2013 compared
to only US$73 million in the comparable
period a year ago. The significant upturn in
the external payments position was due
largely to the higher current account surplus
combined with the reversal of financial
account from net outflows to net inflows. The
improvement in the current account surplus
emanated mainly from increased net receipts
in secondary income and services while net
inflows in the financial account were
attributed to net inflows in the portfolio
investment account.
International reserves continued to rise.
Gross international reserves (GIR) continued
to accumulate, growing by 6.7 percent from
year-ago levels to reach US$81.3 billion as of
end-June 2013. This is, however, slightly
lower than that of the previous quarter as
market volatilities following talks of a
possible tapering by the US of its quantitative
easing dampened the monthly build-up of the
GIR. In addition, gold prices in the world
market continued to decline. Nevertheless,
the country’s GIR remains adequate to cover
11.8 months’ worth of imports of goods and

Bangko Sentral ng Pilipinas | 7
Report on Economic and Financial Developments Second Quarter 2013
payments of services and income. It is also
equivalent to 7.8 times the country’s short-
term external debt based on original maturity
and 5.3 times based on residual maturity.
Debt ratios remain at comfortable levels. As
of end-June 2013, the outstanding BSP-
approved/registered external debt stood at
US$58.0 billion, reflecting a drop of US$1.0
billion or 1.8 percent from US$59.0 billion in
the previous quarter. On a y-o-y basis, the
debt stock likewise declined by US$3.2 billion
(5.3 percent) from US$61.2 billion in June
2012.
The decline in the debt stock in Q2 2013
resulted from negative foreign exchange (FX)
revaluation adjustments (US$725 million),
particularly in yen-denominated loans as the
US dollar strengthened; and net loan
repayments (US$450 million) largely by the
public sector. These were partially offset by
an increase in non-residents’ investments in
Philippine debt papers (US$120 million),
notwithstanding concerns about the tapering
of the US Fed’s quantitative easing (QE)
program.
Similarly, the y-o-y decline was due mainly to
negative FX revaluation adjustments (US$3.2
billion) and transfers to residents of Philippine
debt papers held by non-residents (US$660
million), partially offset by net availments
(US$480 million) and previous periods’
adjustments (US$150 million).
The country’s external debt ratio sustained its
improving trend, declining to 18.3 percent
from 19.1 percent and 21.9 percent in the
previous quarter and a year ago, respectively.
Similarly, the external debt to GDP ratio was
estimated at 21.8 percent during the review
period, lower than the 22.8 percent a quarter
ago and 26.1 percent posted a year ago.
The peso depreciates. The peso averaged
weaker at P41.78/US$1, depreciating by 2.56
percent from the previous quarter’s average
of P40.71/US$1. The peso’s weakening was
due mainly to repricing of risk fuelled by
uncertainty about the exit from monetary
policy stimulus in the US. Nonetheless, the
continued strong foreign exchange inflows
from OF remittances tempered the further
depreciation of the peso.
The global economy picks up slightly. In
recent years, global economic growth was led
by emerging economies, but this has been
showing signs of slackening lately as growth in
mature economies picked up slowly. Global
labor market conditions improved gradually

Bangko Sentral ng Pilipinas | 8
Report on Economic and Financial Developments Second Quarter 2013
except in the euro area. Inflation rates of
advanced economies were generally lower
while those of emerging markets showed
mixed trends.
The massive monetary stimulus adopted by
advanced economies helped fuel their
economic growth. The US GDP growth rate in
the second quarter accelerated slightly to 1.4
percent from the previous quarter’s 1.3
percent. This growth reflected primarily
positive contributions from personal
consumption expenditures, exports, non-
residential fixed investments, private
inventory investments, and residential
investments.
In Japan, economic gains were also posted in
the second quarter of 2013, with GDP
growing by 0.9 percent from the last quarter’s
0.3 percent due to stronger domestic and
external demand.
Among the newly-industrialized economies in
Asia, Hong Kong, South Korea and Singapore
grew by 3.3 percent, 2.3 percent, and 3.7
percent, respectively. Meanwhile, China’s
GDP slightly slowed down to 7.5 percent in
the second quarter compared to 7.7 percent
in the previous quarter. Weak industrial
output, sluggish fixed-asset investment
expansion and lackluster exports weighed
down on China’s growth.
B. Challenges and Policy Directions
Overall global economic conditions remain
fragile as risks of weaker growth in emerging
economies have increased due to domestic
capacity constraints, weak external demand
and possibility of tighter financial conditions
should the unwinding of unconventional
monetary policy in the US lead to capital flow
reversals.
In addition, there are concerns on the geo-
political uncertainty in the Middle East,
specifically in Syria and Egypt, which could
lead to oil supply disruptions and higher oil
prices, and volatility in the global financial
markets.
In its World Economic Outlook Update (July
2013), the International Monetary Fund (IMF)
downscaled its global growth projections
relative to forecasts released in April 2013,
reflecting slower growth in emerging markets
and continued recession in the euro area.
The biggest challenge for policymakers is to
strengthen global economic growth.
Specifically, major advanced economies face

Bangko Sentral ng Pilipinas | 9
Report on Economic and Financial Developments Second Quarter 2013
the challenge of maintaining a supportive
macroeconomic policy mix, combined with
credible plans for reaching medium-term debt
sustainability and reforms to restore balance
sheets and credit channels. Many emerging
market and developing economies face a
tradeoff between macroeconomic policies to
support weak activity and those to contain
capital outflows. Macroprudential and
structural reforms can mitigate the risks
associated with this tradeoff.
While global growth projections from the IMF
were revised downwards, that of the
Philippines was adjusted upwards. The
Philippines needs to keep the economy on a
steady growth course, requiring policies
largely aimed at sustaining domestic sources
of growth to help compensate for any
weaknesses in external demand. In this
regard, close coordination between fiscal and
monetary policies will help ensure that the
macroeconomic environment remains
supportive of sustainable and balanced
growth.
The favorable fiscal position of the NG
provides sufficient policy space to support
projects that will continue to stimulate
aggregate demand. Growth could further
accelerate once the implementation of
various infrastructure projects gain
momentum. Furthermore, continuing social
spending programs for health, education,
housing, employment, and conditional cash
transfers, as well as initiatives for financial
inclusion and consumer protection, shall help
promote inclusive and sustainable growth.
For its part, the BSP remains committed to its
mandate of safeguarding price stability and
ensuring a macroeconomic environment
conducive to sustained growth. The risks to
inflation outlook remain broadly balanced,
supporting the argument for keeping policy
rates steady. Downside risks to the inflation
outlook continue to persist owing to
uncertainty over the strength of the global
economy and its impact on international
commodity prices. Meanwhile, the upside
pressures could emanate from the likelihood
of higher electricity rates and continued
strong liquidity growth.
The pronouncements by the US Fed
prompted portfolio adjustments in global
financial markets, which in turn, generated
increased volatility in the equity, bond and
foreign exchange markets. Such volatility
could recur over the short term as these
markets try to fully assess and price in the
impact of unwinding of the US QE program.

Bangko Sentral ng Pilipinas | 10
Report on Economic and Financial Developments Second Quarter 2013
Capital flow reversals, however, could ensue
if underlying vulnerabilities in emerging
markets are left unchecked.
The Institute for International Finance (IIF)
forecasts a decline in private capital flows to
emerging markets in the next two years as
yield spreads narrow with the eventual exit
from extraordinary monetary stimulus by the
US Fed. Nonetheless, capital inflows into the
Philippines are likely to remain substantial.
The IIF has acknowledged that strong growth
potential along with recent sovereign credit
ratings upgrade would continue to attract
foreign interest into the country.
However, the eventual scaling back of
extraordinary monetary measures by the US
Federal Reserve could consequently lead to
corrections in the foreign exchange market
and weakening of the domestic currency.
Some of the corrections may have in fact
helped reduce the risk of a build-up of
stretched asset valuations and the risk of
“search for yields’’ that could contribute to
financial market imbalances. These, however,
should be counterbalanced by the steady
stream of remittances and continued capital
inflows into the country.
Against this backdrop, the BSP stands ready
to employ, from its menu of policy
instruments, measures that will help ensure
that the benefits of capital flows are
maximized while warding off the potential
destabilizing impact of volatile capital flows
on price and financial stability. The BSP will
also continue to maintain a market-
determined exchange rate, while guarding
against speculative flows that could
contribute to the peso’s volatility and
undermine the inflation target.
Amid downside risks to global economic
prospects on the horizon, contingency
measures are in place to ensure adequate
liquidity in the financial system, should capital
flows reverse course. The BSP will maintain a
comfortable level of international reserves to
serve as added insurance against external
shocks.
On banking regulation and supervision, the
BSP will sustain the reform momentum with a
view to strengthen its resilience against
shocks as well as to enhance its role as a
catalyst for durable long-term economic
growth. Toward this end, the BSP continues
to enhance its monitoring of financial market
developments as it also continues to put in
place measures to strengthen the capacity of

Bangko Sentral ng Pilipinas | 11
Report on Economic and Financial Developments Second Quarter 2013
the banking system to endure shocks,
including the adoption of expanded reporting
standards for real estate exposures as well as
the Basel III capital adequacy standards
beginning January 2014. Likewise, the BSP
continues to take the lead in promoting
financial inclusion with programs and reforms
aimed at promoting greater access to
financial services.
The BSP also remains proactive in ensuring
the credibility of the payments and
settlements system with the continued
enhancement of its processes in accordance
with international best practices.
Finally, amid the increasing
interconnectedness of global financial
markets, the BSP will remain an active
participant in regional and international
cooperation programs and fora, in order to
reap the benefits of collaborative
engagement.

Bangko Sentral ng Pilipinas | 12
Report on Economic and Financial Developments Second Quarter 2013
A. Real Sector Aggregate Supply and Demand
The Philippine economy continued to exhibit vibrant growth in the
second quarter of 2013. Real Gross Domestic Product (GDP)
accelerated by 7.5 percent in Q2 2013, faster than the 6.3 percent
growth posted a year ago. On the supply side, industry and services
sectors supported the economic growth. On the demand side, strong
capital formation and government as well as private consumption
expenditures propelled growth. This brought the country’s real GDP
growth to 7.6 percent in the first semester of 2013.
GDP by industry
The services sector remained the key source of growth for the
Philippine economy during the quarter in review after contributing
4.4 percentage points to real GDP growth. Growth in this sector was
at 7.4 percent in the second quarter of 2013, albeit lower than the
7.7 percent posted in the previous year. Contributing largely to the
services sector’s sustained growth during the review quarter was the
0
2
4
6
8
10
Q1 Q2 Q3 Q4 Q1 Q2 Q3 Q4 Q1 Q2
2011 2012 2013
Gross Domestic Product and Gross National Income Annual growth rate in percent, at constant 2000 prices
Real GDP Real GNI
The Philippine
economy sustains
robust growth
MAIN REPORT
Services continue to
drive output expansion

Bangko Sentral ng Pilipinas | 13
Report on Economic and Financial Developments Second Quarter 2013
9.6 percent expansion in financial intermediation and 9.5 percent
acceleration in real estate, renting and business activities (which
includes the buoyant business process outsourcing industry) sub-
sectors supported by strong business and consumer confidence as
well as low interest rates which continued to support bank lending
activities. Other major contributors to the services sector’s growth
were other services (7.4 percent); trade and repair of motor vehicles,
motorcycles, personal and household goods (7.3 percent); public
administration and defense which include compulsory social security
(5.9 percent).
The industry sector contributed 2.5 percentage points to the real GDP
growth during the review quarter. The industry sector grew by
10.3 percent in Q2 2013, as against the 5.8 percent in the same
period last year. The major contributors to the positive performance
of this sector were the sustained double-digit growth in construction
(17.4 percent) supported by continued expansion in both public and
private construction; and manufacturing (10.3 percent) driven mainly
by the expansion in food manufactures and chemical products.
-5
0
5
10
15
Q1 Q2 Q3 Q4 Q1 Q2 Q3 Q4 Q1 Q2
2011 2012 2013
Gross Domestic Product, by industry Annual growth rate in percent, at constant 2000 prices
Agriculture, Hunting, Forestry and Fishing Industry Services

Bangko Sentral ng Pilipinas | 14
Report on Economic and Financial Developments Second Quarter 2013
The agriculture, hunting, forestry and fishing (AHFF) sector also
posted positive contribution of 0.7 percentage point to the real GDP
growth during the review period, even as this sector contracted
slightly by 0.3 percent in the second quarter of 2013 compared to the
same period last year. The decline can be attributed to lower corn
and palay yields due to intense heat experienced in some areas of the
country during the summer months of 2013; and poor banana and
coconut harvests brought about by a typhoon in Mindanao. On the
other hand, mango production rebounded in the first semester of
2013 after a decline in the same period last year. While majority of
the crop production contracted in the second quarter of 2013,
fisheries and forestry production remains positive, which moderated
the decline in the overall AHFF.
GDP by expenditure
On the expenditure side, private consumption, along with capital
formation and government spending boost output growth. The strong
growth of capital formation was driven largely by the continued
improvement of construction activities, both public and private, as
well as expansion in intellectual property products. Meanwhile, the
robust government consumption during the review quarter was
propelled by higher public spending due to increase disbursements to
finance the implementation of the projects and programs of the
different government department and agencies.
Labor and Employment
Based on the results of the April 2013 Labor Force Survey (LFS) of the
National Statistics Office (NSO), the unemployment rate was higher at
7.5 percent in the second quarter of 2013 relative to the 6.9 percent
recorded in the same quarter of 2012 (Table 2).
Employment figures reflect soft labor market conditions

Bangko Sentral ng Pilipinas | 15
Report on Economic and Financial Developments Second Quarter 2013
There was an observed improvement in the quality of employment
even as the overall level of employment decreased slightly by 0.1
percent year-on-year. Employment in the agriculture sector
contracted (-5.0 percent). However, the impact of the decline in the
employment in the agriculture sector was cushioned by increased
employment in the services (1.9 percent) and industry (3.8 percent)
sectors, which generated 224,000 and 380,000 additional jobs,
respectively. The growth in employment in the industry sector came
primarily from construction, manufacturing and mining and
quarrying. Meanwhile, the additional jobs generated in the services
sector were mainly in the tourism-related industries, such as
accommodation and food service activities, transportation and
storage, as well as arts, entertainment and recreation. Of the 37.8
million total employed persons, 52.6 percent were employed by the
services sector, while the agriculture and industry sectors employed
31.3 percent and 16.1 percent, respectively. The ratio of the
underemployed to total employed persons declined marginally to
19.2 percent during the review period from 19.3 percent in the
comparable period in 2012. Of the 7.3 million underemployed
persons, 42.2 percent were in the services sector, while the
underemployed in the agriculture and industry sectors accounted for
15
17
19
21
23
25
6.0
6.5
7.0
7.5
8.0
8.5
9.0
Q1 Q2 Q3 Q4 Q1 Q2 Q3 Q4 Q1 Q2 Q3 Q4 Q1 Q2
2010 2011 2012 2013
Unemployment and Underemployment Rates In percent
Unemployment Rate
Underemployment Rate (RHS)

Bangko Sentral ng Pilipinas | 16
Report on Economic and Financial Developments Second Quarter 2013
the remaining 40.9 percent and 16.9 percent of the total,
respectively.
Classified by status of employment, employment increased at a
slower pace compared to the second quarter of 2012 among wage
and salary workers (2.9 percent from 4.3 percent). Meanwhile,
employment declined from the levels in the same quarter a year-ago
among self-employed workers (-1.3 percent from 0.5 percent),
employers in own-family operated farm or business workers 1
(-8.0 percent from -4.0 percent) and workers without pay in own
family-operated farm or business (-8.8 percent from 3.6 percent).
B. Fiscal Sector
National Government Cash Operations
The cash operations of the National Government (NG) yielded a
surplus of P15.2 billion in Q2 2013. This level was a reversal from the
P0.5 billion deficit recorded in the same period in 2012 and the
programmed deficit of P10.8 billion during the review period.
1 An employer is a person working in his own business, farm, profession or trade who has one or more regular paid employees, including paid family members. Domestic helpers, family drivers and other household helpers who assist in the family-operated business, regardless of time spent in this activity, are not hired employees in the enterprise/business. A retail store operator who is wholly assisted in the operation of his store by unpaid relatives living with him and who employs carpenters to construct a new building for his store (with store operator supervising the work) is not an employer. However, if an operator happens to be the owner or partner of a big firm which has its own construction unit to take care of its needs, the operator is an employer. (source: http://www.bles.dole.gov.ph/)

Bangko Sentral ng Pilipinas | 17
Report on Economic and Financial Developments Second Quarter 2013
Total revenues reached P475.1 billion for the review period, higher
than the year-ago level of P399.9 billion due mainly to improved
collections by the Bureau of Internal Revenue (BIR). The Q2 2013
revenue level was 1.5 percent lower than the target level for the
quarter of P482.2 billion. Tax collections, which constituted
90.4 percent of total revenues, amounted to P429.6 billion,
16.2 percent higher than the year-ago level but 12.6 percent lower
than the programmed tax revenue during the review period. Non-tax
revenues, including grants, which consisted mainly of collections
made by the Bureau of the Treasury (BTr), increased by 50.5 percent
from the year-ago level. Likewise, non-tax revenue over performed
against the programmed level for the review period.

Bangko Sentral ng Pilipinas | 18
Report on Economic and Financial Developments Second Quarter 2013
Meanwhile, total expenditures reached P460.0 billion in Q2 2013,
14.9 percent higher than the P400.4 billion expenditures incurred a
year ago, although this amount was 6.7 percent lower than the
P493.0 billion programmed expenditures for the quarter. The bulk of
expenditures was channeled to infrastructure spending and capital
outlays.
The NG’s net financing for the second quarter of 2013 amounted to
P-88.6 billion, significantly higher than the year ago level of
P12.2 billion. The net financing was sourced mainly from domestic
borrowings amounting to P103.8 billion. Meanwhile, the NG recorded
external obligations amounting to P-15.2 billion in the review quarter.
The net financing was based on a gross financing mix ratio of 95:5, in
favor of domestic sourcing.
Moving forward, the NG will continue to pursue fiscal consolidation in
the medium term by supporting legislative initiatives to raise
revenues and widen the tax base while pursuing parallel efforts to
reinforce tax administration and ensure an efficient expenditure
management program.

Bangko Sentral ng Pilipinas | 19
Report on Economic and Financial Developments Second Quarter 2013
C. Monetary Sector
Prices
Headline inflation decreased to 2.6 percent year-on-year (y-o-y) in
Q2 2013 from the quarter-ago and year-ago rates of 3.2 percent and
2.9 percent, respectively.
The slowdown in headline inflation was traced mainly to lower non-
food inflation, owing to lower electricity rates and domestic
petroleum prices. Likewise, lower inflation on most food items,
particularly rice, corn, fish, milk, oils, and sugar, was recorded during
the quarter. On a quarter-on-quarter (q-o-q) basis, headline inflation
decelerated slightly to 0.6 percent in Q2 2013 from 0.7 percent in
Q1 2013.
Core inflation, which excludes some food and energy items to
measure generalized price pressures, also fell to 3.0 percent in
Q2 2013 from 3.8 percent in the previous quarter and 3.7 percent a
year ago. All alternative measures of core inflation estimated by the
BSP decreased in Q2 2013 relative to the rates registered in the
previous quarter. In particular, the trimmed mean, weighted median,
and net of volatile items measures declined to 2.3 percent,
0
1
2
3
4
5
6
Q1 Q2 Q3 Q4 Q1 Q2 Q3 Q4 Q1 Q2 Q3 Q4 Q1 Q2
2 0 1 0 2 0 1 1 2 0 1 2 2013
Inflation Rate (2006=100) in percent
Philippines
Metro Manila
Areas outside Metro Manila
Inflation eases due
largely to lower non-
food inflation
Core inflation
moderates

Bangko Sentral ng Pilipinas | 20
Report on Economic and Financial Developments Second Quarter 2013
2.3 percent, and 3.2 percent, respectively, from the previous
quarter’s 3.0 percent, 2.7 percent, and 3.8 percent.
Food inflation slowed down to 2.3 percent in Q2 2013 from
2.7 percent in the previous quarter, but was higher than the
1.8 percent posted a year ago. Adequate domestic supply of selected
food items, particularly rice, corn, fish, milk, oils, and sugar, led to the
deceleration of food inflation in Q2 2013. The inflation rate of rice,
corn, fish, milk, and sugar declined to 1.6 percent, 4.9 percent,
2.4 percent, 2.1 percent, and 0.9 percent, respectively, from the
quarter-ago rates of 1.7 percent, 5.5 percent, 5.3 percent,
2.9 percent, and 3.1 percent. Prices of oils and fats declined further to
-7.4 percent from -5.8 percent in Q1 2013.
Slower price increases
for rice, corn, fish, milk,
and sugar drive down
food inflation

Bangko Sentral ng Pilipinas | 21
Report on Economic and Financial Developments Second Quarter 2013
Non-food inflation decelerated to 2.0 percent during the review
quarter from 2.8 percent in the previous quarter and 3.7 percent a
year ago. Lower inflation for electricity, gas and other fuels, and
transport supported the decline in non-food inflation. In particular,
from 0.9 percent in Q1 2013, electricity, gas, and other fuels inflation
reversed to -0.5 percent in Q2 2013 due to lower electricity charges
and LPG prices. Similarly, transport prices went down by 0.2 percent
after rising by 0.9 percent in the previous quarter, reflecting
reduction in the prices of gasoline and diesel.
In terms of geographical location, the headline inflation rate for
Metro Manila (MM) eased further to 1.7 percent from its quarter-ago
and year-ago rates of 2.2 percent and 2.4 percent, respectively.
Similarly, inflation rate in areas outside Metro Manila (AOMM)
slowed down to 2.9 percent compared to its quarter-ago and year-
ago rates of 3.5 percent and 3.1 percent, respectively.
In MM, food inflation went down to 2.0 percent in Q2 2013 from
2.5 percent in the previous quarter, as most food commodities,
particularly corn, meat, fish, milk, oils, fruits, and sugar, posted lower
inflation. Likewise, non-food inflation decreased to 1.2 percent from
0
1
2
3
4
5
6
7
Q1 Q2 Q3 Q4 Q1 Q2 Q3 Q4 Q1 Q2 Q3 Q4 Q1 Q2
2010 2011 2012 2013
Food and Non-Food Inflation (2006=100) in percent
Headline Inflation
Food Inflation
Non-Food Inflation
Inflation rates in Metro
Manila and in areas
outside Metro Manila
slow down
Non-food inflation
declines

Bangko Sentral ng Pilipinas | 22
Report on Economic and Financial Developments Second Quarter 2013
1.9 percent in Q1 2013 as inflation for all commodity groups
decelerated, except for recreation and education.
In AOMM, food inflation fell to 2.3 percent from 2.7 percent in
Q1 2013 due mainly to the slower price increases of key food items,
particularly rice, corn, fish, milk, oils, and sugar. Non-food inflation
also eased to 2.1 percent in Q2 2013 from 3.1 percent in the previous
quarter as most commodity groups posted lower inflation, except for
recreation.
On a q-o-q basis, headline inflation in MM and AOMM decreased to
0.1 percent and 0.7 percent, respectively, in Q2 2013 from
0.2 percent and 0.9 percent in the previous quarter.
Domestic Liquidity2
Using the Standardized Report Forms3 (SRF) format, money supply or
M3 grew by 20.0 percent y-o-y as of end-June 2013 to reach P5.7
2 The indicators used for money supply are: M1 (or narrow money), comprised of currency in circulation and demand deposits; M2, composed of M1 plus savings and time deposits (quasi-money); M3, consisting of M2 plus deposit substitutes; and M4, consisting of M3 plus foreign currency deposits. 3 The SRF is a unified framework that allows for cross-country comparison of source data and methodology for compiling and reporting monetary statistics introduced by the IMF in 2004.
1
2
3
4
5
6
Q1 Q2 Q3 Q4 Q1 Q2 Q3 Q4 Q1 Q2 Q3 Q4 Q1 Q2
2 0 1 0 2 0 1 1 2 0 1 2 2013
Inflation Rate (2006=100) in percent
Philippines MM Areas outside MM
Domestic liquidity
growth supports
brisker domestic
economic activity

Bangko Sentral ng Pilipinas | 23
Report on Economic and Financial Developments Second Quarter 2013
trillion. This growth was faster than the 13.4 percent expansion as of
end-March 2013 (Table 5).
Domestic Liquidity (M3)
Particulars
Levels (in billion pesos) Growth Rates
(in %)
Jun-13 Mar-13 Jun-12 Q-o-Q Y-o-Y
Domestic Liquidity (M3), 5,740.0 5,210.5 4,783.4 10.2 20.0
of which:
Net Foreign Assets 3,393.0 3,251.3 3,201.0 4.4 6.0
Domestic Claims 5,647.6 5,612.4 5,083.0 0.6 11.1
of which:
Net Claims on
Central Government 1,007.3 1,157.4 989.3 -13.0 1.8
Claims on Other
Sector 4,640.3 4,455.0 4,093.7 4.2 13.4
The increase in M3 was driven by the 11.1 percent y-o-y expansion in
domestic claims in June 2013. Credits extended to the private sector
grew by 15.9 percent, consistent with the sustained expansion in
bank lending to bolster economic activity. Similarly, net claims on the
central government rose by 1.8 percent in June, largely as a result of
the increase in investments in National Government securities. The
decrease in the liabilities excluded from broad money (due, in part, to
the lower level of SDA placements by trust entities) also contributed
to faster liquidity growth.
The adoption of the SRF-based monetary statistics is consistent with the framework of the Monetary and Financial Statistics Manual (MFSM), Balance of Payments and International Investment Position Manual, 6th Edition (BPM6), and the System of the National Accounts (SNA) of the International Monetary Fund (IMF). This initiative is part of the BSP’s adherence to international best practices in statistical compilation.

Bangko Sentral ng Pilipinas | 24
Report on Economic and Financial Developments Second Quarter 2013
Similarly, net foreign assets (NFA) also grew by 6.0 percent y-o-y in
June 2013. The BSP’s international reserves rose further due mainly
to robust foreign exchange inflows from overseas remittances and
BPO receipts. However, the NFA of banks contracted further as banks’
foreign liabilities continued to increase given higher placements and
deposits made by foreign banks with their local branches and other
banks, while their foreign assets decreased due to the decline in loan
receivables from and deposits with foreign banks.
Following the rise in M3, M4, a broader concept of domestic liquidity
which comprises M3 and foreign currency deposits of residents,
increased by 17.4 percent y-o-y in June 2013 from 10.7 percent in
March 2013.
Domestic Interest Rates
The average 91-day, 182-day and 364-day Treasury bill(T-bill) rates in
the primary market increased markedly in the second quarter by
33 basis points (bps), 25 bps, and 6 bps, respectively, as indications of
a US Fed exit on its bond-buying program steered investors into
seeking higher yields.
Similarly, secondary market yields of GS for all maturities increased
as of end-June 2013 compared to their end-March 2013 rates, driven
mainly by cautious selling activities due to expectations of a US scale
down of its quantitative easing program (QE3) amid signs of some
recovery in the US economy. Rates went up by a range of 49 bps (3-yr
and 20-yr) to 154 bps (3-month).
Yields of short-term
secondary T-bills
increase
Domestic market
interest rates rise

Bangko Sentral ng Pilipinas | 25
Report on Economic and Financial Developments Second Quarter 2013
In contrast, market interest rates decreased during the review
quarter. Bank lending rates, savings deposit rates, interbank call
loans, time deposit rates, and Manila reference rates declined by
6 bps, 26 bps, 78 bps, 93 bps and 100 bps, respectively.
The Monetary Board (MB) kept the BSP’s key policy rates at
3.50 percent for the overnight borrowing or reverse repurchase (RRP)
facility and 5.50 percent for the overnight lending or repurchase (RP)
facility during its policy meetings in the first quarter. However, the
MB decided to further reduce the SDA rate by another 50 bps,
increasing the cumulative cut on SDA rate for the year to 150 bps
across all tenors. The MB’s decision to maintain the policy rates was
based on its assessment that inflation environment continues to be
benign and inflation expectations are firmly anchored. Meanwhile,
the MB noted that the reduction in the SDA rate is consistent with the
BSP’s continuing efforts to fine-tune the operations of its monetary
policy tools.
The differentials between domestic and US interest rates (gross and
net of tax) widened in Q2 2013 relative to the previous quarter. The
rise in the domestic interest rate combined with the continued
0
1
2
3
4
5
6
7
3 mo 6 mo 1 yr 2 yr 3 yr 4 yr 5 yr 7 yr 10 yr 20 yr 25 yr
Yield Curves for Government Securities in percent
Q2 2012 Q3 2012 Q4 2012
Q1 2013 Q2 2013
Interest rate
differentials widen

Bangko Sentral ng Pilipinas | 26
Report on Economic and Financial Developments Second Quarter 2013
decline in foreign interest rates led to a widening in the positive after
tax differentials between the RP 91-day T-bill rate and the US 90-day
T-bill rate and the US 90-day LIBOR. The average 91-day RP T-bill rate
rose by 33 bps q-o-q, while the average US 90-day T-bill rate and US
90-day LIBOR decreased by 3 bps and 1 bp, respectively. The
domestic interest rate rose as investors sought higher yields on
prospects of the further dollar strengthening, following the release of
the better-than-expected consumer confidence data amid
expectations that the US Fed may reduce its US$85 billion bond-
buying program in the near future. Meanwhile, the decline in US
interest rates was driven largely by the release of favorable economic
reports during the quarter, including the US retail sales April 2013
data, unemployment rate, which fell in April 2013 to its lowest since
December 2008 in April 2013, and higher output growth for Q1 2013.
Weaker-than-expected manufacturing data in China and the euro
area along with the decline in Japan’s 10-year government bond rate
to its lowest level since August 2009 also boosted the demand for the
US debt papers.
The positive differential between the BSP's policy interest rate
(overnight borrowing or RRP rate) and the US federal funds target
rate was unchanged at 325 bps as of end‐June 2013, as the policy
settings for both central banks were kept steady. Adjusted for the risk
premium, the spread between the two policy rates declined further
to 210 bps in end‐June 2013 from 216 bps in end‐March 2013. This
development may be traced to the 6 bps rise in the risk premium,
given the 68 bps increase in the 10-year RP yield relative to the 61 bps
rise in the 10-year US yield. ROP bond yields edged higher, tracking
the rise in regional bond yields amid market uncertainty over
prospects that the US Fed will taper off its bond-purchase program.

Bangko Sentral ng Pilipinas | 27
Report on Economic and Financial Developments Second Quarter 2013
Monetary Policy Developments
During its monetary policy meetings on 25 April and 13 June 2013,
the BSP decided to maintain its key policy interest rates at 3.50
percent for the overnight borrowing or reverse repurchase (RRP)
facility and 5.50 percent for the overnight lending or repurchase (RP)
facility. The interest rate on term RRPs and RPs were also maintained.
The reserve requirement ratios were kept steady as well.
The Monetary Board’s (MB) policy rate decisions were based on its
assessment that the inflation environment remained benign over the
policy horizon. Latest baseline forecasts indicated that inflation will
remain within target for 2013 until 2015, supported by well-anchored
inflation expectations. With the current stronger pace of domestic
liquidity growth, inflation is still expected to remain manageable over
the policy horizon given improvements in the economy’s absorptive
capacity. Keeping policy settings steady also allows time to assess the
impact of recent fine-tuning in monetary operations. Recent global
financial market developments also support an unchanged policy
stance.
Meanwhile, the BSP reduced the interest rates on the SDA facility by
50 bps during its policy meeting on 25 April 2013. By end-April 2013,
the SDA rate was set to 2.0 percent regardless of tenor. The MB
noted that the benign inflation environment and robust domestic
growth prospects provided scope for further enhancing the efficiency
of monetary operations in absorbing liquidity through the SDA facility.
The adjustment was also in line with the BSP’s continuing efforts to
fine-tune its monetary policy instruments and thereby gain greater
flexibility in conducting monetary operations, and also to ensure
adequate liquidity for economic activity.
BSP maintains key
policy rates

Bangko Sentral ng Pilipinas | 28
Report on Economic and Financial Developments Second Quarter 2013
D. Financial Sector
The Philippine banking system remained resilient amid the lackluster
global environment. Banks’ core balance sheets were marked by a
steady growth in assets and capital accounts. Asset quality continued
to improve and solvency ratios remained at par with international
standards.
Performance of the Banking System
Market Size
The number of banking institutions (head offices) fell to 687 as of
end-March 2013 from the quarter- and year-ago levels of 696 and
723, respectively, indicating continued consolidation of banks as well
as the exit of weaker players in the banking system (Table 7). By
banking classification, banks (head offices) consisted of 36 universal
and commercial banks (U/KBs), 70 thrift banks (TBs), and 581 rural
banks (RBs). Meanwhile, the operating network (including branches)
of the banking system increased to 9,477 in Q1 2013 from 9,410 in Q4
2012 and 9,186 during the same period last year, due mainly to the
increase in the branches/agencies of UKBs, TBs and RBs.
The total resources of the banking system rose by 6.0 percent and
16.3 percent to P8.9 trillion as of end-June 2013 from quarter- and
year- ago levels of P8.4 trillion and P7.7 trillion, respectively (Table 8).
The increase could be traced to the growth in loans, securities and
other equities indicative of the public’s continued trust in the banking
system. U/KBs accounted for nearly 90 percent of the total resources
of the banking system.
BSP reduces SDA rates
Number of banks declines
but operating network
continues to expand
Philippine banking
system weathers
global headwinds

Bangko Sentral ng Pilipinas | 29
Report on Economic and Financial Developments Second Quarter 2013
Savings Mobilization
Savings and time deposits remained the primary sources of funds for
banks. Banks’ total deposits4 as of end-June 2013 amounted to P5.1
trillion, 22.1 percent higher than the year-ago level of P4.2 trillion.
The rapid growth may be attributed to the shift of depositors’
investments from the BSP’s SDA facility to bank deposits as a result of
the fine-tuning of access of banks and trust departments/entities to
the BSP SDA facility.5 Savings deposits registered a 22.3 percent
growth and continued to account for nearly half of the funding base
of banks. Meanwhile, demand deposits expanded y-o-y by 23.5
percent and time deposits increased by 20.4 percent from the level
posted a year ago.
4 This refers to the total peso-denominated deposits of the banking system. 5 SDA placements of trust departments/entities under the investment management accounts (IMA) shall be reduced by at least 30 percent by end-July 2013 (relative to the outstanding balance as of 31 March 2013) and the remaining balance shall be phased out by end-November 2013. Thus, beginning 1 January 2014, placements of trust departments/entities in the SDA facility shall consist only of funds from trust accounts allowed under existing regulations.
0
1000
2000
3000
4000
5000
6000
Mar Jun Sep Dec Mar Jun Sep Dec Mar Jun Sep Dec Mar Jun
2010 2011 2012 2013
Deposit Liabilities of Banks in billion pesos
Demand Savings Time

Bangko Sentral ng Pilipinas | 30
Report on Economic and Financial Developments Second Quarter 2013
Bank Lending Operations
Outstanding loans of commercial banks, net of banks' RRP
placements with the BSP as of end-June 2013, grew by 12.3 percent
y-o-y and 3.9 percent q-o-q. Likewise, outstanding loans of
commercial banks, inclusive of RRPs, expanded by 13.0 percent and
3.6 percent y-o-y and q-o-q, respectively. Commercial banks' loans
continued to grow steadily at double-digit growth rates since January
2011. The expansion of domestic economic activity and stable
financial conditions supported the sustained growth in bank lending
in June.
Loans for production activities, which comprised more than four-
fifths of commercial banks’ total loan portfolio, posted a 12.2 percent
growth. However, the expansion was lower than the 15.1 percent
y-o-y growth registered during the same period last year. The growth
of production loans was driven mainly by increased lending to mining
and quarrying (85.7 percent); construction (48.7 percent); health and
social work (47.2 percent); real estate renting and business services
(22.3 percent); and hotels and restaurants (19.5 percent). Similarly,
the growth in consumer loans also increased to 12.1 percent,
reflecting the robust intermediation of banks in the household sector.
0.0
1.0
2.0
3.0
4.0
Mar Jun Sep Dec Mar Jun Sep Dec Mar Jun Sep Dec Mar Jun
2010 2011 2012 2013
Loans Outstanding of Commercial Banks (Gross of RRPs) in trillion pesos

Bangko Sentral ng Pilipinas | 31
Report on Economic and Financial Developments Second Quarter 2013
Credit Card Receivables
The combined credit card receivables (CCRs) of U/KBs and TBs as of
end-March 2013, inclusive of credit card subsidiaries, rose by 9.0
percent to P143.7 billion relative to last year’s level, further boosting
the growth in household consumption. However, CCRs went down by
3.4 percent compared to the level at the end of the previous quarter.
Meanwhile, the ratio of CCRs to the total loan portfolio (TLP) slightly
dipped to 3.7 percent from 3.8 percent compared to the previous
quarter. The non-performing CCRs of U/KBs and TBs, inclusive of
credit card subsidiaries, decreased by 7.8 percent to P15.3 billion
from last quarter’s P16.6 billion. As to loan quality, the ratio of non-
performing CCRs to total CCRs slightly decreased to 10.6 percent from
the previous quarter’s 11.1 percent, as the growth in non-performing
CCRs was outpaced by the total increment in CCRs. In the same
manner, this quarter’s delinquency ratio was also better than the 11.1
percent recorded a year ago.
Auto Loans
The combined auto loans (ALs) of U/KBs and TBs, inclusive of non-
bank subsidiaries, increased by 4.6 percent to P167.2 billion as of
end-March 2013 from the previous quarter’s P159.9 billion and by
15.4 percent from P144.8 billion a year ago. Consumers’ continued
confidence in the economy as well as the aggressive marketing
strategies of banks and other car financing firms sustained the rise in
automobile purchases. The proportion of total ALs to TLP, exclusive of
interbank loans (IBL), was slightly higher at 4.3 percent than the
previous quarter’s ratio of 4.1 percent. In terms of loan quality, the
ratios of non-performing ALs to total ALs, as well as to TLP, which are
at 4.6 percent and 0.2 percent, respectively, remain unchanged
relative to the previous quarter figures.
Credit card receivables
continue to increase
Consumers’ continued
confidence in the economy
and aggressive marketing
strategies boost demand
for automobiles

Bangko Sentral ng Pilipinas | 32
Report on Economic and Financial Developments Second Quarter 2013
Residential Real Estate Loans
As of end-March 2013, the combined residential real estate loans
(RRELs) of U/KBs and TBs rose by 5.6 percent to P279.3 billion from
the previous quarter’s P264.5 billion, and 20.1 percent higher than
the previous year's P232.6 billion. The continued bullishness in the
real estate market as indicated by the increase in the number of
projects unveiled by real estate developers as well as banks’
intensified promotional campaigns in terms of offering lower interest
rates, supported more real estate purchases during the review
period. The ratio of RRELs to TLP slightly increased to 7.1 percent
from 6.7 percent in the previous quarter. By industry, U/KBs held a
bigger slice of the total residential real estate exposure at 62.1
percent (P173.5 billion) while TBs accounted for the remaining 37.9
percent (P105.9 billion). In terms of loan quality, the ratio of non-
performing RRELs to total RRELs of U/KBs and TBs eased to 3.5
percent from the previous quarter’s 4.1 percent and previous year’s
4.2 percent.
Asset Quality and Capital Adequacy
The U/KBs gross non-performing loans (GNPL) ratio sustained its
downward path, easing to 2.75 percent as of end-May 20136 from
3.17 percent in the comparable period in 20127 (Table 9a). While a
lower GNPL ratio is being reported by U/KBs, the NNPL ratio has
remained nearly constant. As of end-May 2013, the NNPL ratio was at
6 On 16 October 2012, the BSP amended banks’ reporting standard for NPLs. Beginning with
the January 2013 reports, banks have been required to report their “gross” NPLs and their “net” NPLs. Gross NPLs represent the actual level of NPL without any adjustment for loans treated as “loss” and fully provisioned. Net NPLs is just the gross NPLs less specific allowance for credit losses on TLP (Circular No. 772, series of 2012). The new reporting standard was driven by the BSP’s intent to be more transparent as it gives a fuller picture of the gross amount of NPLs and the full extent of allowances for probable losses. Under the previous framework, NPLs were reported net of loans considered as “loss” but fully provisioned for. 7 For comparative purposes, computations for periods prior to January 2013 are aligned with Circular No. 772.
Continued bullishness in
the property market
supports real estate
purchases
Asset quality continues
to improve as NPL ratio
eases

Bangko Sentral ng Pilipinas | 33
Report on Economic and Financial Developments Second Quarter 2013
0.44 percent and the year-to-date ratios have been within a very
narrow band between 0.43 percent and 0.45 percent. Banks’
initiatives to improve asset quality along with prudent lending
regulations helped bring the NPL ratios to below its pre-Asian crisis
level of around 3.5 percent. The low GNPL ratio reflected the 2.45
percent decline in the level of GNPLs, from P103.92 billion to P101.37
billion, combined with the 12.3 percent expansion in the U/KBs’ TLP,
from P3.3 trillion to P3.7 trillion. On the other hand, the slightly
higher net non-performing loan (NNPL) ratio was due to the 2.02
percent increase in the NNPL level from P15.85 billion in end-May
2012 to P16.17 billion in end-May 2013.
Nonetheless, the Philippine U/KBs’ GNPL ratio of 2.75 percent was
higher compared to Indonesia’s 1.8 percent, Malaysia’s 2.0 percent,
South Korea’s 1.6 percent and Thailand’s 2.2 percent.8 The lower NPL
ratios of Malaysia and South Korea were attributed to the creation of
publicly-owned asset management companies (AMCs) in these
countries, which purchased the bulk of their NPLs, a practice not
resorted in the Philippines.
8 Sources: Various central bank websites, IMF and financial stability reports, Indonesia (commercial banks, Q4 2012); Malaysia (commercial banks, Q4 2012); Thailand (total financial institutions, Q2 2013); and Korea (banking system, Q3 2012).
0.0
0.1
0.2
0.3
0.4
0.5
2.5
2.6
2.7
2.8
2.9
3.0
Dec
-12
Jan
-13
Feb
-13
Mar
-13
Ap
r-13
May
-13
Ratio of GNPLs and NNPLs to Total Loans of U/KBs In percent
GNPL Ratio NNPL Ratio

Bangko Sentral ng Pilipinas | 34
Report on Economic and Financial Developments Second Quarter 2013
The loan exposures of banks remained adequately covered as the
U/KB’s NPL coverage ratio improved to 128.5 percent as of end-May
2013 from 119.8 percent in the preceding year. The ratio was
indicative of banks’ continued compliance with the loan-loss
provisioning requirements of the BSP to ensure adequate buffers
against unexpected losses.
As of end-December 2012, the U/KB banking industry average CARs
stood at 17.3 percent and 18.4 percent on solo and consolidated
bases, which were both higher than last year’s 16.7 percent and 17.7
percent, respectively.
The industry augmented its qualifying capital to support an increase
in assumed risks. The improvement in capital was mainly driven by
the expansion in retained earnings as U/KBs posted healthy net
profits at end-2012. On the other hand, the rise in the industry’s risk-
weighted assets (RWA) was brought about by the increase in lending
to corporations and in investments in foreign currency debt securities
issued by the National Government and the Bangko Sentral ng
Pilipinas.
The Philippine banking system’s CAR on a consolidated basis at 17.6
percent was the same with Malaysia and higher than those of
14
15
16
17
18
19
20
Mar Jun Sep Dec Mar Jun Sep Dec Mar Jun Sep Dec
2010 2011 2012
Capital Adequacy Ratio of U/KBs In percent
Solo
Consolidated
Banks remain
adequately capitalized

Bangko Sentral ng Pilipinas | 35
Report on Economic and Financial Developments Second Quarter 2013
Indonesia (17.3 percent), Thailand (15.8 percent), and South Korea
(14.1 percent).9
Banking Policies
Banking policies implemented during the quarter were aimed at
strengthening regulations and guidelines on: 1) foreign exchange
transactions; 2) temporary window for the purchase of foreign
exchange (FX) to service unregistered private sector foreign loans;
3) appendix 45 of MORB, specifically on the general features of a
microfinance deposit account; 4) rate of Interest in the absence of
stipulation; 5) cross selling framework; 6) qualifications of
independent director; and 7) banking days and hours (Annex A).
Capital Market Reforms
Capital market policy reforms continued to gain ground during the
period as the BSP, other government agencies, and the private sector
adopted measures to develop further the Philippine capital market.
During the quarter, the reforms focused more on promoting investor
confidence, enhancing transparency and corporate governance,
expanding products and markets, strengthening prudential
regulations, and helping develop the necessary market infrastructure
(Annex B).
Stock Market
During the period April to June, strong domestic macroeconomic
fundamentals offset the impact of negative developments from
overseas to lift the Philippine Stock Exchange index (PSEi). The 30-
stock composite index averaged 6,836.0 index points, higher by 6.2
9 Sources: Various central bank websites, IMF and financial stability reports, Indonesia (commercial banks, Q4 2012); Thailand (banking system Q1 2013); Malaysia (commercial banks, Q4 2012); and Korea (banking system, Q3 2012).
BSP continues to
collaborate with
government agencies
and private sector in
developing the capital
market
Banking policies
implemented aim to
strengthen and enhance
existing regulations
Robust outlook for
the Philippine
economy and credit
rating upgrades lift
the local stock index

Bangko Sentral ng Pilipinas | 36
Report on Economic and Financial Developments Second Quarter 2013
percent and 34.2 percent relative to first quarter’s and the previous
year’s levels, respectively.
Investors’ sentiments were generally bullish in the first half of the
quarter, with the PSEi recording seven historic highs during the
period. Trading was lifted by optimism over the strong Philippine
economic outlook, reports of the 23.3 percent growth in listed firms’
combined profits in the first three months of the year, and ample
market liquidity, following the third BSP SDA rate cut in April. The
credit rating upgrades of the Philippines to investment grade by S&P
in early May, and by Fitch Rating in late March, likewise boosted
market sentiments. Moreover, the overall optimism in Asian stock
markets, largely due to signs of an improving US economy and Japan’s
affirmation of its stimulus plans to boost growth, also helped the local
index surge to its 31st peak for the year at 7,392.2 index points on 15
May, higher ytd by 27.2 percent.
In the second half of the quarter, however, the local index dipped to
mirror the retreat in markets’ overseas after the US Federal Reserve
signaled that it could start unwinding its QE measures later this year.
Concerns over the potential slowdown of the Chinese economy
2000
3000
4000
5000
6000
7000
8000
Q1 Q2 Q3 Q4 Q1 Q2 Q3 Q4 Q1 Q2 Q3 Q4 Q1 Q2
2010 2011 2012 2013
Philippine Stock Exchange Index (PSEi)* Quarterly average, in index points
*/ Average of the monthly closing index during the quarter

Bangko Sentral ng Pilipinas | 37
Report on Economic and Financial Developments Second Quarter 2013
following reports of unfavorable economic data also weighed down
on investor confidence from late May up to end-June. Negative news
in the domestic front, including the decline in exports and higher
unemployment rate, combined with concerns about high equity price
valuations dampened sentiments in the latter half of the second
quarter, overshadowing investors’ positive outlook on the Philippine
economy. Subsequently, from the peak of 7,392.2 index points on 15
May, the PSEi closed the month of June 12.5 percent lower at 6,465.3
index points (Table 10). Relative to the end-March index, the closing
index in June was also lower by 5.6 percent.
Reflecting the generally bearish sentiments in the second half of the
quarter-in-review, total stock market capitalization settled at P11.7
trillion as of end-June, about 6.9 percent lower relative to the level
posted in March. Compared to year-ago levels, however, market
capitalization remained higher by 16.5 percent during the period in
review. Muted investor risk appetite from late May to June also led to
lower foreign buying activity during the quarter as net foreign
purchases dipped by 55.5 percent from P39.9 billion in the first three
months of the year to P17.7 billion in the period April through June.
Moreover, the price-earnings ratio of listed issues declined from the
peak of 22.1 times posted in April to 18.9 times in June. Nonetheless,
Philippine shares remain one of the most expensive in the region.
Stock market indicators
reflect generally bearish
sentiments

Bangko Sentral ng Pilipinas | 38
Report on Economic and Financial Developments Second Quarter 2013
On q-o-q basis, most stock markets in the region similarly advanced
during the period April through June. Of the seven Asian-Pacific
national stock indices monitored, five rallied relative to the previous
quarter. The rally was led by Indonesia, whose average stock index in
Q2 rose by 7.1 percent q-o-q. This was followed by the Philippines
(6.2 percent), Malaysia (6.0 percent), Thailand (2.1 percent), and
Singapore (1.0 percent). In contrast, stock markets in China and Hong
Kong retreated amid signs that China’s economy was weakening.
Financial 26%
Industrial 24%
Holding Firms 20%
Property 12%
Services 13%
Mining and Oil 5%
PSE Market Capitalization by Sector 2Q 2013,Percent share
Most stock markets in
the region rally in Q2
2013

Bangko Sentral ng Pilipinas | 39
Report on Economic and Financial Developments Second Quarter 2013
Local Currency Bond Market
Size and Composition10
Local currency (LCY) bonds issued by both public and private sectors
amounted to P155.8 billion in the second quarter of 2013, declining
by 13.5 percent from the P180.1 billion registered in the same period
in 2012 and down by 8.2 percent from the P169.7 billion posted in the
previous quarter.
10 This refers to the peso-denominated bond issuances by both public and private sectors. Public sector issuances of LCY bonds include issuances in the primary market and rollovers of maturing series which were issued by the BTr and GOCCs.
0
5000
10000
15000
20000
25000
Indonesia Singapore Philippines Hong Kong China Malaysia Thailand
Selected Asian Stock indices (in index points)
Q2 2012
Q1 2013
Q2 2013
95%
5%
Local Currency Bond Issuances (Apr-Jun 2013, percent share)
Public Private Corp
Both public and private
sectors issue fewer
local currency bonds

Bangko Sentral ng Pilipinas | 40
Report on Economic and Financial Developments Second Quarter 2013
Public sector issuances aggregated P148.6 billion, declining by 3.5
percent from the previous quarter’s level due to lower issuance of
fixed-rate bonds. There was also no issuance from government
owned and controlled corporations (GOCCs) during the period.
The private sector likewise decreased its issuance of LCY bonds to
P7.2 billion, a 54.3 percent decline from 1Q 2013 and a 91.6 percent
drop on a y-o-y basis. Private corporates opted to source some of its
financing needs from the international debt markets, taking
advantage of the low interest rate environment during the quarter.
In terms of market share, the public sector comprised 95 percent of
the total bond issuances and the private sector accounted for the
remaining 5 percent.
Bonds issued by the Bureau of the Treasury (BTr) accounted for the
bulk of total public issuances which were mostly in the form of Fixed-
Rate T-bonds and T-bills. Meanwhile, issuances from the private
sector consisted largely of bonds and notes with issuances accounted
for mostly by firms in the real estate sector firms.
Primary Market 11
Primary auctions for both T-bills and T-bonds offered volumes were
increased to P150 billion from the P120 billion programmed in the
previous quarter due to the Bureau of the Treasury’s decision to hold
fewer auctions during the quarter.
11 The discussion includes primary market for government issuances only.

Bangko Sentral ng Pilipinas | 41
Report on Economic and Financial Developments Second Quarter 2013
Results of GS Auctions (Jan-Jun 2013, in billion pesos)
Offerings Tenders Accepted Rejected
Bids Bids
First Quarter 120.0 431.2 120.8 310.4
T-bills 45.0 135.6 45.8 89.8
T-bonds 75.0 295.6 75.0 220.6
Second Quarter 150.0 256.3 141.8 114.5
T-bills 60.0 81.7 51.8 29.8
T-bonds 90.0 174.6 90.0 84.6
With ample liquidity in the system, demand for T-bills and T-bonds
climbed with investors tendering more than that of the National
Government’s (NG) program for both short- and long-dated
securities. Total amount of tenders for both T-bills and T-bonds
reached P256.3 billion, almost two times oversubscribed given NG’s
offerings of P150.0 billion.
The NG awarded in full its programmed borrowings for T-bonds while
accepting only P51.8 billion of T-bills, less than the P60.0 billion
programmed amount. Investors were seen tendering higher yields for
short-term dated T-bills, prompting the BTr to reject some of the bids
in the 182- and 360-days tenors to keep the NG’s debt servicing costs
manageable. The yields for the six-month and one-year debt papers
were observed to reach at least 1 percent in the second quarter since
falling to record lows earlier this year.
Secondary Market
Trading of both government and private corporate bonds fell to
P1,273 billion, or down by 56.2 percent, q-o-q, but up by 97.7 percent
on y-o-y basis.
Trading for both
government and
corporate bonds at
the secondary market
declines
Ample liquidity in the
system sustains demand
for T-bills and T-bonds
Investors seek higher
yields

Bangko Sentral ng Pilipinas | 42
Report on Economic and Financial Developments Second Quarter 2013
The decrease in the trading volume at the fixed income market was
notable in the months of May and June due to heightened worries
over US tapering its QE measures. Uncertainties were compounded
by brewing tensions in the Middle East, which prompted investors to
pull out funds from the country’s fixed income market. Nonetheless,
the country’s strong macroeconomic fundamentals continued to
support trading at the fixed income exchange, which tempered selling
pressures at the secondary market.
Foreign Currency Bond Market
The NG refrained from borrowing in the international debt market in
the second quarter of 2013. The preference was to source funds from
the domestic lenders, taking advantage of the ample liquidity in the
local capital market. The NG’s plan for 2013 is to source 20 percent of
the government’s funding needs from overseas lenders while the
remaining 80 percent, from local investors.
This is in contrast with the private sector, which tapped the
international financial market in sourcing funds. During the quarter, a
real estate developer, raised US$250 million through sale of 10-year
0
500
1,000
1,500
2,000
2,500
3,000
1Q 2Q 3Q 4Q 1Q 2Q 3Q 4Q 1Q 2Q 3Q 4Q 1Q 2Q
2010 2011 2012 2013
Secondary Market Volume of Private Corporate and Government Bonds (in billion pesos)
The NG maintains limited
borrowing offshore,
taking advantage of the
ample liquidity in the
domestic capital market

Bangko Sentral ng Pilipinas | 43
Report on Economic and Financial Developments Second Quarter 2013
bonds which was followed by an US$800 million 10-year callable
bonds from a brewery firm.12
Credit Risk Assessment
Following the first investment grade rating from Fitch in the first
quarter of the year, Standard & Poor’s Rating Services raised the
Philippines’ credit rating to investment grade from a rating from BB+
to BBB- on May 2, 2013. This is the Philippines’ second investment
grade rating received by the Philippines in 2013.
Source: Reuters
Latest Philippine Sovereign Credit Ratingsas of June 2013
Rating
Agency
Local Currency
(LT/ST)
Foreign Currency
(LT/ST)Outlook
S&P BBB-/A3 BBB-/A3 Stable
Moody's Ba1/.n.a. Ba1/n.a. Stable
Fitch BBB/n.a. BBB-/F3 Stable
The S&P, just like Fitch Ratings, attributed the upgrade to the
country’s improved fiscal profile, declining reliance on foreign
currency debt, increased revenue collection, and macroeconomic
stability.
The S&P said the ability of the Philippines to pay its debt to foreign
creditors had strengthened, as evidenced by the country’s dollar
reserves. The reserves come mostly from remittances from
expatriate Filipinos, foreign investments in the business process
outsourcing sector and foreign investments in peso–denominated
securities.
12 Source: Reuters
S&P raises the
Philippines’ sovereign
credit rating to
investment grade

Bangko Sentral ng Pilipinas | 44
Report on Economic and Financial Developments Second Quarter 2013
Sovereign Spreads
The upgrade in the country’s credit rating did not translate into a
significant narrowing of debt spread. Credit spreads closed the
second quarter wider relative to the previous quarter’s level and on a
y-o-y basis, reflecting heightened risk aversion towards the country’s
debt papers. The Emerging Market Bond Index (EMBI)+ Philippine
spreads averaged 147.4 bps, up from the first quarter’s 136.2 bps
while credit default swaps (CDS) spreads inched up to average 102.7
bps from 101.8 bps. Against those of neighboring economies, the
Philippine CDS traded lower than Indonesia’s average of 164.5 bps
and closer to Thailand’s 95.3 bps and Malaysia’s 90.3 bps.
From April to mid-May credit spreads initially narrowed on the back
of continued monetary easing from major central banks that pushed
nominal yields to record lows. During this period, the Bank of Japan
(BOJ) unveiled its new program of quantitative and qualitative
monetary easing in April, while the European Central Bank (ECB) cut
its policy rate in early May. Similarly, the US Fed reaffirmed its
commitment to its asset purchase program during its 1 May 2013
policy meeting, but also made indications that it is prepared to
0
100
200
300
400
Q1 Q2 Q3 Q4 Q1 Q2 Q3 Q4 Q1 Q2 Q3 Q4 Q1 Q2
2010 2011 2012 2013
JP Morgan EMBI+ Sovereign Bond Spreads in basis points
EMBI+ Philippines EMBI+ Global
Debt spreads widen
anew

Bangko Sentral ng Pilipinas | 45
Report on Economic and Financial Developments Second Quarter 2013
increase or decrease the pace of its purchases based on the outlook
for inflation and labor market conditions.
Investors discounted reports of sluggish growth in Europe, gloomy
Chinese PMI data, and the cut in the IMF global growth outlook for
2013 to 3.1 percent from its 3.3 percent forecast in March. The
sustained low yields in advanced economies (AEs) led investors to
search for higher returns in EM papers and corporate debts, driving
debt spreads even lower. Risk taking and carry trade activities rose
while corporate issuances strengthened, benefiting high yielding
bonds including those of the Philippines.
The second credit rating upgrade received by the Philippines from
S&P on 2 May 2013 supported the prices of Philippine sovereign
bonds which pushed yields to drop, narrowing the gap between high-
yielding EM bonds with US investment grade bonds. From end-March
2013, the EMBI+ Philippine spreads, or the extra yield investors
demand to hold Philippine debt securities over US Treasuries,
narrowed to 118.0 bps on 3 May (from 152 bps) while the CDS
spread, or the cost of insuring the country’s 5-year sovereign bonds
against default, dropped to 80.5 bps on 7 May (from 109 bps).
0
50
100
150
200
250
Q1 Q2 Q3 Q4 Q1 Q2 Q3 Q4 Q1 Q2 Q3 Q4 Q1 Q2
2010 2011 2012 2013
5-Year CDS Spreads in basis points
Philippines Indonesia Thailand Malaysia

Bangko Sentral ng Pilipinas | 46
Report on Economic and Financial Developments Second Quarter 2013
In the last two weeks of May, the narrowing trend reversed. Debt
spreads expanded on renewed speculation that the US Fed could
start tapering its bond buying program over the next few months,
translating to a sell-off in US Treasuries. This subsequently pushed
yields to rise in both the investment-grade and high-yielding
emerging market bonds. Widening pressures intensified as weaker
jobs data were reported in the euro area with the unemployment
rate hitting record highs in France and Italy.
A gradual correction that began in mid-May snowballed into a full-
blown sell-off in the fixed income market in June, expanding spreads
to levels last seen in June 2011. On 24 June, EMBI+Philippine spreads
widened to 228 bps while CDS spreads jumped similarly to 157 bps on
the same day. EM bond funds registered net outflows for the first
time in almost a year, intensifying the widening trend. Moreover,
worries over a liquidity crisis in China’s interbank market added to the
market’s risk-off trading sentiment. A mild recovery was observed
beginning 25 June towards the end of the month but sentiments
remained gloomy. The partial recovery was due to some window
dressing ahead of the end of the first half of the year. The market
ended the month on a slow trade with recent losses still unrecovered.
Payments and Settlements System
In Q2 2013, the total volume of transactions that were settled and
processed in the Philippine Payments and Settlements System
(PhilPaSS) increased by 5.4 percent to 355,585 from the previous
quarter’s level of 337,452. The growth in the volume of transactions
was due to the q-o-q increase in the following: interbank sale and
purchase of foreign currency (US dollar) via payment-versus-payment
PhilPaSS transactions
increase

Bangko Sentral ng Pilipinas | 47
Report on Economic and Financial Developments Second Quarter 2013
(PVP) (23.1 percent); interbank transactions (11.1 percent); and
PhilPaSS-REMIT transactions (9.0 percent).
Although the growth in the total volume of transactions increased,
the total value of transactions recorded a q-o-q decline of 8.0 percent
to P89.6 trillion. The decrease in the total transaction value was due
to the contraction in the following accounts: sales and purchases of
government securities via delivery-versus-payment (DvP) (-56.3
percent); tertiary transactions on government securities (GS) via
expanded delivery-versus-payment (eDvP) (-16.9 percent); and BSP
Treasury Department transactions (-13.1 percent).
On a y-o-y basis, both the value and volume of transactions grew by
7.3 percent and 10.2 percent, respectively.
As a result of the increase in the volume of PhilPaSS transactions in
Q2 2013, the total revenues derived from PhilPaSS operations
reached P42.1 million, 2.3 percent higher than the P41.1 million
recorded in Q1 2013. On a y-o-y basis, total revenues grew by 8.7
percent.
2012
Q2 Q1 Q2 Q-o-Q Y-o-Y
Volume 355,585 337,452 322,789 5.4 10.2
Value (In Tril l ion PhP) 89.6 97.4 83.5 -8.0 7.3
Transaction Fees (In Mln PhP) 42.1 41.1 38.7 2.3 8.7
Source: Payments and Settlements Office, Bangko Sentral ng Pilipinas
PhilPaSS Transactions
Growth rates (%)2013

Bangko Sentral ng Pilipinas | 48
Report on Economic and Financial Developments Second Quarter 2013
E. External Sector
Balance of Payments
The country’s balance of payments position yielded a higher surplus
of US$1 billion in Q2 2013 compared to only US$73 million in the
comparable period a year ago. The significant upturn in the external
payments position was due largely to the higher current account
surplus combined with the reversal of financial account from net
outflows to net inflows. The improvement in the current account
surplus emanated mainly from increased net receipts in secondary
income and services while net inflows in the financial account were
attributed to net inflows in the portfolio investment account. The
global economic recovery is proceeding at a gradual pace as
economic activity in Japan has gained further traction. This favorable
development resulted in the modest growth of merchandise exports
and in the rise in investment inflows indicating sustained investor
confidence on the back of the country’s credit rating upgrade to
investment grade from Standard and Poor’s (S&P) and Fitch Ratings.
Balance of Payments ( in million US$)
Growth2013 2012 Rate (%)
Current Account 2484 2276 9.1Capital Account 24 30 -20.4Financial Account -127 722 -117.6Net Unclassified Items -1594 -1511 -5.5
Overall BOP 1041 73 1325.7
Q2
Current Account. The current account recorded a surplus of US$2.5
billion (equivalent to 3.6 percent of GDP) in Q2 2013, an increase of
9.1 percent from the US$2.3 billion surplus in the same quarter a year
ago. The continued surplus in the current account was buoyed by the
Current account posts
higher surplus
BOP surplus surges as
current and financial
accounts improve
appreciably

Bangko Sentral ng Pilipinas | 49
Report on Economic and Financial Developments Second Quarter 2013
combined effect of higher net receipts in the secondary income and
services accounts as well as the reduced deficit in trade-in-goods
which more than offset the reversal of the primary income balance
from net receipts to net payments.13
Trade-in-Goods. The deficit in the trade-in-goods account declined by
16.4 percent to US$2.3 billion in Q2 2013 compared to the US$2.7
billion deficit registered in the comparable period last year. The
continued narrowing of the trade-in-goods deficit was a result of the
1.2 percent expansion in goods exports and the 1.9 percent
contraction in goods imports. The moderate growth in exports of
goods was supported by sustained external demand from major
export markets, particularly Japan, Singapore, Malaysia, the
Netherlands, and the U.K.
Exports of Goods. Exports of goods grew in Q2 2013, with receipts
reaching US$12.8 billion compared to US$12.7 billion in the same
quarter in 2012. Exports reflected the nascent economic recovery of
Japan and some advanced economies even as prospects for global
growth remained modest.14
The following major commodity groups lifted export performance in
Q2 2013:
Mineral products exports rose by 83.2 percent to US$1.1 billion
from US$583 million in the comparable quarter a year ago due to
13
Primary Income account (formerly the Income account) shows flows for the use of labor and financial resources between resident and non-resident institutional units. Secondary Income account (formerly the Current Transfers account) shows current transfers, in cash or in kind, for nothing in return, between residents and non-residents.
14 Based on BPM6 concept (excluding from the National Statistics Office (NSO) foreign trade statistics those goods that did not involve change in ownership), e.g., consigned goods are deducted, in addition to the exclusion of returned/replacement goods, and temporarily imported goods. For example, of the total electronics exports, 17 percent are on consignment basis.
Exports of goods
sustain growth
Trade-in-goods deficit
declines further

Bangko Sentral ng Pilipinas | 50
Report on Economic and Financial Developments Second Quarter 2013
the upturn in shipments of copper metal and copper concentrates
due to increased export volume even as world price of copper
declined. These copper products are exported mainly to Japan
and South Korea.
Petroleum products exports increased by almost threefold to
US$249 million on account of higher earnings of naphtha
reformates or preparations for preparing spirits, other fuel and
bunker oils, and high speed diesel fuel to Singapore and Malaysia.
Fruits and vegetables exports grew by 26 percent to US$393
million due mainly to continued strong demand for bananas
(increasing by 55.7 percent) from Japan, China, South Korea and
some Middle East countries. Bananas comprised the bulk
(nearly 63 percent) of fruits and vegetables exports.
Sugar and products exports expanded by 17.7 percent to US$56
million from US$48 million a year ago, primarily due to the
notable increases in exports of molasses, and centrifugal and
refined sugar mainly to Japan.
Forest products exports climbed appreciably (by almost 200
percent) due to higher demand from China for lumber and other
forest products.
Conversely, the following major commodity groups recorded declines
in export earnings:
Manufactured products exports fell by 5.1 percent to reach
US$10.5 billion compared to US$11 billion in the same quarter a
year ago due mainly to the downtrend in the shipments of
machinery and transport equipment (by 26.3 percent) notably
other parts and accessories of motor vehicles, and other parts of
printing machinery; chemicals (by 9.9 percent); and garments
(by 8.4 percent), particularly children’s and infants’ wear and polo

Bangko Sentral ng Pilipinas | 51
Report on Economic and Financial Developments Second Quarter 2013
shirts/sports shirts. Other manufactured products including iron &
steel, textile yarns/fabrics, and miscellaneous manufactured
articles likewise posted declines during the quarter in review.
Partly mitigating the decline recorded in this broad category of
manufactured products were the gains posted in the following
sub-categories of manufactured goods:
o Electronics products (including other electronics), increased by
6.4 percent, attributed mainly to higher exports of
semiconductors, automotive, and consumer electronics.
Comprising about 73 percent of electronics exports, shipments
of semiconductors grew by 10.7 percent to US$3.2 billion, due
to increased demand for other monolithic integrated circuits.
This favorable development is consistent with the
improvement in the semiconductor book-to-bill ratio at 1.10 in
June 2013 from 0.93 in June 2012. Moreover, data from the
Semiconductor Industry Association (based in the U.S.) also
indicated that the three-month-moving average sales of
semiconductors in the Americas, Asia-Pacific and Europe rose
by 2.1 percent year-on-year.
o Wood manufactures exports climbed by 91.6 percent due to
increased demand for builder’s joinery and carpentry of wood,
including French windows and frames, other parquet panels,
and spools, cops and bobbins, and sewing thread reels from
Japan.
o Processed food and beverages exports rose by 74.8 percent
due mainly to increased shipments of tuna, processed cheese
and liver in airtight containers to countries in Europe, Asia and
the U.S.

Bangko Sentral ng Pilipinas | 52
Report on Economic and Financial Developments Second Quarter 2013
Coconut products exports decreased by 9.8 percent to US$341
million due largely to the 25.8 percent downturn in sales of
coconut oil given weaker demand from major markets in Europe
and the U.S. and low supply of copra due to declining world price.
Other agro-based products exports contracted slightly to US$220
million on account largely of the 8.8 percent drop in exports of
fresh or preserved fish, particularly shrimps and prawns (by 58.3
percent).
Imports of Goods. Imports of goods decreased moderately (by 1.9
percent) to US$15.1 billion in Q2 2013 from US$15.4 billion in the Imports of goods
contract moderately

Bangko Sentral ng Pilipinas | 53
Report on Economic and Financial Developments Second Quarter 2013
same quarter last year. Except for raw materials and intermediate
goods, increases in all major commodity groups were noted.15
Imports of raw materials and intermediate goods, aggregating US$6.1
billion, were lower by 7.2 percent, pulled down mainly by lower
imports of semi-processed raw materials (by 10.8 percent),
particularly materials and accessories for the manufacture of
electrical equipment and chemicals. Raw material inputs for the
production of electronics exports which comprised 39.2 percent of
semi-processed raw materials dropped by 24.1 percent.
Meanwhile, imports of mineral fuels and lubricants rose by
11.7 percent to US$3.5 billion as a result of the higher import price of
petroleum crude even as import volume declined during the quarter
in review. The import price of petroleum crude went up by
1.5 percent to US$104.89/barrel in Q2 2013 from US$103.34/barrel in
the same quarter a year ago, amid concerns that an escalation of the
conflict in Syria could disrupt global oil supply. Meanwhile, the
volume of petroleum crude imports declined by 35.7 percent to 15.64
million barrels from 24.33 million barrels. Capital goods imports grew
by 2.9 percent to US$3 billion on account of the higher procurement
of power generating and specialized machines (by 6.3 percent),
telecommunication equipment and electrical machines (by 12
percent), aircraft, ships & boats (by 25.5 percent), and land transport
equipment excluding passenger cars & motorized cycle (by 5.6
percent). The uptrend recorded in these commodities more than
offset the lower purchases posted in imports of office & EDP
machines (by 30 percent), and professional, scientific, photographic
equipment and optical goods (by 10.4 percent). Consumer goods
imports rose by 4.5 percent to US$2 billion in Q2 2013 as
15 Based on BPM6 concept (excluding from the National Statistics Office (NSO) foreign trade statistics those goods that did not involve change in ownership), e.g., consigned goods are deducted, in addition to the exclusion of returned/replacement goods, and temporarily imported goods.

Bangko Sentral ng Pilipinas | 54
Report on Economic and Financial Developments Second Quarter 2013
procurement of both durable goods (by 6.5 percent) and non‐durable
goods (by 2.8 percent) registered upward trends. For durable goods,
imports of home appliances and miscellaneous manufactures
increased. For non‐durable goods, other food & live animals chiefly
for food, fruits and vegetables, fish and fish preparation, beverages
and tobacco manufacture, and articles of apparel and accessories, all
posted increments.
Trade-in-Services. Net services receipts amounted to US$226 million
in Q2 2013, higher than the US$156 million posted in the comparable
quarter a year ago. The 44.8 percent expansion was a result of the
gains registered in net receipts from telecommunications, computer,
and information services combined with the decline in net payments
in transport (due to lower outlays for freight as a result of lower
imports of goods), travel, insurance and pension, and government
goods and services (Table 3). This favorable outcome more than
compensated for the decreased net receipts in other business,
personal, cultural and recreational, and construction services, along
with increased net payments in charges for the use of intellectual
property, and financial services.16
16Based on BPM6, financial services consist of: a) explicitly charged and other financial services; and b) financial intermediation services indirectly measured (FISIM). FISIM refers to margins between interest payable and reference rate on loans and deposits. Government goods and services n.i.e. cover goods and services: a) supplied by and to embassies, military bases and international organizations; b) acquired from the host economy by diplomats, consular staff, and military personnel located abroad and their dependents; and c) services supplied by and to governments and not included in other categories of services.
Net receipts of services
increase

Bangko Sentral ng Pilipinas | 55
Report on Economic and Financial Developments Second Quarter 2013
Total exports of business process outsourcing (BPO) services—which
are lodged under telecommunication, computer and information, and
technical, trade-related and other business services—amounted to
US$2.3 billion. The BPO industry remains an important economic
growth driver in the services sector, with a broad range of services in
the voice and non-voice segments.
Primary Income. The primary income account registered net
payments of US$465 million in Q2 2013, a reversal of the US$54
million net receipts recorded in Q2 2012. The turnaround was caused
primarily by higher net payments of investment income even as
earnings of resident overseas Filipino (OF) workers increased by
8 percent to reach US$1.7 billion. In particular, net dividends to
foreign direct and portfolio investors increased by 75.2 percent and
137.1 percent, respectively. Meanwhile, investment income on
reserve assets declined due to lower global interest rates. These
developments were offset by lower net interest payments on other
investments (by 44.1 percent), specifically foreign loans by deposit-
taking corporations (by 31.5 percent) and the NG (by 27.6 percent),
due to declining global interest rates.
Secondary Income. Net receipts in the secondary income account
rose by 4.5 percent to US$5 billion compared to the year-ago level of
US$4.8 billion. This was due to the 5.4 percent expansion in personal
transfers to US$4.7 billion during the quarter in review. Comprising
nearly 98 percent of personal transfers, non-resident OF workers’
remittances rose by 4.8 percent from the level in Q2 2012 to US$4.7
billion. The steady stream of remittances continued to draw strength
from the continued demand for skilled Filipino manpower abroad as
well as the efficient network of bank and non-bank remittance
Primary income
account reverses to
net payments
Net receipts of
secondary income
improve

Bangko Sentral ng Pilipinas | 56
Report on Economic and Financial Developments Second Quarter 2013
channels established worldwide and their expanding financial services
to cater to the various needs of OFs.
Capital and Financial Account
Capital Account. Net receipts in the capital account posted US$24
million in Q2 2013, 20.4 percent lower than the US$30 million
recorded in the same quarter a year ago. This was due mainly to the
decline in capital transfers to the NG.
Financial Account. The financial account registered net inflows of
US$127 million in the review quarter, a turnaround from the US$722
million net outflows recorded in the same period in 2012.17 This was
driven mainly by the reversal of residents’ net acquisition of financial
assets in Q2 2012 to net disposal of financial assets of US$693 million
in Q2 2013. These inflows were partly mitigated by the reversal of net
incurrence of liabilities to net repayment of liabilities of US$566
million. In particular, net inflows were realized in the portfolio
investment account. Notwithstanding the volatility in the global
market as a result of the tapering off of the U.S. Fed quantitative
easing measures, investors’ confidence in the country’s
macroeconomic fundamentals was sustained following the country’s
investment grade credit rating.
Direct investments. The direct investment account yielded US$139
million net outflows (or net lending of residents to the rest of the
world) in Q2 2013, higher by 74 percent than the net outflows
recorded in the same quarter last year. During the quarter, residents’
17 Based on BPM6 concept, the overall balance in the financial account is termed as net lending/net borrowing. Net lending means that, in net terms, the economy supplies funds to the rest of the world, taking into account acquisition and disposal of financial assets and incurrence and repayment of liabilities. Net acquisition of financial assets and net incurrence of liabilities were previously referred to as residents’ investments abroad and non-residents’ investments in the Philippines, respectively, based on BPM5 concept.
Capital account yields
lower net receipts
Direct investments
register higher net
outflows
Financial account
reverses to net inflows

Bangko Sentral ng Pilipinas | 57
Report on Economic and Financial Developments Second Quarter 2013
net acquisition of financial assets of US$265 million exceeded their
net incurrence of liabilities (or foreign direct investments) of US$125
million. Foreign direct investments declined by 77.1 percent as non-
residents’ equity capital reversed to net withdrawals of US$161
million. By country source, gross equity capital placements came
mostly from the U.S., Singapore, the United Kingdom, and Japan and
benefited the following sectors: a) financial and insurance activities;
b) manufacturing; and c) real estate. Non-residents’ reinvestment of
earnings declined by 42.5 percent while their placements in domestic
debt instruments rose by 33.6 percent during the quarter.
Portfolio investments. Net inflows of portfolio investments
(indicating net borrowing of residents from the rest of the world)
reached US$337 million in Q2 2013, although slightly lower by 7.2
percent than the previous year’s level. This developed as the
increase in residents’ net incurrence of liabilities to US$430 million
was partly compensated by the reversal to net acquisition of financial
assets of US$93 million from net disposal of financial assets.
Non-residents’ net placements in long-term debt securities issued by
local corporations (US$930 million) mainly contributed to net
incurrence of liabilities in the portfolio investments account.
These however were partly offset by the following transactions:
a) Non-residents’ net withdrawals of placements in equity securities
issued by domestic deposit-taking corporations (US$225 million);
b) Domestic deposit-taking corporations’ net redemption of long-
term bonds (US$171 million) issued to non-residents;
Portfolio investments
continue to yield net
inflows

Bangko Sentral ng Pilipinas | 58
Report on Economic and Financial Developments Second Quarter 2013
c) NG’s redemption of short-term bonds (US$124 million) issued to
non-residents; and
d) Residents’ net purchase from non-residents through secondary
market trading of bonds issued offshore by local corporations
(US$117 million).
Meanwhile, other local corporations’ net placements in short-term
debt securities (US$213 million) and equity securities (US$147
million) issued by non-residents; and domestic deposit-taking
corporations’ net subscription of foreign debt securities (US$176
million) primarily contributed to the increase in net acquisition of
financial assets.
Financial derivatives. Financial derivatives recorded a net gain of
US$27 million in the second quarter of 2013, a reversal of the US$2
million net loss in the comparable period last year.
Other Investments. The other investment account yielded net
outflows (indicating net lending of residents to the rest of the world)
amounting to US$97 million in Q2 2013, markedly lower than US$1
billion posted in the same quarter last year. This resulted mainly from
higher net repayments of liabilities by residents amounting to US$1.1
billion, which was partly offset by their net disposal of assets
amounting to US$974 million.
Net repayment of liabilities in other investments in Q2 2013 resulted
from the following transactions:
a) Non-residents’ net withdrawal of currency and deposits in
domestic deposit-taking corporations (US$648 million);
Trading in financial
derivatives results in
net gain
Other investment
account registers lower
net outflows

Bangko Sentral ng Pilipinas | 59
Report on Economic and Financial Developments Second Quarter 2013
b) Net repayment of other accounts payable by domestic deposit-
taking corporations (US$683 million); and
c) Net repayment of long-term foreign loans by the NG (US$346
million) and by other domestic corporations (US$210 million).
These were partly offset, however, by other domestic corporations’
net availment of long-term foreign loans (US$511 million) and trade
credit and advances (US$304 million) from non-residents.
Meanwhile, net disposal of financial assets during the review period
was driven mainly by other domestic corporations’ net withdrawals of
currency and deposits in foreign banks (US$1 billion).
International Reserves
Gross international reserves (GIR) continued to accumulate, growing
by 6.7 percent from year-ago levels to reach US$81.3 billion as of
end-June 2013. This is, however, slightly lower than that of the
previous quarter as market volatilities following talks of a possible
tapering by the US of its quantitative easing dampened the monthly
build-up of the GIR. In addition, gold prices in the world market
continued to decline. Nevertheless, the country’s GIR remains
adequate to cover 11.8 months’ worth of imports of goods and
payments of services and income. It is also equivalent to 7.8 times
the country’s short-term external debt based on original maturity and
5.3 times based on residual maturity.
International reserves
continue to grow

Bangko Sentral ng Pilipinas | 60
Report on Economic and Financial Developments Second Quarter 2013
Inflows from the foreign exchange operations and investment income
of the BSP as well as foreign currency deposits by the National
Government (NG) contributed to the increase in the GIR level. These
inflows were partly offset, however, by payments for maturing
foreign exchange obligations by the national government.
Bulk of the reserves was held in foreign investments, comprising 86.9
percent of the total GIR as of end-June. About 9.4 percent of total
reserves were in gold and the remaining 3.7 percent were the
combined holdings of Special Drawing Rights (SDRs), the BSP’s reserve
position in the IMF, and foreign exchange.
In terms of currency composition, majority were held in US dollars,
comprising 79.2 percent of total GIR (excluding gold) as of end-June.
Meanwhile, 10.1 percent of the reserves were denominated in yen,
4.6 percent in euro and 0.7 percent consisted of reserve position in
the IMF. The remaining balance of 5.4 percent were in other
currencies.
Net international reserves (NIR), which refers to the difference
between the BSP’s GIR and total short-term liabilities, was recorded
at US$81.3 billion as of end-June.
0
20,000
40,000
60,000
80,000
100,000
Mar Jun Sep Dec Mar Jun Sep Dec Mar Jun Sep Dec Mar Jun
2010 2011 2012 2013
Gross International Reserves in million US Dollars

Bangko Sentral ng Pilipinas | 61
Report on Economic and Financial Developments Second Quarter 2013
Exchange Rate
The peso averaged weaker at P41.78/US$1, depreciating by 2.56
percent from the previous quarter’s average of P40.71/US$1. 18
Meanwhile, on a year-on-year basis, the peso appreciated by 2.39
percent from the P42.78/US$1 average in the second quarter of 2012.
The peso’s weakening was due mainly to repricing of risk fuelled by
uncertainty about the exit from monetary policy stimulus in the US.
Nonetheless, the continued strong foreign exchange inflows from OF
remittances tempered the further depreciation of the peso.19
The geopolitical tension in North Korea along with the protracted
recession in the euro zone dented investors’ confidence on riskier
emerging market assets such as peso-denominated instruments. The
peso depreciated further in May as it averaged P41.30/US$1 due to
the increase in U.S. bond yields which eroded the appeal of riskier,
high-yielding assets including Philippine bonds. The peso’s
depreciating trend persisted as it averaged P42.91/US$1 in June on
lingering concerns over the US Fed’s unwinding of its bond buying
program, along with liquidity concerns in China which prompted
investors’ flight to safe-haven assets such as US corporate bonds and
equities.20
On a year-to-date basis, the peso depreciated against the US dollar by
4.98 percent on 28 June 2013 as it closed at P43.20/US$1, moving in
18 Dollar rates or the reciprocal of the peso-dollar rates were used to compute for the percentage change. 19 Personal remittances from overseas Filipinos (OFs) continued to rise in April 2013, registering a 7 percent year-on-year growth to reach US$1.9 billion. 20 “Capital Flows to Emerging Market Economies,” (26 June 2013). Institute of International Finance
The peso depreciates

Bangko Sentral ng Pilipinas | 62
Report on Economic and Financial Developments Second Quarter 2013
tandem with the rest of the Asian currencies except the Chinese yuan,
which appreciated vis-à-vis the US dollar.21
On a real trade-weighted basis, the peso gained external price
competitiveness against the basket of currencies of major trading
partners (MTPs) and competitor countries in both the broad and
narrow series during the review quarter. 22 The real effective
exchange rate (REER) indices of the peso decreased q-o-q by 0.5
percent for both the MTPs and broad basket of competitor countries,
and by 1.0 percent for the narrow basket of competitor countries to
reach 97.4 index points, 155.2 index points, and 194.0 index points,
respectively.23 This developed as the peso’s nominal depreciation
21
Based on the last done deal in the afternoon. 22 The basket of the major trading partners is composed of the currencies of US, Japan, the Euro area and the United Kingdom. The broad basket of competitor countries comprises the currencies of Singapore, South Korea, Taiwan, Malaysia, Thailand, Indonesia and Hong Kong while the narrow basket is composed of the currencies of Indonesia, Malaysia and Thailand only. 23 The REER index represents the Nominal Effective Exchange Rate (NEER) index of the peso, adjusted for inflation rate differentials with the countries whose currencies comprise the NEER index basket. A decrease in the REER index indicates some gain in the external price competitiveness of the peso, while a significant increase indicates the opposite. The NEER index, meanwhile, represents the weighted average exchange rate of the peso vis-à-vis a basket of foreign currencies.
-12.21
-7.55
-6.72
-4.98
-3.46
-3.26
-3.08
-1.77
-1.28
1.45
-14 -12 -10 -8 -6 -4 -2 0 2 4
Japanese Yen
Indian Rupee
South Korean Won
Philippine Peso
Malaysian Ringgit
Singaporean Dollar
New Taiwan Dollar
Thai Baht
Indonesian Rupiah
Chinese Yuan
Appreciation/Depreciation of Selected Asian Currencies Closing prices: 28 Dec 2012 vs 28 June 2013 in percent

Bangko Sentral ng Pilipinas | 63
Report on Economic and Financial Developments Second Quarter 2013
more than offset the widening inflation differential relative to these
baskets of currencies.
Meanwhile, on a y-o-y basis, the peso lost external price
competitiveness against the basket of currencies of MTPs as the
combined impact of the peso’s nominal appreciation and the
widening inflation differential against this currency basket resulted to
a real appreciation of the peso against MTPs by 8.2 percent. Likewise,
the peso lost external competitiveness against competitor countries
in both the broad and narrow series as the peso’s nominal
appreciation more than offset the impact of narrowing inflation
differential against these currency baskets. This led to a real
appreciation of the peso against the broad and narrow baskets of
competitor countries by 3.6 percent and 4.0 percent, respectively.
External Debt
As of end-June 2013, the outstanding BSP-approved/registered
external debt stood at US$58.0 billion, reflecting a drop of US$1.0
billion or 1.8 percent from US$59.0 billion in the previous quarter. On
a y-o-y basis, the debt stock likewise declined by US$3.2 billion (5.3
percent) from US$61.2 billion in June 2012.
External debt stays
manageable

Bangko Sentral ng Pilipinas | 64
Report on Economic and Financial Developments Second Quarter 2013
The decline in the debt stock in Q2 2013 resulted from: (a) negative
foreign exchange (FX) revaluation adjustments (US$725 million),
particularly in yen-denominated loans as the US dollar strengthened;
and (b) net loan repayments (US$450 million) largely by the public
sector. These were partially offset by an increase in non-residents’
investments in Philippine debt papers (US$120 million),
notwithstanding concerns about the tapering of the US Fed’s QE
program.
Similarly, the y-o-y decline was due mainly to the negative FX
revaluation adjustments (US$3.2 billion) and transfers to residents of
Philippine debt papers held by non-residents (US$660 million). The
contraction in debt stock was partially offset by net availments
(US$480 million) and previous periods’ adjustments (US$150 million).
Medium- and long-term (MLT) loans (i.e., those with original
maturities longer than one (1) year) declined by 1.6 percent to
US$48.5 billion (83.5 percent of total external debt) from US$49.3
billion (83.4 percent) in the first quarter of 2013. A marginal increase

Bangko Sentral ng Pilipinas | 65
Report on Economic and Financial Developments Second Quarter 2013
in the share of MLT loans to total external debt was attributed to the
relatively faster decline in short-term debt.
Meanwhile, short-term (ST) obligations (those with original maturities
of up to one year) decreased by 2.5 percent to US$9.5 billion (16.5
percent of total external debt) from US$9.8 billion (16.6 percent of
total external debt).
The country’s external debt profile continued to be dominated by
MLT loans. The larger share of MLT accounts to total external debt
indicate that loan payments are spread out over a longer period of
time, resulting in a more manageable level of debt servicing. The
weighted average maturity of 20.2 years for MLT loans with original
tenors of more than one (1) year was slightly shorter than the 20.3
years recorded a quarter ago due to prepayment of certain loans
owed by the National Government (NG) to the Asian Development
Bank (ADB). The computation excluded the SDR allocation24 from the
International Monetary Fund (US$1.3 billion) which is considered as
permanent debt.
The country’s external debt ratio (a solvency indicator) or total
outstanding debt as a percent of annual aggregate output or Gross
National Income (GNI) sustained its improving trend, declining to 18.3
percent from 19.1 percent and 21.9 percent in the previous quarter
and a year ago, respectively. Similarly, the external debt to GDP ratio
was estimated at 21.8 percent during the review period, lower than
the 22.8 percent a quarter ago and 26.1 percent posted a year ago.
The debt service burden (DSB) ratio, which relates the total principal
and interest payments to the total exports of goods and receipts from
24
SDR allocation from the IMF is excluded from the calculation of weighted average maturity of MLT accounts, being a permanent debt to be repaid only in the event that the IMF SDR Department ceases to exist or the debtor country ceases to be a member of the IMF.

Bangko Sentral ng Pilipinas | 66
Report on Economic and Financial Developments Second Quarter 2013
services and income (XGSI), was estimated at 5.4 percent for the
review period, lower than the 11.5 percent and 7.1 percent a
quarter ago and a year ago, respectively. The ratio, which is a
measure of the adequacy of the country’s foreign exchange earnings
to meet maturing loan payments, has remained below the
international benchmark range of 20-25 percent.
Foreign Interest Rates
Monetary policy in advanced economies remained accommodative
during the review period to support the pace of economic recovery
due to continued weakness in labor market conditions, slowdown in
spending, and anemic bank lending growth.
In the second quarter of 2013, the Federal Open Market Committee
(FOMC) maintained the target range for the federal funds at 0 to 0.25
percent and anticipates that this low range is appropriate as long as
the unemployment rate remains above 6.5 percent. In addition, the
FOMC decided to continue purchasing additional agency mortgage-
backed securities at a pace of $40 billion per month. The FOMC will
also purchase longer-term Treasury securities after its program to
extend the average maturity of its holdings of Treasury securities is
completed at the end of the year, initially at a pace of $45 billion per
month. It will likewise maintain its existing policy of reinvesting
principal payments from its holdings of agency debt and agency
mortgage-backed securities in agency mortgage-backed securities,
and will resume rolling over maturing Treasury securities at auction.
As the FOMC maintained its monetary policy stance, the U.S. prime
rate and discount rate continued to average at 3.25 percent and 0.75
percent, respectively, during the review period.25 Meanwhile, the U.S.
25 The prime rate refers to the interest rate charged by banks to their most creditworthy customers. The discount rate refers to the rate charged by the Federal Reserve Bank when it extends credit to depository institutions.
Monetary policy in
advanced economies
remain accommodative

Bangko Sentral ng Pilipinas | 67
Report on Economic and Financial Developments Second Quarter 2013
federal funds rate decreased to 0.115 percent in the second quarter
of 2013 from the 0.155 percent average reported in the previous
quarter (Table 16).
During his 22 May 2013 testimony before the Joint Economic
Committee of the US Congress, Federal Reserve Chairman Ben
Bernanke announced that at the Federal Open Market Committee's
most recent meeting, it was made clear that the Committee is
prepared to increase or reduce the pace of its asset purchases to
ensure that the stance of monetary policy remains appropriate as the
outlook for the labor market or inflation changes. Accordingly, in
considering whether a recalibration of the pace of its purchases is
warranted, the Committee will continue to assess the degree of
progress made toward its objectives in light of incoming information.
The Committee also reiterated, consistent with its forward guidance
regarding the federal funds rate, that it expects a highly
accommodative stance of monetary policy to remain appropriate for
a considerable time after the asset purchase program ends and the
economic recovery strengthens.26 This development was viewed by
financial markets that the Fed might reduce their bond purchases,
and that the quantitative easing might taper off sooner than
expected, in light of the information that the US labor market
condition is improving. The 10-year US treasury yield was quick to
react as it rose by 11 basis points, from 1.93 percent to 2.04 percent.
This is the first time since March of this year that the yield breached
the 2.0 percent mark.27
The Monetary Policy Committee (MPC) of the Bank of England (BOE)
also maintained its monetary policy settings, keeping the official bank
rate paid on commercial bank reserves at 0.5 percent in the second
quarter of 2013. In addition, the MPC also decided to maintain the
26 Source: Federal Reserve Bank website (http://www.federalreserve.gov/newsevents/testimony/bernanke20130522a.htm) 27 Bloomberg

Bangko Sentral ng Pilipinas | 68
Report on Economic and Financial Developments Second Quarter 2013
stock of asset purchases financed by the issuance of central bank
reserves at £375 billion.28
Similarly, the Bank of Japan (BOJ) kept the uncollateralized overnight
call rate at around 0 to 0.1 percent. In achieving price stability target,
the BOJ will pursue aggressive monetary easing, through a virtually
zero interest rate policy and purchases of financial assets. However,
last April 2013, the BOJ entered a new phase of monetary easing as it
embarked on its “Quantitative and Qualitative Monetary Easing”
policy. The main operating target for its money market operations
was changed from the uncollateralized overnight call rate to the
monetary base (the adoption of the “monetary base control”). This
new phase will have the effect of doubling the monetary base and the
outstanding amounts of Japanese government bonds (JGBs) and
exchange-traded funds (ETFs) in two years and more than double the
average remaining maturity of JGB purchases. Particularly, the BOJ
will conduct money market operations so that the monetary base will
increase at an annual pace of about 60-70 trillion yen.29 On the other
hand, with the adoption of a more aggressive purchasing of JGBs, the
Asset Purchase Program will be terminated. The purchases of JGBs,
under the previous program, will be absorbed into the
aforementioned JGB purchases. The Bank will purchase JGBs so that
their amount outstanding will increase at an annual pace of about 50
trillion yen.30
The Governing Council of the European Central Bank (ECB), in its
meeting last 2 May 2013, decided to reduce the interest rates on the
28 The previous change in the official bank rate was a reduction of 0.5 percentage points to 0.5 percent on 5 March 2009. A program of asset purchases financed by the issuance of central bank reserves was initiated on 5 March 2009. The previous change in the size of that program was an increase of £50 billion to a total of £375 billion on 5 July 2012. 29 Under this guideline, the monetary base -- whose amount outstanding was 138 trillion yen at end-2012 -- is expected to reach 200 trillion yen at end-2013 and 270 trillion yen at end-2014 (Source: Bank of Japan’s Statement of Monetary Policy, 04 April 2013 -Introduction of the "Quantitative and Qualitative Monetary Easing") 30 The monthly flow of JGB purchases is expected to become 7+ trillion yen on a gross basis.

Bangko Sentral ng Pilipinas | 69
Report on Economic and Financial Developments Second Quarter 2013
main refinancing operations and on the marginal lending facility by 25
basis points to 0.50 percent and by 50 basis points to 1.00 percent,
respectively. The said cutback took effect last 8 May 2013. However,
for the deposit facility, the council maintained the interest rate at 0.0
percent.31 The council also decided to continue conducting its main
refinancing operations (MROs) as fixed rate tender procedures with
full allotment for as long as necessary, and at least until the end of
the 6th maintenance period on 8 July 2014.
Meanwhile, the 90-day London Interbank Offered Rate (LIBOR) and
the 90-day Singapore Interbank Offered Rate (SIBOR) decreased by
1.7 basis points and 1.6 basis points, respectively, as global financial
markets remained liquid. The LIBOR averaged 0.2750 percent while
the SIBOR stood at 0.2793 percent, respectively, (Table 16).
Global Economic Developments
In recent years, global economic growth was led by emerging
economies, but this has been showing signs of slackening lately as
growth in mature economies picked up slowly. Global labor market
conditions improved gradually except in the euro area. Inflation rates
of advanced economies were generally lower while those of emerging
markets showed mixed trends.
31 The decisions of the Governing Council of the European Central Bank are available online at http://www.ecb.int/press/govcdec/mopo/2013/html/index.en.html

Bangko Sentral ng Pilipinas | 70
Report on Economic and Financial Developments Second Quarter 2013
Q3 2012 Q4 2012 Q1 2013 Q2 2013 Q3 2012 Q4 2012 Q1 2013 Q2 2013 Q3 2012 Q4 2012 Q1 2013 Q2 2013G3 US 3.1 2.0 1.3 1.4 1.7 1.9 1.7 1.4 8.0 7.8 7.7 7.6 Japan 0.3 0.4 0.3 0.9 -0.4 -0.2 -0.6 -0.3 4.3 4.2 4.3 4.0 Euro area -0.7 -0.9 -1.1 -0.7 2.5 2.3 1.8 1.4 11.5 11.8 12.0 12.1
Asian NIEs Hong Kong 1.5 2.8 2.9 3.3 3.0 3.7 3.7 4.0 3.3 3.3 3.4 3.4
South Korea 1.6 1.5 1.5 2.3 1.6 1.7 1.4 1.1 3.1 3.0 3.3 3.2 Singapore 0.0 1.5 0.2 3.7 4.2 4.0 4.0 1.6 1.9 1.8 1.9 2.1 China 7.4 7.9 7.7 7.5 2.0 2.2 2.5 2.4 4.1 4.1 4.1 4.1 India 5.3 4.7 4.8 n.a. 7.9 7.2 6.7 4.7 n.a. n.a. n.a n.a.
ASEAN Indonesia 6.2 6.1 6.0 5.8 4.5 4.4 5.3 5.6 6.1 n.a. n.a. n.a. Malaysia 5.3 6.5 4.1 4.3 1.4 1.3 1.5 1.8 3.0 3.1 3.2 3.2 Philippines 7.3 7.1 7.8 7.5 3.5 2.9 3.2 2.6 7.0 6.8 7.1 7.5 Thailand 3.1 19.1 5.4 2.8 2.9 3.2 3.1 2.3 0.6 0.5 0.7 n.a. Vietnam 4.7 5.0 4.8 4.9 5.6 7.0 6.9 6.8 2.1 n.a. n.a. n.a.
Macroeconomic Indicators in Selected Economies, Q2 2013
Year-on-year growth rates (in percent)
Real GDP
Country
Sources: Bloomberg; The Institute of International Finance, Inc.; Bureau of Economic Analysis; Bureau of Labor Statistics; Cabinet Office; European
Central Bank; Hong Kong Administrative Region Government Portal; and Korea National Statistics
1/ Unemployment rate is the proportion (in percent) of the total number of unemployed to the total number of persons in the labor force.
Inflation Unemployment1/
The massive monetary stimulus adopted by advanced economies
helped fuel their economic growth. The US GDP growth rate in the
second quarter accelerated slightly to 1.4 percent from the previous
quarter’s 1.3 percent. This growth reflected primarily positive
contributions from personal consumption expenditures, exports, non-
residential fixed investments, private inventory investments, and
residential investments.32
In Japan, economic gains were also posted in the second quarter of
2013, with GDP growing by 0.9 percent from the last quarter’s 0.3
percent due to stronger domestic and external demand. Also, the
increase in industrial production, real exports and public investments,
as well as the pick-up in housing investment buoyed Japan’s GDP
growth.33
Similarly, economic activity in the euro area showed some
improvement as GDP growth fell at a slower pace of 0.7 percent from
the previous quarter’s 1.1 percent decline. The expansion in industrial 32 US Department of Commerce, Bureau of Economic Analysis: advanced estimate dated 31 July 2013. http://www.bea.gov/newsreleases/national/gdp/gdpnewsrelease.htm 33 Monthly Report of Recent Economic and Financial Developments, Bank of Japan, 12 July 2013.

Bangko Sentral ng Pilipinas | 71
Report on Economic and Financial Developments Second Quarter 2013
output supported the soft recovery in the region. Nonetheless, the
euro area’s economic slump is expected to turn to positive growth on
the back of improved investors’ sentiment and the expected pick-up
in global demand. Meanwhile, domestic demand should be supported
by the sustained accommodative monetary policy stance and by the
gains in real income due to generally low prices.34
Among the newly-industrialized economies in Asia, Hong Kong, South
Korea and Singapore grew by 3.3 percent, 2.3 percent, and 3.7
percent, respectively. Meanwhile, China’s GDP slightly slowed down
to 7.5 percent in the second quarter compared to 7.7 percent in the
previous quarter. Weak industrial output, sluggish fixed-asset
investment expansion and lackluster exports weighed down on
China’s growth.
The average inflation rates of major advanced economies decelerated
in the second quarter of 2013. In the U.S., the inflation rate decreased
to 1.4 percent from 1.7 percent in the previous quarter. Likewise, in
the euro area, the inflation rate declined to 1.4 percent from 1.8
percent in the previous quarter. In Japan, deflation persisted, but to a
lesser extent, at -0.3 percent from last quarter’s -0.6 percent.
In the Asian region, inflation showed mixed trends. The inflation rate
in Hong Kong rose to 4.0 percent from 3.7 percent in the first quarter.
In contrast, the inflation rates in South Korea, Singapore, China and
India declined to 1.1 percent, 1.6 percent, 2.4 percent and 4.7
percent, respectively, from the previous quarter’s 1.4 percent, 4.0
percent, 2.5 percent and 6.7 percent.
34 European Central Bank (ECB) Monthly Bulletin, August 2013 and the Organization for Economic Cooperation and Development (OECD), Quarterly National Accounts dated 22 August 2013.

Bangko Sentral ng Pilipinas | 72
Report on Economic and Financial Developments Second Quarter 2013
Global labor market conditions generally improved except in the euro
area. The rate of unemployment in the US eased to 7.6 percent from
7.7 in the previous quarter, reflective of the mild GDP growth. In
Japan, unemployment decelerated to 4.0 percent from 4.3 percent a
quarter ago. Meanwhile in the euro area, unemployment marginally
inched up to 12.1 percent from 12.0 percent in the previous quarter.
In the East Asian region, unemployment rates showed mixed trends.
In Hong Kong and China, unemployment rates remained subdued at
3.4 percent and 4.1 percent, respectively. In South Korea, the jobless
rate eased slightly to 3.2 percent from 3.3 percent in the previous
quarter. In contrast, the unemployment rate in Singapore increased
to 2.1 percent from previous quarter’s 1.9 percent.
F. Financial Condition of the BSP
Balance Sheet
Based on preliminary and unaudited financial statement of the BSP
for end-June 2013, total assets reached P4,091.3 billion, 11.1 percent
or P407.1 billion higher than the year-ago level (Table 17). Relative
to the end-March 2013 level, the amount was higher by 1.0 percent
or P42.3 billion. The BSP’s liabilities increased by P459 billion or 12.8
percent y-o-y to P4,041.7 billion, and by 1.1 percent relative to the
end-March 2013 level. Meanwhile, the BSP’s net worth declined to
P49.6 billion compared to the year-ago level of P101.5 billion, as the
growth in liabilities was slightly higher than the growth in assets
during the period. The amount was also lower than the P52.4 billion
posted at end-March 2013.
BSP’s net worth declines

Bangko Sentral ng Pilipinas | 73
Report on Economic and Financial Developments Second Quarter 2013
The y-o-y expansion in the BSP’s assets was largely due to the build-
up of international reserves, which accounted for around 85.4
percent of total assets. The P291.5 billion expansion in international
reserves was principally due to the continued foreign exchange
operations and investment income of the BSP as well as deposits by
the Treasurer of the Philippines (TOP) of proceeds from bond
issuances and other foreign borrowings.
The BSP’s liabilities similarly increased during the review period due
mainly to higher deposits, as part of the BSP’s continued liquidity
management operations. In particular, reserve deposits of banks and
other financial institutions increased by P197 billion to P913.6 billion
from P716.6 billion posted a year ago. Meanwhile, placements in the
SDA facility increased by P138.2 billion to P1,710.5 billion from
P1,572.3 billion registered a year ago.
Income Statement
Based on preliminary and unaudited data, the BSP’s financial
operations, for the second quarter of 2013, recorded a loss of P1.8
billion, which, is a marked improvement from the immediately
preceding quarter’s loss of P14.3 billion (Table 18). The sharp cut in
losses was primarily the result of lower interest expense and realized
Balance Sheet of the BSP*In billion pesos
2013 2012
Jun Mar Jun
Assets 4,091.3 4,049.0 3,684.2
Liabilities 4,041.7 3,996.6 3,582.7
Networth 49.6 52.4 101.5
* Unaudited
BSP registers lower net loss

Bangko Sentral ng Pilipinas | 74
Report on Economic and Financial Developments Second Quarter 2013
foreign exchange losses during the period, which combined to only
about P13.8 billion as compared to P25.2 billion in the first quarter.
Total revenues amounted to P20.8 billion, slightly higher than the
P17.9 billion posted during the same period last year. Interest
income, which comprised the primary source of revenues, was down
by 24.8 percent or P2.5 billion lower than the previous year’s level.
Meanwhile, miscellaneous income improved by 68.1 percent or 5.1
billion, higher than the level posted during the same period a year
ago.
Total expenditures amounted to P20.6 billion, P6.5 billion lower than
the level posted for the same period last year. The y-o-y decrease in
expenditures was due mainly to lower interest expense, which fell by
38.9 percent, on account of the reduction of interest rates on the SDA
facility by 50 bps to 2.50 percent in March, and by another 50 bps to
2.00 percent in April across all tenors.
G. Challenges and Policy Directions
Overall global economic conditions remain fragile as risks of weaker
growth in emerging economies have increased due to domestic
capacity constraints, weak external demand and possibility of tighter
Income Statement of the BSP*In billion pesos
2013 2012
Q2 Q1 Q2
Revenue 20.830 15.239 17.851
Less: Expense 20.634 23.261 27.115
Equals Net Income Before
FX Gains/Loss (-) 0.196 -8.022 -9.264
Add/Less: Gains/Losses on FX Rate
Fluctuations -0.290 -6.256 -9.567
Less: Provision for Income Tax 1.718 0.000 0.000
Equals: Net Income Available
for Distribution -1.812 -14.278 -18.831
* Unaudited

Bangko Sentral ng Pilipinas | 75
Report on Economic and Financial Developments Second Quarter 2013
financial conditions should the unwinding of unconventional
monetary policy in the US lead to capital flow reversals.
In addition, there are concerns on the geo-political uncertainty in the
Middle East, specifically in Syria and Egypt, which could lead to oil
supply disruptions and higher oil prices, and volatility in the global
financial markets.
In its World Economic Outlook Update (July 2013), the International
Monetary Fund (IMF) downscaled its global growth projections
relative to forecasts released in April 2013, reflecting slower growth
in emerging markets and continued recession in the euro area.35
The biggest challenge for policymakers is to strengthen global
economic growth. Specifically, major advanced economies face the
challenge of maintaining a supportive macroeconomic policy mix,
combined with credible plans for reaching medium-term debt
sustainability and reforms to restore balance sheets and credit
channels. Many emerging market and developing economies face a
tradeoff between macroeconomic policies to support weak activity
and those to contain capital outflows. Macroprudential and structural
reforms can mitigate the risks associated with this tradeoff.36
While global growth projections from the IMF were revised
downwards, that of the Philippines was adjusted upwards.37 The
Philippines needs to keep the economy on a steady growth course,
35
The IMF forecasted global growth at 3.1 percent and 3.8 percent in 2013 and 2014, respectively. These estimates were lower by 0.2 percentage points compared to projections published in April 2013. Advanced economies are expected to grow by 1.2 percent in 2013 and 2.1 percent in 2014. Meanwhile, growth projections for emerging markets and developing economies by the IMF have been scaled down by 0.3 percentage point compared to the last WEO release. Emerging markets and developing economies are forecasted to grow by 5.0 percent and 5.4 percent in 2013 and 2014, respectively. 36
International Monetary Fund (2013). ‘World Economic Outlook Update.’ July. 37
The IMF growth forecast for the Philippines was raised to 7.0 percent in 2013 from 6.0 percent and 6.0 percent in 2014 from 5.5 percent.

Bangko Sentral ng Pilipinas | 76
Report on Economic and Financial Developments Second Quarter 2013
requiring policies largely aimed at sustaining domestic sources of
growth to help compensate for any weaknesses in external demand.
In this regard, close coordination between fiscal and monetary
policies will help ensure that the macroeconomic environment
remains supportive of sustainable and balanced growth.
The favorable fiscal position of the NG provides sufficient policy space
to support projects that will continue to stimulate aggregate demand.
Growth could further accelerate once the implementation of various
infrastructure projects gain momentum. Furthermore, continuing
social spending programs for health, education, housing,
employment, and conditional cash transfers, as well as initiatives for
financial inclusion and consumer protection, shall help promote
inclusive and sustainable growth.
For its part, the BSP remains committed to its mandate of
safeguarding price stability and ensuring a macroeconomic
environment conducive to sustained growth. The risks to inflation
outlook remain broadly balanced, supporting the argument for
keeping policy rates steady. Downside risks to the inflation outlook
continue to persist owing to uncertainty over the strength of the
global economy and its impact on international commodity prices.
Meanwhile, the upside pressures could emanate from the likelihood
of higher electricity rates and continued strong liquidity growth.
The pronouncements by the US Fed prompted portfolio adjustments
in global financial markets, which in turn, generated increased
volatility in the equity, bond and foreign exchange markets. Such
volatility could recur over the short term as these markets try to fully
assess and price in the impact of unwinding of the US quantitative
easing (QE) program. Capital flow reversals, however, could ensue if
underlying vulnerabilities in emerging markets are left unchecked.

Bangko Sentral ng Pilipinas | 77
Report on Economic and Financial Developments Second Quarter 2013
The Institute for International Finance (IIF) forecasts a decline in
private capital flows to emerging markets in the next two years as
yield spreads narrow with the eventual exit from extraordinary
monetary stimulus by the US Fed. Nonetheless, capital inflows into
the Philippines are likely to remain substantial. The IIF has
acknowledged that strong growth potential along with recent
sovereign credit ratings upgrade would continue to attract foreign
interest into the country.38
However, the eventual scaling back of extraordinary monetary
measures by the US Federal Reserve could consequently lead to
corrections in the foreign exchange market and weakening of the
domestic currency. Some of the corrections may have in fact helped
reduce the risk of a build-up of stretched asset valuations and the risk
of “search for yields’’ that could contribute to financial market
imbalances. These, however, should be counterbalanced by the
steady stream of remittances and continued capital inflows into the
country.
Against this backdrop, the BSP stands ready to employ, from its menu
of policy instruments, measures that will help ensure that the
benefits of capital flows are maximized while warding off the
potential destabilizing impact of volatile capital flows on price and
financial stability. The BSP will also continue to maintain a market-
determined exchange rate, while guarding against speculative flows
that could contribute to the peso’s volatility and undermine the
inflation target.
Amid downside risks to global economic prospects on the horizon,
contingency measures are in place to ensure adequate liquidity in the
38
IIF (2013). ‘Capital Flows to Emerging Market Economies.’ 26 June.

Bangko Sentral ng Pilipinas | 78
Report on Economic and Financial Developments Second Quarter 2013
financial system, should capital flows reverse course. The BSP will
maintain a comfortable level of international reserves to serve as
added insurance against external shocks.
On banking regulation and supervision, the BSP will sustain the
reform momentum with a view to strengthen its resilience against
shocks as well as to enhance its role as a catalyst for durable long-
term economic growth. Toward this end, the BSP continues to
enhance its monitoring of financial market developments as it also
continues to put in place measures to strengthen the capacity of the
banking system to endure shocks, including the adoption of expanded
reporting standards for real estate exposures as well as the Basel III
capital adequacy standards beginning January 2014. Likewise, the BSP
continues to take the lead in promoting financial inclusion with
programs and reforms aimed at promoting greater access to financial
services.
The BSP also remains proactive in ensuring the credibility of the
payments and settlements system with the continued enhancement
of its processes in accordance with international best practices.
Finally, amid the increasing interconnectedness of global financial
markets, the BSP will remain an active participant in regional and
international cooperation programs and fora, in order to reap the
benefits of collaborative engagement.

Bangko Sentral ng Pilipinas | 79
Report on Economic and Financial Developments Second Quarter 2013
Annex A
Banking Policies
Banking policies implemented during the quarter were aimed at strengthening regulations and
guidelines on: 1) foreign exchange transactions; 2) temporary window for the purchase of
foreign exchange (FX) to service unregistered private sector foreign loans; 3) appendix 45 of
MORB, specifically on the general features of a microfinance deposit account; 4) rate of
Interest in the absence of stipulation; 5) cross selling framework; 6) qualifications of
independent director; and 7) banking days and hours.
Amendments to Foreign Exchange Regulations
The BSP amended the regulations governing foreign exchange transactions which include,
among others:
Increasing the ceiling that Authorized Agent Banks (AABs)/AAB-subsidiary/affiliate forex
corporations (AAB-forex corps) may sell to US$120,000 without need to submit any
documentation.
Inclusion of the following as allowable forms of investment:
a. Offshore FX-denominated global funds/mutual funds and unit investment trust funds;
b. FX intercompany loans of resident enterprises to their offshore parent
companies/subsidiaries with an original tenor of at least one (1) year;
c. Real property abroad, including condominium units;
d. Debt securities issued offshore by both residents and non-residents that are in local
banks’ asset inventory; and
e. Equity securities issued by residents that are listed abroad.

Bangko Sentral ng Pilipinas | 80
Report on Economic and Financial Developments Second Quarter 2013
Inclusion of the following as allowable funding for onshore peso accounts of non-residents:
a. onshore peso receipts of non-residents from residents for services rendered by the
former to the latter;
b. peso receipts of onshore expatriates with contracts of less than one (1) year representing
salary/ allowance/other benefits; and
c. onshore peso funds of foreign students enrolled in the Philippines and non-resident
Filipinos.
Allowing a depository bank to sell FX for the balance of the peso deposit account funded in
the forms enumerated above up to US$60,000 per day;
Increasing the amount of FX that may be purchased using unspent pesos of departing non-
resident tourists or balikbayan without need to show proof/s of previous sale of FX for
pesos from US$5,000 to US$10,000 or its equivalent in other foreign currency.
(Circular No. 794 dated 18 April 2013)
Amendment to Align the Familial Restrictions Applicable to "Independent Director" with the
Existing Provision of the Securities Regulation Code
The Manual of Regulations for Banks (MORB) and Manual of Regulations for Non-Bank
Financial Institutions (MORNBFI) were amended to align the familial restrictions applicable to
"Independent Director" with the existing provision of the Securities Regulation Code.
Circular 793 defines an independent director as to refer to a person who is not a relative,
legitimate or common-law, of any director, stockholder holding shares of stock sufficient to
elect one seat in the board of the bank or any of its related companies. For this purpose,
relatives refer to spouse, parent, child, brother, sister, parent-in-law, son-/daughter-in-law,
and brother-/sister-in-law.
The same circular also prescribes that individuals appointed independent directors must
submit certifications, which were signed under oath, that they were not relative, legitimate or

Bangko Sentral ng Pilipinas | 81
Report on Economic and Financial Developments Second Quarter 2013
common-law, of any director officer or shareholder of the banks. (Circular No. 793 dated 5
July 2013)
Issuance of Guidelines on the Temporary Window for the Purchase of Foreign Exchange (FX)
to Service Unregistered Private Sector Foreign Loans
The BSP issued the guidelines on the temporary window for the purchase of foreign exchange
(FX) to service unregistered private sector foreign loans. The temporary window shall be
available from May to December 2013 and shall cover the following foreign loans of the
private sector that are booked and outstanding in the borrower’s records as of 30 September
2012 with payments (principal, interest and other related fees) falling due within said period:
a. Loans approved by the Bangko Sentral ng Pilipinas (BSP) but not yet registered;
b. Loans without BSP approval/registration, but being reported to the BSP; and
c. Loans without BSP approval/registration, and currently not being reported to the BSP.
Prepayments and arrears may also be considered subject to conditions indicated herein.
A limit on the maximum amount of FX that may be purchased shall be determined by the BSP
based on prevailing conditions.
Private sector borrowers with foreign loans covered by the above categories may purchase FX
from authorized agent banks (AABs) and/or their subsidiary/affiliate foreign exchange
corporations (AAB-forex corps) to service regular/scheduled loan payments (principal, interest
and related fees), including arrears and prepayments within the period allowed herein upon
compliance with the procedure stated under circular 795.
A fixed processing fee of PHP10,000 will be charged by the BSP on each application for
servicing of private sector foreign loans that are: (a) without BSP approval/registration, but
being reported to BSP; and (b) without BSP approval/registration, and currently not being
reported to BSP. The processing fee shall be in the form of Manager’s Check or Cashier’s Check
payable to the BSP.
FX selling AAB-forex corps and private sector borrowers shall report such FX sales/purchases to
the BSP, in accordance with the deadlines set. (Circular 795 dated 18 April 2013)

Bangko Sentral ng Pilipinas | 82
Report on Economic and Financial Developments Second Quarter 2013
Amendments to Appendix 45 (Notes on Microfinance) of Section X361 of the Manual of
Regulations for Banks
The BSP amended Appendix 45 of the MORB, specifically on general features of a Microfinance
Savings Deposit Account, by increasing the average daily savings account balance of individual
microfinance clients from a maximum of P15,000.00 to P40,000.00.
Item no. 3 of Subsection G on General Features of a Microfinance Savings Deposit Account will
now read as follows:
3. Only for individual microfinance clients whose average daily savings account balance does
not exceed Forty Thousand Pesos (P40 000.00). (Circular No. 796 dated 3 May 2013)
Lower Rate of Interest in the Absence of Stipulation
The BSP lowered to six from twelve percent the rate of interest on obligations in the absence
of stipulation in loan contracts. Circular no.799 states that the rate of interest for the
forbearance of any money, goods or credits and the rate allowed in judgments, in the absence
of an express contract as to such rate of interest, shall be six percent per annum. Subsection
X305.1 of the Manual of Regulations for Banks and Sections 4305Q.1, 4305S.3 and 4303P.1 of
the Manual of Regulations for Non-Bank Financial Institutions are hereby amended
accordingly. (Circular 799 dated 21 June 2013)
Revision of Cross-Selling Framework
The Monetary Board (MB) liberalized the framework for the cross-selling of financial products
by banks. Under the new guidelines, banks may use their premises to market and sell the
financial products of their related parties under a banking group or a financial conglomerate.
Cross-selling is an international practice that separates the production of a financial product or
service from its distribution. Under the new guidelines, bank premises are used as an access
point for financial products offered by related parties.

Bangko Sentral ng Pilipinas | 83
Report on Economic and Financial Developments Second Quarter 2013
The new rules now allow all types of banks to perform cross-selling, giving consumers a
broader array of financial products using the existing branch network of the banking system.
They also dispense with the submission of product by product documentary requirements
under the previous guidelines.
While documentary requirements have been streamlined, governance standards have been
strengthened, an oversight mechanism specific to cross-selling has been outlined in the new
rules. Among others, a complaints handling mechanism has been instituted.
To sustain high standards of risk management, the products were limited to those without
investment risk and allowed only banks with CAMELS rating of at least 3 to perform cross-
selling.
Banks may now cross-sell credit cards and auto, home mortgage, personal and other retail
loans; term, life, non-life and other protection-type insurance products; cash, debit and related
products; and other similar financial instruments that may be authorized by the MB. (Circular
No. 801 dated 27 June 2013)
Amendment of Section X156 of the MORB on the Submission to the BSP of the Notice of
Intended Closure of Banks and/or Their Branches or Other Offices Due to Local Holidays
The BSP amended x156 of MORB to require banks and/or their branches, extension offices
(EOs or other banking offices (OBOs) to notify the BSP two days before their closure in
connection with the observance of a local holiday within their area.
The required notice shall be supported by a certification jointly signed by the President of the
bank or officer of equivalent position and the head of the branches department, if any.
In case of closure of the bank and/or their branches/EOs/OBOs due to approved local holidays
covered by a Presidential Proclamation, no notice of temporary closure to the BSP shall be
required. (Circular No. 802 dated 21 June 2013)

Bangko Sentral ng Pilipinas | 84
Report on Economic and Financial Developments Second Quarter 2013
Annex B
Capital Market Reforms
Promoting investor confidence
PSE adjusted the float levels of six sector index member companies on 27 May 2013,
following the conduct of its quarterly rebalancing of float levels, based on the PSE Revised
Policy on Index Management. The adjustments are based on the companies’ latest public
ownership reports as of 31 March 2013 to the PSE where the free float level for each
company is amended only when it changes by more than 5 percent on a cumulative basis.
Nonetheless, the quarterly rebalancing of the float levels does not affect the composition
of the PSE indices.
Enhancing transparency and corporate governance
SEC approved new PSE rules creating a new listing board structure. Under the new rules,
there shall be two listing boards: the Small, Medium and Emerging (SME) board and the
Main Board. Companies that will list on what will be called the Main Board must have an
authorized capital stock of at least P500 million, and at least three years of operating
history. A company applying for listing on the new SME board must have an authorized
capital stock of P100 million or more, of which a minimum of 25 percent must be
subscribed and fully paid. This new board structure shall replace the previous three-listing
board structure of the Exchange composed of the First Board, Second Board and the Small
and Medium Enterprise Board.
The BSP liberalized existing foreign exchange (FX) regulations, the sixth in a series of
reforms initiated by the Bank since 2007 to keep FX policies responsive to current
economic conditions and encourage the general public to shift their transactions from the
informal market to the banking system, which may improve further capture of pertinent
information needed for policy making. The new rules aim to further simplify FX

Bangko Sentral ng Pilipinas | 85
Report on Economic and Financial Developments Second Quarter 2013
transactions of both residents and non-residents with banks and increase residents’ over-
the-counter (OTC) FX purchase limit per transaction from US$60,000 to US$120,000
without the need for documentation. The reform also increased the allowable purchase of
tourists and Filipino migrant workers to as much as US$10,000 from the previous
US$5,000 when they leave the country. Philippine residents will also have more
investment instruments to choose from that can be funded with FX bought from banks.
Non-residents, on the other hand, have been given more options for funding their
onshore peso requirements.
Expanding products and markets
The BSP liberalized the framework for the cross-selling39 of financial products by banks.
Under the new guidelines, banks may use their premises to market and sell the financial
products of their related parties under a banking group or a financial conglomerate. This
initiative makes available to consumers a broader array of financial products using the
existing branch network of the banking system. Banks may now cross-sell credit cards and
auto, home mortgage, personal and other retail loans; term, life, non-life and other
protection-type insurance products; cash, debit and related products; and other similar
financial instruments that may be authorized by the MB. The new framework also allows all
types of banks to perform cross-selling.
Strengthening prudential regulation
The PSE approved its proposed rules for financially distressed companies and for those
undergoing corporate rehabilitation. Both rules are expected to provide additional
safeguards to minority stockholders of companies experiencing financial problems and
those undergoing corporate rehabilitation. For companies experiencing financial distress,
listed issuers shall be required to immediately disclose the following: (a) cessation of
business operations for at least six months for any reason; (b) reporting of negative
stockholders' equity; (c) delay in payment of loans amounting to at least ten percent of its
total assets; and (d) adverse or qualified auditor's opinion on the financial statements of
39 Cross-selling is an international practice that separates the production of a financial product or service from its distribution.

Bangko Sentral ng Pilipinas | 86
Report on Economic and Financial Developments Second Quarter 2013
the company for three consecutive years. For companies under corporate rehabilitation,
the PSE proposed to impose a trading suspension on the shares of the company five
trading days after the filing of the disclosure on corporate rehabilitation, as opposed to
the existing PSE rehabilitation guidelines which call for the immediate imposition of a
trading suspension on the shares of a company upon receipt of the company’s relevant
disclosure.
Helping develop the necessary market infrastructure
The PSE partnered with the Korea Exchange (KRX) for the local bourse' new disclosure
engine called the PSE Electronic Disclosure Generation Technology or PSE EDGE. This shall
be used by listed companies to disseminate their required disclosures, making use of
electronic templates that can be easily integrated real-time, upon release to the public, in
various systems such as the PSE website and trading terminals, and the systems of data
vendors and analysts.
A possible merger between the PSE and the Fixed Income Exchange (FIE) was explored. The
PSE signed a memorandum of Agreement with the BAP and with the Singapore Exchange
to work towards the consolidation of the PSE and the Philippine Dealing System Holding
Corporation (PDS). The MOA provides the framework for initial discussions and developing
a plan that may be pursued by the different parties involved to consolidate the operations
of the PSE and the PDS. In most markets, trading of both the fixed income and equity
securities are operated by one group or entity.

1 GROSS NATIONAL INCOME AND GROSS DOMESTIC PRODUCT BY INDUSTRIAL ORIGIN
for periods indicated
in million pesos, at constant 2000 prices
Q1 Q2 Q3 Q4 Q1 Q2 Q3 Q4 Q1 Q2 Q3 Q4 Q1 Q2 Q1 Q2 Q3 Q4 Q1 Q2 Q3 Q4 Q1 Q2 Q3 Q4 Q1 Q2
Agriculture, Hunting, Forestry and Fishing 163,629 148,896 149,181 200,959 170,615 160,915 152,195 196,110 172,560 161,887 158,826 205,664 177,845 161,345 -1.8 -2.0 -2.0 4.1 4.3 8.1 2.0 -2.4 1.1 0.6 4.4 4.9 3.1 -0.3
Industry 425,567 489,793 447,055 497,101 454,771 481,033 446,150 511,302 478,924 508,847 477,887 556,965 530,984 561,244 15.4 15.7 9.8 6.5 6.9 -1.8 -0.2 2.9 5.3 5.8 7.1 8.9 10.9 10.3
Mining and Quarrying 13,903 23,580 13,448 14,968 18,380 25,606 13,993 12,530 18,074 27,258 13,829 12,885 17,724 26,515 2.4 24.4 6.8 6.9 32.2 8.6 4.1 -16.3 -1.7 6.5 -1.2 2.8 -1.9 -2.7
Manufacturing 298,652 306,874 299,709 359,288 322,771 324,637 305,692 371,230 342,235 338,489 323,524 391,463 374,755 373,337 18.3 13.2 8.4 6.5 8.1 5.8 2.0 3.3 6.0 4.3 5.8 5.5 9.5 10.3
Construction 65,566 106,296 78,972 74,986 66,471 78,501 70,616 78,283 67,467 87,624 83,158 101,671 87,216 102,855 9.7 24.7 15.6 4.6 1.4 -26.1 -10.6 4.4 1.5 11.6 17.8 29.9 29.3 17.4
Electricity, Gas and Water Supply 47,445 53,043 54,926 47,859 47,148 52,289 55,850 49,260 51,148 55,475 57,375 50,946 51,289 58,536 9.8 10.2 10.1 9.4 -0.6 -1.4 1.7 2.9 8.5 6.1 2.7 3.4 0.3 5.5
Services 743,844 814,702 783,995 836,818 768,594 857,966 823,874 885,474 833,337 923,948 889,910 942,916 890,410 992,279 7.2 7.3 7.8 6.4 3.3 5.3 5.1 5.8 8.4 7.7 8.0 6.5 6.8 7.4
Transportation, Storage and
Communication 106,538 112,714 94,479 114,035 111,052 117,449 98,831 118,694 121,777 128,328 108,129 123,860 125,202 132,783 -2.2 2.2 3.0 1.4 4.2 4.2 4.6 4.1 9.7 9.3 9.4 4.4 2.8 3.5
Trade and Repair of Motor Vehicles,
Motorcycles, Personal & Household Goods 206,308 226,459 244,719 271,256 212,164 232,115 255,680 280,555 228,701 250,135 276,518 299,037 241,306 268,409 11.6 6.8 11.0 5.0 2.8 2.5 4.5 3.4 7.8 7.8 8.2 6.6 5.5 7.3
Financial Intermediation 87,058 97,838 92,692 97,127 92,597 109,185 94,012 98,575 100,641 116,821 102,054 107,271 118,743 128,026 8.3 5.8 13.1 13.6 6.4 11.6 1.4 1.5 8.7 7.0 8.6 8.8 18.0 9.6
R. Estate, Renting and Business Activities 139,097 153,607 150,320 145,922 146,521 165,120 162,086 164,518 157,962 178,418 174,796 175,254 167,102 195,434 5.2 8.6 6.6 9.4 5.3 7.5 7.8 12.7 7.8 8.1 7.8 6.5 5.8 9.5
Public Administration & Defense;
Compulsory Social Security 62,788 71,919 63,427 56,953 58,970 75,012 66,105 59,875 61,601 77,831 71,620 64,782 66,701 82,427 7.5 9.6 6.5 -0.8 -6.1 4.3 4.2 5.1 4.5 3.8 8.3 8.2 8.3 5.9
Other Services 142,055 152,165 138,357 151,524 147,289 159,085 147,161 163,256 162,654 172,415 156,792 172,711 171,356 185,201 9.8 10.9 4.4 8.7 3.7 4.5 6.4 7.7 10.4 8.4 6.5 5.8 5.3 7.4
Gross Domestic Product 1,333,040 1,453,390 1,380,231 1,534,877 1,393,979 1,499,915 1,422,219 1,592,887 1,484,821 1,594,682 1,526,622 1,705,545 1,599,239 1,714,868 8.4 8.9 7.3 6.1 4.6 3.2 3.0 3.8 6.5 6.3 7.3 7.1 7.7 7.5
Net Primary Income 291,467 293,900 276,855 287,377 283,592 280,797 267,291 299,268 289,052 302,187 286,249 307,387 312,839 310,317 -26.0 -31.8 -34.7 -35.1 -2.7 -4.5 -3.5 4.1 1.9 7.6 7.1 2.7 8.2 2.7
Gross National Income 1,624,507 1,747,290 1,657,086 1,822,254 1,677,571 1,780,711 1,689,510 1,892,155 1,773,874 1,896,869 1,812,871 2,012,932 1,912,077 2,025,185 0.1 -1.0 -3.1 -3.5 3.3 1.9 2.0 3.8 5.7 6.5 7.3 6.4 7.8 6.8
Total may not add up due to rounding.
Source : National Statistical Coordination Board
2012 2013
Note: Data on Real GDP and its components are based on 2000 prices. The use of terminology Gross National Income (GNI) in place of Gross National Product (GNP) has been adopted in the revised/rebased Philippine System of National Accounts (PSNA) in accordance with the 1993/1998 System of National Accounts prescribed by the United Nations.
Annual Change (%)
2010 2011 2012 2013 2010 2011

1a GROSS NATIONAL INCOME AND GROSS DOMESTIC PRODUCT BY EXPENDITURE SHARES
for periods indicated
in million pesos, at constant 2000 prices
Q1 Q2 Q3 Q4 Q1 Q2 Q3 Q4 Q1 Q2 Q3 Q4 Q1 Q2 Q1 Q2 Q3 Q4 Q1 Q2 Q3 Q4 Q1 Q2
Household Final Consumption Expenditure 923,065 977,453 922,575 1,122,734 969,538 1,025,090 985,430 1,188,852 1,035,983 1,092,699 1,051,037 1,262,804 1,092,750 1,149,454 5.0 4.9 6.8 5.9 6.9 6.6 6.7 6.2 5.5 5.2
Government Final Consumption Expenditure 157,087 167,182 128,518 117,421 133,653 179,168 141,539 127,739 162,111 192,079 159,013 139,865 183,505 224,750 -14.9 7.2 10.1 8.8 21.3 7.2 12.3 9.5 13.2 17.0
Capital Formation 245,325 291,433 240,350 406,541 315,939 254,757 281,487 354,579 216,940 263,980 299,035 388,432 313,499 298,738 28.8 -12.6 17.1 -12.8 -31.3 3.6 6.2 9.5 44.5 13.2
Fixed Capital 284,446 303,951 279,393 314,417 306,025 272,377 277,674 302,925 314,530 296,065 306,934 362,512 363,683 324,741 7.6 -10.4 -0.6 -3.7 2.8 8.7 10.5 19.7 15.6 9.7
Construction 99,946 151,801 119,330 119,583 105,472 116,398 107,135 120,380 104,200 128,268 127,749 156,967 135,540 148,295 5.5 -23.3 -10.2 0.7 -1.2 10.2 19.2 30.4 30.1 15.6
Durable Equipment 152,793 124,821 133,371 156,848 167,635 128,005 143,180 144,405 175,124 138,699 151,520 164,741 191,943 146,639 9.7 2.6 7.4 -7.9 4.5 8.4 5.8 14.1 9.6 5.7
Breeding Stock & Orchard Dev't 26,552 22,386 18,718 31,272 26,808 22,576 18,655 30,639 27,157 23,146 18,821 30,946 27,315 22,888 1.0 0.8 -0.3 -2.0 1.3 2.5 0.9 1.0 0.6 -1.1
Intellectual Property Products 5,154 4,942 7,974 6,714 6,110 5,397 8,703 7,501 8,049 5,952 8,844 9,859 8,885 6,920 18.5 9.2 9.1 11.7 31.7 10.3 1.6 31.4 10.4 16.2
Changes in Inventories -39,121 -12,517 -39,042 92,124 9,914 -17,619 3,814 51,653 -97,591 -32,086 -7,899 25,919 -50,185 -26,002 125.3 -40.8 109.8 -43.9 -1,084.4 -82.1 -307.1 -49.8 48.6 19.0
Exports 665,317 780,446 835,162 605,208 700,348 778,938 744,719 581,411 768,687 863,274 790,719 631,391 710,211 807,402 5.3 -0.2 -10.8 -3.9 9.8 10.8 6.2 8.6 -7.6 -6.5
Less: Imports 652,376 758,904 740,657 732,342 715,160 744,283 719,921 674,823 701,245 806,318 770,330 728,483 715,220 782,429 9.6 -1.9 -2.8 -7.9 -1.9 8.3 7.0 8.0 2.0 -3.0
Statistical Discrepancy -5,377 -4,221 -5,717 15,316 -10,339 6,244 -11,035 15,130 2,346 -11,030 -2,851 11,536 14,495 16,953
Gross Domestic Product 1,333,040 1,453,390 1,380,231 1,534,877 1,393,979 1,499,915 1,422,219 1,592,887 1,484,821 1,594,682 1,526,622 1,705,545 1,599,239 1,714,868 4.6 3.2 3.0 3.8 6.5 6.3 7.3 7.1 7.7 7.5
Net Primary Income 291,467 293,900 276,855 287,377 283,592 280,797 267,291 299,268 289,052 302,187 286,249 307,387 312,839 310,317 -2.7 -4.5 -3.5 4.1 1.9 7.6 7.1 2.7 8.2 2.7
Gross National Income 1,624,507 1,747,290 1,657,086 1,822,254 1,677,571 1,780,711 1,689,510 1,892,155 1,773,874 1,896,869 1,812,871 2,012,932 1,912,077 2,025,185 3.3 1.9 2.0 3.8 5.7 6.5 7.3 6.4 7.8 6.8
Note: Data on Real GDP and its components are based on 2000 prices. The use of terminology Gross National Income (GNI) in place of Gross National Product (GNP) has been adopted in the revised/rebased Philippine System of National Accounts (PSNA) in accordance with the 1993/1998 System of National Accounts prescribed by the United Nations.
Total may not add up due to rounding.
Source: National Statistical Coordination Board
Annual Change (%)
2010 2011 2012 2013 2011 2012 2013

2 SELECTED LABOR, EMPLOYMENT AND WAGE INDICATORS
Q1 Q2 Q3 Q4 Q1 Q2 Q3 Q4 Q1 Q2 Q3 Q4 Q1 Q2
Employment Status 1
Labor Force (in thousands) 38,828 38,512 38,946 39,287 39,210 39,691 39,928 41,194 40,226 40,643 40,427 40,431 40,834 40,905
Employed 36,001 35,413 36,237 36,488 36,293 36,820 37,106 38,550 37,334 37,840 37,584 37,668 37,940 37,819
Unemployed 2,827 3,099 2,709 2,799 2,917 2,871 2,822 2,644 2,892 2,803 2,842 2,763 2,894 3,086
Underemployed 7,107 6,297 6,502 7,141 7,050 7,127 7,095 7,381 7,018 7,312 8,546 7,158 7,934 7,252
Labor Force Participation Rate (%) 64.5 63.6 63.9 64.2 63.7 64.2 64.3 66.3 64.2 64.7 64.0 63.9 64.1 63.9
Employment Rate (%) 92.7 92.0 93.0 92.9 92.6 92.8 92.9 93.6 92.8 93.1 93.0 93.2 92.9 92.5
Unemployment Rate (%) 7.3 8.0 7.0 7.1 7.4 7.2 7.1 6.4 7.2 6.9 7.0 6.8 7.1 7.5
Underemployment Rate (%) 19.7 17.8 17.9 19.6 19.4 19.4 19.1 19.1 18.8 19.3 22.7 19.0 20.9 19.2
Overseas Employment (Deployed) 388,495 385,072 399,061 298,198 419,503 460,457 431,493 376,378 466,927p
455,733p
416,029p
332,471p .. ..
Land-based 301,417 303,686 306,042 212,531 323,700 378,491 335,792 280,744 360,456 369,274 329,380 269,867 .. ..
Sea-based 87,078 81,386 93,019 85,667 95,803 81,966 95,701 95,634 106,471 86,459 86,649 62,604 .. ..
Strikes
Number of New Strikes 1 3 1 3 1 1 1 2 .. ..
Number of Workers Involved 1,800 387 47 800 128 - 3,700 - - - 20 189 .. ..
Nominal Daily Wage Rates (in pesos)
National Capital Region
Agricultural
Plantation 345.00 345.00 367.00 367.00 367.00 389.00 389.00 389.00 389.00 409.00 409.00 419.00 419.00 419.00
Non-Plantation 345.00 345.00 367.00 367.00 367.00 389.00 389.00 389.00 389.00 409.00 409.00 419.00 419.00 419.00
Non-Agricultural 382.00 382.00 404.00 404.00 404.00 426.00 426.00 426.00 426.00 446.00 446.00 456.00 456.00 456.00
Real Daily Wage Rates (in pesos), 2006=100
National Capital Region
Agricultural
Plantation 298.96 297.67 315.56 309.97 306.09 320.43 320.96 318.85 316.00 329.57 325.90 334.13 333.86 332.01
Non-Plantation 298.96 297.67 315.56 309.97 306.09 320.43 320.96 318.85 316.00 329.57 325.90 334.13 333.86 332.01
Non-Agricultural 331.02 329.59 347.38 341.22 336.95 350.91 351.49 349.18 346.06 359.39 355.38 363.64 363.35 361.33
Notes:1 Starting with January 2007 LFS round, the population projections based on the 2000 Census of Population was adopted to generate the labor force statistics per NSCB Resolution No. 1 Series of 2005
¨ Data not availablep
preliminary
Numbers may not add up due to rounding.
2013p
Sources of data: Bureau of Labor and Employment Statistics (BLES), Philippine Overseas Employment Administration (POEA), National Statistics Office (NSO), National Wages and Productivity Commission (NWPC), and National Conciliation and Mediation Board (NCMB)
2010 2011 2012p

3 CASH OPERATIONS OF THE NATIONAL GOVERNMENT
for periods indicated
in billion pesos
2013
Q1 Q2 Q3 Q4 Q1 Q2 Q3 Q4 Q1 Q2 Q2
Program
Jan Apr Jul Oct Jan Apr Jul Oct Jan Apr Jun-13
Revenues 323.1 358.6 335.4 342.9 361.0 399.9 358.0 416.0 364.3 475.1 482.2
Tax 265.7 327.8 297.9 310.7 302.3 369.7 324.9 364.3 316.7 429.6 491.6
Non-tax 57.4 30.8 37.5 32.1 58.7 30.3 33.2 51.7 47.6 45.6 -9.4
Expenditures 349.3 349.6 371.2 487.6 394.9 400.4 427.6 554.9 430.8 460.0 493.0
Interest Payments 90.7 43.8 87.9 56.6 98.5 51.5 95.2 67.6 98.3 58.8 55.0
Equity — 0.1 0.2 12.6 0.0 0.9 0.0 20.4 0.2 0.1 0.0
Net Lending 2.4 9.9 2.8 2.9 3.2 8.5 10.4 5.4 -8.1 4.7 6.2
Subsidy 7.1 7.1 4.9 34.6 5.6 7.1 5.7 24.2 4.2 6.9 12.1
Allotment to LGUs 76.4 78.8 74.9 85.0 71.0 78.4 74.1 74.9 80.3 82.8 60.5
Tax Expenditures 8.1 2.9 2.3 12.6 7.3 7.6 3.4 14.1 0.6 11.2 7.7
Others 164.6 207.0 198.1 283.4 209.3 246.4 238.7 348.3 255.2 295.5 351.6
Surplus/Deficit (-) -26.2 9.0 -35.8 -144.8 -33.9 -0.5 -69.6 -138.9 -66.5 15.2 -10.8
Financing 1
-64.0 87.3 -13.6 105.5 162.5 12.2 91.2 272.3 -0.8 88.6 148.526.2 -9.0 35.8 144.8 33.9 0.5 69.6 138.9 66.5 -15.2 10.8
External Borrowings 54.4 -5.8 11.8 -9.2 66.8 -5.7 -10.4 19.3 -49.3 -15.2 3.5
Domestic Borrowings -118.4 93.1 -25.3 114.7 95.7 17.9 101.6 253.0 48.5 103.8 145.0
Total Change in Cash: Deposit/Withdrawal (-) 77.6 241.6 -307.3 -91.6 164.7 -23.9 -45.5 196.5 -182.2 85.9 141.3
Budgetary -90.2 96.3 -49.3 -39.2 128.6 11.7 21.7 133.4 -67.3 103.8 137.7
Non-Budgetary Accounts 2
167.8 145.3 -257.9 -52.3 36.1 -35.6 -67.1 63.1 -114.9 -17.9 3.6
1 Availment less repayment
2 Refers to accounts not included in the NG budget, e.g., sale, purchase or redemption of government securities, but included in the cash operations report to
show the complete relations in the movements of the cash accounts.
Note: Details may not add up to total due to rounding off
Source: Bureau of the Treasury
201320122011

4 CONSUMER PRICE INDEX IN THE PHILIPPINES (2000=100)
for periods indicated
(2006=100)
Quarterly Average
Q1 Q2 Q3 Q4 Q1 Q2 Q3 Q4 Q1 Q2 Q3 Q4 Q1 Q2
ALL ITEMS 119.0 120.0 120.9 121.9 124.3 126.0 126.7 127.6 128.2 129.7 131.1 131.3 132.3 133.1
FOOD AND NON-ALCHOLIC BEVERAGES 128.0 128.3 129.8 131.7 135.2 136.2 136.7 138.1 137.9 138.8 140.9 141.3 141.6 142.0
FOOD ITEMS 128.9 129.2 130.8 132.8 136.5 137.4 137.9 139.4 139.1 139.9 142.1 142.6 142.8 143.1
ALCOHOLIC BEVERAGES, TOBACCO AND NARCOTICS 115.6 116.1 116.6 117.3 120.0 122.3 123.7 124.6 125.8 128.4 129.7 130.8 158.4 168.5
NON-FOOD 113.2 114.7 115.2 115.5 117.3 119.3 120.3 120.8 121.9 123.7 124.8 124.8 125.3 126.0
CLOTHING AND FOOTWEAR 112.9 113.6 114.7 115.4 116.5 117.8 119.3 119.9 120.9 123.7 125.3 125.9 126.8 128.2
HOUSING, WATER, ELECTRICITY, GAS AND OTHER FUELS 112.3 115.0 115.2 115.3 117.7 120.6 121.1 121.7 123.4 125.9 127.2 126.5 126.9 127.7
FURNISHINGS, HOUSEHOLD EQUIPMENT
AND ROUTING MAINTENANCE OF THE HOUSE 112.9 113.9 114.3 114.8 115.6 116.6 117.3 117.6 118.2 120.6 122.4 123.2 124.0 125.0
HEALTH 119.1 119.7 121.0 121.7 122.8 123.8 125.0 125.5 126.2 127.8 128.9 129.4 130.3 131.5
TRANSPORT 115.2 115.9 116.0 116.7 120.0 123.5 124.0 124.1 125.2 126.3 125.5 125.9 126.3 126.1
COMMUNICATION 92.6 92.6 92.7 92.6 92.5 92.4 92.4 92.2 92.2 92.5 92.6 92.6 92.7 92.6
RECREATION AND CULTURE 104.7 105.1 105.5 105.6 105.8 106.5 107.2 107.4 108.3 109.3 110.1 110.2 110.7 111.6
EDUCATION 121.6 123.1 126.3 126.7 126.8 128.7 132.7 132.8 132.9 134.8 138.7 138.7 138.7 140.8
RESTAURANTS AND MISCELLANEOUS GOODS AND SERVICES 115.1 115.8 116.3 116.7 117.9 119.0 119.9 120.4 121.5 123.0 123.8 124.2 125.0 125.9
Q1 Q2 Q3 Q4 Q1 Q2 Q3 Q4 Q1 Q2 Q3 Q4 Q1 Q2
ALL ITEMS 1.1 0.9 0.7 0.8 2.0 1.3 0.6 0.7 0.5 1.1 1.1 0.2 0.7 0.6
FOOD AND NON-ALCHOLIC BEVERAGES 0.8 0.3 1.2 1.5 2.7 0.7 0.3 1.0 -0.1 0.6 1.5 0.3 0.2 0.3
FOOD ITEMS 0.9 0.3 1.2 1.6 2.7 0.7 0.4 1.1 -0.2 0.6 1.5 0.3 0.2 0.2
ALCOHOLIC BEVERAGES, TOBACCO AND NARCOTICS 1.1 0.5 0.4 0.6 2.3 1.9 1.1 0.7 1.0 2.1 1.0 0.8 21.2 6.4
NON-FOOD 1.3 1.4 0.4 0.2 1.6 1.7 0.8 0.4 0.9 1.5 0.8 0.1 0.3 0.6
CLOTHING AND FOOTWEAR 0.9 0.6 0.9 0.6 1.0 1.1 1.2 0.5 0.8 2.3 1.3 0.4 0.7 1.1
HOUSING, WATER, ELECTRICITY, GAS AND OTHER FUELS 2.1 2.5 0.1 0.1 2.1 2.4 0.4 0.5 1.4 2.0 1.0 -0.6 0.3 0.7
FURNISHINGS, HOUSEHOLD EQUIPMENT
AND ROUTING MAINTENANCE OF THE HOUSE 0.9 0.8 0.4 0.4 0.7 0.9 0.6 0.3 0.5 2.0 1.5 0.7 0.6 0.8
HEALTH 1.6 0.5 1.1 0.6 0.9 0.8 1.0 0.4 0.5 1.3 0.8 0.4 0.7 0.9
TRANSPORT 1.2 0.6 0.1 0.6 2.9 2.9 0.4 0.1 0.9 0.9 -0.6 0.3 0.3 -0.2
COMMUNICATION -1.2 0.1 0.1 -0.1 -0.1 -0.1 0.0 -0.1 -0.1 0.3 0.1 0.0 0.1 -0.1
RECREATION AND CULTURE -0.3 0.4 0.3 0.1 0.2 0.7 0.6 0.2 0.9 0.9 0.7 0.1 0.5 0.8
EDUCATION 0.5 1.2 2.6 0.3 0.1 1.5 3.1 0.1 0.1 1.5 2.9 0.0 0.0 1.5
RESTAURANTS AND MISCELLANEOUS GOODS AND SERVICES 0.9 0.6 0.4 0.3 1.0 1.0 0.7 0.4 1.0 1.2 0.7 0.3 0.6 0.7
Q1 Q2 Q3 Q4 Q1 Q2 Q3 Q4 Q1 Q2 Q3 Q4 Q1 Q2
ALL ITEMS 3.9 3.8 3.9 3.5 4.5 4.9 4.8 4.7 3.1 2.9 3.5 2.9 3.2 2.6
FOOD AND NON-ALCHOLIC BEVERAGES 4.4 3.5 4.2 3.8 5.7 6.2 5.3 4.8 2.0 1.9 3.1 2.3 2.7 2.3
FOOD ITEMS 4.5 3.6 4.4 4.0 5.9 6.3 5.4 4.9 1.9 1.8 3.0 2.2 2.7 2.3
ALCOHOLIC BEVERAGES, TOBACCO AND NARCOTICS 3.6 3.0 2.7 2.6 3.8 5.3 6.1 6.2 4.8 5.0 4.9 5.0 25.9 26.9
NON-FOOD 3.6 4.1 3.8 3.3 3.7 4.0 4.4 4.6 3.9 3.7 3.7 3.3 2.8 2.0
CLOTHING AND FOOTWEAR 2.3 2.4 2.8 3.1 3.2 3.7 4.0 3.9 3.7 5.0 5.1 5.0 4.9 3.6
HOUSING, WATER, ELECTRICITY, GAS AND OTHER FUELS 4.2 5.9 5.6 4.8 4.9 4.8 5.2 5.6 4.8 4.4 5.0 3.9 2.8 1.4
FURNISHINGS, HOUSEHOLD EQUIPMENT
AND ROUTING MAINTENANCE OF THE HOUSE 2.4 2.6 2.6 2.5 2.4 2.4 2.6 2.5 2.3 3.4 4.4 4.8 4.9 3.6
HEALTH 3.9 3.8 3.7 3.7 3.0 3.4 3.3 3.2 2.8 3.3 3.1 3.1 3.3 2.8
TRANSPORT 5.7 4.4 2.4 2.5 4.2 6.6 6.9 6.4 4.3 2.2 1.2 1.5 0.9 -0.2
COMMUNICATION -1.0 -1.0 -1.0 -1.1 -0.1 -0.3 -0.4 -0.4 -0.4 0.1 0.3 0.4 0.6 0.2
RECREATION AND CULTURE 0.7 0.6 0.6 0.5 1.1 1.3 1.6 1.7 2.4 2.6 2.7 2.6 2.2 2.1
EDUCATION 4.2 4.3 4.5 4.7 4.3 4.6 5.1 4.8 4.8 4.8 4.5 4.4 4.4 4.4
RESTAURANTS AND MISCELLANEOUS GOODS AND SERVICES 2.7 2.7 2.6 2.3 2.4 2.7 3.1 3.2 3.1 3.3 3.3 3.2 2.8 2.4
Source of basic data: National Statistics Office
2 0 1 2 2013
2 0 1 2
2 0 1 0
2 0 1 0 2 0 1 1
2 0 1 1
2 0 1 1
Year-on-Year Change (in percent)
2 0 1 2
Quarter-on-Quarter Change (in percent)
2013
20132 0 1 0

4a CONSUMER PRICE INDEX IN METRO MANILA (2000=100)
for periods indicated
(2006=100)
Quarterly Average
Q1 Q2 Q3 Q4 Q1 Q2 Q3 Q4 Q1 Q2 Q3 Q4 Q1 Q2
ALL ITEMS 114.8 116.0 116.7 117.6 119.5 120.9 121.2 122.1 122.9 123.7 125.6 125.4 125.7 125.8
FOOD AND NON-ALCHOLIC BEVERAGES 124.1 123.4 124.9 128.6 130.3 130.6 130.5 132.9 131.6 132.0 135.3 135.2 134.9 134.7
FOOD ITEMS 124.9 124.2 125.7 129.7 131.5 131.7 131.6 134.2 132.7 133.0 136.5 136.3 135.9 135.7
ALCOHOLIC BEVERAGES, TOBACCO AND NARCOTICS 115.0 115.5 115.8 116.3 117.6 118.9 119.1 119.5 120.4 122.5 124.2 126.5 140.3 144.7
NON-FOOD 110.9 113.0 113.3 113.1 115.2 117.0 117.4 117.7 119.4 120.3 121.7 121.4 121.7 121.8
CLOTHING AND FOOTWEAR 114.7 115.5 117.3 117.9 118.7 118.9 121.2 121.3 123.1 126.6 129.8 130.4 131.1 132.3
HOUSING, WATER, ELECTRICITY, GAS AND OTHER FUELS 111.2 115.4 114.9 114.0 116.6 119.2 119.3 120.0 121.8 122.9 124.5 123.4 123.5 123.5
FURNISHINGS, HOUSEHOLD EQUIPMENT
AND ROUTING MAINTENANCE OF THE HOUSE 109.7 111.0 111.4 111.8 112.1 112.2 112.3 112.4 112.7 114.1 117.7 119.2 120.5 120.8
HEALTH 121.7 122.0 124.7 125.0 126.7 127.0 128.8 129.0 130.0 130.8 132.4 132.6 134.5 134.7
TRANSPORT 106.4 106.9 106.3 107.2 110.8 114.3 114.0 113.7 114.9 114.4 113.8 114.3 114.2 113.5
COMMUNICATION 93.7 93.7 93.9 93.8 93.6 93.4 93.3 93.2 93.1 93.7 93.9 93.9 93.9 93.9
RECREATION AND CULTURE 105.8 106.7 107.2 107.4 107.5 107.4 107.3 107.3 110.2 111.1 112.5 112.5 113.1 114.1
EDUCATION 125.9 127.5 130.6 130.6 130.6 132.2 135.5 135.5 135.5 137.0 140.0 140.0 140.0 142.1
RESTAURANTS AND MISCELLANEOUS GOODS AND SERVICES 111.7 111.8 112.9 113.0 114.8 115.9 116.3 116.5 119.5 119.9 120.7 120.7 120.9 121.1
Q1 Q2 Q3 Q4 Q1 Q2 Q3 Q4 Q1 Q2 Q3 Q4 Q1 Q2
ALL ITEMS 1.0 1.1 0.5 0.8 1.6 1.1 0.2 0.7 0.7 0.7 1.5 -0.1 0.2 0.1
FOOD AND NON-ALCHOLIC BEVERAGES -0.7 -0.6 1.2 3.0 1.3 0.2 -0.1 1.8 -1.0 0.4 2.5 -0.1 -0.3 -0.1
FOOD ITEMS -0.8 -0.6 1.2 3.2 1.4 0.2 -0.1 1.9 -1.1 0.3 2.6 -0.1 -0.3 -0.2
ALCOHOLIC BEVERAGES, TOBACCO AND NARCOTICS 0.9 0.4 0.3 0.5 1.1 1.1 0.2 0.3 0.8 1.7 1.4 1.8 10.9 3.1
NON-FOOD 1.8 1.9 0.2 -0.2 1.8 1.6 0.4 0.3 1.4 0.8 1.1 -0.2 0.2 0.1
CLOTHING AND FOOTWEAR 1.2 0.7 1.6 0.5 0.7 0.2 1.9 0.1 1.4 2.9 2.5 0.4 0.6 0.9
HOUSING, WATER, ELECTRICITY, GAS AND OTHER FUELS 3.6 3.8 -0.5 -0.8 2.3 2.2 0.1 0.6 1.5 0.9 1.3 -0.9 0.1 0.0
FURNISHINGS, HOUSEHOLD EQUIPMENT
AND ROUTING MAINTENANCE OF THE HOUSE 0.4 1.2 0.4 0.3 0.3 0.1 0.1 0.1 0.2 1.2 3.2 1.2 1.1 0.2
HEALTH 1.5 0.2 2.3 0.2 1.4 0.3 1.4 0.2 0.7 0.6 1.2 0.2 1.4 0.1
TRANSPORT 2.0 0.4 -0.6 0.8 3.4 3.1 -0.2 -0.3 1.0 -0.5 -0.5 0.5 -0.1 -0.6
COMMUNICATION -1.3 0.0 0.2 -0.2 -0.2 -0.1 -0.2 -0.1 0.0 0.6 0.2 0.0 0.0 0.0
RECREATION AND CULTURE -0.6 0.8 0.5 0.1 0.1 -0.1 -0.1 0.0 2.7 0.8 1.3 0.1 0.5 0.9
EDUCATION 0.1 1.2 2.5 0.0 0.0 1.3 2.5 0.0 0.0 1.1 2.2 0.0 0.0 1.5
RESTAURANTS AND MISCELLANEOUS GOODS AND SERVICES 0.1 0.1 1.0 0.1 1.6 1.0 0.3 0.2 2.6 0.4 0.6 0.0 0.1 0.2
Q1 Q2 Q3 Q4 Q1 Q2 Q3 Q4 Q1 Q2 Q3 Q4 Q1 Q2
ALL ITEMS 3.6 3.7 3.9 3.5 4.1 4.2 3.9 3.8 2.8 2.4 3.7 2.8 2.2 1.7
FOOD AND NON-ALCHOLIC BEVERAGES 3.6 2.2 2.8 2.8 5.0 5.8 4.5 3.3 1.0 1.1 3.7 1.8 2.5 2.0
FOOD ITEMS 3.8 2.3 2.9 2.9 5.3 6.1 4.7 3.4 0.9 1.0 3.7 1.6 2.5 2.0
ALCOHOLIC BEVERAGES, TOBACCO AND NARCOTICS 3.0 2.4 2.0 2.1 2.3 2.9 2.9 2.7 2.4 3.1 4.3 5.9 16.5 18.1
NON-FOOD 3.5 4.4 4.4 3.8 3.8 3.5 3.6 4.1 3.7 2.9 3.7 3.1 1.9 1.2
CLOTHING AND FOOTWEAR 2.6 3.0 3.7 4.0 3.5 3.0 3.4 2.9 3.7 6.5 7.1 7.4 6.6 4.5
HOUSING, WATER, ELECTRICITY, GAS AND OTHER FUELS 4.9 7.8 7.8 6.2 4.9 3.2 3.9 5.3 4.4 3.1 4.4 2.8 1.4 0.5
FURNISHINGS, HOUSEHOLD EQUIPMENT
AND ROUTING MAINTENANCE OF THE HOUSE 1.5 1.8 2.1 2.3 2.2 1.1 0.8 0.6 0.5 1.6 4.8 6.0 7.0 5.9
HEALTH 4.2 3.9 4.1 4.2 4.1 4.2 3.2 3.2 2.6 2.9 2.8 2.8 3.5 3.0
TRANSPORT 7.4 5.7 2.7 2.7 4.1 6.9 7.3 6.1 3.7 0.1 -0.2 0.5 -0.6 -0.8
COMMUNICATION -1.5 -1.5 -1.2 -1.2 -0.1 -0.3 -0.7 -0.6 -0.5 0.3 0.7 0.8 0.8 0.2
RECREATION AND CULTURE 0.7 0.3 0.8 0.9 1.6 0.7 0.1 -0.1 2.5 3.4 4.8 4.9 2.6 2.7
EDUCATION 2.3 2.9 4.1 3.8 3.7 3.7 3.8 3.8 3.8 3.6 3.3 3.3 3.3 3.7
RESTAURANTS AND MISCELLANEOUS GOODS AND SERVICES 1.4 0.5 1.3 1.3 2.8 3.7 3.0 3.1 4.1 3.5 3.8 3.6 1.1 0.9
Source of basic data: National Statistics Office
2013
2013
20132 0 1 0
2 0 1 1
2 0 1 2
2 0 1 2
2 0 1 2
2 0 1 1
Quarter-on-Quarter Change (in percent)
Year-on-Year Change (in percent)
2 0 1 0
2 0 1 0 2 0 1 1

4b CONSUMER PRICE INDEX IN AREAS OUTSIDE METRO MANILA(2000=100)
for periods indicated
(2006=100)
Quarterly Average
Q1 Q2 Q3 Q4 Q1 Q2 Q3 Q4 Q1 Q2 Q3 Q4 Q1 Q2
ALL ITEMS 120.3 121.3 122.3 123.2 125.8 127.6 128.4 129.3 129.8 131.6 132.9 133.2 134.4 135.4
FOOD AND NON-ALCHOLIC BEVERAGES 128.8 129.4 130.9 132.4 136.3 137.4 138.0 139.2 139.3 140.2 142.1 142.7 143.1 143.6
FOOD ITEMS 129.7 130.3 131.8 133.5 137.5 138.6 139.2 140.5 140.4 141.4 143.3 143.9 144.2 144.7
ALCOHOLIC BEVERAGES, TOBACCO AND NARCOTICS 115.7 116.2 116.8 117.5 120.4 123.0 124.7 125.6 126.8 129.6 130.8 131.6 162.1 173.3
NON-FOOD 114.0 115.2 115.8 116.4 118.1 120.3 121.5 122.0 122.8 125.1 125.7 126.1 126.7 127.7
CLOTHING AND FOOTWEAR 112.3 113.0 113.8 114.6 115.8 117.4 118.6 119.5 120.2 122.7 123.9 124.4 125.4 126.8
HOUSING, WATER, ELECTRICITY, GAS AND OTHER FUELS 112.8 114.9 115.3 115.9 118.2 121.2 121.9 122.5 124.1 127.3 128.4 127.9 128.4 129.6
FURNISHINGS, HOUSEHOLD EQUIPMENT
AND ROUTING MAINTENANCE OF THE HOUSE 114.0 114.9 115.3 115.9 116.9 118.2 119.0 119.5 120.2 122.9 124.0 124.7 125.3 126.5
HEALTH 118.4 119.1 120.0 120.7 121.7 122.9 124.0 124.6 125.1 127.0 128.0 128.5 129.1 130.6
TRANSPORT 117.9 118.7 119.0 119.6 122.9 126.4 127.1 127.4 128.4 130.0 129.1 129.5 130.0 130.0
COMMUNICATION 92.1 92.2 92.2 92.1 92.0 92.0 92.0 91.8 91.8 91.9 92.0 92.0 92.1 92.0
RECREATION AND CULTURE 104.3 104.6 104.9 104.9 105.2 106.2 107.1 107.4 107.7 108.7 109.2 109.4 109.8 110.8
EDUCATION 120.3 121.8 125.0 125.6 125.7 127.7 131.9 132.0 132.1 134.2 138.3 138.3 138.3 140.4
RESTAURANTS AND MISCELLANEOUS GOODS AND SERVICES 116.6 117.6 117.8 118.2 119.2 120.3 121.4 122.1 122.5 124.3 125.2 125.8 126.8 128.0
Q1 Q2 Q3 Q4 Q1 Q2 Q3 Q4 Q1 Q2 Q3 Q4 Q1 Q2
ALL ITEMS 1.1 0.9 0.8 0.8 2.1 1.4 0.7 0.7 0.4 1.4 1.0 0.3 0.9 0.7
FOOD AND NON-ALCHOLIC BEVERAGES 1.2 0.4 1.2 1.1 2.9 0.8 0.4 0.9 0.0 0.7 1.3 0.4 0.3 0.3
FOOD ITEMS 1.3 0.5 1.2 1.2 3.0 0.8 0.5 1.0 -0.1 0.7 1.3 0.4 0.2 0.3
ALCOHOLIC BEVERAGES, TOBACCO AND NARCOTICS 1.2 0.5 0.5 0.7 2.5 2.1 1.4 0.7 1.0 2.2 0.9 0.6 23.1 7.0
NON-FOOD 1.1 1.1 0.5 0.5 1.5 1.9 1.0 0.4 0.7 1.8 0.5 0.4 0.4 0.8
CLOTHING AND FOOTWEAR 0.7 0.7 0.7 0.7 1.0 1.4 1.1 0.7 0.6 2.1 1.0 0.4 0.8 1.1
HOUSING, WATER, ELECTRICITY, GAS AND OTHER FUELS 1.5 1.8 0.4 0.5 2.0 2.5 0.6 0.5 1.3 2.5 0.9 -0.4 0.4 0.9
FURNISHINGS, HOUSEHOLD EQUIPMENT
AND ROUTING MAINTENANCE OF THE HOUSE 1.0 0.7 0.4 0.5 0.9 1.1 0.7 0.4 0.6 2.2 0.9 0.5 0.5 1.0
HEALTH 1.6 0.6 0.7 0.6 0.8 1.0 0.9 0.5 0.4 1.5 0.7 0.4 0.5 1.1
TRANSPORT 1.0 0.7 0.3 0.5 2.7 2.9 0.5 0.2 0.8 1.2 -0.7 0.3 0.4 0.0
COMMUNICATION -1.1 0.1 0.0 -0.1 -0.1 0.0 0.0 -0.1 -0.1 0.1 0.1 0.0 0.1 -0.1
RECREATION AND CULTURE -0.2 0.3 0.3 0.0 0.3 0.9 0.9 0.3 0.3 0.9 0.5 0.2 0.4 0.8
EDUCATION 0.6 1.3 2.7 0.4 0.1 1.6 3.3 0.1 0.1 1.6 3.1 0.0 0.0 1.5
RESTAURANTS AND MISCELLANEOUS GOODS AND SERVICES 1.2 0.9 0.1 0.4 0.8 0.9 0.9 0.5 0.3 1.5 0.8 0.5 0.8 0.9
Q1 Q2 Q3 Q4 Q1 Q2 Q3 Q4 Q1 Q2 Q3 Q4 Q1 Q2
ALL ITEMS 4.0 3.9 3.9 3.6 4.6 5.2 5.0 5.0 3.2 3.1 3.5 3.0 3.5 2.9
FOOD AND NON-ALCHOLIC BEVERAGES 4.5 3.8 4.5 4.0 5.8 6.2 5.4 5.2 2.2 2.1 3.0 2.5 2.7 2.4
FOOD ITEMS 4.7 3.9 4.6 4.2 6.0 6.4 5.6 5.3 2.2 2.0 2.9 2.4 2.7 2.3
ALCOHOLIC BEVERAGES, TOBACCO AND NARCOTICS 3.7 3.1 2.9 2.8 4.1 5.8 6.8 6.8 5.3 5.4 4.9 4.8 27.8 33.7
NON-FOOD 3.6 3.9 3.4 3.1 3.6 4.4 4.9 4.8 4.0 4.0 3.4 3.4 3.1 2.1
CLOTHING AND FOOTWEAR 2.2 2.3 2.5 2.8 3.1 3.9 4.2 4.2 3.8 4.5 4.4 4.1 4.3 3.4
HOUSING, WATER, ELECTRICITY, GAS AND OTHER FUELS 3.9 5.1 4.6 4.3 4.8 5.5 5.7 5.7 5.0 5.0 5.3 4.4 3.4 1.8
FURNISHINGS, HOUSEHOLD EQUIPMENT
AND ROUTING MAINTENANCE OF THE HOUSE 2.7 2.8 2.8 2.6 2.5 2.9 3.2 3.1 2.9 4.0 4.2 4.4 4.2 2.9
HEALTH 3.9 3.7 3.6 3.6 2.8 3.2 3.3 3.2 2.8 3.4 3.2 3.1 3.2 2.8
TRANSPORT 5.1 4.0 2.4 2.5 4.2 6.5 6.8 6.5 4.5 2.8 1.6 1.7 1.3 0.0
COMMUNICATION -0.7 -0.8 -0.8 -1.1 -0.1 -0.2 -0.3 -0.3 -0.2 -0.1 0.0 0.2 0.4 0.1
RECREATION AND CULTURE 0.8 0.7 0.5 0.4 0.9 1.5 2.1 2.4 2.4 2.3 1.9 1.8 1.9 1.9
EDUCATION 4.8 4.8 4.7 5.0 4.5 4.8 5.5 5.1 5.1 5.1 4.9 4.7 4.7 4.6
RESTAURANTS AND MISCELLANEOUS GOODS AND SERVICES 3.3 3.6 3.0 2.7 2.3 2.3 3.1 3.2 2.7 3.3 3.1 3.0 3.5 3.0
Source of basic data: National Statistics Office
2 0 1 0 2 0 1 1
2 0 1 1
2013
2013
2013
2 0 1 2
2 0 1 2
2 0 1 22 0 1 1
Year-on-Year Change (in percent)
Quarter-on-Quarter Change (in percent)
2 0 1 0
2 0 1 0

5 MONETARY INDICATORS (DCS CONCEPT: SRF-Based) 1
as of periods indicated
in billion pesos
2013
Q1 Q2 Q3 Q4 p
Q1 p
Q2 p
A. Liquidity
1. M4 (2+7) 5,621.1 5,814.4 5,756.7 6,227.7 6,219.9 6,827.4
2. M3 : Broad Money Liabilities (3+6) 4,596.7 4,783.4 4,734.0 5,227.5 5,210.5 5,740.0
3. M2 (4+5) 4,368.2 4,535.6 4,543.6 5,008.2 4,968.2 5,526.7
4. M1: Currency Outside Depository Corporations and Transferable Deposits (Narrow Money ) 1,471.8 1,450.5 1,458.4 1,606.8 1,657.5 1,780.1
Currency Outside Depository Corporations (Currency in Circulation) 476.9 468.0 469.7 558.8 541.7 525.2
Transferable Deposits (Demand Deposits) 994.9 982.5 988.8 1,048.0 1,115.8 1,255.0
5. Other deposits included in broad money 2,896.4 3,085.2 3,085.1 3,401.4 3,310.7 3,746.6
Savings Deposits Savings Deposits 1,940.5 2,005.2 2,046.5 2,186.0 2,235.8 2,462.1
Time Deposits Time Deposits 956.0 1,080.0 1,038.6 1,215.4 1,074.9 1,284.5
6. Securities Other Than Shares Included in Broad Money (Deposit Substitutes) 228.5 247.7 190.4 219.3 242.3 213.3
7. Transferable & Other Deposits in Foreign Currency (FCDU Deposits-Residents) 1,024.5 1,031.0 1,022.7 1,000.1 1,009.3 1,087.4
8. Liabilities Excluded from Broad-Money (Other Liabilities) 2,501.1 2,469.5 2,692.0 2,396.3 2,643.9 2,213.2
B. Domestic Claims 4,878.5 5,083.0 5,135.1 5,375.4 5,612.4 5,647.6
1. Net Claims on Central Government 996.0 989.3 1,030.0 952.9 1,157.4 1,007.3
Claims on Central Government 1,467.8 1,430.2 1,426.0 1,543.3 1,575.4 1,528.6
Less: Liabilities to Central Government 471.8 440.9 396.0 590.4 418.0 521.3
2. Claims on Other Sectors 3,882.4 4,093.7 4,105.1 4,422.5 4,455.0 4,640.3
Claims on Other Financial Corporations 434.9 500.4 489.5 542.1 550.3 559.4
Claims on State and Local Government 71.5 70.3 70.9 71.2 72.1 72.5
Claims on Public Nonfinancial Corporations 277.6 305.2 284.4 280.3 281.6 278.8
Claims on Private Sector 3,098.4 3,217.8 3,260.3 3,528.9 3,551.0 3,729.6
C. Net Foreign Assets 3,243.7 3,201.0 3,313.7 3,248.5 3,251.3 3,393.0
1. Bangko Sentral ng Pilipinas 3,196.9 3,154.1 3,359.5 3,382.3 3,390.0 3,467.8
Claims on Non-residents 3,272.2 3,226.5 3,431.0 3,452.0 3,458.7 3,540.2
Less: Liabilities to Non-residents 75.3 72.5 71.5 69.7 68.7 72.4
2. Other Depository Corporations 46.8 46.9 -45.8 -133.8 -138.7 -74.7
Claims on Non-residents 623.7 634.0 621.1 583.8 571.6 615.3
Less: Liabilities to Non-residents 576.9 587.1 667.0 717.7 710.3 690.0
1Based on the Standardized Report Forms (SRFs), a unified framework for reporting monetary and financial statistics to the International Monetary Fund.
PPreliminary
Note: Details may not add up to totals due to rounding.
Source : Bangko Sentral ng Pilipinas
2012
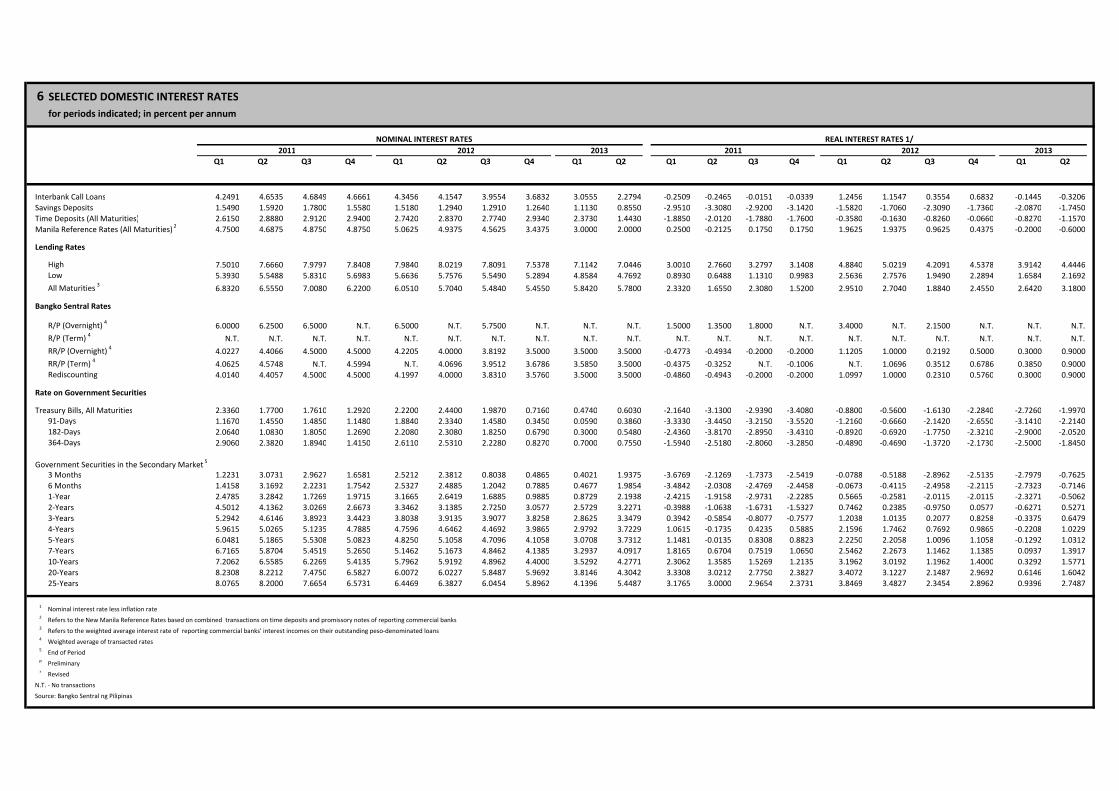
6 SELECTED DOMESTIC INTEREST RATES
for periods indicated; in percent per annum
NOMINAL INTEREST RATES REAL INTEREST RATES 1/
2011 2012 2013 2011 2012 2013
Q1 Q2 Q3 Q4 Q1 Q2 Q3 Q4 Q1 Q2 Q1 Q2 Q3 Q4 Q1 Q2 Q3 Q4 Q1 Q2
4.0729
3.1 3 3.6 3 3.2 2.6
Interbank Call Loans 4.2491 4.6535 4.6849 4.6661 4.3456 4.1547 3.9554 3.6832 3.0555 2.2794 -0.2509 -0.2465 -0.0151 -0.0339 1.2456 1.1547 0.3554 0.6832 -0.1445 -0.3206
Savings Deposits 1.5490 1.5920 1.7800 1.5580 1.5180 1.2940 1.2910 1.2640 1.1130 0.8550 -2.9510 -3.3080 -2.9200 -3.1420 -1.5820 -1.7060 -2.3090 -1.7360 -2.0870 -1.7450
Time Deposits (All Maturities) 2.6150 2.8880 2.9120 2.9400 2.7420 2.8370 2.7740 2.9340 2.3730 1.4430 -1.8850 -2.0120 -1.7880 -1.7600 -0.3580 -0.1630 -0.8260 -0.0660 -0.8270 -1.1570
Manila Reference Rates (All Maturities) 2
4.7500 4.6875 4.8750 4.8750 5.0625 4.9375 4.5625 3.4375 3.0000 2.0000 0.2500 -0.2125 0.1750 0.1750 1.9625 1.9375 0.9625 0.4375 -0.2000 -0.6000
Lending Rates
7.5010 7.6660 7.9797 7.8408 7.9840 8.0219 7.8091 7.5378 7.1142 7.0446 3.0010 2.7660 3.2797 3.1408 4.8840 5.0219 4.2091 4.5378 3.9142 4.4446
5.3930 5.5488 5.8310 5.6983 5.6636 5.7576 5.5490 5.2894 4.8584 4.7692 0.8930 0.6488 1.1310 0.9983 2.5636 2.7576 1.9490 2.2894 1.6584 2.1692
6.8320 6.5550 7.0080 6.2200 6.0510 5.7040 5.4840 5.4550 5.8420 5.7800 2.3320 1.6550 2.3080 1.5200 2.9510 2.7040 1.8840 2.4550 2.6420 3.1800
Bangko Sentral Rates
6.0000 6.2500 6.5000 N.T. 6.5000 N.T. 5.7500 N.T. N.T. N.T. 1.5000 1.3500 1.8000 N.T. 3.4000 N.T. 2.1500 N.T. N.T. N.T.
N.T. N.T. N.T. N.T. N.T. N.T. N.T. N.T. N.T. N.T. N.T. N.T. N.T. N.T. N.T. N.T. N.T. N.T. N.T. N.T.
4.0227 4.4066 4.5000 4.5000 4.2205 4.0000 3.8192 3.5000 3.5000 3.5000 -0.4773 -0.4934 -0.2000 -0.2000 1.1205 1.0000 0.2192 0.5000 0.3000 0.9000
4.0625 4.5748 N.T. 4.5994 N.T. 4.0696 3.9512 3.6786 3.5850 3.5000 -0.4375 -0.3252 N.T. -0.1006 N.T. 1.0696 0.3512 0.6786 0.3850 0.9000
4.0140 4.4057 4.5000 4.5000 4.1997 4.0000 3.8310 3.5760 3.5000 3.5000 -0.4860 -0.4943 -0.2000 -0.2000 1.0997 1.0000 0.2310 0.5760 0.3000 0.9000
Rate on Government Securities
Treasury Bills, All Maturities 2.3360 1.7700 1.7610 1.2920 2.2200 2.4400 1.9870 0.7160 0.4740 0.6030 -2.1640 -3.1300 -2.9390 -3.4080 -0.8800 -0.5600 -1.6130 -2.2840 -2.7260 -1.9970
1.1670 1.4550 1.4850 1.1480 1.8840 2.3340 1.4580 0.3450 0.0590 0.3860 -3.3330 -3.4450 -3.2150 -3.5520 -1.2160 -0.6660 -2.1420 -2.6550 -3.1410 -2.2140
2.0640 1.0830 1.8050 1.2690 2.2080 2.3080 1.8250 0.6790 0.3000 0.5480 -2.4360 -3.8170 -2.8950 -3.4310 -0.8920 -0.6920 -1.7750 -2.3210 -2.9000 -2.0520
2.9060 2.3820 1.8940 1.4150 2.6110 2.5310 2.2280 0.8270 0.7000 0.7550 -1.5940 -2.5180 -2.8060 -3.2850 -0.4890 -0.4690 -1.3720 -2.1730 -2.5000 -1.8450
Government Securities in the Secondary Market 5
2.6000 2.9000 3.7000 3.0000 3.2000 2.7000
3 Months 1.2231 3.0731 2.9627 1.6581 2.5212 2.3812 0.8038 0.4865 0.4021 1.9375 -3.6769 -2.1269 -1.7373 -2.5419 -0.0788 -0.5188 -2.8962 -2.5135 -2.7979 -0.7625
6 Months 1.4158 3.1692 2.2231 1.7542 2.5327 2.4885 1.2042 0.7885 0.4677 1.9854 -3.4842 -2.0308 -2.4769 -2.4458 -0.0673 -0.4115 -2.4958 -2.2115 -2.7323 -0.7146
1-Year 2.4785 3.2842 1.7269 1.9715 3.1665 2.6419 1.6885 0.9885 0.8729 2.1938 -2.4215 -1.9158 -2.9731 -2.2285 0.5665 -0.2581 -2.0115 -2.0115 -2.3271 -0.5062
2-Years 4.5012 4.1362 3.0269 2.6673 3.3462 3.1385 2.7250 3.0577 2.5729 3.2271 -0.3988 -1.0638 -1.6731 -1.5327 0.7462 0.2385 -0.9750 0.0577 -0.6271 0.5271
3-Years 5.2942 4.6146 3.8923 3.4423 3.8038 3.9135 3.9077 3.8258 2.8625 3.3479 0.3942 -0.5854 -0.8077 -0.7577 1.2038 1.0135 0.2077 0.8258 -0.3375 0.6479
4-Years 5.9615 5.0265 5.1235 4.7885 4.7596 4.6462 4.4692 3.9865 2.9792 3.7229 1.0615 -0.1735 0.4235 0.5885 2.1596 1.7462 0.7692 0.9865 -0.2208 1.0229
5-Years 6.0481 5.1865 5.5308 5.0823 4.8250 5.1058 4.7096 4.1058 3.0708 3.7312 1.1481 -0.0135 0.8308 0.8823 2.2250 2.2058 1.0096 1.1058 -0.1292 1.0312
7-Years 6.7165 5.8704 5.4519 5.2650 5.1462 5.1673 4.8462 4.1385 3.2937 4.0917 1.8165 0.6704 0.7519 1.0650 2.5462 2.2673 1.1462 1.1385 0.0937 1.3917
10-Years 7.2062 6.5585 6.2269 5.4135 5.7962 5.9192 4.8962 4.4000 3.5292 4.2771 2.3062 1.3585 1.5269 1.2135 3.1962 3.0192 1.1962 1.4000 0.3292 1.5771
20-Years 8.2308 8.2212 7.4750 6.5827 6.0072 6.0227 5.8487 5.9692 3.8146 4.3042 3.3308 3.0212 2.7750 2.3827 3.4072 3.1227 2.1487 2.9692 0.6146 1.6042
25-Years 8.0765 8.2000 7.6654 6.5731 6.4469 6.3827 6.0454 5.8962 4.1396 5.4487 3.1765 3.0000 2.9654 2.3731 3.8469 3.4827 2.3454 2.8962 0.9396 2.7487
1Nominal interest rate less inflation rate
2Refers to the New Manila Reference Rates based on combined transactions on time deposits and promissory notes of reporting commercial banks
3Refers to the weighted average interest rate of reporting commercial banks' interest incomes on their outstanding peso-denominated loans
4Weighted average of transacted rates
5End of Period
pPreliminary
rRevised
N.T. - No transactions
Source: Bangko Sentral ng Pilipinas
Low
All Maturities 3
R/P (Overnight) 4
High
364-Days
R/P (Term) 4
RR/P (Overnight) 4
RR/P (Term) 4
Rediscounting
91-Days
182-Days

7 NUMBER OF FINANCIAL INSTITUTIONS 1
as of periods indicated
2013
Q1 Q2 Q3 Q4 Q1 Q2 Q3 Q4 Q1
Mar Jun Sep Dec March June September Dec March
T o t a l 25,078 25,544 25,828 26,173 26,515 26,787 26,745 27,198 27,338
Head Offices 7,379 7,411 7,433 7,418 7,436 7,424 7,271 7,245 7,212
Branches/Agencies 17,699 18,133 18,395 18,755 19,079 19,363 19,474 19,953 20,126
Banks 8,870 8,915 8,965 9,050 9,186 9,207 9,301 9,410 9,477
Head Offices 746 739 730 726 723 712 705 696 687
Branches/Agencies 8,124 8,176 8,235 8,324 8,463 8,495 8,596 8,714 8,790
Universal and Commercial Banks 4,695 4,764 4,813 4,857 4,904 4,965 5,028 5,145 5,182
Head Offices 38 38 38 38 38 37 37 37 36
Branches/Agencies 4,657 4,726 4,775 4,819 4,866 4,928 4,991 5,108 5,146
Thrift Banks 1,419 1,381 1,394 1,491 1,545 1,522 1,545 1,619 1,641
Head Offices 73 72 70 71 71 69 69 70 70
Branches/Agencies 1,346 1,309 1,324 1,420 1,474 1,453 1,476 1,549 1,571
Savings and Mortgage Banks 894 854 887 979 1,007 1,003 1,020 1,052 1,072
Head Offices 28 27 27 28 28 28 28 28 28
Branches/Agencies 866 827 860 951 979 975 992 1,024 1,044
Private Development Banks 357 358 340 344 367 341 346 385 384
Head Offices 20 20 19 19 19 18 18 19 19
Branches/Agencies 337 338 321 325 348 323 328 366 365
Stock Savings and Loan Assns. 141 142 140 141 144 150 151 154 157
Head Offices 22 22 21 21 21 20 20 20 20
Branches/Agencies 119 120 119 120 123 130 131 134 137
Microfinance Banks 27 27 27 27 27 28 28 28 28
Head Offices 3 3 3 3 3 3 3 3 3
Branches/Agencies 24 24 24 24 24 25 25 25 25
Rural Banks 2,756 2,770 2,758 2,702 2,737 2,720 2,728 2,646 2,654
Head Offices 635 629 622 617 614 606 599 589 581
Branches/Agencies 2,121 2,141 2,136 2,085 2,123 2,114 2,129 2,057 2,073
(continued next page)
20122011

7 NUMBER OF FINANCIAL INSTITUTIONS 1
(Continuation)
2013
Q1 Q2 Q3 Q4 Q1 Q2 Q3 Q4 Q1
Mar Jun
Non-Banks 16,208 16,629 16,863 17,123 17,329 17,580 17,444 17,788 17,861
Head Offices 6,633 6,672 6,703 6,692 6,713 6,712 6,566 6,549 6,525
Branches/Agencies 9,575 9,957 10,160 10,431 10,616 10,868 10,878 11,239 11,336
Investment Houses 28 28 28 27 27 27 27 27 26
Head Offices 18 18 18 17 17 17 17 17 16
Branches/Agencies 10 10 10 10 10 10 10 10 10
Finance Companies 47 47 47 47 46 85 85 87 87
Head Offices 21 21 21 21 20 20 20 20 20
Branches/Agencies 26 26 26 26 26 65 65 67 67
Investment Companies 4 4 4 4 4 4 4 3 3
Head Offices 4 4 4 4 4 4 4 3 3
Branches/Agencies - - - - - - - - -
Securities Dealers/Brokers 14 14 14 14 14 13 13 13 13
Head Offices 14 14 14 14 14 13 13 13 13
Branches/Agencies - - - - - - - - -
Pawnshops 15,818 16,239 16,467 16,729 16,936 17,128 16,992 17,335 17,408
Head Offices 6,381 6,420 6,451 6,442 6,464 6,463 6,317 6,301 6,279
Branches/Agencies 9,437 9,819 10,016 10,287 10,472 10,665 10,675 11,034 11,129
Lending Investors 2 2 1 1 1 1 1 1 1
Head Offices 2 2 1 1 1 1 1 1 1
Branches/Agencies - - - - - - - - -
Non-Stock Savings and Loan Assns. 167 167 174 174 174 195 195 195 196
Head Offices 69 69 70 70 70 71 71 71 70
Branches/Agencies 98 98 104 104 104 124 124 124 126
Private Insurance Companies 2
119 119 119 119 119 119 119 119 119
Head Offices 115 115 115 115 115 115 115 115 115
Branches/Agencies 4 4 4 4 4 4 4 4 4
Government Non-Banks 4 4 4 4 4 4 4 4 4
Head Offices 4 4 4 4 4 4 4 4 4
Branches/Agencies - - - - - - - - -
Venture Capital Corporations - - - - - - - - -
Head Offices - - - - - - - - -
Branches/Agencies - - - - - - - - -
Credit Card Companies 4 4 4 3 3 3 3 3 3
Head Offices 4 4 4 3 3 3 3 3 3
Branches/Agencies - - - - - - - - -
Other Non-Bank with QBF 1 1 1 1 1 1 1 1 1
Head Offices 1 1 1 1 1 1 1 1 1
Branches/Agencies - - - - - - - - -
1 Refers to the number of financial establishments which includes the head offices and branches; excludes the Bangko Sentral ng Pilipinas
Starting Q4 2009, data include other banking offices per Circular 505 and 624 dated 22 December 2005 and 13 October 2008, respectively.
(Other banking offices refer to any office or place of business in the Philippines other than the head office, branch or extension offfice, which primarily
engages in banking activities other than the acceptance of deposits and/or servicing of withdrawals thru tellers or other authorized personnel.)2
Covers only the head offices and their foreign branches._
zero or nil
Source: Bangko Sentral ng Pilipinas
20122011

8 TOTAL RESOURCES OF THE PHILIPPINE FINANCIAL SYSTEM 1
as of periods indicated
in billion pesos
Q1 Q2 Q3 Q4 Q1 Q2 Q3 Q4 Q1 Q2
Mar Jun Sep Dec Mar June September December March June
T o t a l 8,958.8 9,208.5 9,286.8 9,645.6 9,530.3 9,805.7 9,970.7p
10,516.2p
10,648.2p
11,156.6p
Banks 7,119.6 7,314.2 7,360.6 7,643.4 7,464.3 7,671.5 7,866.9 8,358.3 8,417.0 8,925.5
Universal and Commercial Banks 2
6,350.5 6,548.1 6,598.1 6,833.0 6,668.0 6,877.6 7,054.3 7,486.7 7,547.6 7,995.5
Thrift Banks 2
587.5
581.5
576.9
623.6 608.6 606.2 622.4 681.6 679.3 739.9
Rural Banks 181.7 184.6 185.6 186.8 187.8 187.6 190.1a
190.1a
190.1a
190.1a
Non-Banks 3
1,839.1 1,894.3 1,926.2 2,002.2 2,066.0 2,134.3 2,103.9 2,157.8 2,231.2 2,231.2b
1 Excludes the Bangko Sentral ng Pilipinas; amount includes allowance for probable losses.
2 Data prior to 2008 were based on the Consolidated Statement of Condition which valued asset gross of allowance for probable losses and net of amortization and
depreciation. Data from March 2008 onwards were based on the new Financial Reporting Package which valued asset gross of amortization, depreciation and
allowance for probable losses.3 Includes Investment Houses, Finance Companies, Investment Companies, Securities Dealers/Brokers, Pawnshops, Lending Investors, Non Stocks Savings
and Loan Associations, Credit Card Companies (which are under BSP supervision), and Private and Government Insurance Companies (i.e., SSS and GSIS).a
As of end-September 2012b
As of end-March 2013p
Preliminary
Notes: Data on Non-Banks are based on Consolidated Statement of Condition (CSOC).
Data on Rural Banks are based on CSOC up to September 2010. Data from October 2010 onwards are based on FRP for some rural banks and
CSOC for other rural banks. Details may not add up to total due to rounding off.
Source: Bangko Sentral ng Pilipinas
(3)
(1)
20132012
(2)
2011
Institutions

9 RATIOS OF NON-PERFORMING LOANS (NPL) AND LOAN LOSS PROVISIONS Universal and Commercial Banks
end-of-period, in percent
2004 12.724 7.754 60.185 #
2005 8.206 6.358 77.486 #
2006 5.662 4.679 82.643 #
2007 4.448 4.151 93.331 #
2008 3.524 3.524 100.011 #
2009 #
Jan 3.817 3.696 96.821 #
Feb 3.727 3.588 96.294 #
Mar 3.562 3.537 99.299 #
Apr 3.652 3.639 99.652 #
May 3.688 3.547 96.158 #
Jun 3.360 3.438 102.334 #
Jul 3.488 3.661 104.983 #
Aug 3.496 3.682 105.311 #
Sep 3.249 3.615 111.272 #
Oct 3.367 3.581 106.371 #
Nov 3.257 3.576 109.770 #
Dec 2.969 3.335 112.342 #
2010 #
Jan 3.222 3.566 110.698 #
Feb 3.183 3.549 111.499 #
Mar 3.215 3.634 113.025 #
Apr 3.337 3.633 108.897 #
May 3.305 3.641 110.172 #
Jun 3.208 3.557 108.813 #
Jul 3.303 3.719 112.573 #
Aug 3.246 3.717 114.521 #
Sep 3.113 3.646 117.125 #
Oct 3.191 3.740 117.200 #
Nov 3.064 3.572 116.582 #
Dec 2.863 3.392 118.482 #
2011 #
Jan 3.006 3.532 117.474 #
Feb 2.934 3.508 119.572 #
Mar 2.986 3.594 120.370 #
Apr 2.947 3.568 121.060 #
May 2.796 3.448 123.306 #
Jun 2.446 3.087 126.172 #
Jul 2.451 3.095 126.241 #
Aug 2.516 3.057 121.498 #
Sep 2.460 3.043 123.704 #
Oct 2.538 3.023 119.073 #
Nov 2.387 2.917 122.197 #
Dec 2.233 2.821 126.363 #
2012P
Jan 2.345 2.925 124.729 #
Feb 2.344 2.911 124.200 #
Mar 2.361 2.950 124.937 #
Apr 2.298 2.890 125.726 #
May 2.184 2.816 128.933 #
Jun 2.058 2.808 136.454 #
Jul 2.077 2.822 135.838 #
Aug 2.085 2.831 135.810 #
Sep 2.050 2.789 136.000
Oct 1.998 2.771 138.729
Nov 1.975 2.710 137.208
Dec 1.866 2.636 141.245
2013P
Jan 2.827 0.428 3.598 127.277 841.501 #
Feb 2.787 0.440 3.539 126.992 804.111 #
Mar 2.741 0.448 3.517 128.312 784.777 #
Apr 2.741 0.440 3.526 128.633 801.406 #
May 2.751 0.439 3.535 128.499 805.547 #
1/Starting Sept. 2002, for supervisory purposes, computation of NPL was based on BSP Circular No. 351 which defines total loans as gross of allowance
2/
pPreliminary
Source: SDC/DES
NPLs, which shall refer to gross NPLs less specific allowance for credit losses on the total loan portfolio, provided, that such specific allowance for credit losses on the total loan
losses on the total loan portfolio shall not be deducted from the total loan portfolio.
TOTAL NPL 1/
/
TOTAL LOANS
for probable losses and interbank loans less loans classified as loss.
Starting January 2013, figures are computed as prescribed under BSP Circular No. 772. Gross NPL represents the actual level of NPL without any
adjustment for loans treated as "loss" and fully provisioned. As a complementary measure to computing gross NPL, banks shall likewise compute their net NPLs, which shall refer
LOAN LOSS
PROVISIONS /
GROSS NPL
LOAN LOSS
PROVISIONS /
NET NPL
LOAN LOSS
PROVISIONS / NPL
TOTAL LOAN
PROVISIONS/
TOTAL LOANS
NET NPL 2/
/
TOTAL LOANS
GROSS NPL 2/
/
TOTAL LOANS
M:\@PERMANENT - MPSS\LTP\2013\Q2 LTP (FMRG)\Final\Tables\Table 9_NPL-TL-LLP (Banking System)_mia for LTP_jay9/25/20135:34 PM

9a UNIVERSAL AND COMMERCIAL BANKS
Selected Asset Quality Indicators
As of End of Periods Indicated
Levels (In Billion Pesos) May-13 Apr-13 Mar-13 Feb-13 Jan-13 Dec-12 1/ May-12 1/
Total Loan Portfolio (TLP) 2/
* 3,685.16 3,670.05 3,625.04 3,587.21 3,608.62 3,650.76
3,282.41
Loan Loss Reserves (LLR) * 130.26 129.42 127.49 126.95 129.85 128.46
124.45
Specific Allowance for Credit Losses 85.2 84.46 83.11 84.18 86.59 89.3
88.07
General Loan Loss Provision 45.06 44.96 44.38 42.77 43.26 39.16
36.39
TLP, net of LLR 3,554.90 3,540.63 3,497.56 3,460.27 3,478.76 3,522.30
3,157.95
TLP 2/
, net of Interbank Loans (IBL) * 3,546.38 3,513.54 3,497.26 3,452.53 3,458.69 3,495.29
3,137.37
Gross Non-Performing Loans (NPL) * 101.37 100.61 99.36 99.96 102.02 100.61
103.92
Net NPL * 16.17 16.15 16.25 15.79 15.43 11.31
15.85
Ratios (In Percent) May-13 Apr-13 Mar-13 Feb-13 Jan-13 Dec-12 1/ May-12 1/
Gross NPL Ratio (Gross NPL to Gross TLP) * 2.75 2.74 2.74 2.79 2.83 2.76
3.17
Net NPL Ratio (Net NPL to Gross TLP) * 0.44 0.44 0.45 0.44 0.43 0.31
0.48
NPL Ratio net of IBL * 2.83 2.84 2.82 2.87 2.93 2.88
3.31
NPL Coverage Ratio (LLR to Gross NPL) * 128.5 128.63 128.31 126.99 127.28 127.68
119.76
* Figures are computed in accordance with the NPL definition as prescribed under BSP Circular No. 772 dated 16 October 2012 effective 01 January 2013
1/ For comparative purposes, computations for periods prior to January 2013 are aligned with Circular No. 772
2/ Gross of Provisions
Source: Bangko Sentral ng Pilipinas

10 STOCK MARKET TRANSACTIONS
volume in million shares, value in million pesos
2013
Q1 Q2 Q3 Q4 Q1 Q2 Q3 Q4 Q1 Q2
Volume 144561.70 232516.10 431850.70 247667.19 402134.63 152893.28 116966.98 371124.16 165036.09 170243.20
Financials 649.80 629.78 1437.01 1406.99 1619.09 1153.40 991.09 1434.87 1815.65 1373.89
Industrial 6459.50 5767.21 29367.37 7523.84 31502.63 13358.43 16361.97 81440.24 18622.05 35931.13
Holding Firms 23546.00 11491.60 22863.88 10799.78 21750.93 7081.49 9092.28 143645.86 33659.42 36289.89
Property 19404.60 13990.80 18584.86 12717.69 25507.07 18144.86 14136.54 18676.08 22018.37 16990.66
Services 5078.60 4239.68 18563.10 16441.56 14403.95 10480.29 15809.81 44604.55 23393.53 21728.44
Mining & Oil 89423.20 196396.98 341034.30 198775.40 307350.84 102674.80 60575.05 81321.26 65526.75 57928.96
SME 0.10 0.02 0.16 1.93 0.12 0.02 0.24 1.30 0.32 0.23
Value 325016.40 336795.10 384522.40 376257.40 502081.15 445647.88 359916.17 464065.87 623381.92 781004.56
Financials 31968.10 34907.81 49817.86 53460.36 74928.85 60289.16 51589.26 96175.25 101569.89 98627.55
Industrial 100461.70 92832.94 107984.66 72814.83 114995.40 132721.16 69893.61 101501.51 125878.90 228624.02
Holding Firms 74750.50 79750.31 63531.85 70700.14 106954.09 104977.44 87474.18 101072.63 167319.87 187192.27
Property 39979.00 35069.70 39404.37 35773.04 58562.31 52982.59 65675.32 66954.94 108596.25 100356.43
Services 53189.50 47266.20 44127.85 91303.82 78836.69 59063.52 67397.33 81771.86 91228.15 150765.32
Mining & Oil 24667.60 46968.00 79655.09 52200.88 67803.28 35613.99 17885.38 16578.97 28786.18 15437.62
SME 0.05 0.08 0.76 4.40 0.53 0.02 1.09 10.71 2.68 1.35
Composite Index (end of period) 4055.10 4291.20 3999.70 4372.00 5107.70 5246.41 5346.10 5812.73 6847.47 6465.28
Sum of details may not add up to totals due to rounding.
Source : Philippine Stock Exchange
20122011

11 PHILIPPINES: BALANCE OF PAYMENTS
in million U.S. dollars
Y-o-Y
Q1 Q2 Q3 Q4 Q1 Q2 Growth (%)
Current Account 393 2276 2249 2208 3139 2484 9.1
Export 21488 23470 23914 23504 22893 24151 2.9
Import 21095 21194 21665 21296 19754 21667 2.2
Goods, Services, and Primary Income -3913 -2486 -2616 -3031 -1414 -2493 -0.3
Export 17045 18592 18913 18108 18210 19003 2.2
Import 20958 21078 21529 21139 19624 21497 2.0
Goods and Services -3256 -2540 -2244 -3260 -1255 -2029 20.1
Export 15170 16657 16945 16112 16312 17016 2.2
Import 18426 19197 19189 19372 17567 19045 -0.8
Goods -4787 -2696 -3021 -4701 -2924 -2255 16.4
Credit: Exports 10339 12692 12262 10991 11149 12840 1.2
Debit: Imports 15126 15388 15283 15692 14073 15095 -1.9
Services 1531 156 777 1441 1669 226 44.8
Credit: Exports 4831 3965 4683 5121 5163 4176 5.3
Debit: Imports 3300 3809 3906 3680 3494 3950 3.7
Primary Income -657 54 -372 229 -160 -465 -960.6
Credit: Receipts 1875 1935 1968 1996 1898 1987 2.7
Debit: Payments 2532 1881 2340 1767 2057 2452 30.4
Secondary Income 4306 4762 4865 5239 4554 4977 4.5
Credit: Receipts 4443 4878 5001 5396 4684 5148 5.5
Debit: Payments 137 116 136 157 130 170 46.8
Capital Account 25 30 33 48 22 24 -20.4
Credit: Receipts 28 33 40 51 27 29 -12.2
Debit: Payments 3 3 7 3 5 5 69.1
Financial Account -4821 722 510 -2542 -677 -127 -117.6
Net Acquisition of Financial Assets -1584 1075 3567 1076 1936 -693 -164.5
Net Incurrence of Liabilities 3237 353 3057 3618 2613 -566 -260.2
Direct Investment -898 80 -42 -92 -1556 139 74.0
Net Acquisition of Financial Assets 526 629 317 373 507 265 -57.9
Net Incurrence of Liabilities 1424 549 359 465 2063 125 -77.1
Portfolio Investment -1248 -363 -61 -1851 -1754 -337 7.2
Net Acquisition of Financial Assets 786 -50 423 45 -774 93 286.0
Net Incurrence of Liabilities 2034 313 484 1896 980 430 37.4
Financial Derivatives -60 2 18 27 49 -27 -1437.1
Net Acquisition of Financial Assets -125 -59 -56 -36 -48 -77 -30.1
Net Incurrence of Liabilities -65 -61 -74 -63 -97 -50 18.0
Other Investment -2615 1003 595 -626 2584 97 -90.3
Net Acquisition of Financial Assets -2771 555 2883 694 2251 -974 -275.5
Net Incurrence of Liabilities -156 -448 2288 1320 -333 -1071 -139.1
NET UNCLASSIFIED ITEMS -3996 -1511 2743 -1393 -2302 -1594 -5.5
OVERALL BOP POSITION 1243 73 4515 3405 1536 1041 1325.7
Debit: Change in Reserve Assets 1253 62 4526 3394 1546 1030 1561.3
Credit: Change in Reserve Liabilities 10 -11 11 -11 10 -11 1.9
Use of Fund Credits 0 0 0 0 0 0 0.0
Short-term 10 -11 11 -11 10 -11 1.9
Note: Totals may not add up due to rounding.
p - Preliminary
Technical Notes:
1. Balance of Payments Statistics from 2011 onwards are based on the IMF's Balance of Payments and International Investment
Position Manual, 6th Edition.
2. Financial Account, including Reserve Assets, is calculated as the sum of net acquisitions of financial assets less net incurrence of liabilities.
3. Balances in the current and capital accounts are derived by deducting debit entries from credit entries.
4. Balances in the financial account are derived by deducting net incurrence of liabilities from net acquisition of financial assets.
5. Negative values of Net Acquisition of Financial Assets indicate withdrawal/disposal of financial assets; negative values of Net
Incurrence of Liabilities indicate repayment of liabilities.
6. Overall BOP position is calculated as the change in the country's net international reserves (NIR), less non-economic transactions (revaluation
and gold monetization/demonetization). Alternatively, it can be derived by adding the current and capital account balances
less financial account plus net unclassified items.
7. Net unclassified items is an offsetting account to the overstatement or understatement in either receipts or payments of the recorded BOP
components vis-à-vis the overall BOP position.
8. Data on Deposit-taking corporations, except the central bank consist of transactions of commercial and thrift banks and offshore banking
units (OBUs).
2012 2013 p

11a EXPORTS BY MAJOR COMMODITY GROUP
for periods indicated
volume in 000 metric tons; unit price in U.S.$/m.t.; fob value in million U.S. dollars; growth rates in percent
C o m m o d i t i e s Volume Price 4/
Value Volume Price 4/
Value Volume Price 4/
Value Volume Price 4/
Value Volume Price 4/
Value Volume Price 4/
Value Volume Price Value
Coconut Products 328 378 322 336 433 341 -9.7
Copra .. 1179 -- .. 1397 -- .. 538 -- .. 1166 -- .. 1069 -- .. 1027 -- 0.0 -26.5 0.0
Coconut Oil 171 1420 242 224 1313 294 217 1111 241 246 969 238 357 896 320 240 907 218 7.3 -31.0 -25.9
Desiccated Coconut 26 2506 66 24 2203 54 12 3210 37 6 6519 39 4 10849 11 5 10096 51 -79.1 358.2 -4.3
Copra Meal/Cake 61 205 12 112 195 22 152 250 38 122 409 50 136 459 27 106 605 64 -5.4 209.8 192.9
Others 6 7 6 8 6 8 1.8
Sugar and Products 48 48 26 55 109 56 17.7
Centrifugal & Refined 76 533 40 81 557 45 45 516 9 .. 1090 -- 99 995 39 35 1450 50 -57.1 160.3 11.6
Molasses 70 93 6 6 122 1 12 143 2 36 344 12 34 280 6 6 839 5 0.0 587.9 587.9
Others 1 2 1 43 1 1 -66.4
Fruits and Vegetables 247 312 323 324 341 393 26.0
Canned Pineapple 54 984 53 51 1011 51 65 991 65 52 955 50 33 1020 13 40 1023 41 -21.0 1.2 -20.1
Pineapple Juice 22 569 12 19 576 11 30 545 16 19 604 11 22 599 5 19 603 11 -1.1 4.7 3.6
Pineapple Concentrates 6 1073 6 9 1295 12 7 1319 9 11 1411 16 7 1360 3 9 1391 13 1.3 7.5 8.9
Bananas 431 262 113 636 250 159 693 262 181 886 218 193 694 298 75 678 364 247 6.7 46.0 55.7
Mangoes 5 741 4 8 798 7 4 851 3 1 1440 1 1 1270 -- 2 1379 3 -72.8 72.9 -52.9
Others 57 72 49 51 77 77 7.1
Other Agro-Based Products 203 222 184 197 261 220 -1.1
Fish, Fresh or Preserved 25 4197 106 28 4373 122 21 4868 101 19 4779 90 22 5529 35 17 6454 111 -38.3 47.6 -9.0
Of which: Shrimps & Prawns 1 10880 9 1 9936 12 .. 10973 5 1 111 9 .. 137091 2 .. 33780 5 0.0 240.0 -58.7
Coffee, Raw, not Roasted .. 4607 -- .. 7088 0 0 0 0 0 0 0 .. 99832 -- .. 10000 0 0.0 0.0 -57.7
Abaca Fibers 5 256 1 1 1382 2 3 612 2 1 715 1 2 777 -- 2 598 1 84.2 -56.7 -20.2
Tobacco,Unmanufactured 8 2627 21 7 2642 18 6 3040 17 6 3040 20 .. 316715 10 .. 78372 18 0.0 2865.9 -0.8
Natural Rubber 8 1423 12 11 1418 15 10 1626 17 9 1929 18 9 2248 9 7 2547 17 -36.9 79.6 13.3
Ramie Fibers, Raw or Processed 0 0 0 .. 12947 -- 0 0 0 0 0 0 .. 84093 -- .. 43200 -- 0.0 233.7 0.0
Seaweeds, Dried 5 2519 13 6 1331 8 3 1157 4 7 915 6 4 1833 1 3 2579 8 -51.1 93.8 -5.3
Rice 0 0 0 0 0 0 0 0 0 0 0 0 0 0 0 0 0 0 0.0 0.0 0.0
Others 50 57 43 62 82 64 12.9
Forest Products 1/ 9 13 21 15 19 39 199.4
Logs .. 35 -- .. 38 -- 0 0 0 0 0 0 1 2431 1 .. 6278 -- 0.0 0.0 0.0
Lumber 92 62 6 103 62 6 78 102 8 119 74 9 76 170 4 29 1080 31 -72.0 1646.7 389.6
Plywood 3 901 2 4 758 3 3 971 3 3 831 3 2 1298 -- 1 431 -- -86.3 -43.1 0.0
Veneer Sheets/Corestocks 1 48 -- .. 10445 -- 1 189 -- 0 0 0 .. 8760 -- .. 7506 -- 0.0 -28.1 0.0
Others 1 3 2 -- 2 7 143.5
Mineral Products 487 583 522 677 520 1067 83.2
Copper Concentrates 53 1249 66 57 1055 60 38 1565 59 20 744 15 19 1753 13 67 1554 103 17.3 47.3 72.7
Copper Metal 22 7648 165 1 8379 8 10 7529 72 32 8087 260 12 7981 23 100 1648 165 10225.4 -80.3 1931.2
Gold 2/ 19 1699 32 413 143 59 5 1530 8 6 1680 10 .. 100372 -- 17 1455 25 -95.9 915.4 -58.5
Iron Ore Agglomerates 720 23 16 811 31 25 930 28 26 715 26 19 950 27 9 1078 26 28 33.0 -14.2 14.0
Chromium Ore 41 50 2 30 93 3 31 73 2 19 66 1 19 166 -- 22 221 5 -26.4 137.0 74.5
Nickel 0 0 0 0 0 0 -100.0
Others 206 428 354 373 361 741 73.1
Petroleum Products 124 85 66 190 176 249 193.4
Manufactures 8819 11010 10781 9152 9266 10452 -5.1
Electronic Products 3/ 4696 4418 4399 4317 2651 4816 9.0
Other electronics 430 684 716 602 585 616 -10.0
Garments 3/ 384 405 299 311 383 371 -8.4
Textile Yarns/Fabrics 45 45 41 40 43 44 -2.3
Footwear 3 3 4 5 4 6 116.5
Travel Goods and Handbags 22 10 6 23 29 35 263.5
Wood Manufactures 468 416 617 659 699 797 91.7
Furniture & Fixtures 38 55 42 45 50 61 11.1
Chemicals 435 630 471 407 751 568 -9.9
Non-Metallic Mineral Manufactures 41 37 34 33 45 53 41.1
Machinery & Transport Equipment 1036 1557 1757 963 1008 1147 -26.3
Processed Food and Beverages 329 337 303 478 527 589 74.7
Iron & Steel 47 78 70 58 52 58 -24.8
Baby Carr., Toys, Games & Sporting Goods 43 57 67 71 62 82 42.1
Basketwork, Wickerwork, & Other
Articles of Plaiting Materials 13 12 6 11 14 16 33.6
Misc. Manufactured Articles, n.e.s. 122 585 702 125 127 132 -77.4
Others 3/ 666 1680 1359 1007 985 1060 -36.9
Special Transactions 3/ 58 21 2 12 3 4 -82.3
TOTAL EXPORTS 3/ 10323 12670 12247 10958 11127 12821 1.2
Coverage adjustments 3/ 16 22 15 33 23 19 -13.0
TOTAL EXPORTS, BPM6 10339 12692 12262 10991 11149 12840 1.2
.. Less than one thousand metric tons 1/ - Volume in 000 cubic meters; unit price in US$/cu.m.
-- Less than one million US$ 2/ - Volume in 000 troy ounces; unit price in US$/oz t.
p - Preliminary 3/ Excludes value of goods that do not involve change in ownership such as consigned, returned/replacement,
and temporarily exported goods
Note: Components may not add up to total due to rounding. 4/ Prices are derived from the NSO's Foreign Trade Statistics (value/volume)
Q2Q4
Growth Rates
Q2 2013Q1
2012 p/
Q1
2013 p/
Q2 Q3

11b IMPORTS BY MAJOR COMMODITY GROUP
for periods indicated volume in 000 metric tons; unit price
1/ in U.S.$/mt; f.o.b. value in million U.S. dollars; growth rates in percent
Volume Price Value Volume Price Value Volume Price Value Volume Price Value Volume Price Value Volume Price Value Volume Price Value
Capital Goods 2863 2959 2672 3254 2658 3046 2.9
Power Generating & Specialized Machines 876 952 967 997 899 1012 6.3
Office & EDP Machines 524 525 483 423 377 367 -30.0
Telecommunication Eqpt. & Elect. Mach. 708 613 653 715 726 686 12.0
Land Transport Eqpt. excl. Passenger Cars & Motorized Cycle 311 309 329 352 323 326 5.6
Aircraft, Ships & Boats 300 424 71 611 209 532 25.5
Prof. Sci. & Cont. Inst.; Photographic Eqpt. & Optical Goods 144 136 169 155 124 122 -10.4
Raw Materials & Intermediate Goods 6040 6559 6414 6308 5913 6089 -7.2
Unprocessed Raw Materials 669 472 738 886 657 657 39.1
Wheat 681 275 187 723 282 204 926 290 268 666 335 223 375 579 217 566 307 174 -16.9 11.6 -14.8
Corn 94 378 35 15 1374 20 9 638 6 19 863 16 28 327 9 11 779 9 -88.3 106.1 -55.7
Unmilled cereals excl. rice & corn 3 3 2 3 1 2 -22.8
Crude materials, inedible 400 198 432 626 398 432 118.3
Pulp & waste paper 14 13 9 7 10 10 -24.1
Cotton 2 2143 4 2 1869 4 2 1711 4 1 1519 2 4 1611 6 3 1732 5 50.0 -19.2 12.8
Syn. fibers 9 2345 20 7 2584 19 8 3318 27 7 3034 23 6 2477 15 8 3220 25 -11.1 37.3 29.5
Metalliferous ores 224 7 101 457 237 246 3415.5
Others 138 155 291 137 130 147 -5.1
Tobacco, unmanufactured 44 47 30 18 31 40 -15.9
Semi-Processed Raw Materials 5371 6087 5676 5422 5256 5432 -10.8
Feeding stuffs for animals 507 396 201 524 441 231 433 533 230 553 555 306 485 585 284 421 497 209 -17.0 25.5 -9.6
Animal & vegetable oils & fats 145 99 77 62 62 50 -49.2
Chemical 1598 1543 1644 1469 1422 1589 3.0
Chemical compounds 432 354 411 339 320 363 2.7
Medicinal & pharmaceutical chemicals 224 235 242 259 256 285 21.1
Urea 124 378 47 108 397 43 167 386 64 195 358 70 128 287 37 150 341 51 21.0 -9.8 19.0
Fertilizer excl. urea 183 343 63 232 345 80 323 353 114 238 340 81 215 326 70 271 329 89 48.1 -4.1 11.5
Artificial resins 428 407 385 325 351 375 -7.9
Others 404 424 428 394 389 426 0.4
Manufactured goods 1272 1341 1245 1284 1356 1433 6.9
Paper & paper products 217 851 185 241 807 195 227 818 186 207 836 173 243 760 185 251 838 210 15.7 -1.5 7.7
Textile yarn, fabrics & made-up articles 157 167 146 168 160 189 13.3
Non-metallic mineral mftures. 108 138 140 148 155 148 6.9
Iron & steel 401 893 358 398 879 350 400 800 320 433 785 340 484 754 365 484 784 380 20.7 -12.2 8.6
Non-ferrous metals 185 190 160 155 182 166 -12.8
Metal products 166 173 162 183 181 202 16.7
Others 113 128 131 116 127 139 8.3
Mat/Acc for the mftr. of elect. eqpt. 4/
2156 2804 2480 2282 2133 2130 -24.1
Iron ore, not agglomerated 0 0 0 496 139 69 0 0 0 120 160 19 0 0 0 225 96 22 0.0 0.0 -68.7
Mineral Fuels & Lubricant 3870 3159 3428 3209 3177 3527 11.7
Coal, Coke 1564 93 146 2192 95 209 2007 87 174 2035 83 169 2108 79 166 3288 62 203 110.2 -33.3 -2.9
Petroleum Crude 2/
24.33 103.34 2514 11.33 116.25 1317 17.42 105.02 1829 16.69 111.37 1859 13.60 113.69 1546 15.64 104.89 1640 -35.7 1.5 24.6
Others 2/
9.05 133.69 1209 12.82 127.36 1633 12.09 117.74 1424 9.88 119.59 1181 12.08 121.18 1464 14.60 115.32 1684 61.3 -13.7 3.1
Consumer Goods 1706 1910 1985 2093 1827 1997 4.5
Durable 820 888 897 1077 915 946 6.5
Passenger cars & motorized cycle 466 501 483 601 519 472 -5.7
Home appliances 69 81 96 114 99 87 7.0
Misc. manufactures 285 306 318 362 296 387 26.4
Non-Durable 886 1022 1088 1015 913 1051 2.8
Food & live animals chiefly for food 812 955 1009 932 814 954 -0.1
Dairy products 75 2671 201 82 2496 204 84 2291 192 80 2062 165 75 2443 183 82 2424 199 9.3 -9.2 -2.4
Fish & fish preparation 62 875 55 55 994 54 52 807 42 71 790 56 70 832 58 47 1186 56 -24.2 35.5 4.1
Rice 3/
101 276 28 297 422 126 437 416 182 174 322 56 4 763 3 159 445 71 57.4 61.2 -43.8
Fruits & vegetables 92 82 75 126 93 82 0.4
Others 436 489 518 529 478 546 11.6
Beverages & tobacco mfture. 18 22 23 23 31 31 40.0
Articles of apparel, access. 56 45 56 60 67 66 46.4
Special Transactions 4/
0 25 45 31 5 11 -55.4
SUB-TOTAL 4/
14479 14612 14544 14895 13580 14670 0.4
Coverage Adjustments 647 776 739 797 494 425 -45.3
TOTAL IMPORTS, BPM6 15126 15388 15283 15692 14073 15095 -1.9
1/ Derived from NSO's value and volume - - Less than one million US dollars
2/ Volume in million barrels; unit price in U.S.$/barrel
3/ Includes rice imporation arrivals which were contracted in the previous year . . Less than one thousand metric tons
4/ Excludes value of goods that do not involve change in ownership such as consigned, returned/replacement, and temporarily imported goods
p/ - Preliminary
Components may not add up to total due to rounding.
Source: National Statistics Office
Q1 Q22013 p/
Q2 20132012 p/ Growth Rates (%)
Commodities Q1 Q2 Q3 Q4

12 INTERNATIONAL RESERVES
as of periods indicated
in million US dollars
2 0 1 2
Mar Jun Sep Dec Mar Jun
Gross International Reserves 76,129 76,130 82,029 83,831 83,951 81,255
Gold 10,444 9,981 11,043 10,353 9,901 7,663
SDRs 1,298 1,272 1,293 1,288 1,257 1,261
Foreign Investments 63,536 64,035 68,304 70,728 71,325 70,645
Foreign Exchange 334 323 858 927 944 1,146
Reserve Position in the Fund 517 519 531 535 524 540
Net International Reserves 76,116 76,128 82,016 83,829 83,938 81,254
Source: Bangko Sentral ng Pilipinas
2013

13 EXCHANGE RATES OF THE PESOpesos per unit of foreign currencyperiod averages
2011 43.3131 0.5436 60.2791 69.4551 34.4567 5.5645 14.1716 1.4219 0.0049 1.4746 0.0391Jan 44.1722 0.5350 59.0151 69.6606 34.3415 5.6790 14.4303 1.4482 0.0049 1.5183 0.0395
Feb 43.7031 0.5293 59.6914 70.4721 34.2489 5.6109 14.3526 1.4237 0.0049 1.4973 0.0391Mar 43.5160 0.5335 60.9427 70.3743 34.3116 5.5850 14.3386 1.4333 0.0050 1.4748 0.0388Apr 43.2402 0.5190 62.3995 70.6571 34.6324 5.5619 14.3268 1.4375 0.0050 1.4866 0.0398May 43.1307 0.5317 61.8629 70.5236 34.8410 5.5488 14.3417 1.4284 0.0050 1.5014 0.0399Jun 43.3657 0.5386 62.4391 70.4189 35.1330 5.5726 14.3534 1.4232 0.0051 1.5075 0.0402Jul 42.8088 0.5389 61.1949 69.0626 35.1642 5.4967 14.2929 1.4211 0.0050 1.4851 0.0404Aug 42.4209 0.5505 60.7724 69.4325 35.0881 5.4408 14.2280 1.4214 0.0050 1.4650 0.0395Sep 43.0256 0.5599 59.3496 67.9974 34.4720 5.5202 14.0215 1.4171 0.0049 1.4516 0.0387Oct 43.4514 0.5669 59.4688 68.3653 33.9693 5.5856 13.8267 1.4070 0.0049 1.4334 0.0376Nov 43.2745 0.5587 58.6807 68.3853 33.5505 5.5605 13.7269 1.3992 0.0048 1.4318 0.0381Dec 43.6486 0.5606 57.5321 68.1115 33.7275 5.6121 13.8198 1.4032 0.0048 1.4428 0.0381
2012 42.2288 0.5299 54.3079 66.9249 33.8041 5.4441 13.6818 1.3595 0.0045 1.4282 0.0375Jan 43.6191 0.5670 56.2828 67.6569 34.0705 5.6185 13.9823 1.3818 0.0048 1.4524 0.0381
Feb 42.6608 0.5448 56.4222 67.4003 34.0289 5.5017 14.1129 1.3882 0.0047 1.4439 0.0380Mar 42.8574 0.5199 56.6288 67.8338 34.0664 5.5216 14.0931 1.3975 0.0047 1.4523 0.0381Apr 42.6998 0.5253 56.2914 68.4145 34.1571 5.5012 13.9585 1.3841 0.0047 1.4492 0.0376May 42.8515 0.5375 54.8780 68.2662 33.9592 5.5199 13.8470 1.3704 0.0046 1.4544 0.0370Jun 42.7765 0.5397 53.6192 66.5015 33.4579 5.5130 13.4563 1.3518 0.0046 1.4297 0.0367Jul 41.9054 0.5302 51.5881 65.3765 33.2304 5.4033 13.2341 1.3250 0.0044 1.3981 0.0367Aug 42.0452 0.5349 52.0961 66.0660 33.7009 5.4213 13.4950 1.3384 0.0044 1.4040 0.0372Sep 41.7490 0.5341 53.6856 67.2180 33.8922 5.3843 13.5519 1.3467 0.0044 1.4135 0.0371Oct 41.4521 0.5258 53.7545 66.6237 33.8484 5.3477 13.5689 1.3515 0.0043 1.4173 0.0374Nov 41.1222 0.5082 52.7036 65.5939 33.6142 5.3060 13.4464 1.3399 0.0043 1.4123 0.0378Dec 41.0067 0.4914 53.7443 66.1474 33.6230 5.2914 13.4347 1.3388 0.0043 1.4117 0.0381
2013 41.2435 0.4327 54.1830 63.6777 33.1802 5.3160 13.4140 1.3834 0.0042 1.3906 0.0374Jan 40.7295 0.4580 54.1270 65.0893 33.1823 5.2537 13.4143 1.3549 0.0042 1.4011 0.0382
Feb 40.6723 0.4372 54.3618 63.0701 32.8469 5.2446 13.1338 1.3647 0.0042 1.3727 0.0374Mar 40.7127 0.4293 52.8776 61.3734 32.6803 5.2477 13.0966 1.3788 0.0042 1.3700 0.0370Apr 41.1422 0.4221 53.5266 62.9378 33.2313 5.2999 13.4866 1.4164 0.0042 1.3793 0.0367May 41.2976 0.4092 53.5926 63.1389 33.0769 5.3210 13.6880 1.3898 0.0042 1.3870 0.0372Jun 42.9069 0.4406 56.6122 66.4568 34.0634 5.5291 13.6649 1.3959 0.0044 1.4334 0.0378
Source: Bangko Sentral ng Pilipinas
Thailand Baht
US DollarJapanese
YenEuro
Pound Sterling
Singapore Dollar
Hongkong Dollar
Malaysian Ringgit
New Taiwan Dollar
South Korean Won
Indonesian Rupiah

13a EXCHANGE RATES OF THE PESOunits of foreign currency per pesoperiod averages
2011 0.0231 1.8411 0.0166 0.0144 0.0290 0.1797 0.0706 0.7033 202.2252 0.6784 25.5615
Jan 0.0226 1.8691 0.0169 0.0144 0.0291 0.1761 0.0693 0.6905 204.0816 0.6586 25.3256Feb 0.0229 1.8891 0.0168 0.0142 0.0292 0.1782 0.0697 0.7024 204.2901 0.6679 25.5460Mar 0.0230 1.8742 0.0164 0.0142 0.0291 0.1791 0.0697 0.6977 201.0490 0.6780 25.7588Apr 0.0231 1.9269 0.0160 0.0142 0.0289 0.1798 0.0698 0.6956 200.2107 0.6727 25.1157May 0.0232 1.8806 0.0162 0.0142 0.0287 0.1802 0.0697 0.7001 198.1982 0.6661 25.0798Jun 0.0231 1.8567 0.0160 0.0142 0.0285 0.1794 0.0697 0.7026 196.8135 0.6634 24.8933Jul 0.0234 1.8557 0.0163 0.0145 0.0284 0.1819 0.0700 0.7037 199.6198 0.6734 24.7292Aug 0.0236 1.8165 0.0165 0.0144 0.0285 0.1838 0.0703 0.7035 200.0000 0.6826 25.2951Sep 0.0232 1.7860 0.0168 0.0147 0.0290 0.1812 0.0713 0.7057 202.7650 0.6889 25.8732Oct 0.0230 1.7641 0.0168 0.0146 0.0294 0.1790 0.0723 0.7107 204.0816 0.6976 26.6241Nov 0.0231 1.7899 0.0170 0.0146 0.0298 0.1798 0.0728 0.7147 207.8775 0.6984 26.2177Dec 0.0229 1.7839 0.0174 0.0147 0.0296 0.1782 0.0724 0.7126 207.7151 0.6931 26.2796
2012 0.0237 1.8893 0.0184 0.0149 0.0296 0.1837 0.0731 0.7358 221.5638 0.7003 26.6838
Jan 0.0229 1.7638 0.0178 0.0148 0.0294 0.1780 0.0715 0.7237 207.7151 0.6885 26.2369Feb 0.0234 1.8355 0.0177 0.0148 0.0294 0.1818 0.0709 0.7204 210.8434 0.6926 26.3125Mar 0.0233 1.9235 0.0177 0.0147 0.0294 0.1811 0.0710 0.7156 212.9719 0.6886 26.2749Apr 0.0234 1.9036 0.0178 0.0146 0.0293 0.1818 0.0716 0.7225 214.2857 0.6900 26.6115May 0.0233 1.8606 0.0182 0.0146 0.0294 0.1812 0.0722 0.7297 215.6863 0.6876 26.9939Jun 0.0234 1.8528 0.0187 0.0150 0.0299 0.1814 0.0743 0.7398 219.7802 0.6995 27.2480Jul 0.0239 1.8860 0.0194 0.0153 0.0301 0.1851 0.0756 0.7547 224.9489 0.7153 27.2817Aug 0.0238 1.8694 0.0192 0.0151 0.0297 0.1845 0.0741 0.7471 227.2727 0.7123 26.9122Sep 0.0240 1.8722 0.0186 0.0149 0.0295 0.1857 0.0738 0.7425 227.5313 0.7075 26.9397Oct 0.0241 1.9019 0.0186 0.0150 0.0295 0.1870 0.0737 0.7399 232.3126 0.7056 26.7152Nov 0.0243 1.9679 0.0190 0.0152 0.0297 0.1885 0.0744 0.7463 232.5581 0.7080 26.4329Dec 0.0244 2.0350 0.0186 0.0151 0.0297 0.1890 0.0744 0.7469 232.8590 0.7084 26.2467
2013 0.0242 2.3137 0.0185 0.0157 0.0301 0.1882 0.0746 0.7230 236.1726 0.7193 26.7445
Jan 0.0246 2.1833 0.0185 0.0154 0.0301 0.1903 0.0745 0.7381 237.3247 0.7137 26.1531Feb 0.0246 2.2870 0.0184 0.0159 0.0304 0.1907 0.0761 0.7327 238.0952 0.7285 26.7344Mar 0.0246 2.3291 0.0189 0.0163 0.0306 0.1906 0.0764 0.7253 238.0952 0.7299 27.0040Apr 0.0243 2.3692 0.0187 0.0159 0.0301 0.1887 0.0741 0.7060 236.4865 0.7250 27.2303May 0.0242 2.4438 0.0187 0.0158 0.0302 0.1879 0.0731 0.7195 237.2881 0.7210 26.9162Jun 0.0233 2.2697 0.0177 0.0150 0.0294 0.1809 0.0732 0.7164 229.7461 0.6976 26.4293
Source: Bangko Sentral ng Pilipinas
US DollarJapanese
YenEuro
South
Korean Won
Malaysian
Ringgit
Thailand
Baht
Indonesian
Rupiah
New Taiwan
Dollar
Pound
Sterling
Singapore
Dollar
Hongkong
Dollar

13b EFFECTIVE EXCHANGE RATE INDICES OF THE PESODecember 1980 = 100period averages
Broad 2 Narrow 3 Broad 2 Narrow 3
2011 13.17 40.97 85.56 86.03 143.00 176.21Jan 13.18 40.86 85.82 85.13 140.89 173.51Feb 13.22 41.10 86.15 85.82 141.73 174.48Mar 13.14 40.83 84.95 85.07 141.35 172.94Apr 13.15 40.56 84.67 85.26 140.23 171.32May 13.14 40.34 84.07 85.23 141.37 174.99Jun 13.04 40.18 83.86 84.98 142.07 175.87Jul 13.20 40.42 84.51 87.28 143.28 177.09Aug 13.23 40.80 85.06 87.33 144.65 178.23Sep 13.20 41.15 85.70 86.24 144.10 177.78Oct 13.10 41.59 86.45 85.83 144.61 178.63Nov 13.22 41.90 87.61 87.09 146.56 180.10Dec 13.24 41.93 87.84 87.05 145.23 179.64
2012 13.86 43.66 92.70 91.84 151.96 189.94Jan 13.32 41.82 87.69 87.57 144.39 178.00Feb 13.54 42.21 88.59 88.38 144.58 178.25Mar 13.62 42.40 89.32 88.59 145.34 180.00Apr 13.64 42.72 90.05 89.30 146.69 180.78May 13.67 42.96 90.55 89.90 149.68 187.09Jun 13.79 43.64 92.28 91.12 153.38 191.90Jul 14.15 44.40 94.25 95.29 157.57 196.30Aug 14.05 44.26 94.28 94.88 157.59 197.49Sep 13.95 44.50 95.06 92.98 156.19 197.24Oct 14.04 44.81 96.16 93.33 155.31 197.24Nov 14.28 45.05 96.98 95.32 157.01 197.72Dec 14.30 45.09 97.21 95.41 155.75 197.25
2013 14.64 45.28 97.25 97.69 155.69 195.00Jan 14.53 45.29 97.69 97.21 156.22 196.83Feb 14.68 45.73 98.38 97.74 155.87 195.94Mar 14.87 45.79 98.30 98.79 156.25 195.12Apr 14.79 45.33 96.97 98.63 154.55 191.09May 14.86 45.27 97.08 99.28 156.82 197.11Jun 14.11 44.24 95.06 94.49 154.45 193.93
1 US, Japan, European Monetary Union, United Kingdom2 Singapore, South Korea, Taiwan, Malaysia, Thailand, Indonesia, Hongkong3 Indonesia, Malaysia, Thailandr Revised using actual inflation rates
Source: Bangko Sentral ng Pilipinas
N O M I N A L R E A L
Competing Countries Competing CountriesMajor Trading
Partners 1
Major Trading
Partners 1

14 TOTAL EXTERNAL DEBT
as of periods indicated
in million US dollars
Medium & Medium &
Trade Non-Trade Long- Term Trade Non-Trade Long- Term
Grand Total 2,766 7,020 49,260 59,046 3,066 6,483 48,460 58,009
Public Sector - 675 42,262 a
42,937 - 636 41,317 a
41,953 a
Banks - 675 3,917 4,592 - 636 3,839 4,475
Bangko Sentral ng Pilipinas - - 1,424 1,424 - - 1,427 1,427
Others - 675 2,493 3,168 - 636 2,412 3,048
Non-Banks - - 38,344 38,344 - - 37,477 37,477
CB-BOL - - - - - - - -
NG and Others - - 38,344 38,344 - - 37,477 37,477
Private Sector 2,766 6,345 6,998 16,109 3,066 5,847 7,143 16,057
Banks - 6,157 1,234 7,390 - 5,660 1,263 6,923
Foreign Bank Branches - 1,423 62 1,485 b
- 1,432 43 1,475 b
Domestic Banks - 4,733 1,172 5,905 - 4,228 1,220 5,448
Non-Banks 2,766 c
188 5,765 d
8,719 3,066 c
187 5,880 d
9,133
Inclusiona
Cumulative foreign exchange revaluation on US dollar-denominated
multi-currency loans from Asian Development Bank and World Bank
Exclusionsb
Due to Head Office/Branches Abroad accounts of branches and
offshore banking units of foreign banks operating in the Philippinesc
Loans without BSP approval/registrationd
Obligations under various capital lease agreements;
Loans without BSP approval/registration
Source: Bangko Sentral ng Pilipinas
253
1,210
11,241
31 March 2013
Short-termTotal
31 March 2013
61
6,995
30 June 2013
Short-termTotal
30 June 2013
12,494
34
5,912
99
1,196

15 SELECTED FOREIGN DEBT SERVICE INDICATORS
for periods indicated
in million US dollars
Q1 Q2 Q3 Q4 Q1 r/
Q2
Debt Service Burden (DSB) 1/
1950 1603 1627 1376 2482 1232
Principal 978 973 690 811 1594 688
Interest 972 630 937 565 888 544
Export Shipments (XS) 3/
10339 12692 12262 10991 11149 12840
Exports of Goods and Receipts 20507 22441 22870 22450 21678 22830
from Services and Income (XGSI) 2/ 3/
Current Account Receipts (CAR) 3/
21488 23470 23914 23504 22893 24151
Gross National Income (GNI) 67430 73657 72917 84970 78182 81345
Ratios (%) :
DSB to XS 18.86 12.63 13.27 12.52 22.26 9.60
DSB to XGSI 9.51 7.14 7.11 6.13 11.45 5.40
DSB to CAR 9.07 6.83 6.80 5.85 10.84 5.10
DSB to GNI 2.89 2.18 2.23 1.62 3.17 1.51
1Debt service burden represents principal and interest payments after rescheduling. In accordance with the internationally-accepted concept, debt
service burden consists of (a) Principal and interest payments on fixed MLT credits including IMF credits, loans covered by the Paris Club and Commercial
Banks rescheduling, and New Money Facilities; and (b) Interest payments on fixed and revolving short-term liabilities of banks and non-banks but excludes
(i) Prepayments of future years' maturities of foreign loans and (ii) Principal payments on fixed and revolving ST liabilities of banks and non-banks.2
Includes cash remittances of overseas Filipinos that were coursed through and reported by commercial banks which are reflected under Compensation
of Employees in the income account and workers' remittances in the Current Transfers account.3
Based on the accounting principle under the Balance of Payments and International Investment Position Manual, Sixth edition (BPM6)p/
Preliminaryr/
Revised to reflect data updates
Source: BSP
2012 2013 p/

16 SELECTED FOREIGN INTEREST RATESperiod averages; in percent
Q1 Q2 Q3 Q4 Q1 Q2 Q3 Q4 Q1 Q2 Q3 Q4 Q1 Q2
US Prime Rate 3.2500 3.2500 3.2500 3.2500 3.2500 3.2500 3.2500 3.2500 3.2500 3.2500 3.2500 3.2500 3.2500 3.2500
US Discount Rate 0.6096 0.7500 0.7500 0.7500 0.7500 0.7500 0.7500 0.7500 0.7500 0.7500 0.7500 0.7500 0.7500 0.7500
US Federal Funds Rate 0.1394 0.1980 0.1996 0.1943 0.1622 0.1015 0.1054 0.0738 0.1141 0.1607 0.1570 0.1722 0.1546 0.1140
LIBOR (90 days) 0.2521 0.4357 0.3880 0.2929 0.3079 0.2632 0.2978 0.4794 0.5141 0.4663 0.4239 0.3170 0.2917 0.2750
SIBOR (90 days) 0.2574 0.4399 0.4101 0.3056 0.3119 0.2725 0.3068 0.4854 0.5198 0.4667 0.4287 0.3189 0.2951 0.2790
Source: Bloomberg, Asian Wall Street Journal, Reuters
2013 2012 2010 2011

17 BALANCE SHEET OF THE BANGKO SENTRAL NG PILIPINASas of periods indicatedin billion pesos
Mar u Jun Sep Dec Mar Jun Sep Dec u Mar Jun
Assets 3,331.9 3,459.4 3,768.0 3,787.9 3,727.9 3,684.2 3,889.7 3,975.9 4,049.0 4,091.3
3,331.9 3,459.4 3,768.0 3,787.9 3,727.9 3,684.2 3,889.7 3,975.9 4,049.0 4,091.3 International Reserves 2,848.5 2,975.8 3,273.0 3,286.5 3,248.1 3,202.9 3,408.2 3,424.3 3,416.3 3,494.4 Foreign Exchange Receivable 0.0 0.0 0.0 0.0 0.0 0.0 0.0 0.0 0.0 0.0 Domestic Securities 243.4 239.9 244.0 240.4 219.0 217.3 220.3 218.1 220.9 219.8 Loans and Advances 111.5 106.4 113.0 114.1 115.8 119.4 116.5 118.5 108.7 101.1 Revaluation of International Reserves 0.0 0.0 0.0 0.0 0.0 0.0 0.0 64.6 131.4 92.5 Bank Premises and Other Fixed Assets 12.8 12.6 13.3 15.4 15.6 16.1 16.3 16.5 16.4 17.5 Derivative Instruments in a Gain Position 0.2 0.6 4.0 2.6 0.5 0.3 0.2 1.5 0.3 5.2 Derivative Asset 0.0 0.0 0.0 0.7 0.7 0.0 0.0 0.0 0.0 Other Assets 115.5 124.0 120.8 128.9 128.3 127.4 128.2 132.4 155.1 160.8
Liabilities 3,199.5 3,338.2 3,632.3 3,647.9 3,606.3 3,582.7 3,815.1 3,911.4 3,996.6 4,041.7
Currency Issue 521.9 521.4 524.1 648.9 576.2 555.5 559.6 692.7 653.2 626.6 Deposits 2,321.9 2,360.6 2,630.7 2,466.2 2,630.2 2,657.2 2,851.6 2,854.5 2,977.4 3,038.5 Reserve Deposits of Other Depository Corporations (ODCs) 1
535.3 579.0 638.5 673.5 680.2 716.6 724.7 782.6 836.3 913.6 Reserve Deposits of Other Financial Corporations (OFCs) 2 0.6 0.7 0.6 0.6 0.6 0.3 0.3 0.3 0.4 0.4 Special Deposit Accounts 3 1,488.9 1,389.2 1,622.1 1,642.7 1,577.1 1,572.3 1,826.3 1,640.1 1,869.5 1,710.5 Treasurer of the Philippines 4 186.7 310.3 294.0 60.1 293.8 259.7 214.3 340.8 193.6 339.4
Other Foreign Currency Deposits 17.0 11.1 1.2 14.5 3.5 23.6 15.8 20.5 7.4 0.0
Foreign Financial Institutions 38.3 38.4 44.4 43.0 43.0 40.3 40.3 40.3 40.3 37.2 Other Deposits 5 55.2 31.9 29.9 31.9 32.0 44.4 30.0 29.8 29.8 37.4
Foreign Loans Payable 1.7 1.8 1.0 1.0 0.1 0.1 0.1 0.1 0.1 0.1
Net Bonds Payable 22.2 21.7 22.4 22.0 21.9 21.1 21.3 20.5 20.9 21.6
Derivative Instruments in a Loss Position 5.9 3.5 0.4 0.3 3.9 5.8 0.9 0.6 0.1 0.0
Derivatives Liability 0.1 0.1 0.1 0.2 0.3 0.3 0.2 0.1 0.2 0.0
Allocation of SDRs 57.7 58.2 57.4 56.5 55.7 53.8 53.9 52.9 51.4 54.5
Revaluation of International Reserves 26.9 66.7 144.6 145.8 50.7 4.8 38.9 0.0 0.0 0.0 Reverse Repurchase Agreements 3 231.4 295.2 241.7 296.0 256.6 274.1 277.8 278.5 282.7 288.7
Other Liabilities 9.7 8.9 10.1 11.0 10.7 10.0 10.9 11.5 10.6 11.6
Net Worth 132.4 121.2 135.7 140.0 121.6 101.5 74.6 64.5 52.4 49.6
Capital 10.0 10.0 10.0 20.0 20.0 20.0 20.0 40.0 40.0 40.0
Surplus/Reserves 122.4 111.2 125.7 120.0 101.6 81.5 54.6 24.5 12.4 9.6
Note: Details may not add up to total due to rounding off.u Unaudited/Preliminary. Starting with end-December 2005, BSP financial statements have been prepared in compliance with some of the requirements of the Philippine Financial Reporting Standards (PFRS)
and Philippine Accounting Standards (PAS) both of which have been aligned with the International Financial Reporting Standards (IFRS) and International Accounting Standards (IAS). 1 ODCs are deposit generating institutions other than the BSP such as universal and commercial banks (UB/KBs), specialized government banks (SGBs), thrift banks (TBs), rural banks (RBs)
and non-banks with quasi-banking functions (NBQBs).2 OFCs are trust units of banks.3 Includes accrued interest payables.4 Includes foreign currency deposits.5 Mostly GOCC deposits.
Source: Bangko Sentral ng Pilipinas
2011 2013 u/p2012

18 INCOME POSITION OF THE BANGKO SENTRAL NG PILIPINAS
1
2 Q1 Q2 1 Q3 1 Q4 FY Q1 Q2 1 Jan-Jun Q3 1 Q4 u FY u Q1 Q2 Jan-Jun3 2 1 Jan Apr Jul Oct Jan Apr Jul Oct Jan Apr
Revenues 16.296 25.873 57.695 18.871 118.735 17.223 17.851 35.074 15.279 15.376 65.729 15.239 20.830 36.069
Interest Income 11.359 11.228 11.105 11.929 45.621 10.485 10.161 20.646 10.145 10.125 40.916 7.923 7.640 15.563 International Reserves 8.526 8.591 8.267 8.456 33.840 8.202 7.511 15.713 7.502 7.598 30.813 6.092 5.545 11.637 Domestic Securities 1.654 1.361 1.579 1.152 5.746 0.984 1.206 2.190 1.282 1.025 4.497 0.523 0.387 0.910 Loans and Advances 0.753 0.750 0.727 1.758 3.988 0.741 0.774 1.515 0.791 0.905 3.211 0.668 0.906 1.574 Others 0.426 0.526 0.532 0.563 2.047 0.558 0.670 1.228 0.570 0.597 2.395 0.640 0.802 1.442 Miscellaneous Income 4.973 14.587 46.384 6.813 72.757 6.647 7.539 14.186 4.957 5.097 24.240 6.960 12.676 19.636 Net Income from Branches -0.036 0.058 0.206 0.129 0.357 0.091 0.151 0.242 0.177 0.154 0.573 0.356 0.514 0.870
Expenses 24.319 31.162 31.343 29.144 115.968 28.302 27.115 55.417 27.727 27.544 110.688 23.261 20.634 43.895
Interest Expenses 20.851 23.507 26.290 24.986 95.634 24.492 22.028 46.520 22.793 21.449 90.762 18.989 13.458 32.447 Legal Reserve Deposits of Banks 1.966 2.031 2.419 0.428 6.844 1.640 0.697 2.337 0.006 0.005 2.348 0.006 0.005 0.011 National Government Deposits 0.771 1.289 1.695 1.071 4.826 0.944 1.385 2.329 1.331 2.029 5.689 1.291 0.743 2.034 BSP Debt Instruments 2.733 2.688 2.733 3.047 11.201 2.443 2.392 4.835 2.666 2.519 10.020 2.487 2.533 5.020 Special Deposit Accounts 14.600 16.766 18.876 19.914 70.156 18.960 17.051 36.011 18.300 16.444 70.755 14.751 10.522 25.273 Loans Payable and Other Foreign Currency Deposits 0.545 0.561 0.548 0.517 2.171 0.483 0.474 0.957 0.465 0.450 1.872 0.453 0.496 0.949 Other Liabilities 0.236 0.172 0.019 0.009 0.436 0.022 0.029 0.051 0.025 0.002 0.078 0.001 -0.841 -0.840 Cost of Minting/Printing of Currency 0.749 1.340 1.354 2.000 5.443 0.951 1.175 2.126 1.224 2.219 5.569 1.121 1.620 2.741 Taxes and Licenses 0.418 2.932 0.334 0.262 3.946 0.301 0.260 0.561 0.272 0.236 1.069 0.207 1.720 1.927 Others 2.301 3.383 3.365 1.896 10.945 2.558 3.652 6.210 3.438 3.640 13.288 2.944 3.836 6.780
Net Income Before Gain/Loss(-) on FXR Fluctuations, Provisions for Income Tax and Capital Reserves -8.023 -5.289 26.352 -10.273 2.767 -11.079 -9.264 -20.343 -12.448 -12.168 -44.959 -8.022 0.196 -7.826
Gain/Loss(-) on Foreign Exchange Rate Fluctuations 1 -12.593 -9.227 -14.840 0.436 -36.224 -8.686 -9.567 -18.253 -17.311 -14.812 -50.376 -6.256 -0.290 -6.546
Provision for Income Tax 0.000 0.000 0.000 0.231 0.231 0.000 0.000 0.000 0.000 0.045 0.045 0.000 1.718 1.718
Capital Reserves 0.000
Net Income Available for Distribution -20.616 -14.516 11.512 -10.068 -33.688 -19.765 -18.831 -38.596 -29.759 -27.025 -95.380 -14.278 -1.812 -16.090
u/pUnaudited/Preliminary. Starting with end-December 2005, BSP financial statements have been prepared in compliance with some of the requirements of the Philippine Financial Reporting Standards (PFRS) and Philippine Accounting Standards (PAS), both of which have been aligned with the International Financial Reporting Standards (IFRS) and International Accounting Standards (IAS).
1This represents realized gains or losses from fluctuations in FX rates arising from foreign currency-denominated transactions of the BSP, including: 1) rollover/re-investments of matured FX investments with foreign financial institutions and FX-denominated government securities; 2) servicing of matured FX obligations of the BSP; and 3) maturity of derivatives instruments.
Source: Bangko Sentral ng Pilipinas
for periods indicatedin billion pesos
2013 u/p2011 2012


